Cambridge A Level Geography 9696 — 2024 May/June Paper 4 · Variant 2
9696/42/M/J/24 · 11 questions · 60 marks · ≈68 min
The question paper and its mark scheme, free to read here and free to download. This is Cambridge’s own paper, exactly as it was sat.
Question paper4 pages

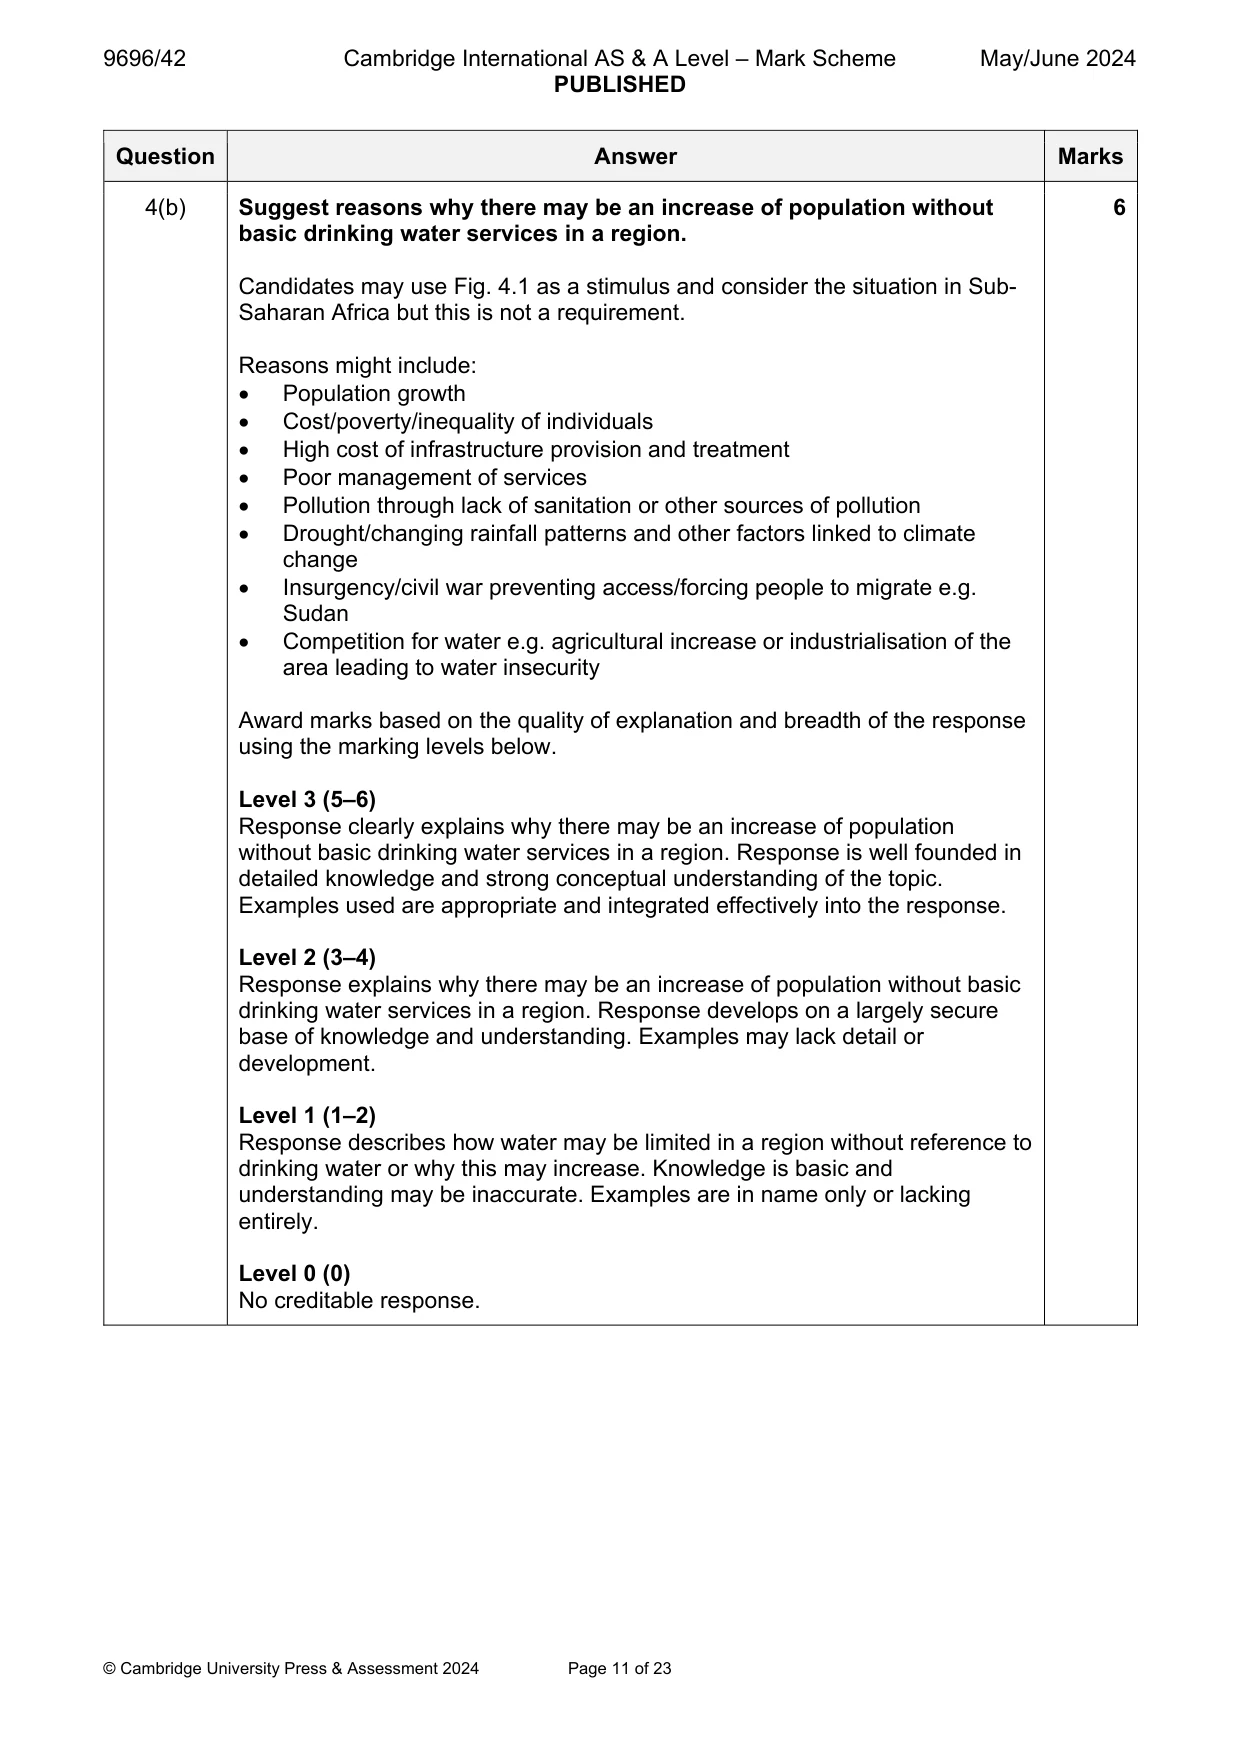
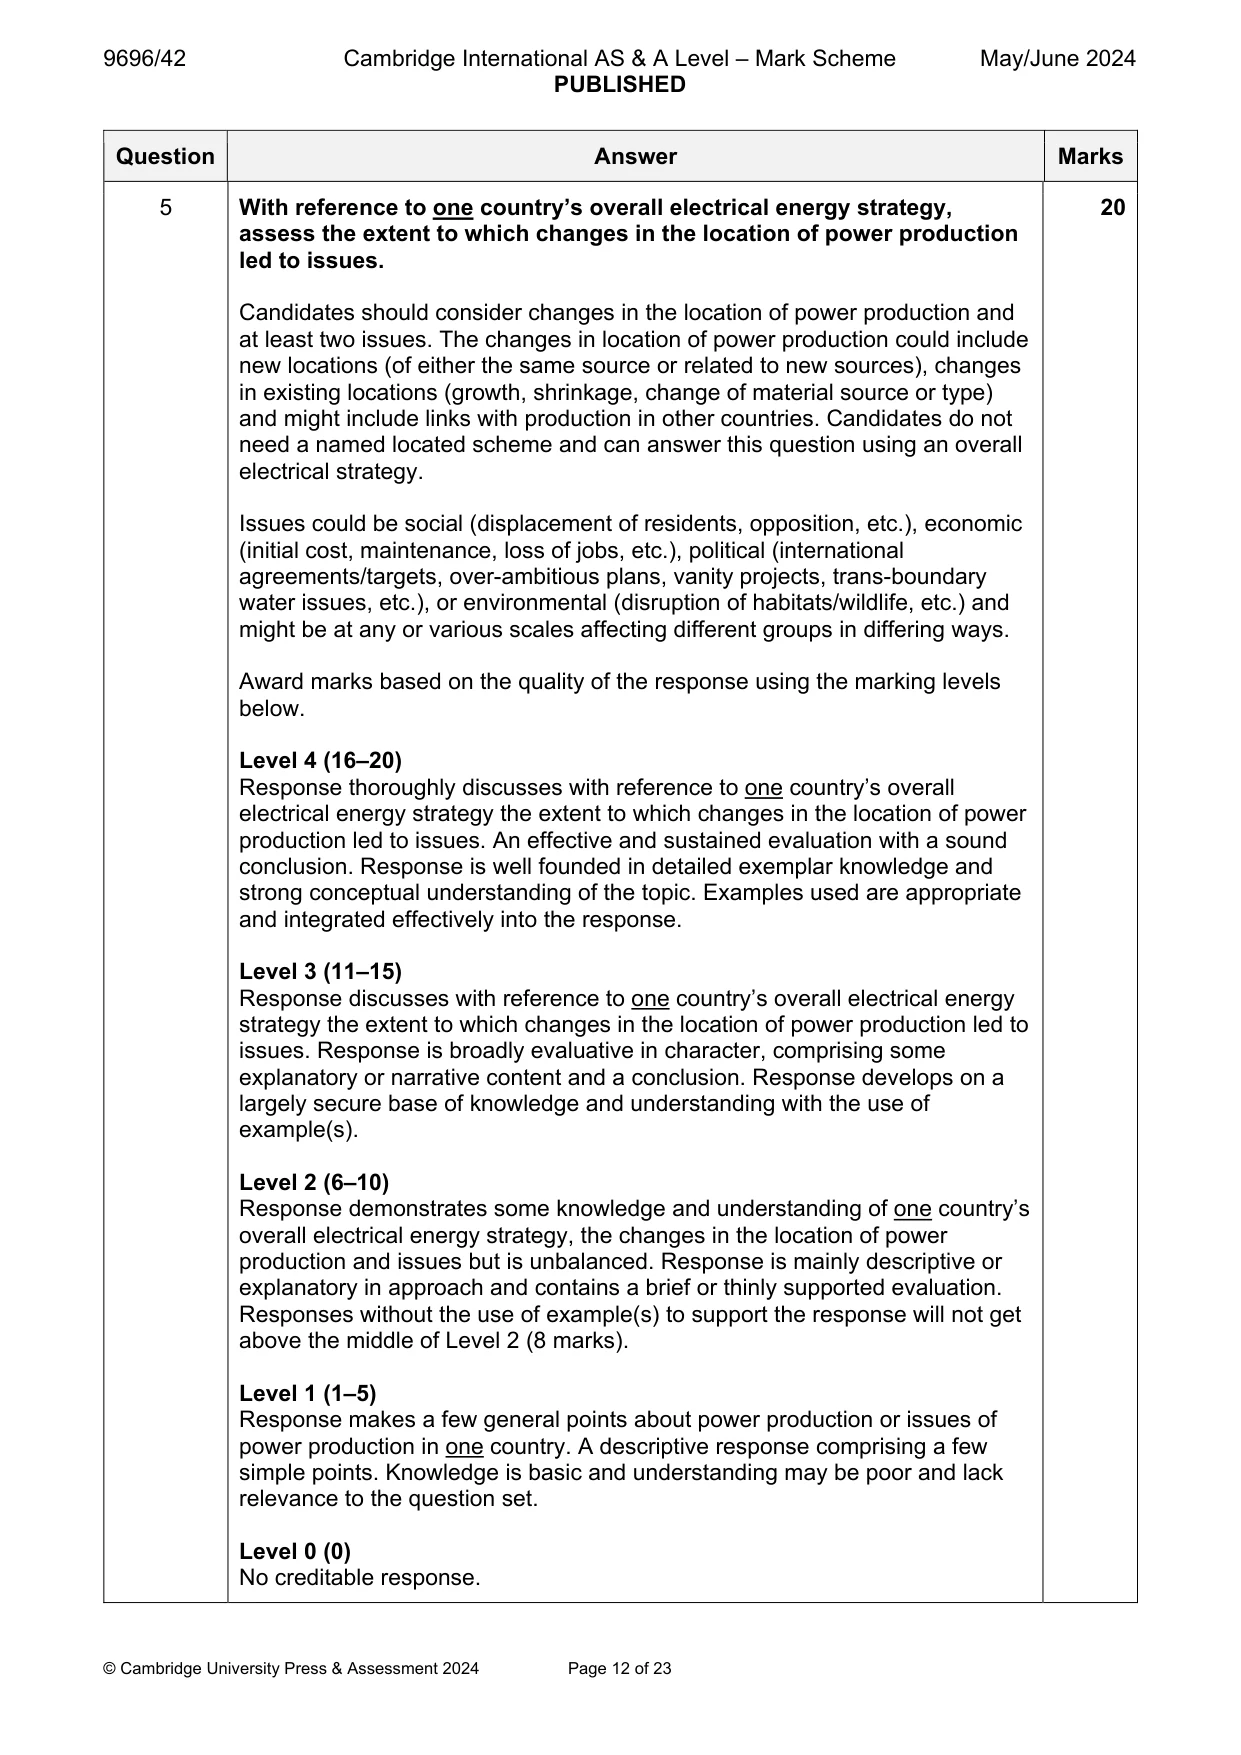
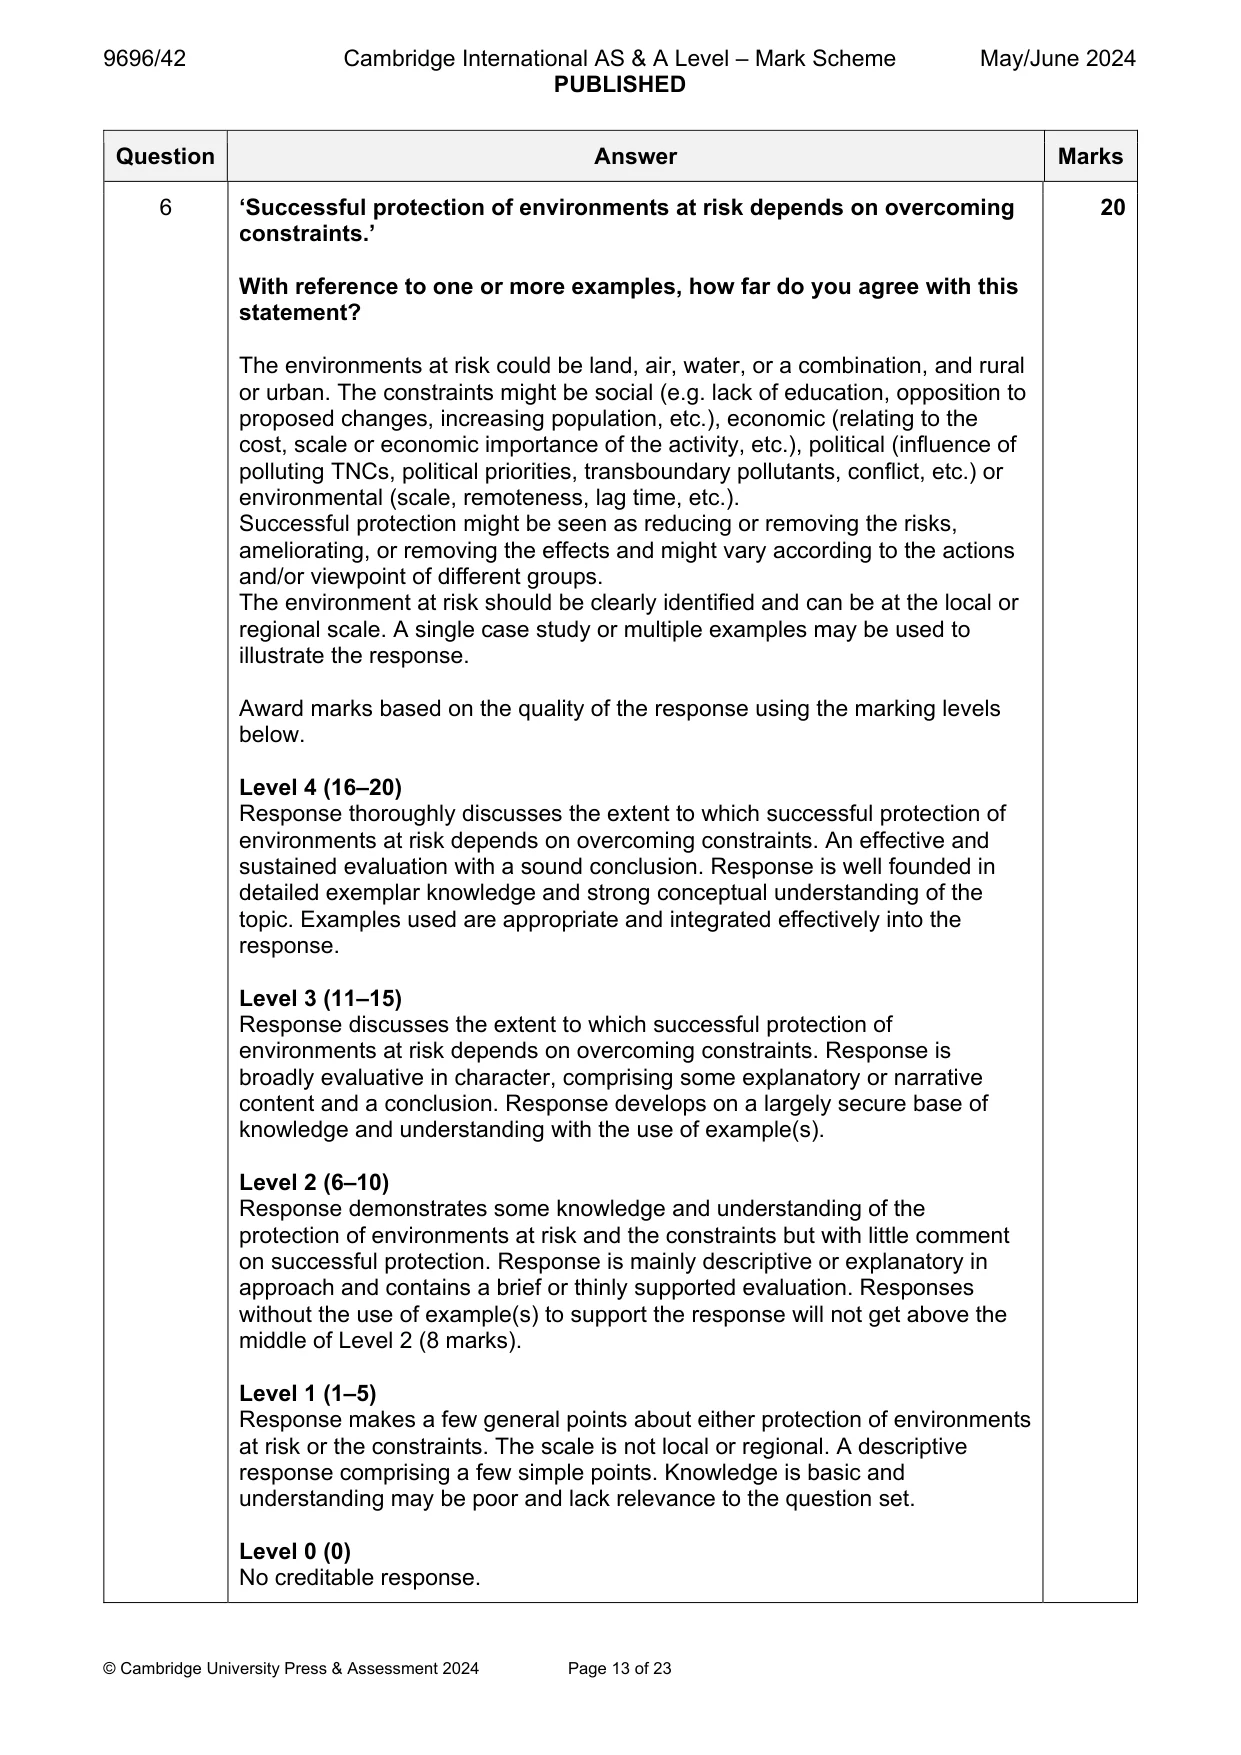
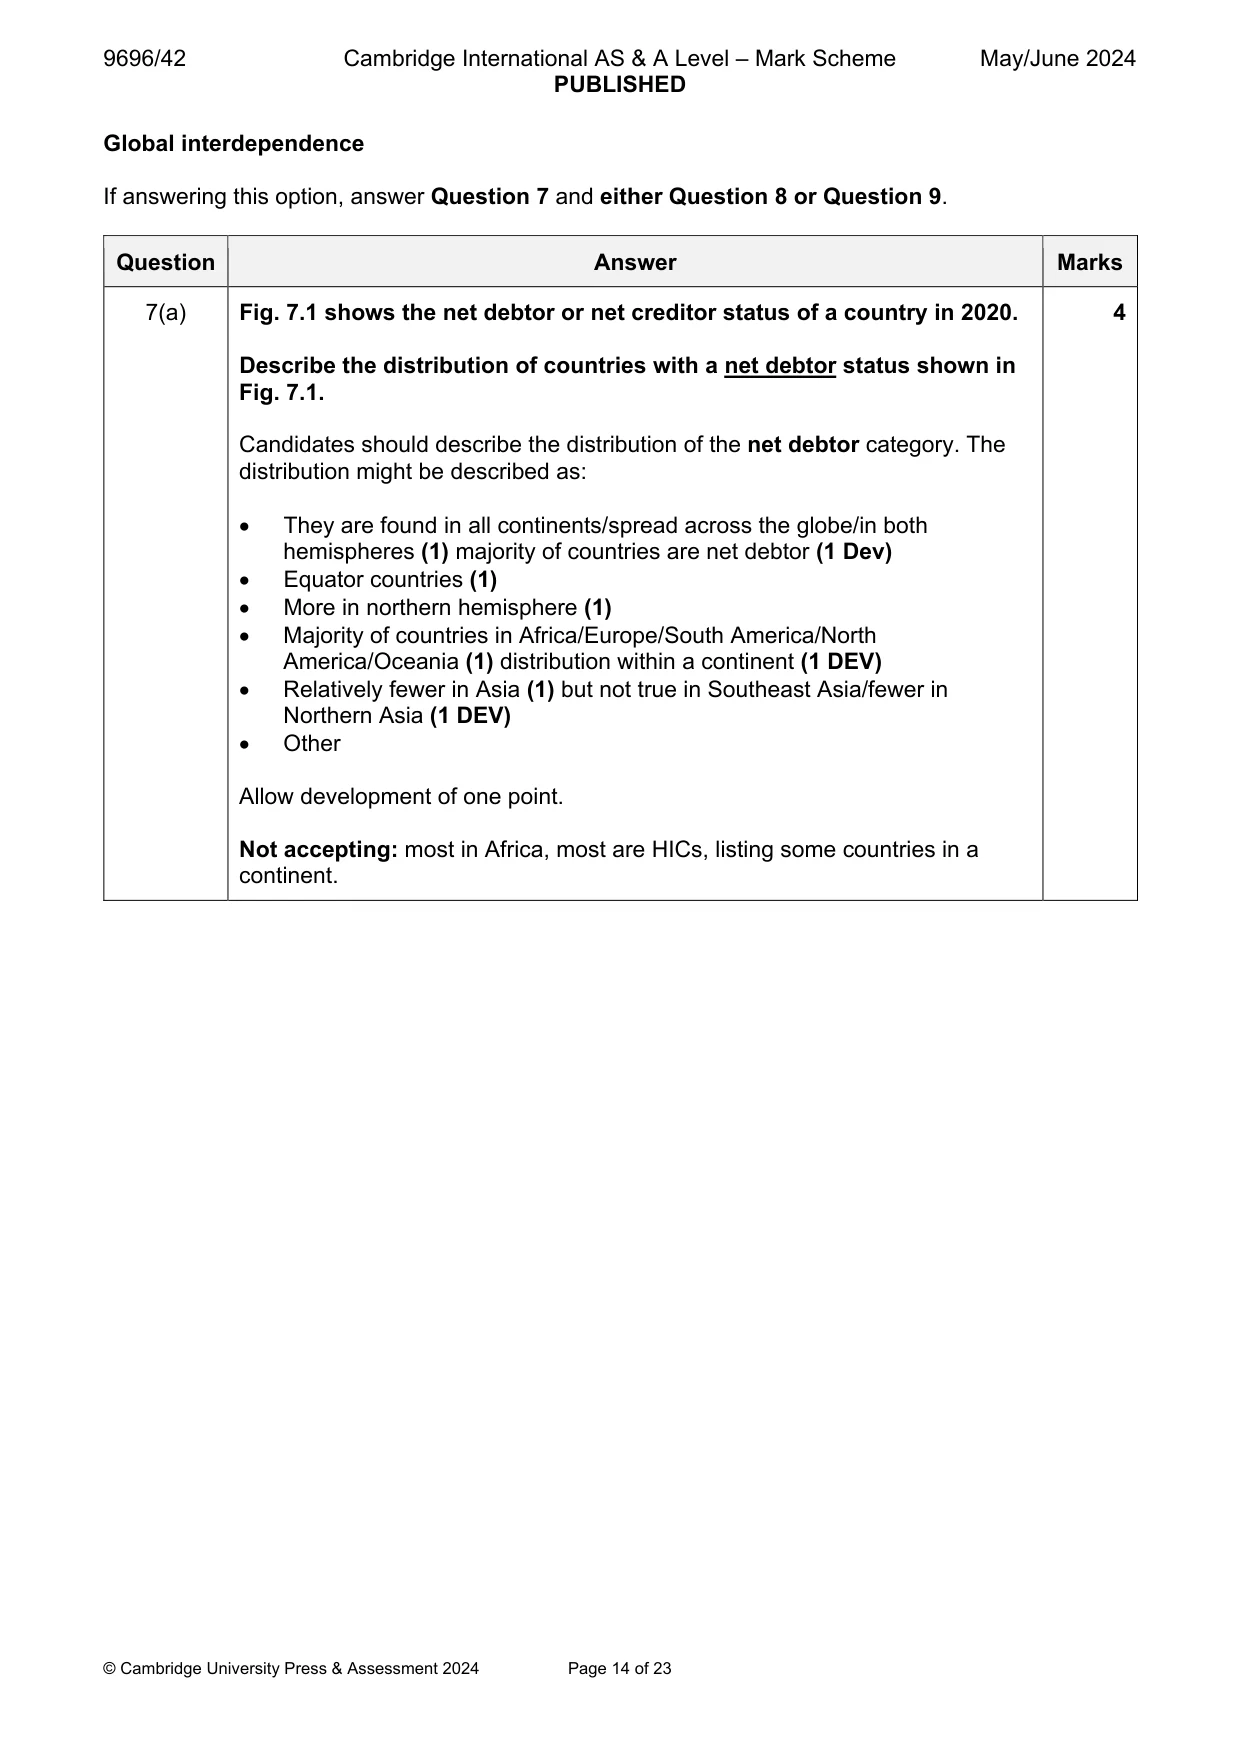
Mark scheme23 pages
Answers below. Sit the paper first if you are practising.



Questions as text
Q1 · The percentage change in manufacturing jobs, by level of education, in the UK, an HIC in…
1 Fig. 1.1 shows the percentage change in manufacturing jobs, by level of education, in the UK, an HIC in Europe, 2012–17. (a) Describe the main changes shown in Fig. 1.1. [4] (b) Explain two ways labour may affect the location of manufacturing industry. [6]
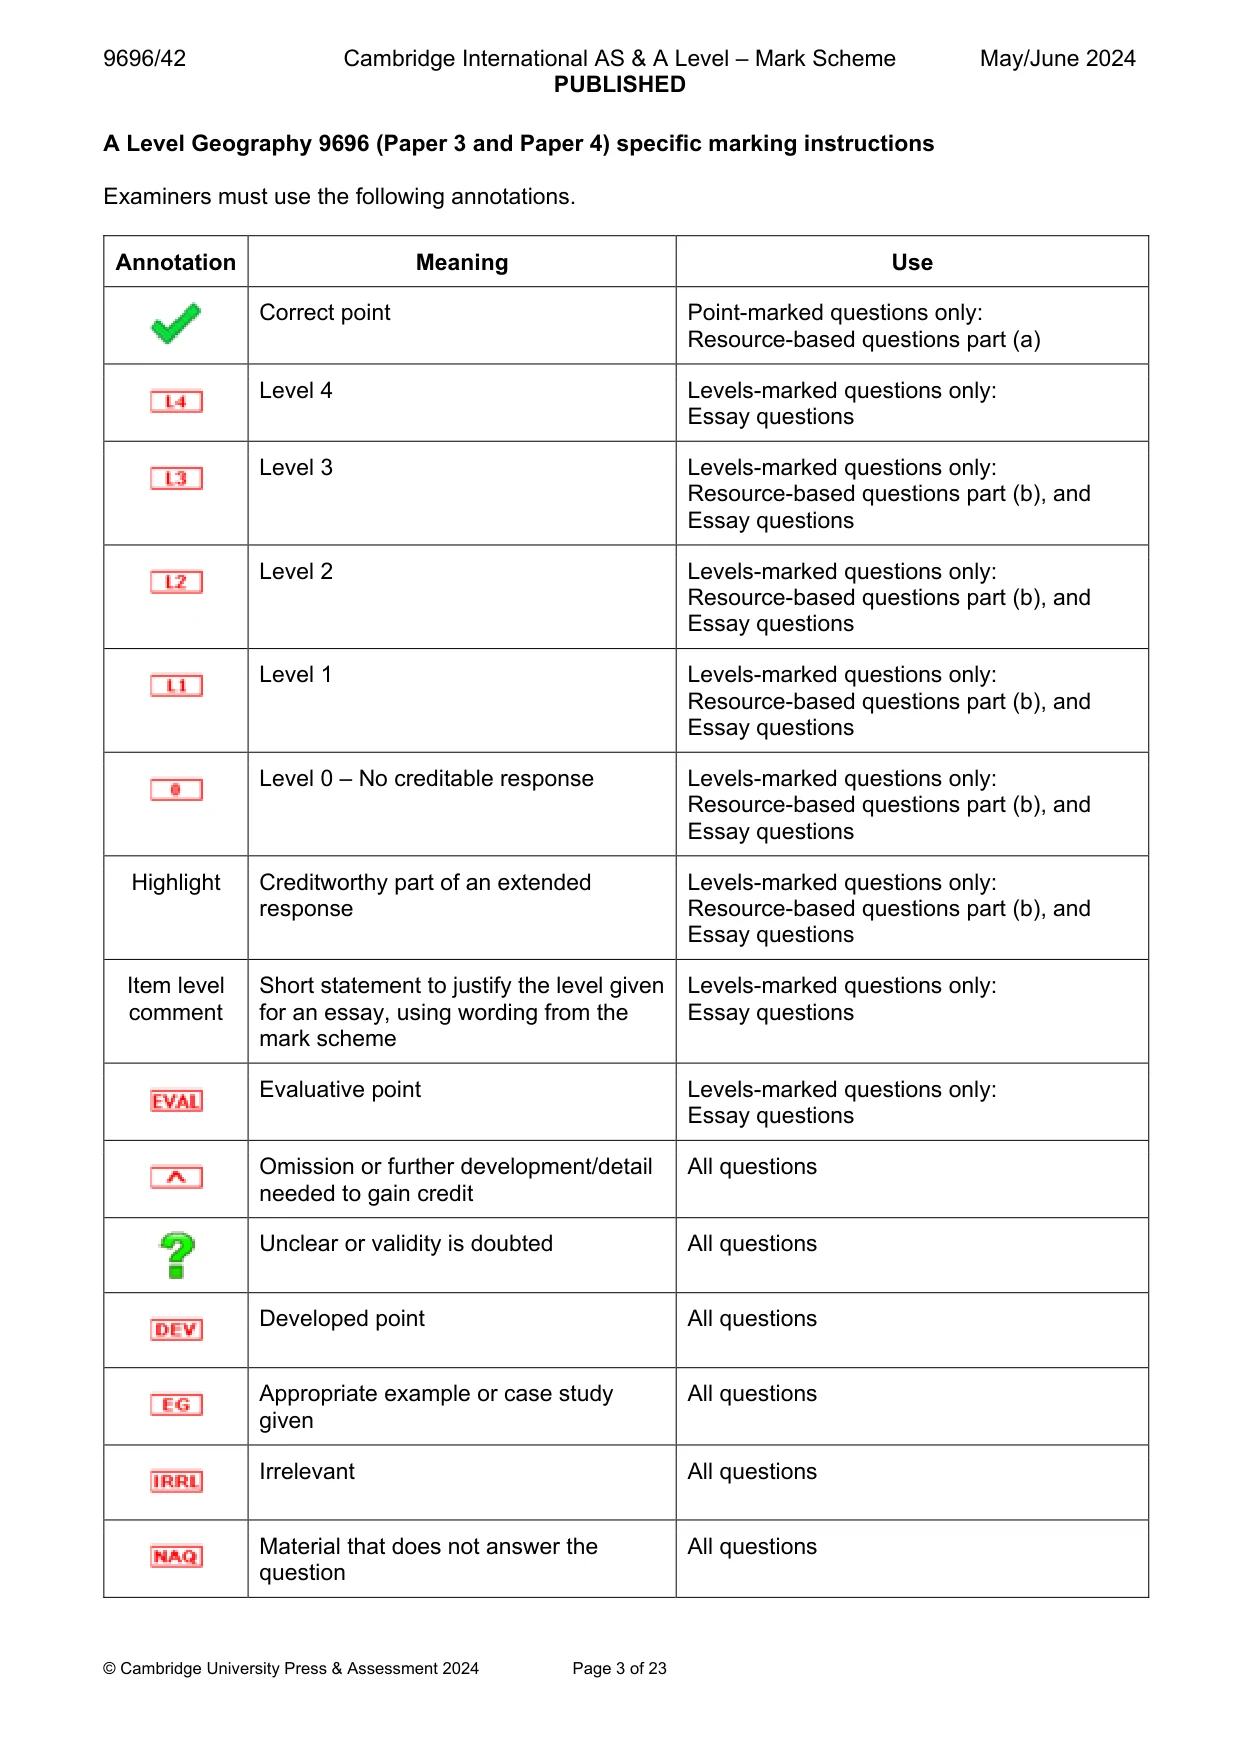
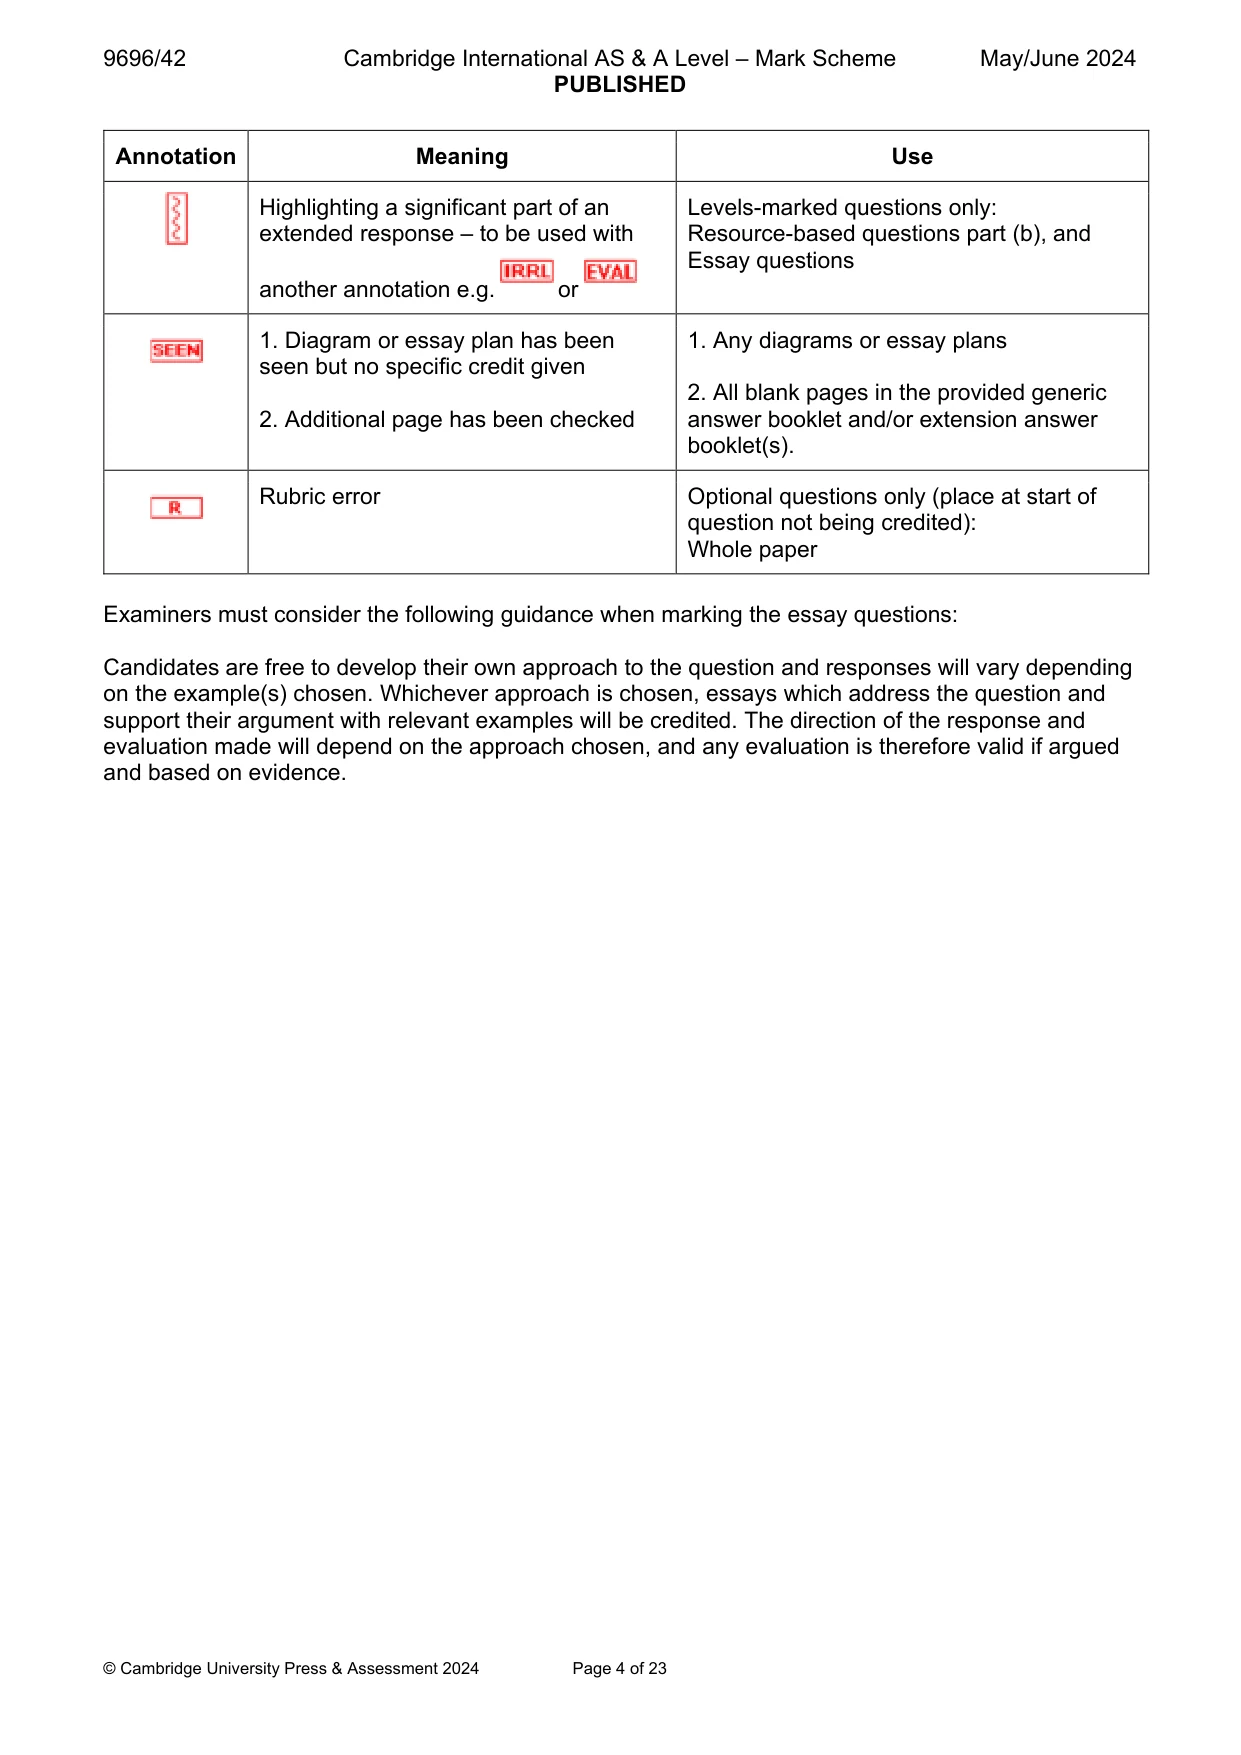
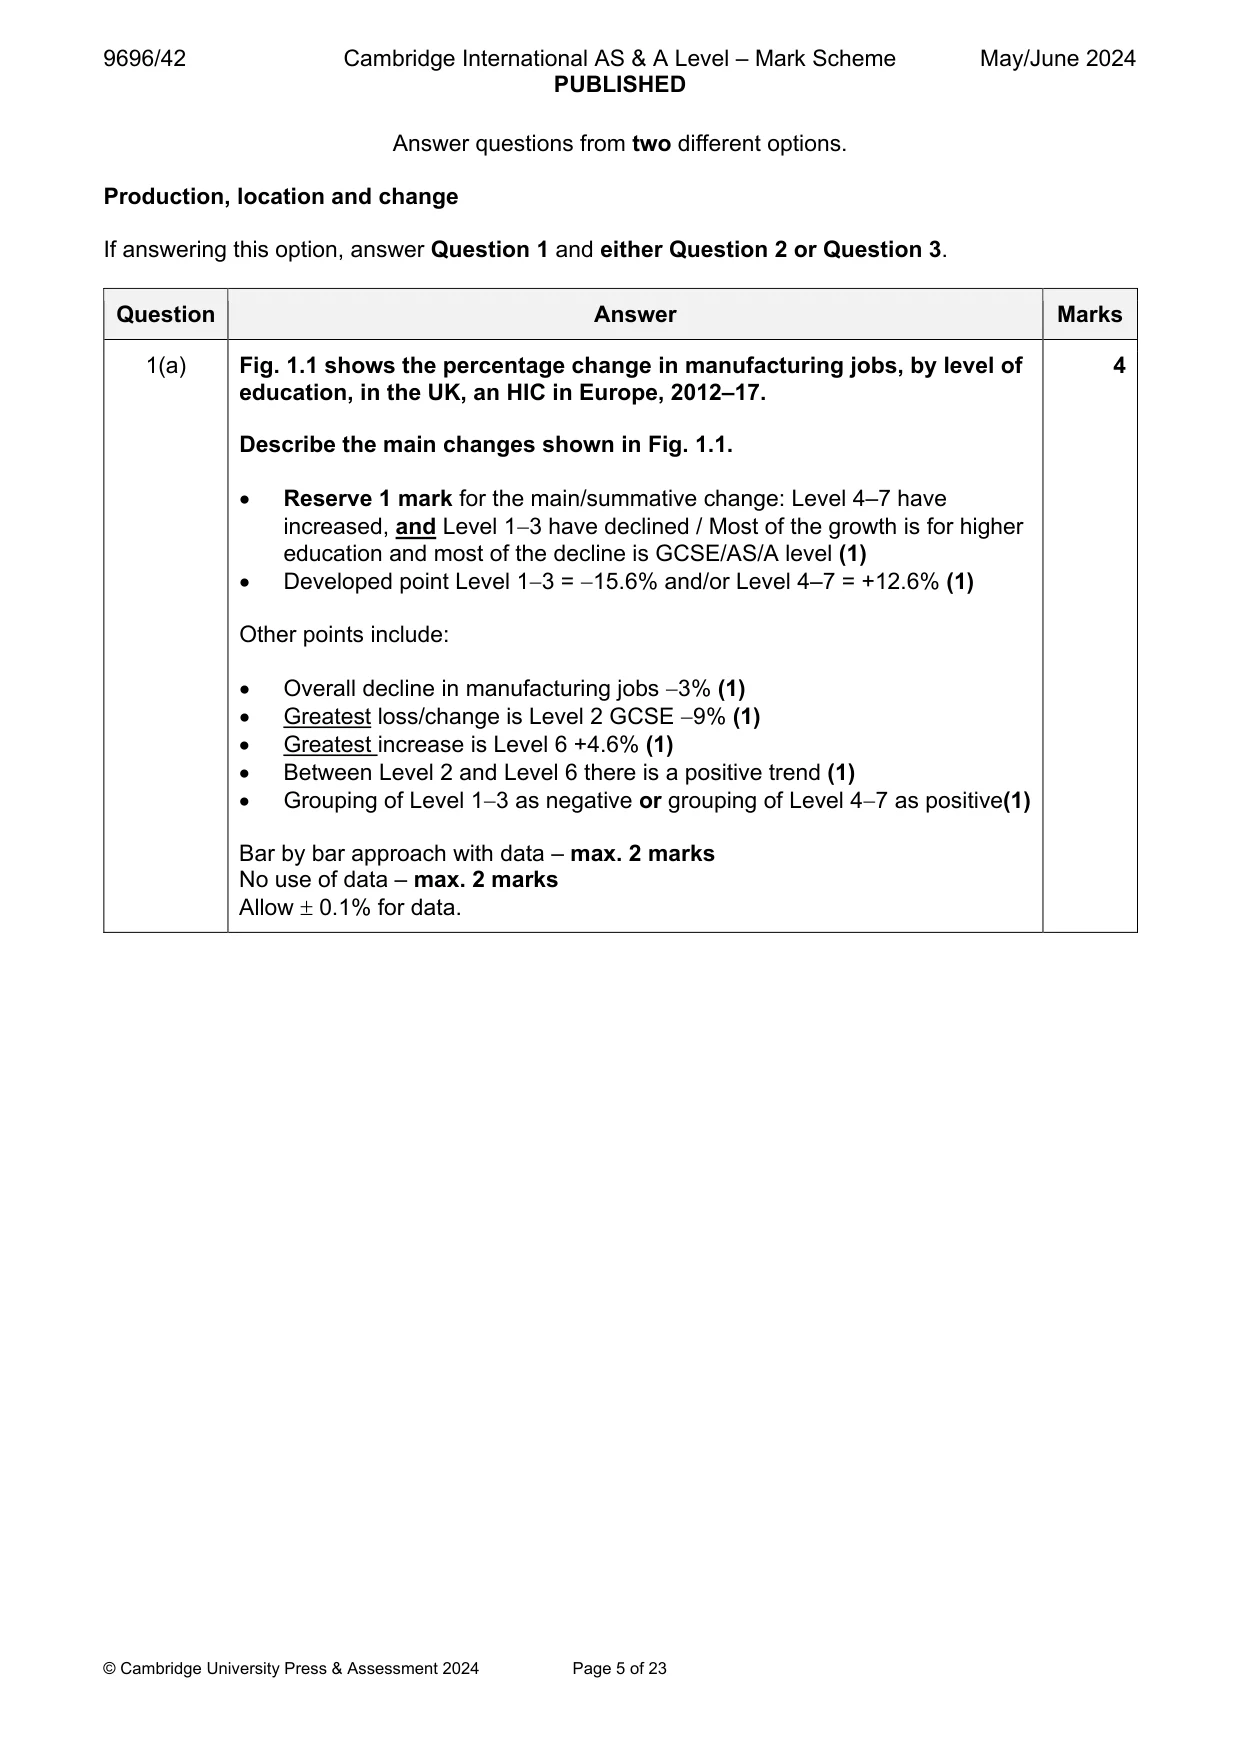
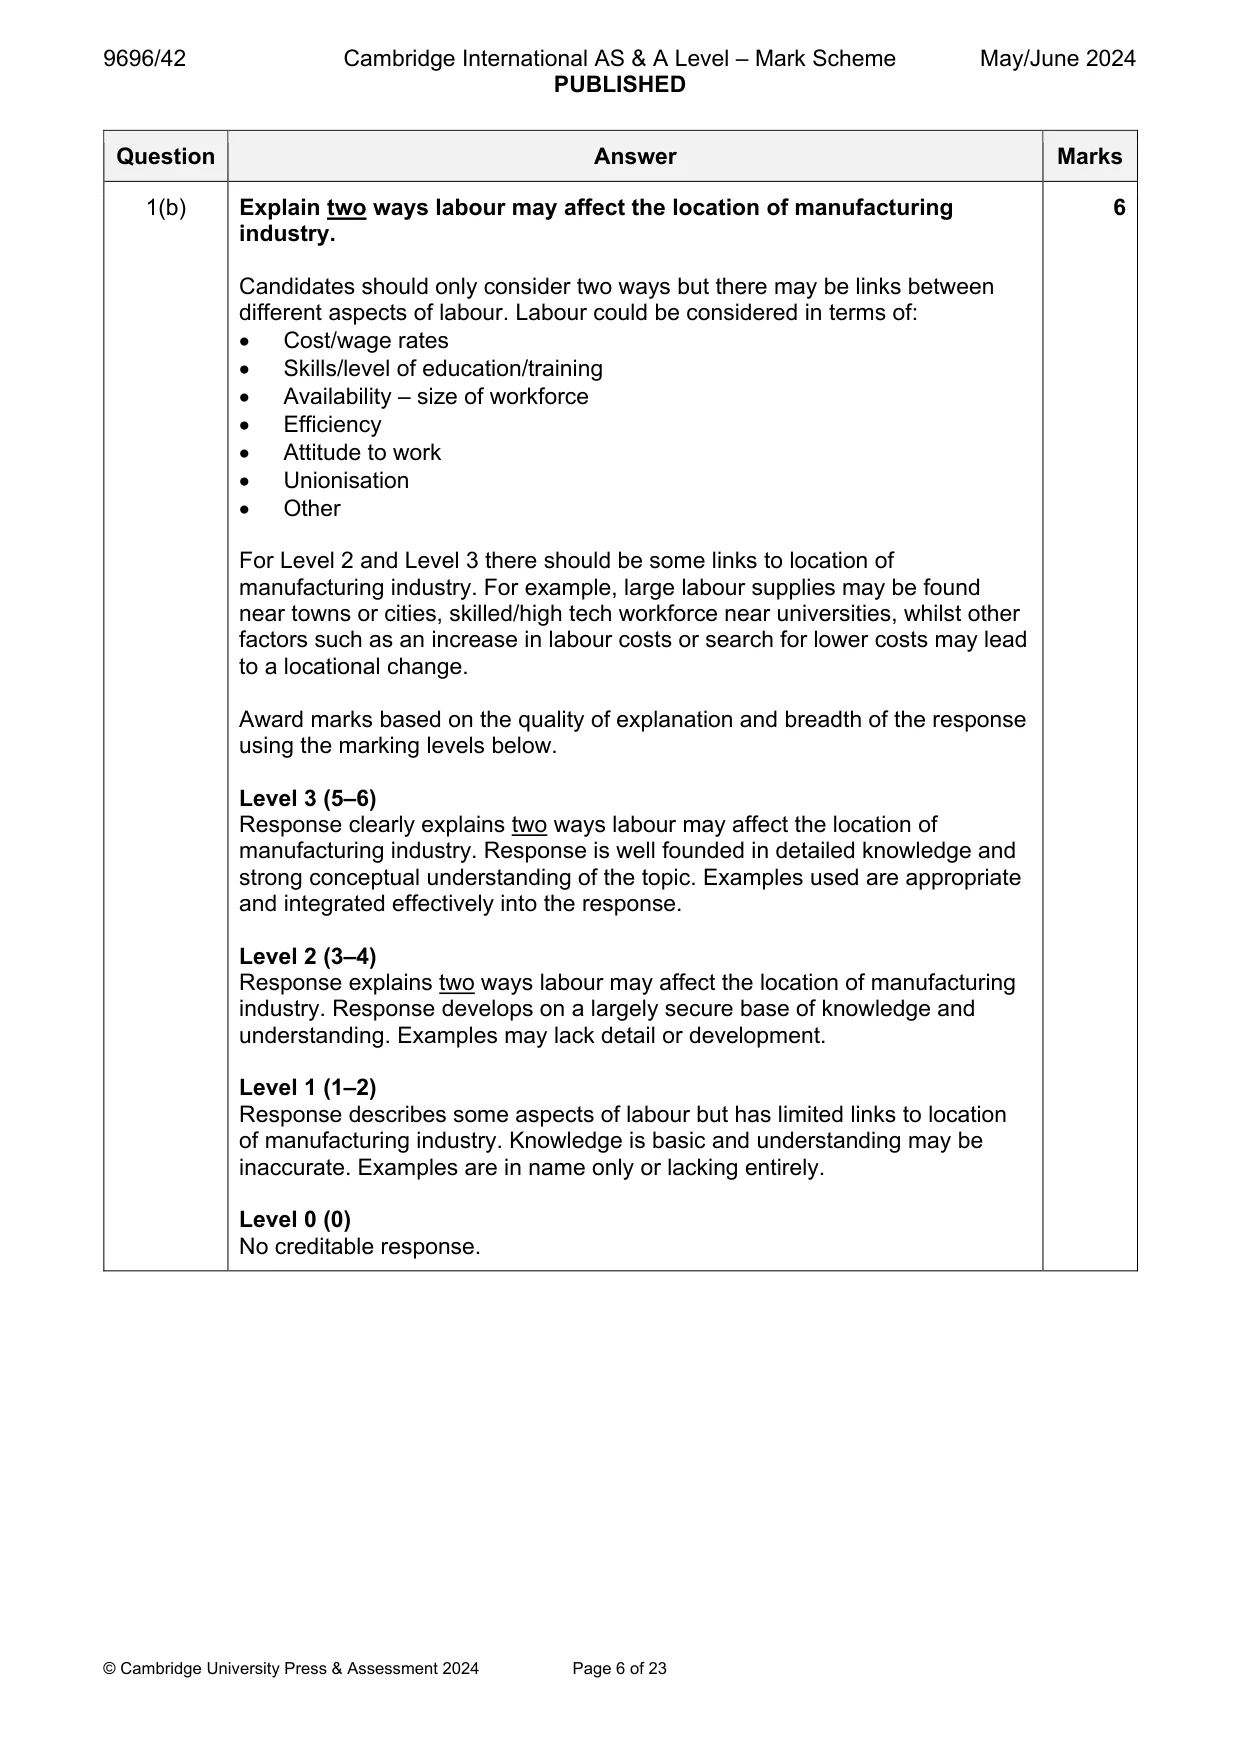
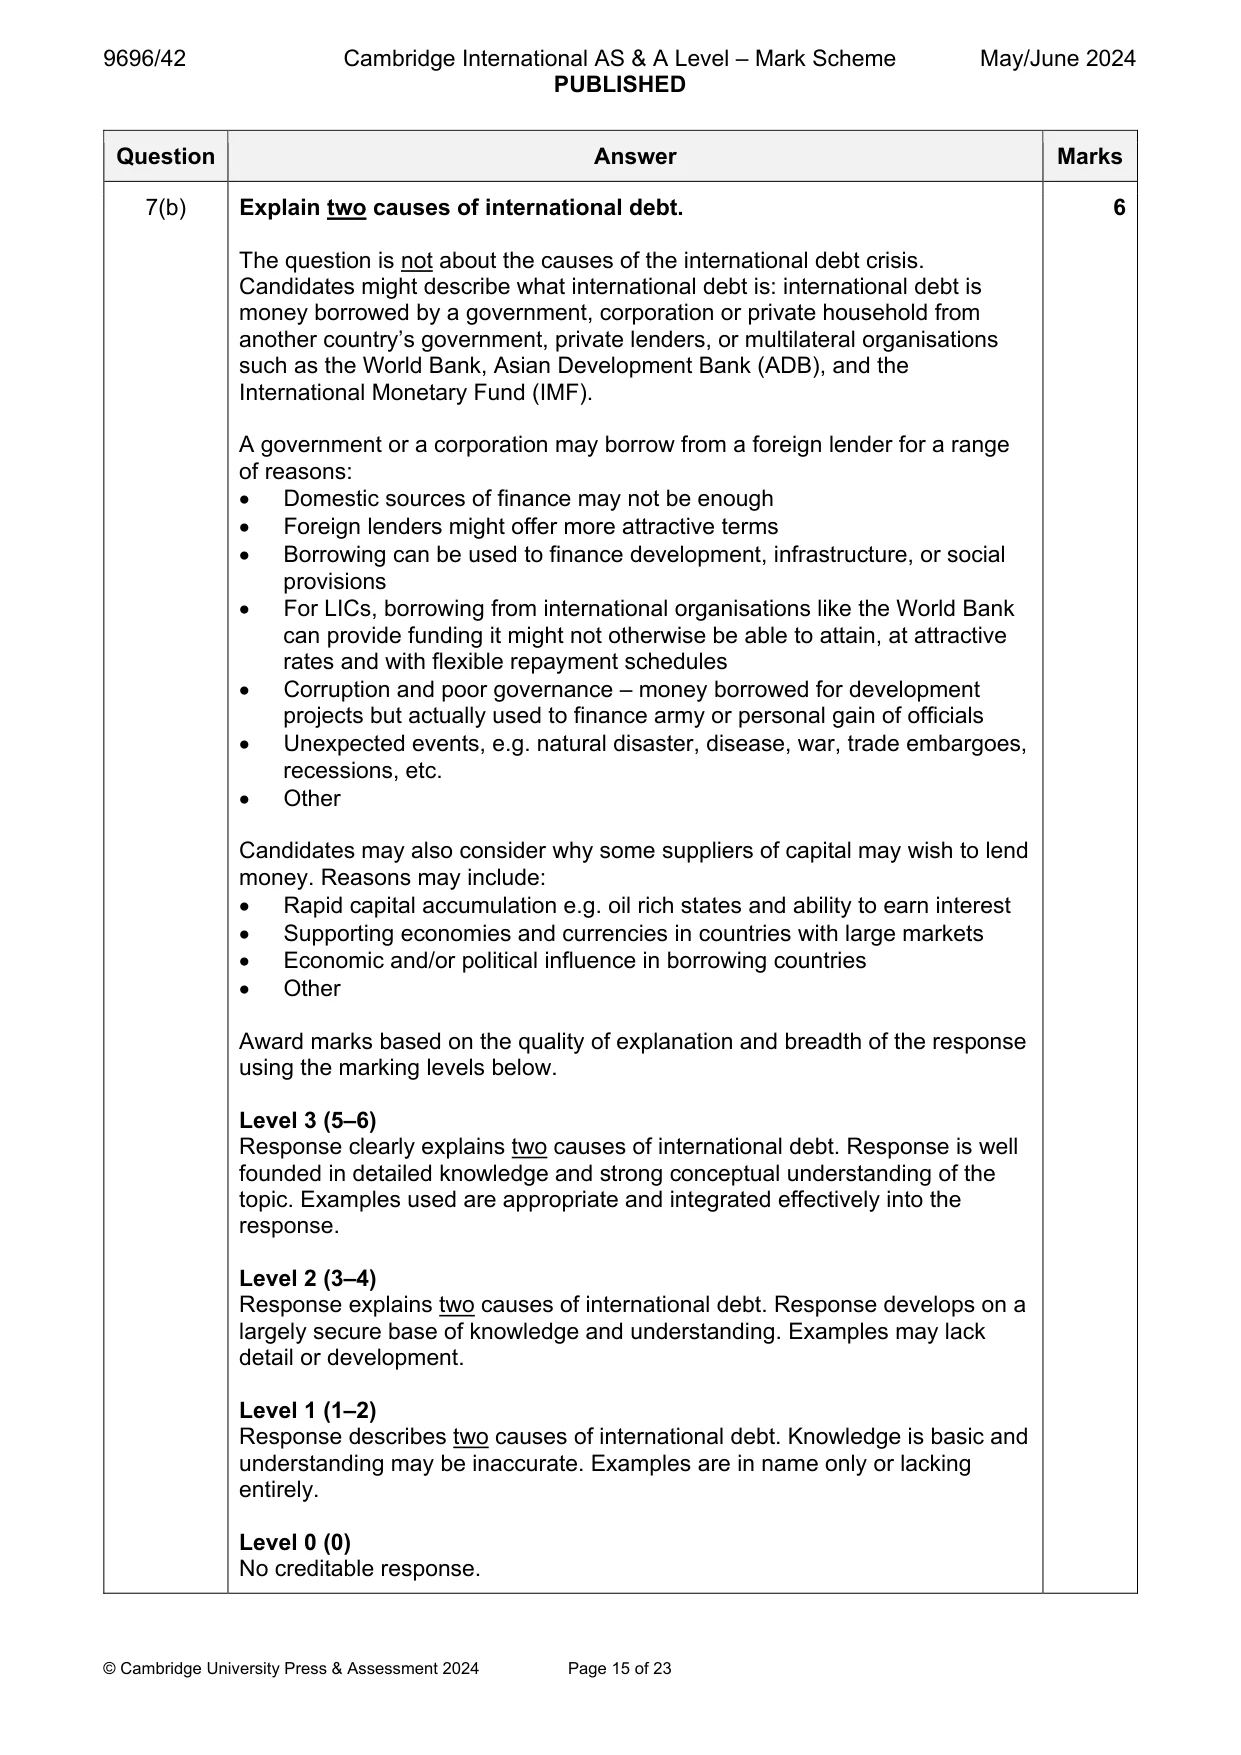
Mark scheme: Question Answer Marks 1(a) Fig. 1.1 shows the percentage change in manufacturing jobs, by level of 4 education, in the UK, an HIC in Europe, 2012–17. Describe the main changes shown in Fig. 1.1. Reserve 1 mark for the main/summative change: Level 4–7 have increased, and Level 13 have declined / Most of the growth is for higher education and most of the decline is GCSE/AS/A level (1) Developed point Level 13 = 15.6% and/or Level 4–7 = +12.6% (1) Other points include: Overall decline in manufacturing jobs 3% (1) Greatest loss/change is Level 2 GCSE 9% (1) Greatest increase is Level 6 +4.6% (1) Between Level 2 and Level 6 there is a positive trend (1) Grouping of Level 13 as negative or grouping of Level 47 as positive(1) Bar by bar approach with data – max. 2 marks No use of data – max. 2 marks Allow 0.1% for data. 1(b) Explain two ways labour may affect the location of manufacturing 6 industry. Candidates should only consider two ways but there may be links between different aspects of labour. Labour could be considered in terms of: Cost/wage rates Skills/level of education/training Availability – size of workforce Efficiency Attitude to work Unionisation Other For Level 2 and Level 3 there should be some links to location of manufacturing industry. For example, large labour supplies may be found near towns or cities, skilled/high tech workforce near universities, whilst other factors such as an increase in labour costs or search for lower costs may lead to a locational change. Award marks based on the quality of explanation and breadth of the response using the marking levels below. Level 3 (5–6) Response clearly explains two ways labour may affect the location of manufacturing industry. Response is well founded in detailed knowledge and strong conceptual understanding of the topic. Examples used are appropriate and integrated effectively into the response. Level 2 (3–4) Response explains two ways labour may affect the location of manufacturing industry. Response develops on a largely secure base of knowledge and understanding. Examples may lack detail or development. Level 1 (1–2) Response describes some aspects of labour but has limited links to location of manufacturing industry. Knowledge is basic and understanding may be inaccurate. Examples are in name only or lacking entirely. Level 0 (0) No creditable response.
Q2 · Assess the extent to which issues in the intensification of agriculture are less…
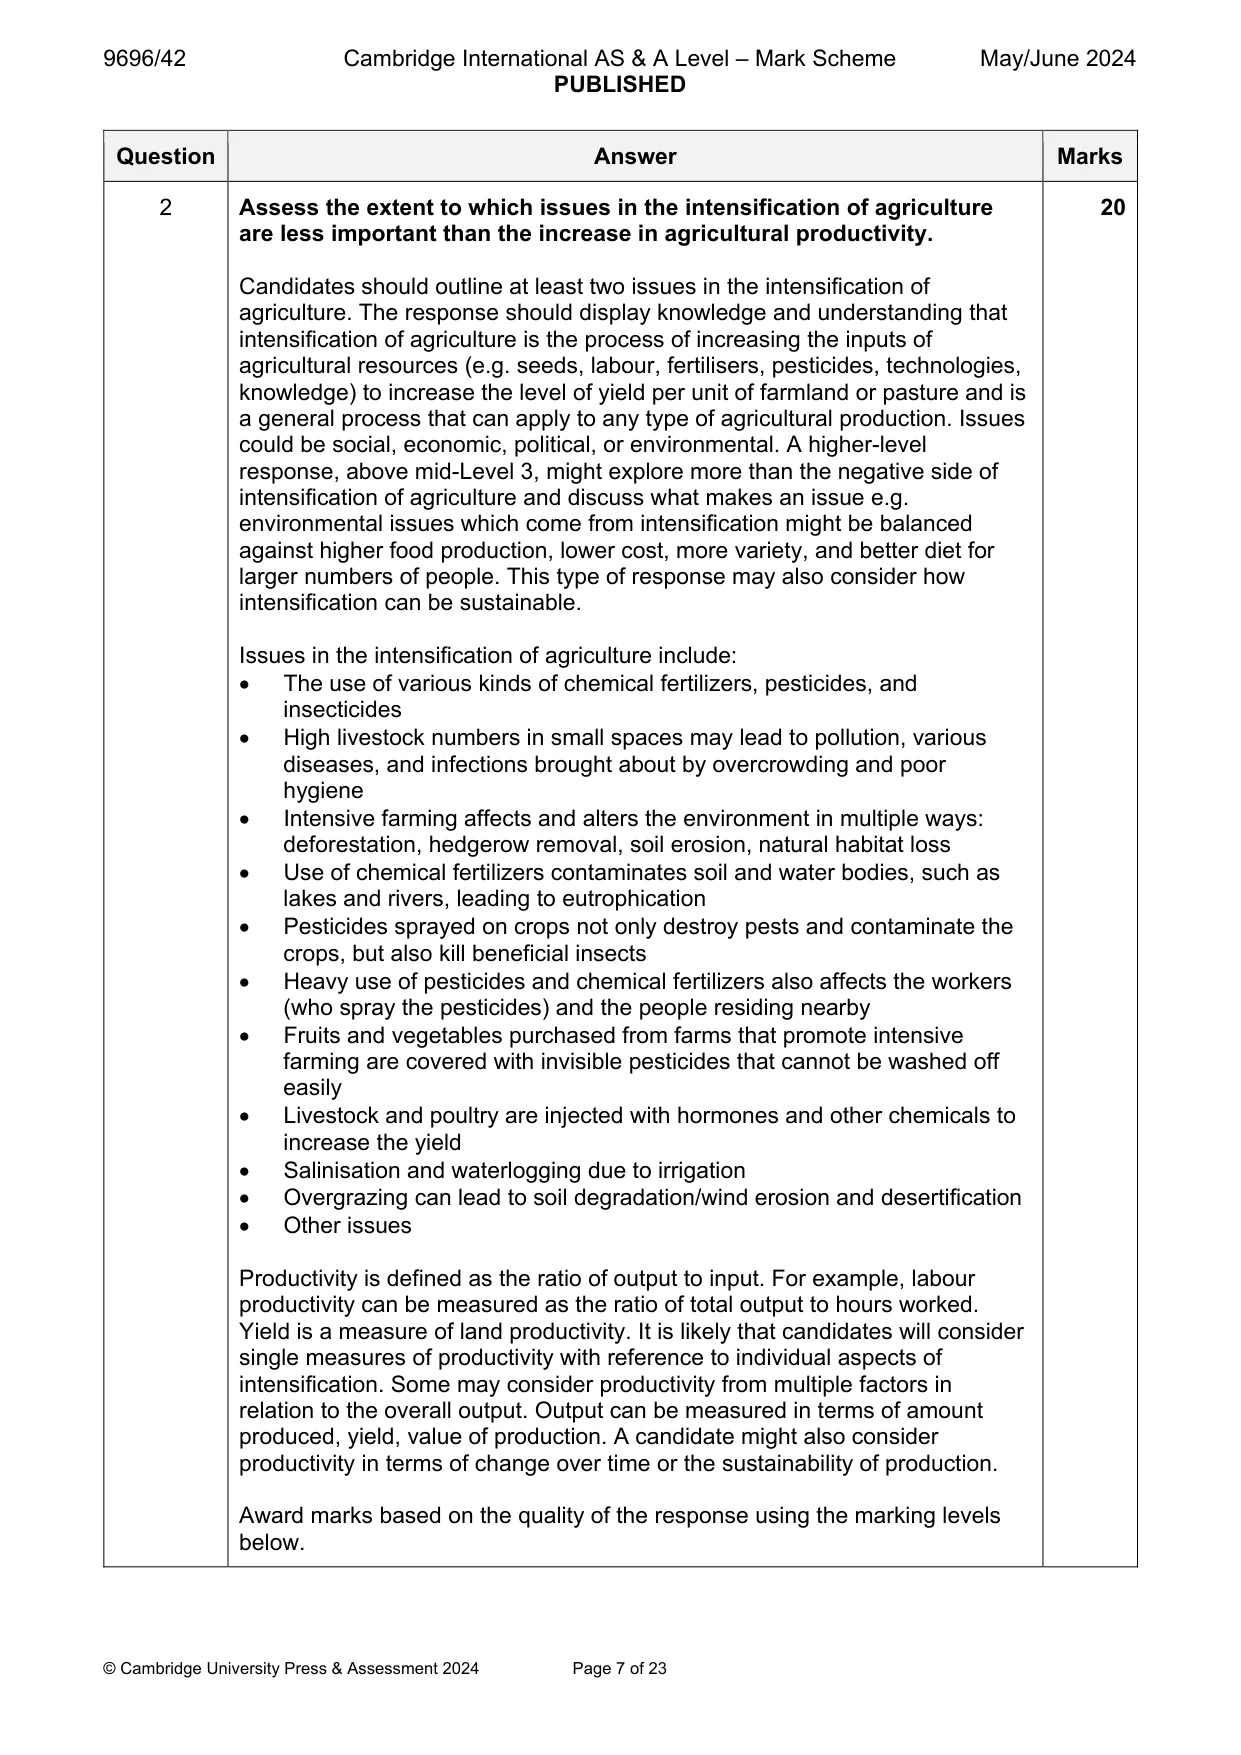
2 Assess the extent to which issues in the intensification of agriculture are less important than the increase in agricultural productivity. [20]
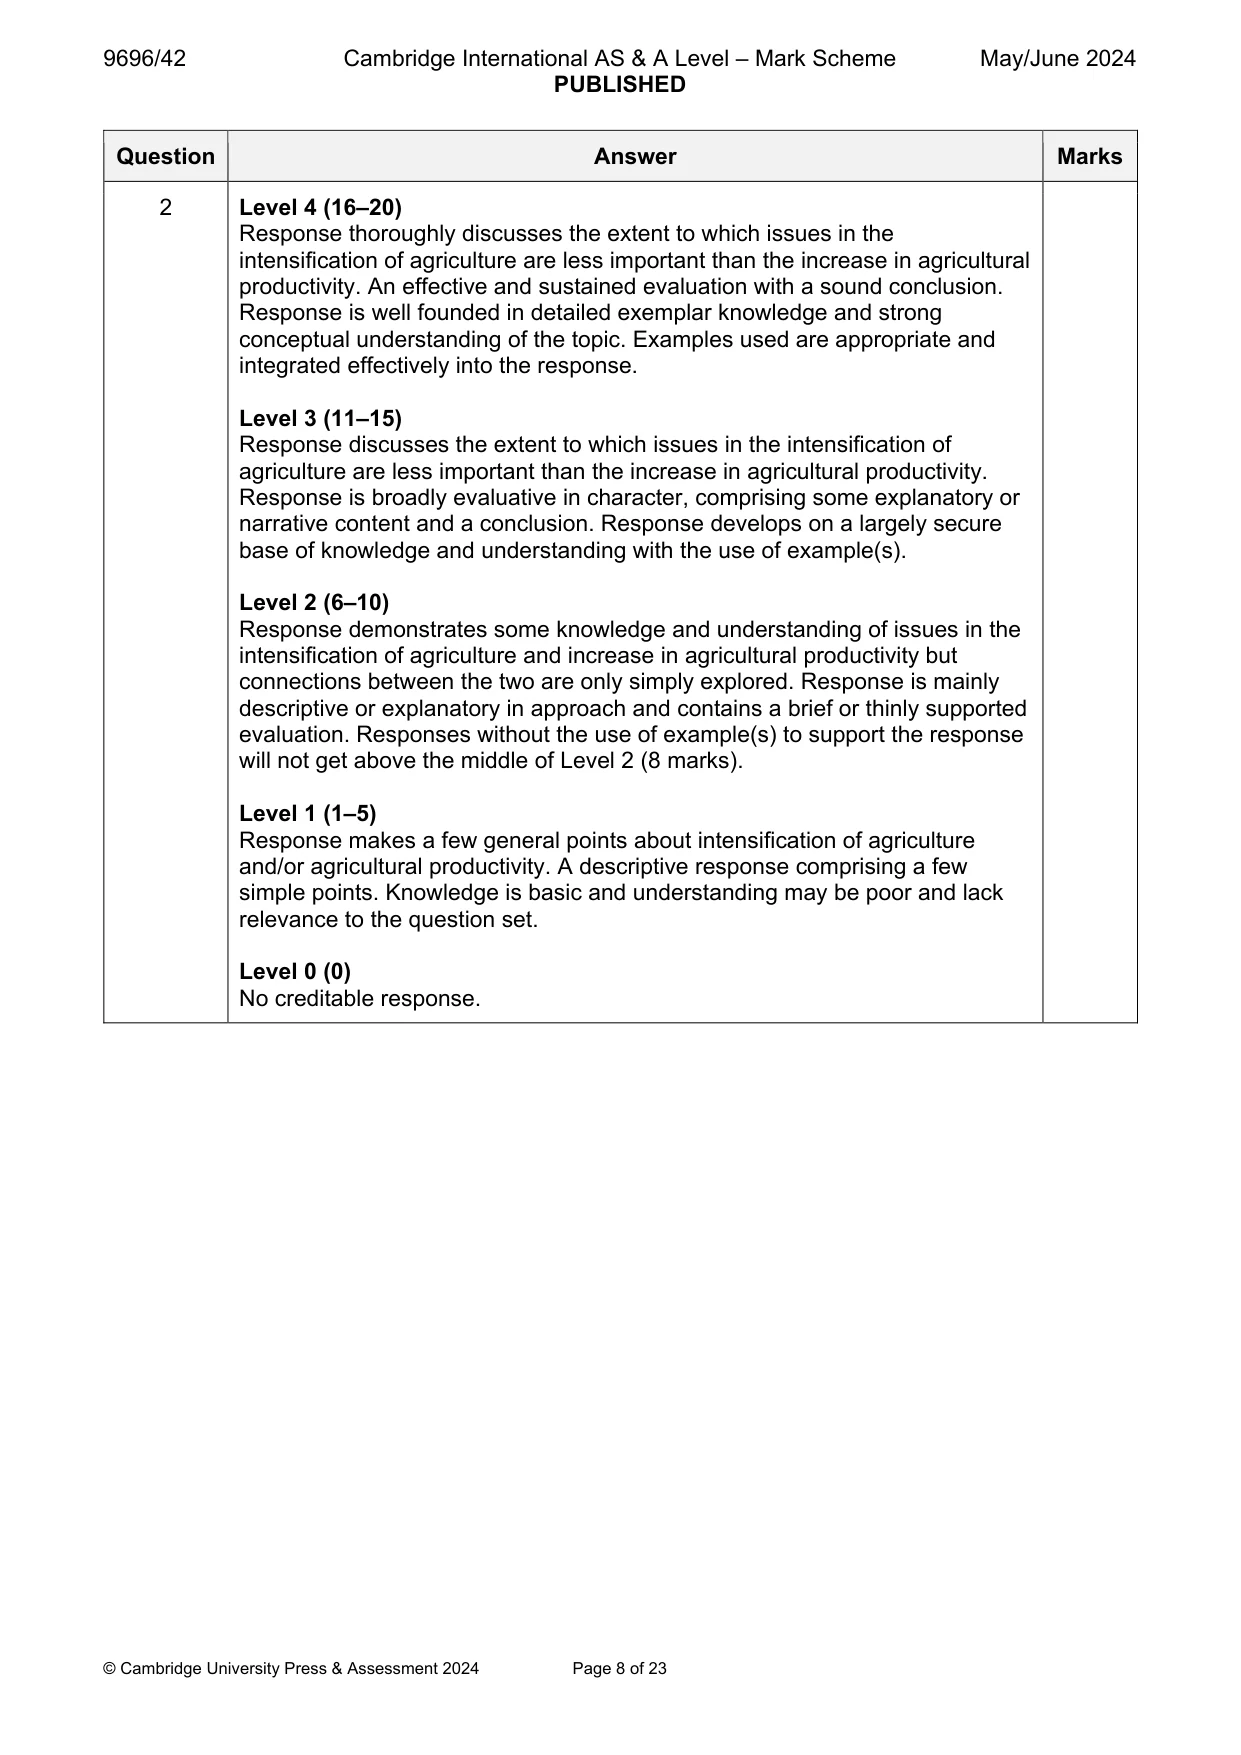
Mark scheme: 2 Assess the extent to which issues in the intensification of agriculture 20 are less important than the increase in agricultural productivity. Candidates should outline at least two issues in the intensification of agriculture. The response should display knowledge and understanding that intensification of agriculture is the process of increasing the inputs of agricultural resources (e.g. seeds, labour, fertilisers, pesticides, technologies, knowledge) to increase the level of yield per unit of farmland or pasture and is a general process that can apply to any type of agricultural production. Issues could be social, economic, political, or environmental. A higher-level response, above mid-Level 3, might explore more than the negative side of intensification of agriculture and discuss what makes an issue e.g. environmental issues which come from intensification might be balanced against higher food production, lower cost, more variety, and better diet for larger numbers of people. This type of response may also consider how intensification can be sustainable. Issues in the intensification of agriculture include: The use of various kinds of chemical fertilizers, pesticides, and insecticides High livestock numbers in small spaces may lead to pollution, various diseases, and infections brought about by overcrowding and poor hygiene Intensive farming affects and alters the environment in multiple ways: deforestation, hedgerow removal, soil erosion, natural habitat loss Use of chemical fertilizers contaminates soil and water bodies, such as lakes and rivers, leading to eutrophication Pesticides sprayed on crops not only destroy pests and contaminate the crops, but also kill beneficial insects Heavy use of pesticides and chemical fertilizers also affects the workers (who spray the pesticides) and the people residing nearby Fruits and vegetables purchased from farms that promote intensive farming are covered with invisible pesticides that cannot be washed off easily Livestock and poultry are injected with hormones and other chemicals to increase the yield Salinisation and waterlogging due to irrigation Overgrazing can lead to soil degradation/wind erosion and desertification Other issues Productivity is defined as the ratio of output to input. For example, labour productivity can be measured as the ratio of total output to hours worked. Yield is a measure of land productivity. It is likely that candidates will consider single measures of productivity with reference to individual aspects of intensification. Some may consider productivity from multiple factors in relation to the overall output. Output can be measured in terms of amount produced, yield, value of production. A candidate might also consider productivity in terms of change over time or the sustainability of production. Award marks based on the quality of the response using the marking levels below. 2 Level 4 (16–20) Response thoroughly discusses the extent to which issues in the intensification of agriculture are less important than the increase in agricultural productivity. An effective and sustained evaluation with a sound conclusion. Response is well founded in detailed exemplar knowledge and strong conceptual understanding of the topic. Examples used are appropriate and integrated effectively into the response. Level 3 (11–15) Response discusses the extent to which issues in the intensification of agriculture are less important than the increase in agricultural productivity. Response is broadly evaluative in character, comprising some explanatory or narrative content and a conclusion. Response develops on a largely secure base of knowledge and understanding with the use of example(s). Level 2 (6–10) Response demonstrates some knowledge and understanding of issues in the intensification of agriculture and increase in agricultural productivity but connections between the two are only simply explored. Response is mainly descriptive or explanatory in approach and contains a brief or thinly supported evaluation. Responses without the use of example(s) to support the response will not get above the middle of Level 2 (8 marks). Level 1 (1–5) Response makes a few general points about intensification of agriculture and/or agricultural productivity. A descriptive response comprising a few simple points. Knowledge is basic and understanding may be poor and lack relevance to the question set. Level 0 (0) No creditable response.
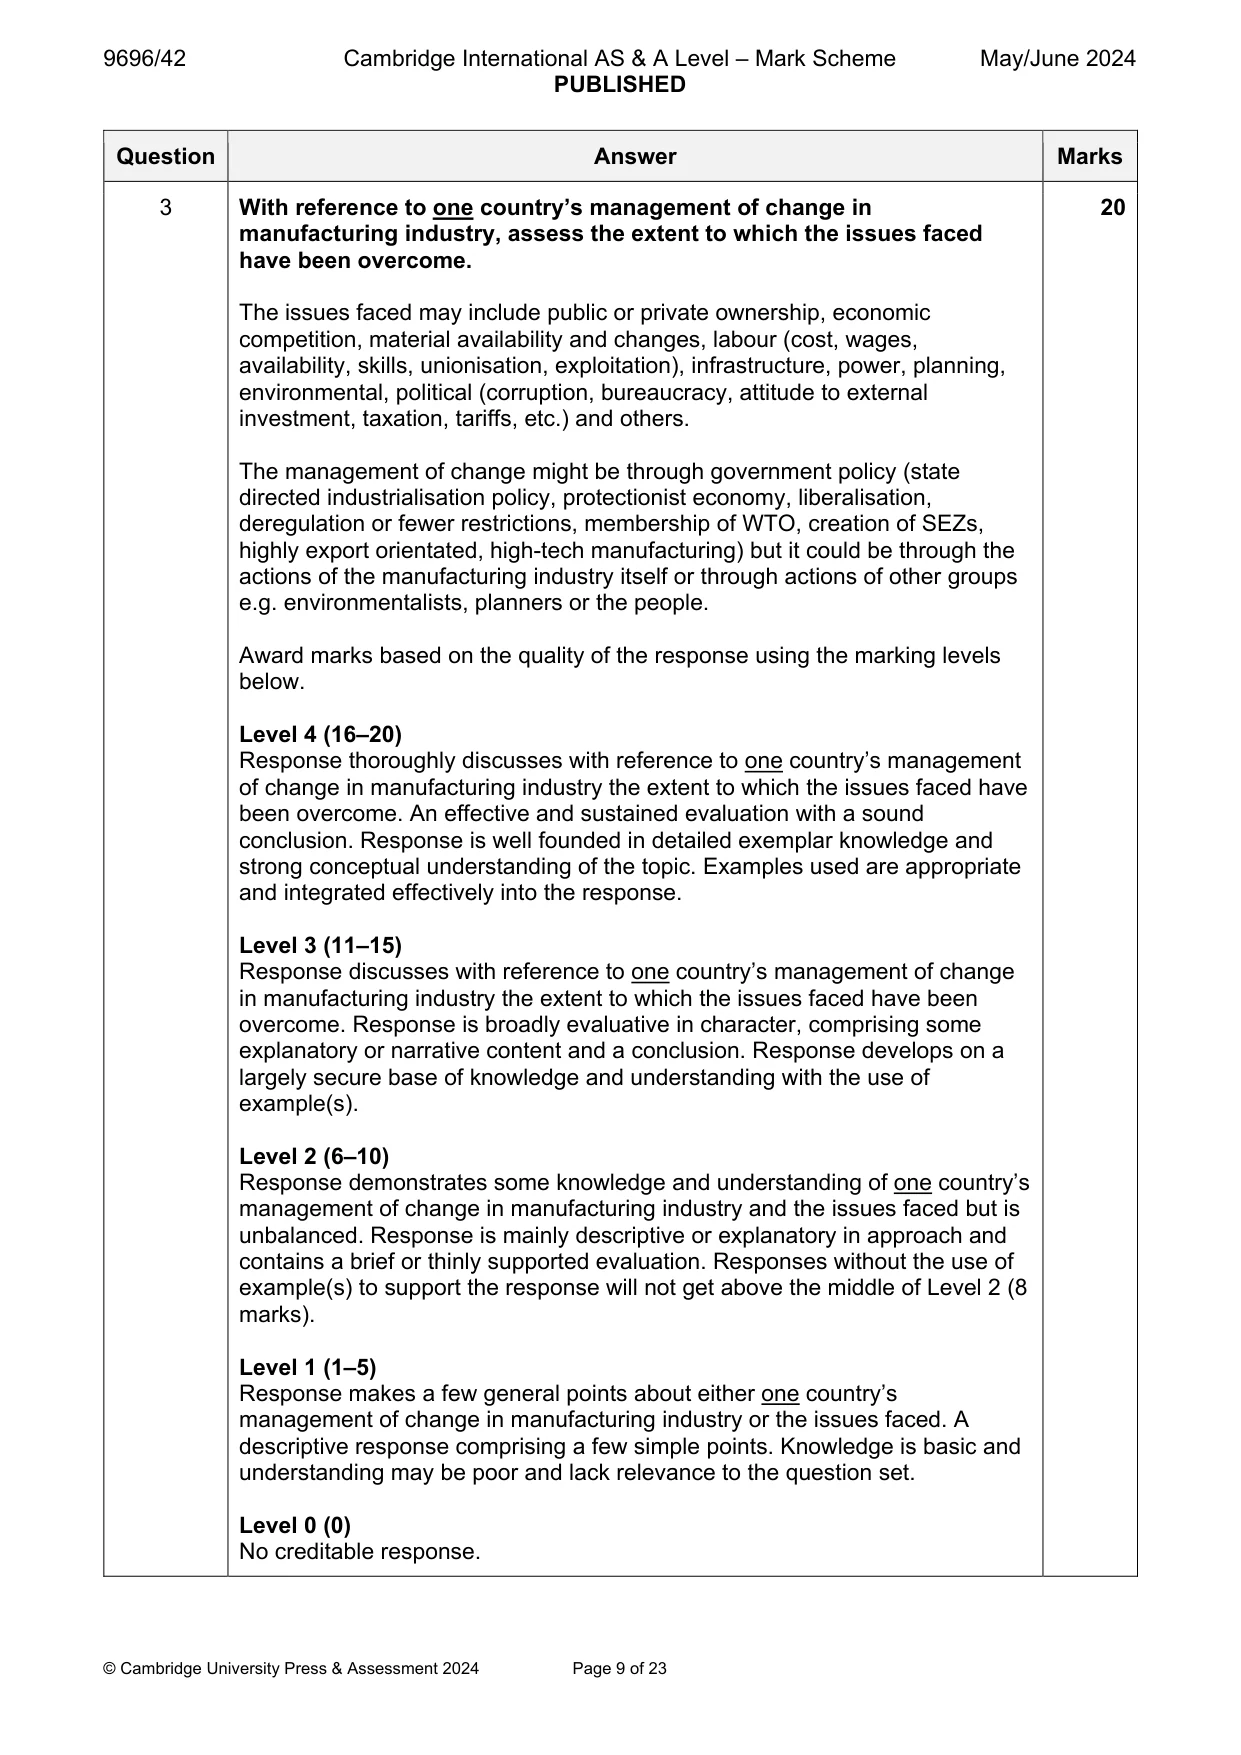
Q3 · With reference to one country’s management of change in manufacturing industry, assess…
3 With reference to one country’s management of change in manufacturing industry, assess the extent to which the issues faced have been overcome. [20] Environmental management If answering this option, answer Question 4 and either Question 5 or Question 6.
Mark scheme: 3 With reference to one country’s management of change in 20 manufacturing industry, assess the extent to which the issues faced have been overcome. The issues faced may include public or private ownership, economic competition, material availability and changes, labour (cost, wages, availability, skills, unionisation, exploitation), infrastructure, power, planning, environmental, political (corruption, bureaucracy, attitude to external investment, taxation, tariffs, etc.) and others. The management of change might be through government policy (state directed industrialisation policy, protectionist economy, liberalisation, deregulation or fewer restrictions, membership of WTO, creation of SEZs, highly export orientated, high-tech manufacturing) but it could be through the actions of the manufacturing industry itself or through actions of other groups e.g. environmentalists, planners or the people. Award marks based on the quality of the response using the marking levels below. Level 4 (16–20) Response thoroughly discusses with reference to one country’s management of change in manufacturing industry the extent to which the issues faced have been overcome. An effective and sustained evaluation with a sound conclusion. Response is well founded in detailed exemplar knowledge and strong conceptual understanding of the topic. Examples used are appropriate and integrated effectively into the response. Level 3 (11–15) Response discusses with reference to one country’s management of change in manufacturing industry the extent to which the issues faced have been overcome. Response is broadly evaluative in character, comprising some explanatory or narrative content and a conclusion. Response develops on a largely secure base of knowledge and understanding with the use of example(s). Level 2 (6–10) Response demonstrates some knowledge and understanding of one country’s management of change in manufacturing industry and the issues faced but is unbalanced. Response is mainly descriptive or explanatory in approach and contains a brief or thinly supported evaluation. Responses without the use of example(s) to support the response will not get above the middle of Level 2 (8 marks). Level 1 (1–5) Response makes a few general points about either one country’s management of change in manufacturing industry or the issues faced. A descriptive response comprising a few simple points. Knowledge is basic and understanding may be poor and lack relevance to the question set. Level 0 (0) No creditable response. Environmental management If answering this option, answer Question 4 and either Question 5 or Question 6.
Q4 · The population without basic drinking water services, by world region, 2000–20
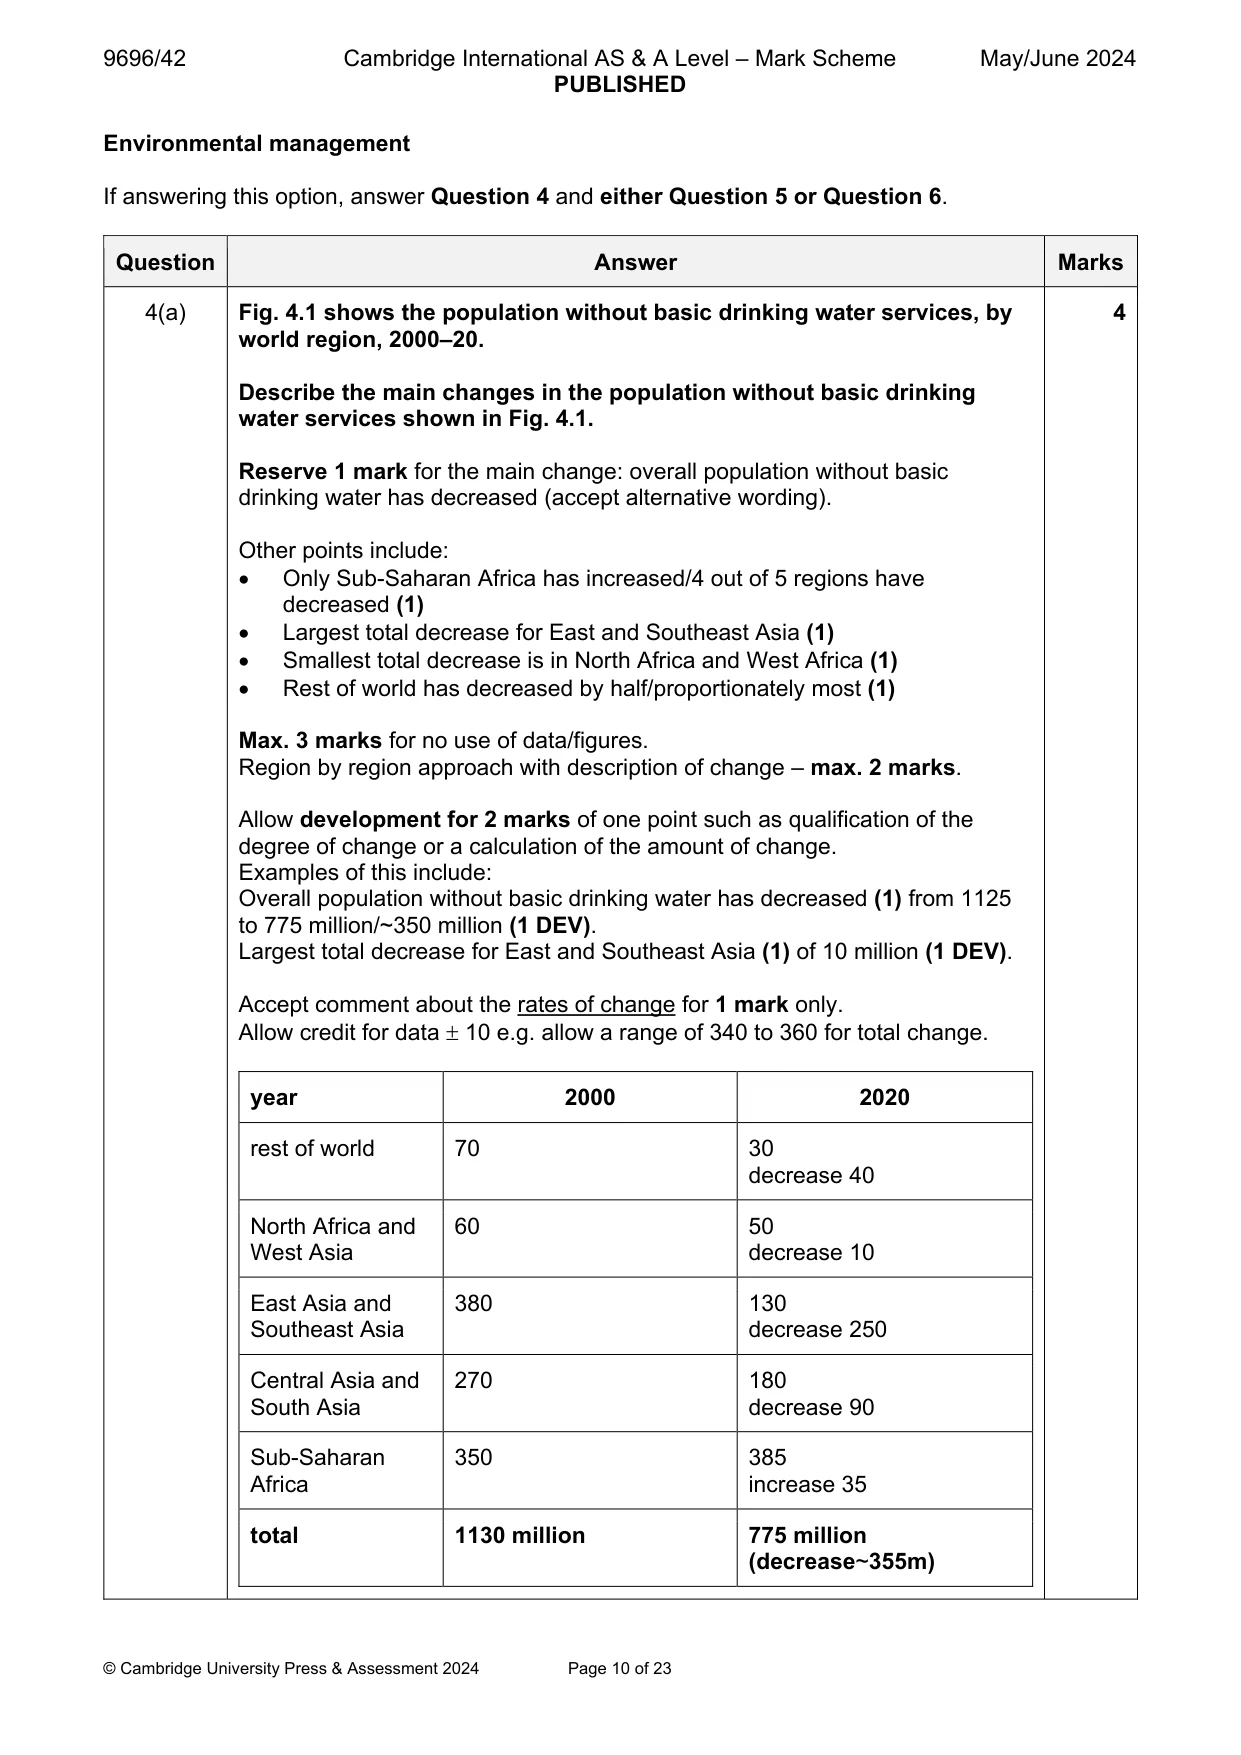
4 Fig. 4.1 shows the population without basic drinking water services, by world region, 2000–20. (a) Describe the main changes in the population without basic drinking water services shown in Fig. 4.1. [4] (b) Suggest reasons why there may be an increase of population without basic drinking water services in a region. [6]
Mark scheme: 4(a) Fig. 4.1 shows the population without basic drinking water services, by 4 world region, 2000–20. Describe the main changes in the population without basic drinking water services shown in Fig. 4.1. Reserve 1 mark for the main change: overall population without basic drinking water has decreased (accept alternative wording). Other points include: Only Sub-Saharan Africa has increased/4 out of 5 regions have decreased (1) Largest total decrease for East and Southeast Asia (1) Smallest total decrease is in North Africa and West Africa (1) Rest of world has decreased by half/proportionately most (1) Max. 3 marks for no use of data/figures. Region by region approach with description of change – max. 2 marks. Allow development for 2 marks of one point such as qualification of the degree of change or a calculation of the amount of change. Examples of this include: Overall population without basic drinking water has decreased (1) from 1125 to 775 million/~350 million (1 DEV). Largest total decrease for East and Southeast Asia (1) of 10 million (1 DEV). Accept comment about the rates of change for 1 mark only. Allow credit for data 10 e.g. allow a range of 340 to 360 for total change. year 2000 2020 rest of world 70 30 decrease 40 North Africa and 60 50 West Asia decrease 10 East Asia and 380 130 Southeast Asia decrease 250 Central Asia and 270 180 South Asia decrease 90 Sub-Saharan 350 385 Africa increase 35 total 1130 million 775 million (decrease~355m) 4(b) Suggest reasons why there may be an increase of population without 6 basic drinking water services in a region. Candidates may use Fig. 4.1 as a stimulus and consider the situation in Sub- Saharan Africa but this is not a requirement. Reasons might include: Population growth Cost/poverty/inequality of individuals High cost of infrastructure provision and treatment Poor management of services Pollution through lack of sanitation or other sources of pollution Drought/changing rainfall patterns and other factors linked to climate change Insurgency/civil war preventing access/forcing people to migrate e.g. Sudan Competition for water e.g. agricultural increase or industrialisation of the area leading to water insecurity Award marks based on the quality of explanation and breadth of the response using the marking levels below. Level 3 (5–6) Response clearly explains why there may be an increase of population without basic drinking water services in a region. Response is well founded in detailed knowledge and strong conceptual understanding of the topic. Examples used are appropriate and integrated effectively into the response. Level 2 (3–4) Response explains why there may be an increase of population without basic drinking water services in a region. Response develops on a largely secure base of knowledge and understanding. Examples may lack detail or development. Level 1 (1–2) Response describes how water may be limited in a region without reference to drinking water or why this may increase. Knowledge is basic and understanding may be inaccurate. Examples are in name only or lacking entirely. Level 0 (0) No creditable response.
Q5 · With reference to one country’s overall electrical energy strategy, assess the extent to…
5 With reference to one country’s overall electrical energy strategy, assess the extent to which changes in the location of power production led to issues. [20]
Mark scheme: 5 With reference to one country’s overall electrical energy strategy, 20 assess the extent to which changes in the location of power production led to issues. Candidates should consider changes in the location of power production and at least two issues. The changes in location of power production could include new locations (of either the same source or related to new sources), changes in existing locations (growth, shrinkage, change of material source or type) and might include links with production in other countries. Candidates do not need a named located scheme and can answer this question using an overall electrical strategy. Issues could be social (displacement of residents, opposition, etc.), economic (initial cost, maintenance, loss of jobs, etc.), political (international agreements/targets, over-ambitious plans, vanity projects, trans-boundary water issues, etc.), or environmental (disruption of habitats/wildlife, etc.) and might be at any or various scales affecting different groups in differing ways. Award marks based on the quality of the response using the marking levels below. Level 4 (16–20) Response thoroughly discusses with reference to one country’s overall electrical energy strategy the extent to which changes in the location of power production led to issues. An effective and sustained evaluation with a sound conclusion. Response is well founded in detailed exemplar knowledge and strong conceptual understanding of the topic. Examples used are appropriate and integrated effectively into the response. Level 3 (11–15) Response discusses with reference to one country’s overall electrical energy strategy the extent to which changes in the location of power production led to issues. Response is broadly evaluative in character, comprising some explanatory or narrative content and a conclusion. Response develops on a largely secure base of knowledge and understanding with the use of example(s). Level 2 (6–10) Response demonstrates some knowledge and understanding of one country’s overall electrical energy strategy, the changes in the location of power production and issues but is unbalanced. Response is mainly descriptive or explanatory in approach and contains a brief or thinly supported evaluation. Responses without the use of example(s) to support the response will not get above the middle of Level 2 (8 marks). Level 1 (1–5) Response makes a few general points about power production or issues of power production in one country. A descriptive response comprising a few simple points. Knowledge is basic and understanding may be poor and lack relevance to the question set. Level 0 (0) No creditable response.
Q6 · ‘Successful protection of environments at risk depends on overcoming constraints.’ With…
6 ‘Successful protection of environments at risk depends on overcoming constraints.’ With reference to one or more examples, how far do you agree with this statement? [20] Global interdependence If answering this option, answer Question 7 and either Question 8 or Question 9.
Mark scheme: 6 ‘Successful protection of environments at risk depends on overcoming 20 constraints.’ With reference to one or more examples, how far do you agree with this statement? The environments at risk could be land, air, water, or a combination, and rural or urban. The constraints might be social (e.g. lack of education, opposition to proposed changes, increasing population, etc.), economic (relating to the cost, scale or economic importance of the activity, etc.), political (influence of polluting TNCs, political priorities, transboundary pollutants, conflict, etc.) or environmental (scale, remoteness, lag time, etc.). Successful protection might be seen as reducing or removing the risks, ameliorating, or removing the effects and might vary according to the actions and/or viewpoint of different groups. The environment at risk should be clearly identified and can be at the local or regional scale. A single case study or multiple examples may be used to illustrate the response. Award marks based on the quality of the response using the marking levels below. Level 4 (16–20) Response thoroughly discusses the extent to which successful protection of environments at risk depends on overcoming constraints. An effective and sustained evaluation with a sound conclusion. Response is well founded in detailed exemplar knowledge and strong conceptual understanding of the topic. Examples used are appropriate and integrated effectively into the response. Level 3 (11–15) Response discusses the extent to which successful protection of environments at risk depends on overcoming constraints. Response is broadly evaluative in character, comprising some explanatory or narrative content and a conclusion. Response develops on a largely secure base of knowledge and understanding with the use of example(s). Level 2 (6–10) Response demonstrates some knowledge and understanding of the protection of environments at risk and the constraints but with little comment on successful protection. Response is mainly descriptive or explanatory in approach and contains a brief or thinly supported evaluation. Responses without the use of example(s) to support the response will not get above the middle of Level 2 (8 marks). Level 1 (1–5) Response makes a few general points about either protection of environments at risk or the constraints. The scale is not local or regional. A descriptive response comprising a few simple points. Knowledge is basic and understanding may be poor and lack relevance to the question set. Level 0 (0) No creditable response. Global interdependence If answering this option, answer Question 7 and either Question 8 or Question 9.
Q7 · The net debtor or net creditor status of a country in 2020
7 Fig. 7.1 shows the net debtor or net creditor status of a country in 2020. (a) Describe the distribution of countries with a net debtor status shown in Fig. 7.1. [4] (b) Explain two causes of international debt. [6]
Mark scheme: 7(a) Fig. 7.1 shows the net debtor or net creditor status of a country in 2020. 4 Describe the distribution of countries with a net debtor status shown in Fig. 7.1. Candidates should describe the distribution of the net debtor category. The distribution might be described as: They are found in all continents/spread across the globe/in both hemispheres (1) majority of countries are net debtor (1 Dev) Equator countries (1) More in northern hemisphere (1) Majority of countries in Africa/Europe/South America/North America/Oceania (1) distribution within a continent (1 DEV) Relatively fewer in Asia (1) but not true in Southeast Asia/fewer in Northern Asia (1 DEV) Other Allow development of one point. Not accepting: most in Africa, most are HICs, listing some countries in a continent. 7(b) Explain two causes of international debt. 6 The question is not about the causes of the international debt crisis. Candidates might describe what international debt is: international debt is money borrowed by a government, corporation or private household from another country’s government, private lenders, or multilateral organisations such as the World Bank, Asian Development Bank (ADB), and the International Monetary Fund (IMF). A government or a corporation may borrow from a foreign lender for a range of reasons: Domestic sources of finance may not be enough Foreign lenders might offer more attractive terms Borrowing can be used to finance development, infrastructure, or social provisions For LICs, borrowing from international organisations like the World Bank can provide funding it might not otherwise be able to attain, at attractive rates and with flexible repayment schedules Corruption and poor governance – money borrowed for development projects but actually used to finance army or personal gain of officials Unexpected events, e.g. natural disaster, disease, war, trade embargoes, recessions, etc. Other Candidates may also consider why some suppliers of capital may wish to lend money. Reasons may include: Rapid capital accumulation e.g. oil rich states and ability to earn interest Supporting economies and currencies in countries with large markets Economic and/or political influence in borrowing countries Other Award marks based on the quality of explanation and breadth of the response using the marking levels below. Level 3 (5–6) Response clearly explains two causes of international debt. Response is well founded in detailed knowledge and strong conceptual understanding of the topic. Examples used are appropriate and integrated effectively into the response. Level 2 (3–4) Response explains two causes of international debt. Response develops on a largely secure base of knowledge and understanding. Examples may lack detail or development. Level 1 (1–2) Response describes two causes of international debt. Knowledge is basic and understanding may be inaccurate. Examples are in name only or lacking entirely. Level 0 (0) No creditable response.
Q8 · Assess the extent to which global patterns of trade are influenced by changes in the…
8 Assess the extent to which global patterns of trade are influenced by changes in the global market. [20]
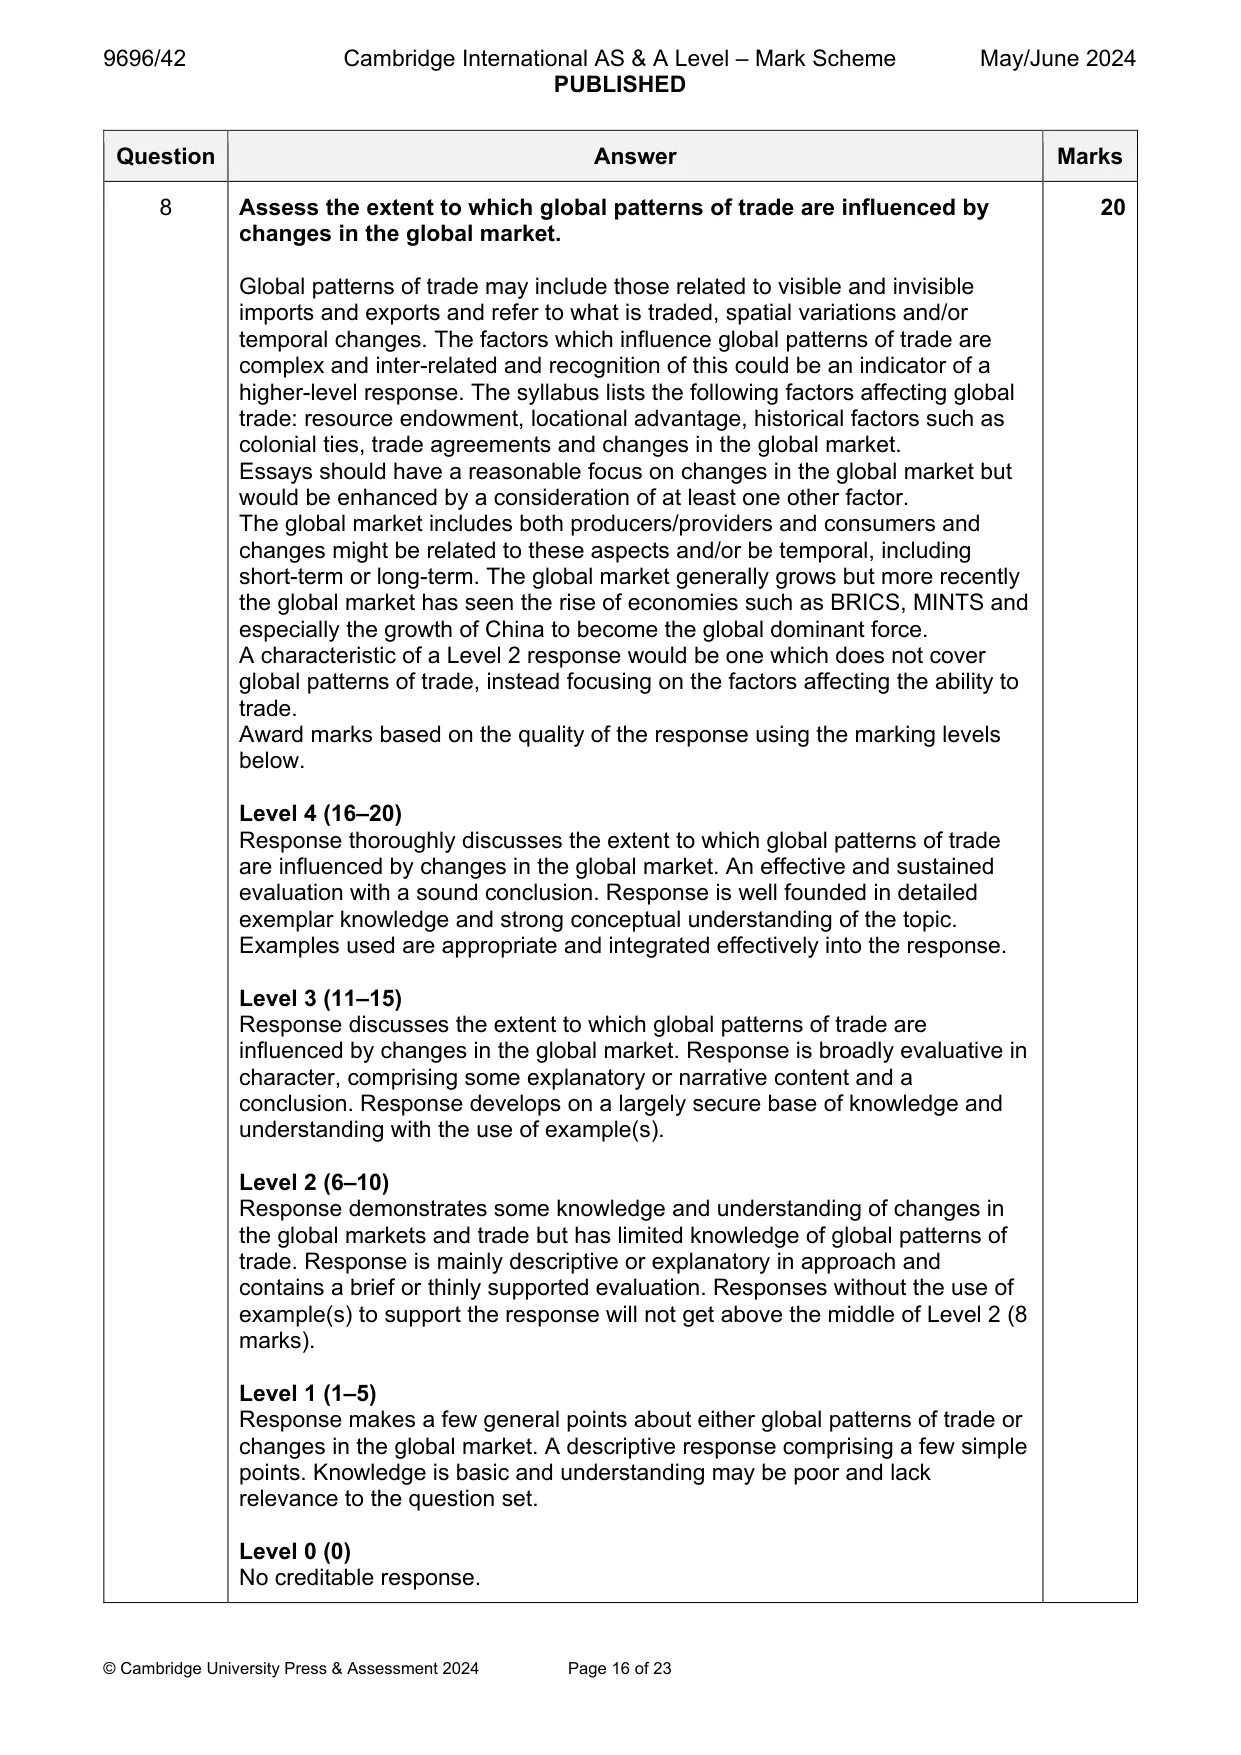
Mark scheme: 8 Assess the extent to which global patterns of trade are influenced by 20 changes in the global market. Global patterns of trade may include those related to visible and invisible imports and exports and refer to what is traded, spatial variations and/or temporal changes. The factors which influence global patterns of trade are complex and inter-related and recognition of this could be an indicator of a higher-level response. The syllabus lists the following factors affecting global trade: resource endowment, locational advantage, historical factors such as colonial ties, trade agreements and changes in the global market. Essays should have a reasonable focus on changes in the global market but would be enhanced by a consideration of at least one other factor. The global market includes both producers/providers and consumers and changes might be related to these aspects and/or be temporal, including short-term or long-term. The global market generally grows but more recently the global market has seen the rise of economies such as BRICS, MINTS and especially the growth of China to become the global dominant force. A characteristic of a Level 2 response would be one which does not cover global patterns of trade, instead focusing on the factors affecting the ability to trade. Award marks based on the quality of the response using the marking levels below. Level 4 (16–20) Response thoroughly discusses the extent to which global patterns of trade are influenced by changes in the global market. An effective and sustained evaluation with a sound conclusion. Response is well founded in detailed exemplar knowledge and strong conceptual understanding of the topic. Examples used are appropriate and integrated effectively into the response. Level 3 (11–15) Response discusses the extent to which global patterns of trade are influenced by changes in the global market. Response is broadly evaluative in character, comprising some explanatory or narrative content and a conclusion. Response develops on a largely secure base of knowledge and understanding with the use of example(s). Level 2 (6–10) Response demonstrates some knowledge and understanding of changes in the global markets and trade but has limited knowledge of global patterns of trade. Response is mainly descriptive or explanatory in approach and contains a brief or thinly supported evaluation. Responses without the use of example(s) to support the response will not get above the middle of Level 2 (8 marks). Level 1 (1–5) Response makes a few general points about either global patterns of trade or changes in the global market. A descriptive response comprising a few simple points. Knowledge is basic and understanding may be poor and lack relevance to the question set. Level 0 (0) No creditable response.
Q9 · With reference to one tourist area or resort, assess the extent to which the impacts of…
9 With reference to one tourist area or resort, assess the extent to which the impacts of tourism change over time. [20] Economic transition If answering this option, answer Question 10 and either Question 11 or Question 12.
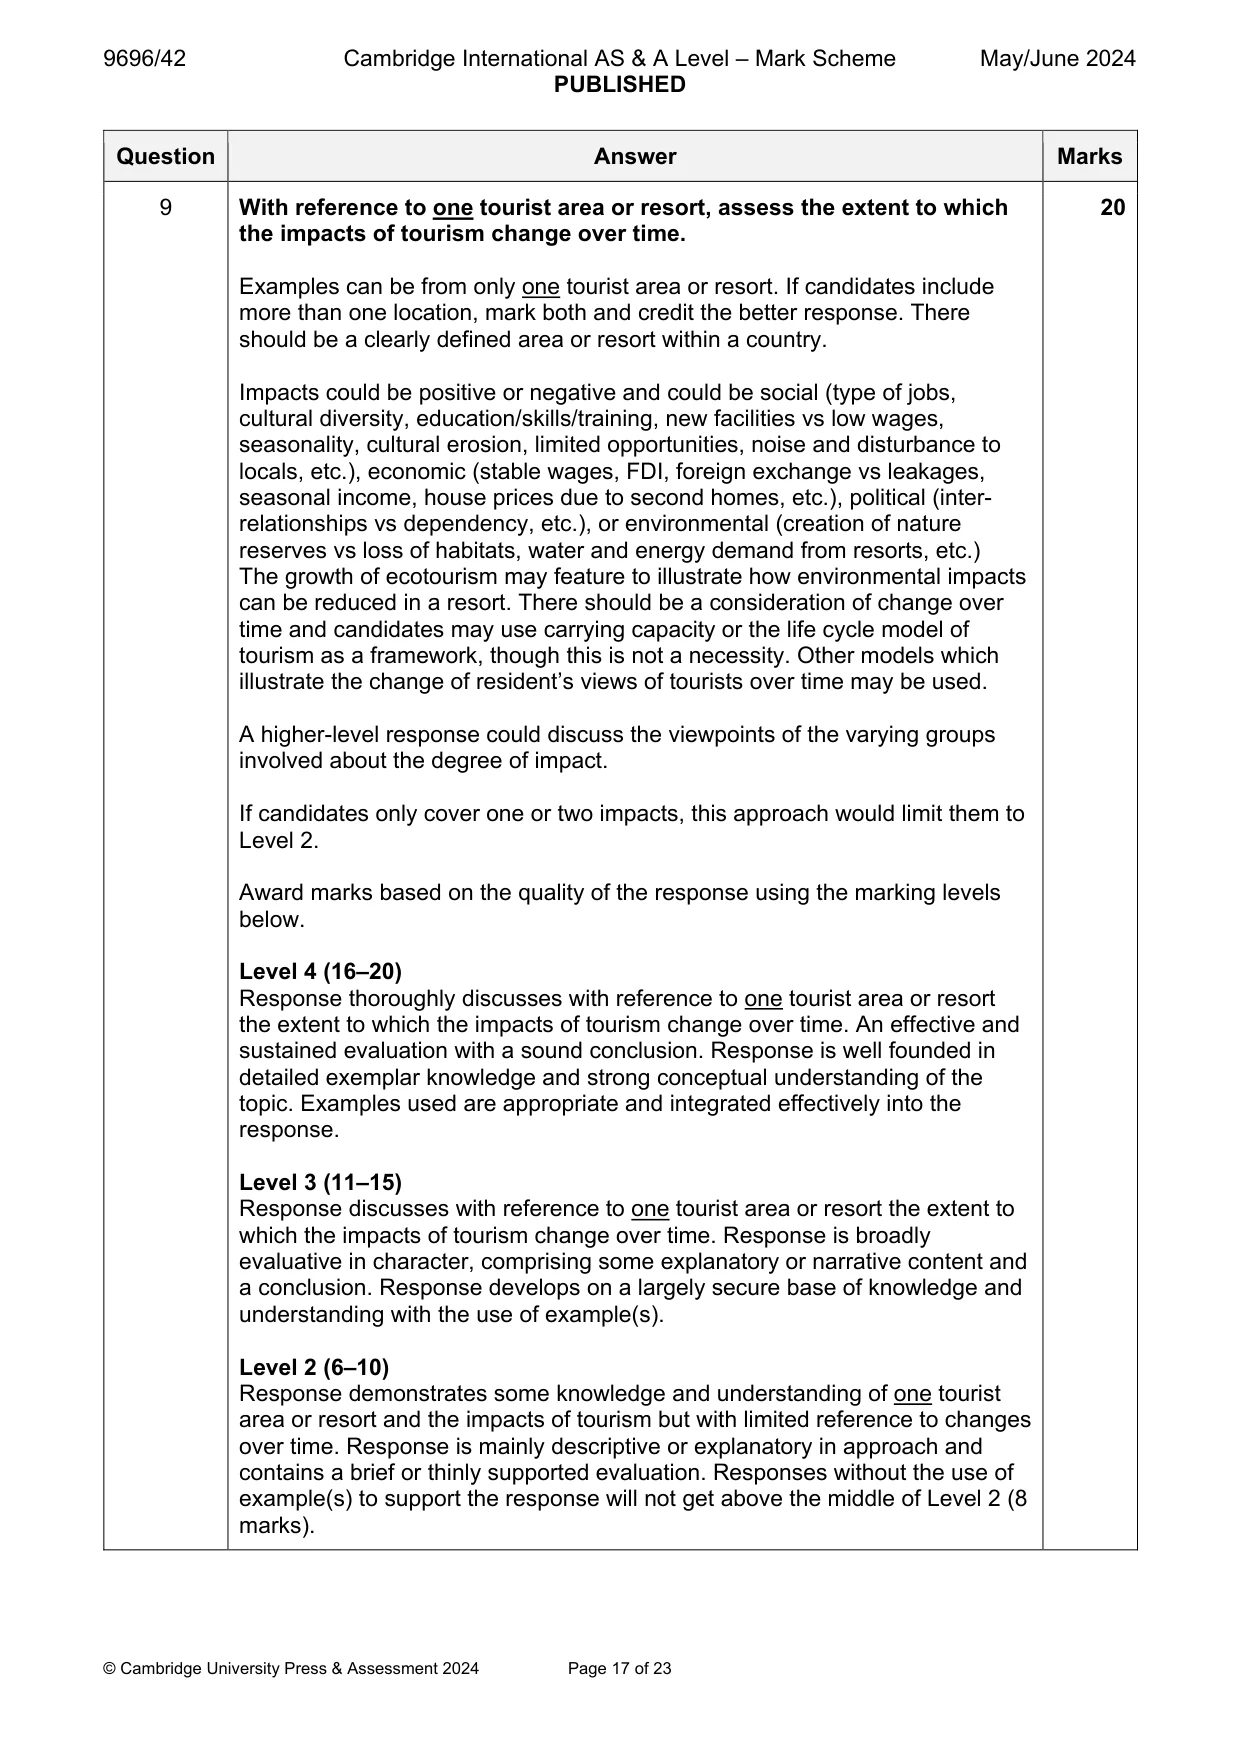
Mark scheme: 9 With reference to one tourist area or resort, assess the extent to which 20 the impacts of tourism change over time. Examples can be from only one tourist area or resort. If candidates include more than one location, mark both and credit the better response. There should be a clearly defined area or resort within a country. Impacts could be positive or negative and could be social (type of jobs, cultural diversity, education/skills/training, new facilities vs low wages, seasonality, cultural erosion, limited opportunities, noise and disturbance to locals, etc.), economic (stable wages, FDI, foreign exchange vs leakages, seasonal income, house prices due to second homes, etc.), political (inter- relationships vs dependency, etc.), or environmental (creation of nature reserves vs loss of habitats, water and energy demand from resorts, etc.) The growth of ecotourism may feature to illustrate how environmental impacts can be reduced in a resort. There should be a consideration of change over time and candidates may use carrying capacity or the life cycle model of tourism as a framework, though this is not a necessity. Other models which illustrate the change of resident’s views of tourists over time may be used. A higher-level response could discuss the viewpoints of the varying groups involved about the degree of impact. If candidates only cover one or two impacts, this approach would limit them to Level 2. Award marks based on the quality of the response using the marking levels below. Level 4 (16–20) Response thoroughly discusses with reference to one tourist area or resort the extent to which the impacts of tourism change over time. An effective and sustained evaluation with a sound conclusion. Response is well founded in detailed exemplar knowledge and strong conceptual understanding of the topic. Examples used are appropriate and integrated effectively into the response. Level 3 (11–15) Response discusses with reference to one tourist area or resort the extent to which the impacts of tourism change over time. Response is broadly evaluative in character, comprising some explanatory or narrative content and a conclusion. Response develops on a largely secure base of knowledge and understanding with the use of example(s). Level 2 (6–10) Response demonstrates some knowledge and understanding of one tourist area or resort and the impacts of tourism but with limited reference to changes over time. Response is mainly descriptive or explanatory in approach and contains a brief or thinly supported evaluation. Responses without the use of example(s) to support the response will not get above the middle of Level 2 (8 marks). 9 Level 1 (1–5) Response makes a few general points about the impacts of tourism or has limited comment on changes over time of the impacts of tourism on one tourist area or resort. A descriptive response comprising a few simple points. Knowledge is basic and understanding may be poor and lack relevance to the question set. Level 0 (0) No creditable response. Economic transition If answering this option, answer Question 10 and either Question 11 or Question 12.
Q10 · The annual growth rate of world real gross domestic product (GDP), 2006–20 and estimated…
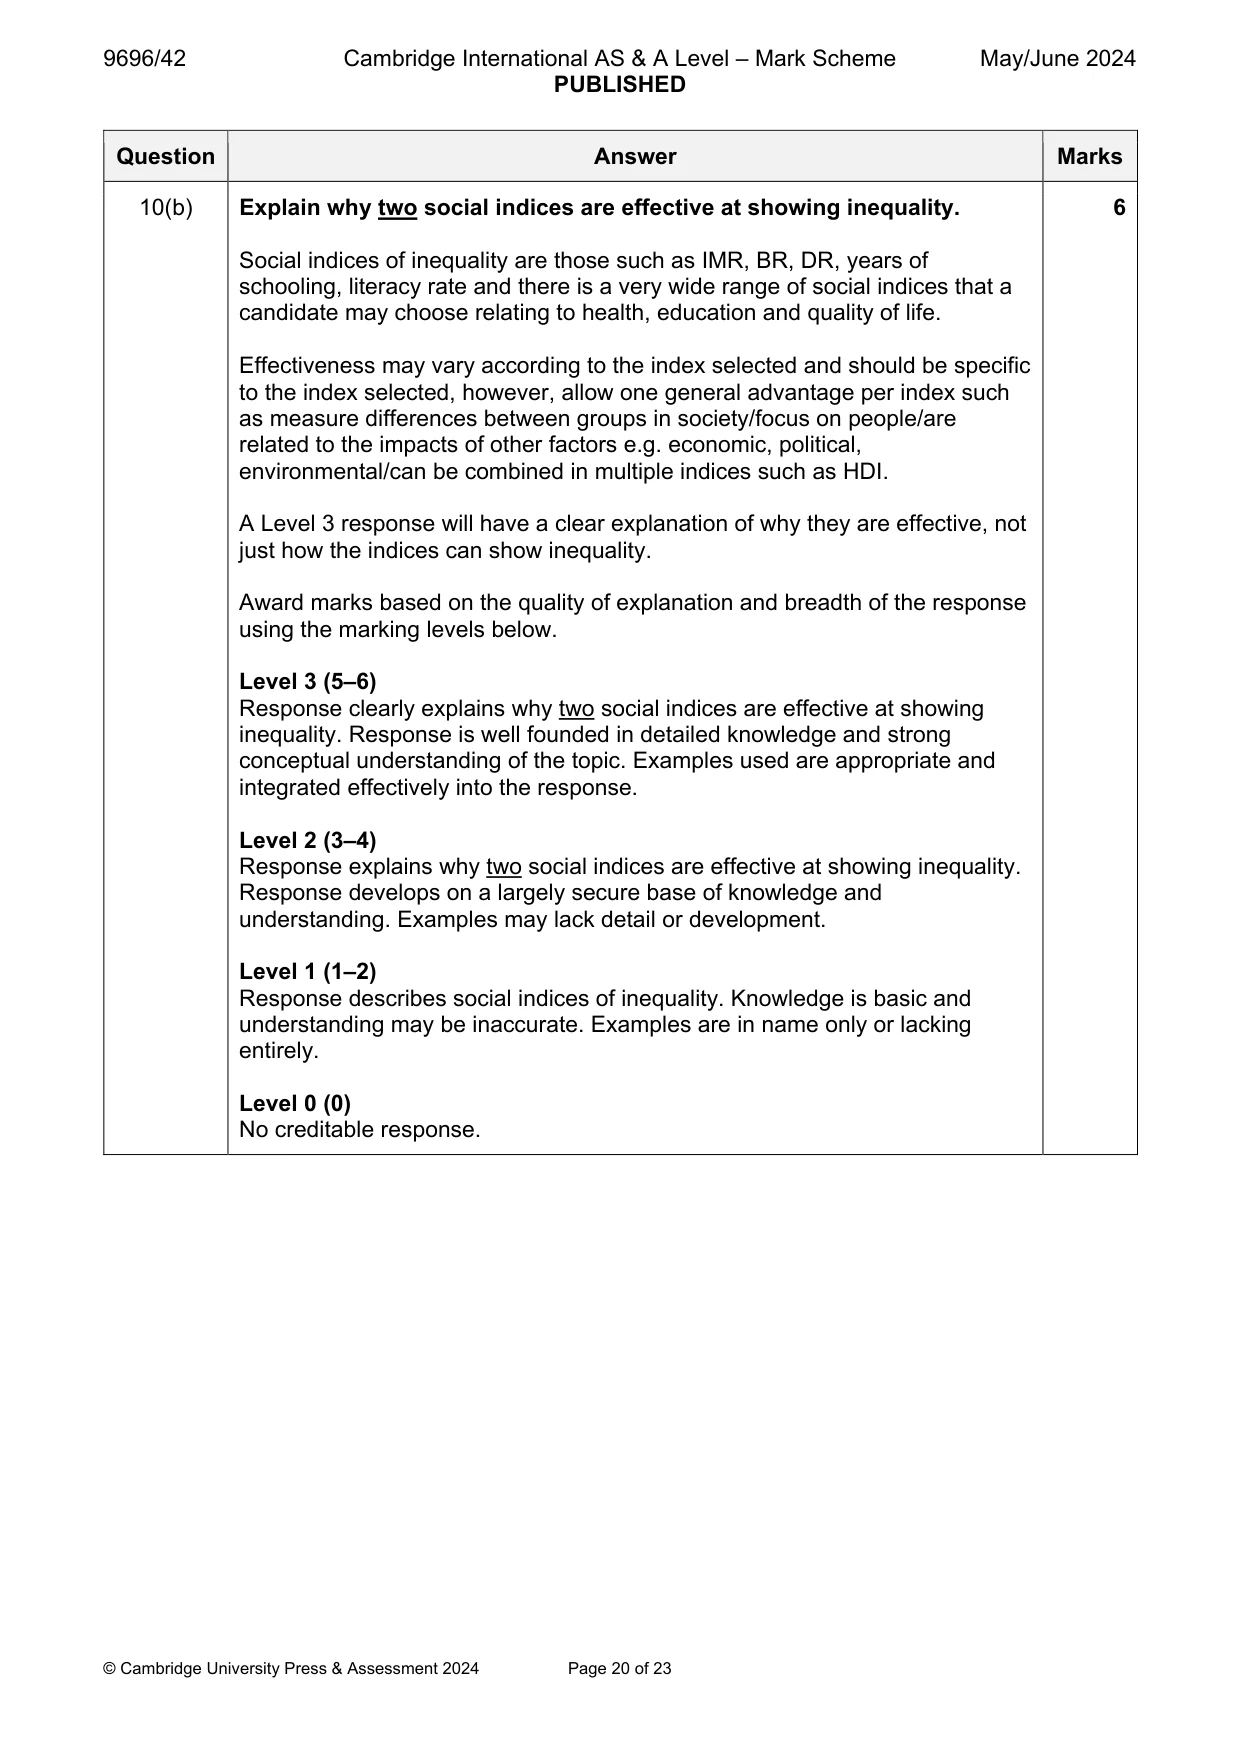
10 Fig. 10.1 shows the annual growth rate of world real gross domestic product (GDP), 2006–20 and estimated to 2021. (a) Describe the trends of annual growth rate of real GDP shown in Fig. 10.1. [4] (b) Explain why two social indices are effective at showing inequality. [6]
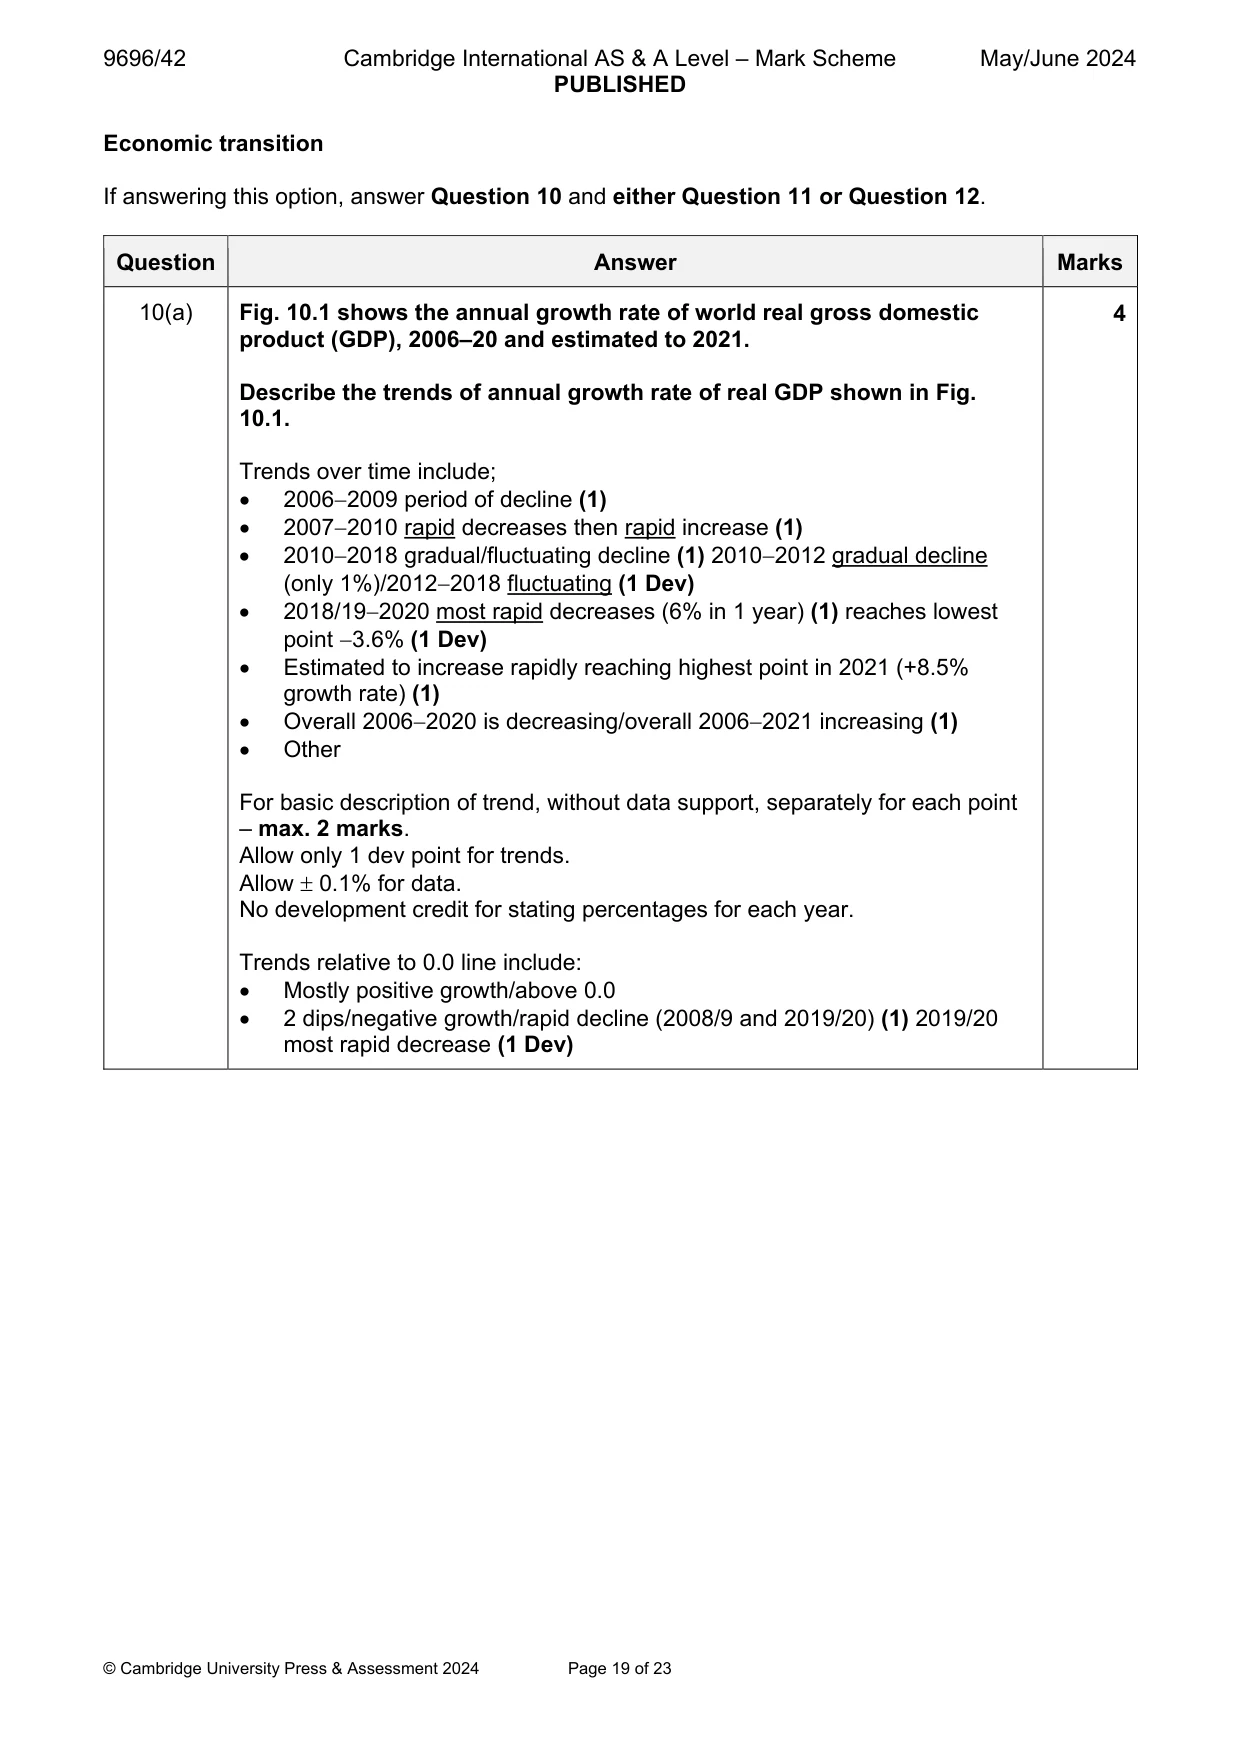
Mark scheme: 10(a) Fig. 10.1 shows the annual growth rate of world real gross domestic 4 product (GDP), 2006–20 and estimated to 2021. Describe the trends of annual growth rate of real GDP shown in Fig. 10.1. Trends over time include; 20062009 period of decline (1) 20072010 rapid decreases then rapid increase (1) 20102018 gradual/fluctuating decline (1) 20102012 gradual decline (only 1%)/20122018 fluctuating (1 Dev) 2018/192020 most rapid decreases (6% in 1 year) (1) reaches lowest point 3.6% (1 Dev) Estimated to increase rapidly reaching highest point in 2021 (+8.5% growth rate) (1) Overall 20062020 is decreasing/overall 20062021 increasing (1) Other For basic description of trend, without data support, separately for each point – max. 2 marks. Allow only 1 dev point for trends. Allow 0.1% for data. No development credit for stating percentages for each year. Trends relative to 0.0 line include: Mostly positive growth/above 0.0 2 dips/negative growth/rapid decline (2008/9 and 2019/20) (1) 2019/20 most rapid decrease (1 Dev) 10(b) Explain why two social indices are effective at showing inequality. 6 Social indices of inequality are those such as IMR, BR, DR, years of schooling, literacy rate and there is a very wide range of social indices that a candidate may choose relating to health, education and quality of life. Effectiveness may vary according to the index selected and should be specific to the index selected, however, allow one general advantage per index such as measure differences between groups in society/focus on people/are related to the impacts of other factors e.g. economic, political, environmental/can be combined in multiple indices such as HDI. A Level 3 response will have a clear explanation of why they are effective, not just how the indices can show inequality. Award marks based on the quality of explanation and breadth of the response using the marking levels below. Level 3 (5–6) Response clearly explains why two social indices are effective at showing inequality. Response is well founded in detailed knowledge and strong conceptual understanding of the topic. Examples used are appropriate and integrated effectively into the response. Level 2 (3–4) Response explains why two social indices are effective at showing inequality. Response develops on a largely secure base of knowledge and understanding. Examples may lack detail or development. Level 1 (1–2) Response describes social indices of inequality. Knowledge is basic and understanding may be inaccurate. Examples are in name only or lacking entirely. Level 0 (0) No creditable response.
Q11 · Assess the extent to which global inequalities in social and economic well-being are…
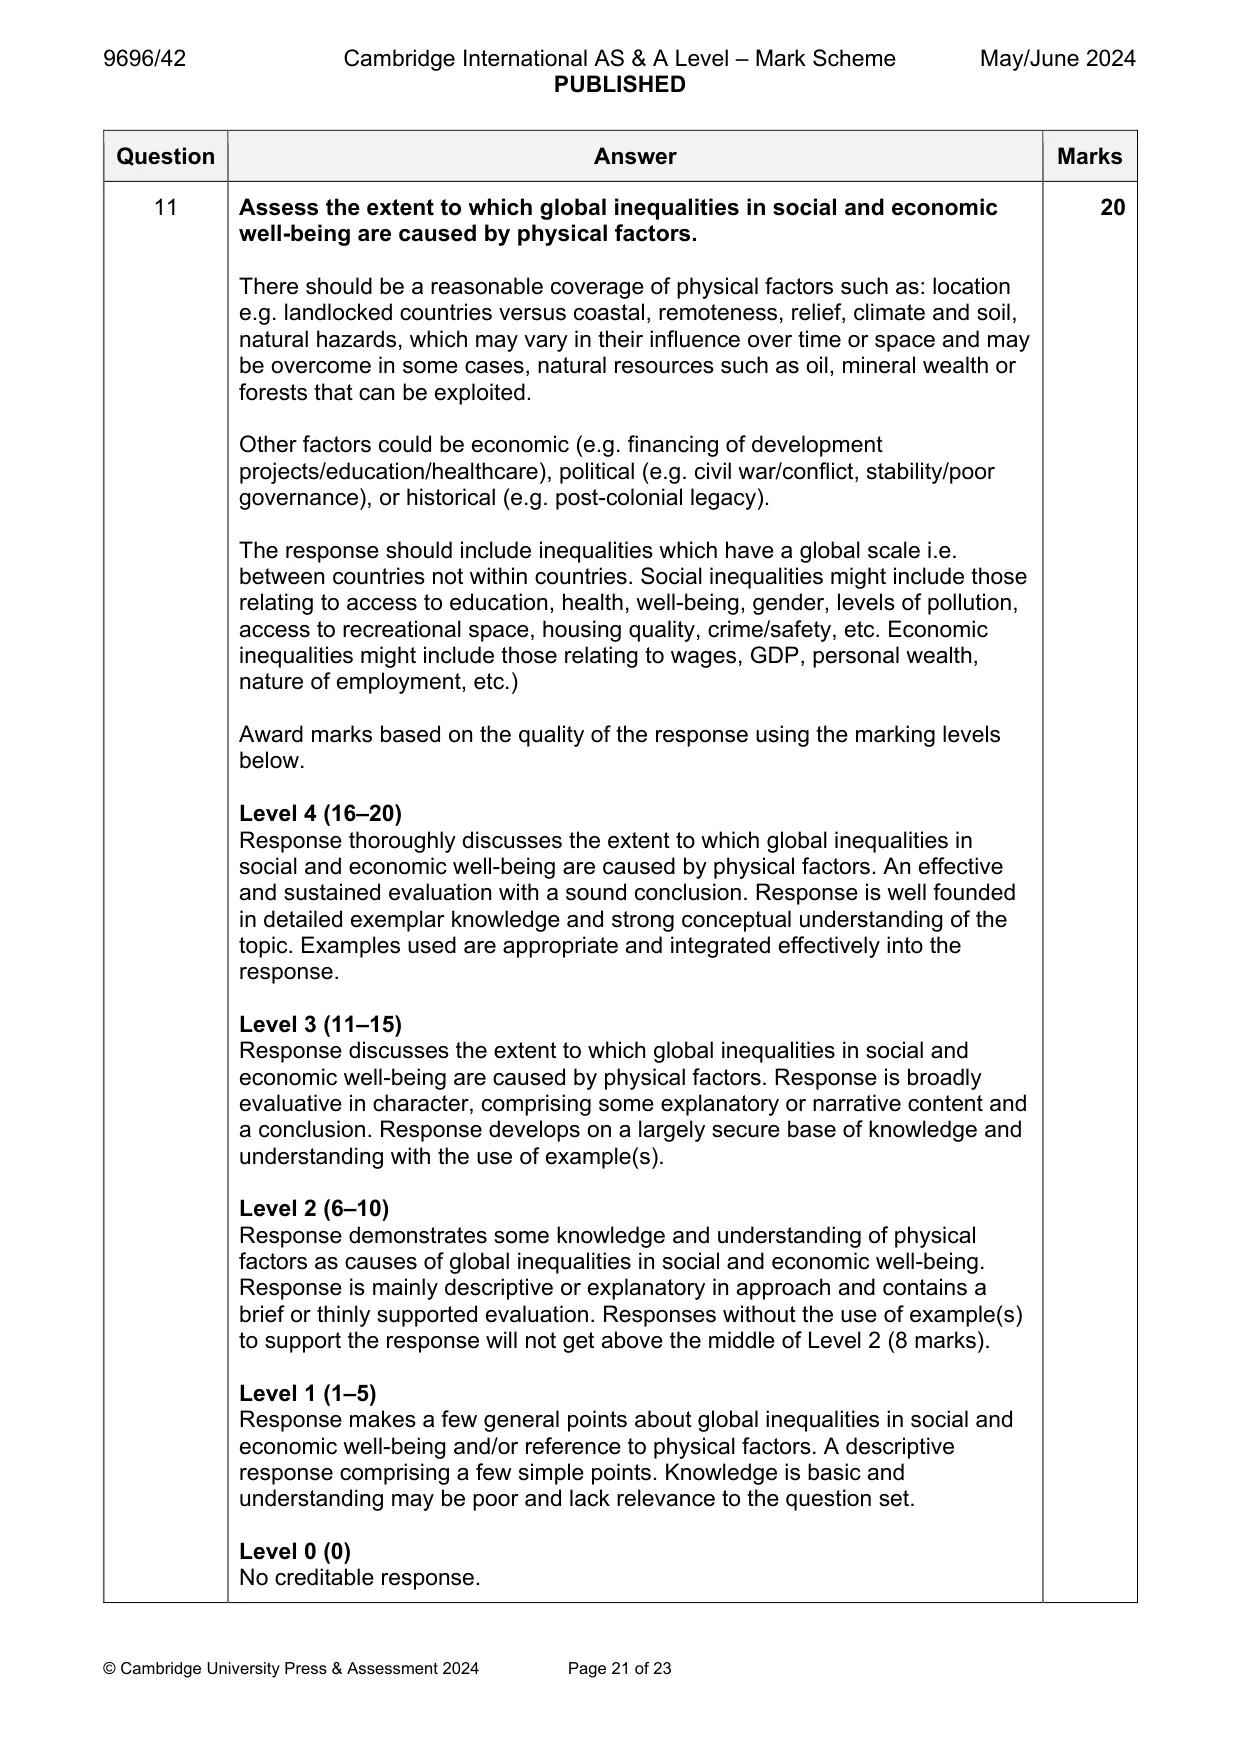
11 Assess the extent to which global inequalities in social and economic well-being are caused by physical factors. [20]
Mark scheme: 11 Assess the extent to which global inequalities in social and economic 20 well-being are caused by physical factors. There should be a reasonable coverage of physical factors such as: location e.g. landlocked countries versus coastal, remoteness, relief, climate and soil, natural hazards, which may vary in their influence over time or space and may be overcome in some cases, natural resources such as oil, mineral wealth or forests that can be exploited. Other factors could be economic (e.g. financing of development projects/education/healthcare), political (e.g. civil war/conflict, stability/poor governance), or historical (e.g. post-colonial legacy). The response should include inequalities which have a global scale i.e. between countries not within countries. Social inequalities might include those relating to access to education, health, well-being, gender, levels of pollution, access to recreational space, housing quality, crime/safety, etc. Economic inequalities might include those relating to wages, GDP, personal wealth, nature of employment, etc.) Award marks based on the quality of the response using the marking levels below. Level 4 (16–20) Response thoroughly discusses the extent to which global inequalities in social and economic well-being are caused by physical factors. An effective and sustained evaluation with a sound conclusion. Response is well founded in detailed exemplar knowledge and strong conceptual understanding of the topic. Examples used are appropriate and integrated effectively into the response. Level 3 (11–15) Response discusses the extent to which global inequalities in social and economic well-being are caused by physical factors. Response is broadly evaluative in character, comprising some explanatory or narrative content and a conclusion. Response develops on a largely secure base of knowledge and understanding with the use of example(s). Level 2 (6–10) Response demonstrates some knowledge and understanding of physical factors as causes of global inequalities in social and economic well-being. Response is mainly descriptive or explanatory in approach and contains a brief or thinly supported evaluation. Responses without the use of example(s) to support the response will not get above the middle of Level 2 (8 marks). Level 1 (1–5) Response makes a few general points about global inequalities in social and economic well-being and/or reference to physical factors. A descriptive response comprising a few simple points. Knowledge is basic and understanding may be poor and lack relevance to the question set. Level 0 (0) No creditable response.
What was in this paper
The subtopics covered by these 11 questions, and how many questions each got. Open one in a new tab to see every Cambridge question on it.
2Agricultural systems and food production1International debt and international aid1Manufacturing and related service industry1Population–resource relationships1The management of a degraded environment1The management of a tourist destination1The management of change in manufacturing industry1The management of energy supply1Trade flows and trading patterns1What you needed in this session
Cambridge’s own grade thresholds for 2024 May/June, Paper 4 · Variant 2. A higher threshold means an easier paper — the bar moves with how the cohort did.