Cambridge A Level Geography 9696 — 2020 May/June Paper 4 · Variant 2
9696/42/M/J/20 · 12 questions · 200 marks · ≈225 min
The question paper and its mark scheme, free to read here and free to download. This is Cambridge’s own paper, exactly as it was sat.
Question paper4 pages


Mark scheme26 pages
Answers below. Sit the paper first if you are practising.



Questions as text
Q1 · The global food price index (FPI), 1980–2017
1 Fig. 1.1 shows the global food price index (FPI), 1980–2017. (a) Describe the trends in the global FPI shown in Fig. 1.1. [4] (b) Suggest reasons why food prices change over time. [6]
Mark scheme: Question Answer Marks 1(a) Fig. 1.1 shows the global food price index (FPI), 1980–2017. 4 Describe the trends in the global FPI shown in Fig. 1.1. Statements such as the following, supported with data at least twice, will score full marks: overall there is an increase in FPI (1), with periods of decrease/fluctuation such as 1980–1984 (1); from 1980–2002, overall there is a slight decrease with some periods of increase peaking at 130 in 1996 (1); from 2000–17 there is a sharper increase to a peak in 2011 (1); at the end of the period there is a decrease from 2011–14 (1), with a small increase in the final year (1). Other statements of trend may be valid. 1 mark for each valid point, with maximum 2 for no data. 1(b) Suggest reasons why food prices change over time. 6 Candidates should suggest reasons why food prices change over time. The answer does not need to be comprehensive but the reasons should cover both increases and decreases to gain full marks. Reasons may refer to supply and/or demand or to other valid factors. Avoid double crediting simple opposites. Suggestions may include: • increases in supply, e.g. capital investment, developments in transport to markets, irrigation, changes in land tenure, agricultural technology, benefits from intensification or extensification, positive weather conditions • decreases in supply, e.g. issues related to intensification or extensification, natural hazards, climate change, disease or insect damage to crops • increases in demand, e.g. population growth, rising incomes, changes in diet, biofuels • decreases in demand, e.g. economic slowdown in specific areas • broad factors, e.g. competition, energy price variations, world commodity markets • other Award marks based on the quality of explanation and breadth of the response using the marking levels below. Level 3 (5–6) Response has a range of valid suggestions why food prices change over time. Response is well founded in detailed knowledge and strong conceptual understanding of the topic. Any examples used are appropriate and integrated effectively into the response. Level 2 (3–4) Response offers one or more suggestions why food prices change over time but focuses on one aspect of change at the expense of the other. Response develops on a largely secure base of knowledge and understanding. Examples may lack detail or development. Level 1 (1–2) Response does not have a clear focus on why food prices change over time and/or the reasons are difficult to identify or insecure. Knowledge is basic and understanding may be inaccurate. Examples are in name only or lacking entirely. Level 0 (0) No creditable response.
Q2 · With reference to one country, assess the extent to which the difficulties of managing…
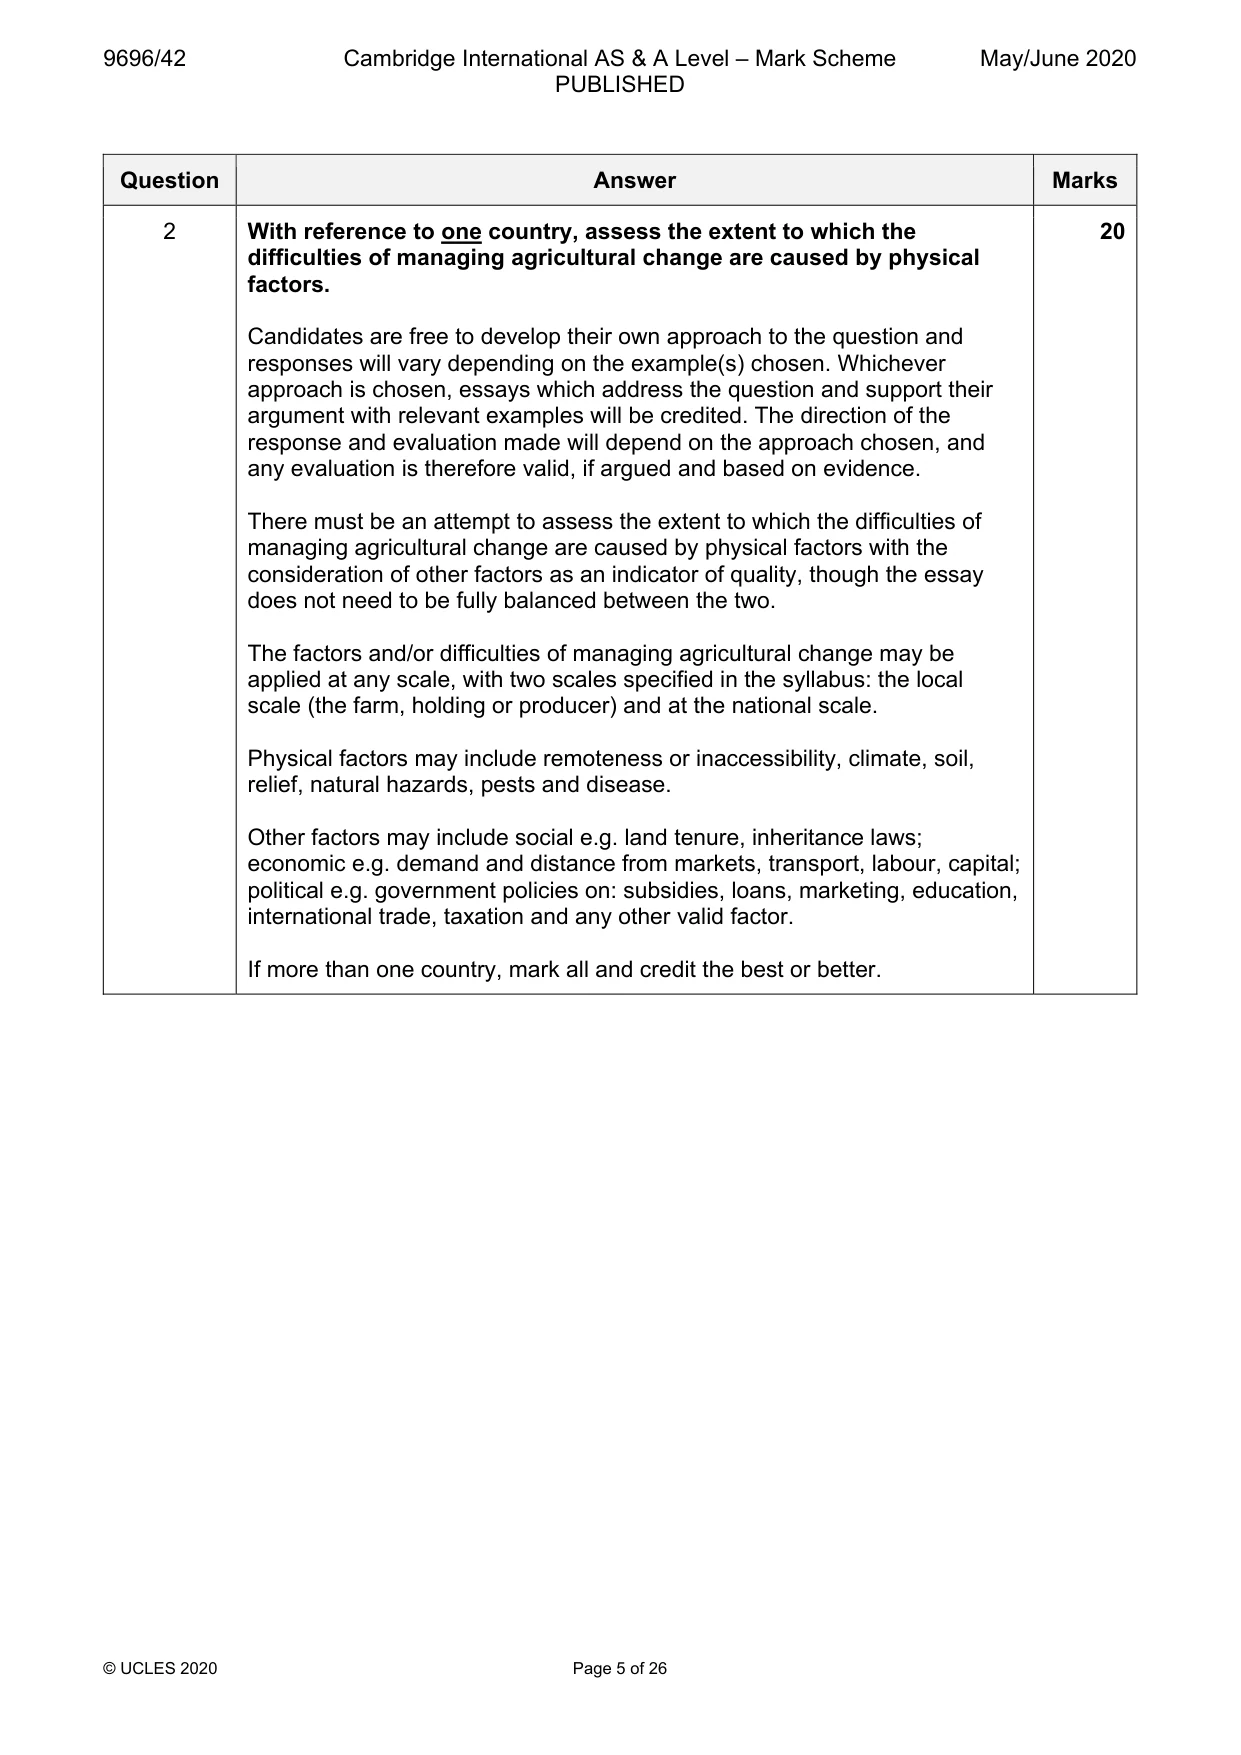
2 With reference to one country, assess the extent to which the difficulties of managing agricultural change are caused by physical factors. [20]
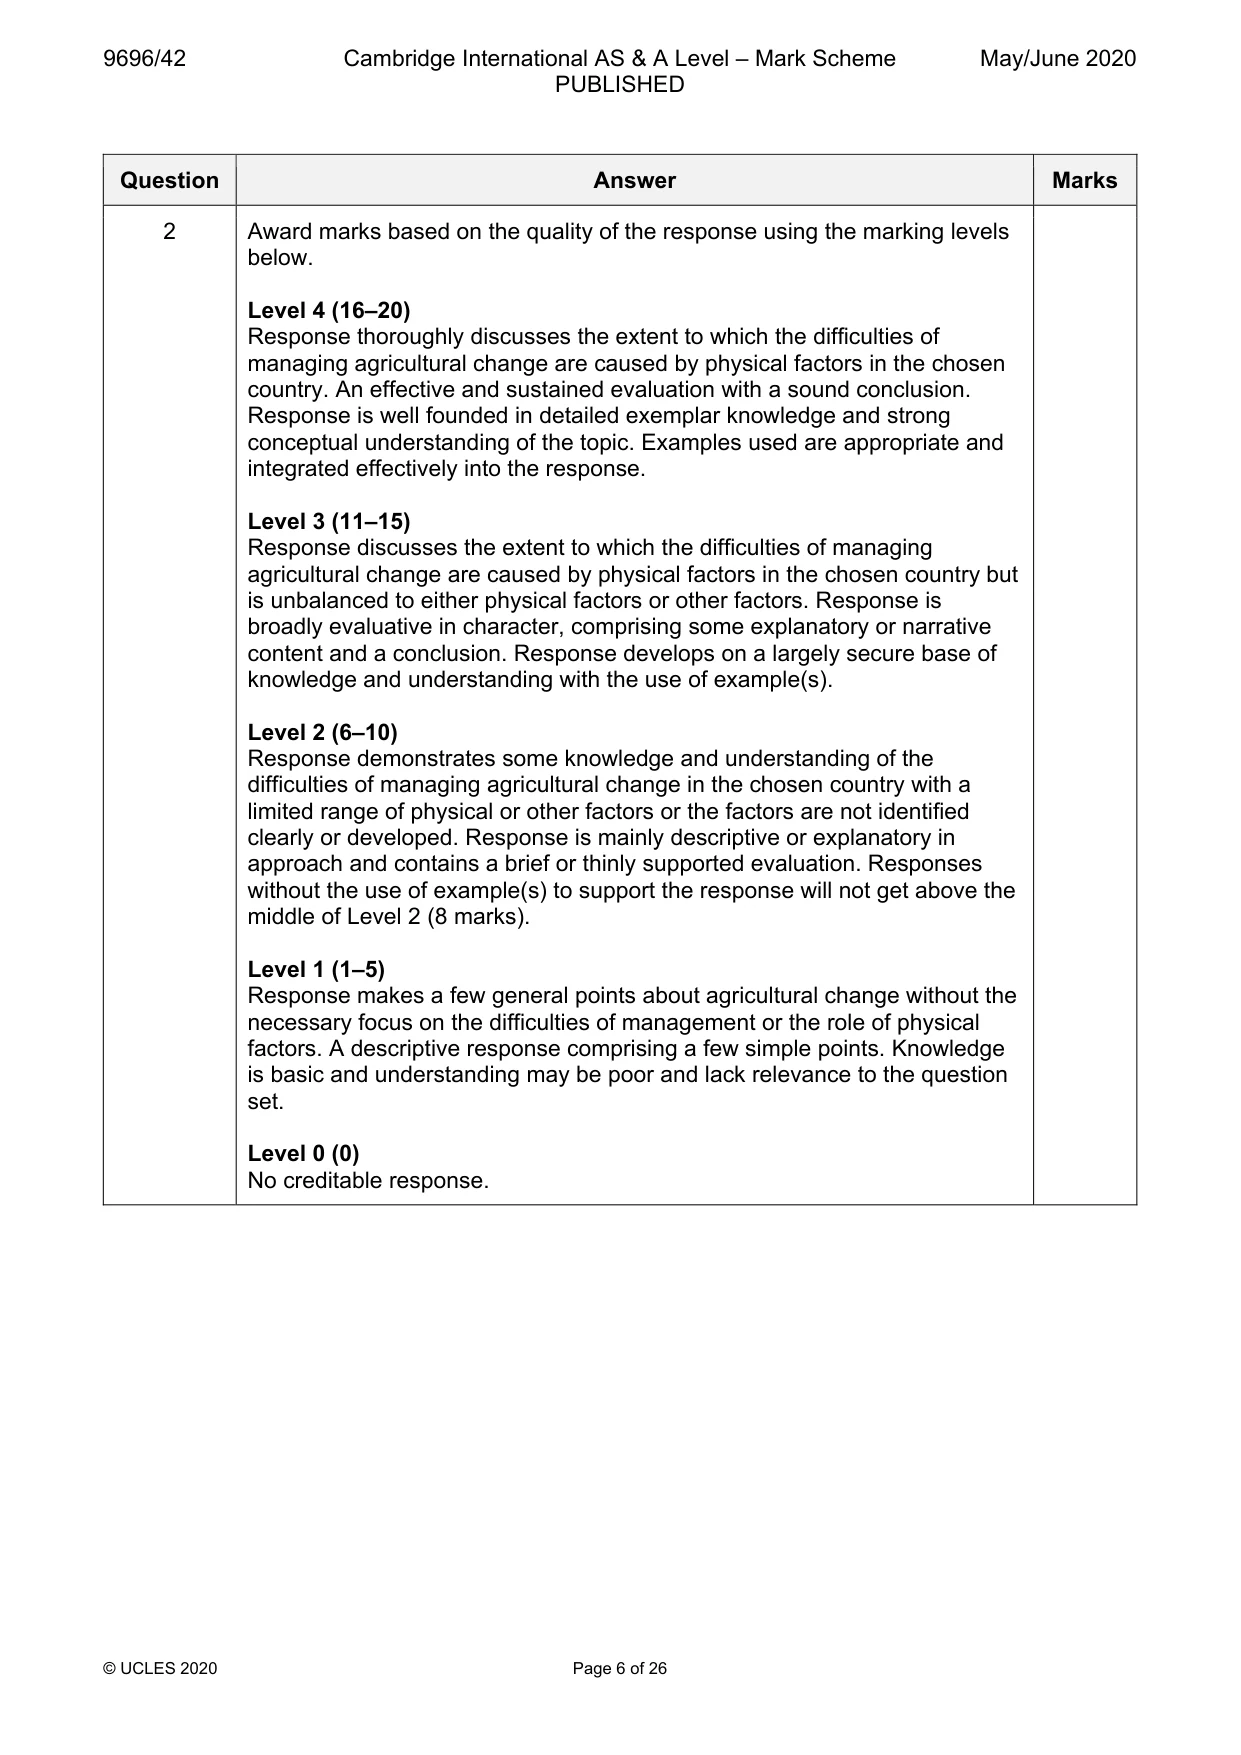
Mark scheme: 2 With reference to one country, assess the extent to which the 20 difficulties of managing agricultural change are caused by physical factors. Candidates are free to develop their own approach to the question and responses will vary depending on the example(s) chosen. Whichever approach is chosen, essays which address the question and support their argument with relevant examples will be credited. The direction of the response and evaluation made will depend on the approach chosen, and any evaluation is therefore valid, if argued and based on evidence. There must be an attempt to assess the extent to which the difficulties of managing agricultural change are caused by physical factors with the consideration of other factors as an indicator of quality, though the essay does not need to be fully balanced between the two. The factors and/or difficulties of managing agricultural change may be applied at any scale, with two scales specified in the syllabus: the local scale (the farm, holding or producer) and at the national scale. Physical factors may include remoteness or inaccessibility, climate, soil, relief, natural hazards, pests and disease. Other factors may include social e.g. land tenure, inheritance laws; economic e.g. demand and distance from markets, transport, labour, capital; political e.g. government policies on: subsidies, loans, marketing, education, international trade, taxation and any other valid factor. If more than one country, mark all and credit the best or better. 2 Award marks based on the quality of the response using the marking levels below. Level 4 (16–20) Response thoroughly discusses the extent to which the difficulties of managing agricultural change are caused by physical factors in the chosen country. An effective and sustained evaluation with a sound conclusion. Response is well founded in detailed exemplar knowledge and strong conceptual understanding of the topic. Examples used are appropriate and integrated effectively into the response. Level 3 (11–15) Response discusses the extent to which the difficulties of managing agricultural change are caused by physical factors in the chosen country but is unbalanced to either physical factors or other factors. Response is broadly evaluative in character, comprising some explanatory or narrative content and a conclusion. Response develops on a largely secure base of knowledge and understanding with the use of example(s). Level 2 (6–10) Response demonstrates some knowledge and understanding of the difficulties of managing agricultural change in the chosen country with a limited range of physical or other factors or the factors are not identified clearly or developed. Response is mainly descriptive or explanatory in approach and contains a brief or thinly supported evaluation. Responses without the use of example(s) to support the response will not get above the middle of Level 2 (8 marks). Level 1 (1–5) Response makes a few general points about agricultural change without the necessary focus on the difficulties of management or the role of physical factors. A descriptive response comprising a few simple points. Knowledge is basic and understanding may be poor and lack relevance to the question set. Level 0 (0) No creditable response.
Q3 · With reference to one country’s industrial policy, assess the extent to which the…
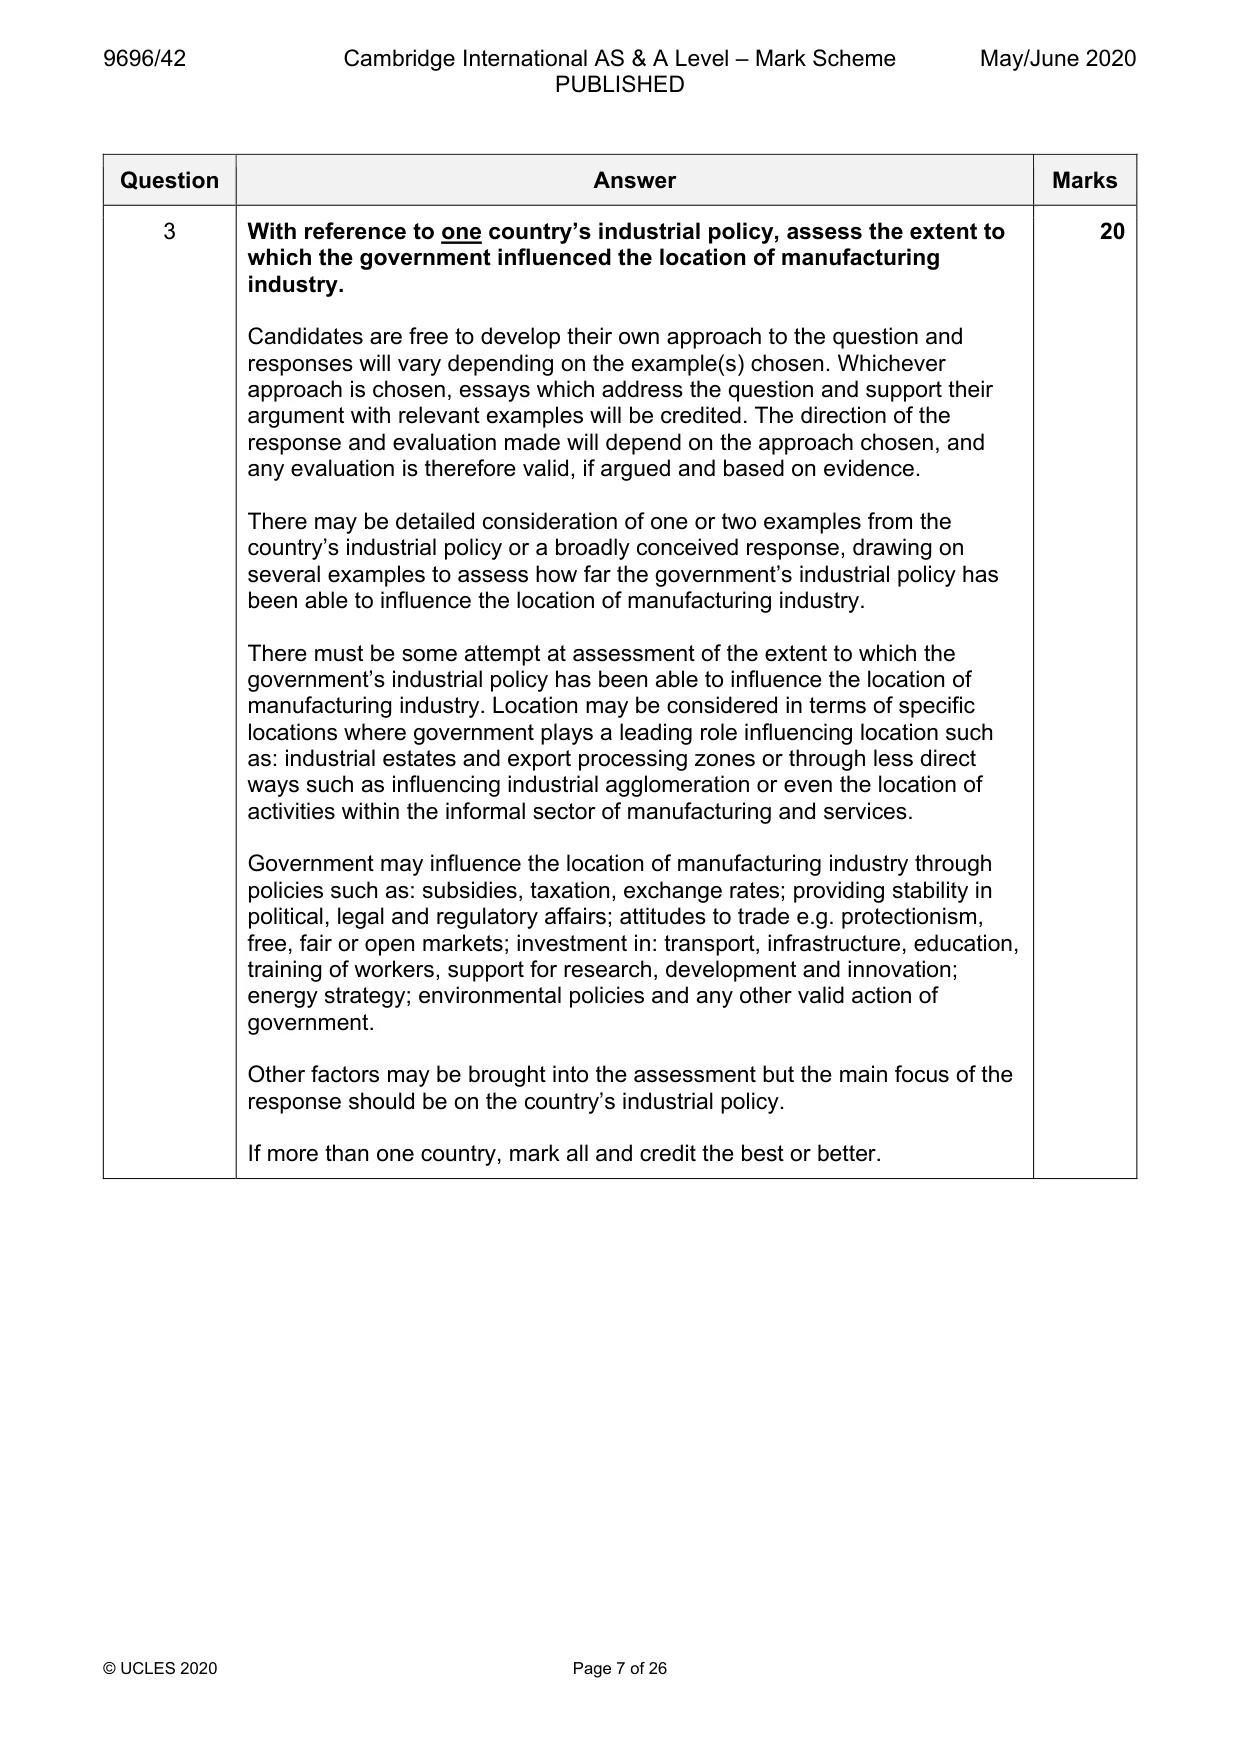
3 With reference to one country’s industrial policy, assess the extent to which the government influenced the location of manufacturing industry. [20] Environmental management If answering this option, answer Question 4 and either Question 5 or Question 6.
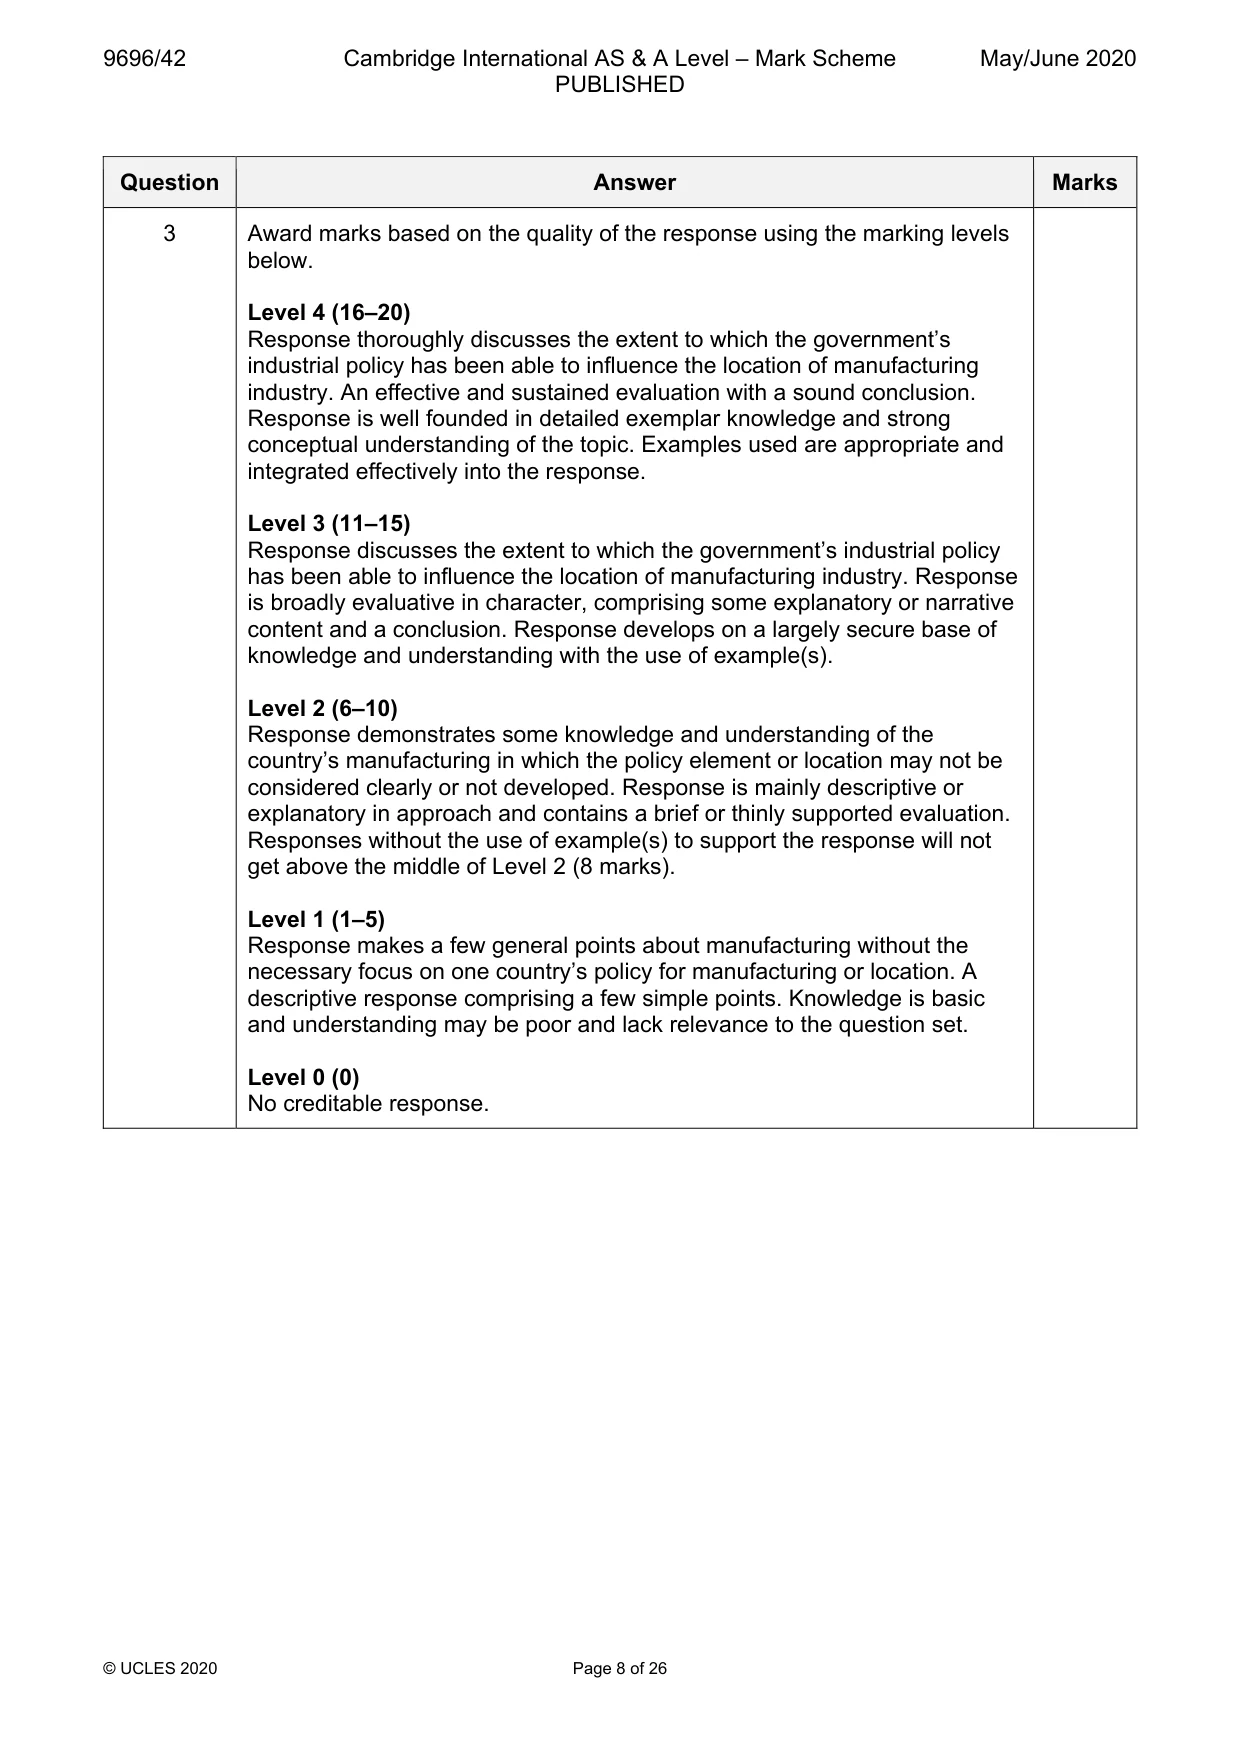
Mark scheme: 3 With reference to one country’s industrial policy, assess the extent to 20 which the government influenced the location of manufacturing industry. Candidates are free to develop their own approach to the question and responses will vary depending on the example(s) chosen. Whichever approach is chosen, essays which address the question and support their argument with relevant examples will be credited. The direction of the response and evaluation made will depend on the approach chosen, and any evaluation is therefore valid, if argued and based on evidence. There may be detailed consideration of one or two examples from the country’s industrial policy or a broadly conceived response, drawing on several examples to assess how far the government’s industrial policy has been able to influence the location of manufacturing industry. There must be some attempt at assessment of the extent to which the government’s industrial policy has been able to influence the location of manufacturing industry. Location may be considered in terms of specific locations where government plays a leading role influencing location such as: industrial estates and export processing zones or through less direct ways such as influencing industrial agglomeration or even the location of activities within the informal sector of manufacturing and services. Government may influence the location of manufacturing industry through policies such as: subsidies, taxation, exchange rates; providing stability in political, legal and regulatory affairs; attitudes to trade e.g. protectionism, free, fair or open markets; investment in: transport, infrastructure, education, training of workers, support for research, development and innovation; energy strategy; environmental policies and any other valid action of government. Other factors may be brought into the assessment but the main focus of the response should be on the country’s industrial policy. If more than one country, mark all and credit the best or better. Question Answer Marks 3 Award marks based on the quality of the response using the marking levels below. Level 4 (16–20) Response thoroughly discusses the extent to which the government’s industrial policy has been able to influence the location of manufacturing industry. An effective and sustained evaluation with a sound conclusion. Response is well founded in detailed exemplar knowledge and strong conceptual understanding of the topic. Examples used are appropriate and integrated effectively into the response. Level 3 (11–15) Response discusses the extent to which the government’s industrial policy has been able to influence the location of manufacturing industry. Response is broadly evaluative in character, comprising some explanatory or narrative content and a conclusion. Response develops on a largely secure base of knowledge and understanding with the use of example(s). Level 2 (6–10) Response demonstrates some knowledge and understanding of the country’s manufacturing in which the policy element or location may not be considered clearly or not developed. Response is mainly descriptive or explanatory in approach and contains a brief or thinly supported evaluation. Responses without the use of example(s) to support the response will not get above the middle of Level 2 (8 marks). Level 1 (1–5) Response makes a few general points about manufacturing without the necessary focus on one country’s policy for manufacturing or location. A descriptive response comprising a few simple points. Knowledge is basic and understanding may be poor and lack relevance to the question set. Level 0 (0) No creditable response. Environmental management If answering this option, answer Question 4 and either Question 5 or Question 6.
Q4 · A diagram of steel manufacturing
4 Fig. 4.1 shows a diagram of steel manufacturing. (a) Use Fig. 4.1 to describe how steel can be considered a sustainable product. [4] (b) Explain how recycling waste materials reduces environmental degradation. [6]
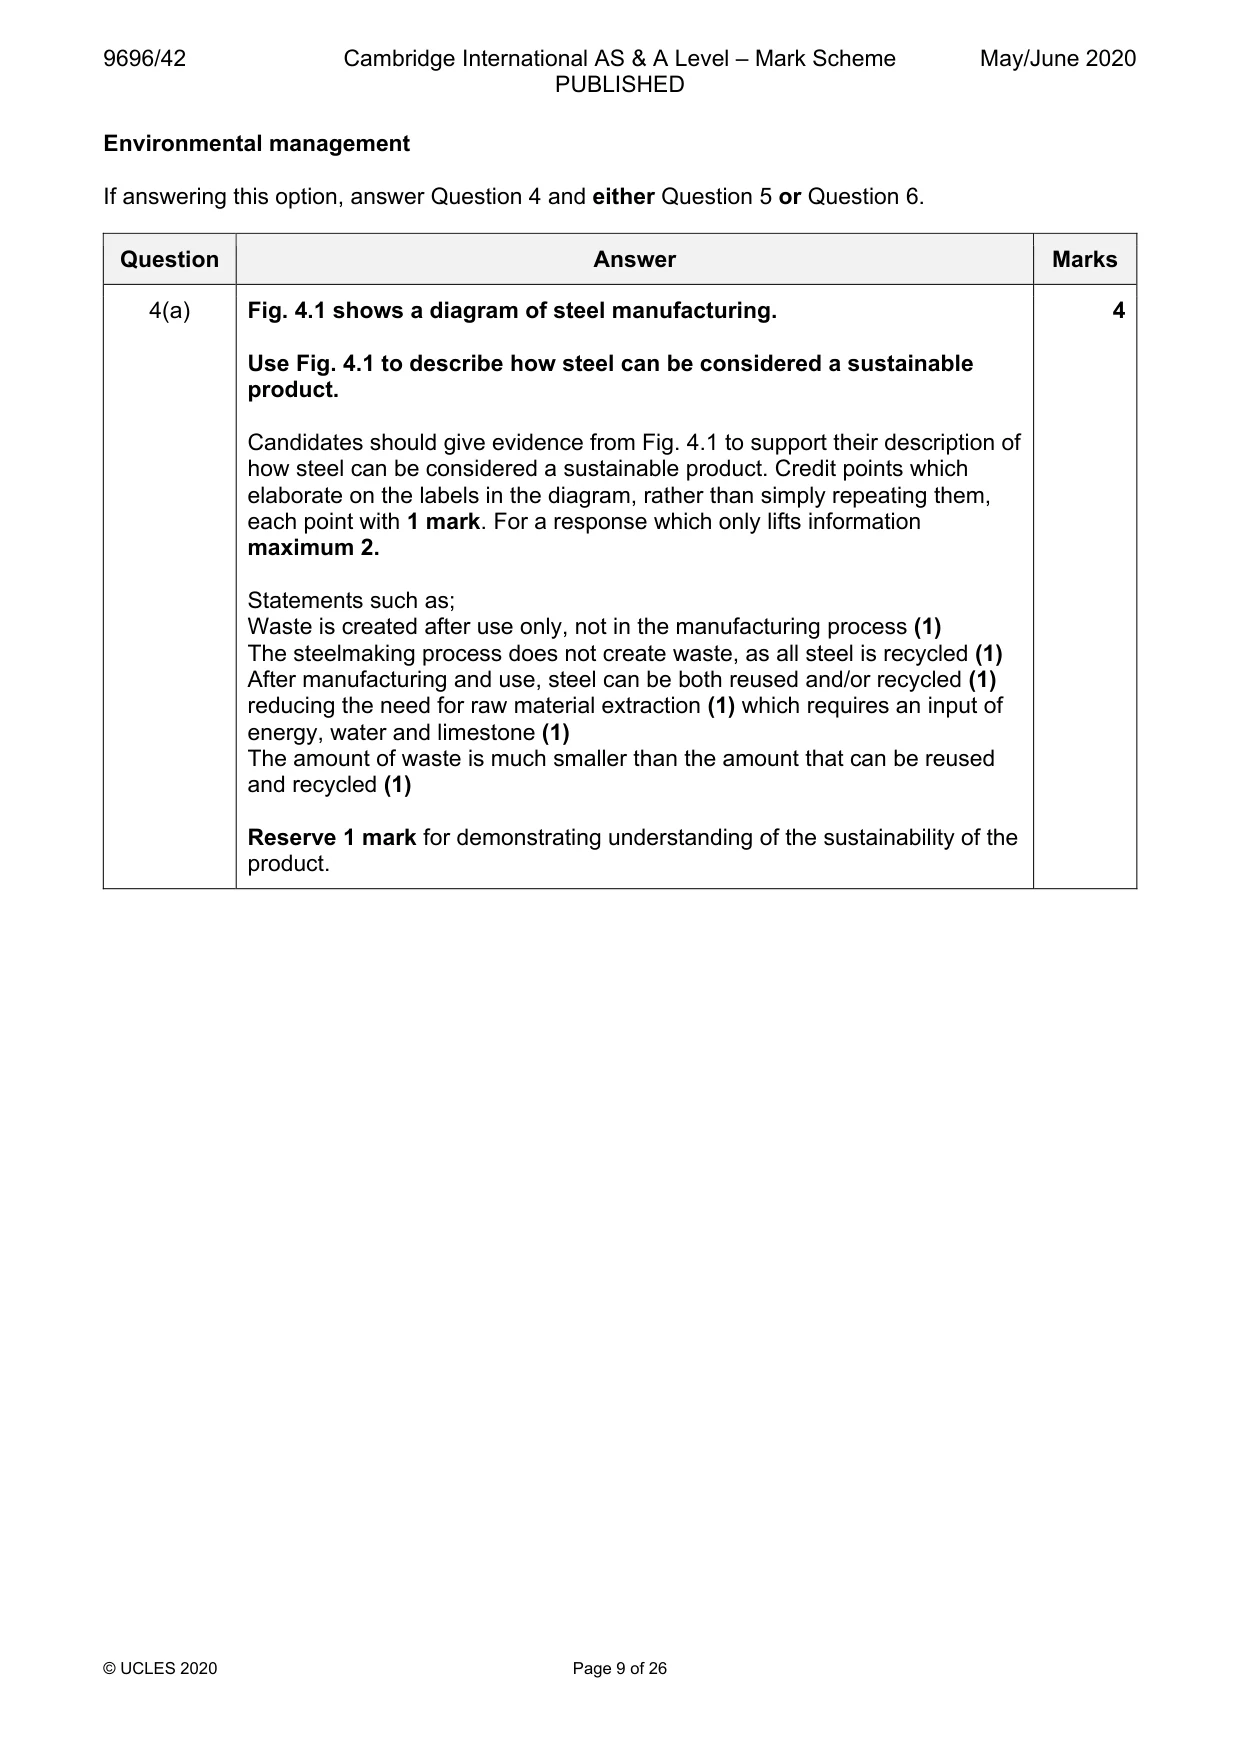
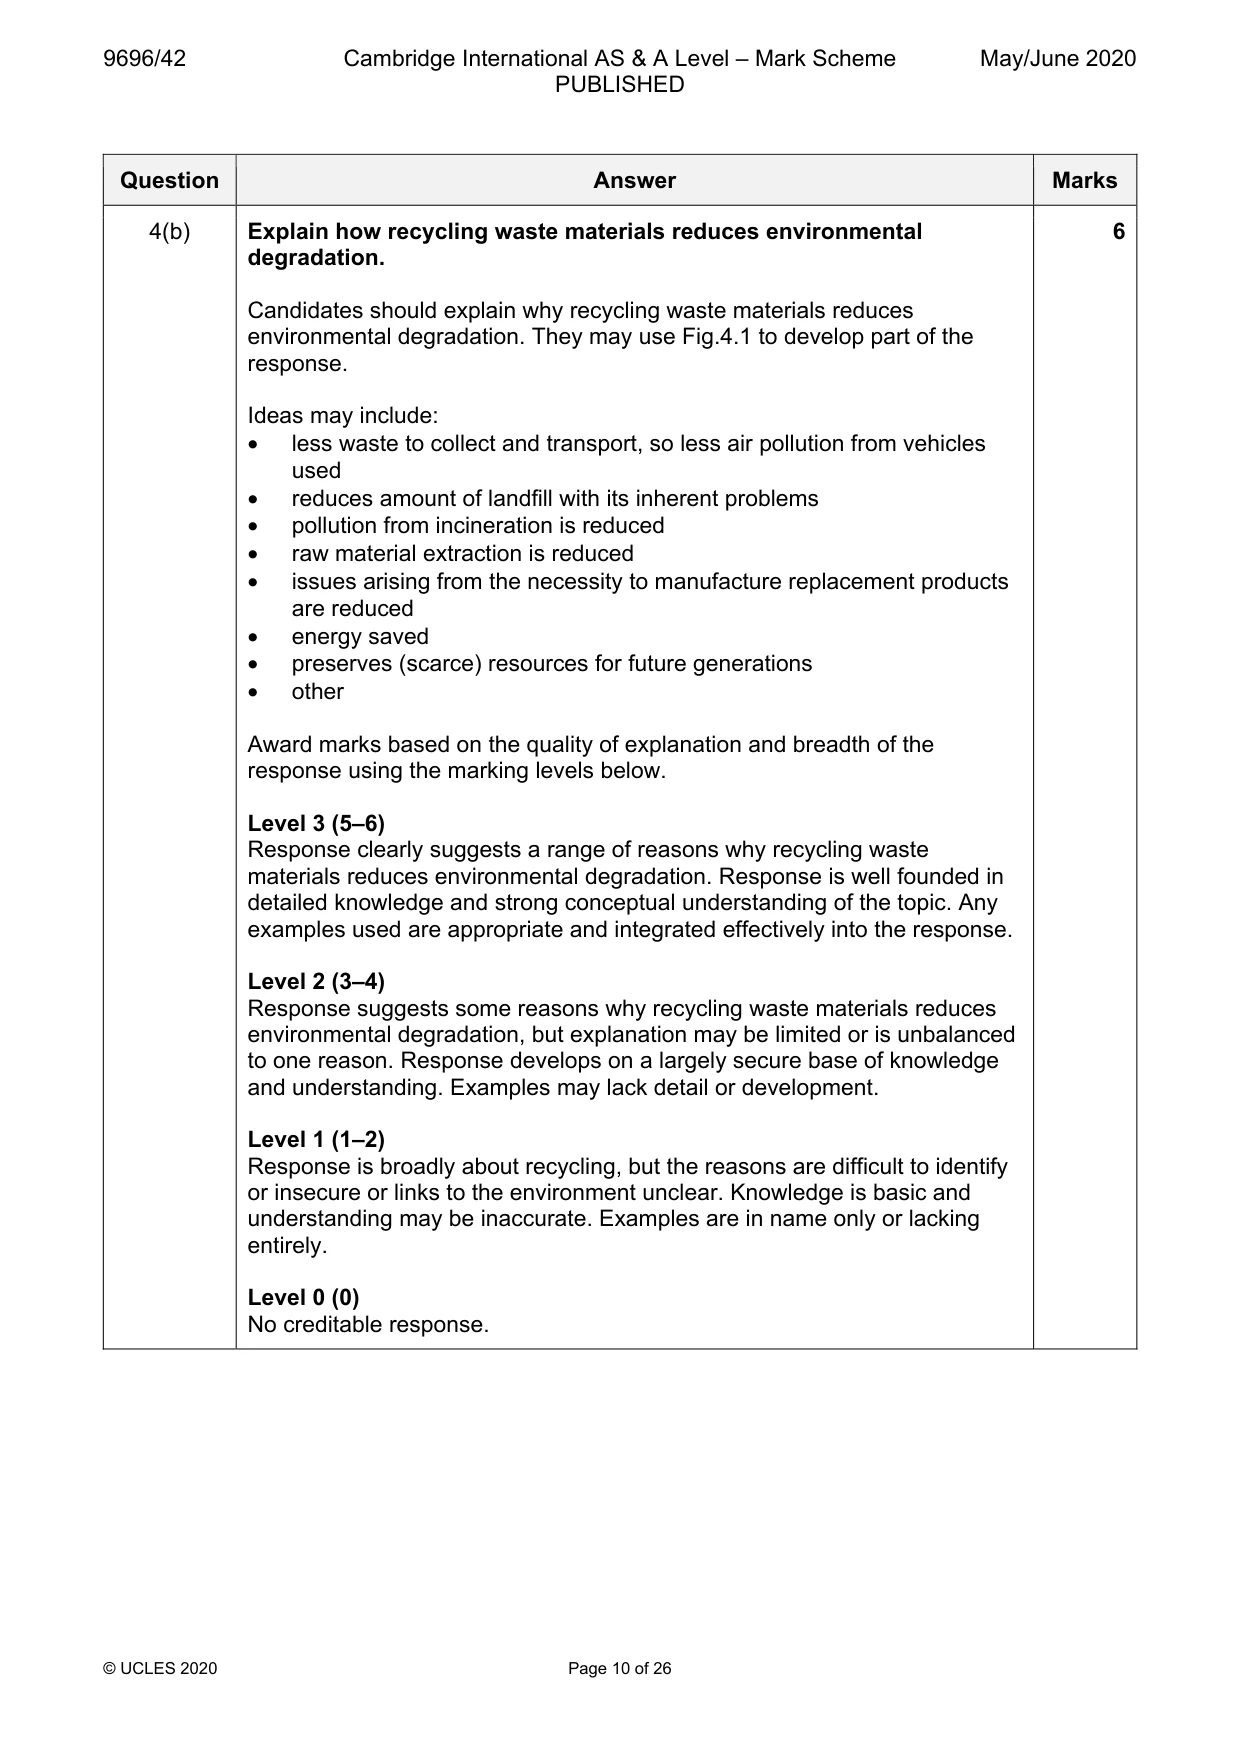
Mark scheme: 4(a) Fig. 4.1 shows a diagram of steel manufacturing. 4 Use Fig. 4.1 to describe how steel can be considered a sustainable product. Candidates should give evidence from Fig. 4.1 to support their description of how steel can be considered a sustainable product. Credit points which elaborate on the labels in the diagram, rather than simply repeating them, each point with 1 mark. For a response which only lifts information maximum 2. Statements such as; Waste is created after use only, not in the manufacturing process (1) The steelmaking process does not create waste, as all steel is recycled (1) After manufacturing and use, steel can be both reused and/or recycled (1) reducing the need for raw material extraction (1) which requires an input of energy, water and limestone (1) The amount of waste is much smaller than the amount that can be reused and recycled (1) Reserve 1 mark for demonstrating understanding of the sustainability of the product. 4(b) Explain how recycling waste materials reduces environmental 6 degradation. Candidates should explain why recycling waste materials reduces environmental degradation. They may use Fig.4.1 to develop part of the response. Ideas may include: • less waste to collect and transport, so less air pollution from vehicles used • reduces amount of landfill with its inherent problems • pollution from incineration is reduced • raw material extraction is reduced • issues arising from the necessity to manufacture replacement products are reduced • energy saved • preserves (scarce) resources for future generations • other Award marks based on the quality of explanation and breadth of the response using the marking levels below. Level 3 (5–6) Response clearly suggests a range of reasons why recycling waste materials reduces environmental degradation. Response is well founded in detailed knowledge and strong conceptual understanding of the topic. Any examples used are appropriate and integrated effectively into the response. Level 2 (3–4) Response suggests some reasons why recycling waste materials reduces environmental degradation, but explanation may be limited or is unbalanced to one reason. Response develops on a largely secure base of knowledge and understanding. Examples may lack detail or development. Level 1 (1–2) Response is broadly about recycling, but the reasons are difficult to identify or insecure or links to the environment unclear. Knowledge is basic and understanding may be inaccurate. Examples are in name only or lacking entirely. Level 0 (0) No creditable response.
Q5 · ‘Resource endowment is the most important factor affecting the supply of energy at the…
5 ‘Resource endowment is the most important factor affecting the supply of energy at the national scale.’ With reference to one or more examples, how far do you agree with this statement? [20]
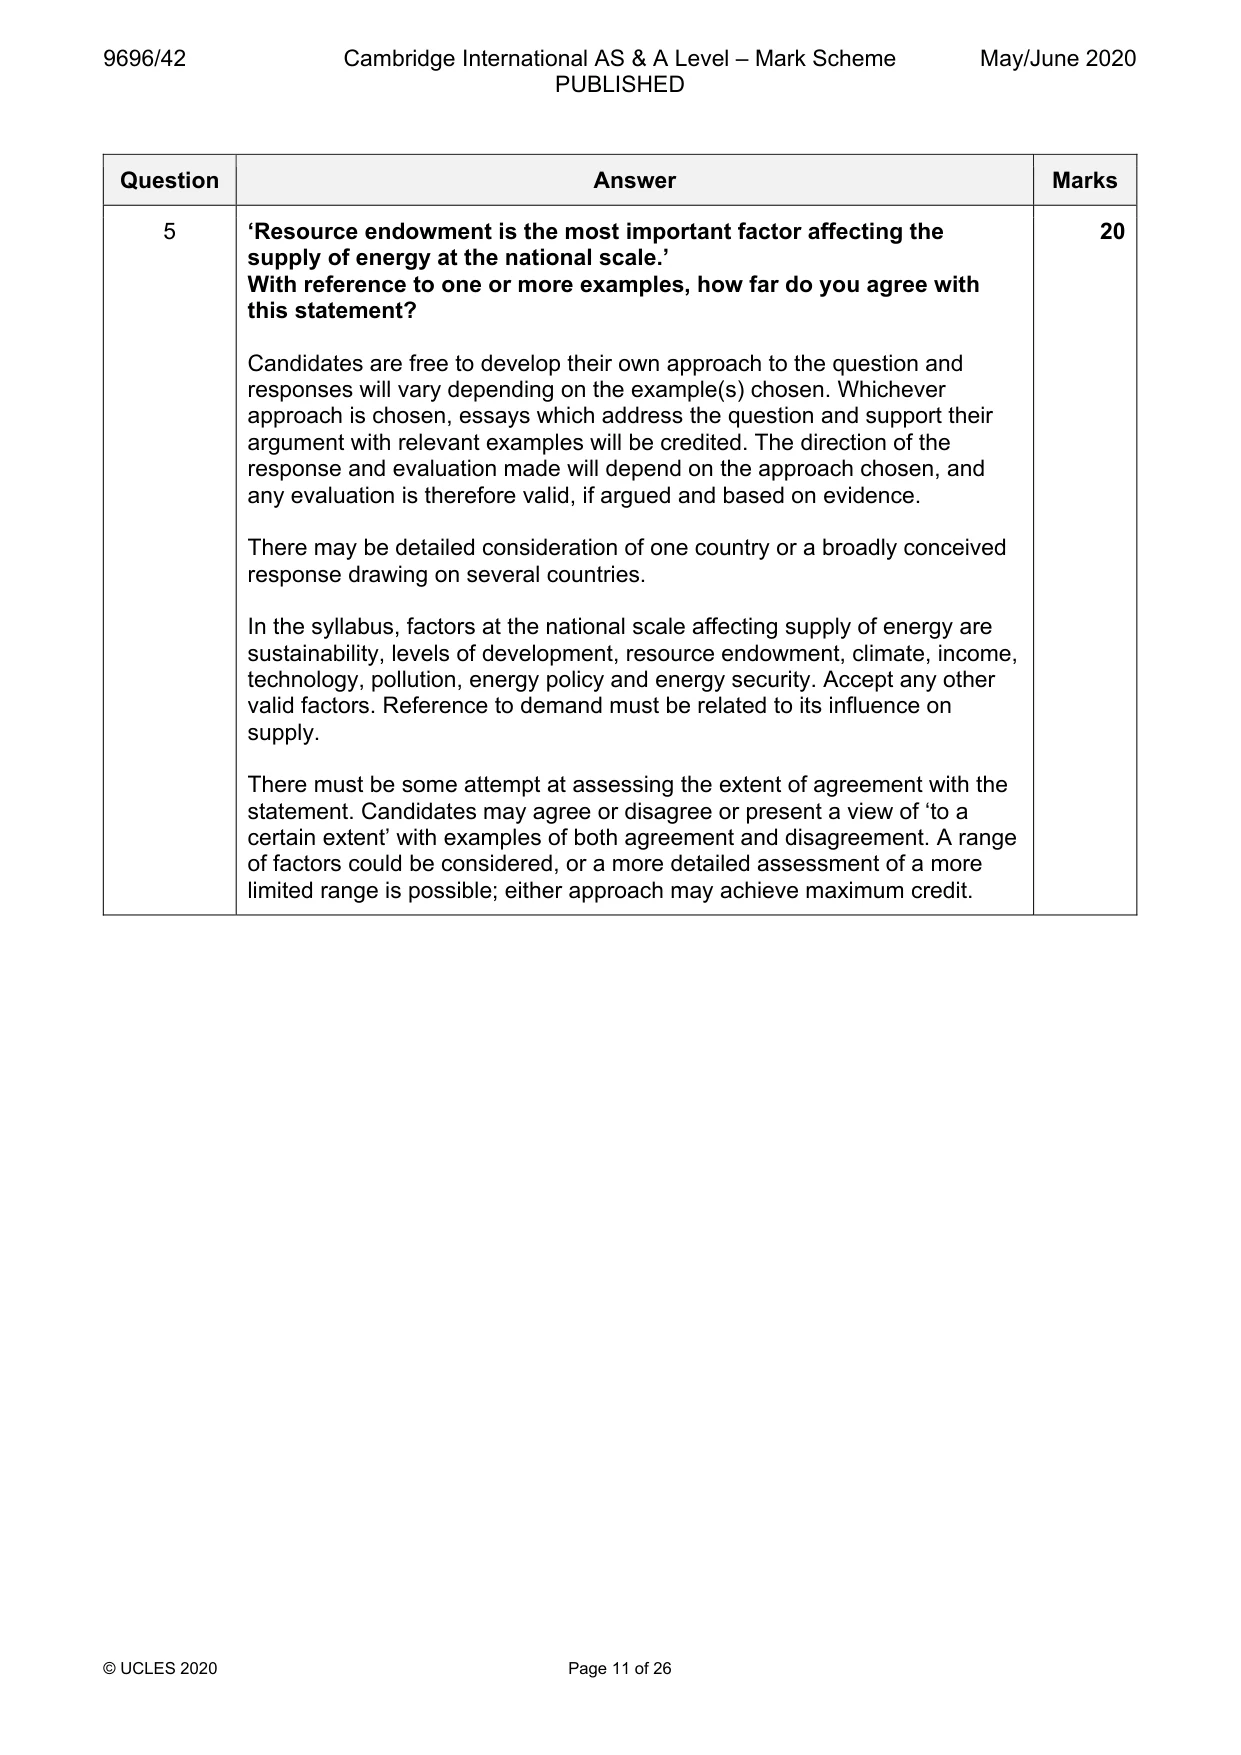
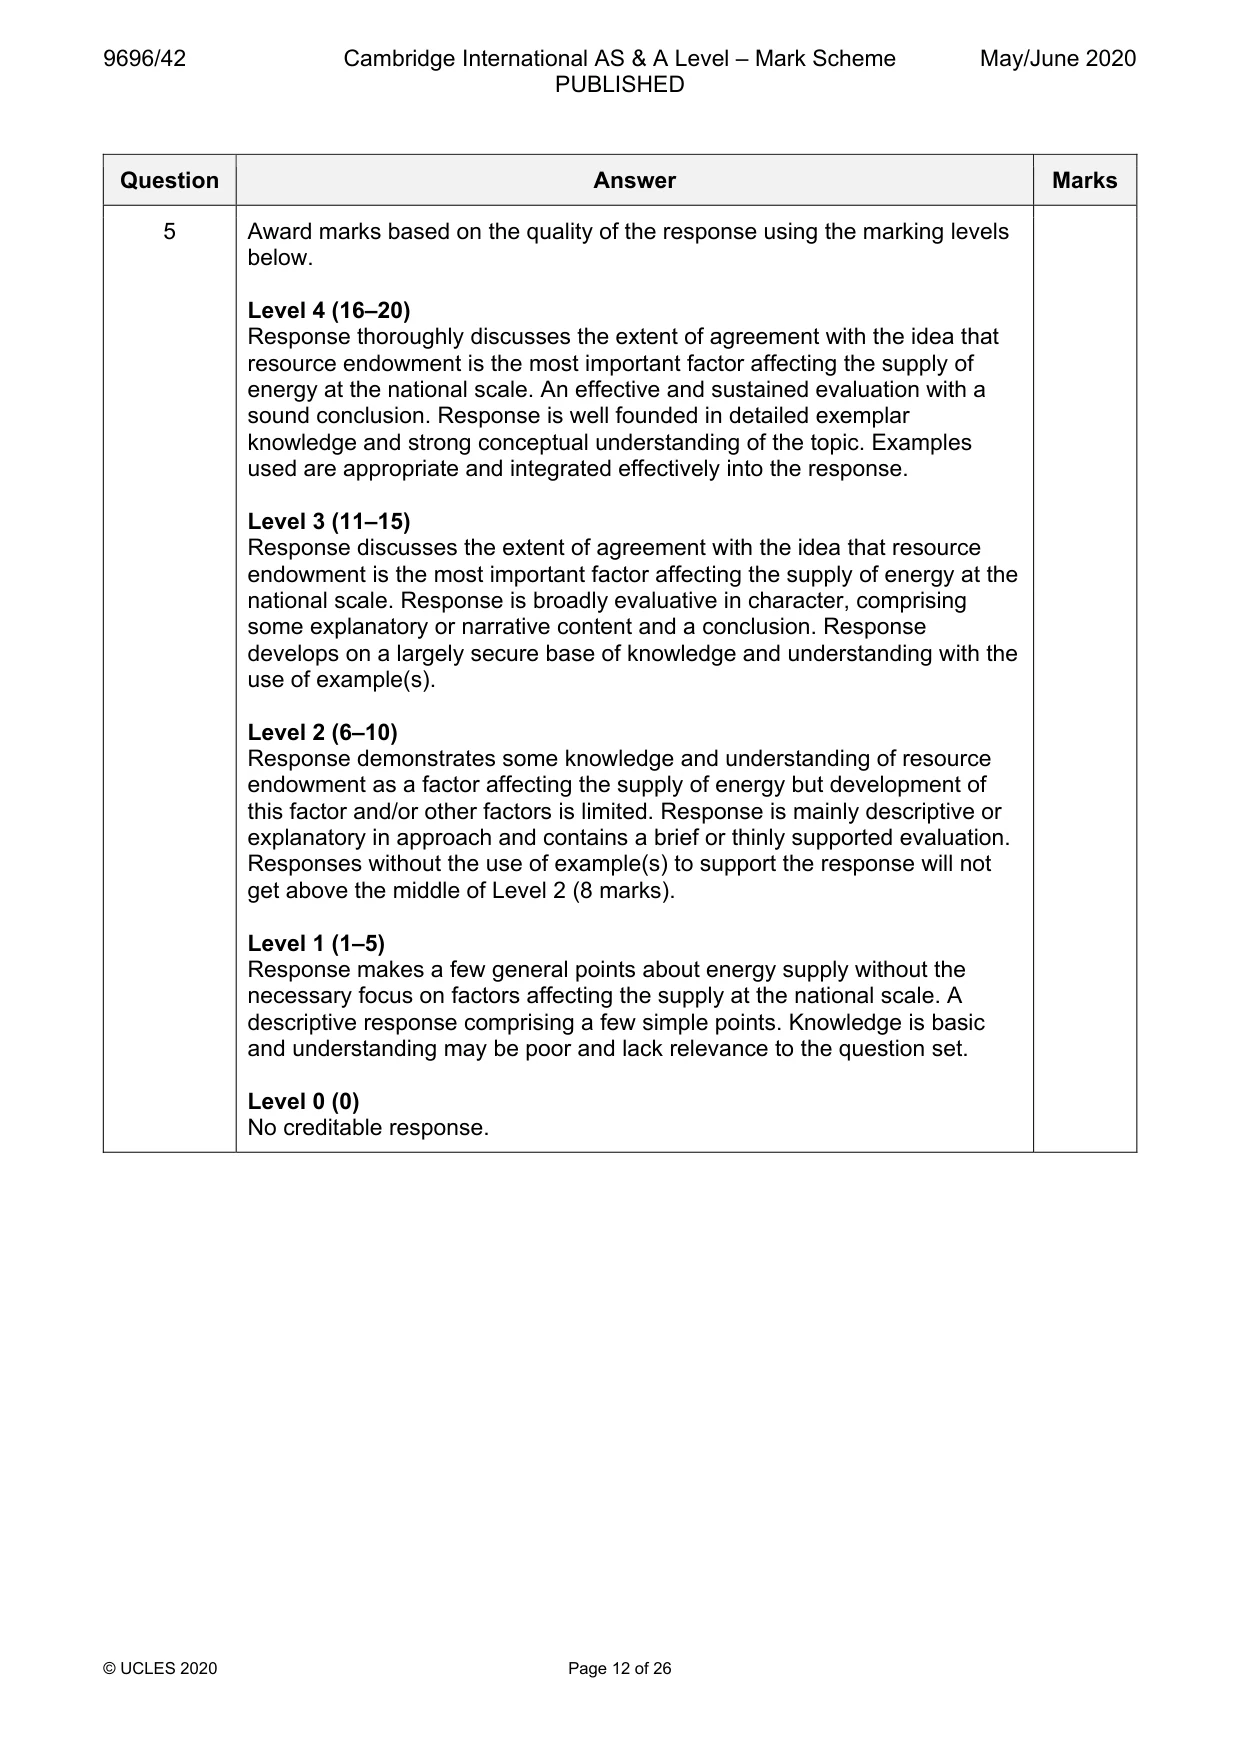
Mark scheme: 5 ‘Resource endowment is the most important factor affecting the 20 supply of energy at the national scale.’ With reference to one or more examples, how far do you agree with this statement? Candidates are free to develop their own approach to the question and responses will vary depending on the example(s) chosen. Whichever approach is chosen, essays which address the question and support their argument with relevant examples will be credited. The direction of the response and evaluation made will depend on the approach chosen, and any evaluation is therefore valid, if argued and based on evidence. There may be detailed consideration of one country or a broadly conceived response drawing on several countries. In the syllabus, factors at the national scale affecting supply of energy are sustainability, levels of development, resource endowment, climate, income, technology, pollution, energy policy and energy security. Accept any other valid factors. Reference to demand must be related to its influence on supply. There must be some attempt at assessing the extent of agreement with the statement. Candidates may agree or disagree or present a view of ‘to a certain extent’ with examples of both agreement and disagreement. A range of factors could be considered, or a more detailed assessment of a more limited range is possible; either approach may achieve maximum credit. 5 Award marks based on the quality of the response using the marking levels below. Level 4 (16–20) Response thoroughly discusses the extent of agreement with the idea that resource endowment is the most important factor affecting the supply of energy at the national scale. An effective and sustained evaluation with a sound conclusion. Response is well founded in detailed exemplar knowledge and strong conceptual understanding of the topic. Examples used are appropriate and integrated effectively into the response. Level 3 (11–15) Response discusses the extent of agreement with the idea that resource endowment is the most important factor affecting the supply of energy at the national scale. Response is broadly evaluative in character, comprising some explanatory or narrative content and a conclusion. Response develops on a largely secure base of knowledge and understanding with the use of example(s). Level 2 (6–10) Response demonstrates some knowledge and understanding of resource endowment as a factor affecting the supply of energy but development of this factor and/or other factors is limited. Response is mainly descriptive or explanatory in approach and contains a brief or thinly supported evaluation. Responses without the use of example(s) to support the response will not get above the middle of Level 2 (8 marks). Level 1 (1–5) Response makes a few general points about energy supply without the necessary focus on factors affecting the supply at the national scale. A descriptive response comprising a few simple points. Knowledge is basic and understanding may be poor and lack relevance to the question set. Level 0 (0) No creditable response.
Q6 · Global interdependence If answering this option, answer Question 7 and either Question 8…
Global interdependence If answering this option, answer Question 7 and either Question 8 or Question 9.
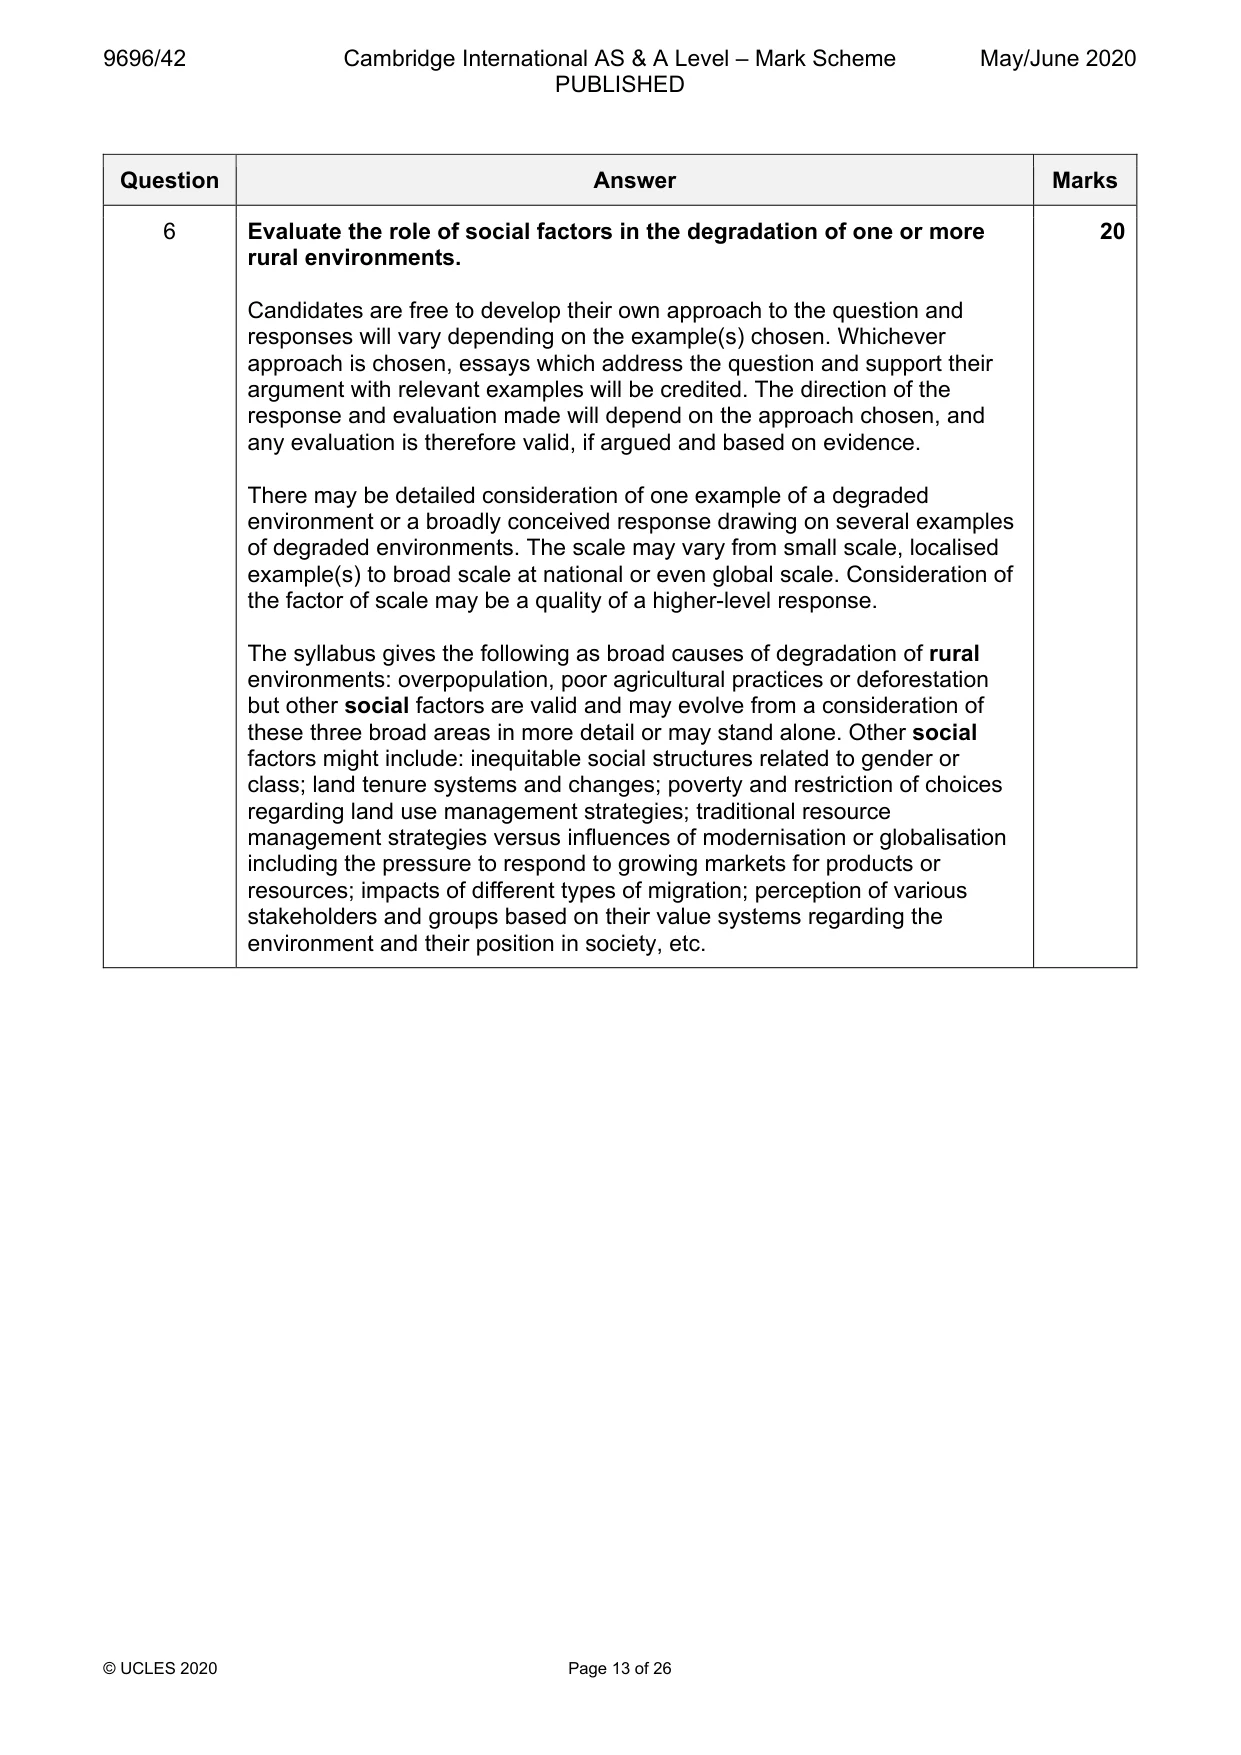
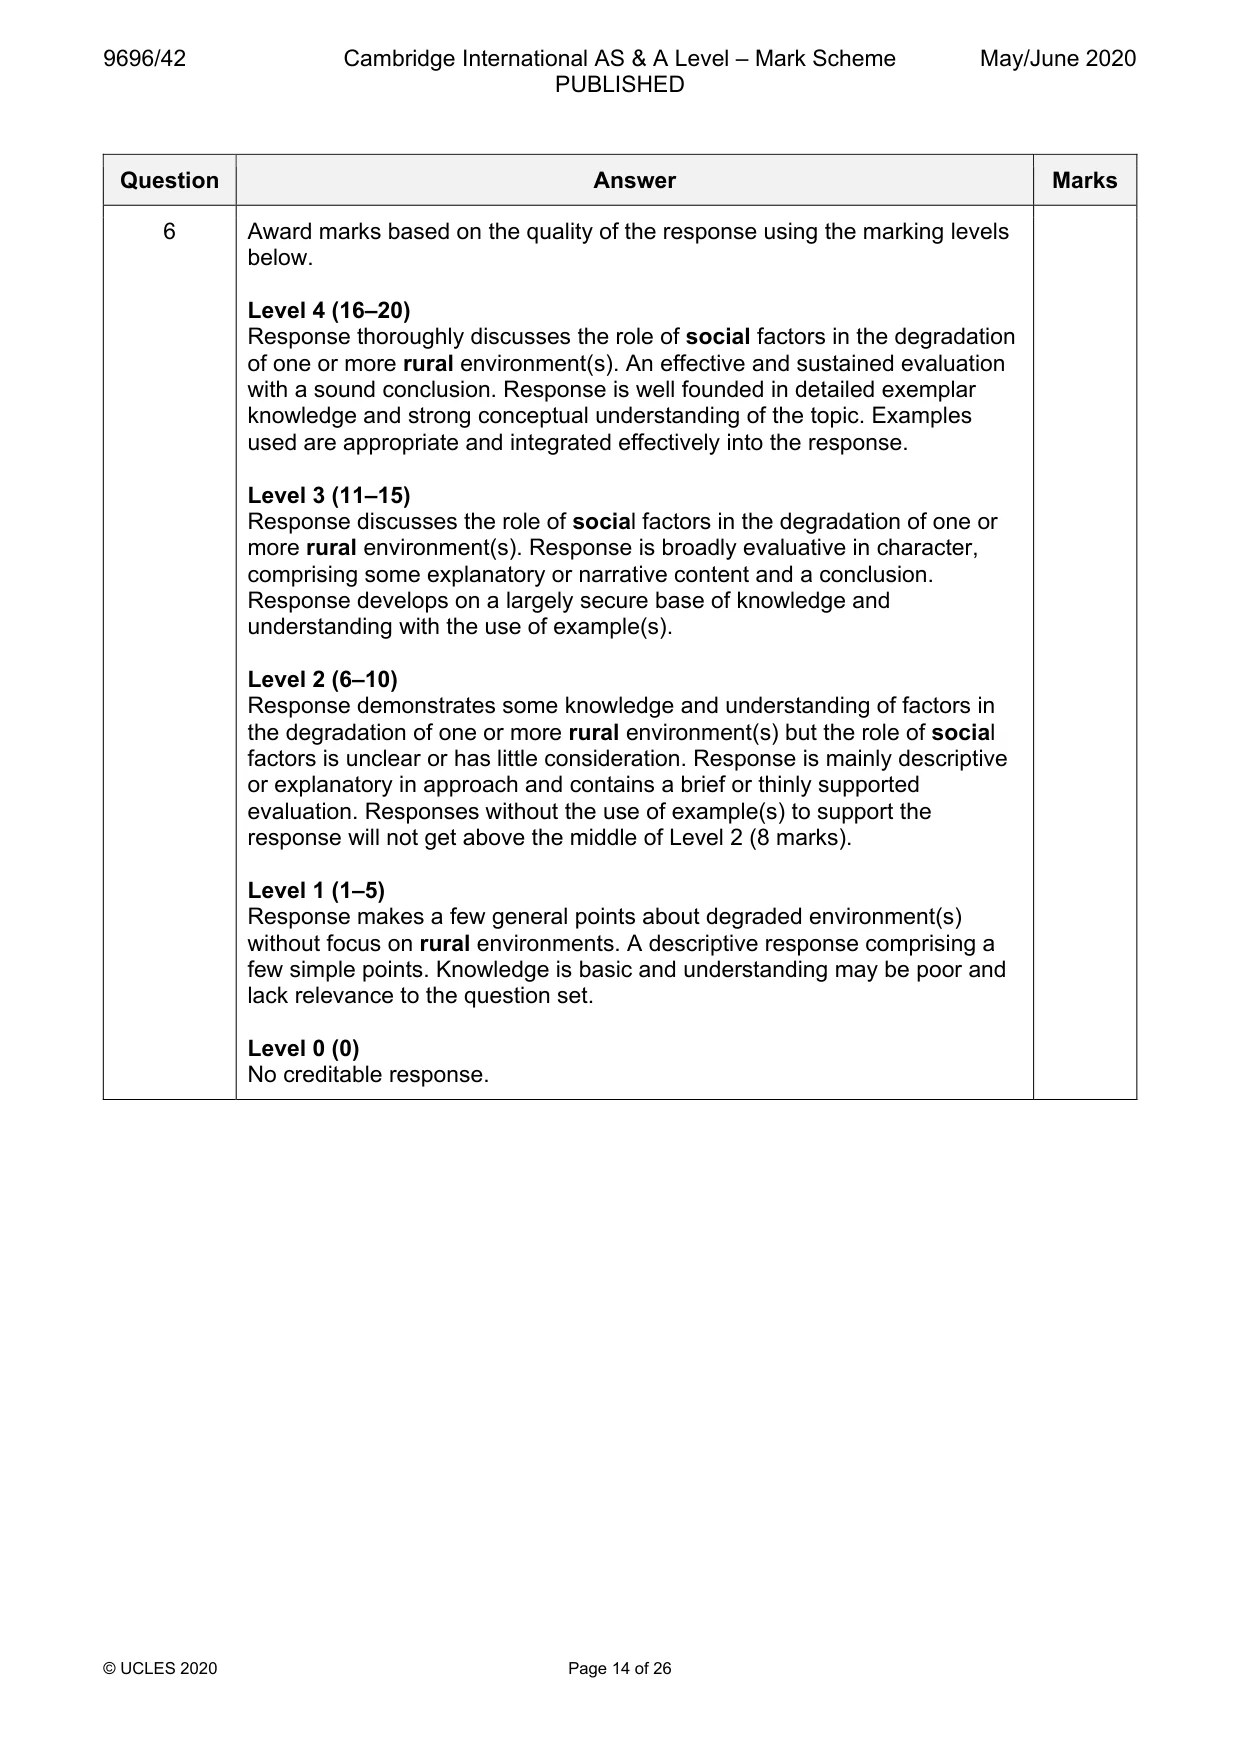
Mark scheme: 6 Evaluate the role of social factors in the degradation of one or more 20 rural environments. Candidates are free to develop their own approach to the question and responses will vary depending on the example(s) chosen. Whichever approach is chosen, essays which address the question and support their argument with relevant examples will be credited. The direction of the response and evaluation made will depend on the approach chosen, and any evaluation is therefore valid, if argued and based on evidence. There may be detailed consideration of one example of a degraded environment or a broadly conceived response drawing on several examples of degraded environments. The scale may vary from small scale, localised example(s) to broad scale at national or even global scale. Consideration of the factor of scale may be a quality of a higher-level response. The syllabus gives the following as broad causes of degradation of rural environments: overpopulation, poor agricultural practices or deforestation but other social factors are valid and may evolve from a consideration of these three broad areas in more detail or may stand alone. Other social factors might include: inequitable social structures related to gender or class; land tenure systems and changes; poverty and restriction of choices regarding land use management strategies; traditional resource management strategies versus influences of modernisation or globalisation including the pressure to respond to growing markets for products or resources; impacts of different types of migration; perception of various stakeholders and groups based on their value systems regarding the environment and their position in society, etc. 6 Award marks based on the quality of the response using the marking levels below. Level 4 (16–20) Response thoroughly discusses the role of social factors in the degradation of one or more rural environment(s). An effective and sustained evaluation with a sound conclusion. Response is well founded in detailed exemplar knowledge and strong conceptual understanding of the topic. Examples used are appropriate and integrated effectively into the response. Level 3 (11–15) Response discusses the role of social factors in the degradation of one or more rural environment(s). Response is broadly evaluative in character, comprising some explanatory or narrative content and a conclusion. Response develops on a largely secure base of knowledge and understanding with the use of example(s). Level 2 (6–10) Response demonstrates some knowledge and understanding of factors in the degradation of one or more rural environment(s) but the role of social factors is unclear or has little consideration. Response is mainly descriptive or explanatory in approach and contains a brief or thinly supported evaluation. Responses without the use of example(s) to support the response will not get above the middle of Level 2 (8 marks). Level 1 (1–5) Response makes a few general points about degraded environment(s) without focus on rural environments. A descriptive response comprising a few simple points. Knowledge is basic and understanding may be poor and lack relevance to the question set. Level 0 (0) No creditable response. Global interdependence If answering this option, answer Question 7 and either Question 8 or Question 9.
Q7 · A photograph which shows Pulau Messah, a tourist destination in Indonesia, an MIC in…
7 Fig. 7.1 is a photograph which shows Pulau Messah, a tourist destination in Indonesia, an MIC in Southeast Asia. (a) Using evidence from Fig. 7.1, suggest the negative impacts of tourism on the environments shown. [4] (b) Explain the ways that local people may benefit economically during the early stages of the life cycle model of tourism. [6]
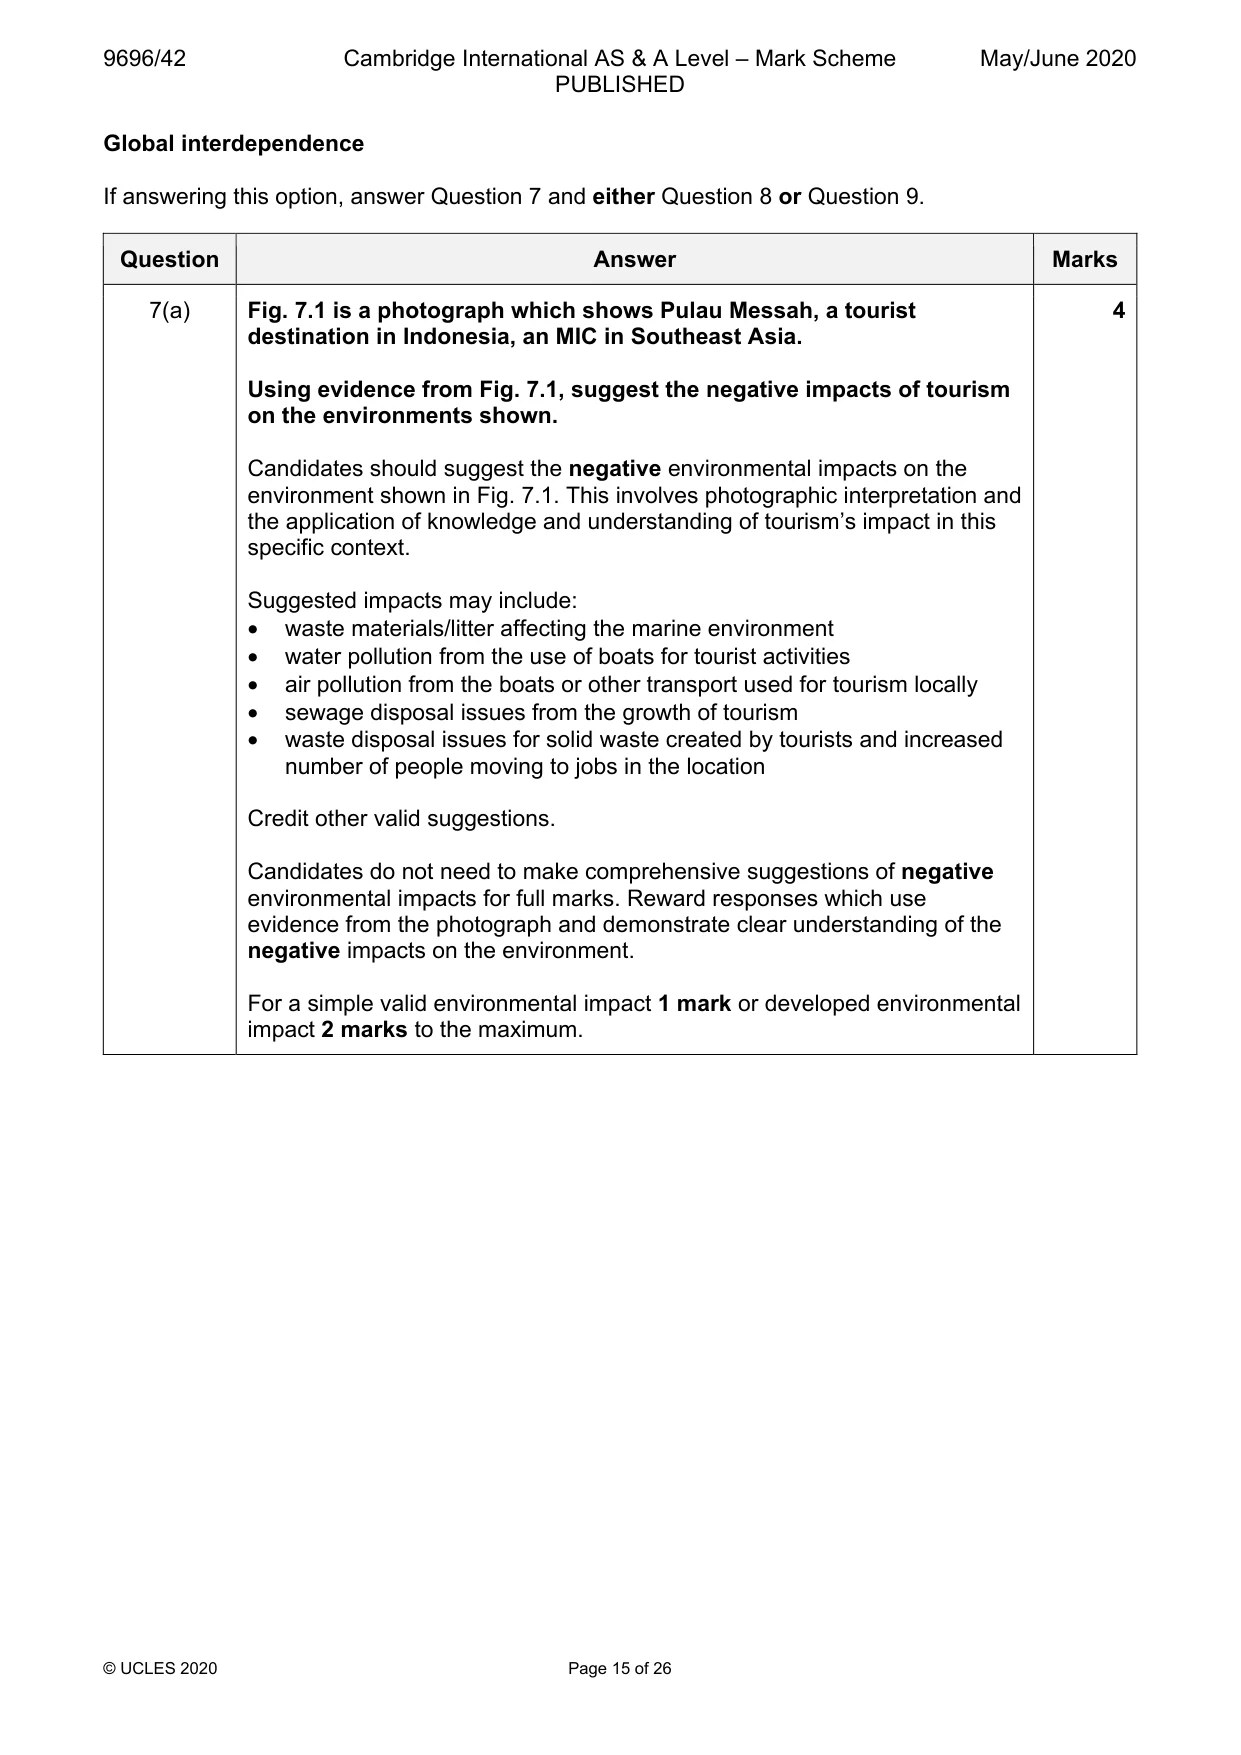
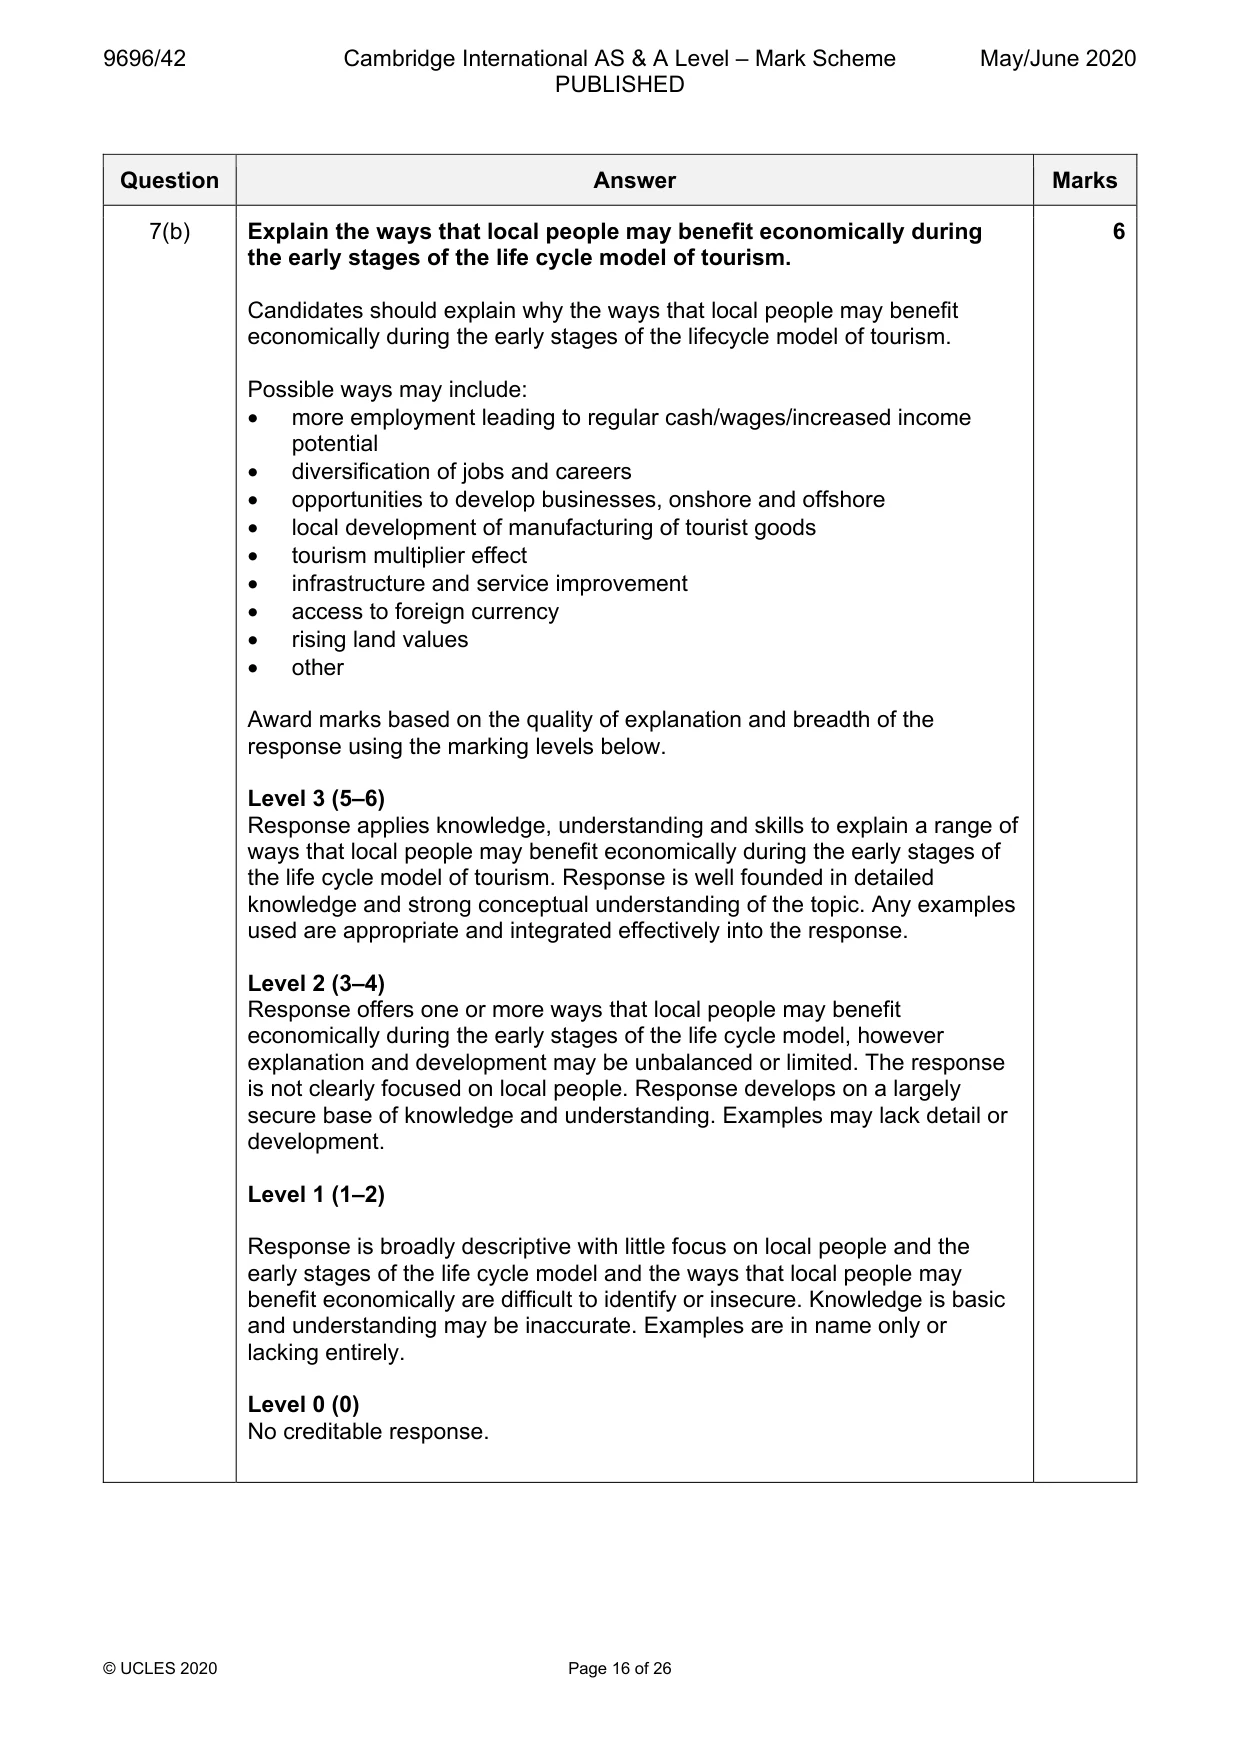
Mark scheme: 7(a) Fig. 7.1 is a photograph which shows Pulau Messah, a tourist 4 destination in Indonesia, an MIC in Southeast Asia. Using evidence from Fig. 7.1, suggest the negative impacts of tourism on the environments shown. Candidates should suggest the negative environmental impacts on the environment shown in Fig. 7.1. This involves photographic interpretation and the application of knowledge and understanding of tourism’s impact in this specific context. Suggested impacts may include: • waste materials/litter affecting the marine environment • water pollution from the use of boats for tourist activities • air pollution from the boats or other transport used for tourism locally • sewage disposal issues from the growth of tourism • waste disposal issues for solid waste created by tourists and increased number of people moving to jobs in the location Credit other valid suggestions. Candidates do not need to make comprehensive suggestions of negative environmental impacts for full marks. Reward responses which use evidence from the photograph and demonstrate clear understanding of the negative impacts on the environment. For a simple valid environmental impact 1 mark or developed environmental impact 2 marks to the maximum. 7(b) Explain the ways that local people may benefit economically during 6 the early stages of the life cycle model of tourism. Candidates should explain why the ways that local people may benefit economically during the early stages of the lifecycle model of tourism. Possible ways may include: • more employment leading to regular cash/wages/increased income potential • diversification of jobs and careers • opportunities to develop businesses, onshore and offshore • local development of manufacturing of tourist goods • tourism multiplier effect • infrastructure and service improvement • access to foreign currency • rising land values • other Award marks based on the quality of explanation and breadth of the response using the marking levels below. Level 3 (5–6) Response applies knowledge, understanding and skills to explain a range of ways that local people may benefit economically during the early stages of the life cycle model of tourism. Response is well founded in detailed knowledge and strong conceptual understanding of the topic. Any examples used are appropriate and integrated effectively into the response. Level 2 (3–4) Response offers one or more ways that local people may benefit economically during the early stages of the life cycle model, however explanation and development may be unbalanced or limited. The response is not clearly focused on local people. Response develops on a largely secure base of knowledge and understanding. Examples may lack detail or development. Level 1 (1–2) Response is broadly descriptive with little focus on local people and the early stages of the life cycle model and the ways that local people may benefit economically are difficult to identify or insecure. Knowledge is basic and understanding may be inaccurate. Examples are in name only or lacking entirely. Level 0 (0) No creditable response.
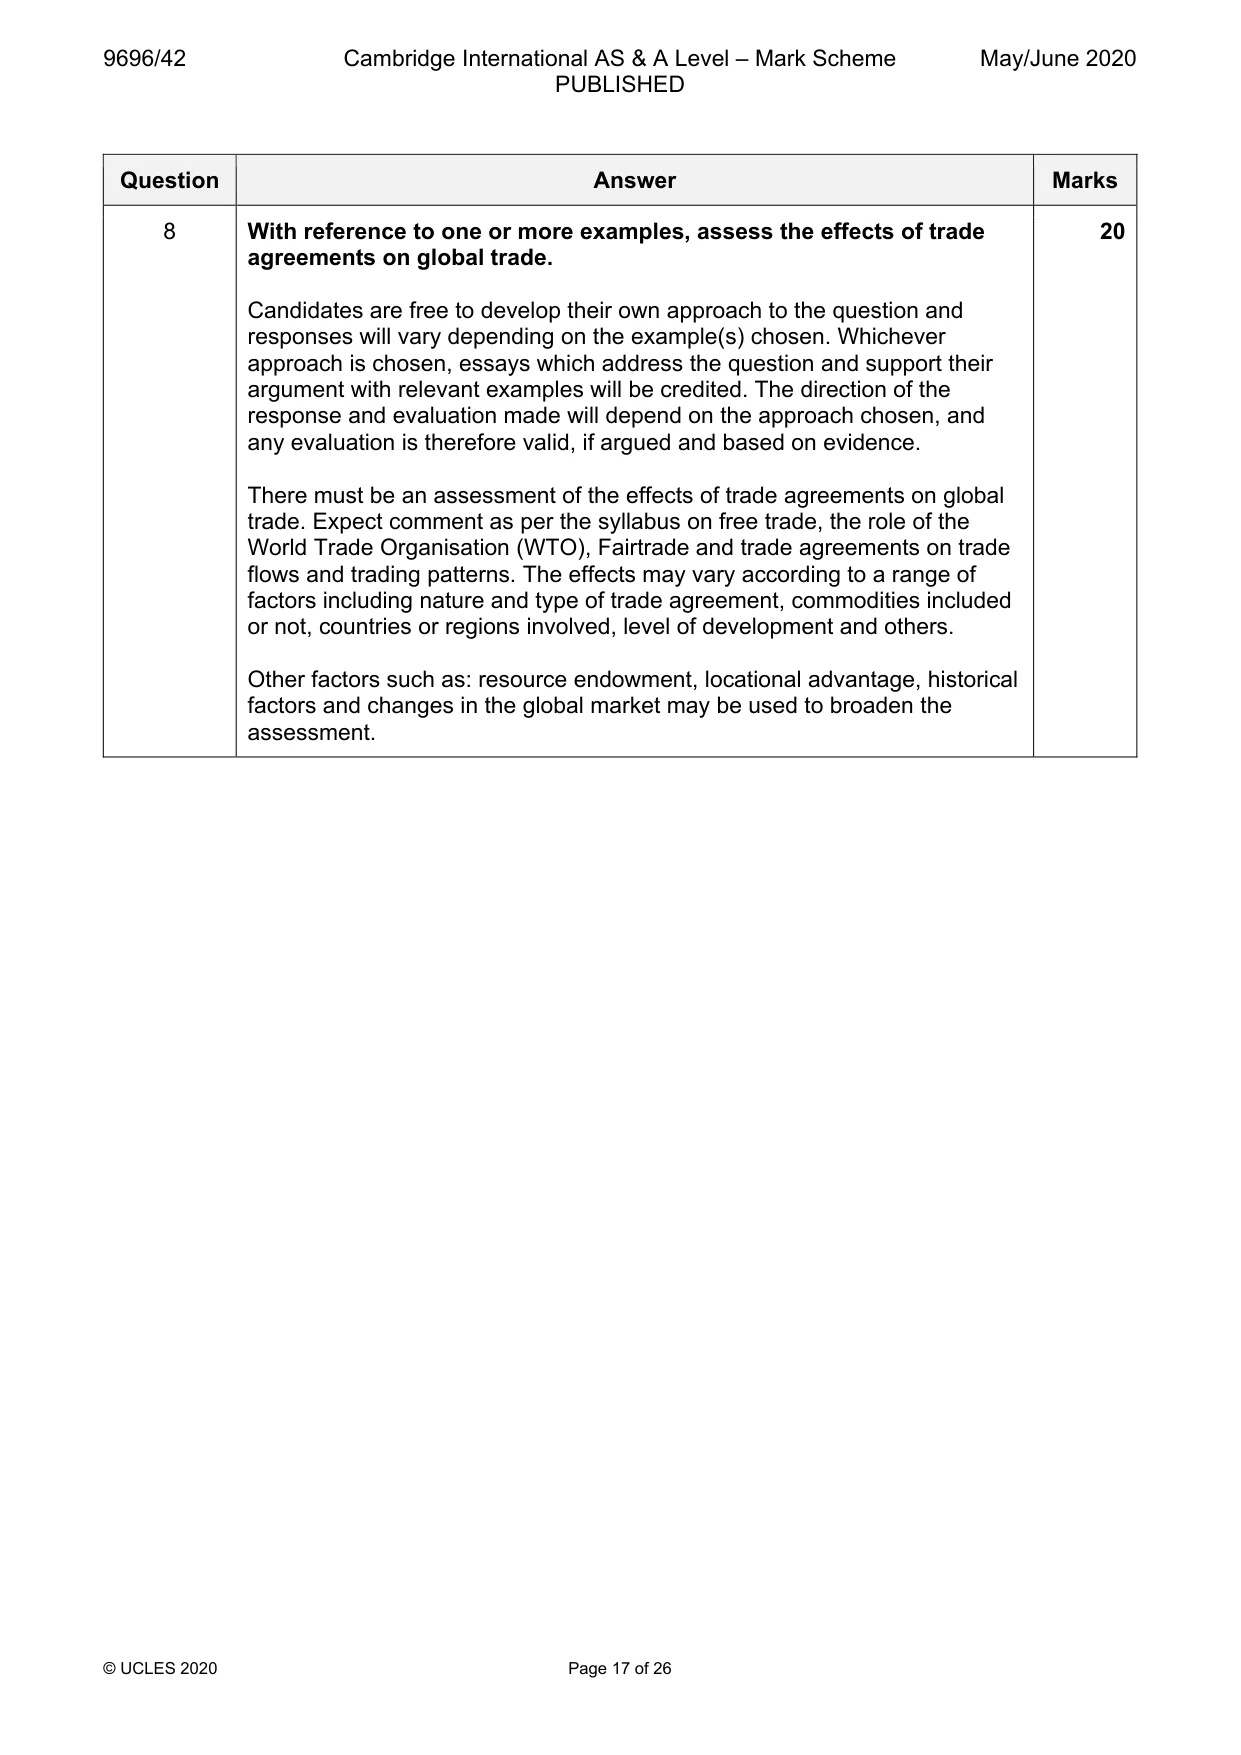
Q8 · With reference to one or more examples, assess the effects of trade agreements on global…
8 With reference to one or more examples, assess the effects of trade agreements on global trade. [20]
Mark scheme: 8 With reference to one or more examples, assess the effects of trade 20 agreements on global trade. Candidates are free to develop their own approach to the question and responses will vary depending on the example(s) chosen. Whichever approach is chosen, essays which address the question and support their argument with relevant examples will be credited. The direction of the response and evaluation made will depend on the approach chosen, and any evaluation is therefore valid, if argued and based on evidence. There must be an assessment of the effects of trade agreements on global trade. Expect comment as per the syllabus on free trade, the role of the World Trade Organisation (WTO), Fairtrade and trade agreements on trade flows and trading patterns. The effects may vary according to a range of factors including nature and type of trade agreement, commodities included or not, countries or regions involved, level of development and others. Other factors such as: resource endowment, locational advantage, historical factors and changes in the global market may be used to broaden the assessment. 8 Award marks based on the quality of the response using the marking levels below. Level 4 (16–20) Response thoroughly discusses the effects of trade agreements on global trade recognising both positive and negative effects. An effective and sustained evaluation with a sound conclusion. Response is well founded in detailed exemplar knowledge and strong conceptual understanding of the topic. Examples used are appropriate and integrated effectively into the response. Level 3 (11–15) Response discusses the effects of trade agreements on global trade. Response is broadly evaluative in character, comprising some explanatory or narrative content and a conclusion. Response develops on a largely secure base of knowledge and understanding with the use of example(s). Level 2 (6–10) Response demonstrates some knowledge and understanding of trade agreements and global trade but is clearly unbalanced and presents quite a simple and narrow view of the effects of trade agreements on global trade. Response is mainly descriptive or explanatory in approach and contains a brief or thinly supported evaluation. Responses without the use of example(s) to support the response will not get above the middle of Level 2 (8 marks). Level 1 (1–5) Response makes a few general points about trade agreements and/or global trade without the necessary focus on the effects of trade agreements on global trade. A descriptive response comprising a few simple points. Knowledge is basic and understanding may be poor and lack relevance to the question set. Level 0 (0) No creditable response.
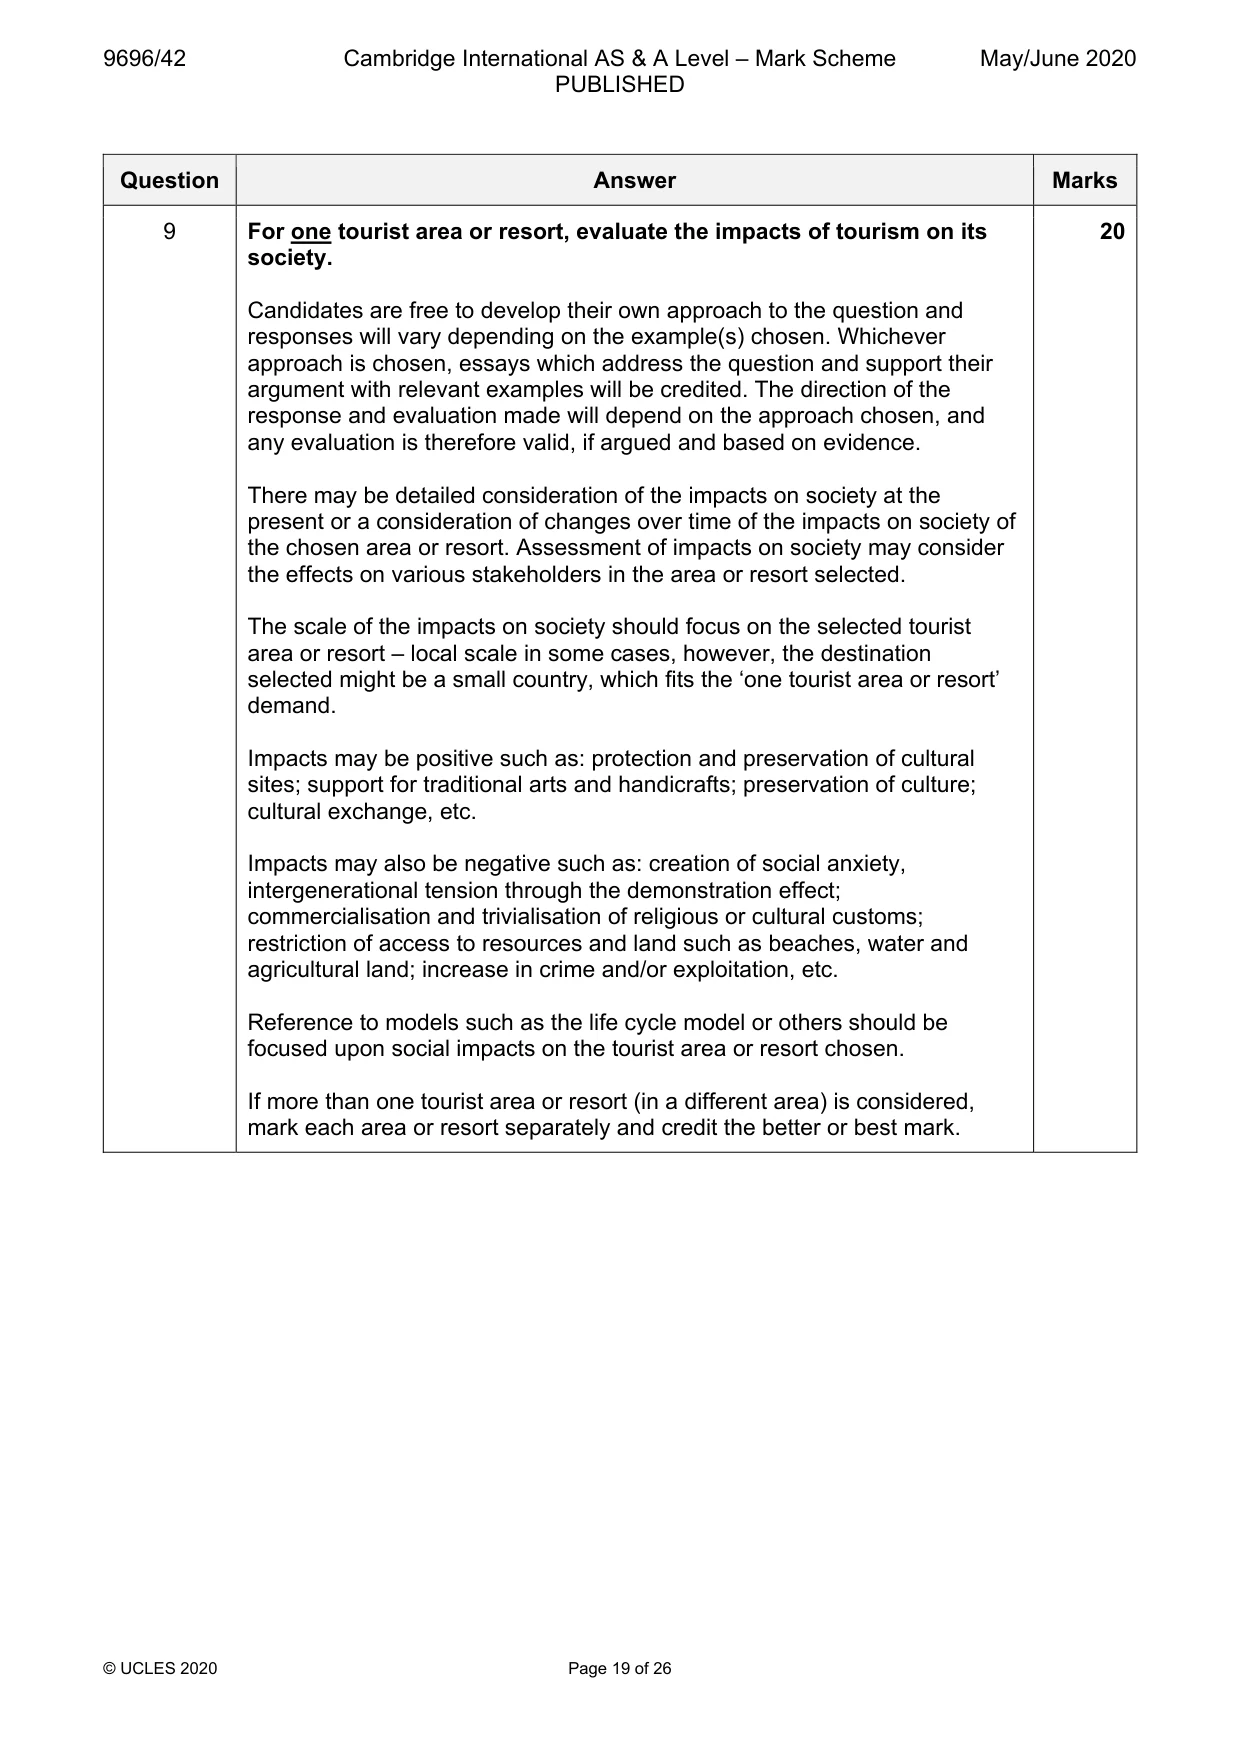
Q9 · For one tourist area or resort, evaluate the impacts of tourism on its society
9 For one tourist area or resort, evaluate the impacts of tourism on its society. [20] Economic transition If answering this option, answer Question 10 and either Question 11 or Question 12.
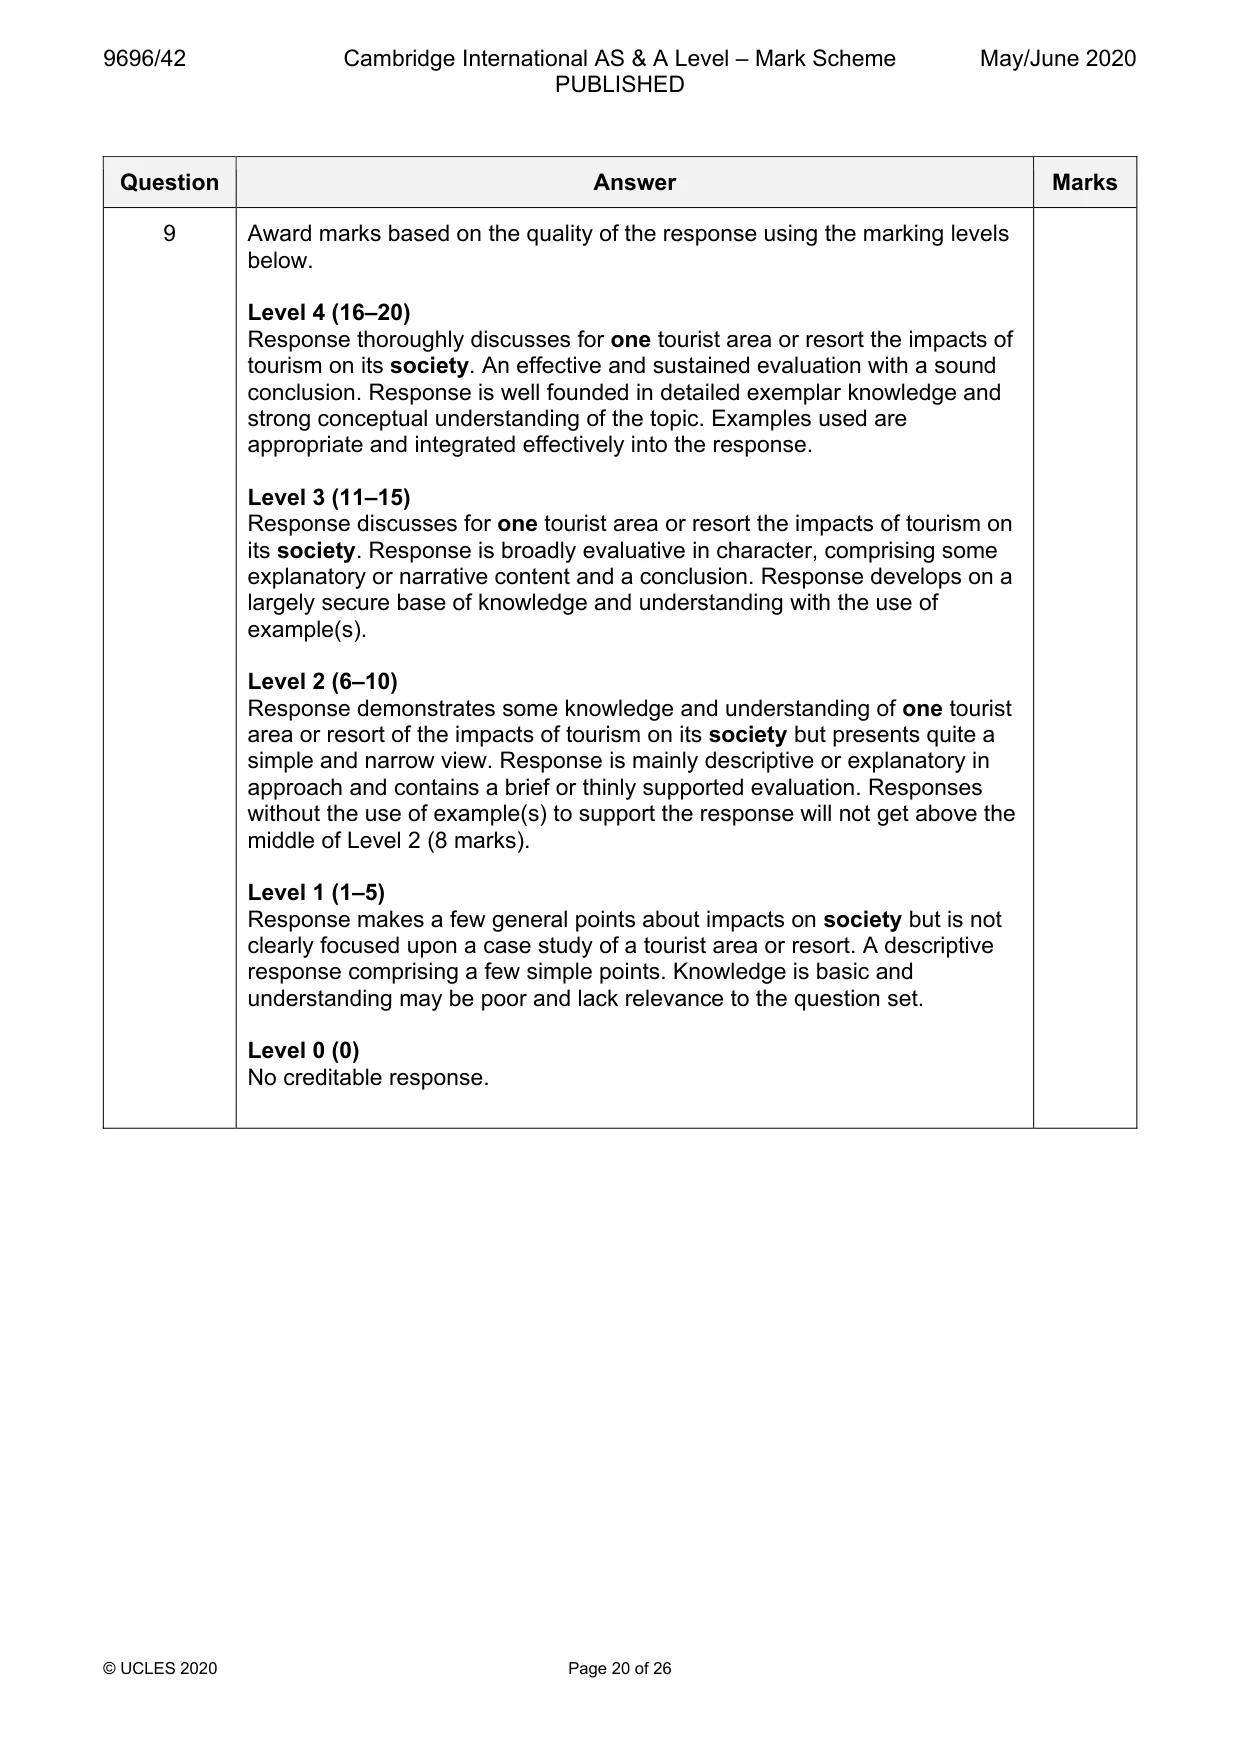
Mark scheme: 9 For one tourist area or resort, evaluate the impacts of tourism on its 20 society. Candidates are free to develop their own approach to the question and responses will vary depending on the example(s) chosen. Whichever approach is chosen, essays which address the question and support their argument with relevant examples will be credited. The direction of the response and evaluation made will depend on the approach chosen, and any evaluation is therefore valid, if argued and based on evidence. There may be detailed consideration of the impacts on society at the present or a consideration of changes over time of the impacts on society of the chosen area or resort. Assessment of impacts on society may consider the effects on various stakeholders in the area or resort selected. The scale of the impacts on society should focus on the selected tourist area or resort – local scale in some cases, however, the destination selected might be a small country, which fits the ‘one tourist area or resort’ demand. Impacts may be positive such as: protection and preservation of cultural sites; support for traditional arts and handicrafts; preservation of culture; cultural exchange, etc. Impacts may also be negative such as: creation of social anxiety, intergenerational tension through the demonstration effect; commercialisation and trivialisation of religious or cultural customs; restriction of access to resources and land such as beaches, water and agricultural land; increase in crime and/or exploitation, etc. Reference to models such as the life cycle model or others should be focused upon social impacts on the tourist area or resort chosen. If more than one tourist area or resort (in a different area) is considered, mark each area or resort separately and credit the better or best mark. Question Answer Marks 9 Award marks based on the quality of the response using the marking levels below. Level 4 (16–20) Response thoroughly discusses for one tourist area or resort the impacts of tourism on its society. An effective and sustained evaluation with a sound conclusion. Response is well founded in detailed exemplar knowledge and strong conceptual understanding of the topic. Examples used are appropriate and integrated effectively into the response. Level 3 (11–15) Response discusses for one tourist area or resort the impacts of tourism on its society. Response is broadly evaluative in character, comprising some explanatory or narrative content and a conclusion. Response develops on a largely secure base of knowledge and understanding with the use of example(s). Level 2 (6–10) Response demonstrates some knowledge and understanding of one tourist area or resort of the impacts of tourism on its society but presents quite a simple and narrow view. Response is mainly descriptive or explanatory in approach and contains a brief or thinly supported evaluation. Responses without the use of example(s) to support the response will not get above the middle of Level 2 (8 marks). Level 1 (1–5) Response makes a few general points about impacts on society but is not clearly focused upon a case study of a tourist area or resort. A descriptive response comprising a few simple points. Knowledge is basic and understanding may be poor and lack relevance to the question set. Level 0 (0) No creditable response. Economic transition If answering this option, answer Question 10 and either Question 11 or Question 12.
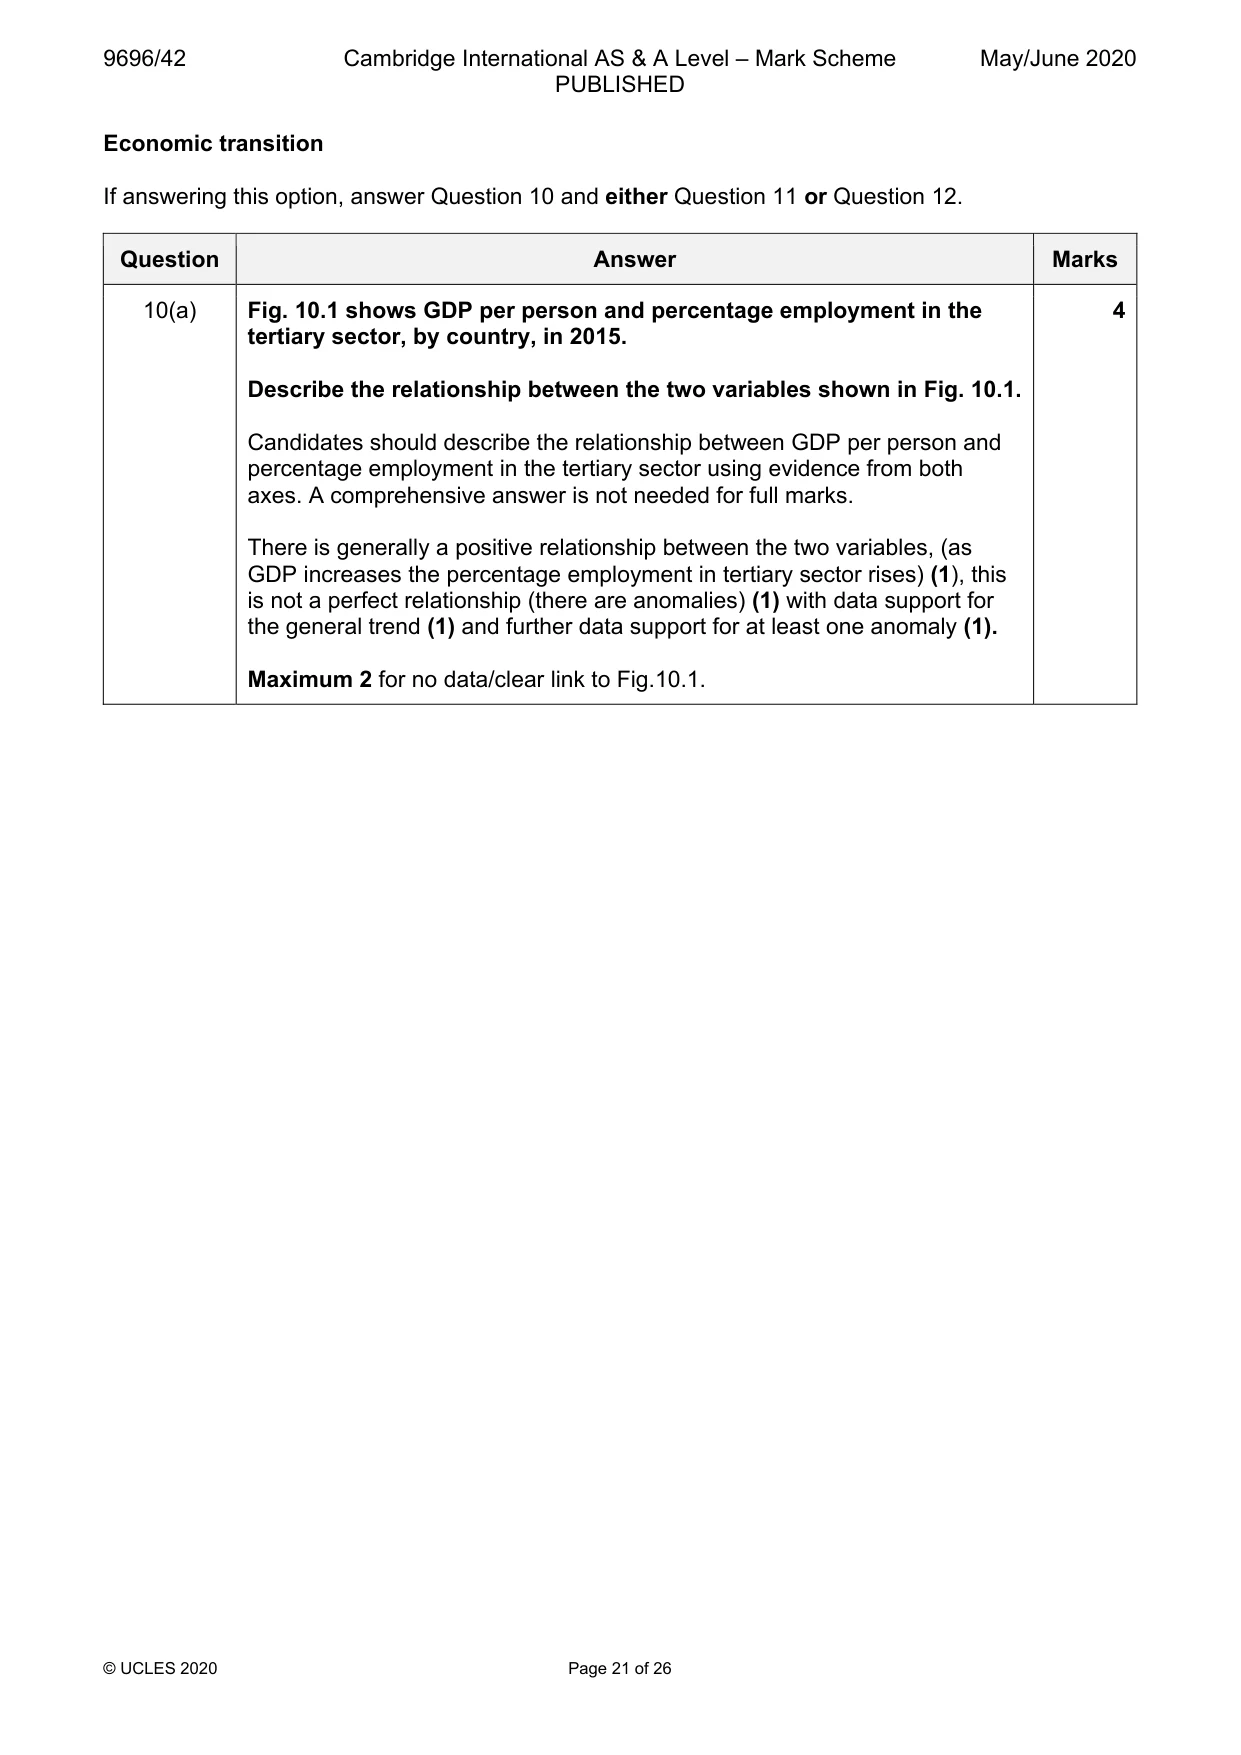
Q10 · GDP per person and percentage employment in the tertiary sector, by country, in 2015
10 Fig. 10.1 shows GDP per person and percentage employment in the tertiary sector, by country, in 2015. (a) Describe the relationship between the two variables shown in Fig. 10.1. [4] (b) Explain the role of the tertiary sector in economic development. [6]
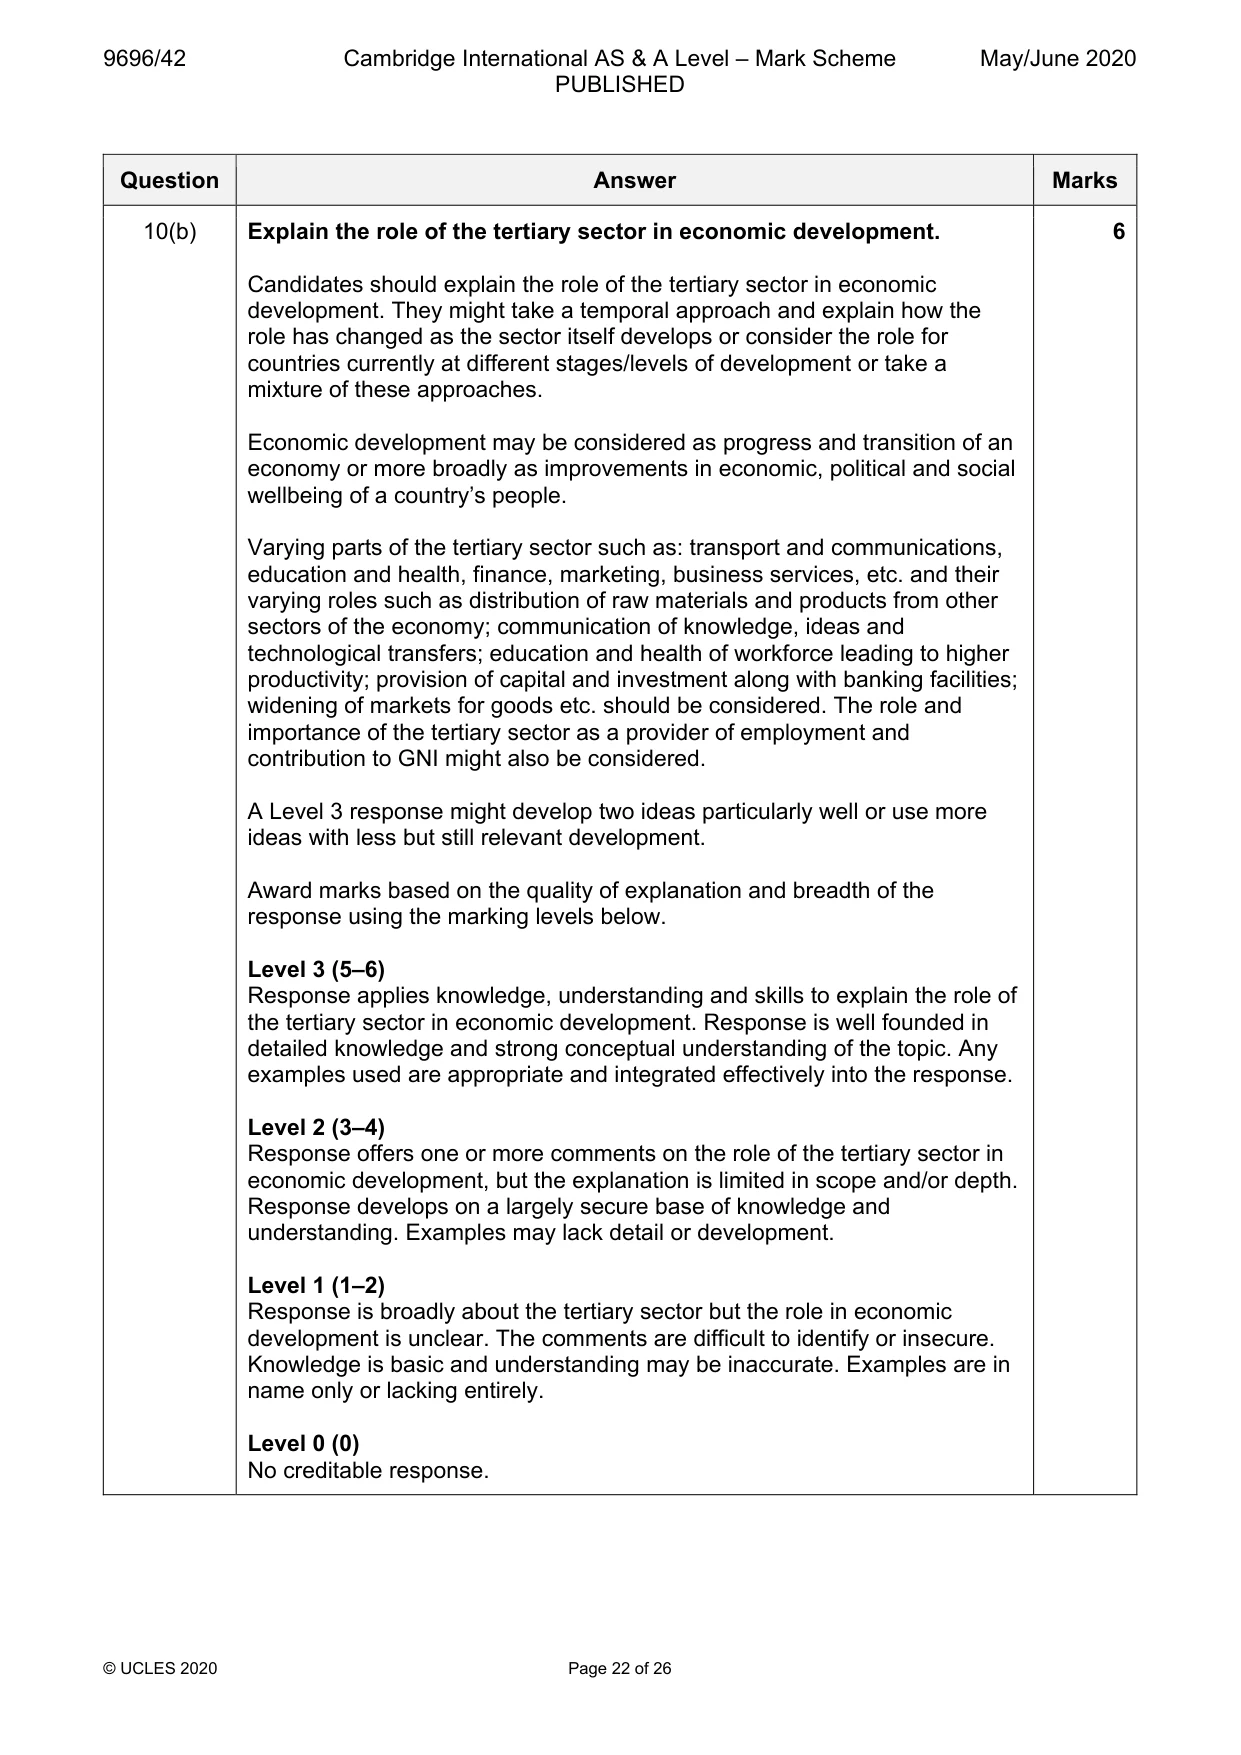
Mark scheme: 10(a) Fig. 10.1 shows GDP per person and percentage employment in the 4 tertiary sector, by country, in 2015. Describe the relationship between the two variables shown in Fig. 10.1. Candidates should describe the relationship between GDP per person and percentage employment in the tertiary sector using evidence from both axes. A comprehensive answer is not needed for full marks. There is generally a positive relationship between the two variables, (as GDP increases the percentage employment in tertiary sector rises) (1), this is not a perfect relationship (there are anomalies) (1) with data support for the general trend (1) and further data support for at least one anomaly (1). Maximum 2 for no data/clear link to Fig.10.1. 10(b) Explain the role of the tertiary sector in economic development. 6 Candidates should explain the role of the tertiary sector in economic development. They might take a temporal approach and explain how the role has changed as the sector itself develops or consider the role for countries currently at different stages/levels of development or take a mixture of these approaches. Economic development may be considered as progress and transition of an economy or more broadly as improvements in economic, political and social wellbeing of a country’s people. Varying parts of the tertiary sector such as: transport and communications, education and health, finance, marketing, business services, etc. and their varying roles such as distribution of raw materials and products from other sectors of the economy; communication of knowledge, ideas and technological transfers; education and health of workforce leading to higher productivity; provision of capital and investment along with banking facilities; widening of markets for goods etc. should be considered. The role and importance of the tertiary sector as a provider of employment and contribution to GNI might also be considered. A Level 3 response might develop two ideas particularly well or use more ideas with less but still relevant development. Award marks based on the quality of explanation and breadth of the response using the marking levels below. Level 3 (5–6) Response applies knowledge, understanding and skills to explain the role of the tertiary sector in economic development. Response is well founded in detailed knowledge and strong conceptual understanding of the topic. Any examples used are appropriate and integrated effectively into the response. Level 2 (3–4) Response offers one or more comments on the role of the tertiary sector in economic development, but the explanation is limited in scope and/or depth. Response develops on a largely secure base of knowledge and understanding. Examples may lack detail or development. Level 1 (1–2) Response is broadly about the tertiary sector but the role in economic development is unclear. The comments are difficult to identify or insecure. Knowledge is basic and understanding may be inaccurate. Examples are in name only or lacking entirely. Level 0 (0) No creditable response.
Q11 · ‘Globalisation of economic activity produces more benefits than problems.’ How far do you…
11 ‘Globalisation of economic activity produces more benefits than problems.’ How far do you agree? [20]
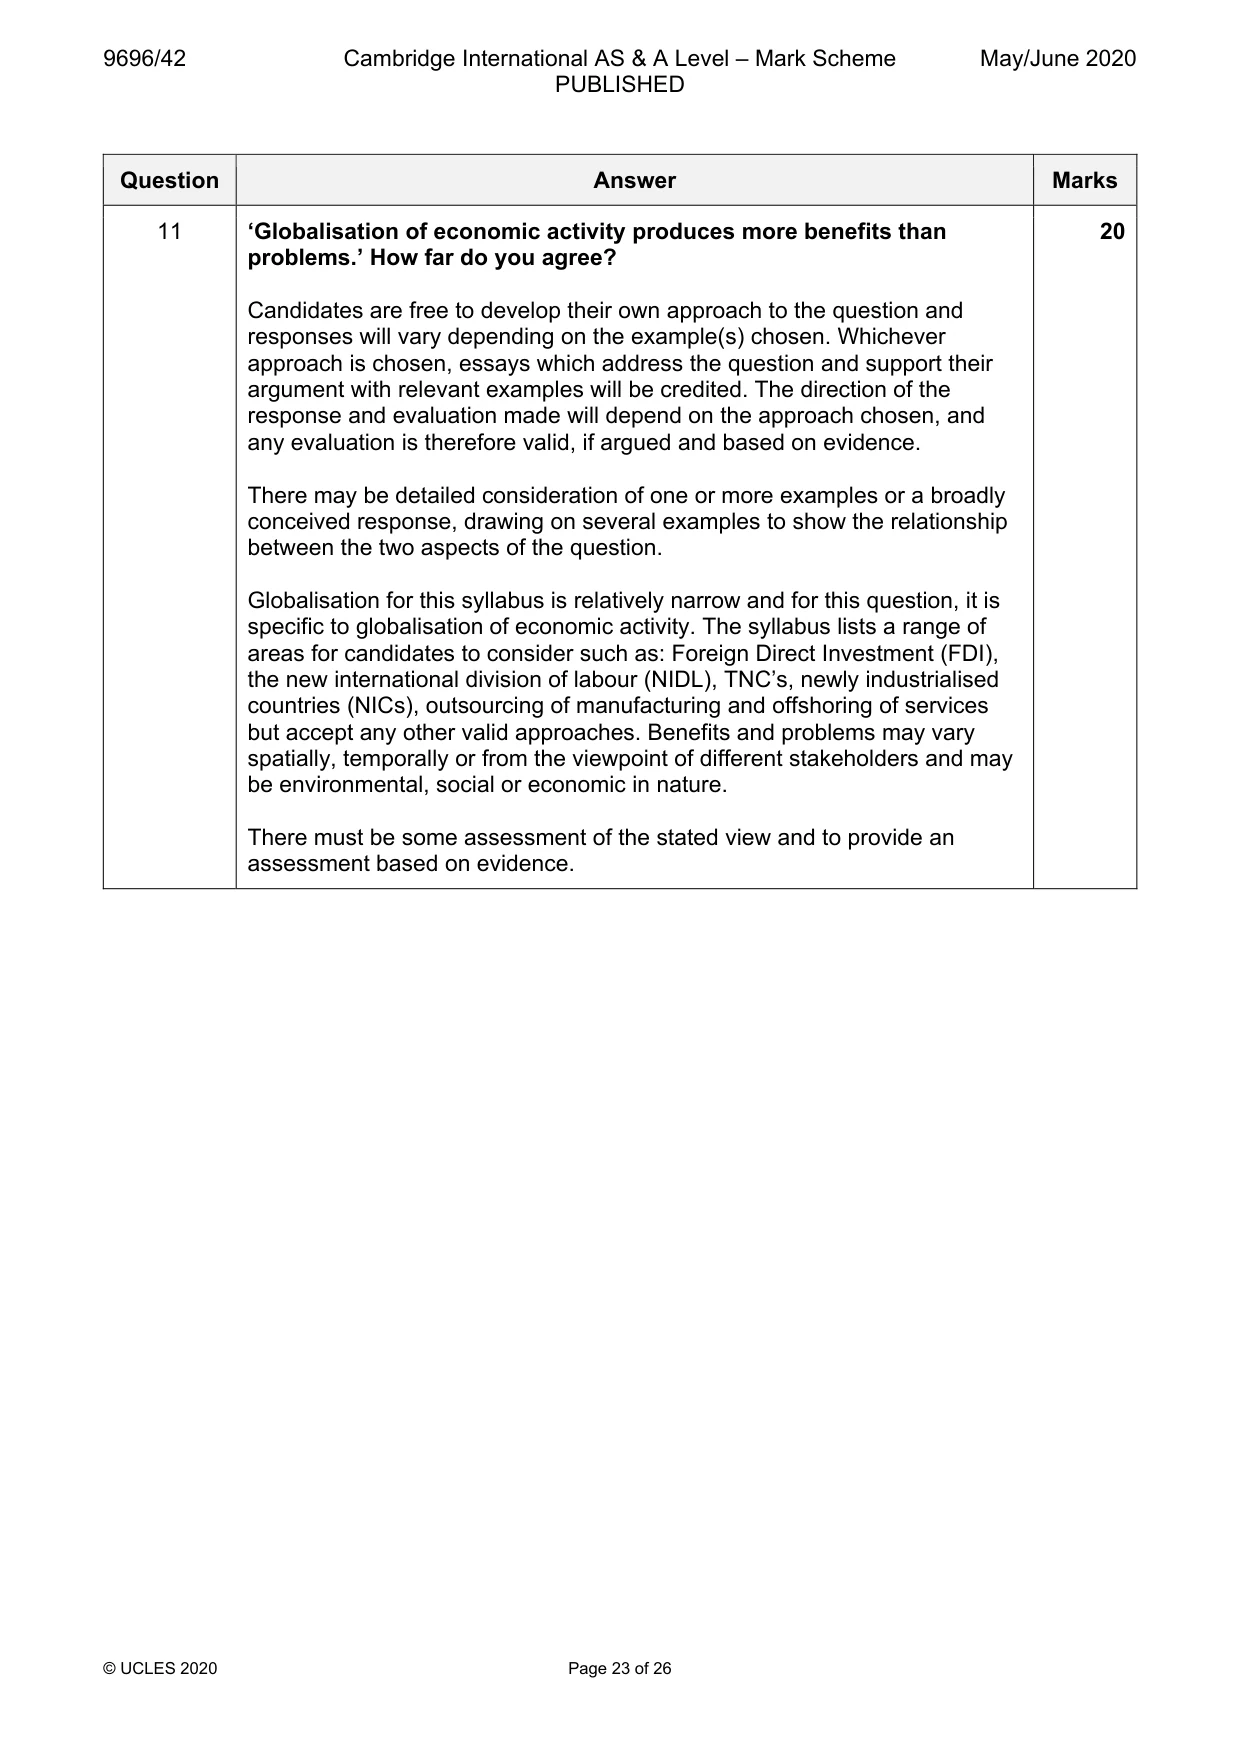
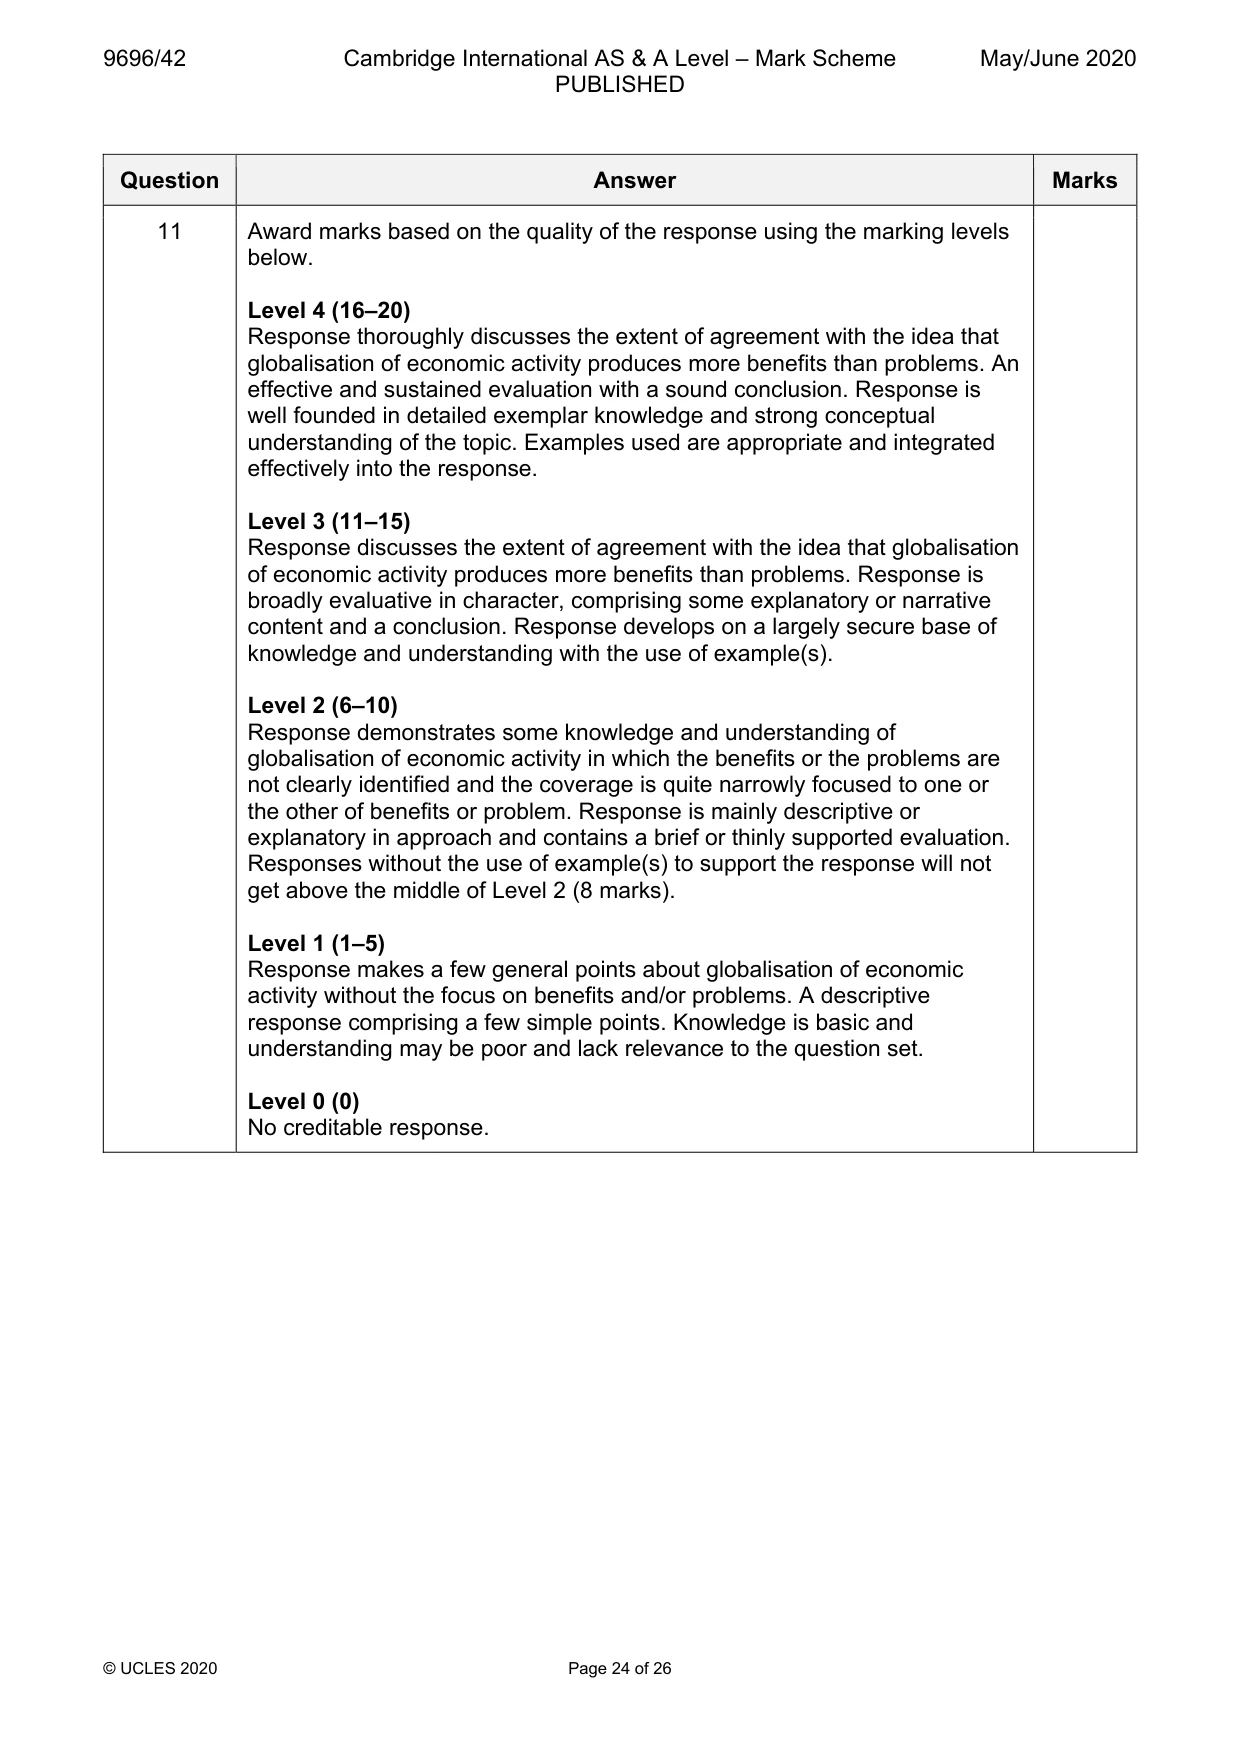
Mark scheme: 11 ‘Globalisation of economic activity produces more benefits than 20 problems.’ How far do you agree? Candidates are free to develop their own approach to the question and responses will vary depending on the example(s) chosen. Whichever approach is chosen, essays which address the question and support their argument with relevant examples will be credited. The direction of the response and evaluation made will depend on the approach chosen, and any evaluation is therefore valid, if argued and based on evidence. There may be detailed consideration of one or more examples or a broadly conceived response, drawing on several examples to show the relationship between the two aspects of the question. Globalisation for this syllabus is relatively narrow and for this question, it is specific to globalisation of economic activity. The syllabus lists a range of areas for candidates to consider such as: Foreign Direct Investment (FDI), the new international division of labour (NIDL), TNC’s, newly industrialised countries (NICs), outsourcing of manufacturing and offshoring of services but accept any other valid approaches. Benefits and problems may vary spatially, temporally or from the viewpoint of different stakeholders and may be environmental, social or economic in nature. There must be some assessment of the stated view and to provide an assessment based on evidence. 11 Award marks based on the quality of the response using the marking levels below. Level 4 (16–20) Response thoroughly discusses the extent of agreement with the idea that globalisation of economic activity produces more benefits than problems. An effective and sustained evaluation with a sound conclusion. Response is well founded in detailed exemplar knowledge and strong conceptual understanding of the topic. Examples used are appropriate and integrated effectively into the response. Level 3 (11–15) Response discusses the extent of agreement with the idea that globalisation of economic activity produces more benefits than problems. Response is broadly evaluative in character, comprising some explanatory or narrative content and a conclusion. Response develops on a largely secure base of knowledge and understanding with the use of example(s). Level 2 (6–10) Response demonstrates some knowledge and understanding of globalisation of economic activity in which the benefits or the problems are not clearly identified and the coverage is quite narrowly focused to one or the other of benefits or problem. Response is mainly descriptive or explanatory in approach and contains a brief or thinly supported evaluation. Responses without the use of example(s) to support the response will not get above the middle of Level 2 (8 marks). Level 1 (1–5) Response makes a few general points about globalisation of economic activity without the focus on benefits and/or problems. A descriptive response comprising a few simple points. Knowledge is basic and understanding may be poor and lack relevance to the question set. Level 0 (0) No creditable response.
Q12 · ‘Regional development begins with divergence
12 ‘Regional development begins with divergence. Convergence occurs later.’ With reference to one country, assess the extent to which this statement is true. [20]
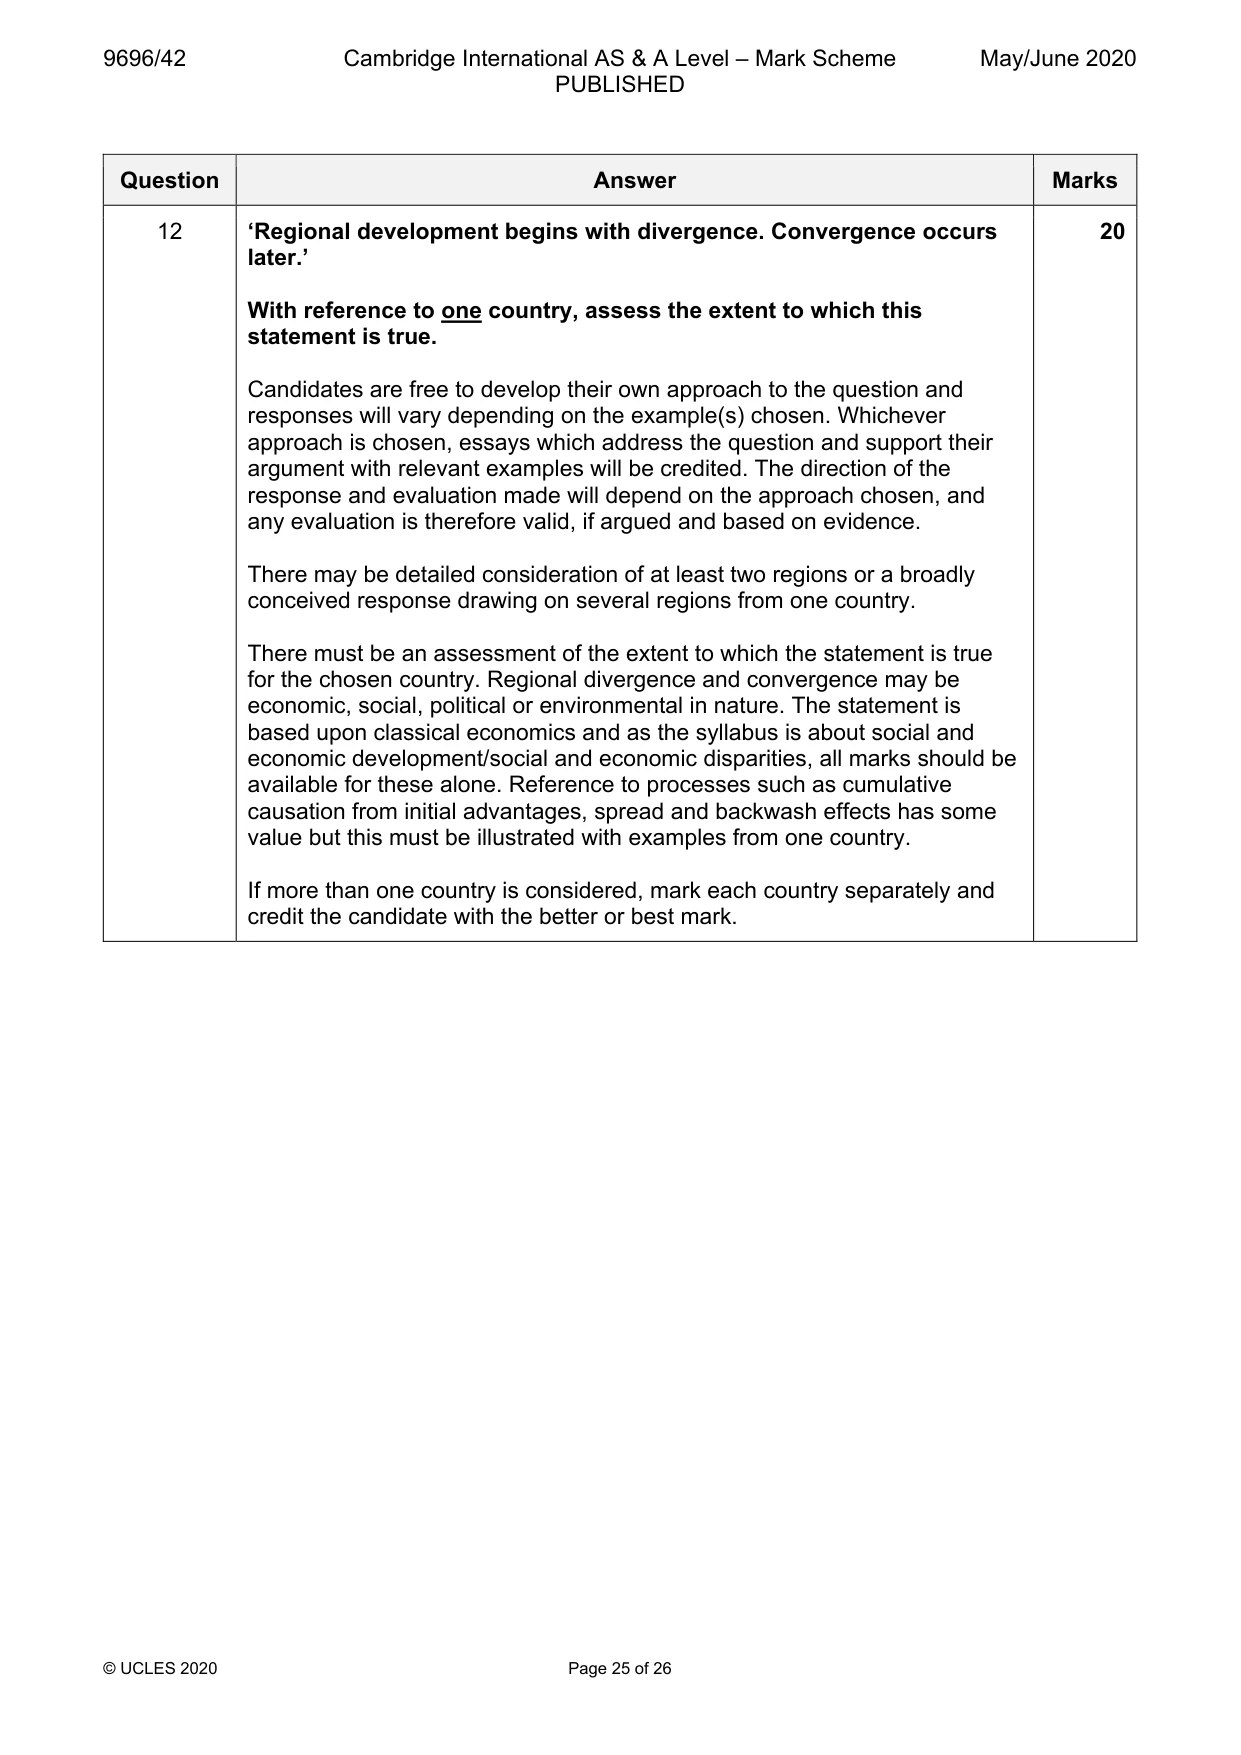
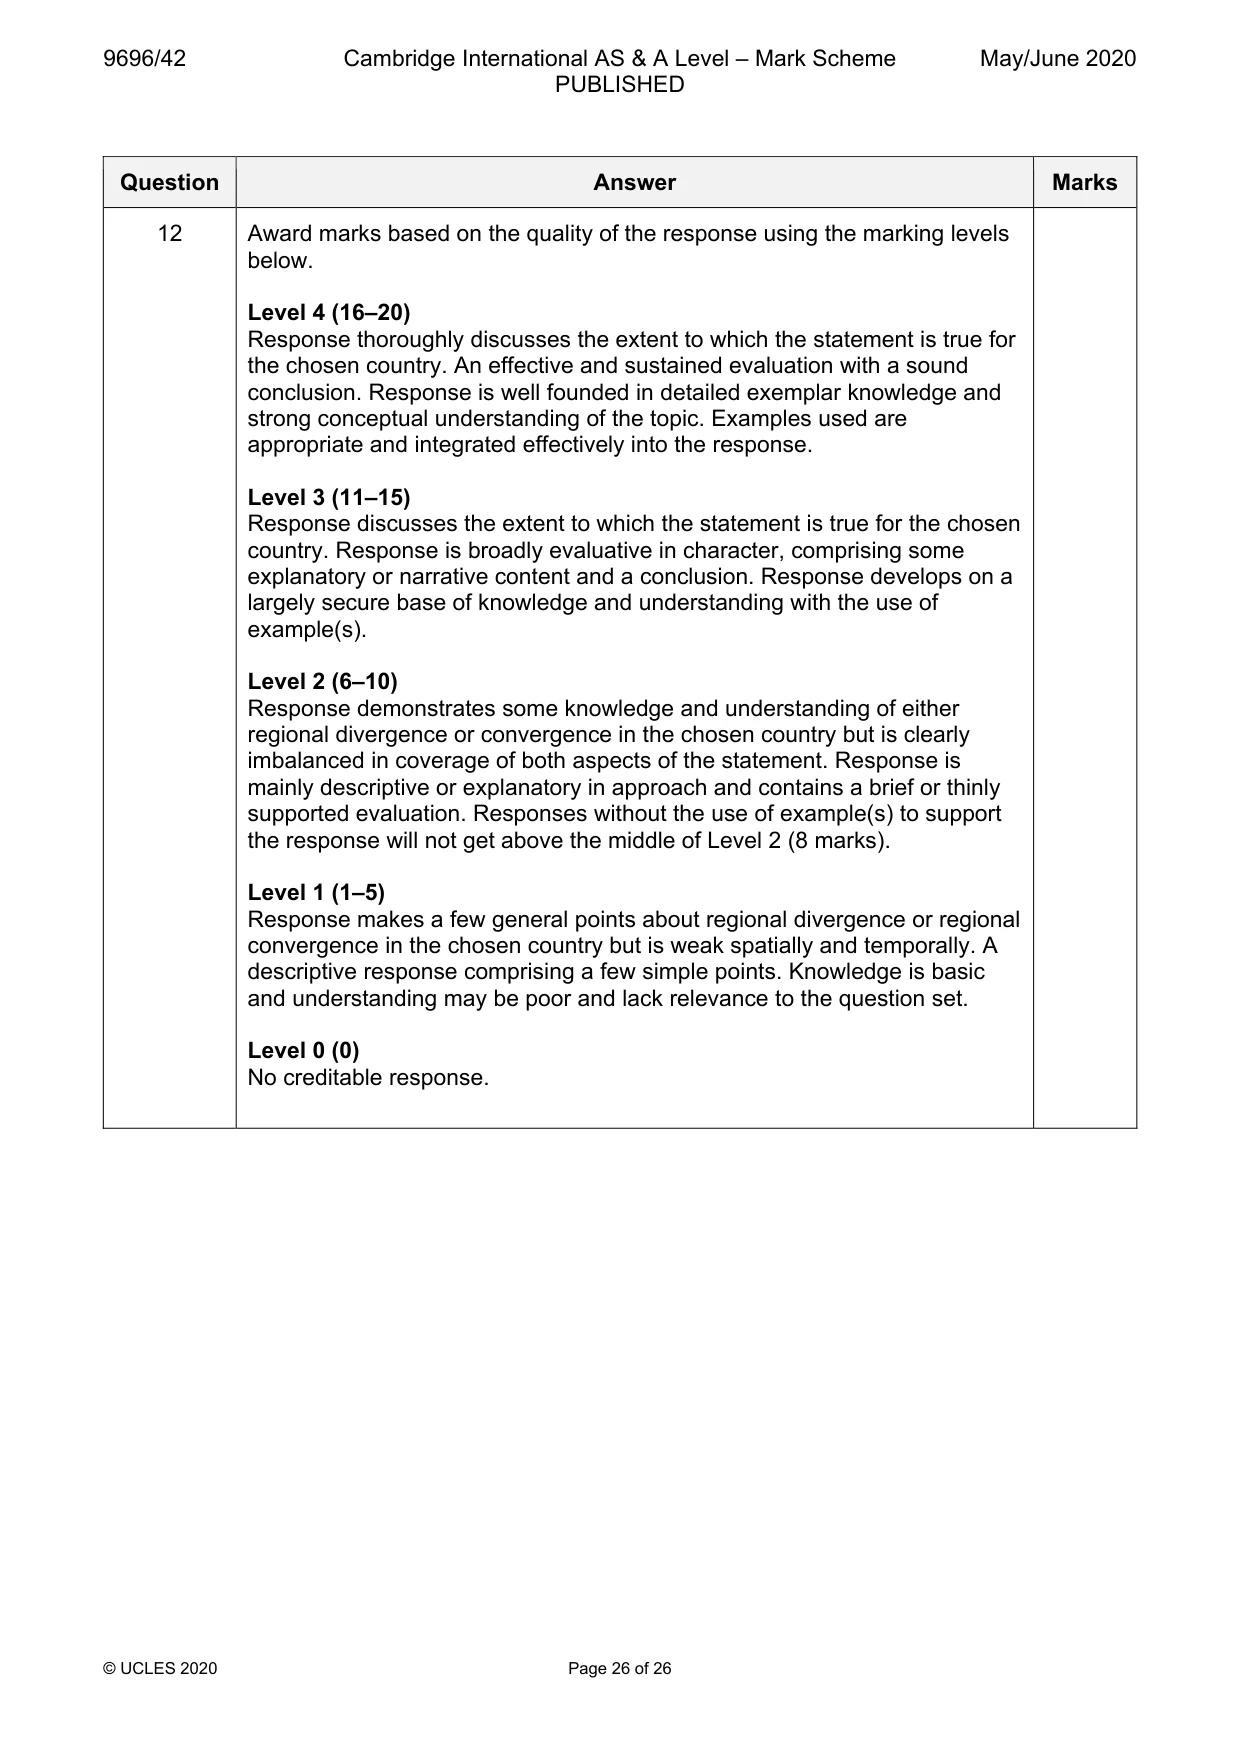
Mark scheme: 12 ‘Regional development begins with divergence. Convergence occurs 20 later.’ With reference to one country, assess the extent to which this statement is true. Candidates are free to develop their own approach to the question and responses will vary depending on the example(s) chosen. Whichever approach is chosen, essays which address the question and support their argument with relevant examples will be credited. The direction of the response and evaluation made will depend on the approach chosen, and any evaluation is therefore valid, if argued and based on evidence. There may be detailed consideration of at least two regions or a broadly conceived response drawing on several regions from one country. There must be an assessment of the extent to which the statement is true for the chosen country. Regional divergence and convergence may be economic, social, political or environmental in nature. The statement is based upon classical economics and as the syllabus is about social and economic development/social and economic disparities, all marks should be available for these alone. Reference to processes such as cumulative causation from initial advantages, spread and backwash effects has some value but this must be illustrated with examples from one country. If more than one country is considered, mark each country separately and credit the candidate with the better or best mark. Question Answer Marks 12 Award marks based on the quality of the response using the marking levels below. Level 4 (16–20) Response thoroughly discusses the extent to which the statement is true for the chosen country. An effective and sustained evaluation with a sound conclusion. Response is well founded in detailed exemplar knowledge and strong conceptual understanding of the topic. Examples used are appropriate and integrated effectively into the response. Level 3 (11–15) Response discusses the extent to which the statement is true for the chosen country. Response is broadly evaluative in character, comprising some explanatory or narrative content and a conclusion. Response develops on a largely secure base of knowledge and understanding with the use of example(s). Level 2 (6–10) Response demonstrates some knowledge and understanding of either regional divergence or convergence in the chosen country but is clearly imbalanced in coverage of both aspects of the statement. Response is mainly descriptive or explanatory in approach and contains a brief or thinly supported evaluation. Responses without the use of example(s) to support the response will not get above the middle of Level 2 (8 marks). Level 1 (1–5) Response makes a few general points about regional divergence or regional convergence in the chosen country but is weak spatially and temporally. A descriptive response comprising a few simple points. Knowledge is basic and understanding may be poor and lack relevance to the question set. Level 0 (0) No creditable response.
What was in this paper
The subtopics covered by these 12 questions, and how many questions each got. Open one in a new tab to see every Cambridge question on it.
2Trade flows and trading patterns2Agricultural systems and food production1National development1Regional development within countries1The globalisation of economic activity1The management of a degraded environment1The management of agricultural change1The management of change in manufacturing industry1The management of energy supply1