Cambridge A Level Geography 9696 — 2020 May/June Paper 2 · Variant 1
9696/21/M/J/20 · 6 questions · 120 marks · ≈135 min
The question paper and its mark scheme, free to read here and free to download. This is Cambridge’s own paper, exactly as it was sat.
Question paper4 pages
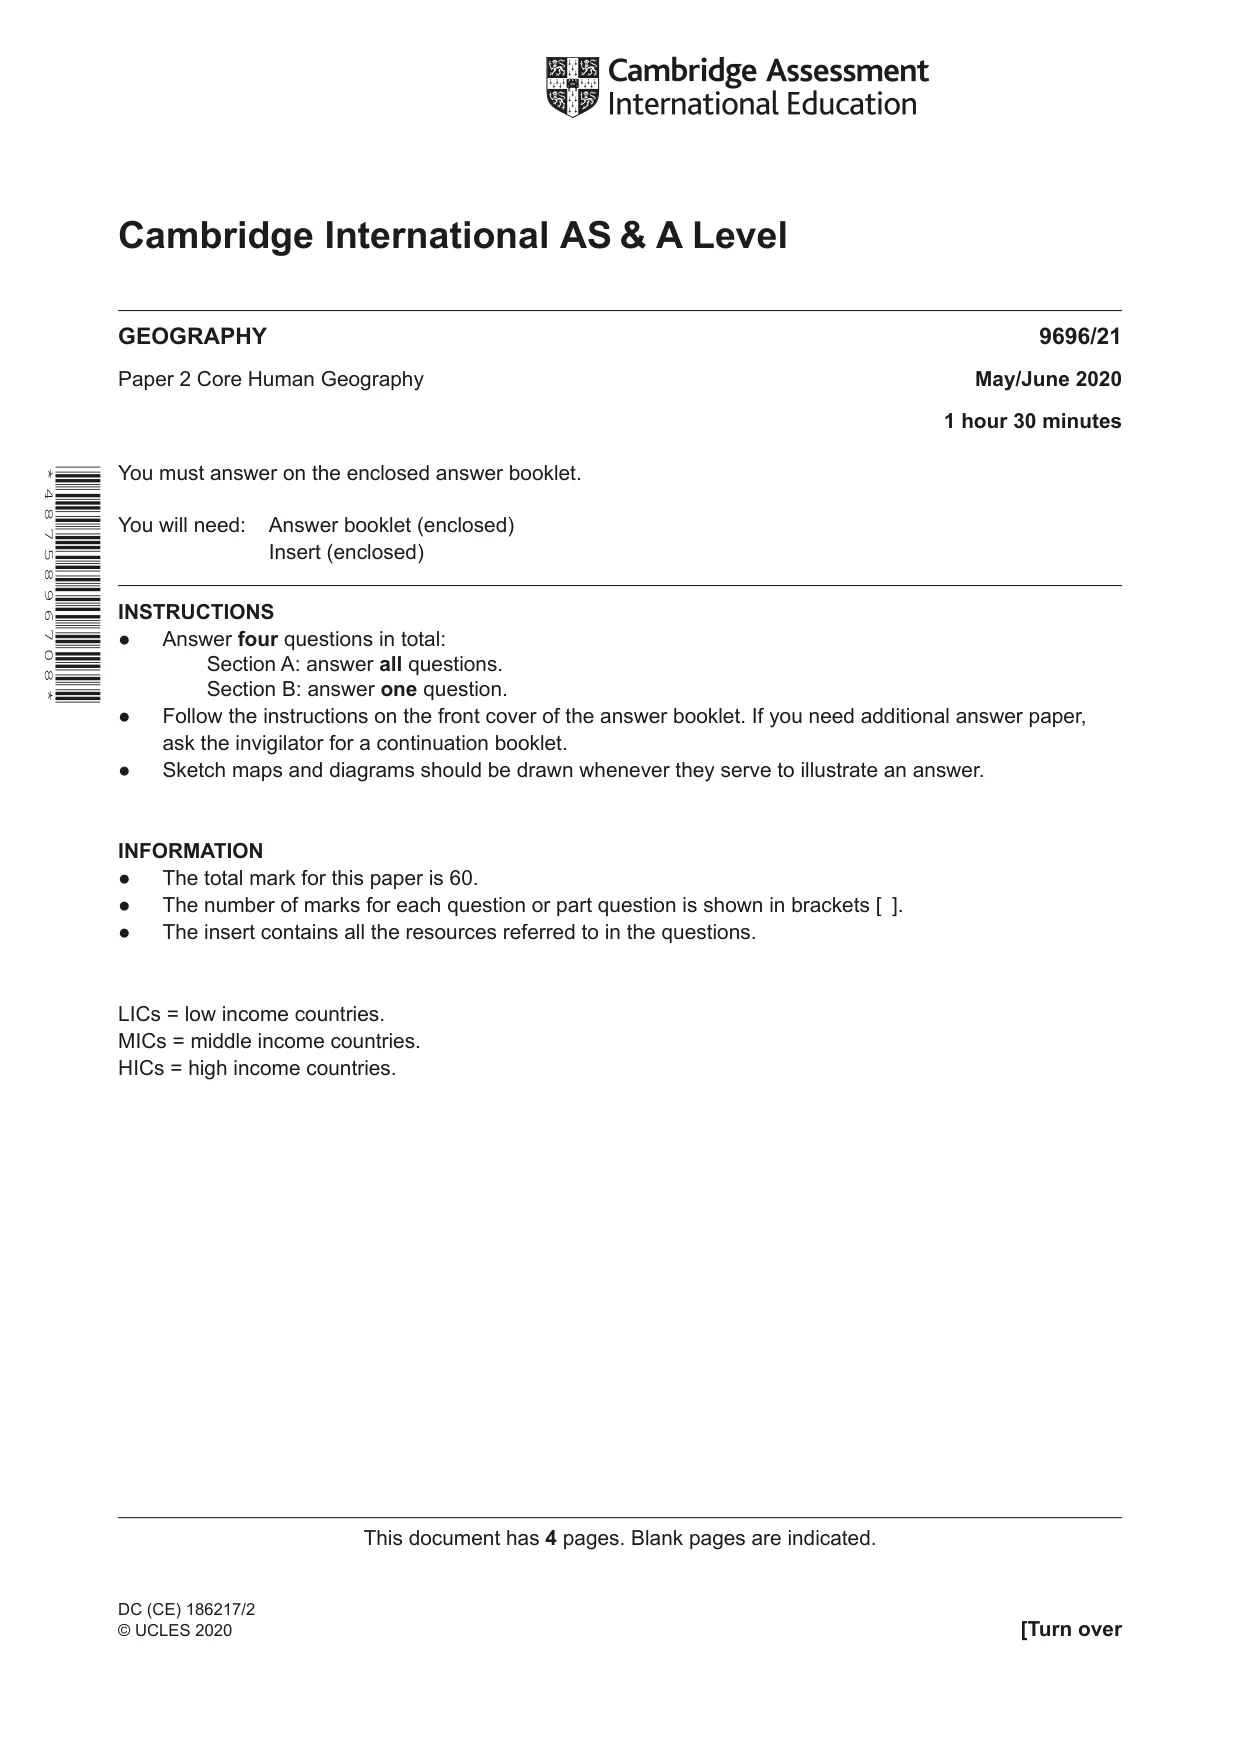
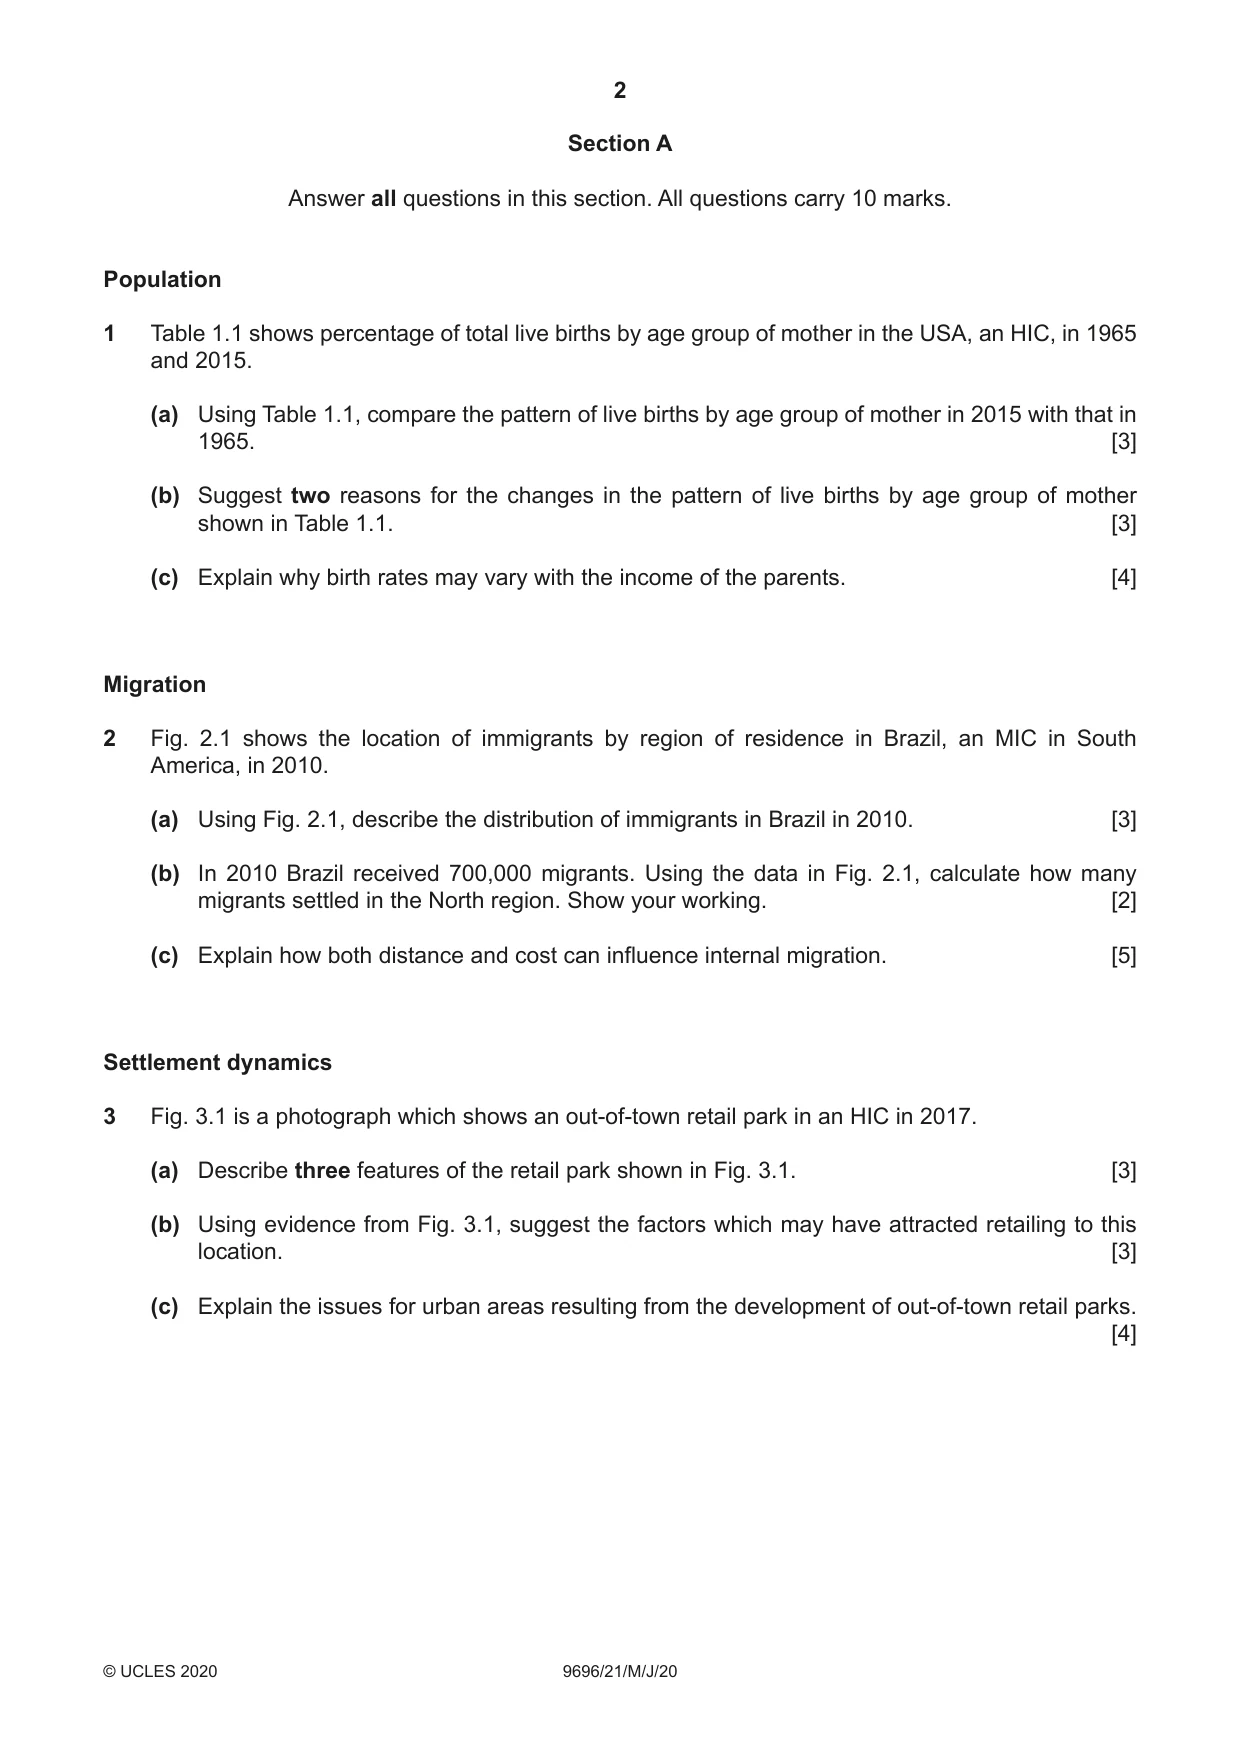
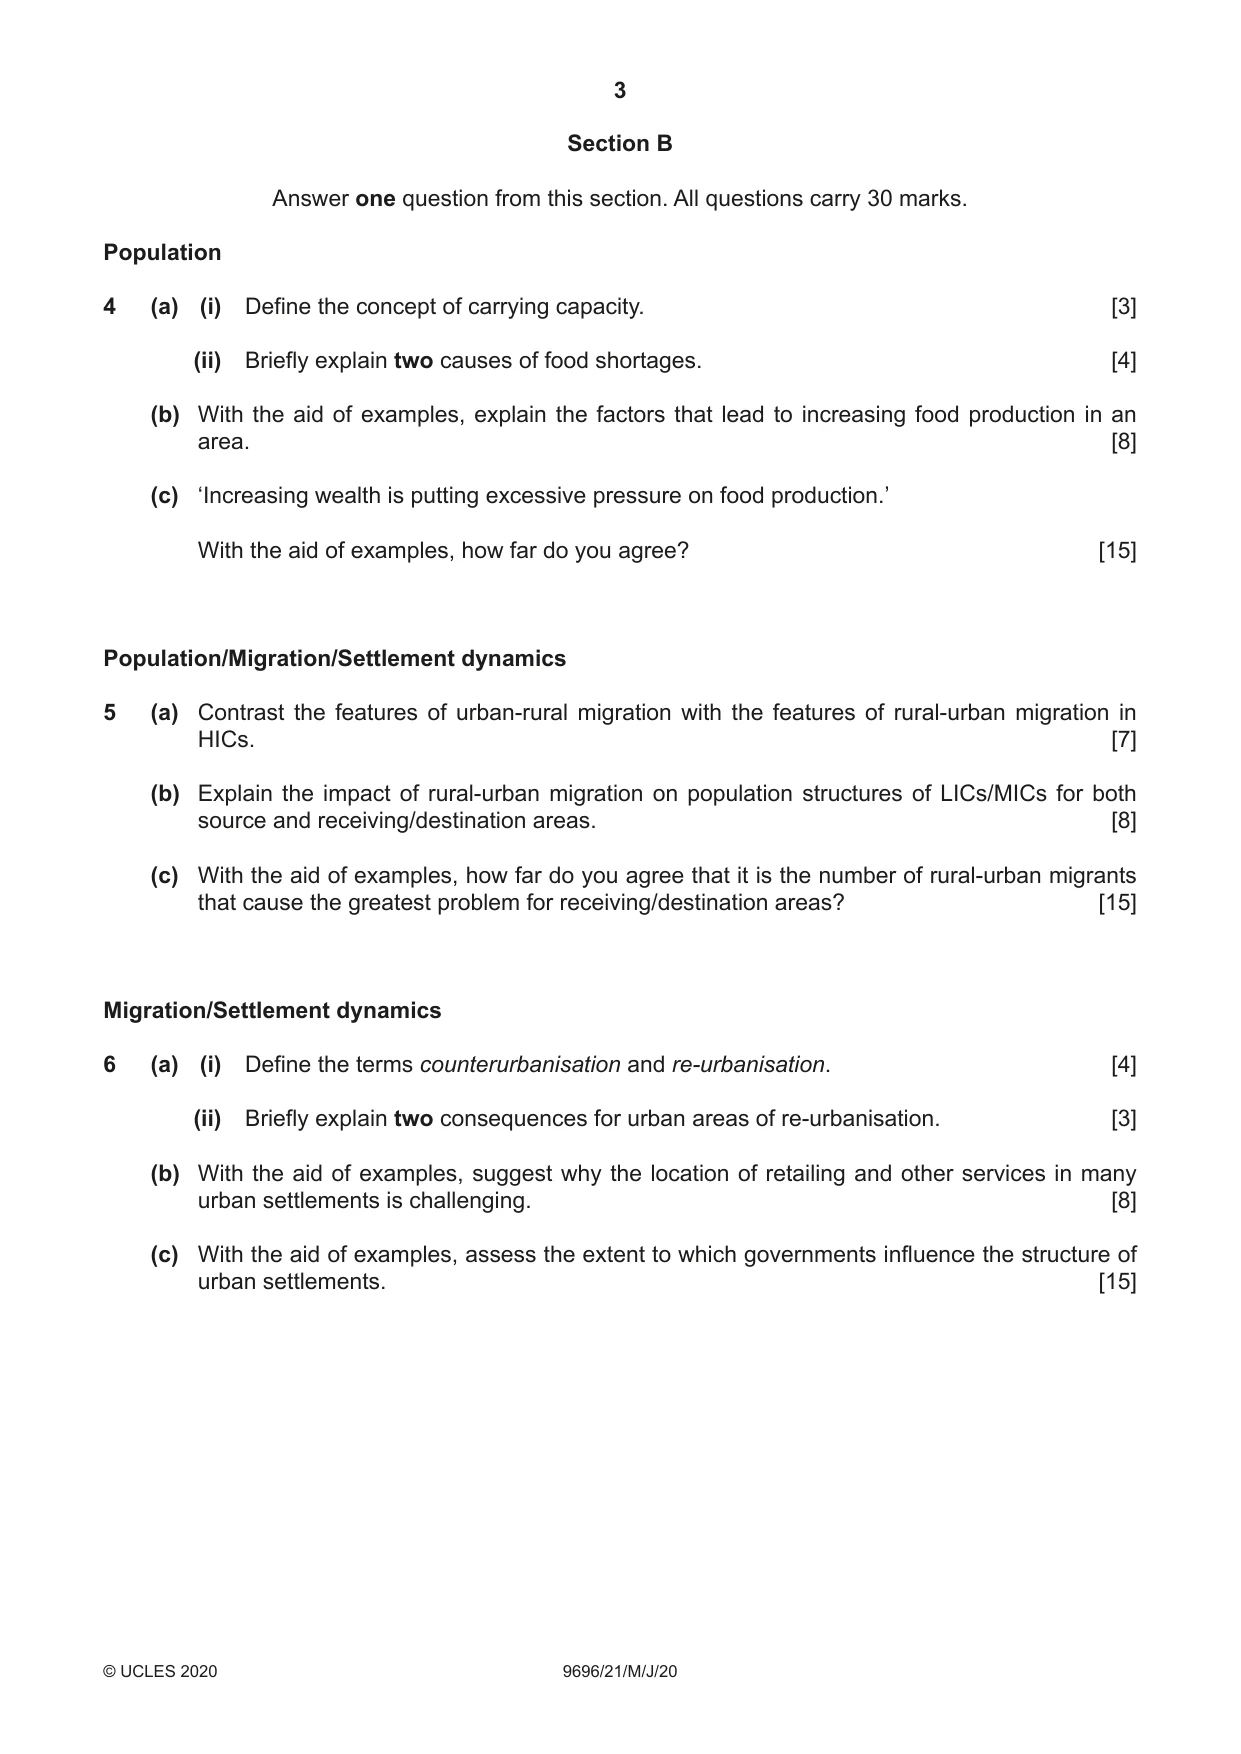

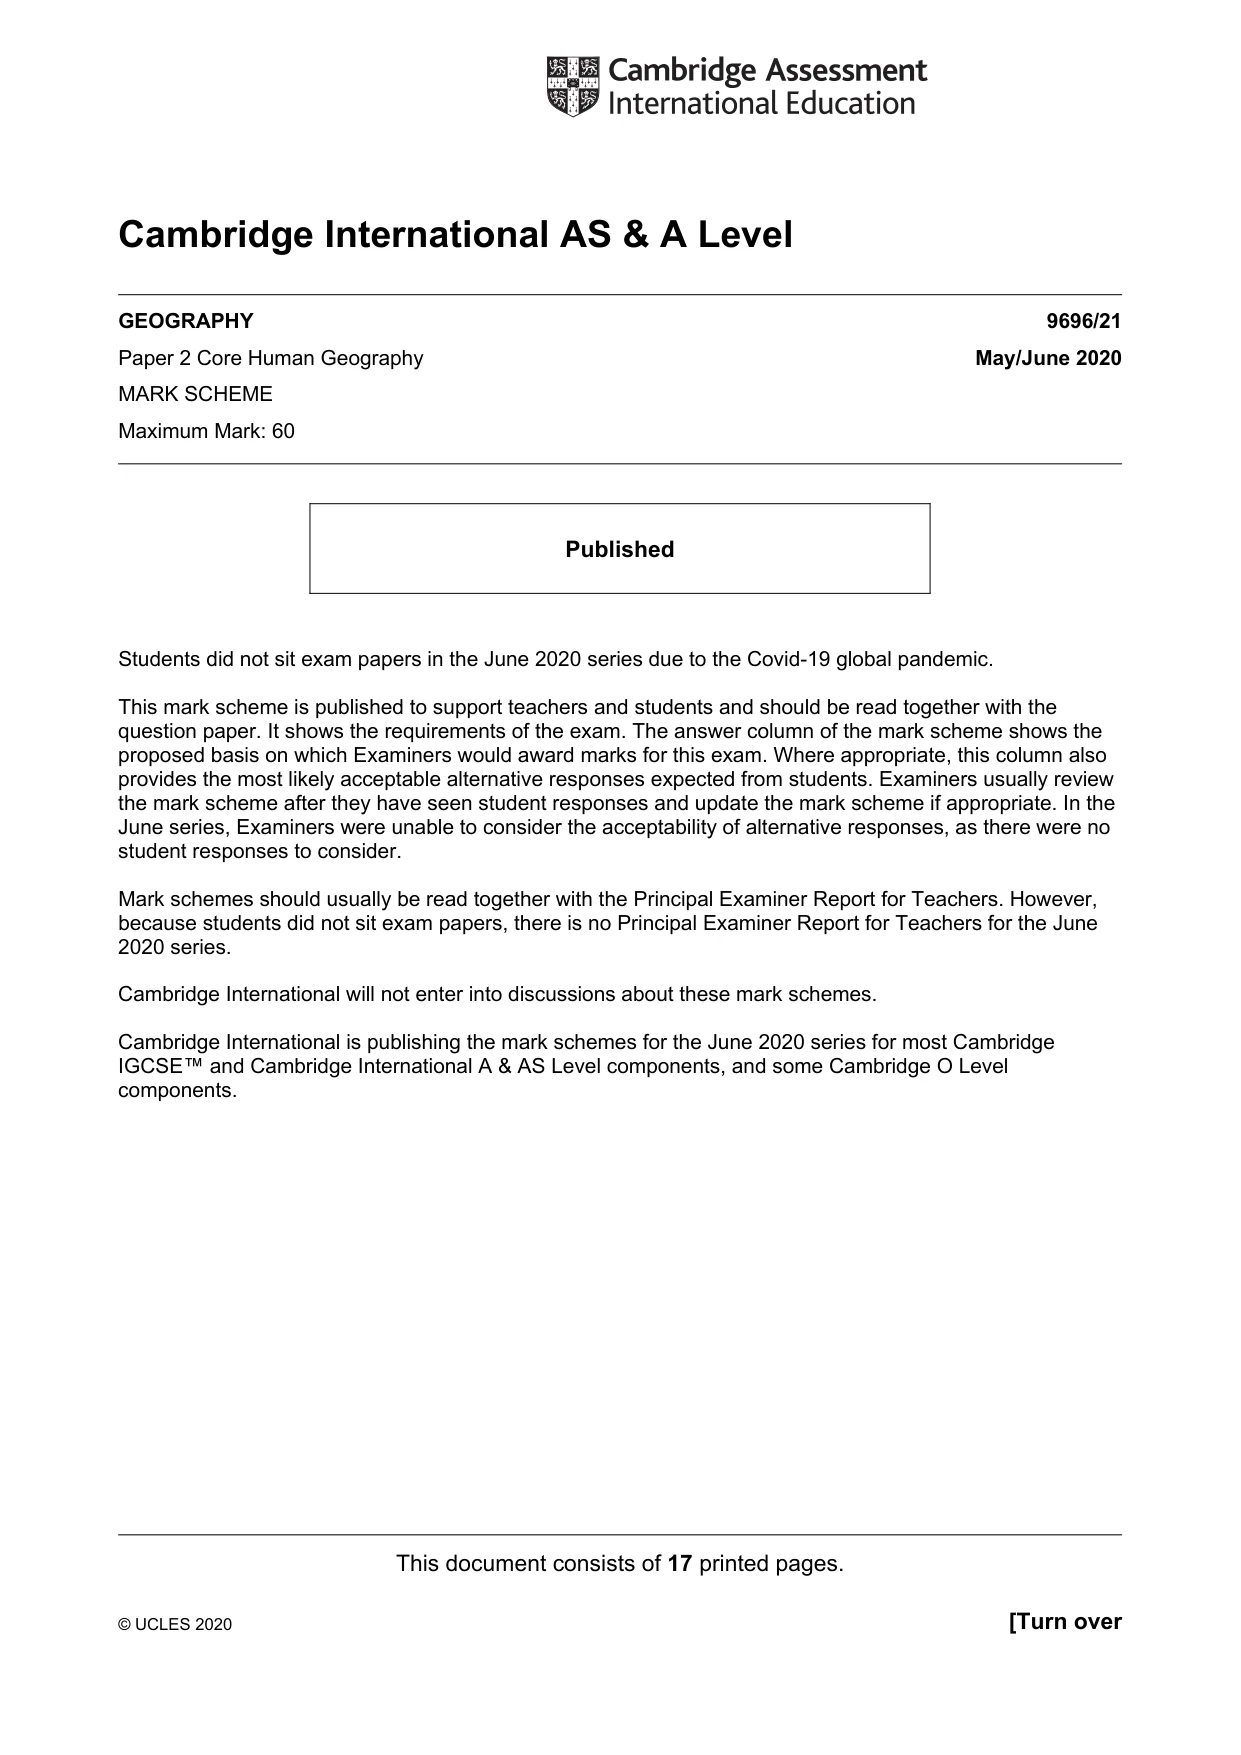
Mark scheme17 pages
Answers below. Sit the paper first if you are practising.

Questions as text
Q1 · Percentage of total live births by age group of mother in the USA, an HIC, in 1965 and…
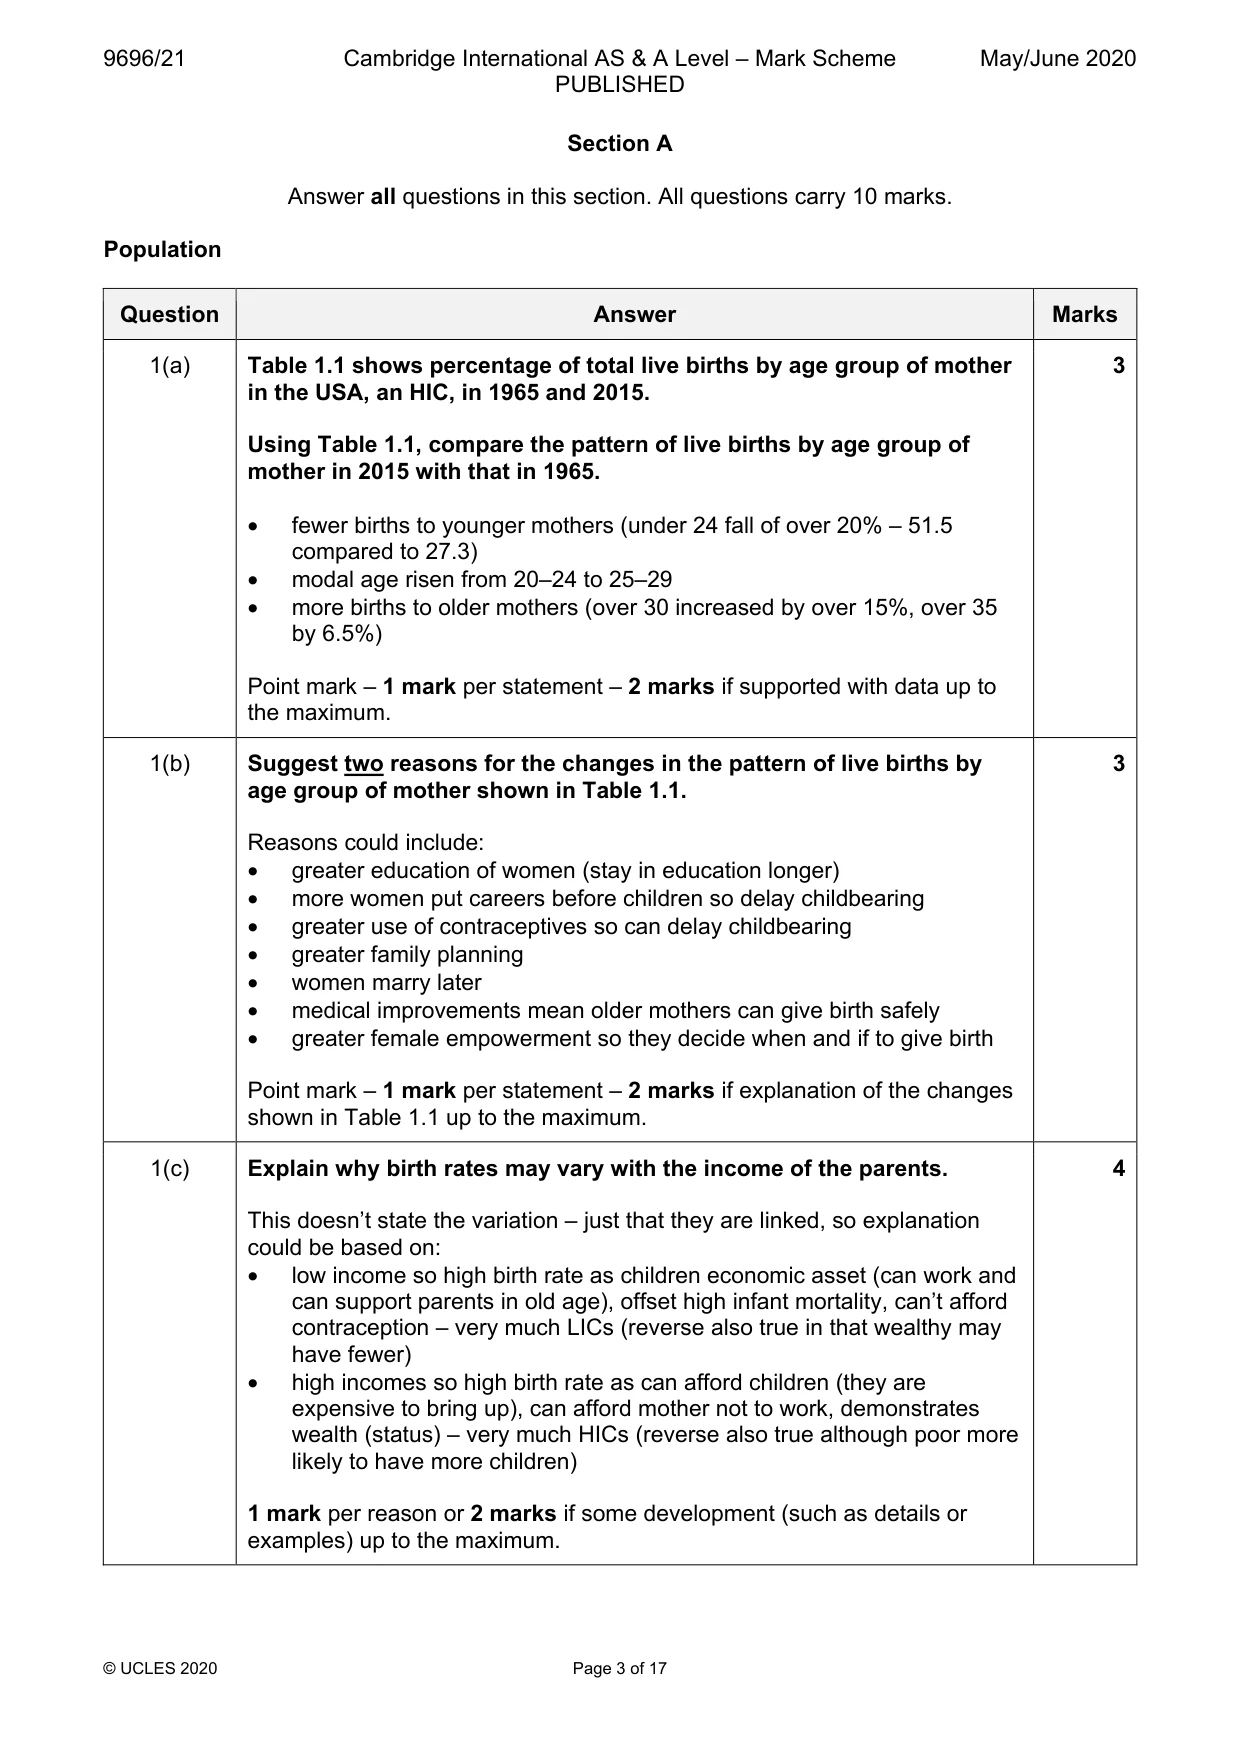
1 Table 1.1 shows percentage of total live births by age group of mother in the USA, an HIC, in 1965 and 2015. (a) Using Table 1.1, compare the pattern of live births by age group of mother in 2015 with that in 1965. [3] (b) Suggest two reasons for the changes in the pattern of live births by age group of mother shown in Table 1.1. [3] (c) Explain why birth rates may vary with the income of the parents. [4] Migration
Mark scheme: Question Answer Marks 1(a) Table 1.1 shows percentage of total live births by age group of mother 3 in the USA, an HIC, in 1965 and 2015. Using Table 1.1, compare the pattern of live births by age group of mother in 2015 with that in 1965. • fewer births to younger mothers (under 24 fall of over 20% – 51.5 compared to 27.3) • modal age risen from 20–24 to 25–29 • more births to older mothers (over 30 increased by over 15%, over 35 by 6.5%) Point mark – 1 mark per statement – 2 marks if supported with data up to the maximum. 1(b) Suggest two reasons for the changes in the pattern of live births by 3 age group of mother shown in Table 1.1. Reasons could include: • greater education of women (stay in education longer) • more women put careers before children so delay childbearing • greater use of contraceptives so can delay childbearing • greater family planning • women marry later • medical improvements mean older mothers can give birth safely • greater female empowerment so they decide when and if to give birth Point mark – 1 mark per statement – 2 marks if explanation of the changes shown in Table 1.1 up to the maximum. 1(c) Explain why birth rates may vary with the income of the parents. 4 This doesn’t state the variation – just that they are linked, so explanation could be based on: • low income so high birth rate as children economic asset (can work and can support parents in old age), offset high infant mortality, can’t afford contraception – very much LICs (reverse also true in that wealthy may have fewer) • high incomes so high birth rate as can afford children (they are expensive to bring up), can afford mother not to work, demonstrates wealth (status) – very much HICs (reverse also true although poor more likely to have more children) 1 mark per reason or 2 marks if some development (such as details or examples) up to the maximum. Migration
Q2 · The location of immigrants by region of residence in Brazil, an MIC in South America, in…
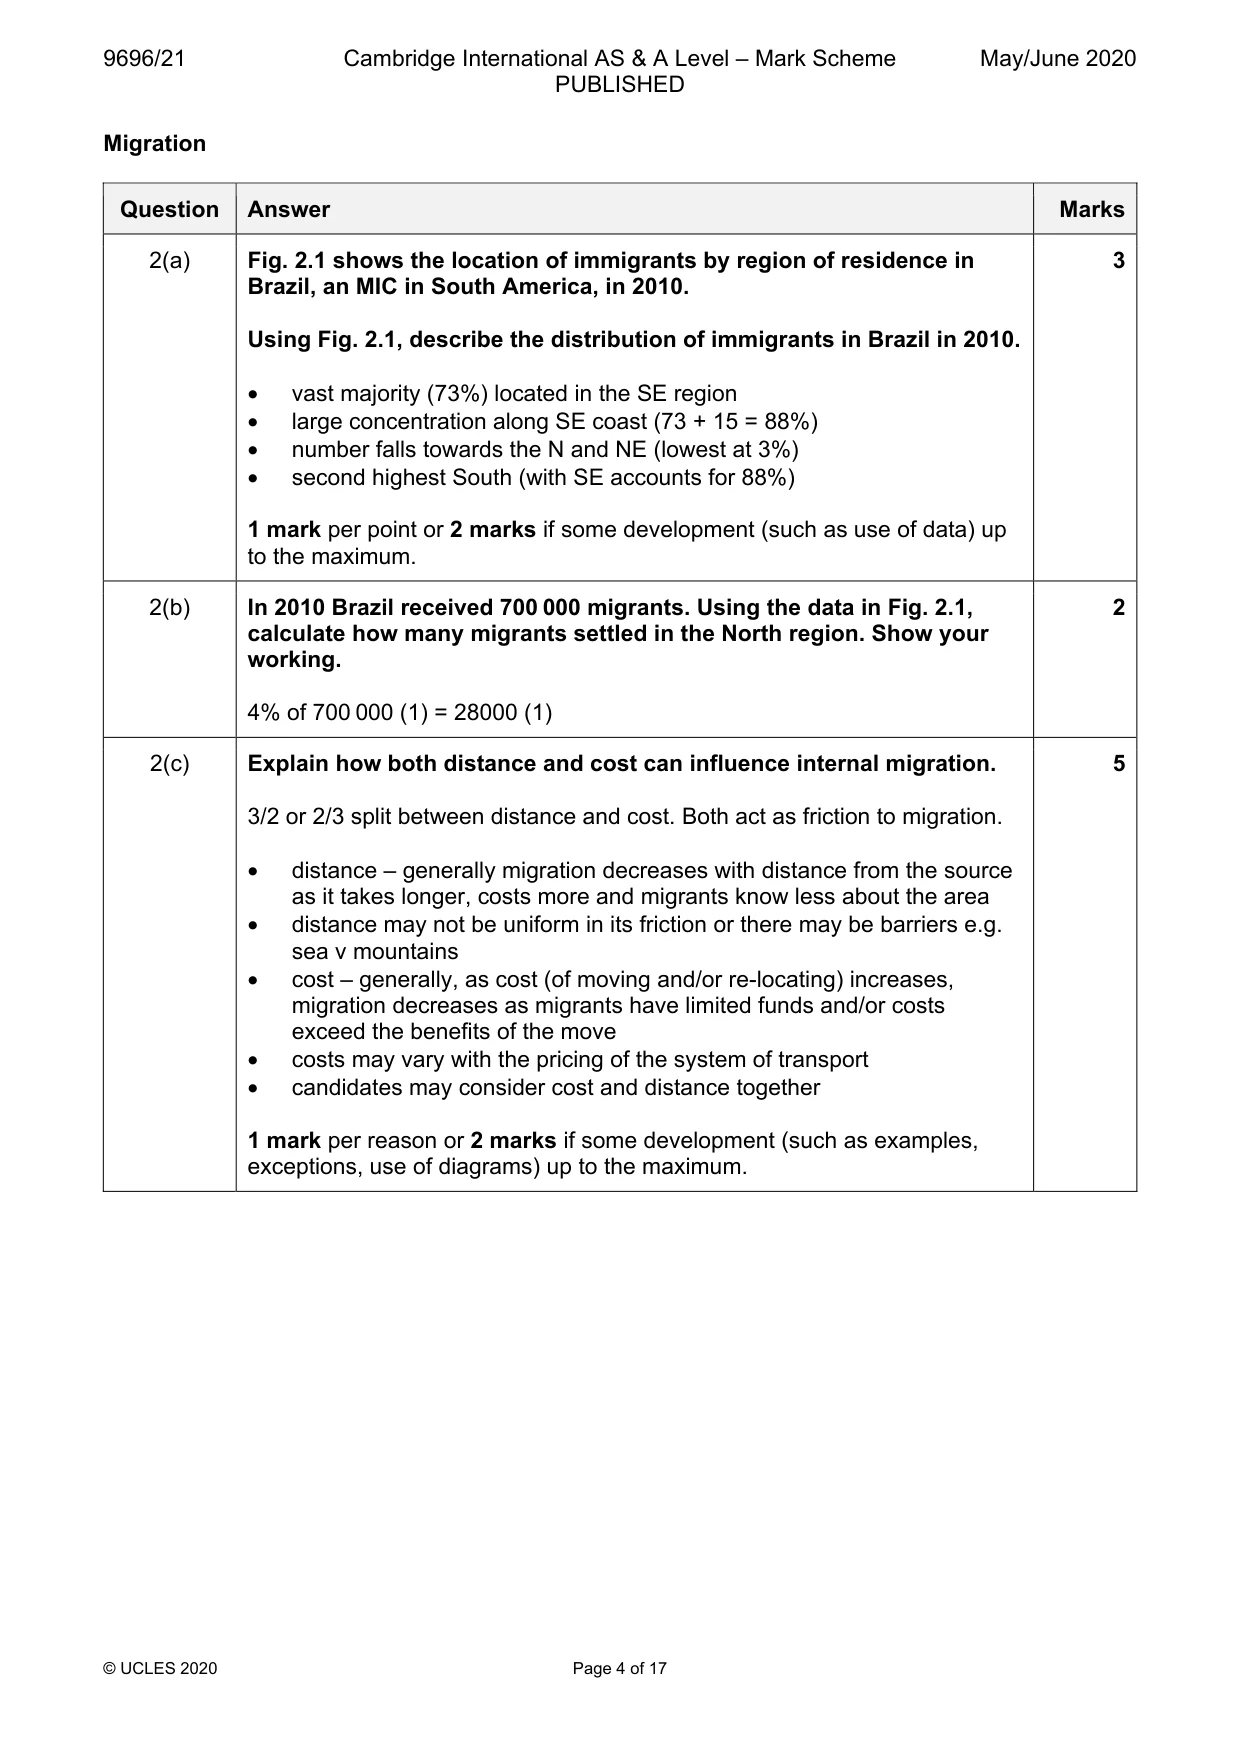
2 Fig. 2.1 shows the location of immigrants by region of residence in Brazil, an MIC in South America, in 2010. (a) Using Fig. 2.1, describe the distribution of immigrants in Brazil in 2010. [3] (b) In 2010 Brazil received 700,000 migrants. Using the data in Fig. 2.1, calculate how many migrants settled in the North region. Show your working. [2] (c) Explain how both distance and cost can influence internal migration. [5] Settlement dynamics
Mark scheme: 2(a) Fig. 2.1 shows the location of immigrants by region of residence in 3 Brazil, an MIC in South America, in 2010. Using Fig. 2.1, describe the distribution of immigrants in Brazil in 2010. • vast majority (73%) located in the SE region • large concentration along SE coast (73 + 15 = 88%) • number falls towards the N and NE (lowest at 3%) • second highest South (with SE accounts for 88%) 1 mark per point or 2 marks if some development (such as use of data) up to the maximum. 2(b) In 2010 Brazil received 700 000 migrants. Using the data in Fig. 2.1, 2 calculate how many migrants settled in the North region. Show your working. 4% of 700 000 (1) = 28000 (1) 2(c) Explain how both distance and cost can influence internal migration. 5 3/2 or 2/3 split between distance and cost. Both act as friction to migration. • distance – generally migration decreases with distance from the source as it takes longer, costs more and migrants know less about the area • distance may not be uniform in its friction or there may be barriers e.g. sea v mountains • cost – generally, as cost (of moving and/or re-locating) increases, migration decreases as migrants have limited funds and/or costs exceed the benefits of the move • costs may vary with the pricing of the system of transport • candidates may consider cost and distance together 1 mark per reason or 2 marks if some development (such as examples, exceptions, use of diagrams) up to the maximum. Settlement dynamics
Q3 · A photograph which shows an out-of-town retail park in an HIC in 2017
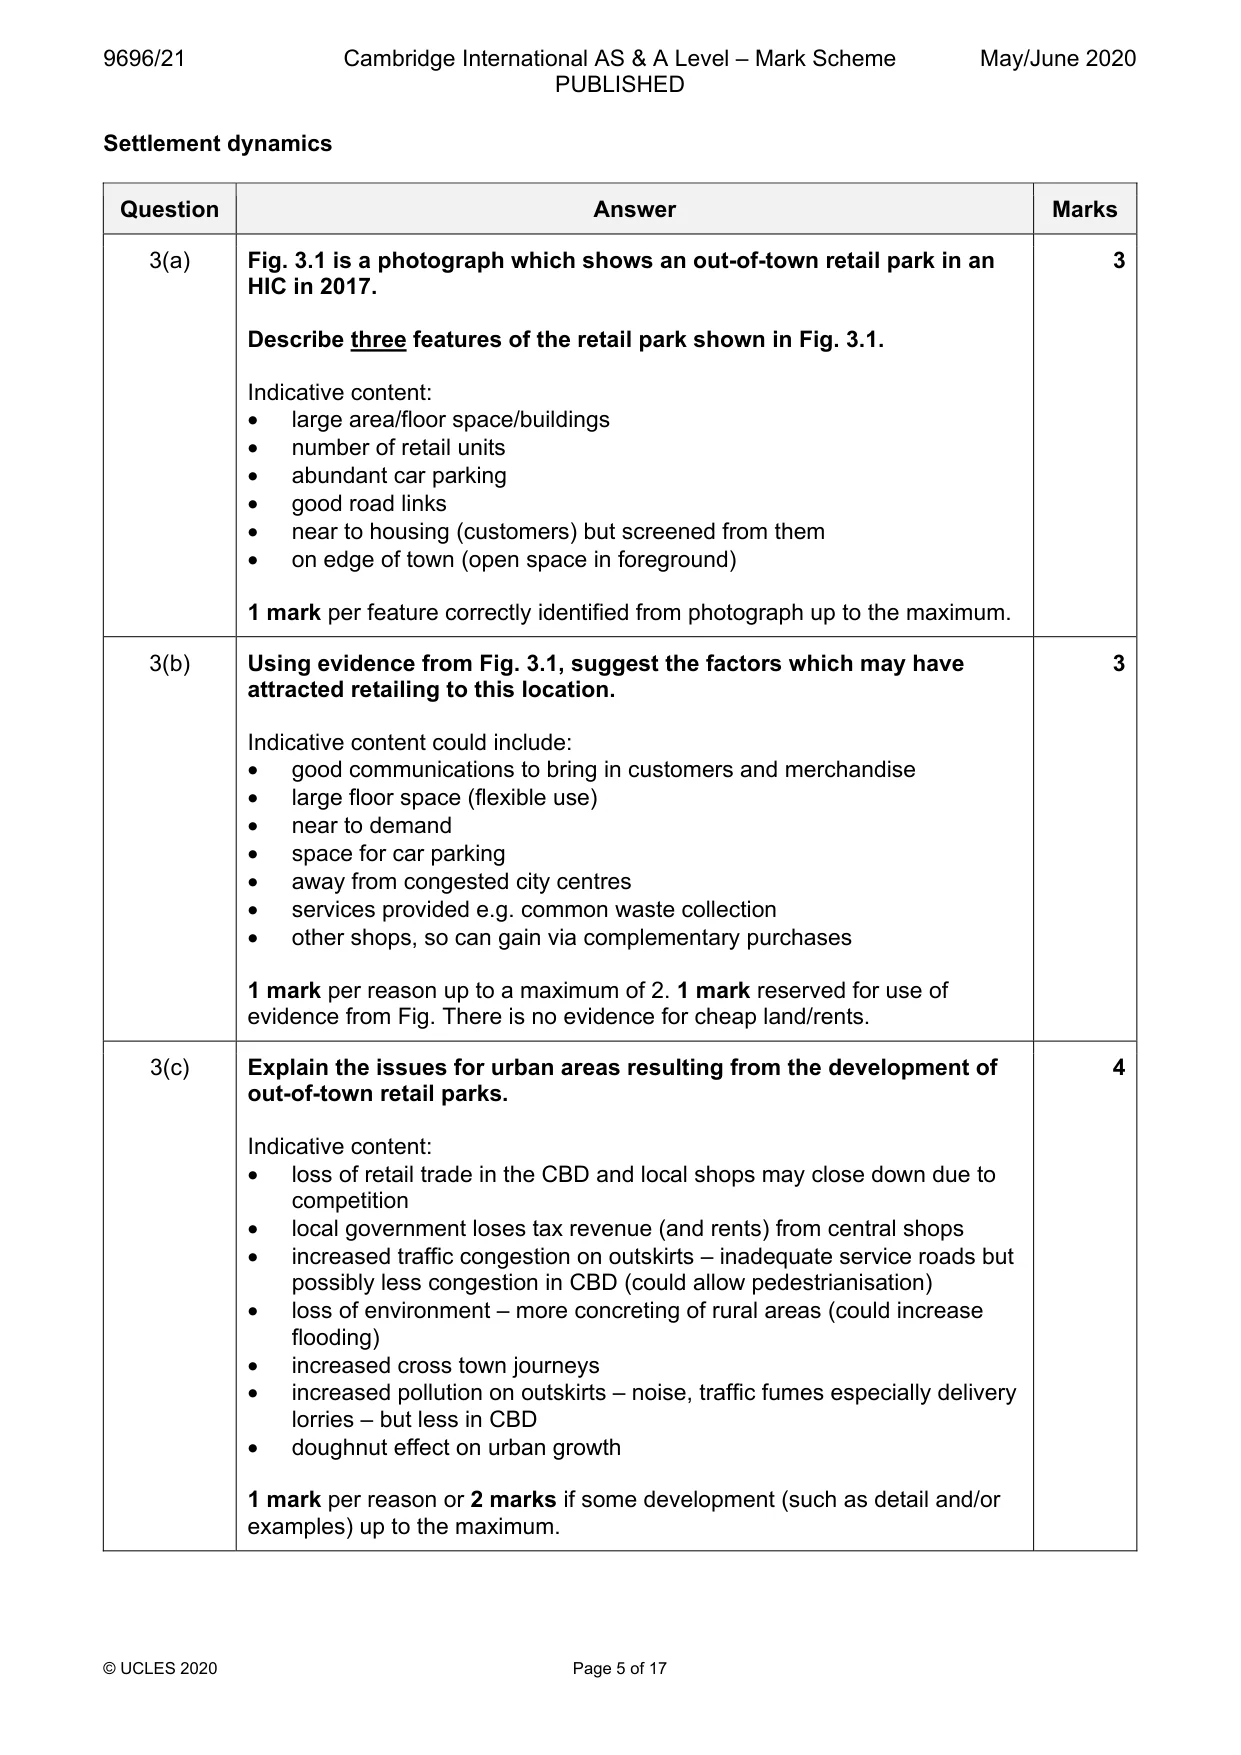
3 Fig. 3.1 is a photograph which shows an out-of-town retail park in an HIC in 2017. (a) Describe three features of the retail park shown in Fig. 3.1. [3] (b) Using evidence from Fig. 3.1, suggest the factors which may have attracted retailing to this location. [3] (c) Explain the issues for urban areas resulting from the development of out-of-town retail parks. [4]
Mark scheme: 3(a) Fig. 3.1 is a photograph which shows an out-of-town retail park in an 3 HIC in 2017. Describe three features of the retail park shown in Fig. 3.1. Indicative content: • large area/floor space/buildings • number of retail units • abundant car parking • good road links • near to housing (customers) but screened from them • on edge of town (open space in foreground) 1 mark per feature correctly identified from photograph up to the maximum. 3(b) Using evidence from Fig. 3.1, suggest the factors which may have 3 attracted retailing to this location. Indicative content could include: • good communications to bring in customers and merchandise • large floor space (flexible use) • near to demand • space for car parking • away from congested city centres • services provided e.g. common waste collection • other shops, so can gain via complementary purchases 1 mark per reason up to a maximum of 2. 1 mark reserved for use of evidence from Fig. There is no evidence for cheap land/rents. 3(c) Explain the issues for urban areas resulting from the development of 4 out-of-town retail parks. Indicative content: • loss of retail trade in the CBD and local shops may close down due to competition • local government loses tax revenue (and rents) from central shops • increased traffic congestion on outskirts – inadequate service roads but possibly less congestion in CBD (could allow pedestrianisation) • loss of environment – more concreting of rural areas (could increase flooding) • increased cross town journeys • increased pollution on outskirts – noise, traffic fumes especially delivery lorries – but less in CBD • doughnut effect on urban growth 1 mark per reason or 2 marks if some development (such as detail and/or examples) up to the maximum. Section B Answer one question from this section. All questions carry 30 marks. Population
Q4 · Define the concept of carrying capacity
4 (a) (i) Define the concept of carrying capacity. [3] (ii) Briefly explain two causes of food shortages. [4] (b) With the aid of examples, explain the factors that lead to increasing food production in an area. [8] (c) ‘Increasing wealth is putting excessive pressure on food production.’ With the aid of examples, how far do you agree? [15] Population/Migration/Settlement dynamics
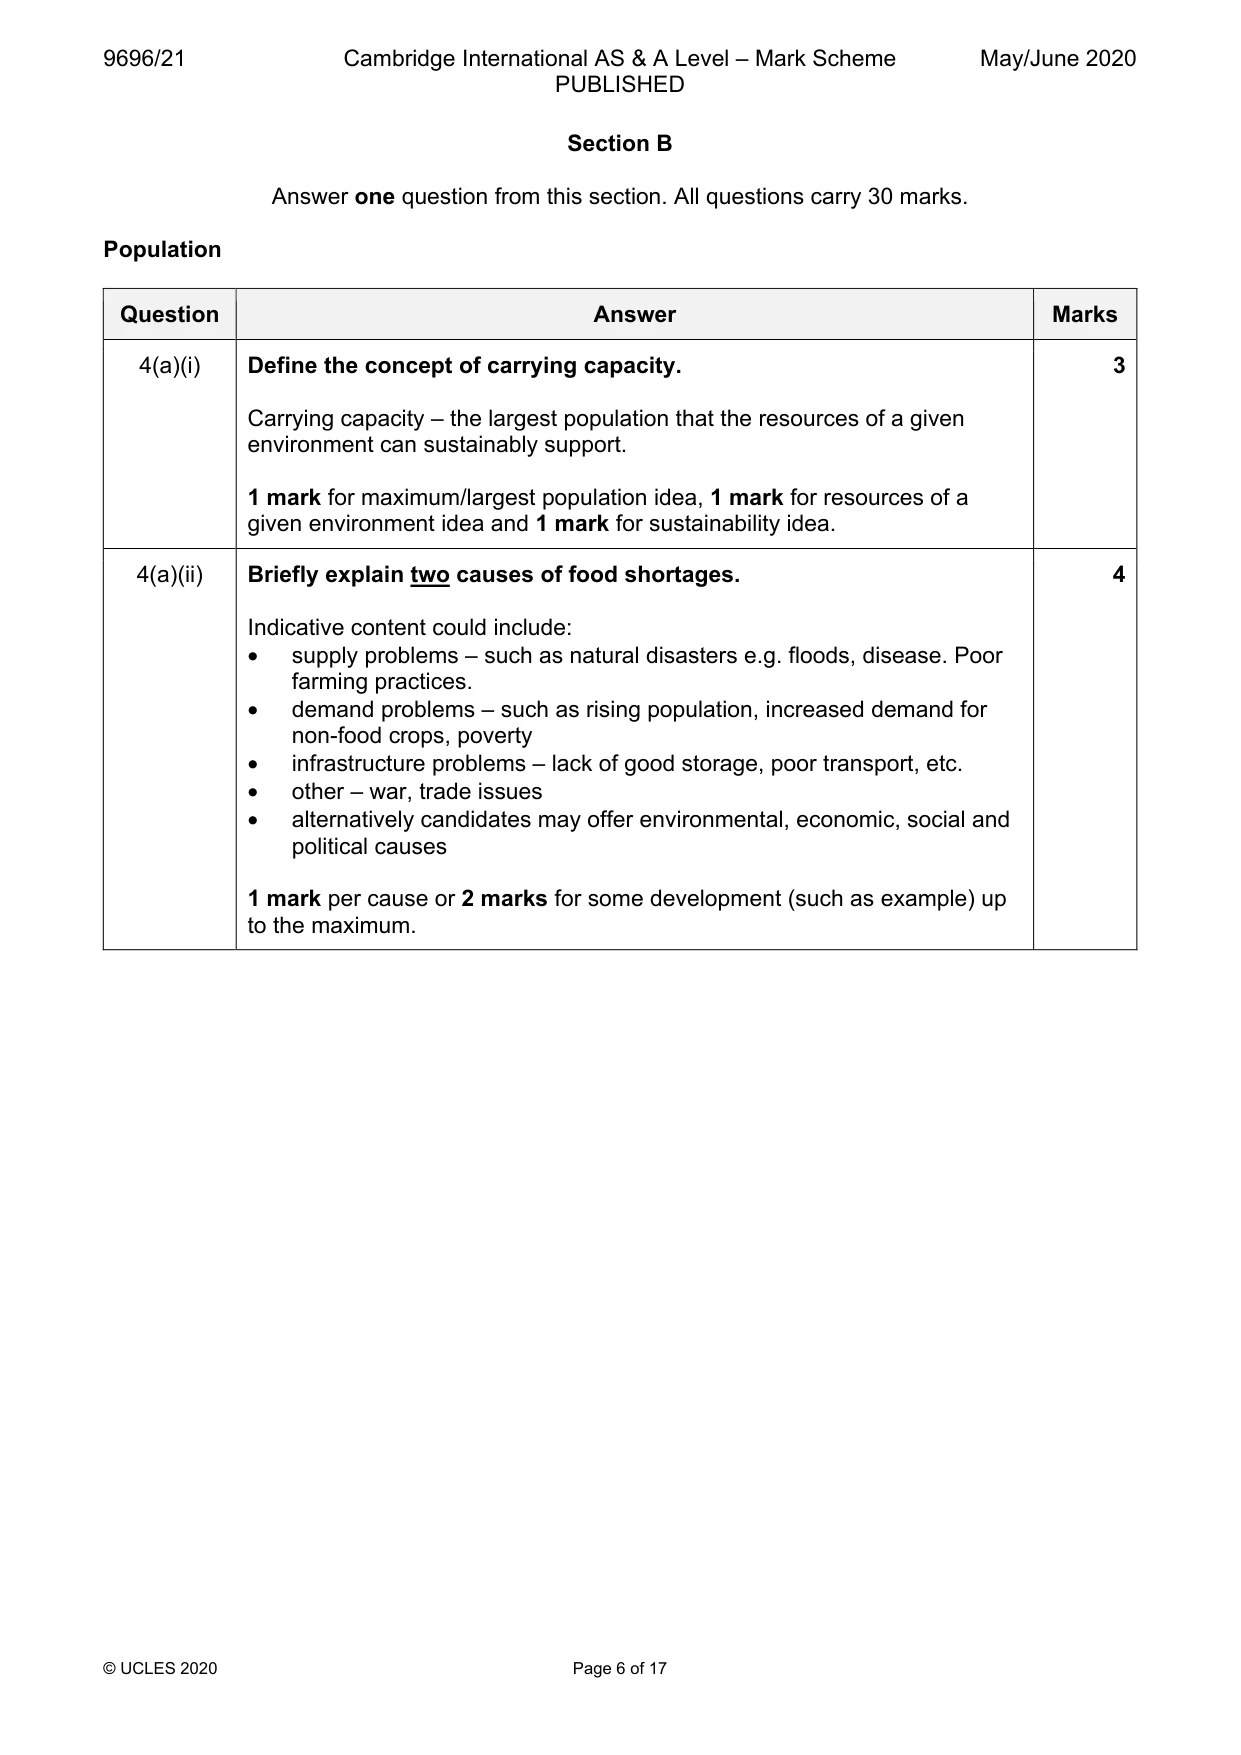
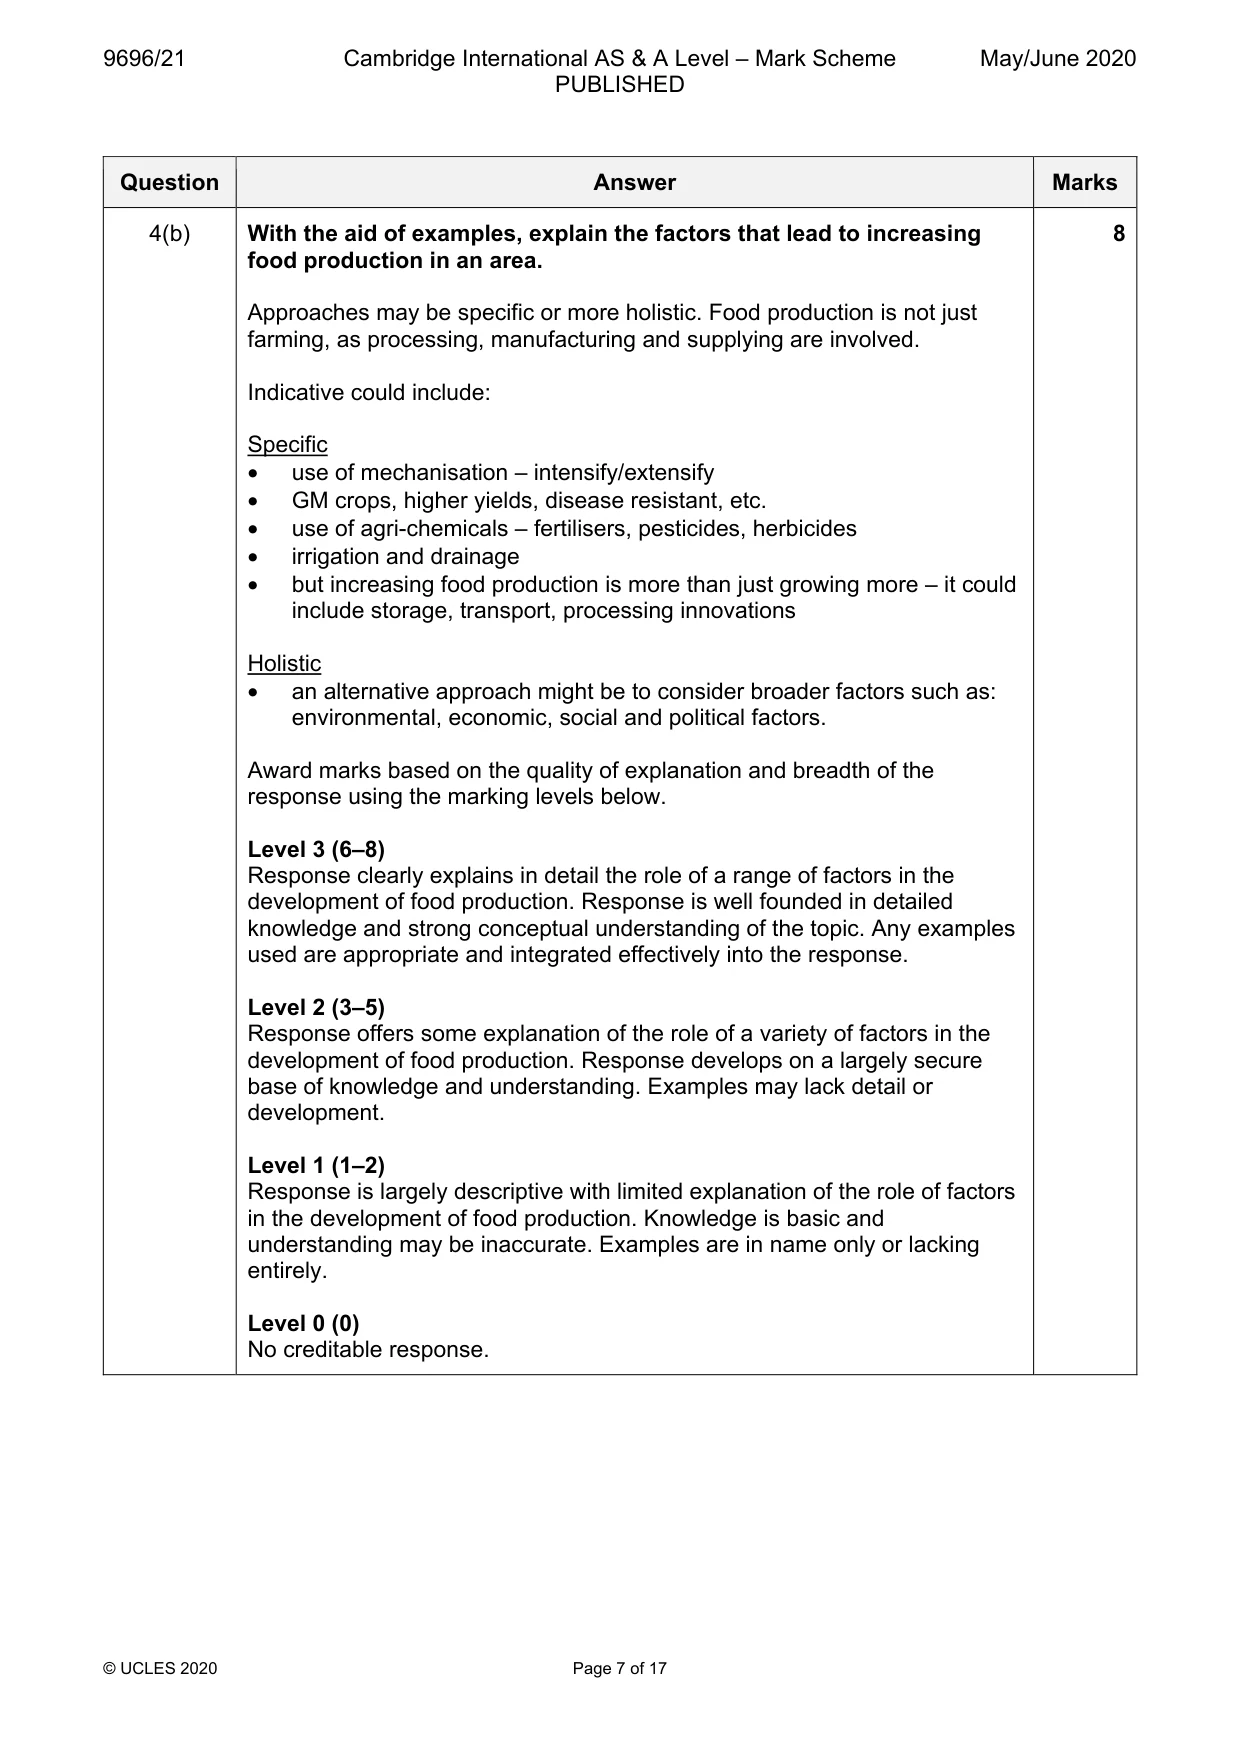
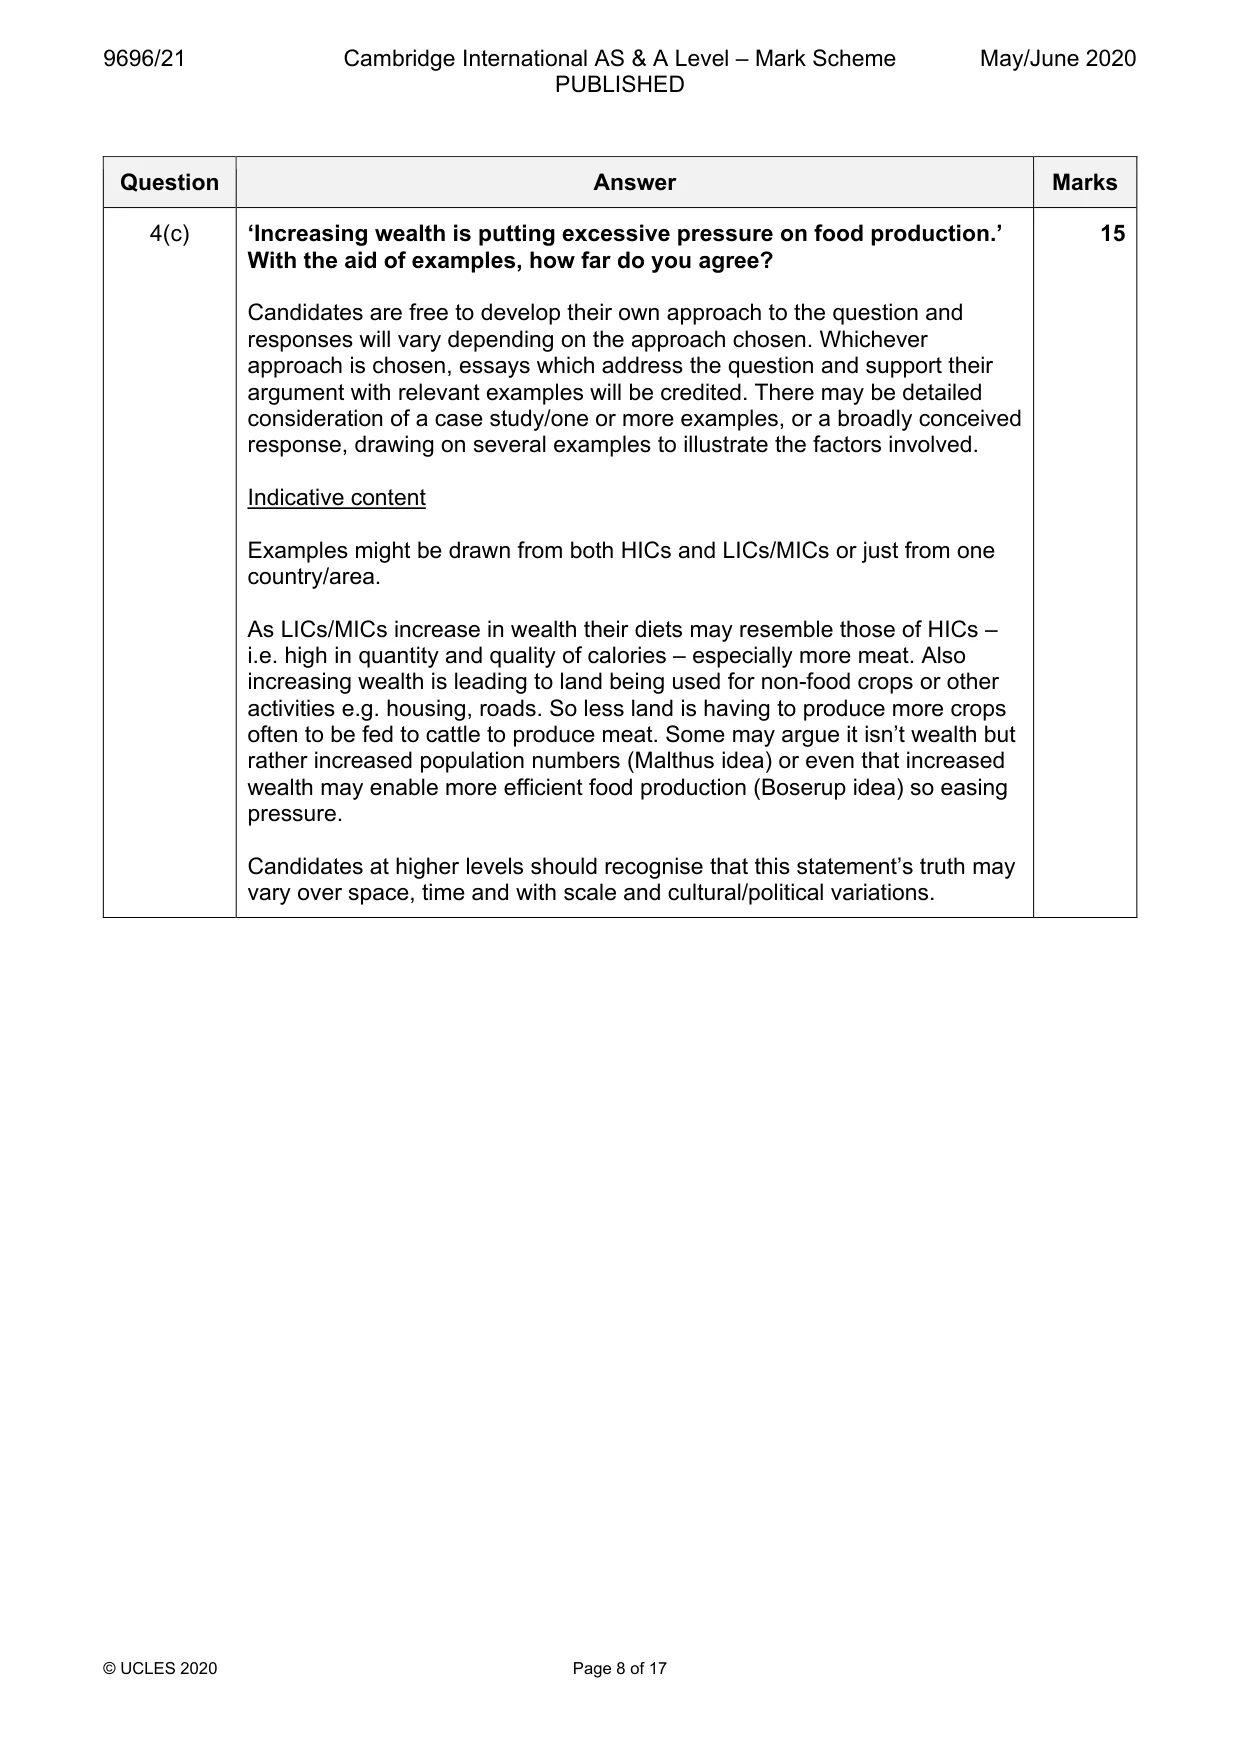
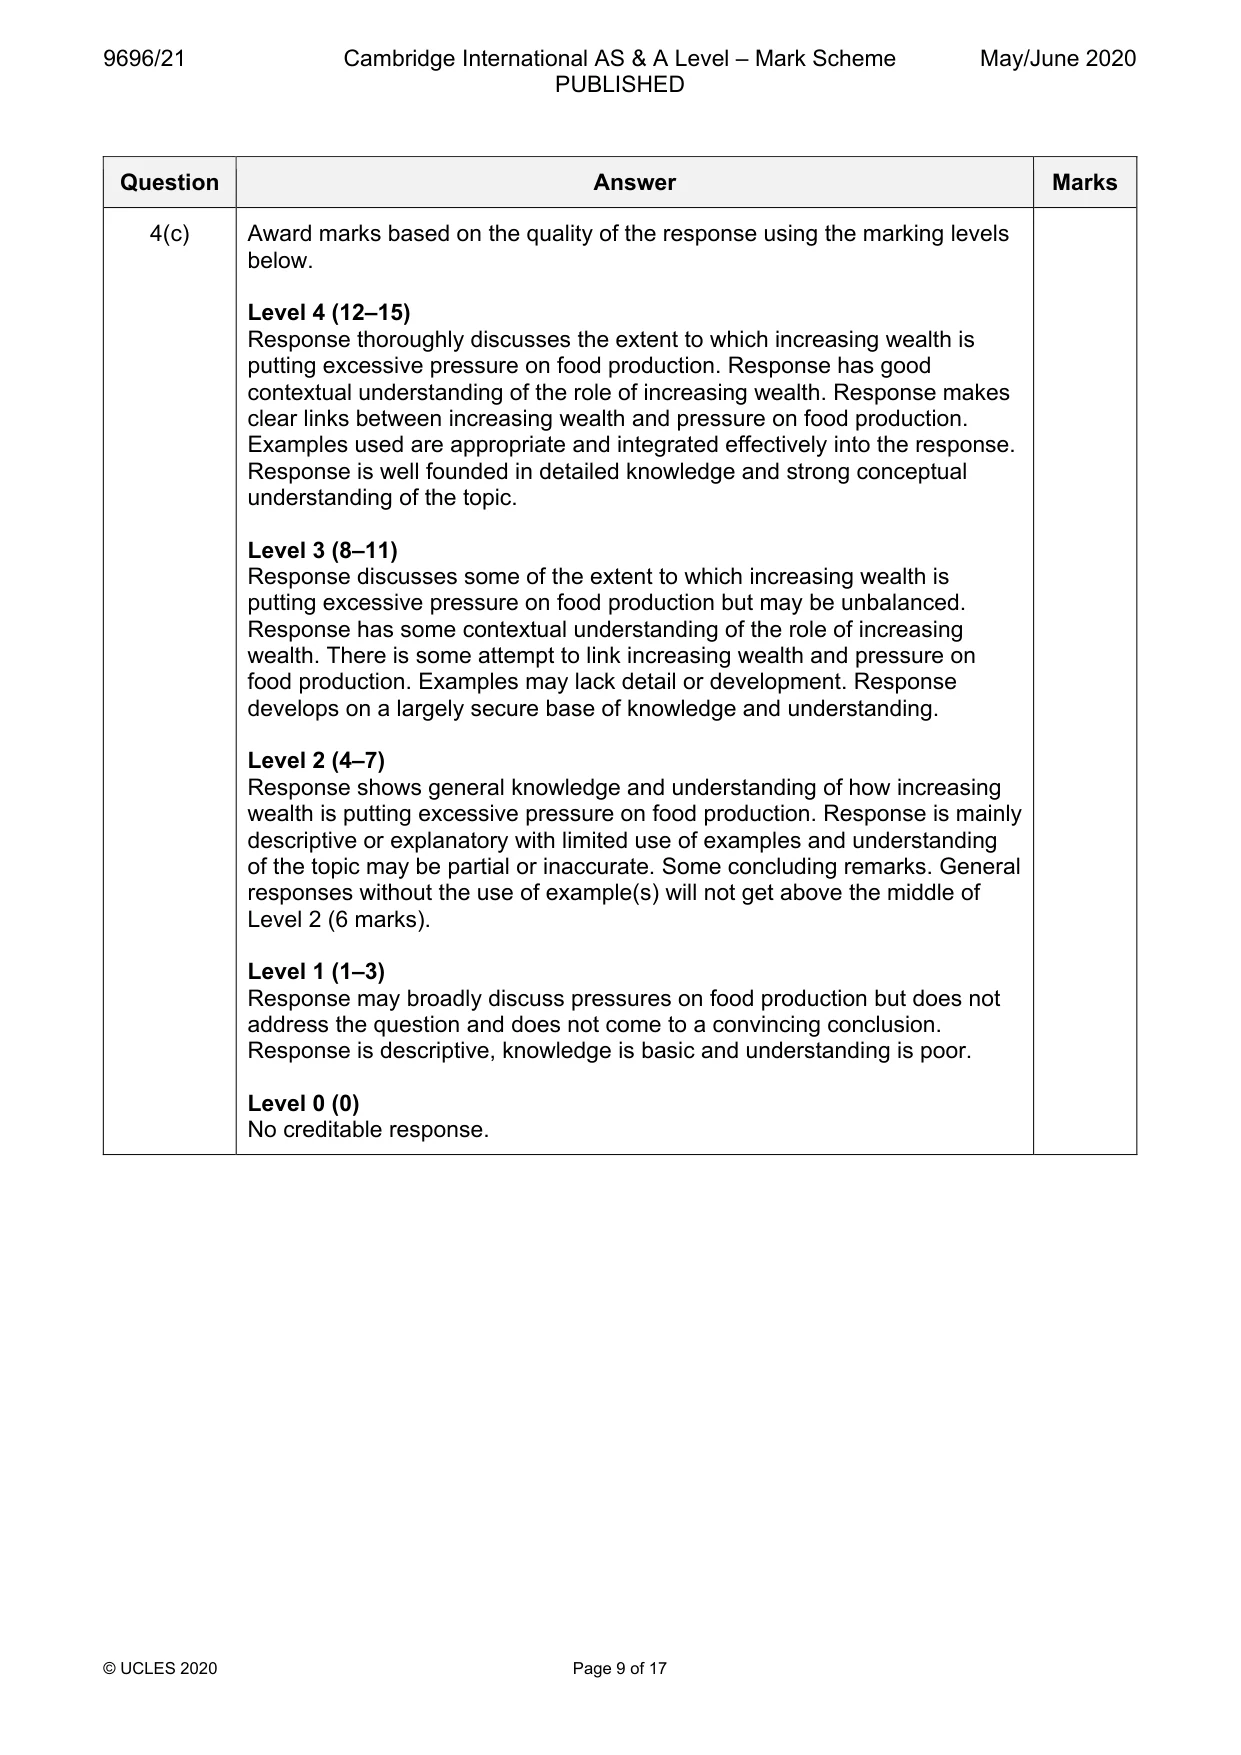
Mark scheme: 4(a)(i) Define the concept of carrying capacity. 3 Carrying capacity – the largest population that the resources of a given environment can sustainably support. 1 mark for maximum/largest population idea, 1 mark for resources of a given environment idea and 1 mark for sustainability idea. 4(a)(ii) Briefly explain two causes of food shortages. 4 Indicative content could include: • supply problems – such as natural disasters e.g. floods, disease. Poor farming practices. • demand problems – such as rising population, increased demand for non-food crops, poverty • infrastructure problems – lack of good storage, poor transport, etc. • other – war, trade issues • alternatively candidates may offer environmental, economic, social and political causes 1 mark per cause or 2 marks for some development (such as example) up to the maximum. Question Answer Marks 4(b) With the aid of examples, explain the factors that lead to increasing 8 food production in an area. Approaches may be specific or more holistic. Food production is not just farming, as processing, manufacturing and supplying are involved. Indicative could include: Specific • use of mechanisation – intensify/extensify • GM crops, higher yields, disease resistant, etc. • use of agri-chemicals – fertilisers, pesticides, herbicides • irrigation and drainage • but increasing food production is more than just growing more – it could include storage, transport, processing innovations Holistic • an alternative approach might be to consider broader factors such as: environmental, economic, social and political factors. Award marks based on the quality of explanation and breadth of the response using the marking levels below. Level 3 (6–8) Response clearly explains in detail the role of a range of factors in the development of food production. Response is well founded in detailed knowledge and strong conceptual understanding of the topic. Any examples used are appropriate and integrated effectively into the response. Level 2 (3–5) Response offers some explanation of the role of a variety of factors in the development of food production. Response develops on a largely secure base of knowledge and understanding. Examples may lack detail or development. Level 1 (1–2) Response is largely descriptive with limited explanation of the role of factors in the development of food production. Knowledge is basic and understanding may be inaccurate. Examples are in name only or lacking entirely. Level 0 (0) No creditable response. Question Answer Marks 4(c) ‘Increasing wealth is putting excessive pressure on food production.’ 15 With the aid of examples, how far do you agree? Candidates are free to develop their own approach to the question and responses will vary depending on the approach chosen. Whichever approach is chosen, essays which address the question and support their argument with relevant examples will be credited. There may be detailed consideration of a case study/one or more examples, or a broadly conceived response, drawing on several examples to illustrate the factors involved. Indicative content Examples might be drawn from both HICs and LICs/MICs or just from one country/area. As LICs/MICs increase in wealth their diets may resemble those of HICs – i.e. high in quantity and quality of calories – especially more meat. Also increasing wealth is leading to land being used for non-food crops or other activities e.g. housing, roads. So less land is having to produce more crops often to be fed to cattle to produce meat. Some may argue it isn’t wealth but rather increased population numbers (Malthus idea) or even that increased wealth may enable more efficient food production (Boserup idea) so easing pressure. Candidates at higher levels should recognise that this statement’s truth may vary over space, time and with scale and cultural/political variations. Question Answer Marks 4(c) Award marks based on the quality of the response using the marking levels below. Level 4 (12–15) Response thoroughly discusses the extent to which increasing wealth is putting excessive pressure on food production. Response has good contextual understanding of the role of increasing wealth. Response makes clear links between increasing wealth and pressure on food production. Examples used are appropriate and integrated effectively into the response. Response is well founded in detailed knowledge and strong conceptual understanding of the topic. Level 3 (8–11) Response discusses some of the extent to which increasing wealth is putting excessive pressure on food production but may be unbalanced. Response has some contextual understanding of the role of increasing wealth. There is some attempt to link increasing wealth and pressure on food production. Examples may lack detail or development. Response develops on a largely secure base of knowledge and understanding. Level 2 (4–7) Response shows general knowledge and understanding of how increasing wealth is putting excessive pressure on food production. Response is mainly descriptive or explanatory with limited use of examples and understanding of the topic may be partial or inaccurate. Some concluding remarks. General responses without the use of example(s) will not get above the middle of Level 2 (6 marks). Level 1 (1–3) Response may broadly discuss pressures on food production but does not address the question and does not come to a convincing conclusion. Response is descriptive, knowledge is basic and understanding is poor. Level 0 (0) No creditable response. Population/Migration/Settlement dynamics
Q5 · Contrast the features of urban-rural migration with the features of rural-urban migration…
5 (a) Contrast the features of urban-rural migration with the features of rural-urban migration in HICs. [7] (b) Explain the impact of rural-urban migration on population structures of LICs/MICs for both source and receiving/destination areas. [8] (c) With the aid of examples, how far do you agree that it is the number of rural-urban migrants that cause the greatest problem for receiving/destination areas? [15] Migration/Settlement dynamics
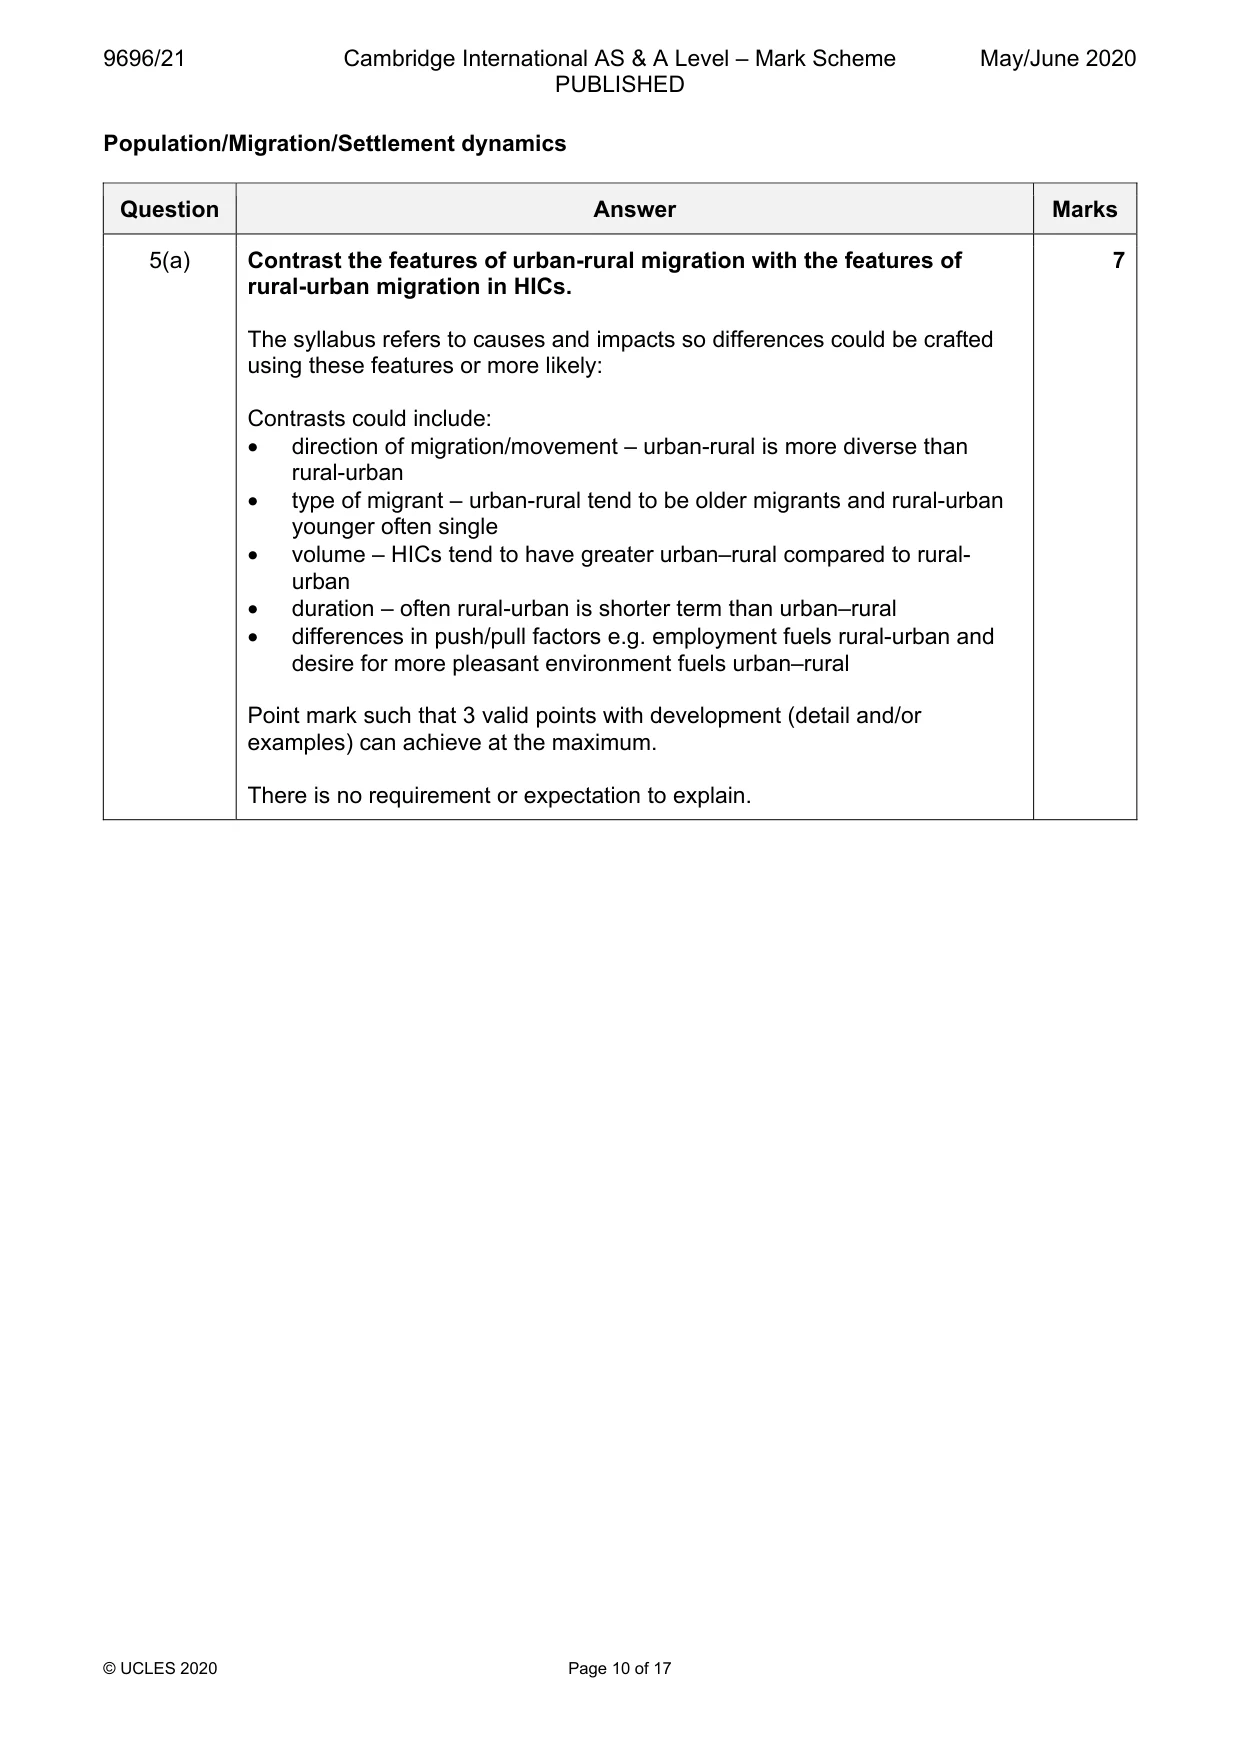
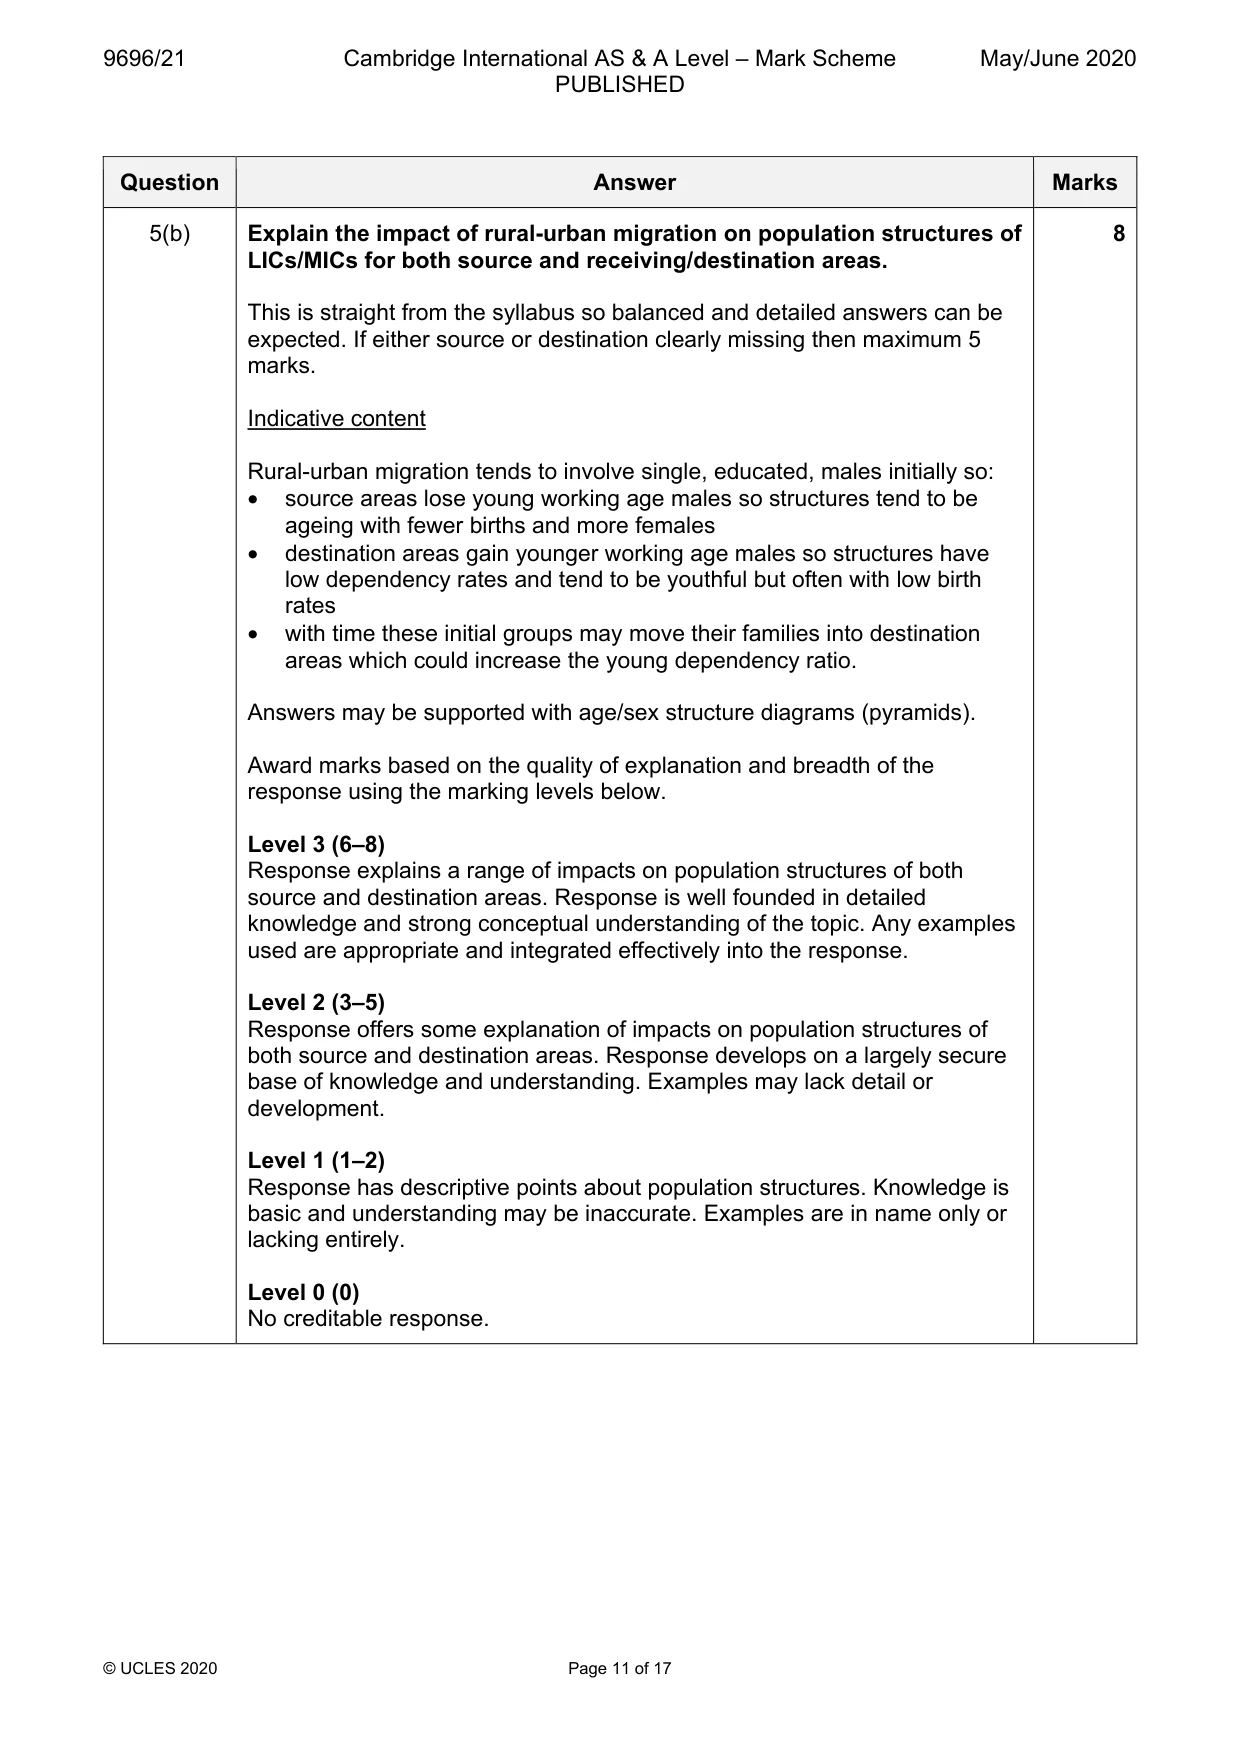
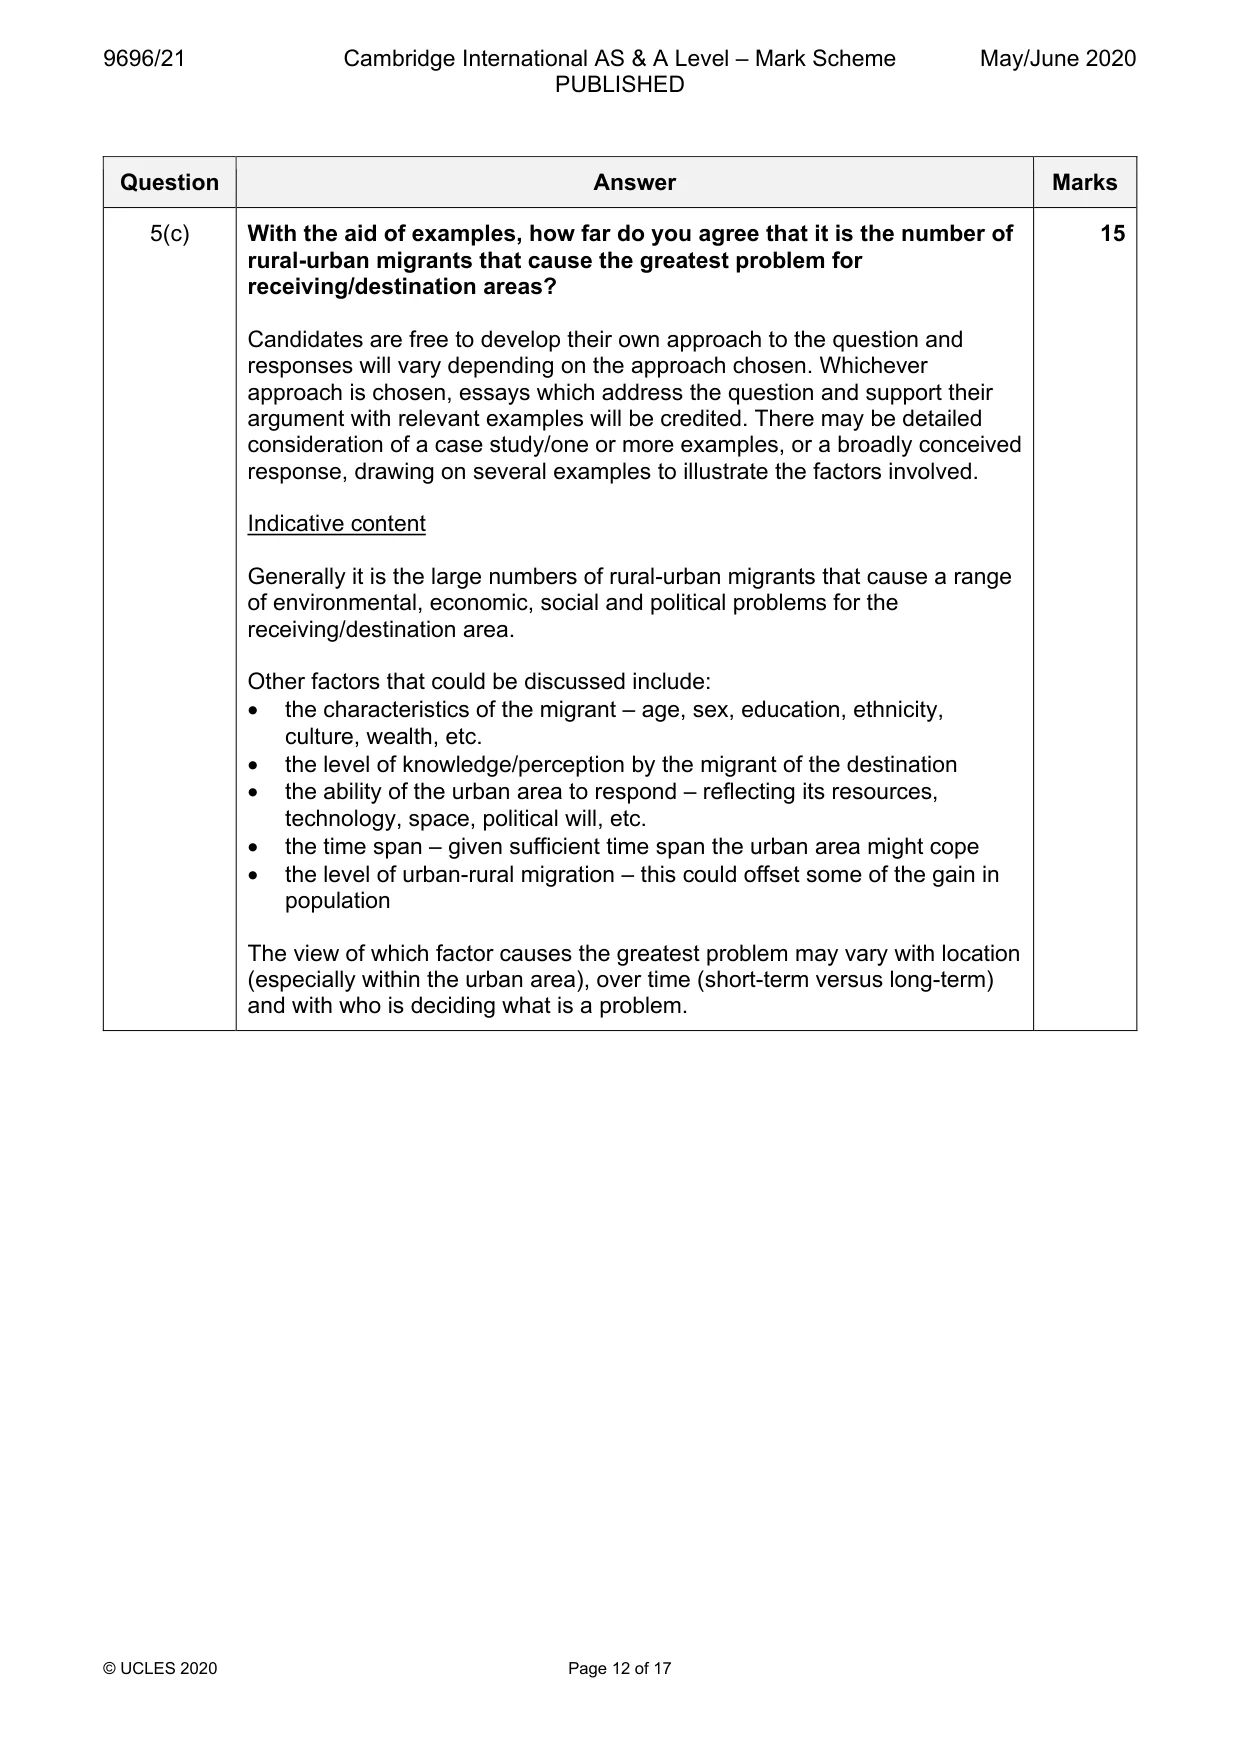
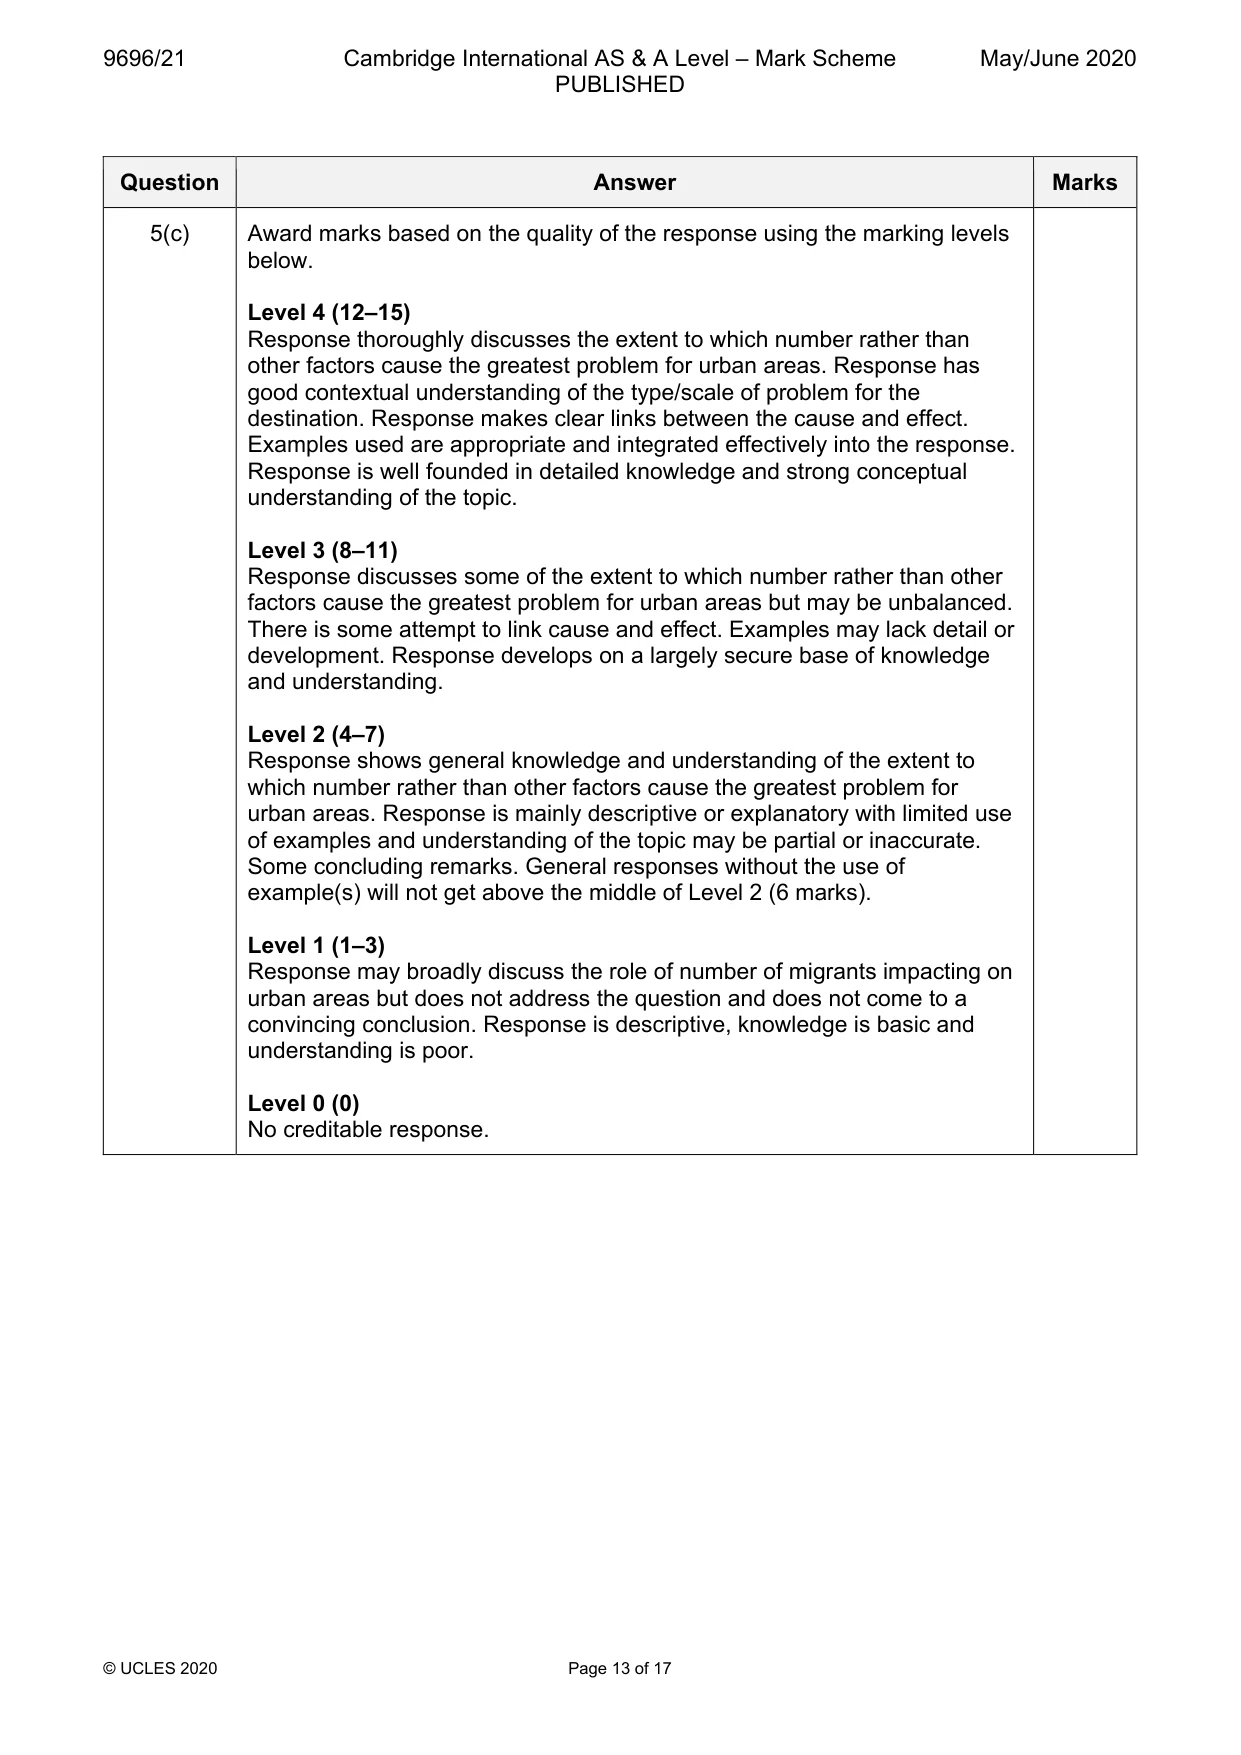
Mark scheme: 5(a) Contrast the features of urban-rural migration with the features of 7 rural-urban migration in HICs. The syllabus refers to causes and impacts so differences could be crafted using these features or more likely: Contrasts could include: • direction of migration/movement – urban-rural is more diverse than rural-urban • type of migrant – urban-rural tend to be older migrants and rural-urban younger often single • volume – HICs tend to have greater urban–rural compared to rural- urban • duration – often rural-urban is shorter term than urban–rural • differences in push/pull factors e.g. employment fuels rural-urban and desire for more pleasant environment fuels urban–rural Point mark such that 3 valid points with development (detail and/or examples) can achieve at the maximum. There is no requirement or expectation to explain. Question Answer Marks 5(b) Explain the impact of rural-urban migration on population structures of 8 LICs/MICs for both source and receiving/destination areas. This is straight from the syllabus so balanced and detailed answers can be expected. If either source or destination clearly missing then maximum 5 marks. Indicative content Rural-urban migration tends to involve single, educated, males initially so: • source areas lose young working age males so structures tend to be ageing with fewer births and more females • destination areas gain younger working age males so structures have low dependency rates and tend to be youthful but often with low birth rates • with time these initial groups may move their families into destination areas which could increase the young dependency ratio. Answers may be supported with age/sex structure diagrams (pyramids). Award marks based on the quality of explanation and breadth of the response using the marking levels below. Level 3 (6–8) Response explains a range of impacts on population structures of both source and destination areas. Response is well founded in detailed knowledge and strong conceptual understanding of the topic. Any examples used are appropriate and integrated effectively into the response. Level 2 (3–5) Response offers some explanation of impacts on population structures of both source and destination areas. Response develops on a largely secure base of knowledge and understanding. Examples may lack detail or development. Level 1 (1–2) Response has descriptive points about population structures. Knowledge is basic and understanding may be inaccurate. Examples are in name only or lacking entirely. Level 0 (0) No creditable response. Question Answer Marks 5(c) With the aid of examples, how far do you agree that it is the number of 15 rural-urban migrants that cause the greatest problem for receiving/destination areas? Candidates are free to develop their own approach to the question and responses will vary depending on the approach chosen. Whichever approach is chosen, essays which address the question and support their argument with relevant examples will be credited. There may be detailed consideration of a case study/one or more examples, or a broadly conceived response, drawing on several examples to illustrate the factors involved. Indicative content Generally it is the large numbers of rural-urban migrants that cause a range of environmental, economic, social and political problems for the receiving/destination area. Other factors that could be discussed include: • the characteristics of the migrant – age, sex, education, ethnicity, culture, wealth, etc. • the level of knowledge/perception by the migrant of the destination • the ability of the urban area to respond – reflecting its resources, technology, space, political will, etc. • the time span – given sufficient time span the urban area might cope • the level of urban-rural migration – this could offset some of the gain in population The view of which factor causes the greatest problem may vary with location (especially within the urban area), over time (short-term versus long-term) and with who is deciding what is a problem. Question Answer Marks 5(c) Award marks based on the quality of the response using the marking levels below. Level 4 (12–15) Response thoroughly discusses the extent to which number rather than other factors cause the greatest problem for urban areas. Response has good contextual understanding of the type/scale of problem for the destination. Response makes clear links between the cause and effect. Examples used are appropriate and integrated effectively into the response. Response is well founded in detailed knowledge and strong conceptual understanding of the topic. Level 3 (8–11) Response discusses some of the extent to which number rather than other factors cause the greatest problem for urban areas but may be unbalanced. There is some attempt to link cause and effect. Examples may lack detail or development. Response develops on a largely secure base of knowledge and understanding. Level 2 (4–7) Response shows general knowledge and understanding of the extent to which number rather than other factors cause the greatest problem for urban areas. Response is mainly descriptive or explanatory with limited use of examples and understanding of the topic may be partial or inaccurate. Some concluding remarks. General responses without the use of example(s) will not get above the middle of Level 2 (6 marks). Level 1 (1–3) Response may broadly discuss the role of number of migrants impacting on urban areas but does not address the question and does not come to a convincing conclusion. Response is descriptive, knowledge is basic and understanding is poor. Level 0 (0) No creditable response. Migration/Settlement dynamics
Q6 · Define the terms counterurbanisation and re-urbanisation
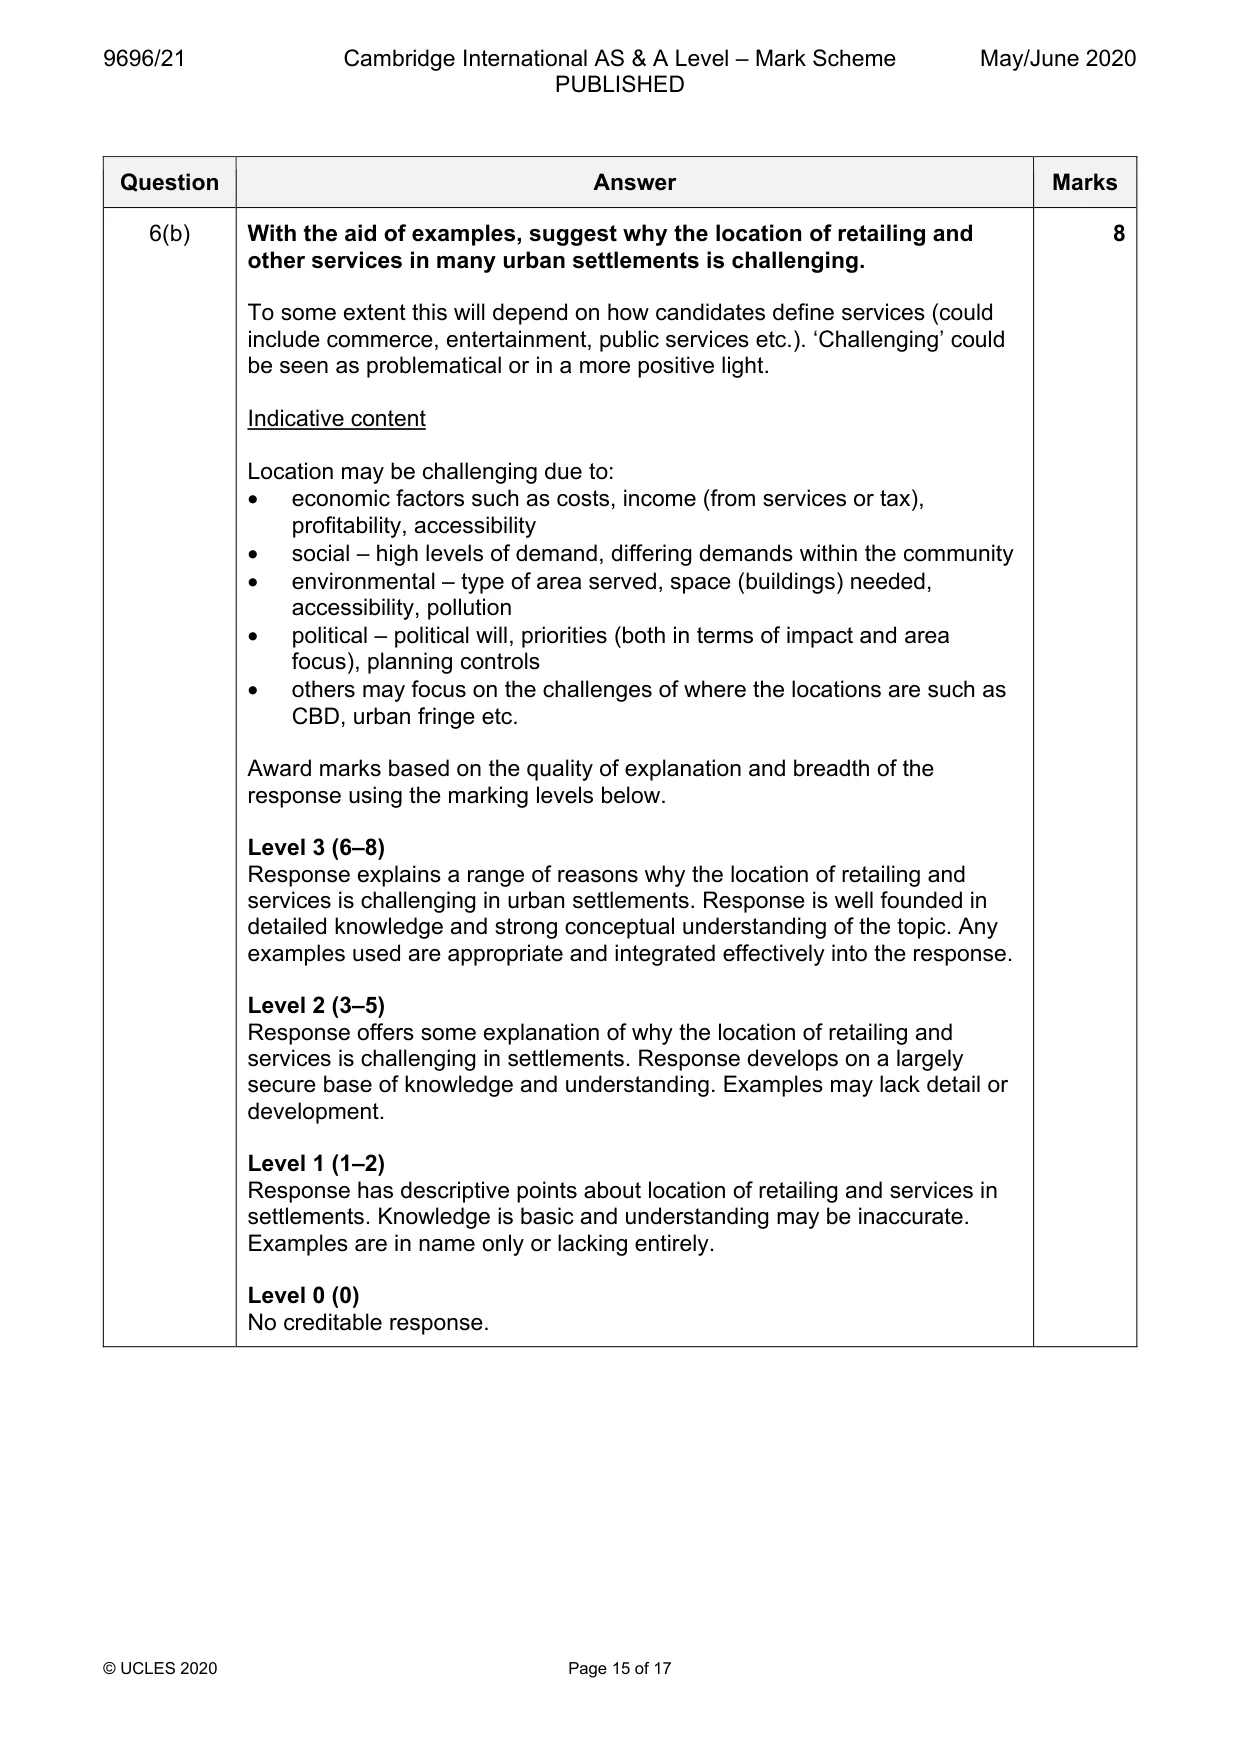
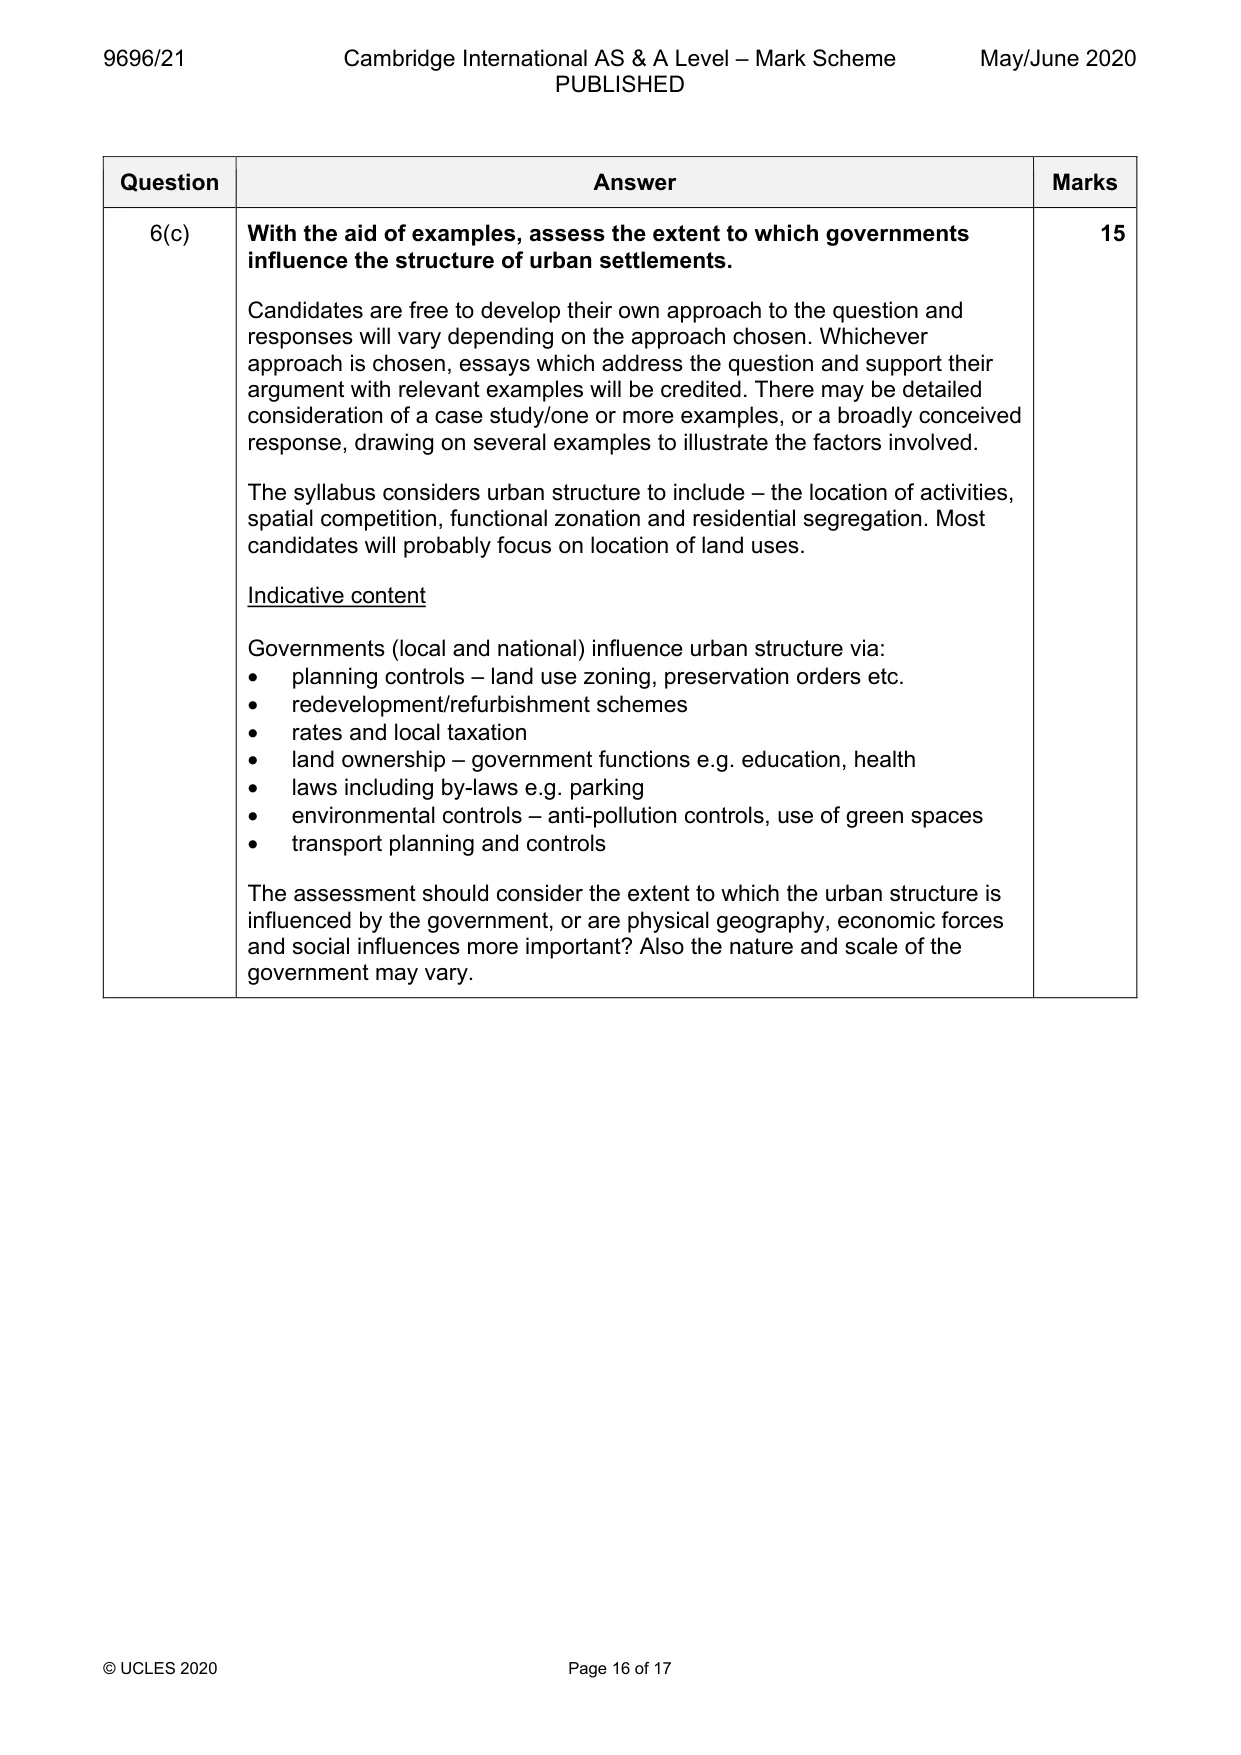
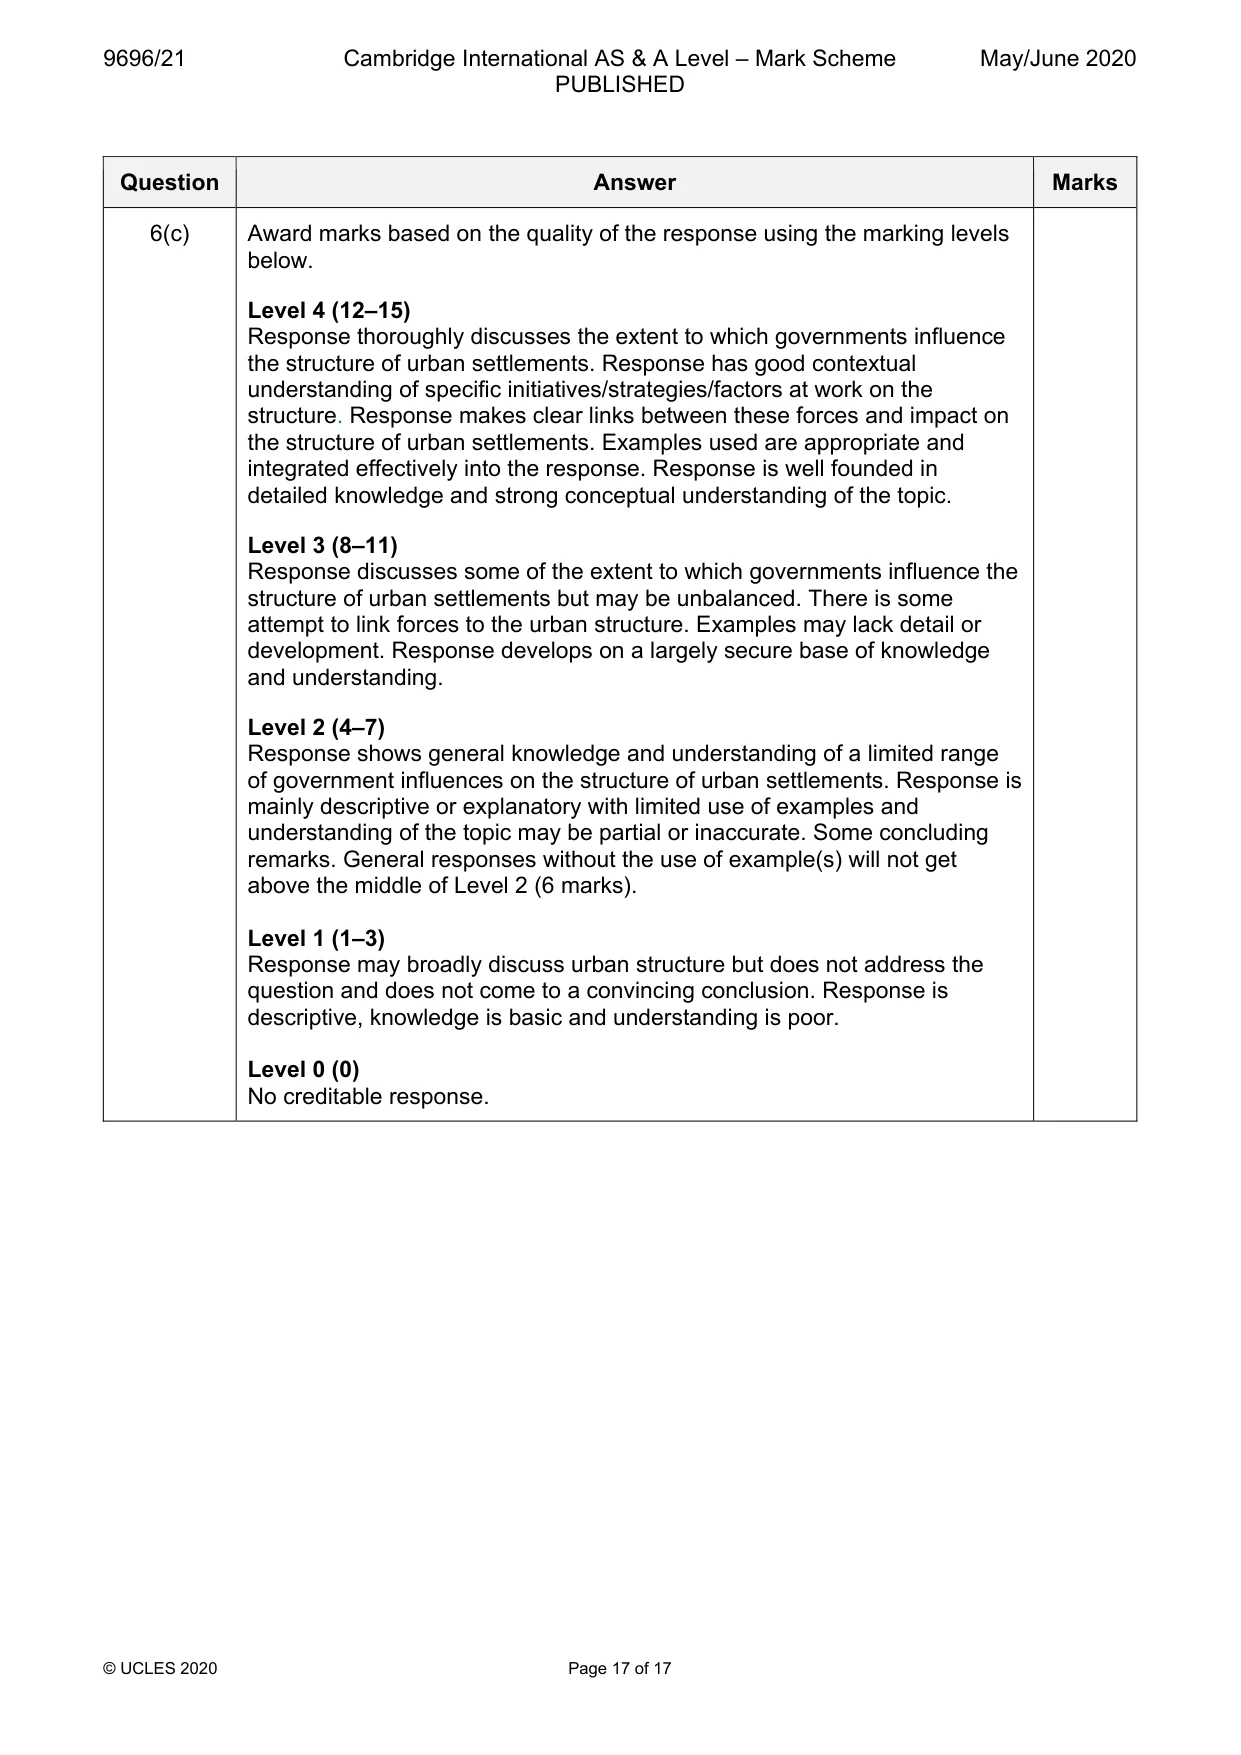
6 (a) (i) Define the terms counterurbanisation and re-urbanisation. [4] (ii) Briefly explain two consequences for urban areas of re-urbanisation. [3] (b) With the aid of examples, suggest why the location of retailing and other services in many urban settlements is challenging. [8] (c) With the aid of examples, assess the extent to which governments influence the structure of urban settlements. [15]
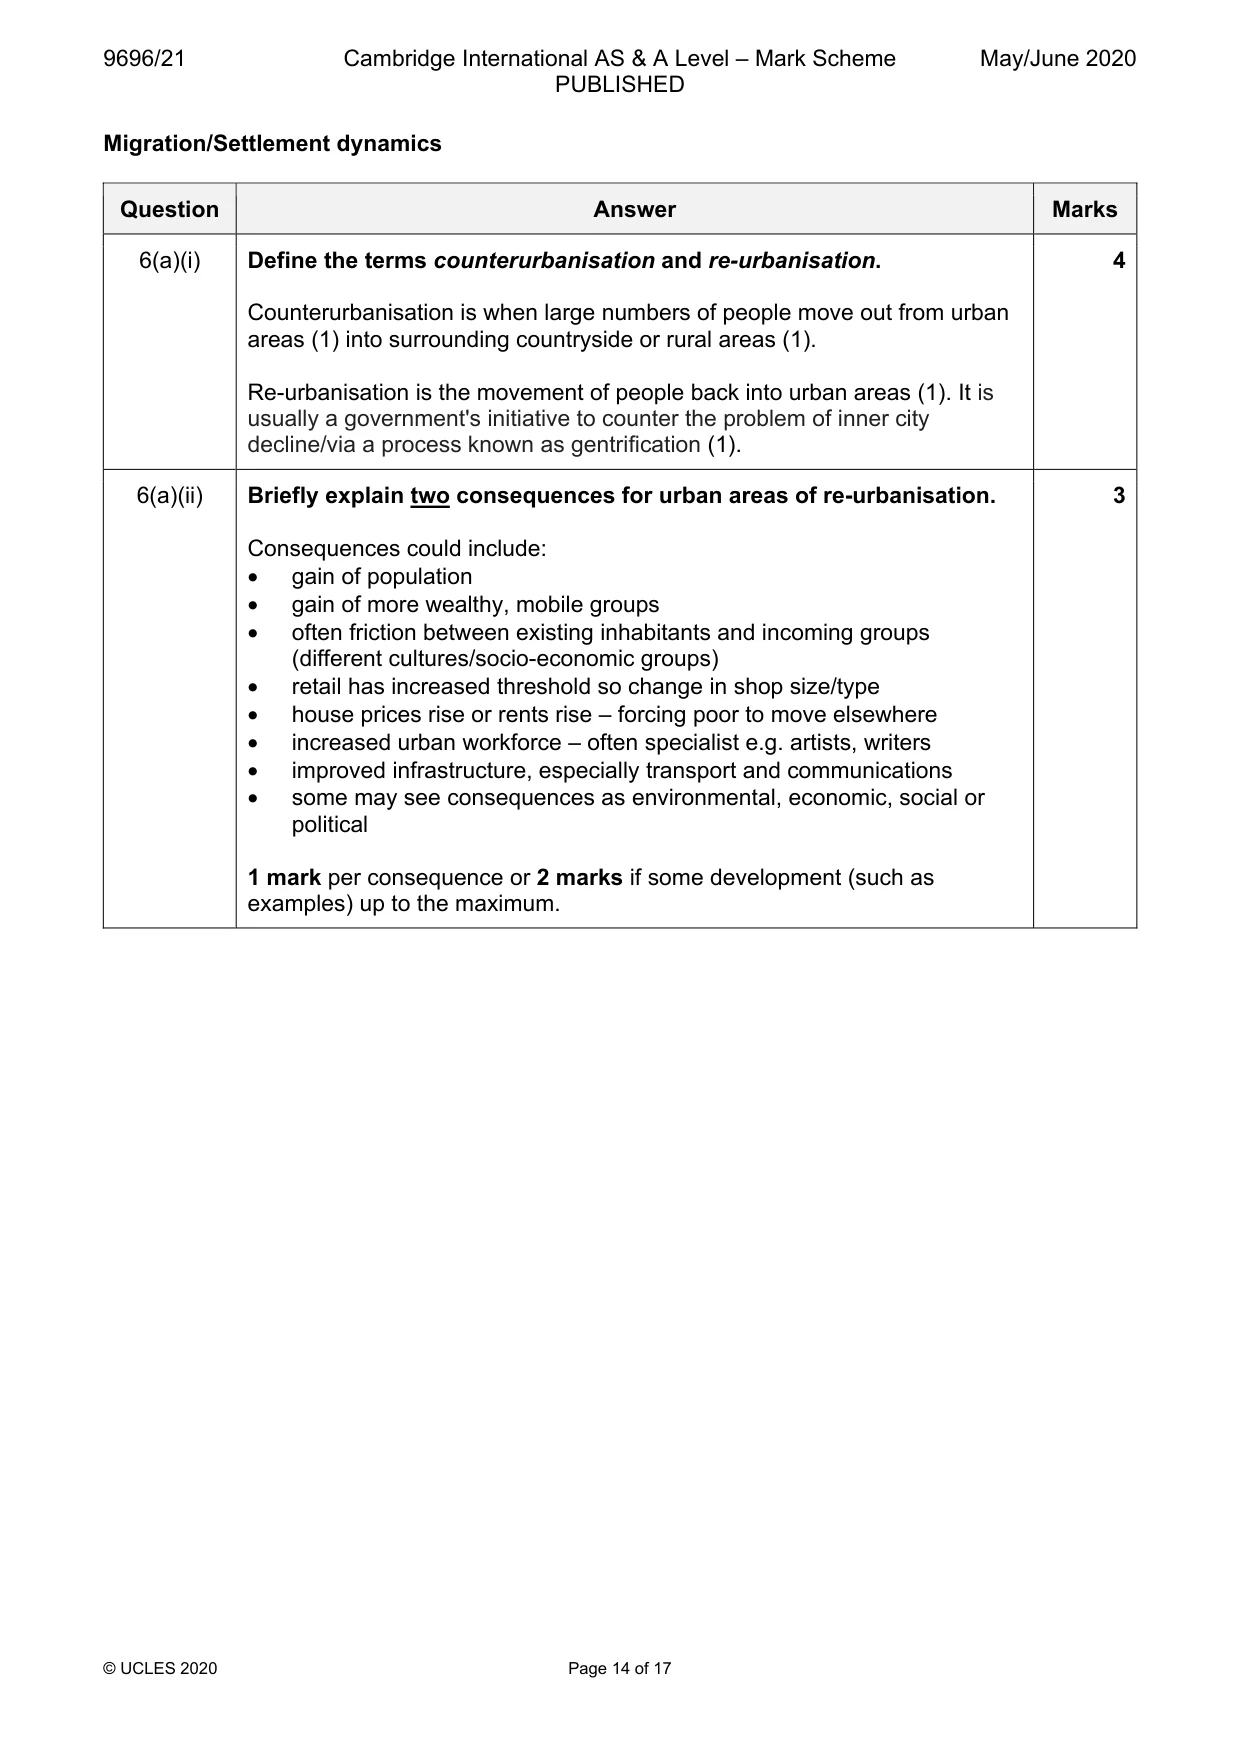
Mark scheme: 6(a)(i) Define the terms counterurbanisation and re-urbanisation. 4 Counterurbanisation is when large numbers of people move out from urban areas (1) into surrounding countryside or rural areas (1). Re-urbanisation is the movement of people back into urban areas (1). It is usually a government's initiative to counter the problem of inner city decline/via a process known as gentrification (1). 6(a)(ii) Briefly explain two consequences for urban areas of re-urbanisation. 3 Consequences could include: • gain of population • gain of more wealthy, mobile groups • often friction between existing inhabitants and incoming groups (different cultures/socio-economic groups) • retail has increased threshold so change in shop size/type • house prices rise or rents rise – forcing poor to move elsewhere • increased urban workforce – often specialist e.g. artists, writers • improved infrastructure, especially transport and communications • some may see consequences as environmental, economic, social or political 1 mark per consequence or 2 marks if some development (such as examples) up to the maximum. Question Answer Marks 6(b) With the aid of examples, suggest why the location of retailing and 8 other services in many urban settlements is challenging. To some extent this will depend on how candidates define services (could include commerce, entertainment, public services etc.). ‘Challenging’ could be seen as problematical or in a more positive light. Indicative content Location may be challenging due to: • economic factors such as costs, income (from services or tax), profitability, accessibility • social – high levels of demand, differing demands within the community • environmental – type of area served, space (buildings) needed, accessibility, pollution • political – political will, priorities (both in terms of impact and area focus), planning controls • others may focus on the challenges of where the locations are such as CBD, urban fringe etc. Award marks based on the quality of explanation and breadth of the response using the marking levels below. Level 3 (6–8) Response explains a range of reasons why the location of retailing and services is challenging in urban settlements. Response is well founded in detailed knowledge and strong conceptual understanding of the topic. Any examples used are appropriate and integrated effectively into the response. Level 2 (3–5) Response offers some explanation of why the location of retailing and services is challenging in settlements. Response develops on a largely secure base of knowledge and understanding. Examples may lack detail or development. Level 1 (1–2) Response has descriptive points about location of retailing and services in settlements. Knowledge is basic and understanding may be inaccurate. Examples are in name only or lacking entirely. Level 0 (0) No creditable response. Question Answer Marks 6(c) With the aid of examples, assess the extent to which governments 15 influence the structure of urban settlements. Candidates are free to develop their own approach to the question and responses will vary depending on the approach chosen. Whichever approach is chosen, essays which address the question and support their argument with relevant examples will be credited. There may be detailed consideration of a case study/one or more examples, or a broadly conceived response, drawing on several examples to illustrate the factors involved. The syllabus considers urban structure to include – the location of activities, spatial competition, functional zonation and residential segregation. Most candidates will probably focus on location of land uses. Indicative content Governments (local and national) influence urban structure via: • planning controls – land use zoning, preservation orders etc. • redevelopment/refurbishment schemes • rates and local taxation • land ownership – government functions e.g. education, health • laws including by-laws e.g. parking • environmental controls – anti-pollution controls, use of green spaces • transport planning and controls The assessment should consider the extent to which the urban structure is influenced by the government, or are physical geography, economic forces and social influences more important? Also the nature and scale of the government may vary. Question Answer Marks 6(c) Award marks based on the quality of the response using the marking levels below. Level 4 (12–15) Response thoroughly discusses the extent to which governments influence the structure of urban settlements. Response has good contextual understanding of specific initiatives/strategies/factors at work on the structure. Response makes clear links between these forces and impact on the structure of urban settlements. Examples used are appropriate and integrated effectively into the response. Response is well founded in detailed knowledge and strong conceptual understanding of the topic. Level 3 (8–11) Response discusses some of the extent to which governments influence the structure of urban settlements but may be unbalanced. There is some attempt to link forces to the urban structure. Examples may lack detail or development. Response develops on a largely secure base of knowledge and understanding. Level 2 (4–7) Response shows general knowledge and understanding of a limited range of government influences on the structure of urban settlements. Response is mainly descriptive or explanatory with limited use of examples and understanding of the topic may be partial or inaccurate. Some concluding remarks. General responses without the use of example(s) will not get above the middle of Level 2 (6 marks). Level 1 (1–3) Response may broadly discuss urban structure but does not address the question and does not come to a convincing conclusion. Response is descriptive, knowledge is basic and understanding is poor. Level 0 (0) No creditable response.
What was in this paper
The subtopics covered by these 6 questions, and how many questions each got. Open one in a new tab to see every Cambridge question on it.