Cambridge A Level Geography 9696 — 2020 May/June Paper 2 · Variant 2
9696/22/M/J/20 · 6 questions · 120 marks · ≈135 min
The question paper and its mark scheme, free to read here and free to download. This is Cambridge’s own paper, exactly as it was sat.
Question paper4 pages

Mark scheme17 pages
Answers below. Sit the paper first if you are practising.

Questions as text
Q1 · Mothers’ mean age at the birth of their first child for selected countries in 2016
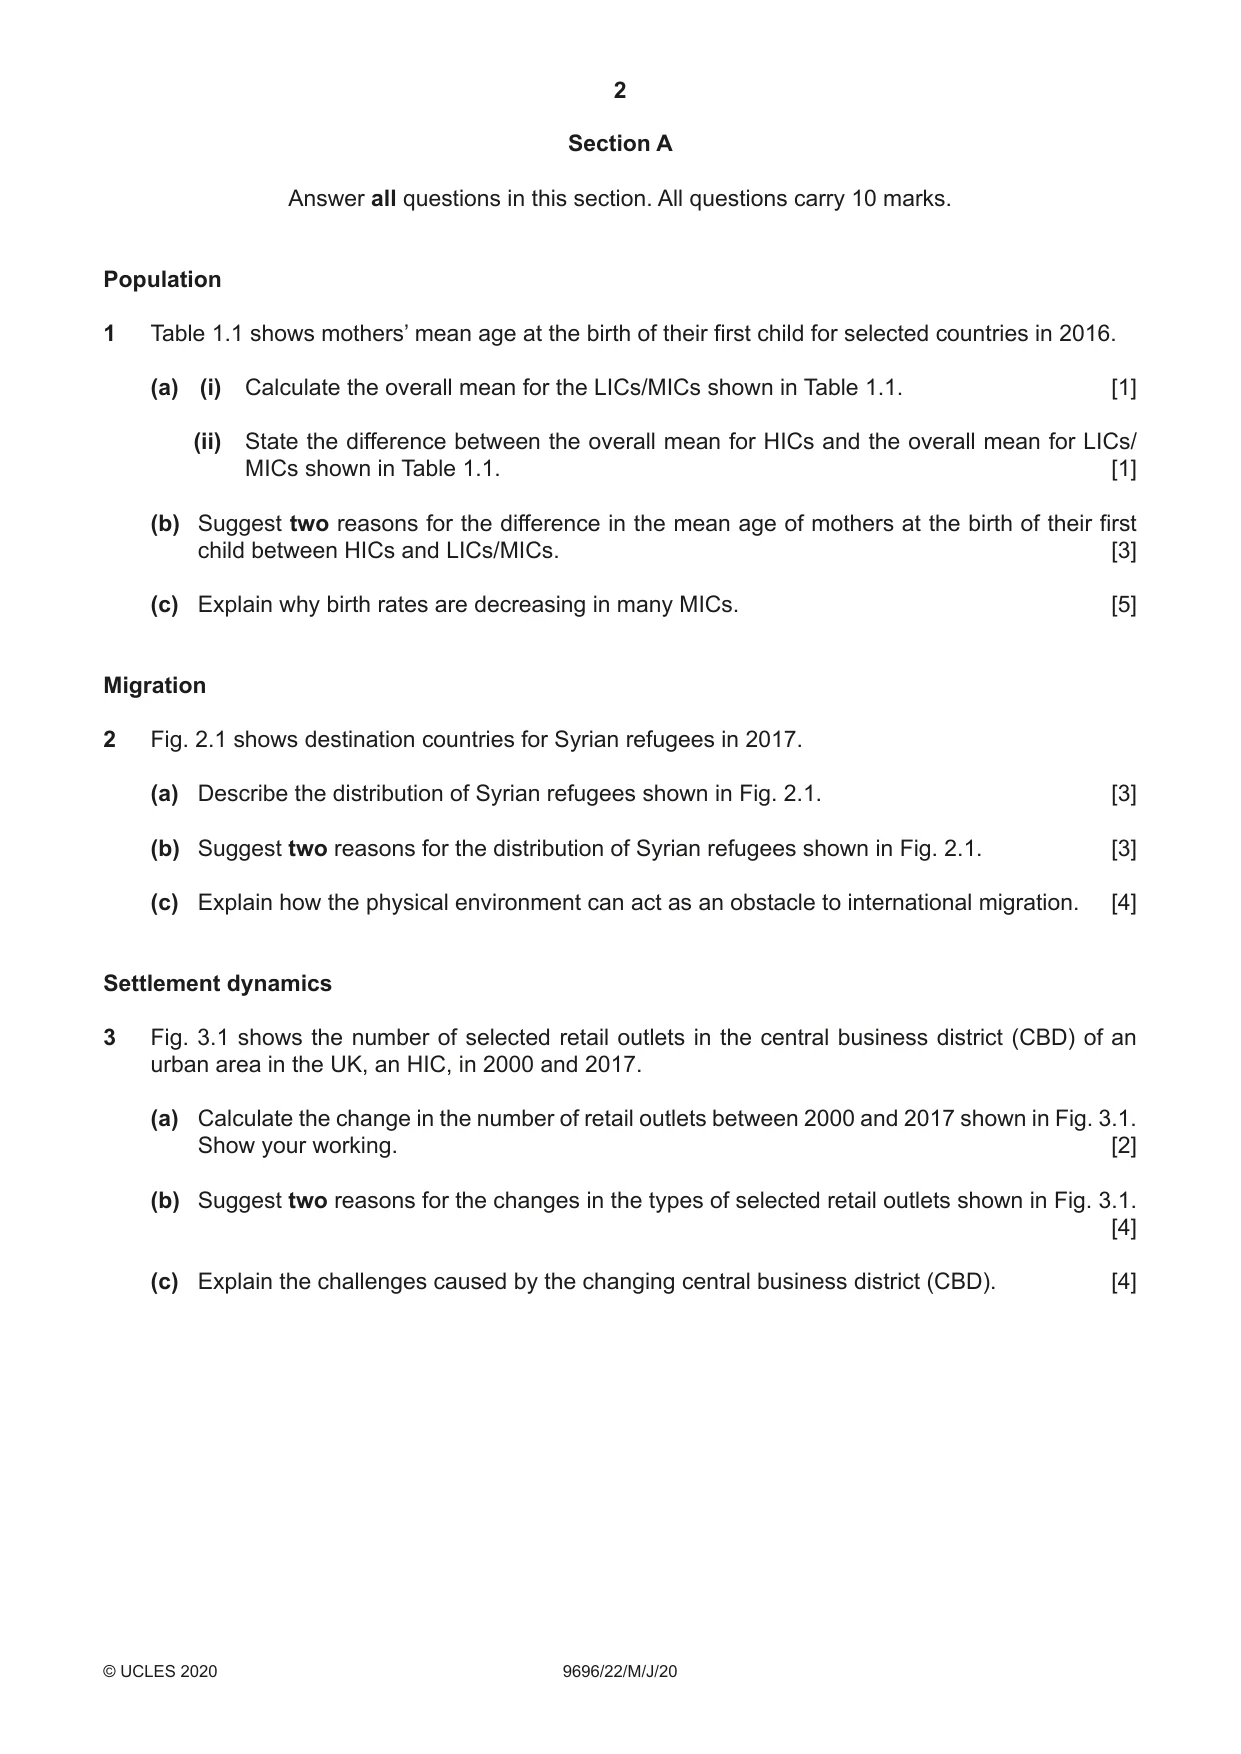
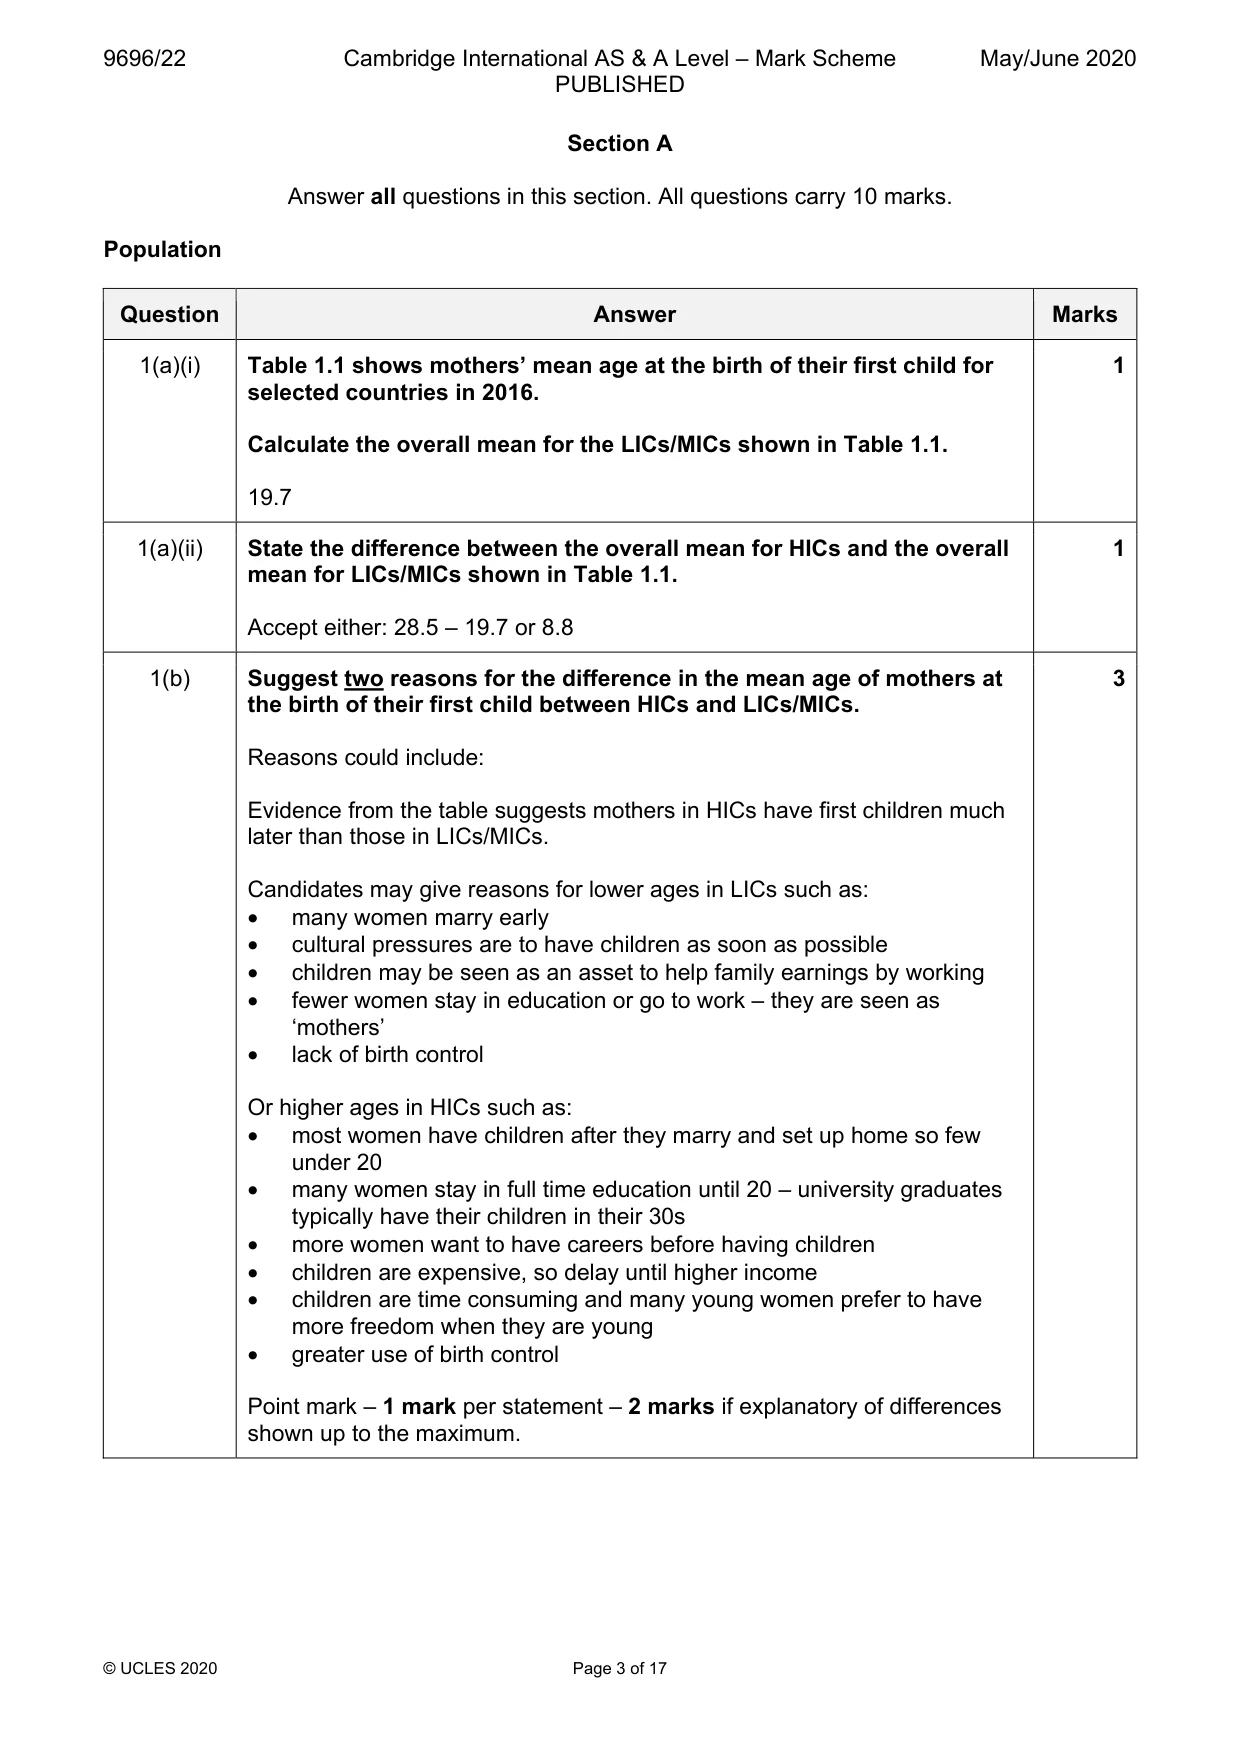
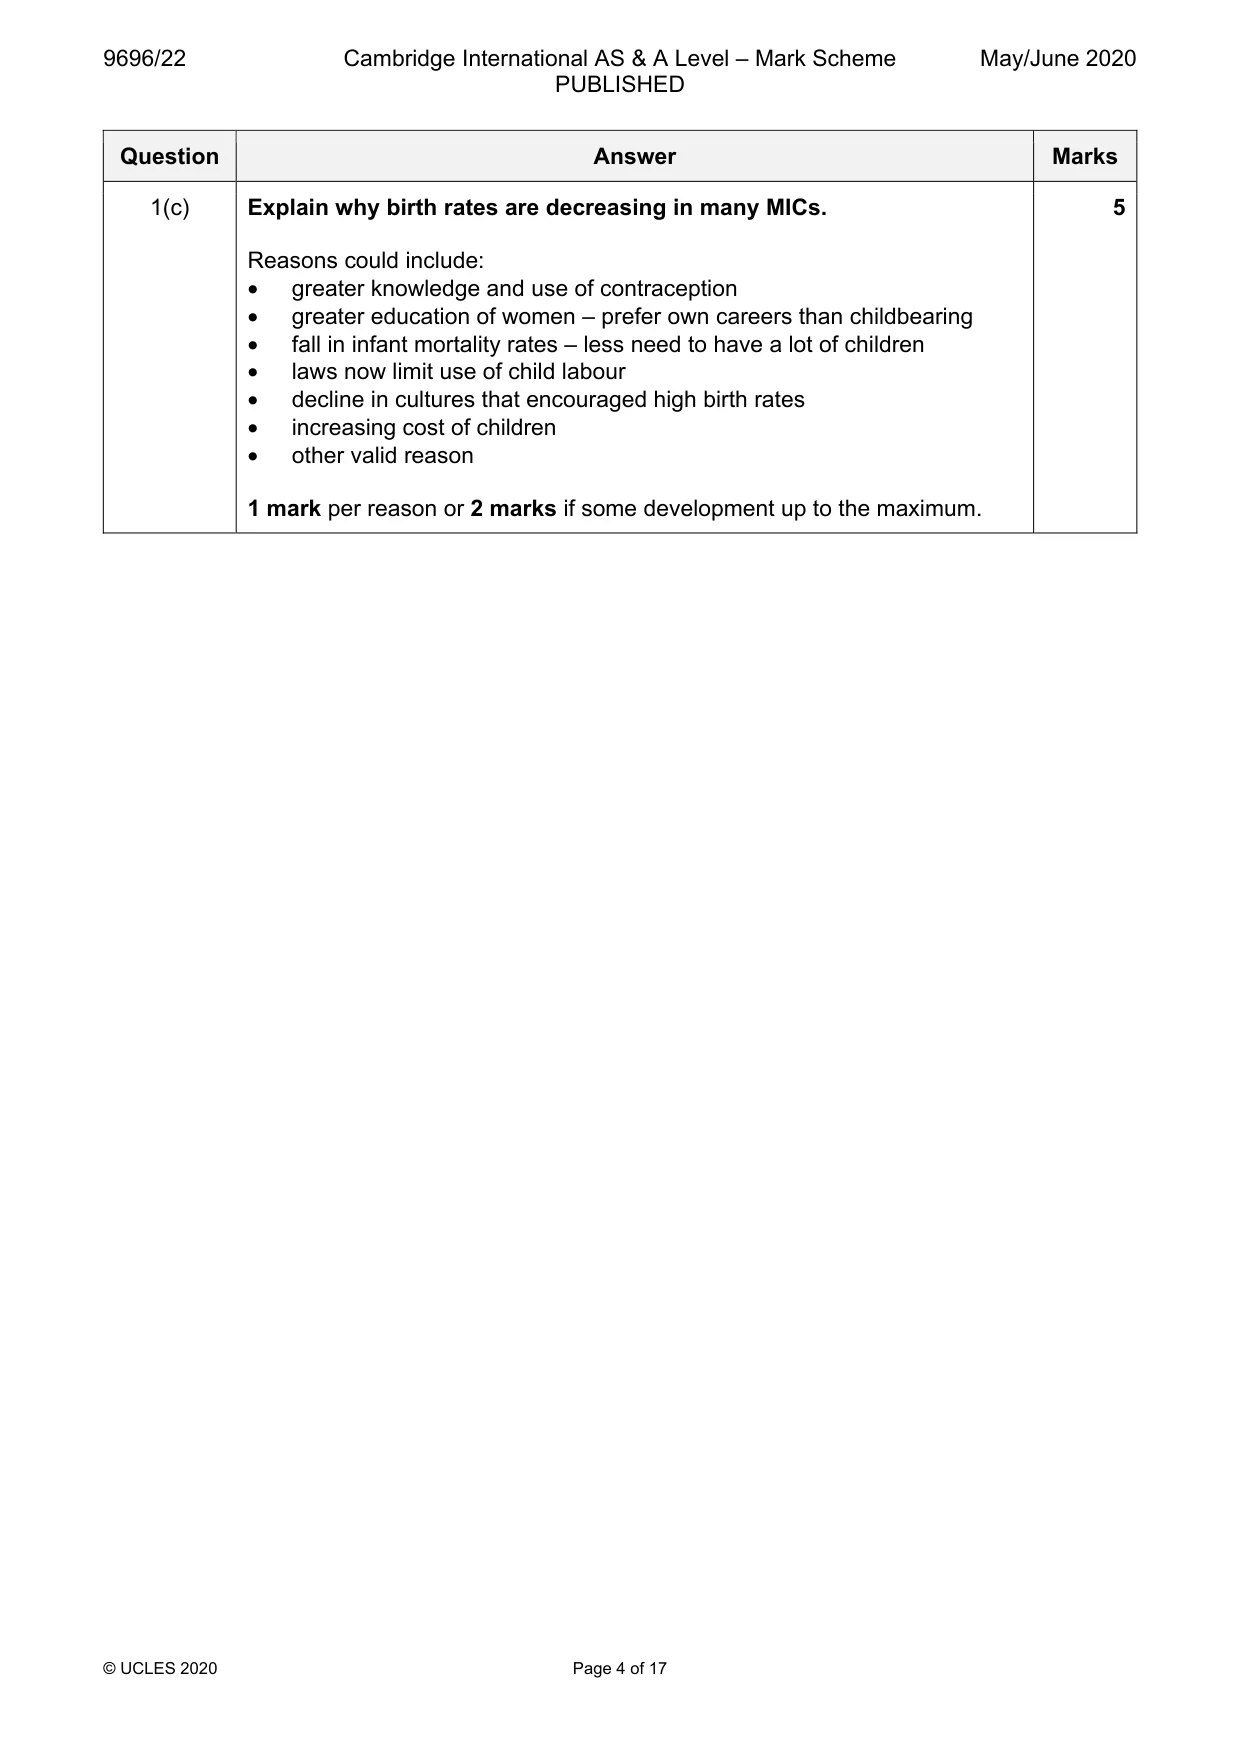
1 Table 1.1 shows mothers’ mean age at the birth of their first child for selected countries in 2016. (a) (i) Calculate the overall mean for the LICs/MICs shown in Table 1.1. [1] (ii) State the difference between the overall mean for HICs and the overall mean for LICs/ MICs shown in Table 1.1. [1] (b) Suggest two reasons for the difference in the mean age of mothers at the birth of their first child between HICs and LICs/MICs. [3] (c) Explain why birth rates are decreasing in many MICs. [5] Migration
Mark scheme: Question Answer Marks 1(a)(i) Table 1.1 shows mothers’ mean age at the birth of their first child for 1 selected countries in 2016. Calculate the overall mean for the LICs/MICs shown in Table 1.1. 19.7 1(a)(ii) State the difference between the overall mean for HICs and the overall 1 mean for LICs/MICs shown in Table 1.1. Accept either: 28.5 – 19.7 or 8.8 1(b) Suggest two reasons for the difference in the mean age of mothers at 3 the birth of their first child between HICs and LICs/MICs. Reasons could include: Evidence from the table suggests mothers in HICs have first children much later than those in LICs/MICs. Candidates may give reasons for lower ages in LICs such as: • many women marry early • cultural pressures are to have children as soon as possible • children may be seen as an asset to help family earnings by working • fewer women stay in education or go to work – they are seen as ‘mothers’ • lack of birth control Or higher ages in HICs such as: • most women have children after they marry and set up home so few under 20 • many women stay in full time education until 20 – university graduates typically have their children in their 30s • more women want to have careers before having children • children are expensive, so delay until higher income • children are time consuming and many young women prefer to have more freedom when they are young • greater use of birth control Point mark – 1 mark per statement – 2 marks if explanatory of differences shown up to the maximum. 1(c) Explain why birth rates are decreasing in many MICs. 5 Reasons could include: • greater knowledge and use of contraception • greater education of women – prefer own careers than childbearing • fall in infant mortality rates – less need to have a lot of children • laws now limit use of child labour • decline in cultures that encouraged high birth rates • increasing cost of children • other valid reason 1 mark per reason or 2 marks if some development up to the maximum. Migration
Q2 · Destination countries for Syrian refugees in 2017
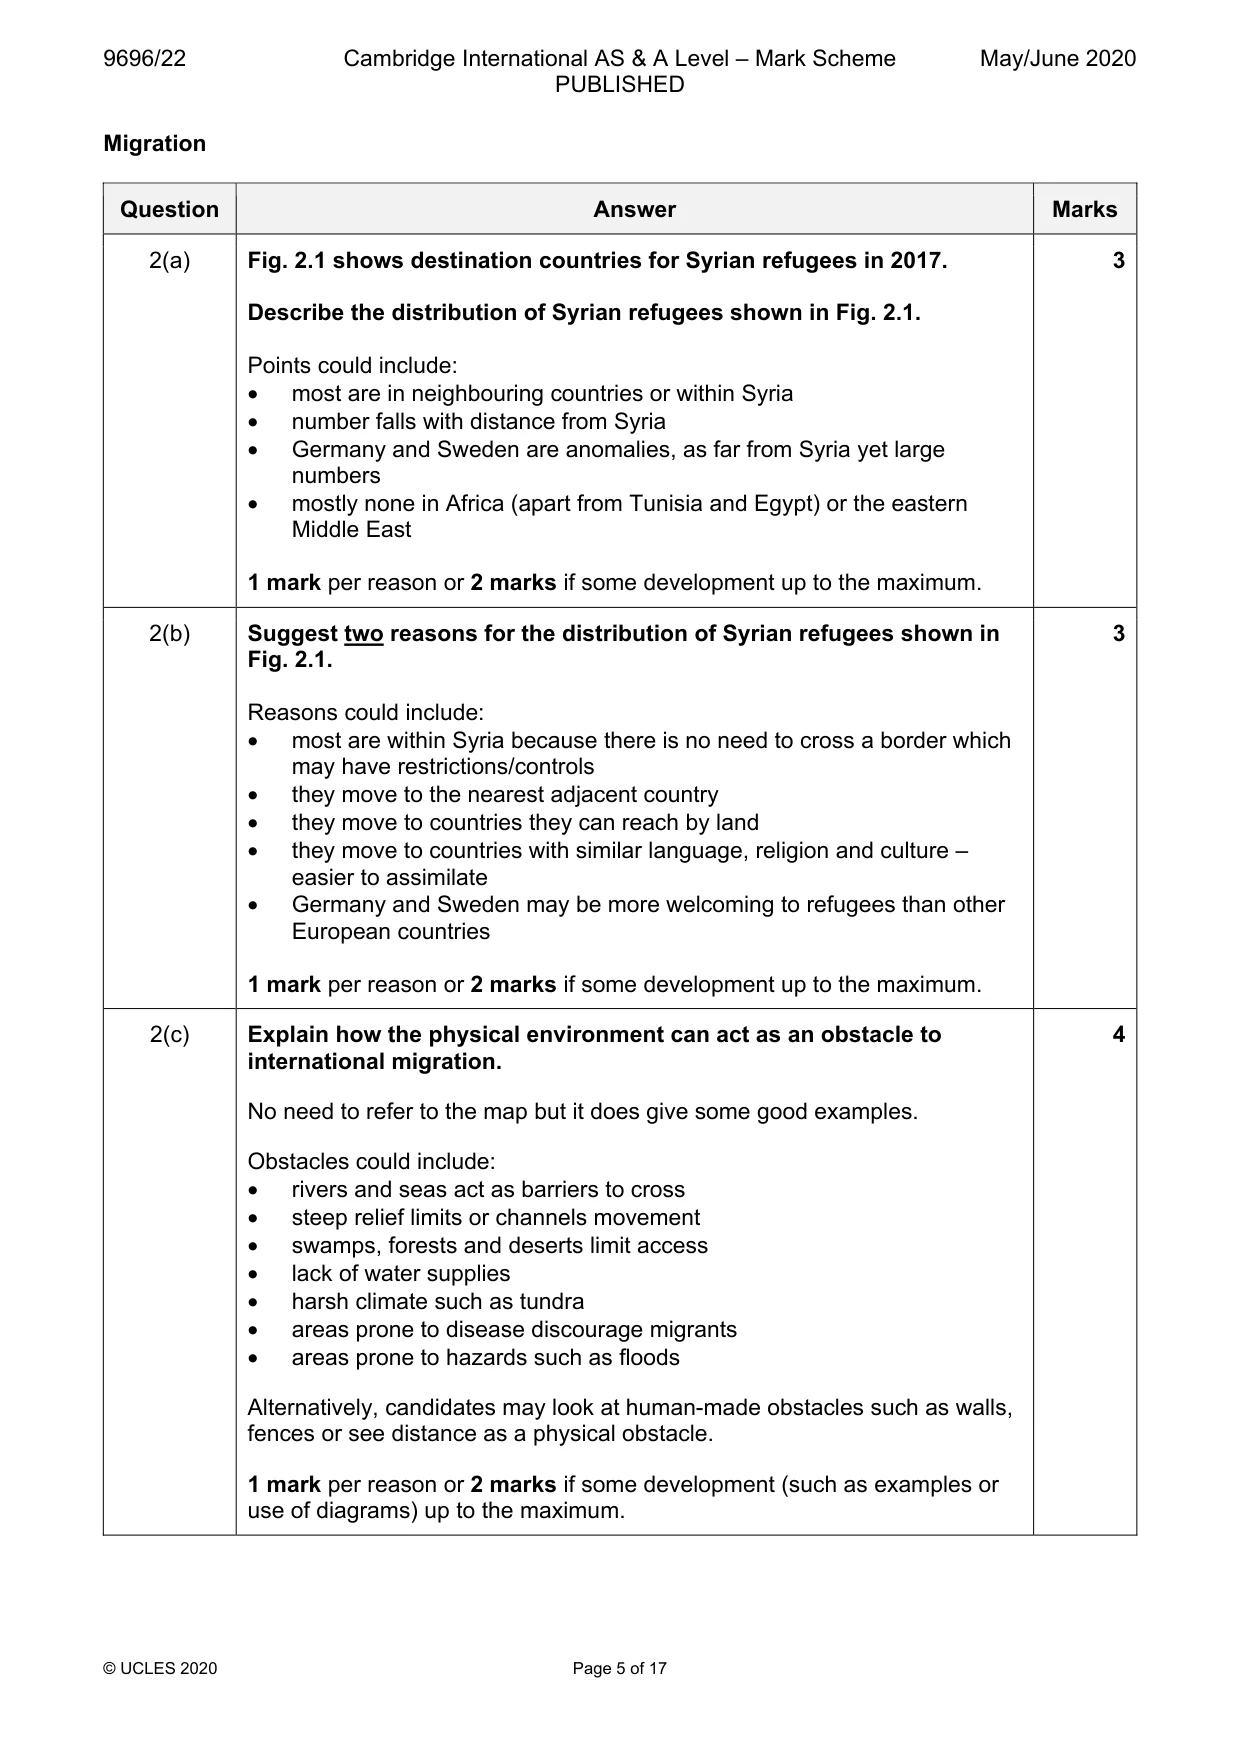
2 Fig. 2.1 shows destination countries for Syrian refugees in 2017. (a) Describe the distribution of Syrian refugees shown in Fig. 2.1. [3] (b) Suggest two reasons for the distribution of Syrian refugees shown in Fig. 2.1. [3] (c) Explain how the physical environment can act as an obstacle to international migration. [4] Settlement dynamics
Mark scheme: 2(a) Fig. 2.1 shows destination countries for Syrian refugees in 2017. 3 Describe the distribution of Syrian refugees shown in Fig. 2.1. Points could include: • most are in neighbouring countries or within Syria • number falls with distance from Syria • Germany and Sweden are anomalies, as far from Syria yet large numbers • mostly none in Africa (apart from Tunisia and Egypt) or the eastern Middle East 1 mark per reason or 2 marks if some development up to the maximum. 2(b) Suggest two reasons for the distribution of Syrian refugees shown in 3 Fig. 2.1. Reasons could include: • most are within Syria because there is no need to cross a border which may have restrictions/controls • they move to the nearest adjacent country • they move to countries they can reach by land • they move to countries with similar language, religion and culture – easier to assimilate • Germany and Sweden may be more welcoming to refugees than other European countries 1 mark per reason or 2 marks if some development up to the maximum. 2(c) Explain how the physical environment can act as an obstacle to 4 international migration. No need to refer to the map but it does give some good examples. Obstacles could include: • rivers and seas act as barriers to cross • steep relief limits or channels movement • swamps, forests and deserts limit access • lack of water supplies • harsh climate such as tundra • areas prone to disease discourage migrants • areas prone to hazards such as floods Alternatively, candidates may look at human-made obstacles such as walls, fences or see distance as a physical obstacle. 1 mark per reason or 2 marks if some development (such as examples or use of diagrams) up to the maximum. Settlement dynamics
Q3 · The number of selected retail outlets in the central business district (CBD) of an urban…
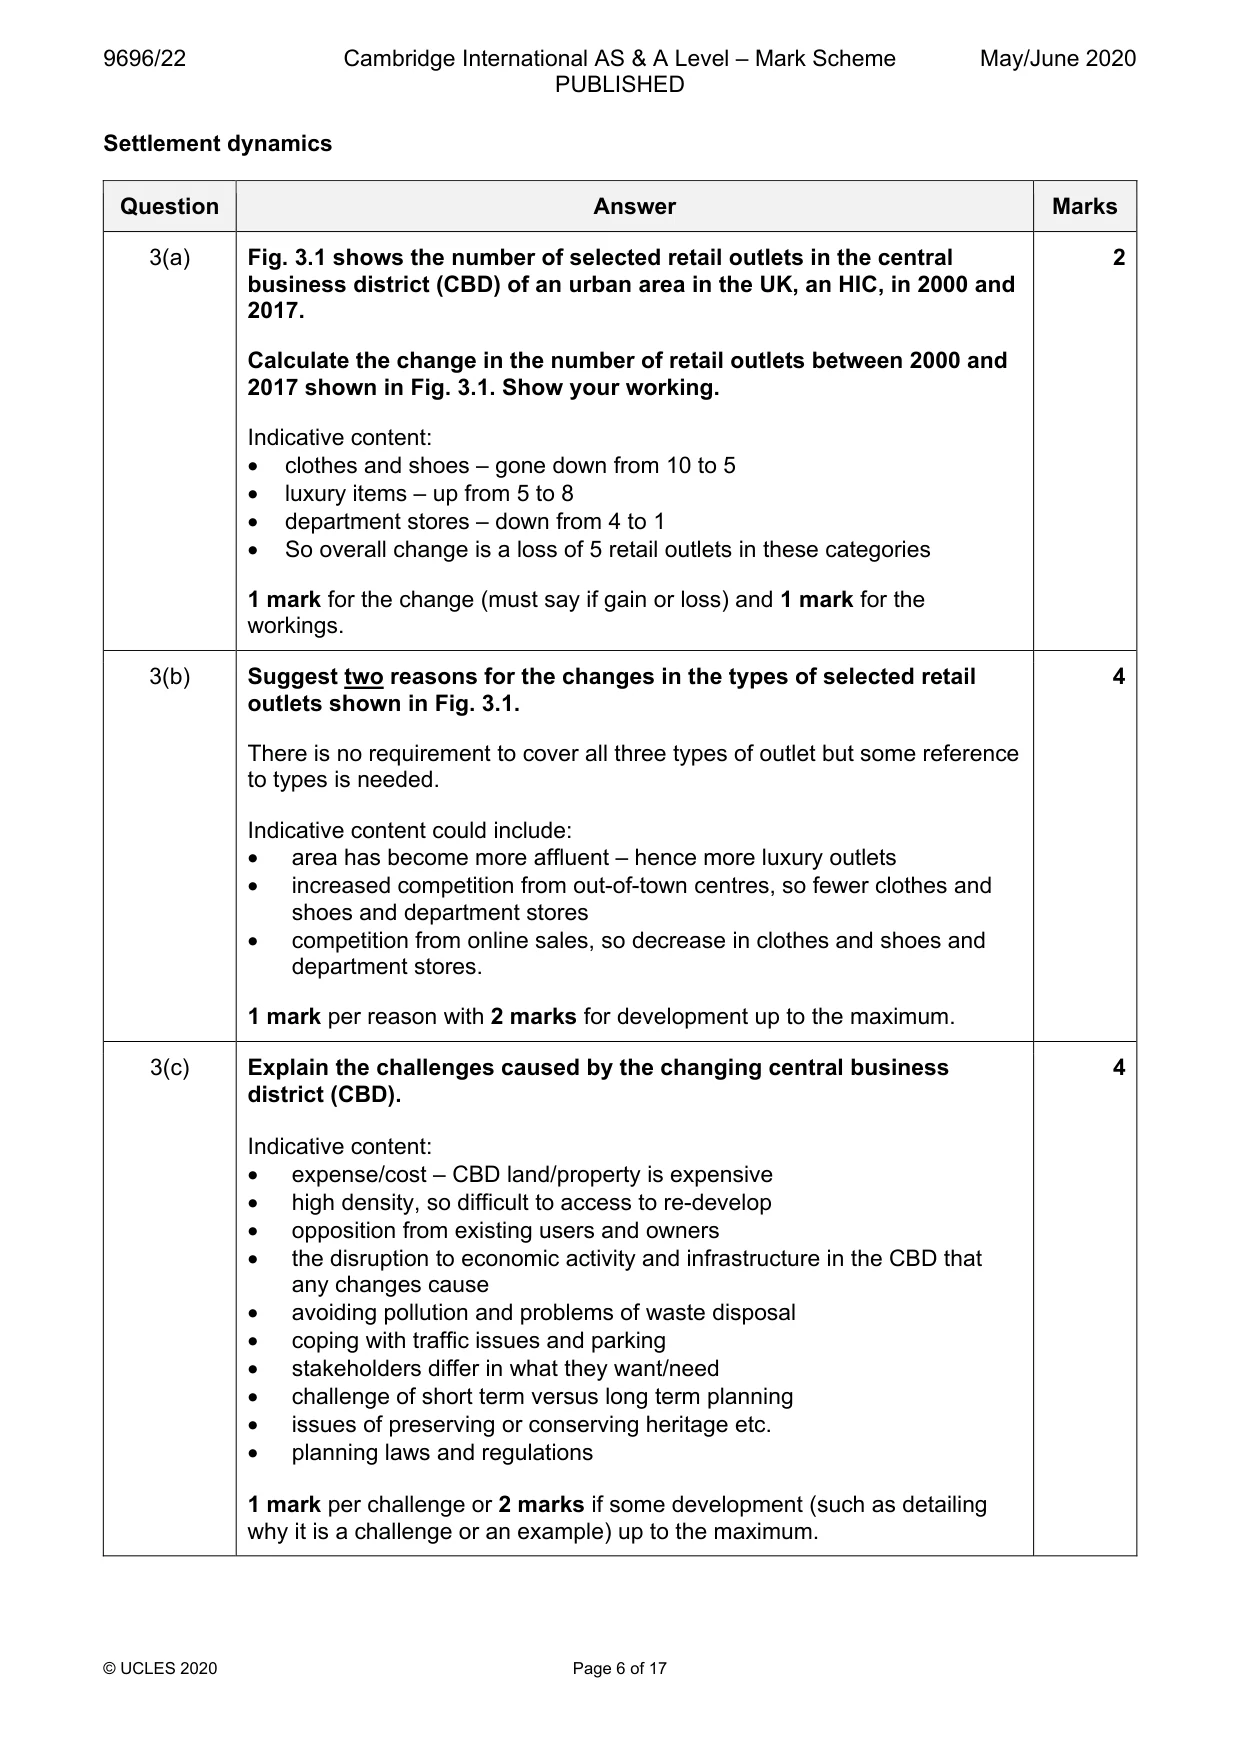
3 Fig. 3.1 shows the number of selected retail outlets in the central business district (CBD) of an urban area in the UK, an HIC, in 2000 and 2017. (a) Calculate the change in the number of retail outlets between 2000 and 2017 shown in Fig. 3.1. Show your working. [2] (b) Suggest two reasons for the changes in the types of selected retail outlets shown in Fig. 3.1. [4] (c) Explain the challenges caused by the changing central business district (CBD). [4]
Mark scheme: 3(a) Fig. 3.1 shows the number of selected retail outlets in the central 2 business district (CBD) of an urban area in the UK, an HIC, in 2000 and 2017. Calculate the change in the number of retail outlets between 2000 and 2017 shown in Fig. 3.1. Show your working. Indicative content: • clothes and shoes – gone down from 10 to 5 • luxury items – up from 5 to 8 • department stores – down from 4 to 1 • So overall change is a loss of 5 retail outlets in these categories 1 mark for the change (must say if gain or loss) and 1 mark for the workings. 3(b) Suggest two reasons for the changes in the types of selected retail 4 outlets shown in Fig. 3.1. There is no requirement to cover all three types of outlet but some reference to types is needed. Indicative content could include: • area has become more affluent – hence more luxury outlets • increased competition from out-of-town centres, so fewer clothes and shoes and department stores • competition from online sales, so decrease in clothes and shoes and department stores. 1 mark per reason with 2 marks for development up to the maximum. 3(c) Explain the challenges caused by the changing central business 4 district (CBD). Indicative content: • expense/cost – CBD land/property is expensive • high density, so difficult to access to re-develop • opposition from existing users and owners • the disruption to economic activity and infrastructure in the CBD that any changes cause • avoiding pollution and problems of waste disposal • coping with traffic issues and parking • stakeholders differ in what they want/need • challenge of short term versus long term planning • issues of preserving or conserving heritage etc. • planning laws and regulations 1 mark per challenge or 2 marks if some development (such as detailing why it is a challenge or an example) up to the maximum. Section B Answer one question from this section. All questions carry 30 marks. Population
Q4 · For your case study of one country’s population policy: (a) outline the difficulties that…
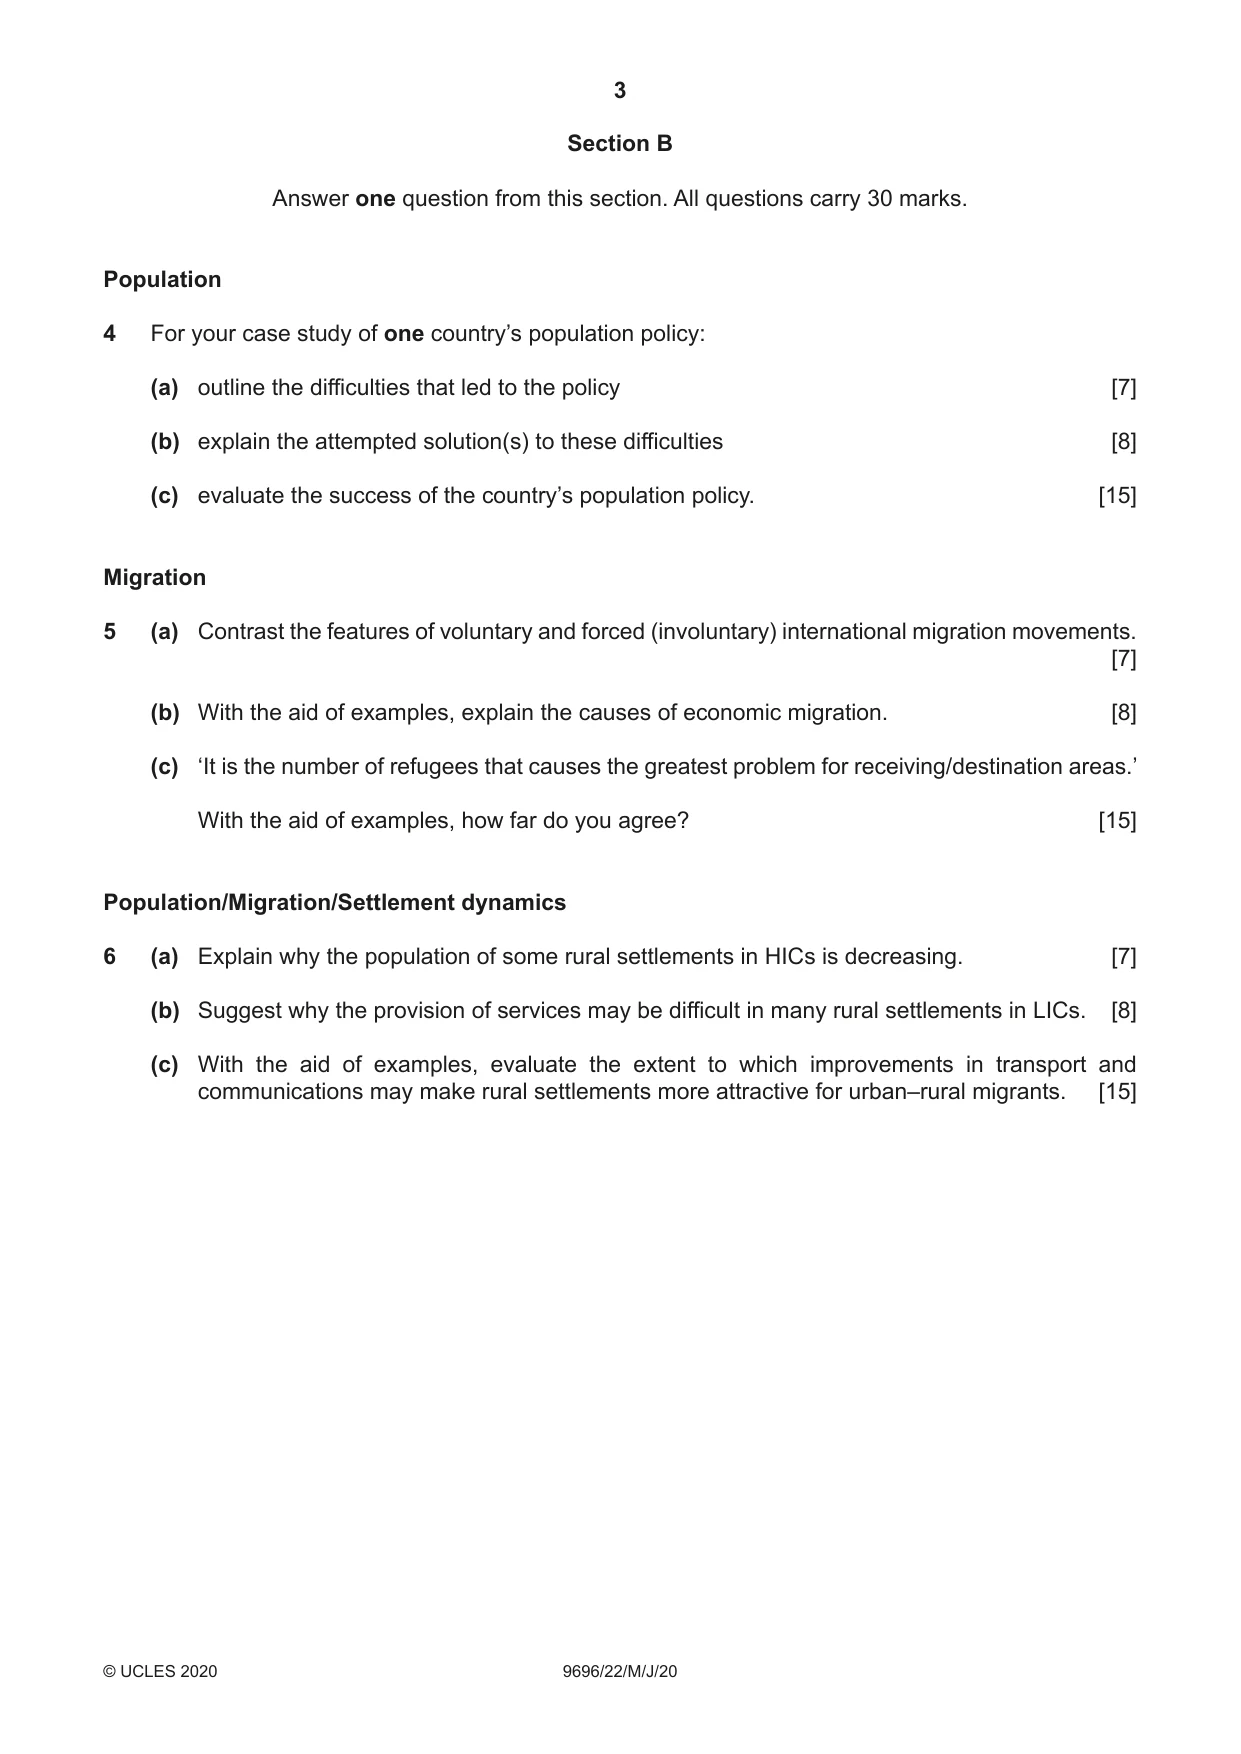
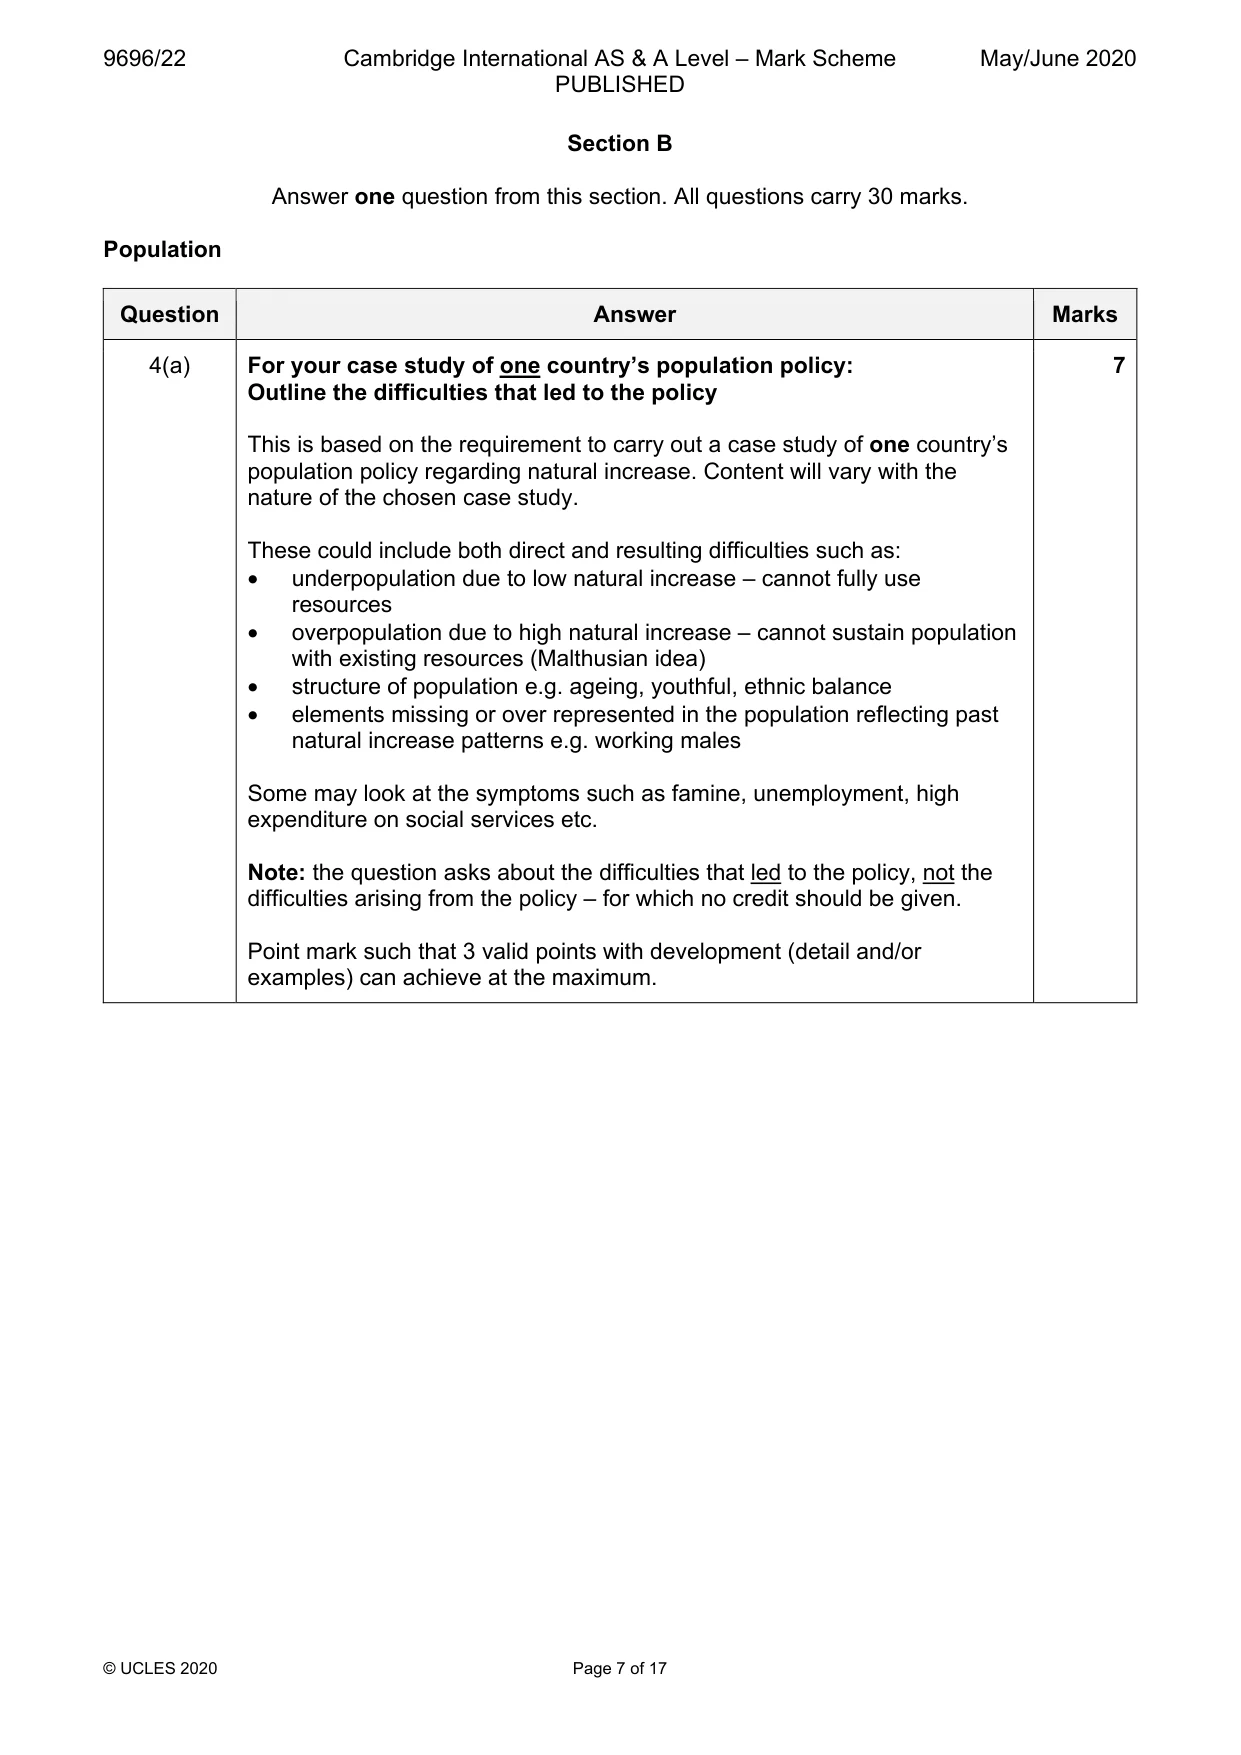
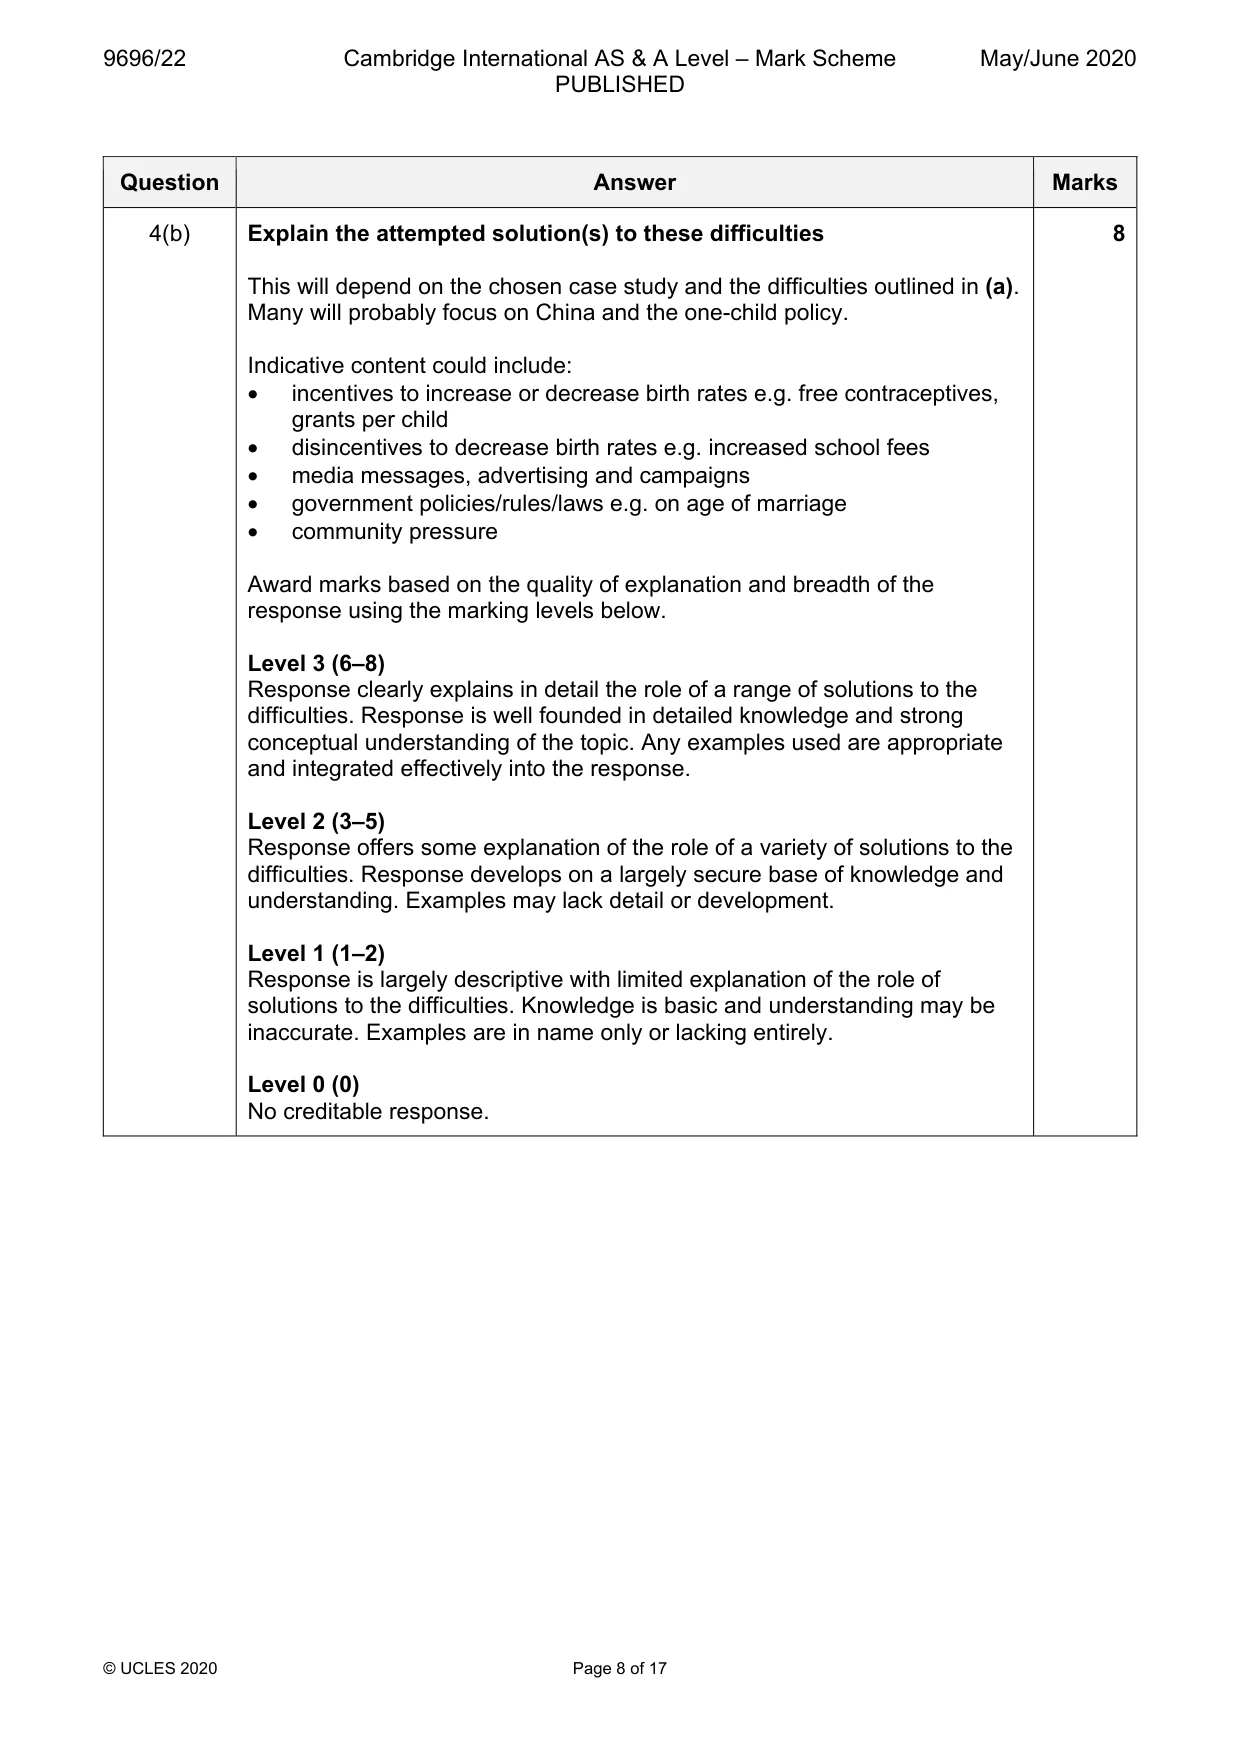
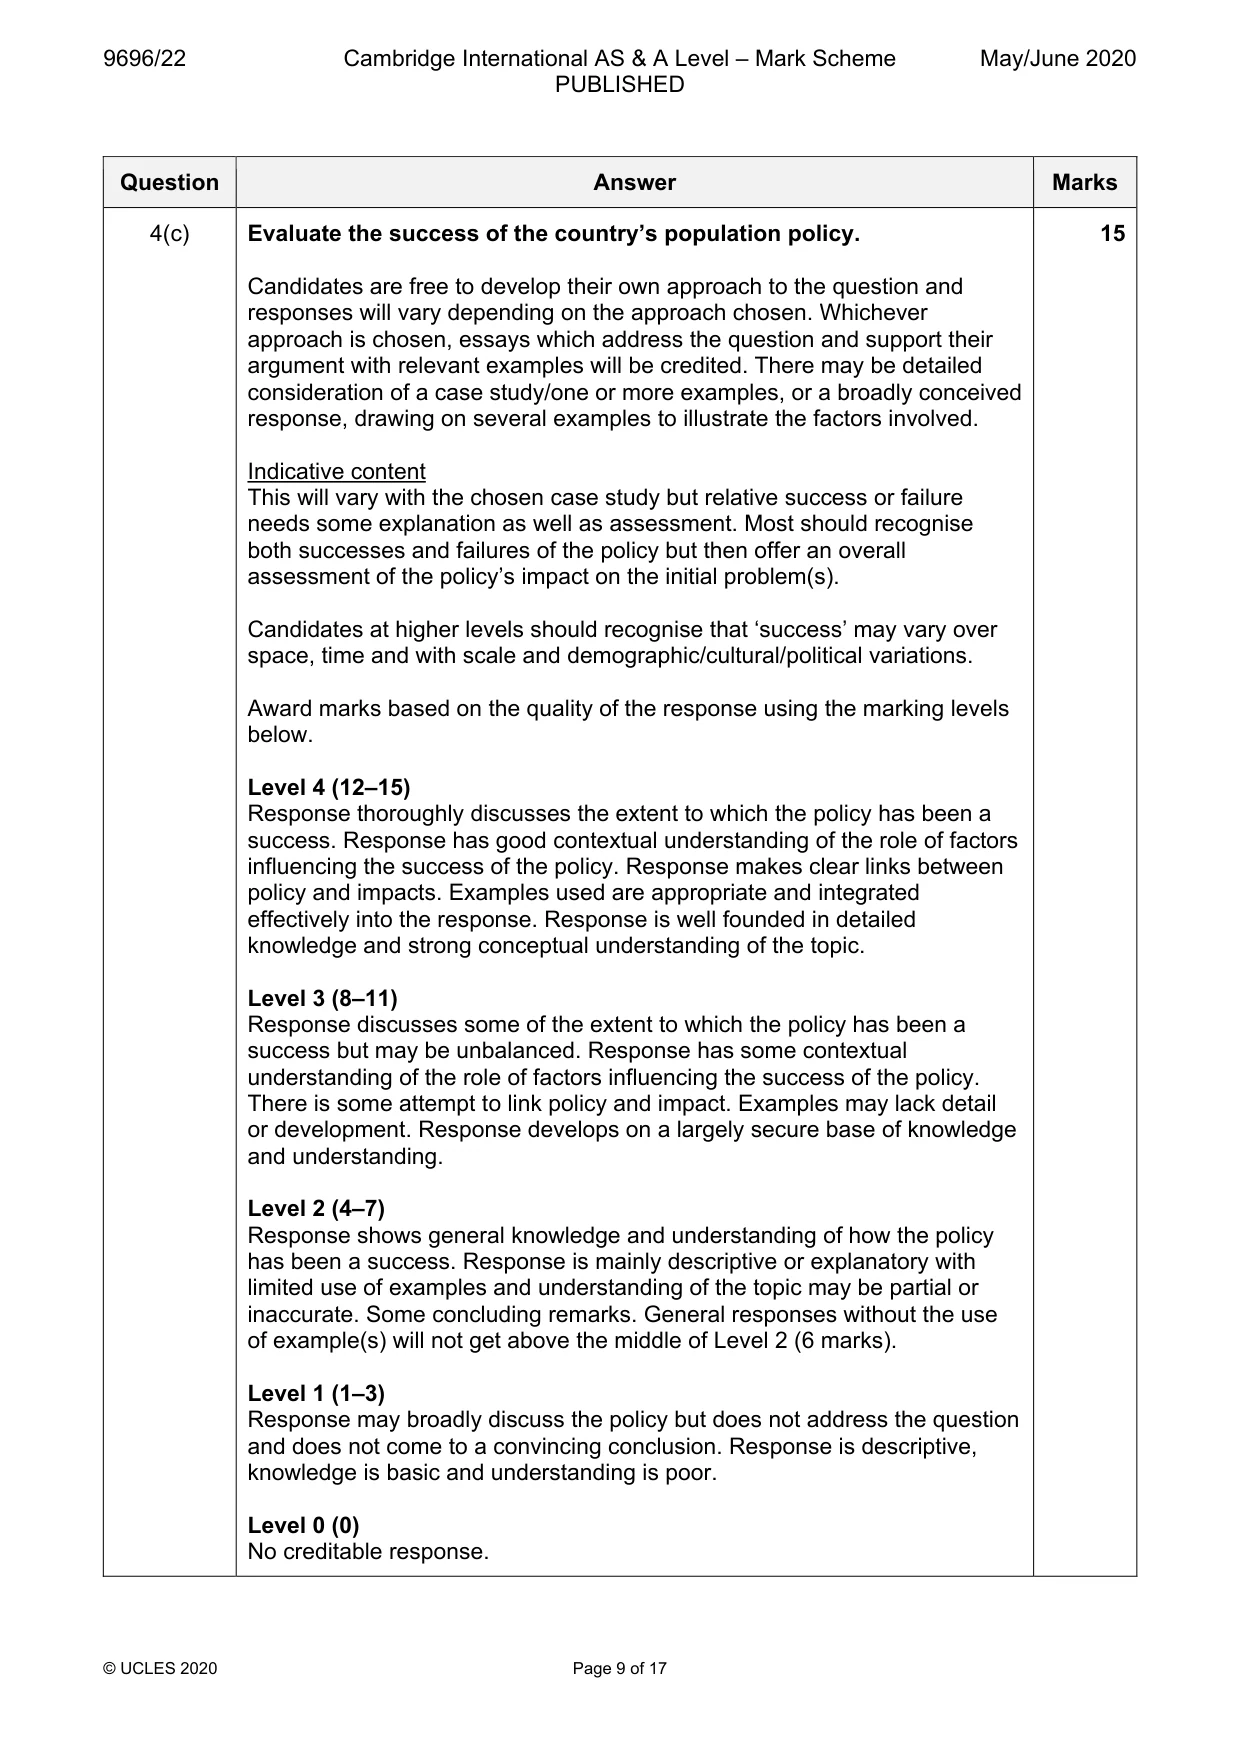
4 For your case study of one country’s population policy: (a) outline the difficulties that led to the policy [7] (b) explain the attempted solution(s) to these difficulties [8] (c) evaluate the success of the country’s population policy. [15] Migration
Mark scheme: 4(a) For your case study of one country’s population policy: 7 Outline the difficulties that led to the policy This is based on the requirement to carry out a case study of one country’s population policy regarding natural increase. Content will vary with the nature of the chosen case study. These could include both direct and resulting difficulties such as: • underpopulation due to low natural increase – cannot fully use resources • overpopulation due to high natural increase – cannot sustain population with existing resources (Malthusian idea) • structure of population e.g. ageing, youthful, ethnic balance • elements missing or over represented in the population reflecting past natural increase patterns e.g. working males Some may look at the symptoms such as famine, unemployment, high expenditure on social services etc. Note: the question asks about the difficulties that led to the policy, not the difficulties arising from the policy – for which no credit should be given. Point mark such that 3 valid points with development (detail and/or examples) can achieve at the maximum. Question Answer Marks 4(b) Explain the attempted solution(s) to these difficulties 8 This will depend on the chosen case study and the difficulties outlined in (a). Many will probably focus on China and the one-child policy. Indicative content could include: • incentives to increase or decrease birth rates e.g. free contraceptives, grants per child • disincentives to decrease birth rates e.g. increased school fees • media messages, advertising and campaigns • government policies/rules/laws e.g. on age of marriage • community pressure Award marks based on the quality of explanation and breadth of the response using the marking levels below. Level 3 (6–8) Response clearly explains in detail the role of a range of solutions to the difficulties. Response is well founded in detailed knowledge and strong conceptual understanding of the topic. Any examples used are appropriate and integrated effectively into the response. Level 2 (3–5) Response offers some explanation of the role of a variety of solutions to the difficulties. Response develops on a largely secure base of knowledge and understanding. Examples may lack detail or development. Level 1 (1–2) Response is largely descriptive with limited explanation of the role of solutions to the difficulties. Knowledge is basic and understanding may be inaccurate. Examples are in name only or lacking entirely. Level 0 (0) No creditable response. Question Answer Marks 4(c) Evaluate the success of the country’s population policy. 15 Candidates are free to develop their own approach to the question and responses will vary depending on the approach chosen. Whichever approach is chosen, essays which address the question and support their argument with relevant examples will be credited. There may be detailed consideration of a case study/one or more examples, or a broadly conceived response, drawing on several examples to illustrate the factors involved. Indicative content This will vary with the chosen case study but relative success or failure needs some explanation as well as assessment. Most should recognise both successes and failures of the policy but then offer an overall assessment of the policy’s impact on the initial problem(s). Candidates at higher levels should recognise that ‘success’ may vary over space, time and with scale and demographic/cultural/political variations. Award marks based on the quality of the response using the marking levels below. Level 4 (12–15) Response thoroughly discusses the extent to which the policy has been a success. Response has good contextual understanding of the role of factors influencing the success of the policy. Response makes clear links between policy and impacts. Examples used are appropriate and integrated effectively into the response. Response is well founded in detailed knowledge and strong conceptual understanding of the topic. Level 3 (8–11) Response discusses some of the extent to which the policy has been a success but may be unbalanced. Response has some contextual understanding of the role of factors influencing the success of the policy. There is some attempt to link policy and impact. Examples may lack detail or development. Response develops on a largely secure base of knowledge and understanding. Level 2 (4–7) Response shows general knowledge and understanding of how the policy has been a success. Response is mainly descriptive or explanatory with limited use of examples and understanding of the topic may be partial or inaccurate. Some concluding remarks. General responses without the use of example(s) will not get above the middle of Level 2 (6 marks). Level 1 (1–3) Response may broadly discuss the policy but does not address the question and does not come to a convincing conclusion. Response is descriptive, knowledge is basic and understanding is poor. Level 0 (0) No creditable response. Migration
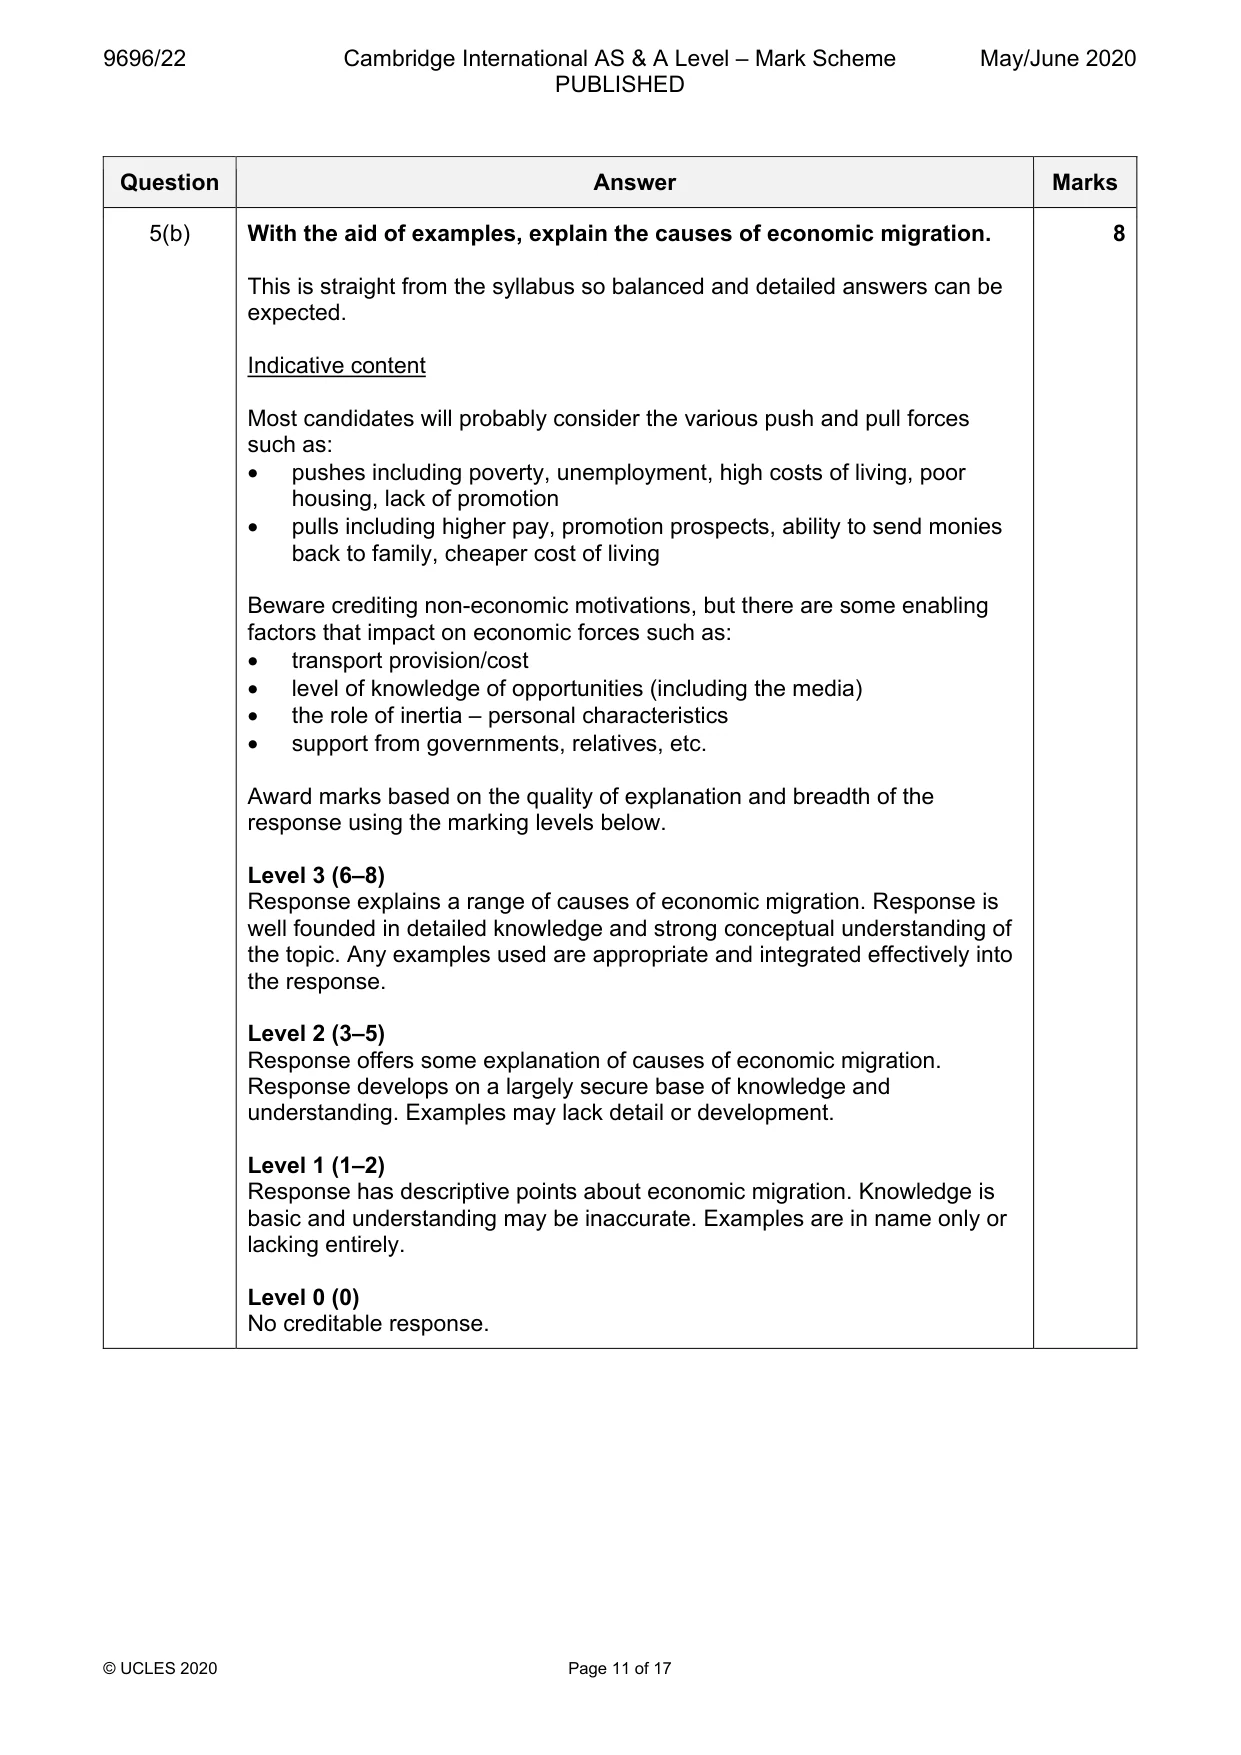
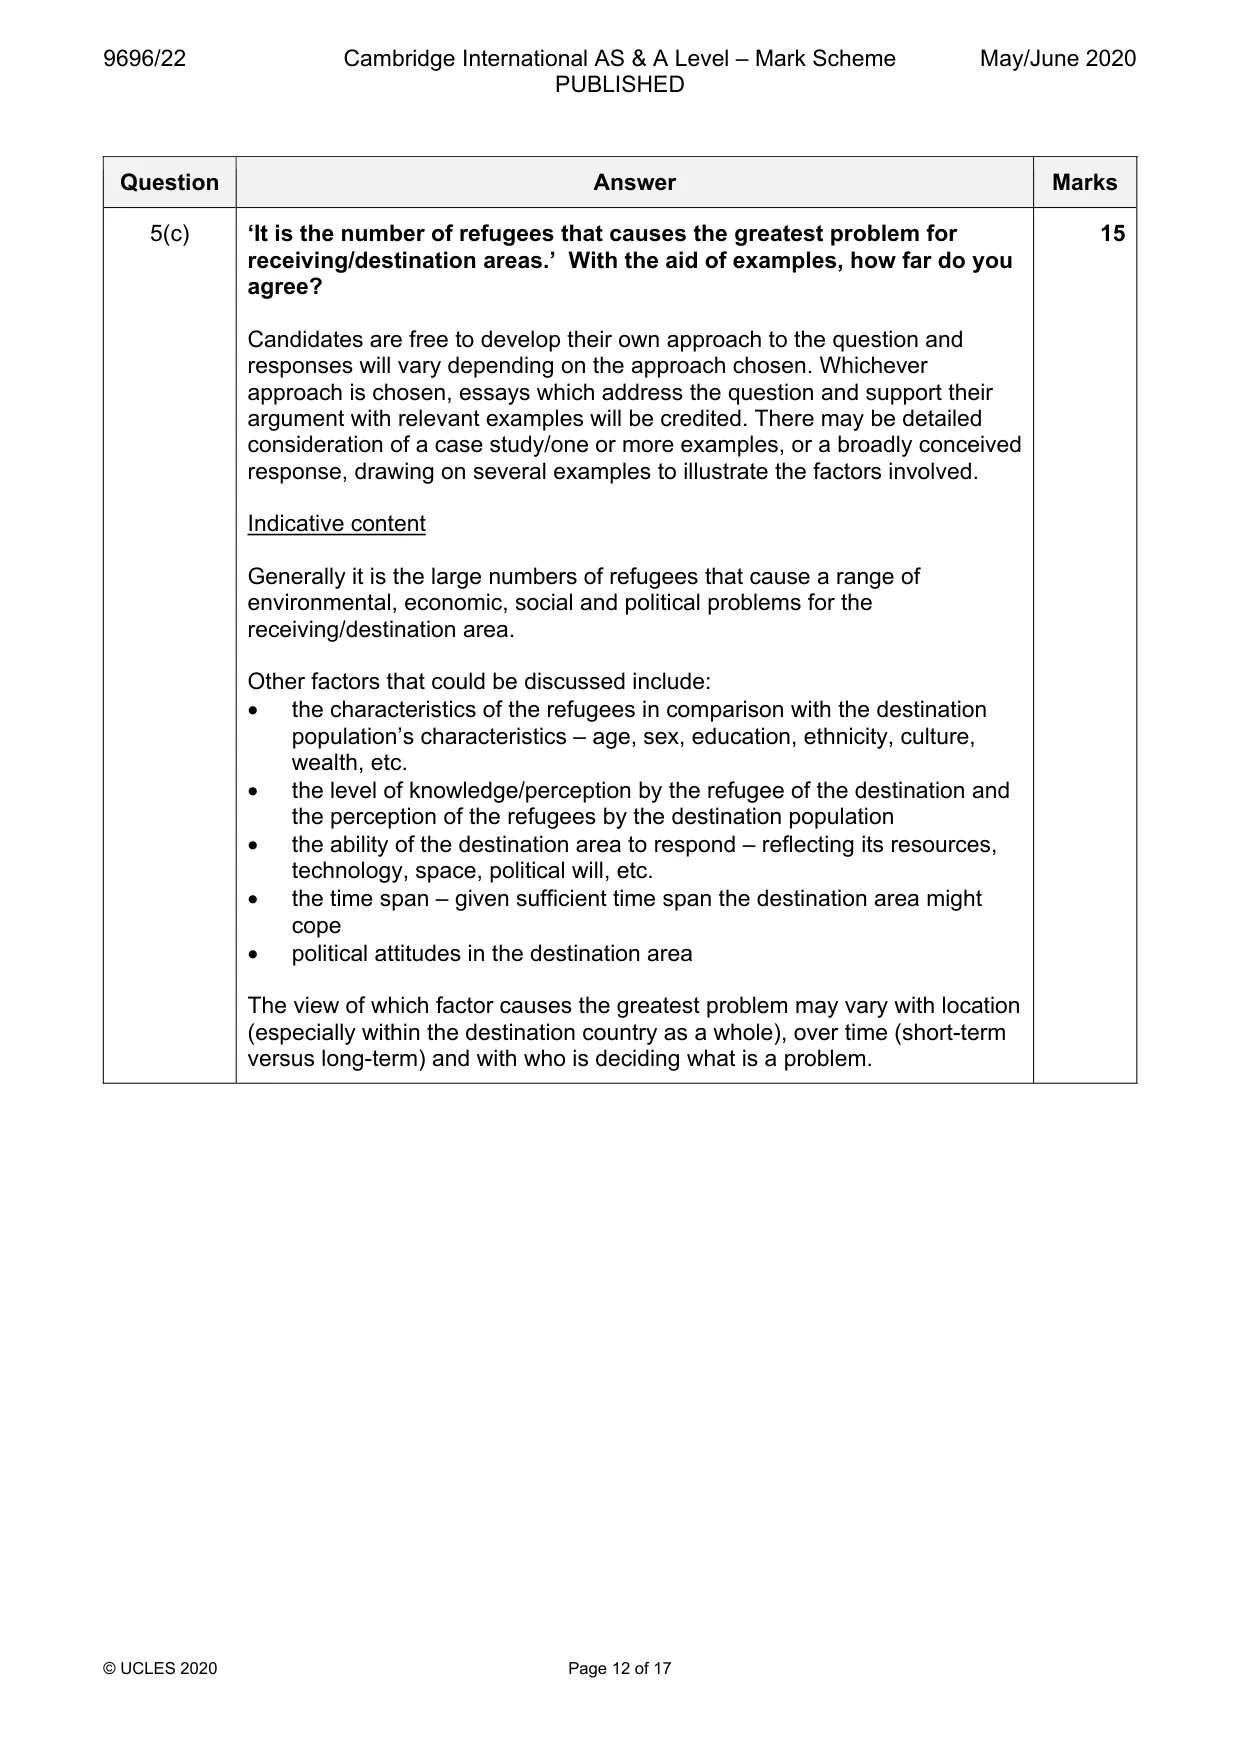
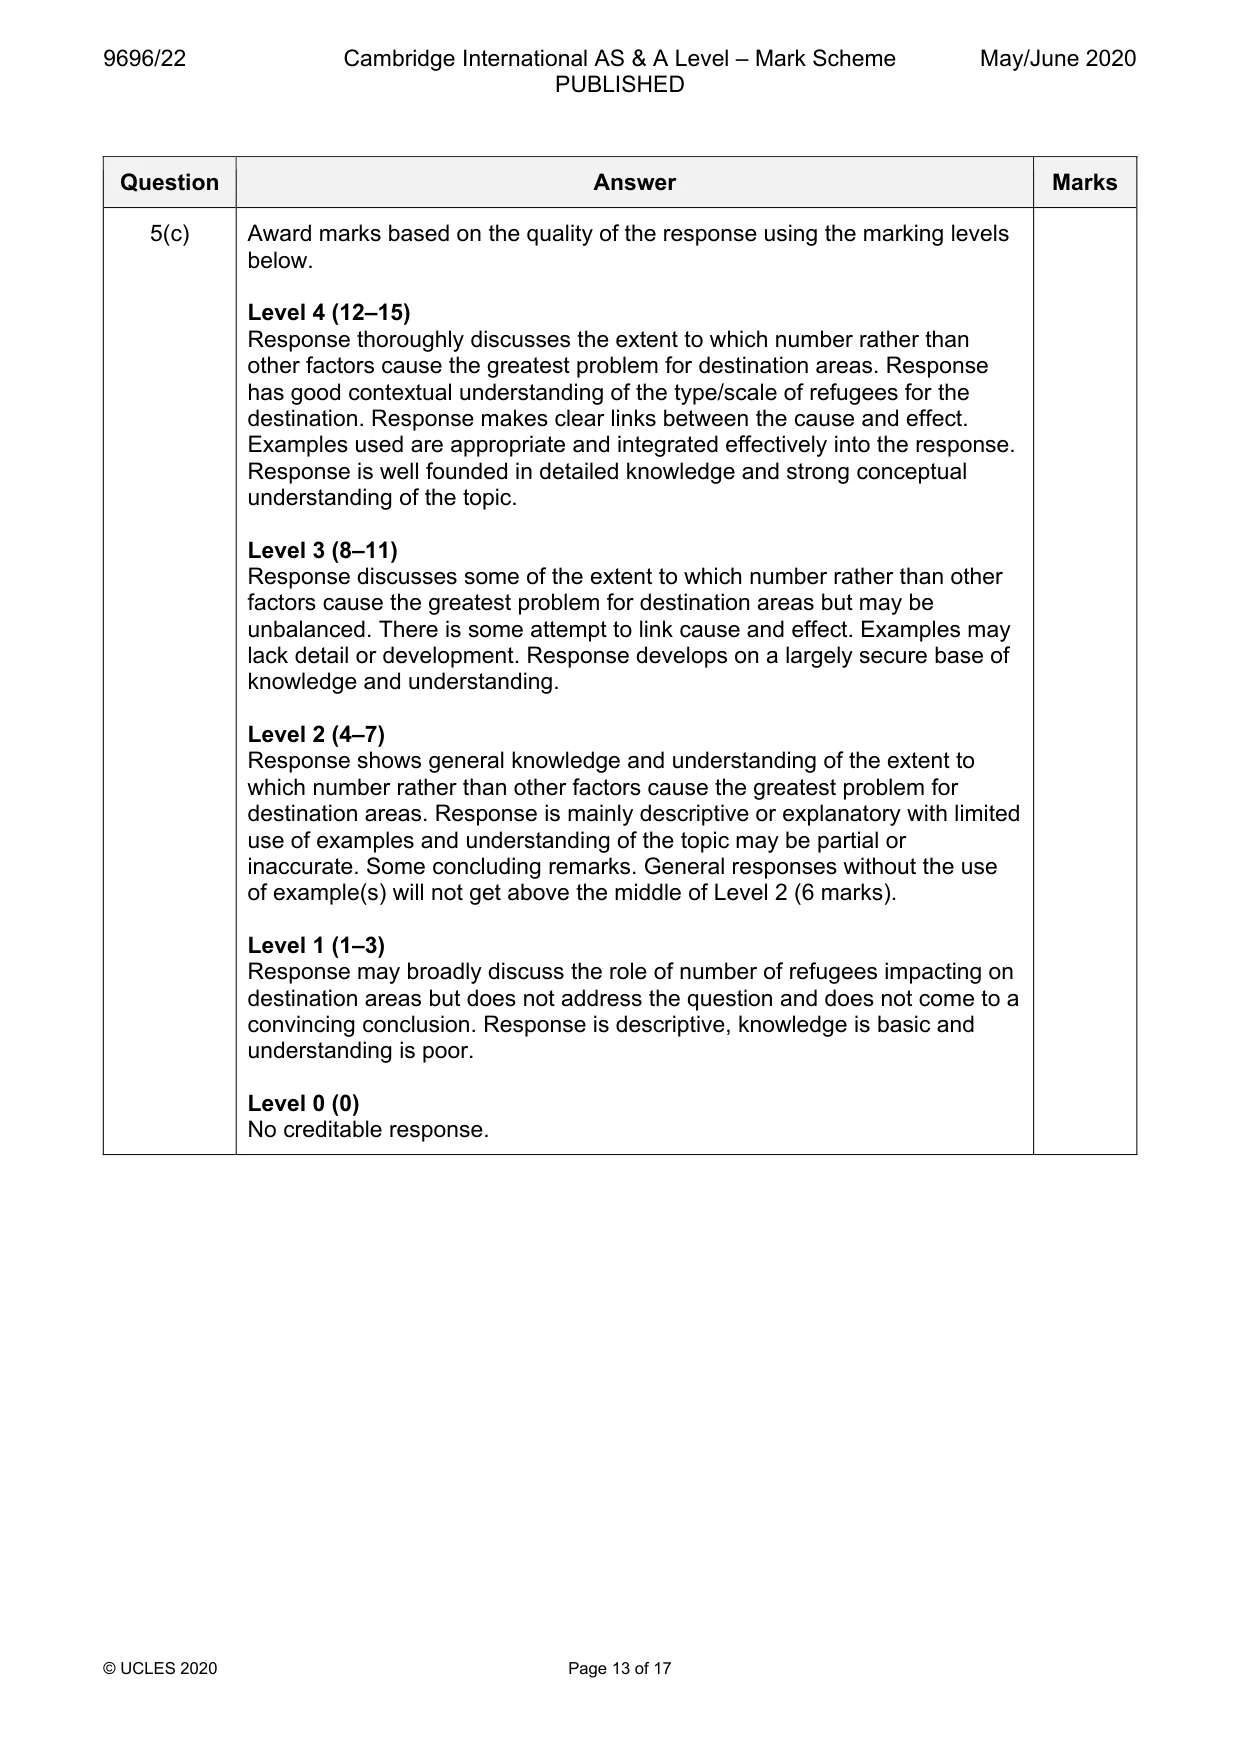
Q5 · Contrast the features of voluntary and forced (involuntary) international migration…
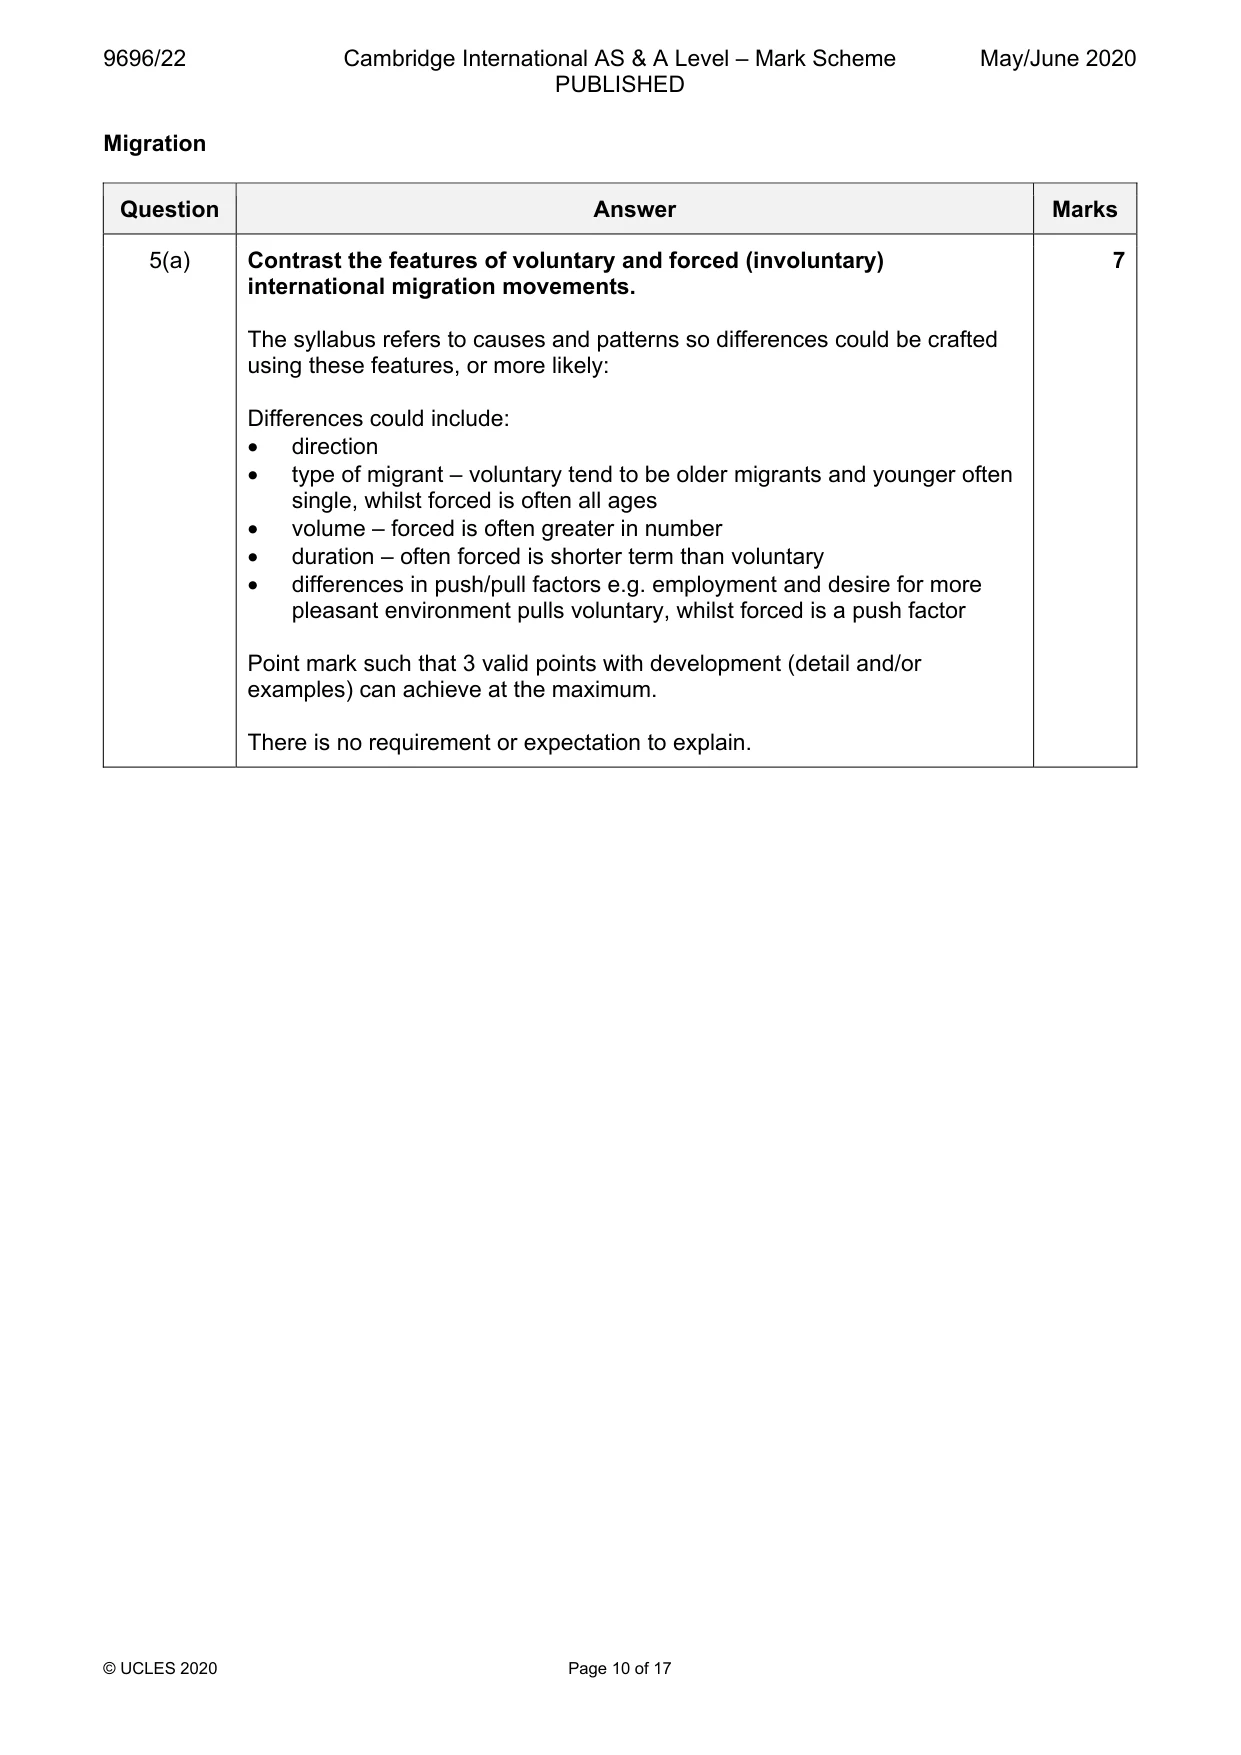
5 (a) Contrast the features of voluntary and forced (involuntary) international migration movements. [7] (b) With the aid of examples, explain the causes of economic migration. [8] (c) ‘It is the number of refugees that causes the greatest problem for receiving/destination areas.’ With the aid of examples, how far do you agree? [15] Population/Migration/Settlement dynamics
Mark scheme: 5(a) Contrast the features of voluntary and forced (involuntary) 7 international migration movements. The syllabus refers to causes and patterns so differences could be crafted using these features, or more likely: Differences could include: • direction • type of migrant – voluntary tend to be older migrants and younger often single, whilst forced is often all ages • volume – forced is often greater in number • duration – often forced is shorter term than voluntary • differences in push/pull factors e.g. employment and desire for more pleasant environment pulls voluntary, whilst forced is a push factor Point mark such that 3 valid points with development (detail and/or examples) can achieve at the maximum. There is no requirement or expectation to explain. Question Answer Marks 5(b) With the aid of examples, explain the causes of economic migration. 8 This is straight from the syllabus so balanced and detailed answers can be expected. Indicative content Most candidates will probably consider the various push and pull forces such as: • pushes including poverty, unemployment, high costs of living, poor housing, lack of promotion • pulls including higher pay, promotion prospects, ability to send monies back to family, cheaper cost of living Beware crediting non-economic motivations, but there are some enabling factors that impact on economic forces such as: • transport provision/cost • level of knowledge of opportunities (including the media) • the role of inertia – personal characteristics • support from governments, relatives, etc. Award marks based on the quality of explanation and breadth of the response using the marking levels below. Level 3 (6–8) Response explains a range of causes of economic migration. Response is well founded in detailed knowledge and strong conceptual understanding of the topic. Any examples used are appropriate and integrated effectively into the response. Level 2 (3–5) Response offers some explanation of causes of economic migration. Response develops on a largely secure base of knowledge and understanding. Examples may lack detail or development. Level 1 (1–2) Response has descriptive points about economic migration. Knowledge is basic and understanding may be inaccurate. Examples are in name only or lacking entirely. Level 0 (0) No creditable response. Question Answer Marks 5(c) ‘It is the number of refugees that causes the greatest problem for 15 receiving/destination areas.’ With the aid of examples, how far do you agree? Candidates are free to develop their own approach to the question and responses will vary depending on the approach chosen. Whichever approach is chosen, essays which address the question and support their argument with relevant examples will be credited. There may be detailed consideration of a case study/one or more examples, or a broadly conceived response, drawing on several examples to illustrate the factors involved. Indicative content Generally it is the large numbers of refugees that cause a range of environmental, economic, social and political problems for the receiving/destination area. Other factors that could be discussed include: • the characteristics of the refugees in comparison with the destination population’s characteristics – age, sex, education, ethnicity, culture, wealth, etc. • the level of knowledge/perception by the refugee of the destination and the perception of the refugees by the destination population • the ability of the destination area to respond – reflecting its resources, technology, space, political will, etc. • the time span – given sufficient time span the destination area might cope • political attitudes in the destination area The view of which factor causes the greatest problem may vary with location (especially within the destination country as a whole), over time (short-term versus long-term) and with who is deciding what is a problem. Question Answer Marks 5(c) Award marks based on the quality of the response using the marking levels below. Level 4 (12–15) Response thoroughly discusses the extent to which number rather than other factors cause the greatest problem for destination areas. Response has good contextual understanding of the type/scale of refugees for the destination. Response makes clear links between the cause and effect. Examples used are appropriate and integrated effectively into the response. Response is well founded in detailed knowledge and strong conceptual understanding of the topic. Level 3 (8–11) Response discusses some of the extent to which number rather than other factors cause the greatest problem for destination areas but may be unbalanced. There is some attempt to link cause and effect. Examples may lack detail or development. Response develops on a largely secure base of knowledge and understanding. Level 2 (4–7) Response shows general knowledge and understanding of the extent to which number rather than other factors cause the greatest problem for destination areas. Response is mainly descriptive or explanatory with limited use of examples and understanding of the topic may be partial or inaccurate. Some concluding remarks. General responses without the use of example(s) will not get above the middle of Level 2 (6 marks). Level 1 (1–3) Response may broadly discuss the role of number of refugees impacting on destination areas but does not address the question and does not come to a convincing conclusion. Response is descriptive, knowledge is basic and understanding is poor. Level 0 (0) No creditable response. Population/Migration/Settlement dynamics
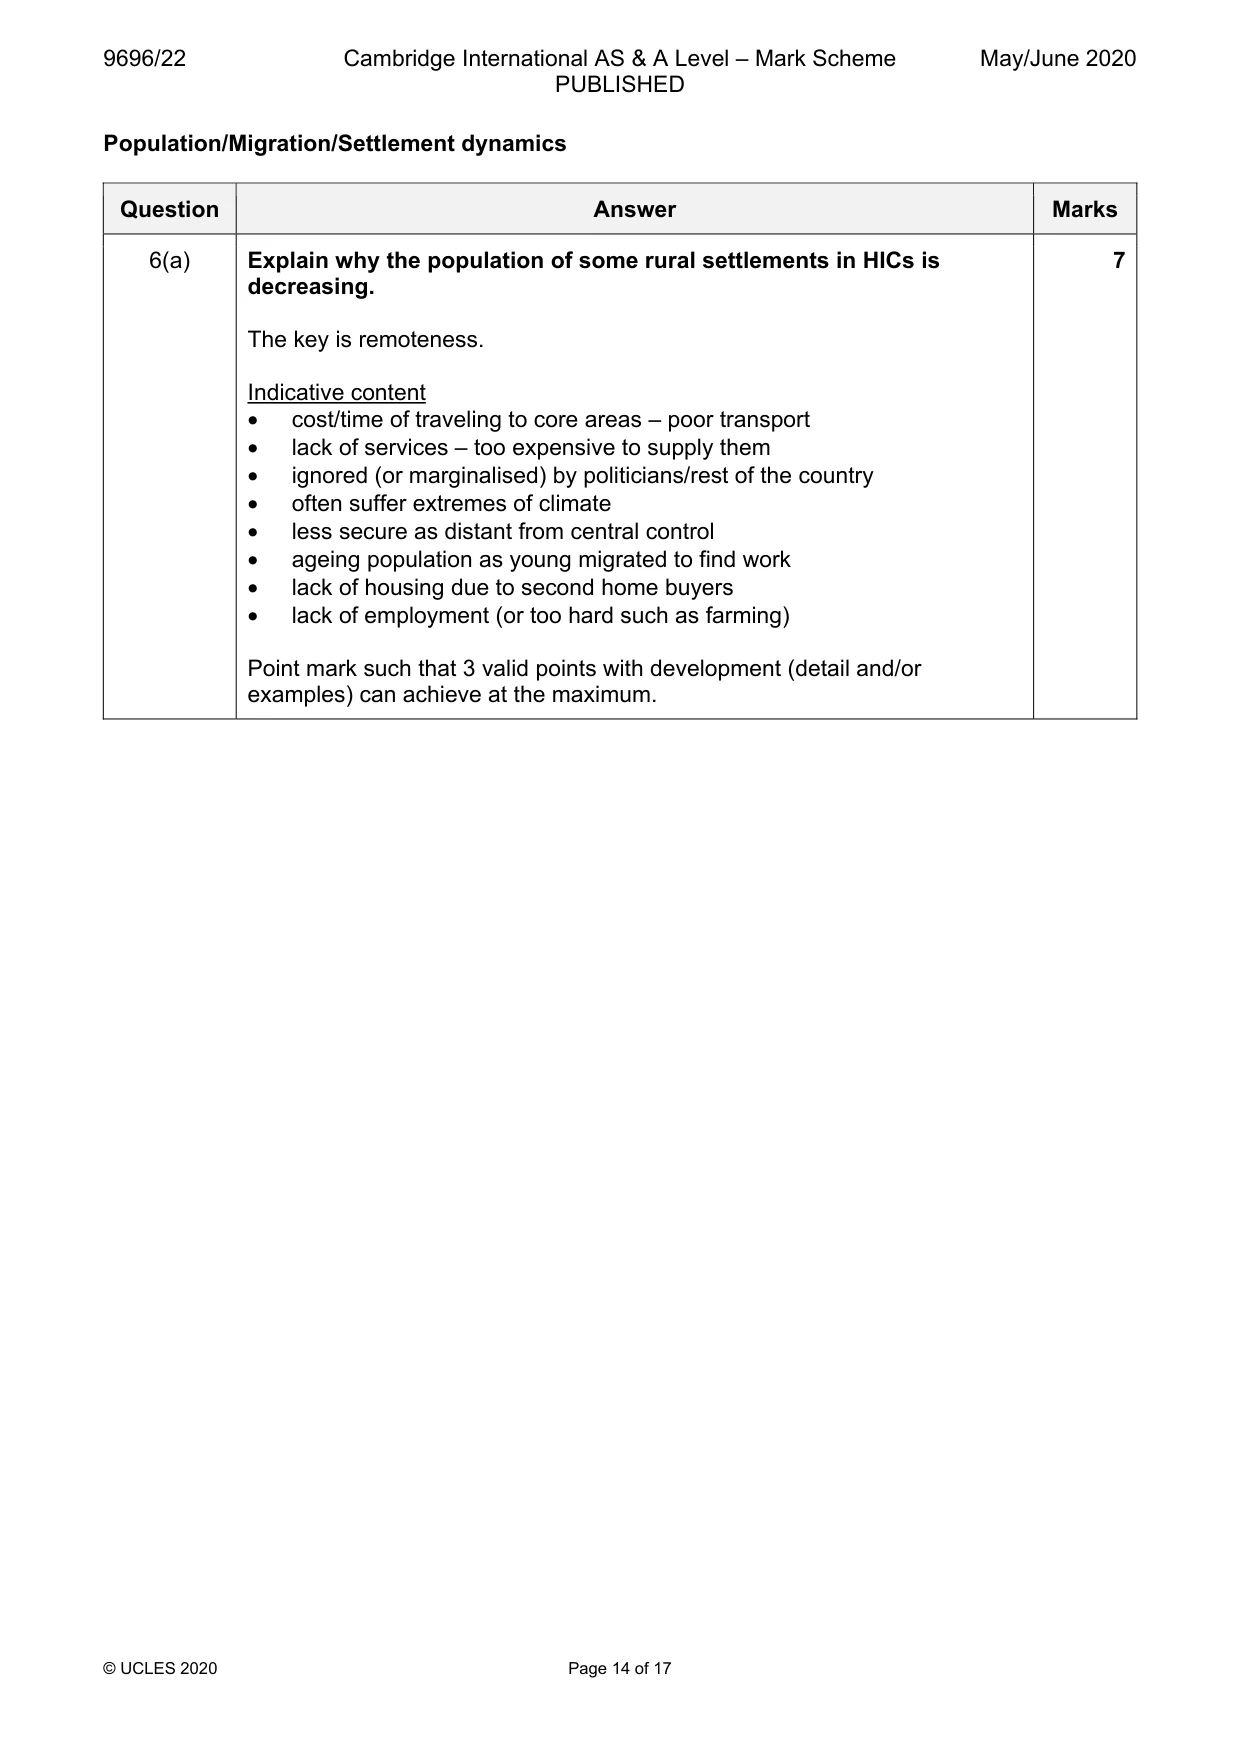
Q6 · Explain why the population of some rural settlements in HICs is decreasing
6 (a) Explain why the population of some rural settlements in HICs is decreasing. [7] (b) Suggest why the provision of services may be difficult in many rural settlements in LICs. [8] (c) With the aid of examples, evaluate the extent to which improvements in transport and communications may make rural settlements more attractive for urban–rural migrants. [15]
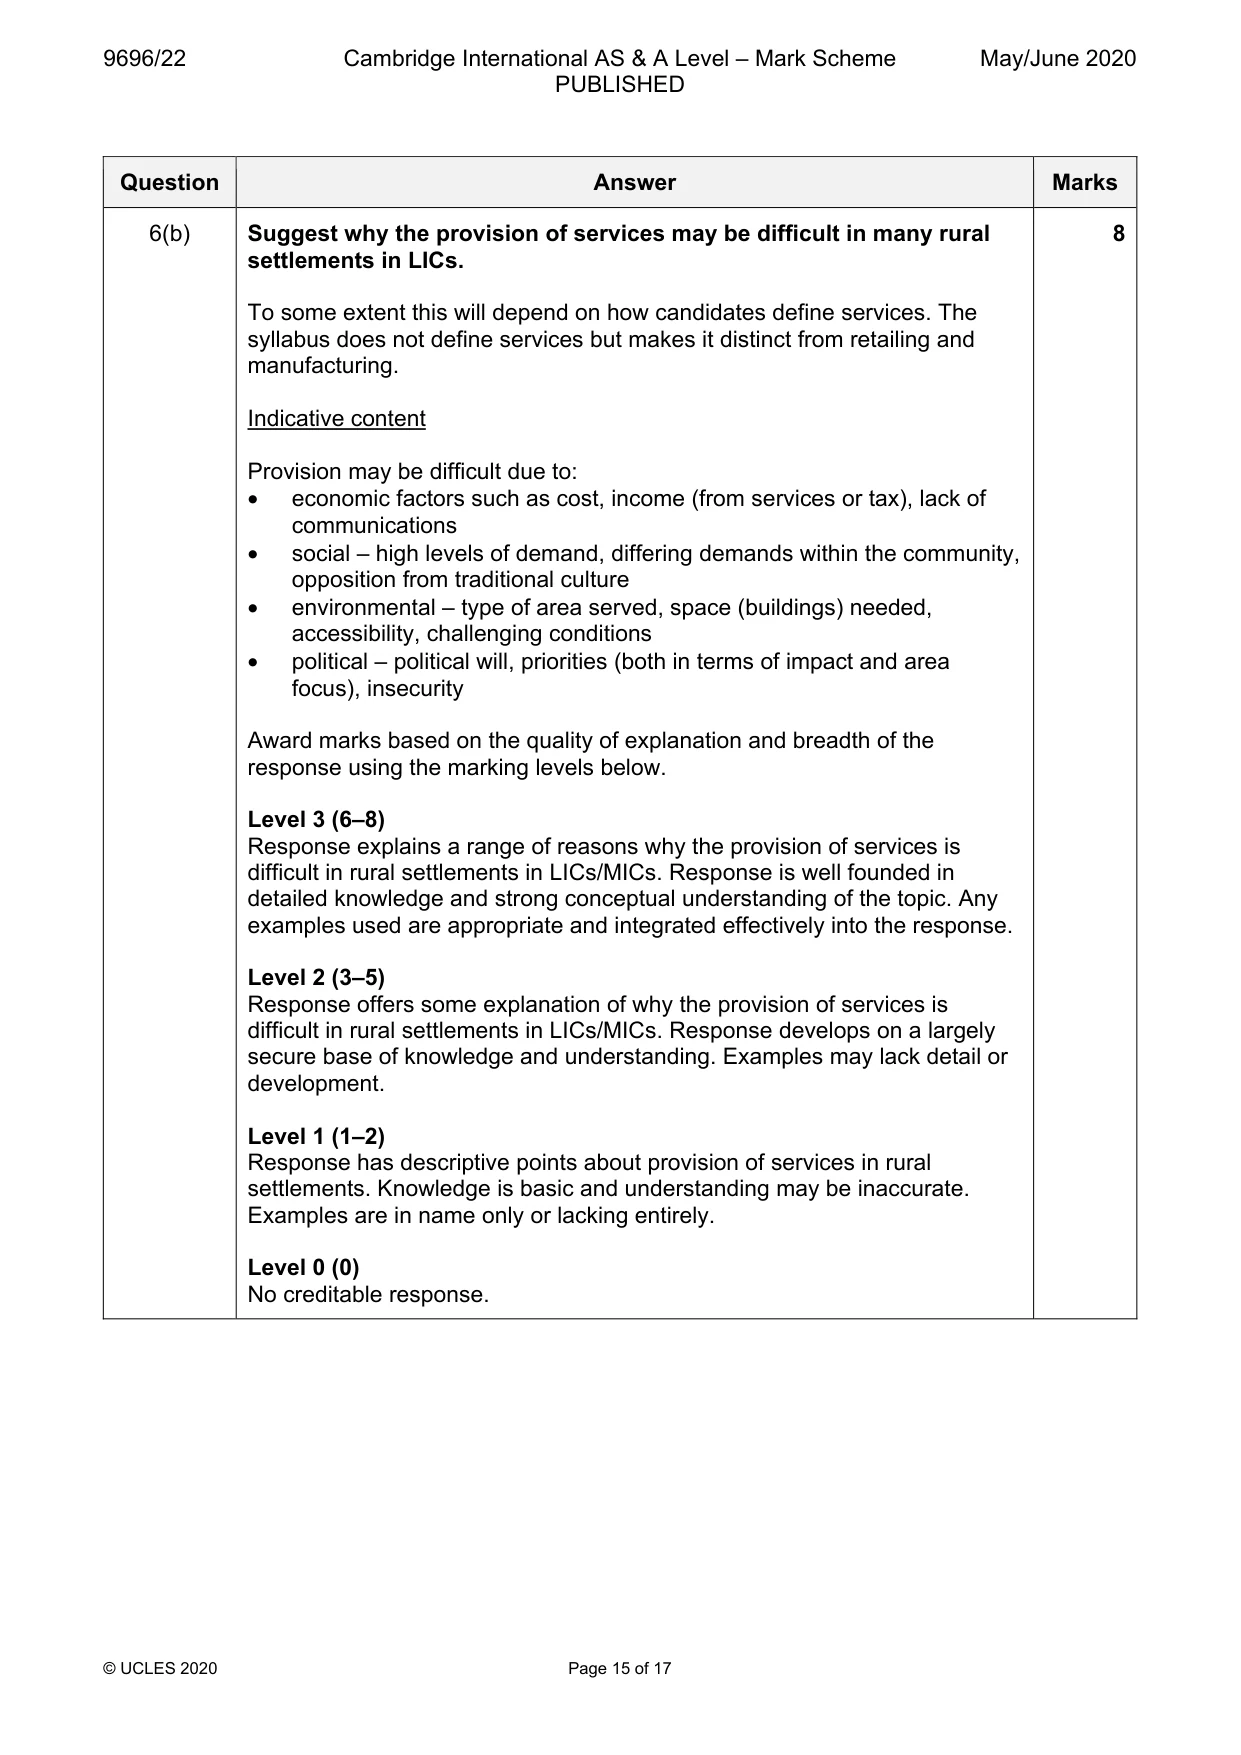
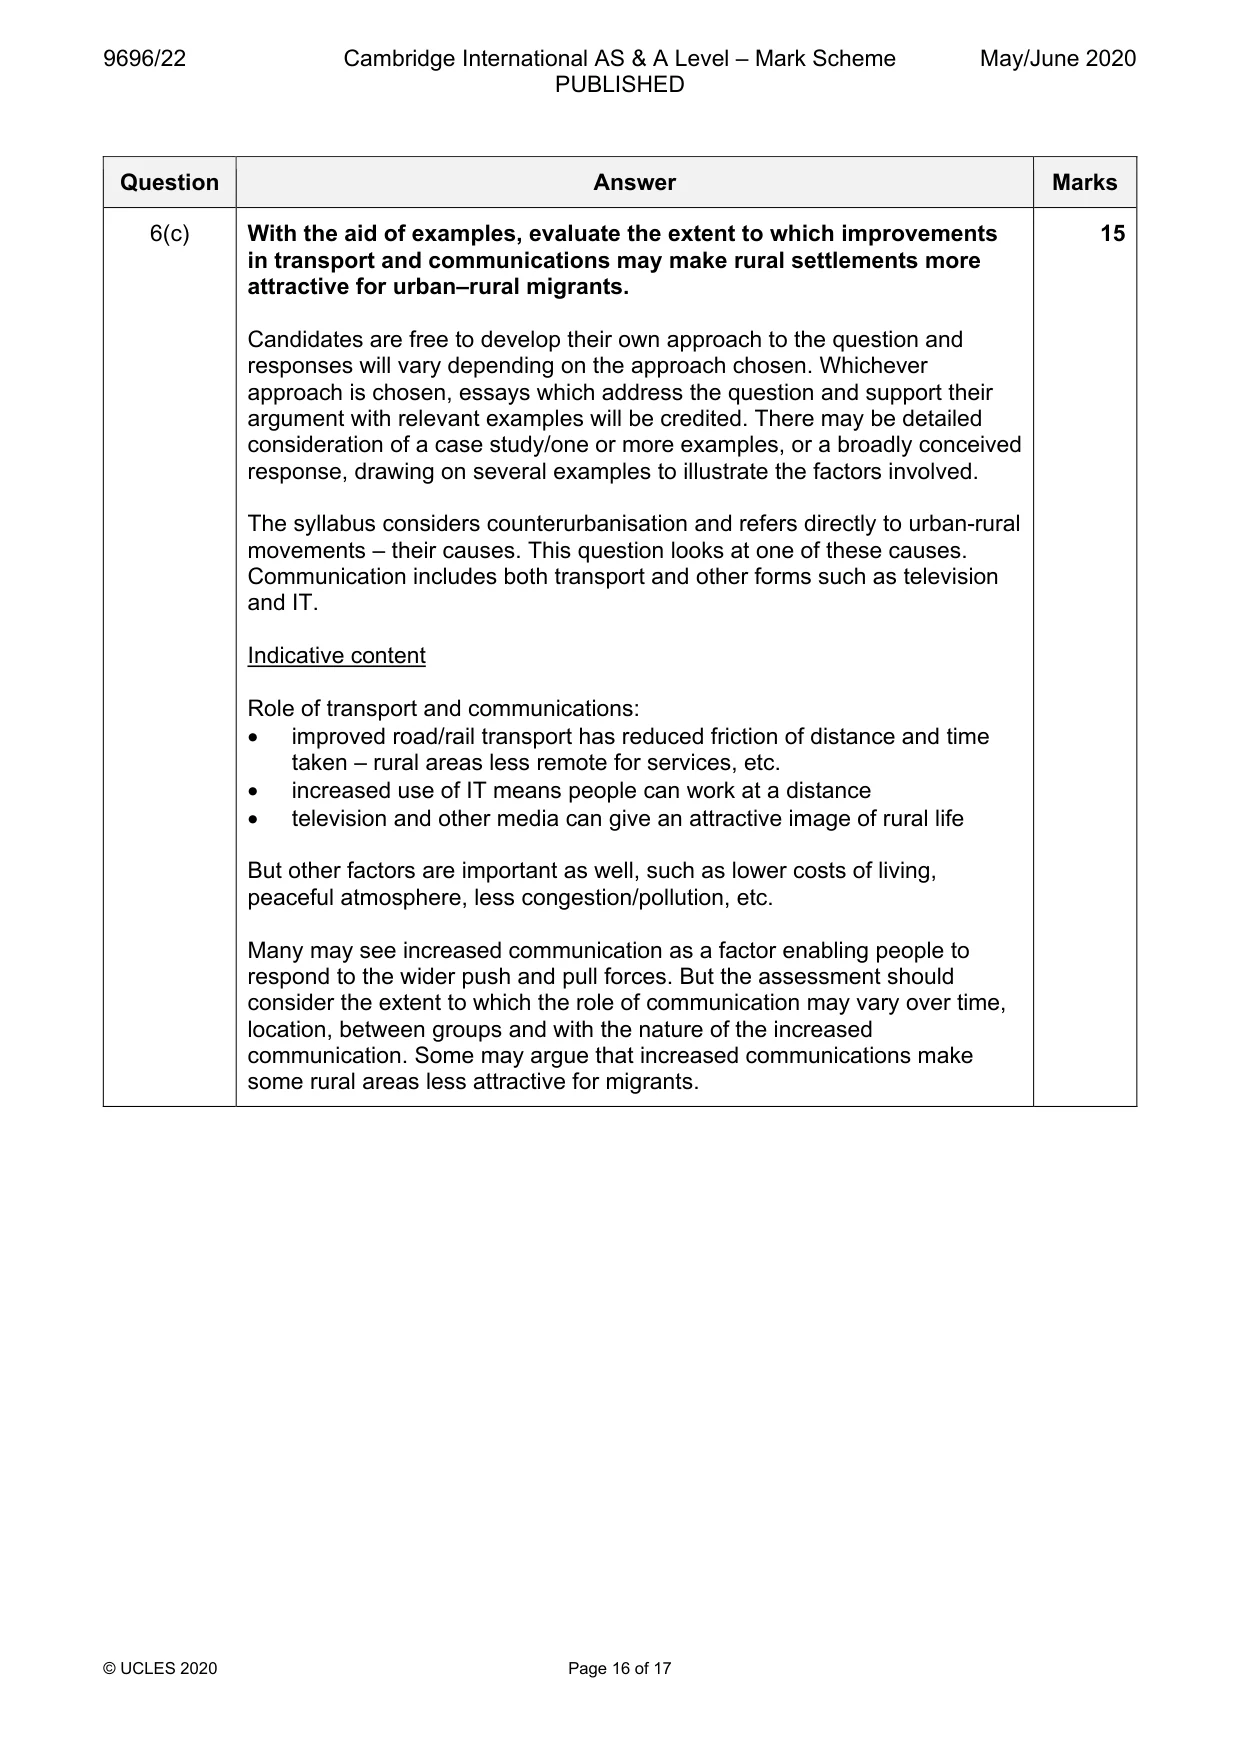
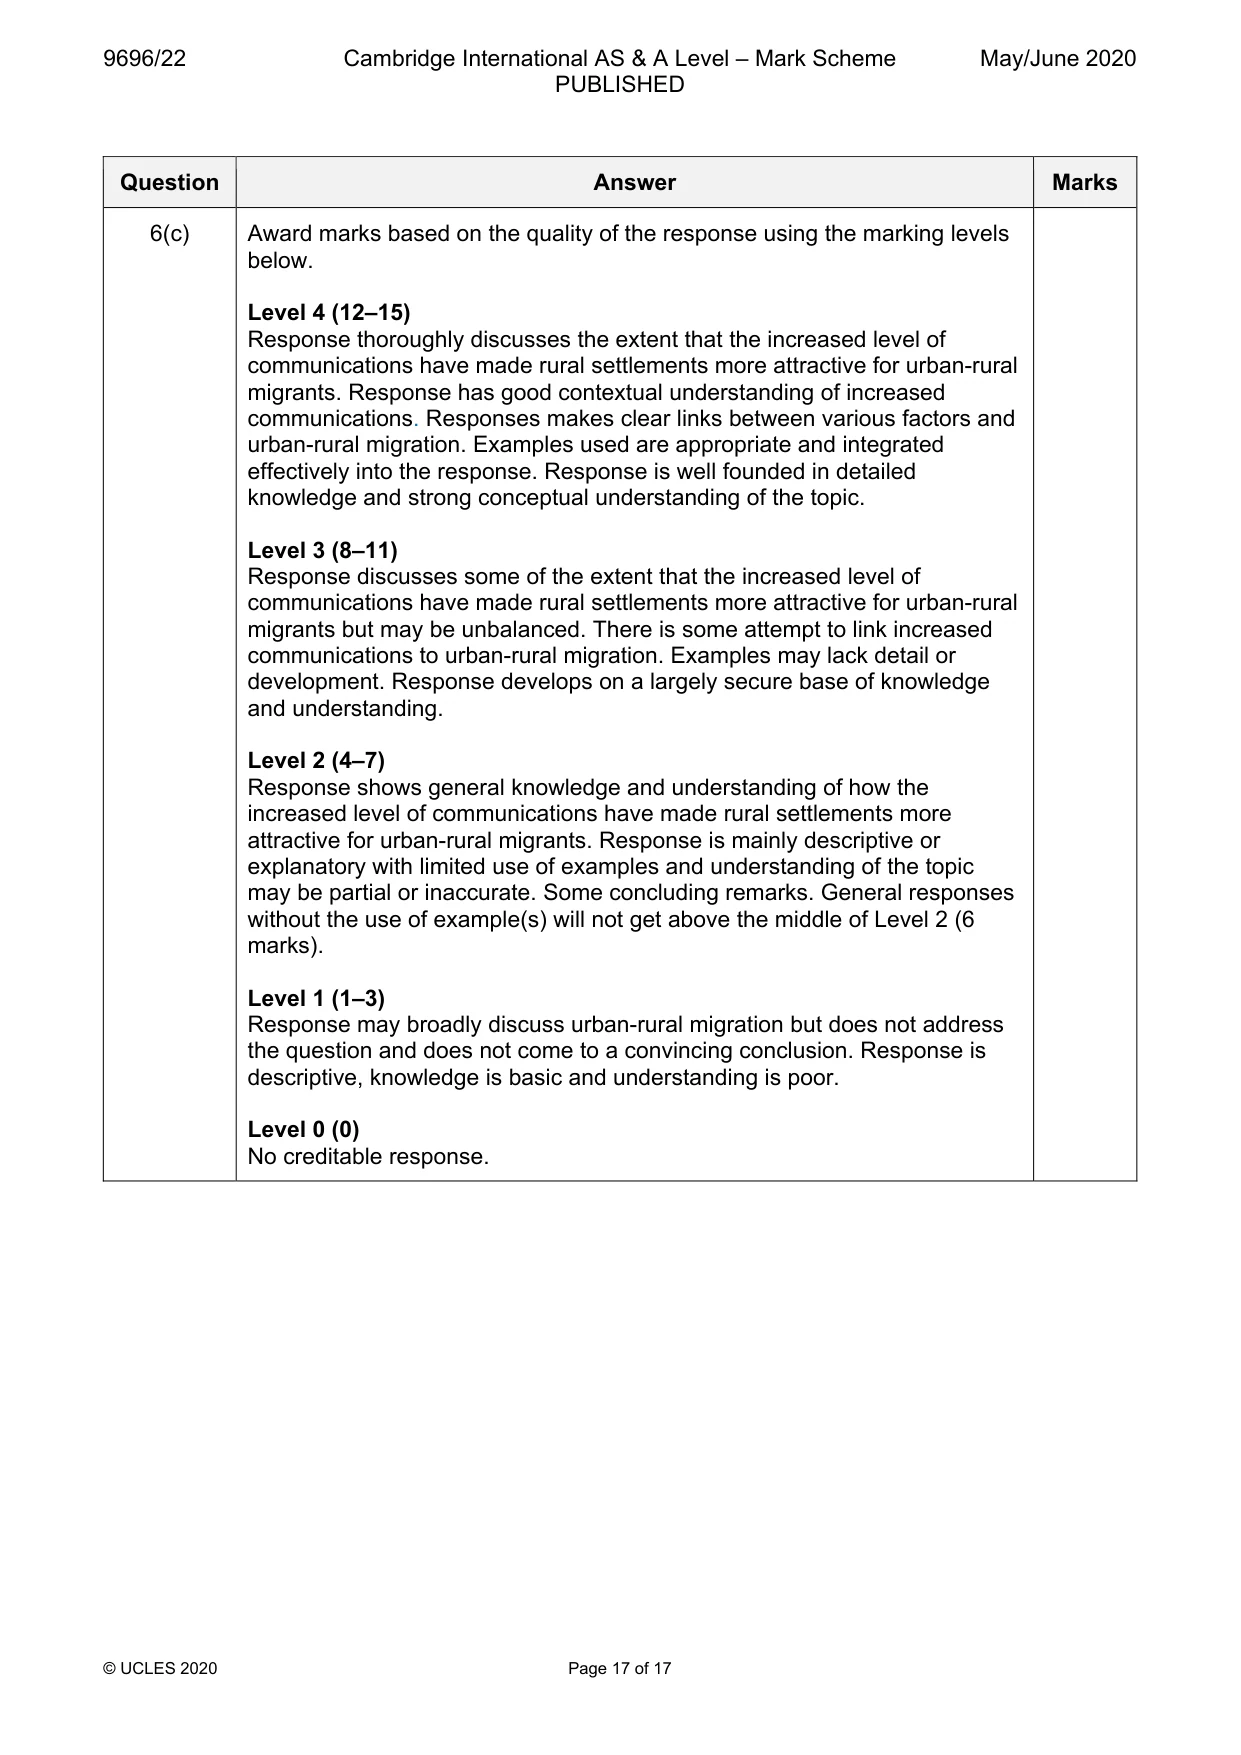
Mark scheme: 6(a) Explain why the population of some rural settlements in HICs is 7 decreasing. The key is remoteness. Indicative content • cost/time of traveling to core areas – poor transport • lack of services – too expensive to supply them • ignored (or marginalised) by politicians/rest of the country • often suffer extremes of climate • less secure as distant from central control • ageing population as young migrated to find work • lack of housing due to second home buyers • lack of employment (or too hard such as farming) Point mark such that 3 valid points with development (detail and/or examples) can achieve at the maximum. Question Answer Marks 6(b) Suggest why the provision of services may be difficult in many rural 8 settlements in LICs. To some extent this will depend on how candidates define services. The syllabus does not define services but makes it distinct from retailing and manufacturing. Indicative content Provision may be difficult due to: • economic factors such as cost, income (from services or tax), lack of communications • social – high levels of demand, differing demands within the community, opposition from traditional culture • environmental – type of area served, space (buildings) needed, accessibility, challenging conditions • political – political will, priorities (both in terms of impact and area focus), insecurity Award marks based on the quality of explanation and breadth of the response using the marking levels below. Level 3 (6–8) Response explains a range of reasons why the provision of services is difficult in rural settlements in LICs/MICs. Response is well founded in detailed knowledge and strong conceptual understanding of the topic. Any examples used are appropriate and integrated effectively into the response. Level 2 (3–5) Response offers some explanation of why the provision of services is difficult in rural settlements in LICs/MICs. Response develops on a largely secure base of knowledge and understanding. Examples may lack detail or development. Level 1 (1–2) Response has descriptive points about provision of services in rural settlements. Knowledge is basic and understanding may be inaccurate. Examples are in name only or lacking entirely. Level 0 (0) No creditable response. Question Answer Marks 6(c) With the aid of examples, evaluate the extent to which improvements 15 in transport and communications may make rural settlements more attractive for urban–rural migrants. Candidates are free to develop their own approach to the question and responses will vary depending on the approach chosen. Whichever approach is chosen, essays which address the question and support their argument with relevant examples will be credited. There may be detailed consideration of a case study/one or more examples, or a broadly conceived response, drawing on several examples to illustrate the factors involved. The syllabus considers counterurbanisation and refers directly to urban-rural movements – their causes. This question looks at one of these causes. Communication includes both transport and other forms such as television and IT. Indicative content Role of transport and communications: • improved road/rail transport has reduced friction of distance and time taken – rural areas less remote for services, etc. • increased use of IT means people can work at a distance • television and other media can give an attractive image of rural life But other factors are important as well, such as lower costs of living, peaceful atmosphere, less congestion/pollution, etc. Many may see increased communication as a factor enabling people to respond to the wider push and pull forces. But the assessment should consider the extent to which the role of communication may vary over time, location, between groups and with the nature of the increased communication. Some may argue that increased communications make some rural areas less attractive for migrants. Question Answer Marks 6(c) Award marks based on the quality of the response using the marking levels below. Level 4 (12–15) Response thoroughly discusses the extent that the increased level of communications have made rural settlements more attractive for urban-rural migrants. Response has good contextual understanding of increased communications. Responses makes clear links between various factors and urban-rural migration. Examples used are appropriate and integrated effectively into the response. Response is well founded in detailed knowledge and strong conceptual understanding of the topic. Level 3 (8–11) Response discusses some of the extent that the increased level of communications have made rural settlements more attractive for urban-rural migrants but may be unbalanced. There is some attempt to link increased communications to urban-rural migration. Examples may lack detail or development. Response develops on a largely secure base of knowledge and understanding. Level 2 (4–7) Response shows general knowledge and understanding of how the increased level of communications have made rural settlements more attractive for urban-rural migrants. Response is mainly descriptive or explanatory with limited use of examples and understanding of the topic may be partial or inaccurate. Some concluding remarks. General responses without the use of example(s) will not get above the middle of Level 2 (6 marks). Level 1 (1–3) Response may broadly discuss urban-rural migration but does not address the question and does not come to a convincing conclusion. Response is descriptive, knowledge is basic and understanding is poor. Level 0 (0) No creditable response.
What was in this paper
The subtopics covered by these 6 questions, and how many questions each got. Open one in a new tab to see every Cambridge question on it.