Cambridge A Level Geography 9696 — 2018 Oct/Nov Paper 4 · Variant 2
9696/42/O/N/18 · 12 questions · 60 marks · ≈68 min
The question paper and its mark scheme, free to read here and free to download. This is Cambridge’s own paper, exactly as it was sat.
Question paper4 pages


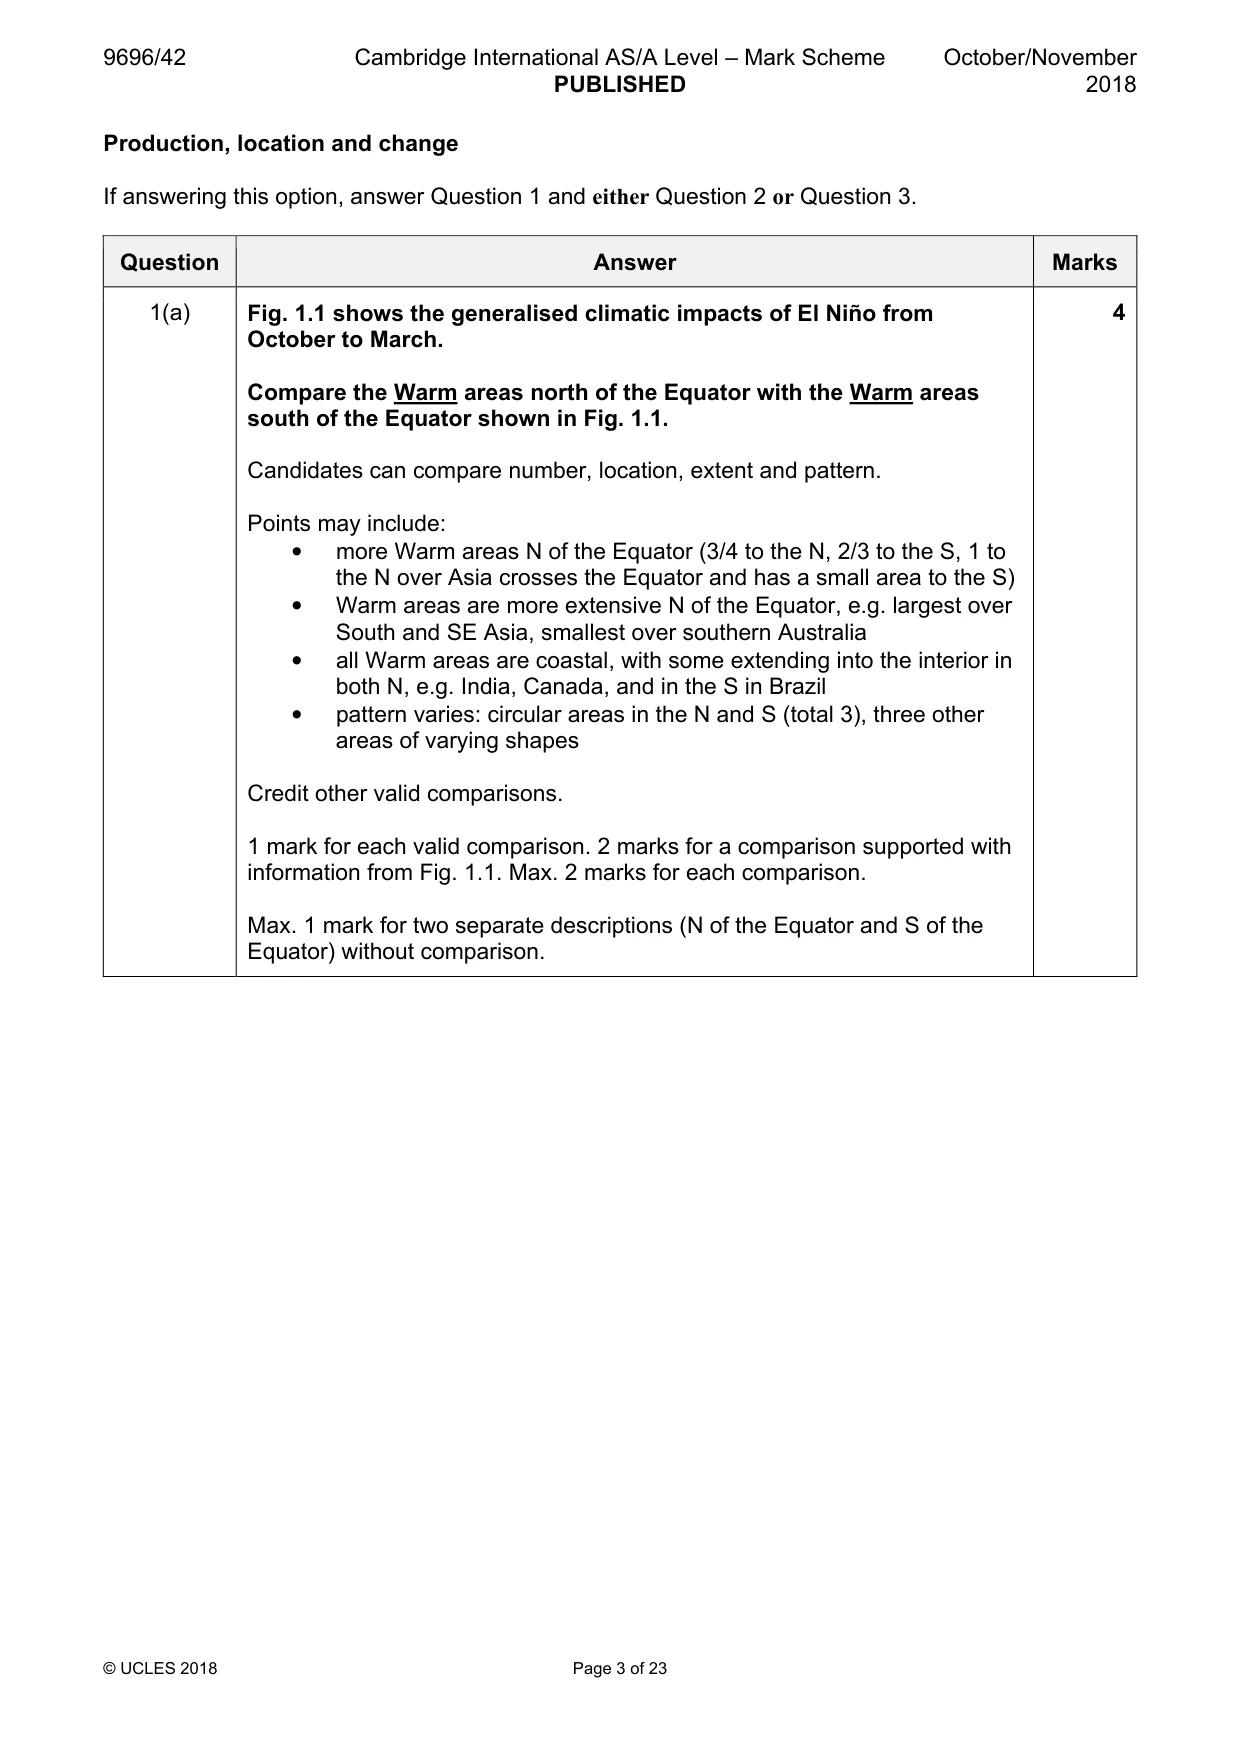
Mark scheme23 pages
Answers below. Sit the paper first if you are practising.






Questions as text
Q1 · The generalised climatic impacts of El Niño from October to March
1 Fig. 1.1 shows the generalised climatic impacts of El Niño from October to March. (a) Compare the Warm areas north of the Equator with the Warm areas south of the Equator shown in Fig. 1.1. [4] (b) Explain what the consequences of warmer drier climates may be for agricultural production in LICs/MICs. [6]
Mark scheme: Question Answer Marks 1(a) Fig. 1.1 shows the generalised climatic impacts of El Niño from 4 October to March. Compare the Warm areas north of the Equator with the Warm areas south of the Equator shown in Fig. 1.1. Candidates can compare number, location, extent and pattern. Points may include: • more Warm areas N of the Equator (3/4 to the N, 2/3 to the S, 1 to the N over Asia crosses the Equator and has a small area to the S) • Warm areas are more extensive N of the Equator, e.g. largest over South and SE Asia, smallest over southern Australia • all Warm areas are coastal, with some extending into the interior in both N, e.g. India, Canada, and in the S in Brazil • pattern varies: circular areas in the N and S (total 3), three other areas of varying shapes Credit other valid comparisons. 1 mark for each valid comparison. 2 marks for a comparison supported with information from Fig. 1.1. Max. 2 marks for each comparison. Max. 1 mark for two separate descriptions (N of the Equator and S of the Equator) without comparison. 1(b) Explain what the consequences of warmer drier climates may be for 6 agricultural production in LICs/MICs. Candidates should explain the consequences of warmer drier climates for agricultural production in LICs/MICs. LICs/MICs may be taken as one group of countries or as a comparison between LICS and MICs. The answer does not need to be comprehensive to gain full marks. Consequences may include: • decreased yields / crop failure • hunger / starvation leading to emigration of farmers and abandoned holdings • increased market prices (as supply is low) means higher incomes for some • increased soil erosion, e.g. by wind, given loss of soil moisture • debt, as farmers have little to sell and cannot pay for inputs or repay loans, e.g. for fertilisers • need for, and investment in, irrigation • change in crops planted to those which tolerate drier conditions • change in pastoral systems as less grazing is available, e.g. stall feeding or irrigated pastures • other valid points Generic response: max. 4 marks. Award marks based on the quality of the explanation and breadth of the response using the marking levels below. Level 3 5–6 Response explains a range of consequences of warmer drier climates for agricultural production in LICs/MICs. Response is well-founded in detailed knowledge and strong conceptual understanding of the topic. Any examples used are appropriate and integrated effectively into the response. Level 2 3–4 Response addresses consequences of warmer drier climates for agricultural production in LICs/MICs in a limited manner. Response develops on a largely secure base of knowledge and understanding. Examples may lack detail or development. Level 1 1–2 Response comprises one or more descriptive points about agricultural production in LICs/MICs with little or no explanation of the consequences of warmer drier climates. Knowledge is basic and understanding may be inaccurate. Examples are in name only or lacking entirely. Level 0 0 No creditable response.
Q2 · Assess the success of one or more attempts to introduce agricultural change
2 Assess the success of one or more attempts to introduce agricultural change. [20]
Mark scheme: 2 Assess the success of one or more attempts to introduce agricultural 20 change. Candidates are free to develop their own approach to the question and responses will vary depending on the example(s) chosen. Whichever approach is chosen, essays which use one or more relevant examples and which assess the success (or failure) of the attempt(s) carefully will be credited. There may be detailed consideration of one example or a broadly conceived response drawing on several examples. There must be some attempt at assessing the success of introducing agricultural change. Success may be considered in relation to specific success criteria, such as agricultural productivity or output, or in relation to meeting aims, delivering change on time and within budget, helping farmers, feeding the nation, producing export crops, etc. It may include consideration of the difficulties encountered, other problems, perhaps unforeseen, and the challenges which remain. Contextual understanding of the different viewpoints of different stakeholders and of success varying in different places should be credited. Award marks based on the quality of the response using the marking levels below. Level 4 16–20 Response considers thoroughly the success of the chosen attempt(s) to introduce agricultural change in different ways. An effective and sustained assessment with a sound conclusion. Response is well-founded in detailed exemplar knowledge, insightful understanding of the context and strong conceptual understanding of the topic. Level 3 11–15 Response considers one or more attempts to introduce agricultural change with a focus on success. Response is broadly an assessment, comprising some explanatory or narrative content and a conclusion. Response develops on a base of knowledge and understanding which is largely secure with some exemplar detail. Level 2 6–10 Response demonstrates some knowledge and understanding of agricultural change in which success may not be identified clearly or developed. Response is mainly descriptive or explanatory in approach and contains a brief or thinly supported assessment. Responses without the use of an example or examples do not get above the middle of Level 2 (8 marks). Level 1 1–5 Response makes a few general points about agriculture without the necessary focus on agricultural change and the success of its introduction. A descriptive response comprising a few simple points. Knowledge is basic and understanding may be poor and lack relevance to the question set. Level 0 0 No creditable response.
Q3 · To what extent does government policy influence the location of manufacturing industry?
3 To what extent does government policy influence the location of manufacturing industry? [20] [Total: 30] Environmental management If answering this option, answer Question 4 and either Question 5 or Question 6.
Mark scheme: 3 To what extent does government policy influence the location of 20 manufacturing industry? Candidates are free to develop their own approach to the question and responses will vary depending on the example(s) chosen. Whichever approach is chosen, essays which use one or more relevant examples and which assess carefully the influence of government policy and other factors on the location of manufacturing will be credited. There may be detailed consideration of one example or a broadly conceived response drawing on several examples. There must be some attempt at assessing the influence of government policy. This could be, for example, in relation to planning, investment in certain locations, financial incentives, industrial estates and EPZs, or through associated factors such as transport. The assessment may be relative to the influence of other factors: land, labour, capital, markets, materials, technology, economies and diseconomies of scale, inertia and transport, as listed in the syllabus, or any other factor the candidate introduces, such as behavioural factors relating to the locational choices of industrialists. Award marks based on the quality of the response using the marking levels below. Level 4 16–20 Response considers thoroughly the influence of government policy on the location of manufacturing industry and the influence of other factors. An effective and sustained assessment with a sound conclusion. Response is well-founded in detailed exemplar knowledge, insightful understanding of the context and strong conceptual understanding of the topic. Level 3 11–15 Response considers the influence of government policy on the location of manufacturing industry and is likely to consider the influence of one or more other factors. Response is broadly an assessment, comprising some explanatory or narrative content and a conclusion. Response develops on a base of knowledge and understanding which is largely secure with some use of examples and exemplar detail. Level 2 6–10 Response demonstrates some knowledge and understanding of the location of manufacturing industry in which the influence of government policy may not be identified clearly or developed. Response is mainly descriptive or explanatory in approach and contains a brief or thinly supported assessment. Responses without the use of an example or examples do not get above the middle of Level 2 (8 marks). 3 Level 1 1–5 Response makes a few general points about manufacturing without the necessary focus on location and the influence of government policy on it. A descriptive response comprising a few simple points. Knowledge is basic and understanding may be poor and lack relevance to the question set. Level 0 0 No creditable response. Environmental management If answering this option, answer Question 4 and either Question 5 or Question 6.
Q4 · A photograph which shows women washing cooking pots in a stagnant pond in an MIC in South…
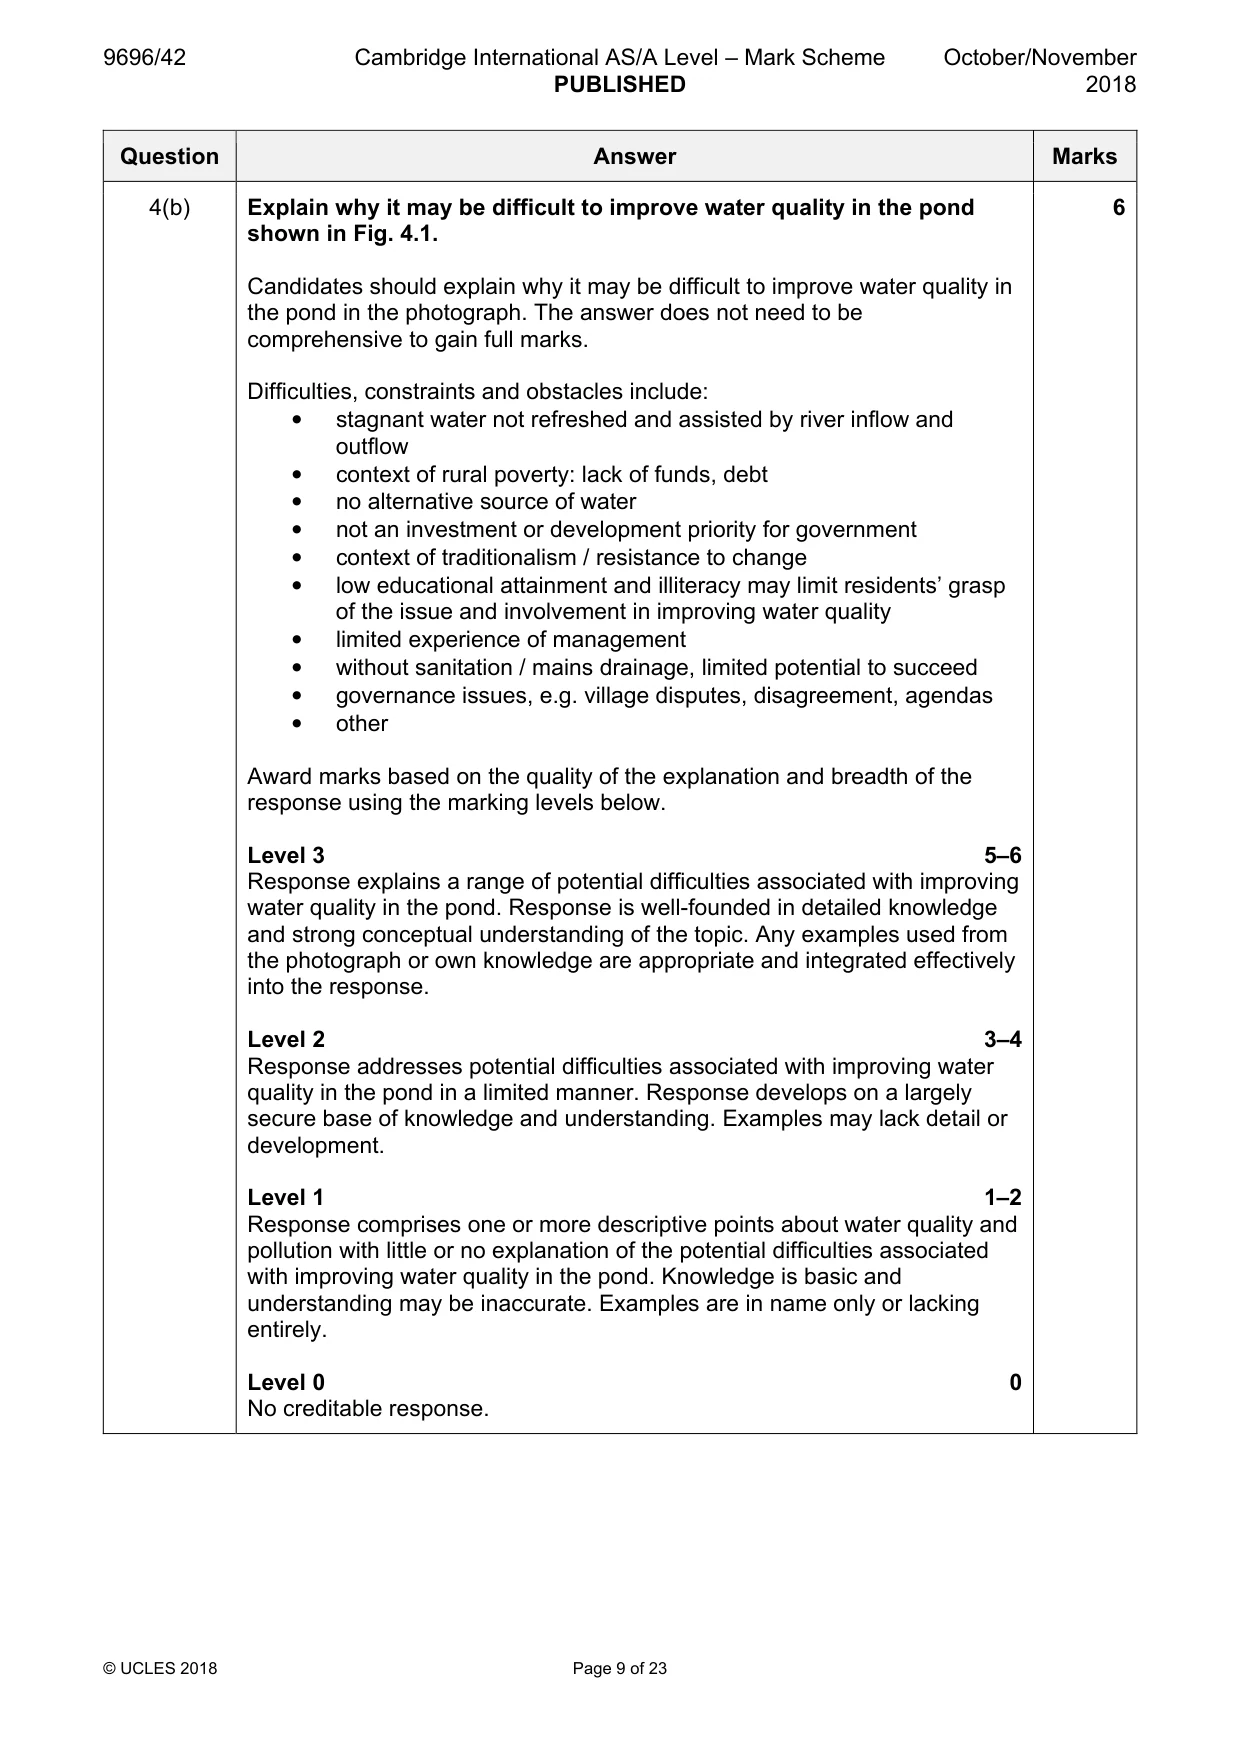
4 Fig. 4.1 is a photograph which shows women washing cooking pots in a stagnant pond in an MIC in South Asia. (a) Describe the sources of pollution affecting the pond, giving evidence from Fig. 4.1. [4] (b) Explain why it may be difficult to improve water quality in the pond shown in Fig. 4.1. [6]
Mark scheme: 4(a) Fig. 4.1 is a photograph which shows women washing cooking pots in 4 a stagnant pond in an MIC in South Asia. Describe the sources of pollution affecting the pond, giving evidence from Fig. 4.1. Candidates should give evidence from the photograph to support their description. Sources of water pollution in the pond which can be seen are: • a village / settlement bordering the pond, with huts close to the water’s edge. Contamination from waste water, toileting (lack of mains drainage highly likely) and domestic activities, e.g. the women washing cooking pots • litter and waste visible around the edge of the pond / on the bank could be carried into the water by rain or wind • animals (three visible, two cattle and a dog), which drink the water and may urinate and defecate in or near it • also accept that after rain, water will drain into the pond from the surrounding area which may carry effluents, fertilisers, etc. Credit each source with evidence 1 mark or 2 marks to the maximum. For valid sources of pollution without evidence from Fig. 4.1, max. 1 mark. 4(b) Explain why it may be difficult to improve water quality in the pond 6 shown in Fig. 4.1. Candidates should explain why it may be difficult to improve water quality in the pond in the photograph. The answer does not need to be comprehensive to gain full marks. Difficulties, constraints and obstacles include: • stagnant water not refreshed and assisted by river inflow and outflow • context of rural poverty: lack of funds, debt • no alternative source of water • not an investment or development priority for government • context of traditionalism / resistance to change • low educational attainment and illiteracy may limit residents’ grasp of the issue and involvement in improving water quality • limited experience of management • without sanitation / mains drainage, limited potential to succeed • governance issues, e.g. village disputes, disagreement, agendas • other Award marks based on the quality of the explanation and breadth of the response using the marking levels below. Level 3 5–6 Response explains a range of potential difficulties associated with improving water quality in the pond. Response is well-founded in detailed knowledge and strong conceptual understanding of the topic. Any examples used from the photograph or own knowledge are appropriate and integrated effectively into the response. Level 2 3–4 Response addresses potential difficulties associated with improving water quality in the pond in a limited manner. Response develops on a largely secure base of knowledge and understanding. Examples may lack detail or development. Level 1 1–2 Response comprises one or more descriptive points about water quality and pollution with little or no explanation of the potential difficulties associated with improving water quality in the pond. Knowledge is basic and understanding may be inaccurate. Examples are in name only or lacking entirely. Level 0 0 No creditable response.
Q5 · ‘Fossil fuels have no future role in global energy supply.’ How far do you agree?
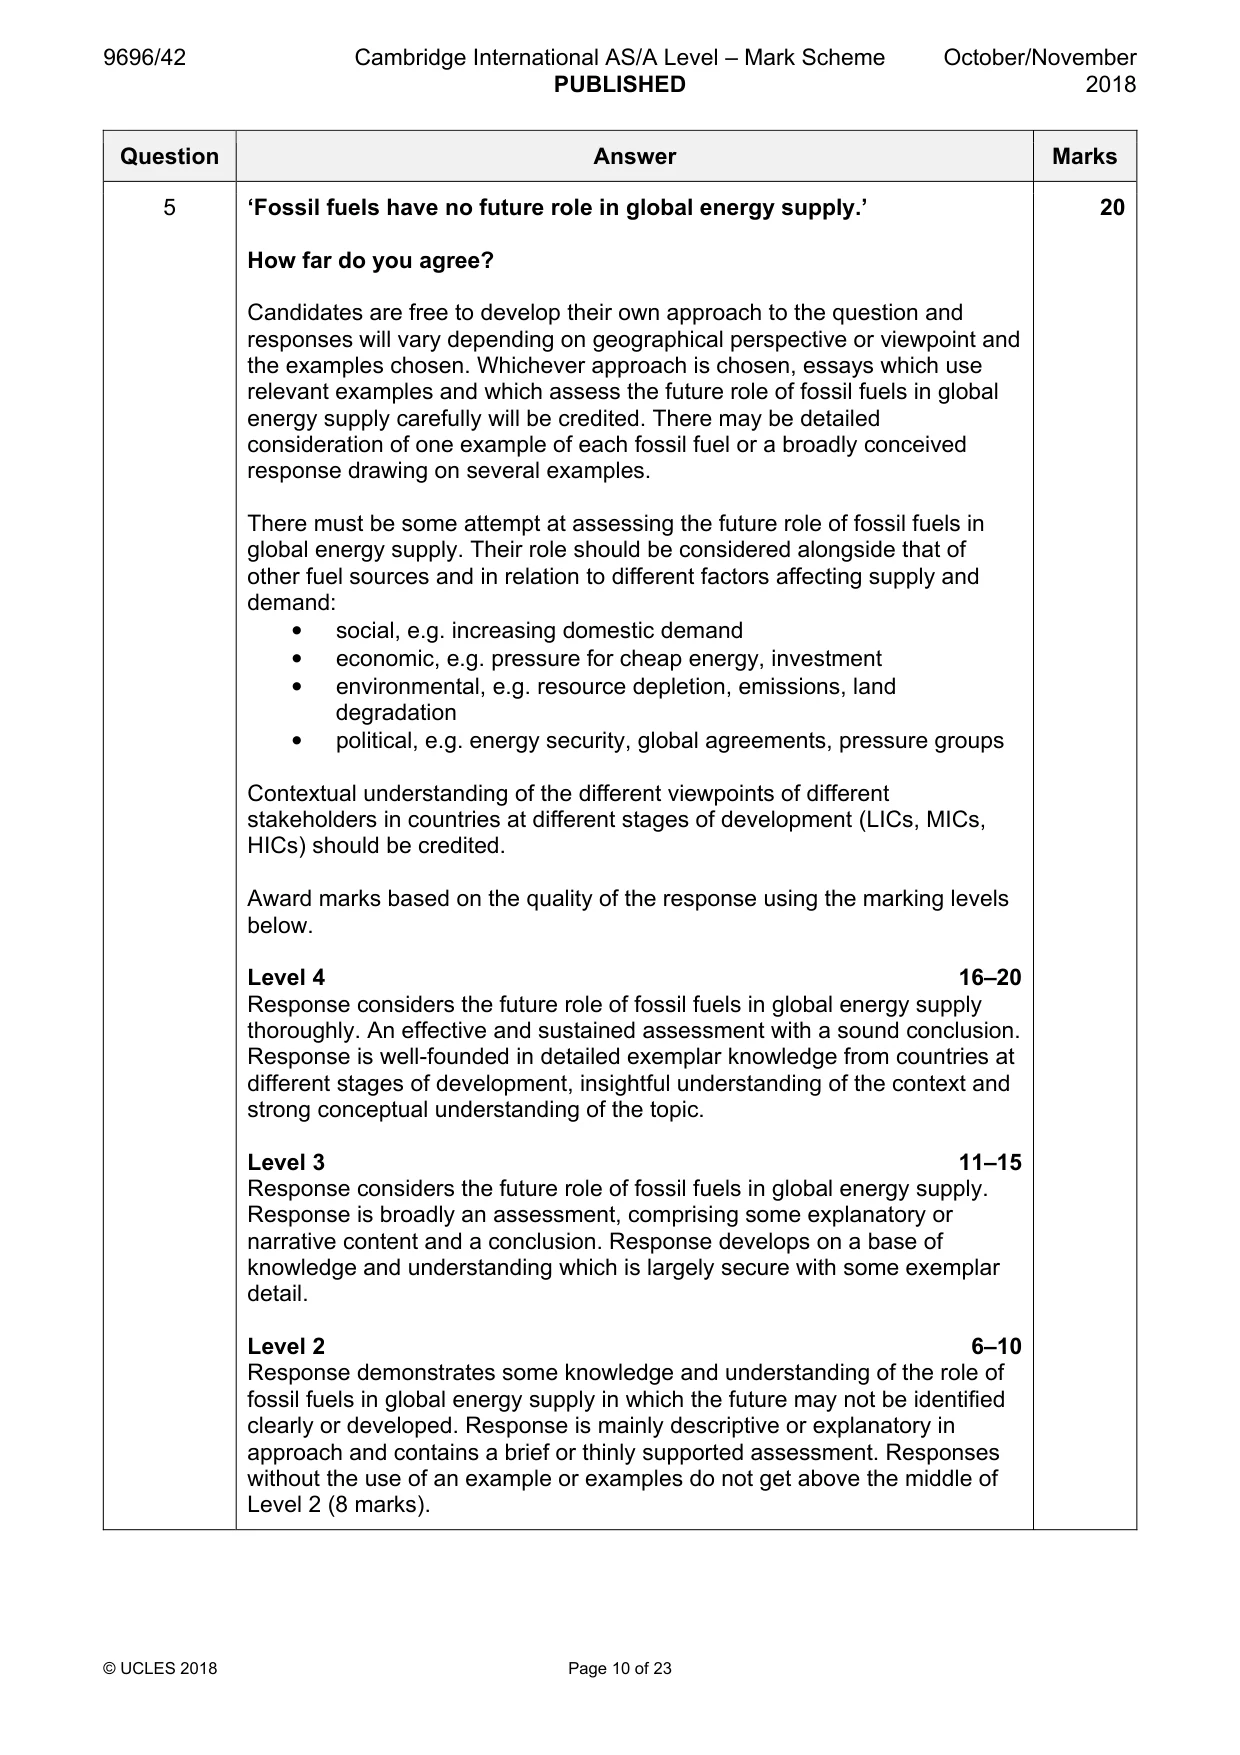
5 ‘Fossil fuels have no future role in global energy supply.’ How far do you agree? [20]
Mark scheme: 5 ‘Fossil fuels have no future role in global energy supply.’ 20 How far do you agree? Candidates are free to develop their own approach to the question and responses will vary depending on geographical perspective or viewpoint and the examples chosen. Whichever approach is chosen, essays which use relevant examples and which assess the future role of fossil fuels in global energy supply carefully will be credited. There may be detailed consideration of one example of each fossil fuel or a broadly conceived response drawing on several examples. There must be some attempt at assessing the future role of fossil fuels in global energy supply. Their role should be considered alongside that of other fuel sources and in relation to different factors affecting supply and demand: • social, e.g. increasing domestic demand • economic, e.g. pressure for cheap energy, investment • environmental, e.g. resource depletion, emissions, land degradation • political, e.g. energy security, global agreements, pressure groups Contextual understanding of the different viewpoints of different stakeholders in countries at different stages of development (LICs, MICs, HICs) should be credited. Award marks based on the quality of the response using the marking levels below. Level 4 16–20 Response considers the future role of fossil fuels in global energy supply thoroughly. An effective and sustained assessment with a sound conclusion. Response is well-founded in detailed exemplar knowledge from countries at different stages of development, insightful understanding of the context and strong conceptual understanding of the topic. Level 3 11–15 Response considers the future role of fossil fuels in global energy supply. Response is broadly an assessment, comprising some explanatory or narrative content and a conclusion. Response develops on a base of knowledge and understanding which is largely secure with some exemplar detail. Level 2 6–10 Response demonstrates some knowledge and understanding of the role of fossil fuels in global energy supply in which the future may not be identified clearly or developed. Response is mainly descriptive or explanatory in approach and contains a brief or thinly supported assessment. Responses without the use of an example or examples do not get above the middle of Level 2 (8 marks). 5 Level 1 1–5 Response makes a few general points about global energy supply without the necessary focus on fossil fuels and their future role. A descriptive response comprising a few simple points. Knowledge is basic and understanding may be poor and lack relevance to the question set. Level 0 0 No creditable response.
Q6 · Evaluate the effectiveness of attempts to protect one or more environments at risk of…
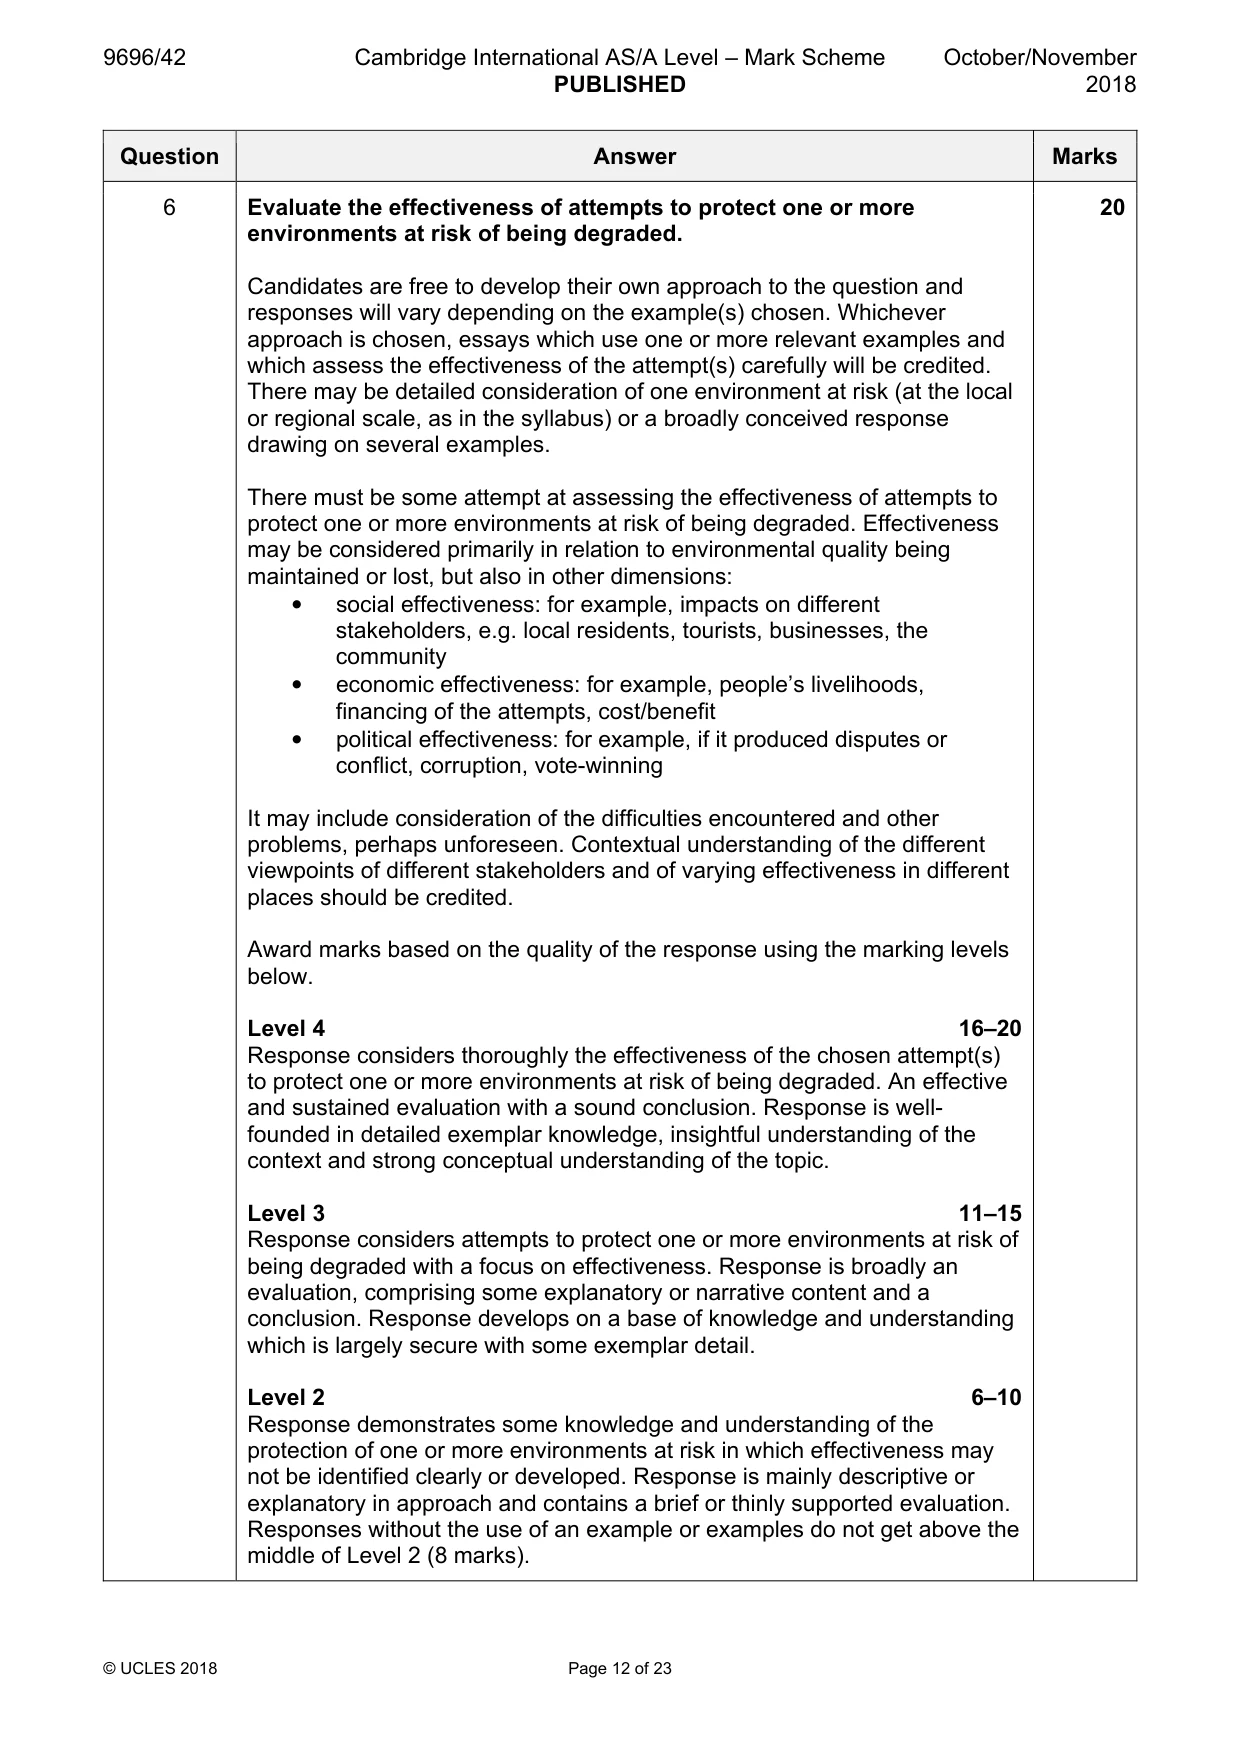
6 Evaluate the effectiveness of attempts to protect one or more environments at risk of being degraded. [20] [Total: 30] Global interdependence If answering this option, answer Question 7 and either Question 8 or Question 9.
Mark scheme: 6 Evaluate the effectiveness of attempts to protect one or more 20 environments at risk of being degraded. Candidates are free to develop their own approach to the question and responses will vary depending on the example(s) chosen. Whichever approach is chosen, essays which use one or more relevant examples and which assess the effectiveness of the attempt(s) carefully will be credited. There may be detailed consideration of one environment at risk (at the local or regional scale, as in the syllabus) or a broadly conceived response drawing on several examples. There must be some attempt at assessing the effectiveness of attempts to protect one or more environments at risk of being degraded. Effectiveness may be considered primarily in relation to environmental quality being maintained or lost, but also in other dimensions: • social effectiveness: for example, impacts on different stakeholders, e.g. local residents, tourists, businesses, the community • economic effectiveness: for example, people’s livelihoods, financing of the attempts, cost/benefit • political effectiveness: for example, if it produced disputes or conflict, corruption, vote-winning It may include consideration of the difficulties encountered and other problems, perhaps unforeseen. Contextual understanding of the different viewpoints of different stakeholders and of varying effectiveness in different places should be credited. Award marks based on the quality of the response using the marking levels below. Level 4 16–20 Response considers thoroughly the effectiveness of the chosen attempt(s) to protect one or more environments at risk of being degraded. An effective and sustained evaluation with a sound conclusion. Response is well- founded in detailed exemplar knowledge, insightful understanding of the context and strong conceptual understanding of the topic. Level 3 11–15 Response considers attempts to protect one or more environments at risk of being degraded with a focus on effectiveness. Response is broadly an evaluation, comprising some explanatory or narrative content and a conclusion. Response develops on a base of knowledge and understanding which is largely secure with some exemplar detail. Level 2 6–10 Response demonstrates some knowledge and understanding of the protection of one or more environments at risk in which effectiveness may not be identified clearly or developed. Response is mainly descriptive or explanatory in approach and contains a brief or thinly supported evaluation. Responses without the use of an example or examples do not get above the middle of Level 2 (8 marks). 6 Level 1 1–5 Response makes a few general points about one or more environments without the necessary focus on protection from risk and its effectiveness. A descriptive response comprising a few simple points. Knowledge is basic and understanding may be poor and lack relevance to the question set. Level 0 0 No creditable response. Global interdependence If answering this option, answer Question 7 and either Question 8 or Question 9.
Q7 · Percentage change in international tourist arrivals for the world and world regions in…
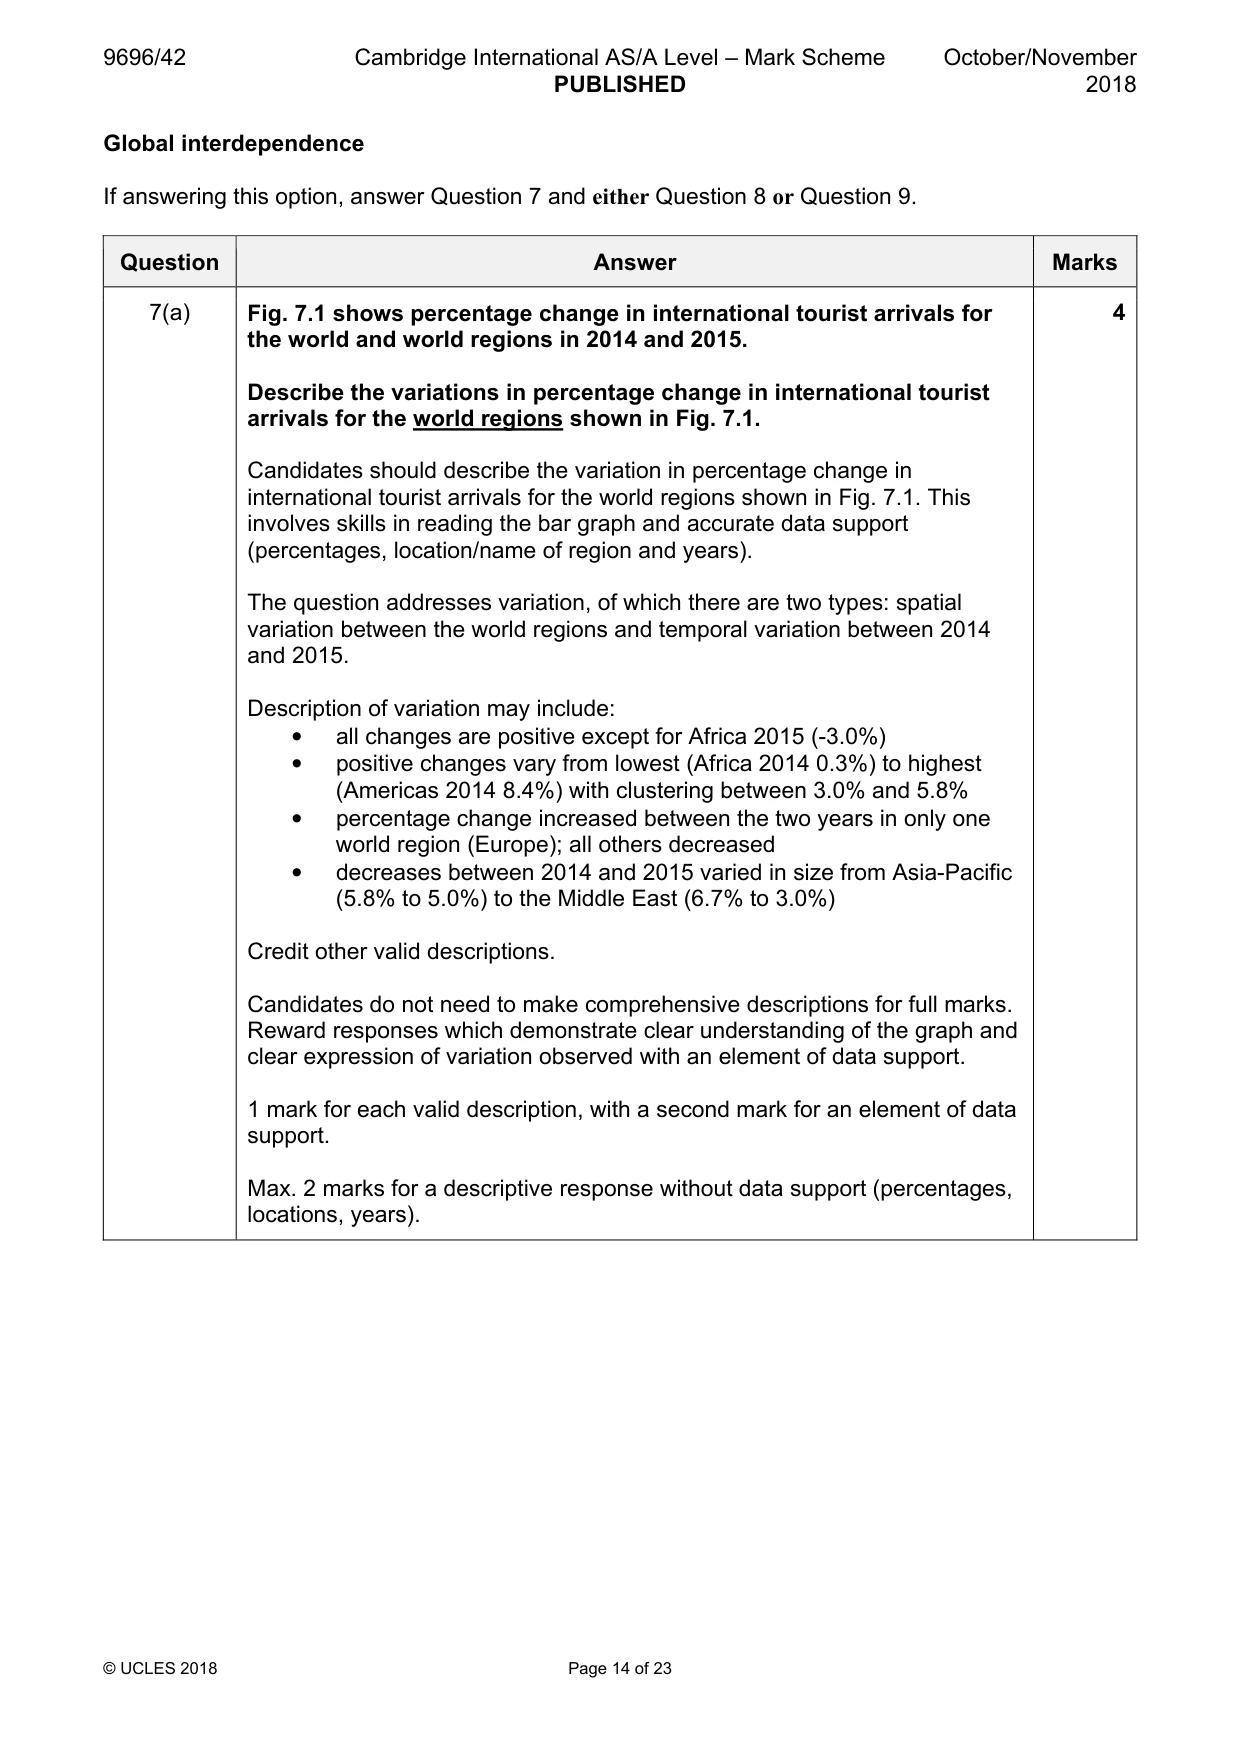
7 Fig. 7.1 shows percentage change in international tourist arrivals for the world and world regions in 2014 and 2015. (a) Describe the variations in percentage change in international tourist arrivals for the world regions shown in Fig. 7.1. [4] (b) Suggest reasons for the percentage increases in international tourist arrivals for the world shown in Fig. 7.1. [6]
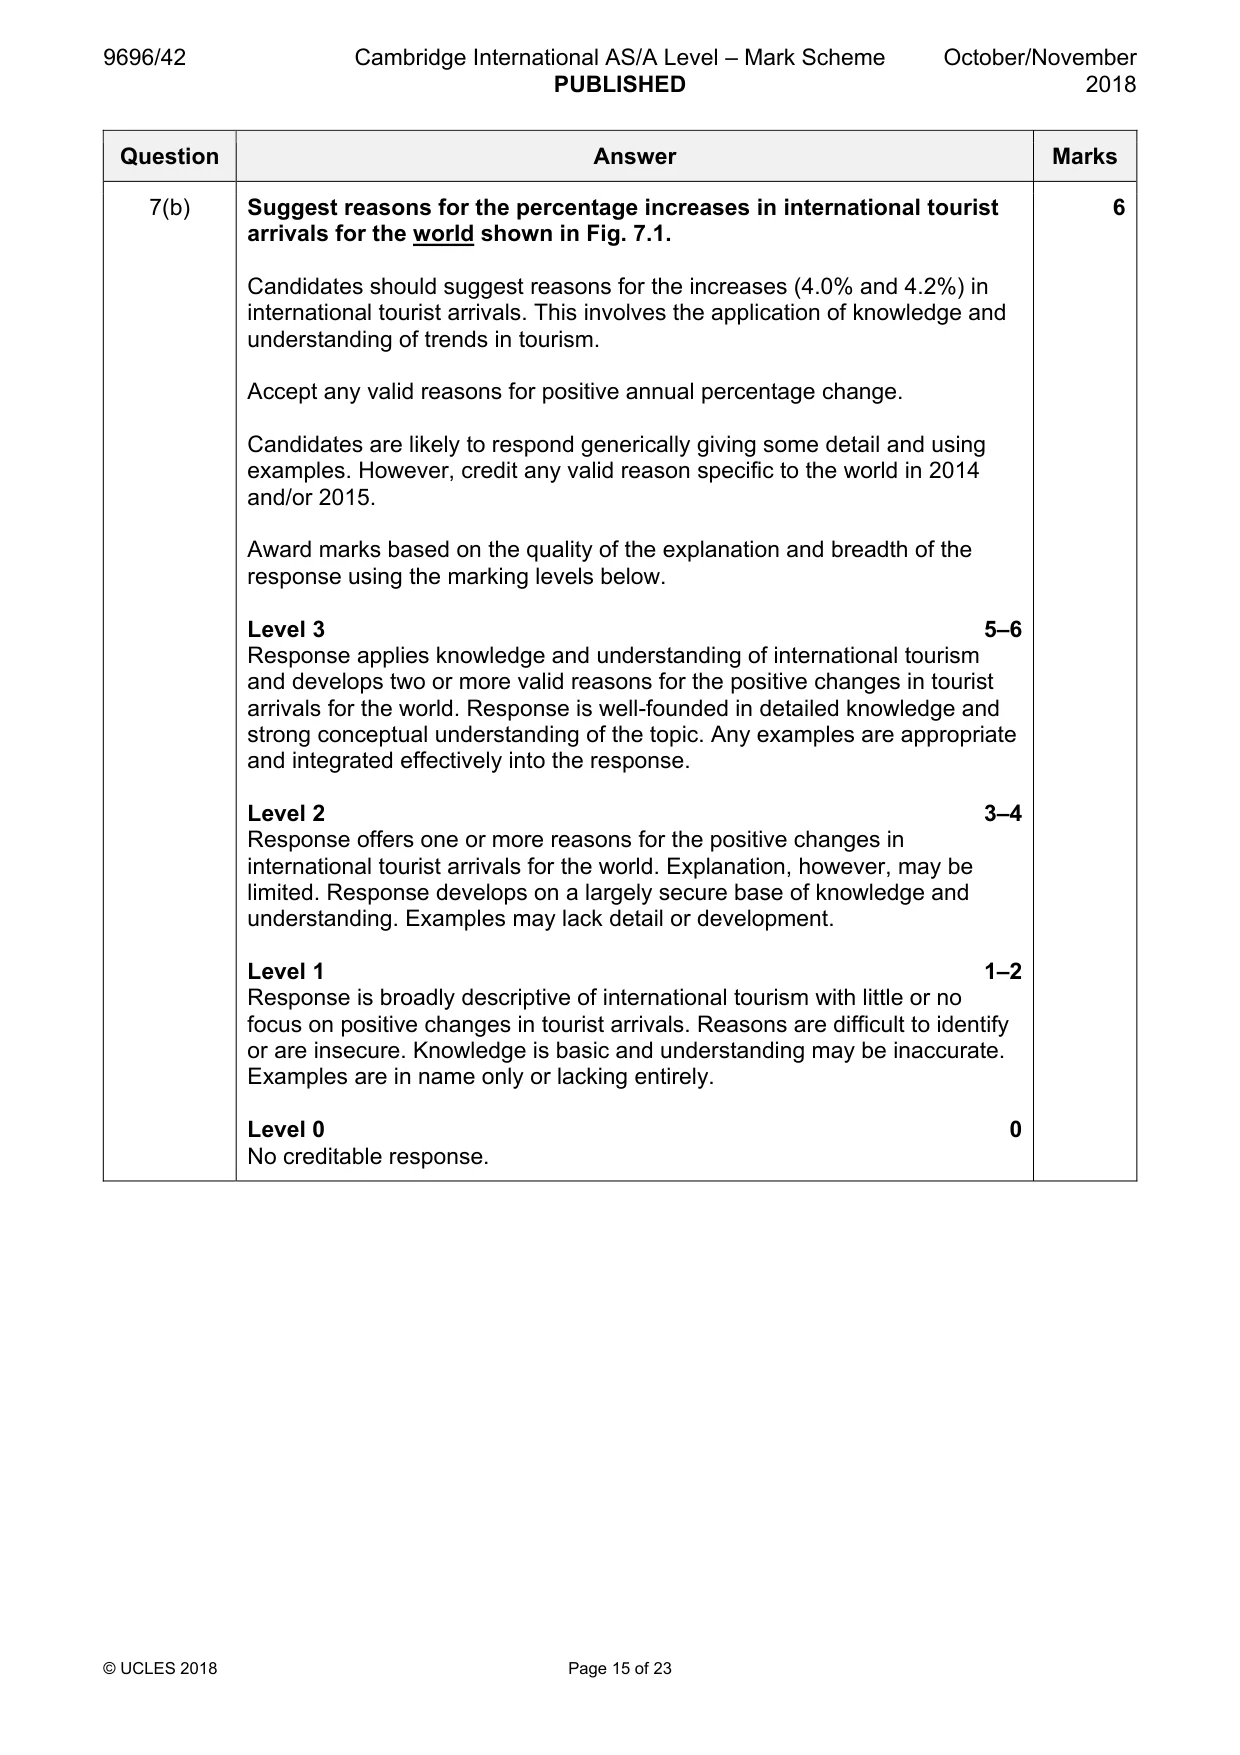
Mark scheme: 7(a) Fig. 7.1 shows percentage change in international tourist arrivals for 4 the world and world regions in 2014 and 2015. Describe the variations in percentage change in international tourist arrivals for the world regions shown in Fig. 7.1. Candidates should describe the variation in percentage change in international tourist arrivals for the world regions shown in Fig. 7.1. This involves skills in reading the bar graph and accurate data support (percentages, location/name of region and years). The question addresses variation, of which there are two types: spatial variation between the world regions and temporal variation between 2014 and 2015. Description of variation may include: • all changes are positive except for Africa 2015 (-3.0%) • positive changes vary from lowest (Africa 2014 0.3%) to highest (Americas 2014 8.4%) with clustering between 3.0% and 5.8% • percentage change increased between the two years in only one world region (Europe); all others decreased • decreases between 2014 and 2015 varied in size from Asia-Pacific (5.8% to 5.0%) to the Middle East (6.7% to 3.0%) Credit other valid descriptions. Candidates do not need to make comprehensive descriptions for full marks. Reward responses which demonstrate clear understanding of the graph and clear expression of variation observed with an element of data support. 1 mark for each valid description, with a second mark for an element of data support. Max. 2 marks for a descriptive response without data support (percentages, locations, years). 7(b) Suggest reasons for the percentage increases in international tourist 6 arrivals for the world shown in Fig. 7.1. Candidates should suggest reasons for the increases (4.0% and 4.2%) in international tourist arrivals. This involves the application of knowledge and understanding of trends in tourism. Accept any valid reasons for positive annual percentage change. Candidates are likely to respond generically giving some detail and using examples. However, credit any valid reason specific to the world in 2014 and/or 2015. Award marks based on the quality of the explanation and breadth of the response using the marking levels below. Level 3 5–6 Response applies knowledge and understanding of international tourism and develops two or more valid reasons for the positive changes in tourist arrivals for the world. Response is well-founded in detailed knowledge and strong conceptual understanding of the topic. Any examples are appropriate and integrated effectively into the response. Level 2 3–4 Response offers one or more reasons for the positive changes in international tourist arrivals for the world. Explanation, however, may be limited. Response develops on a largely secure base of knowledge and understanding. Examples may lack detail or development. Level 1 1–2 Response is broadly descriptive of international tourism with little or no focus on positive changes in tourist arrivals. Reasons are difficult to identify or are insecure. Knowledge is basic and understanding may be inaccurate. Examples are in name only or lacking entirely. Level 0 0 No creditable response.
Q8 · Evaluate why global trade is unequal
8 Evaluate why global trade is unequal. [20]
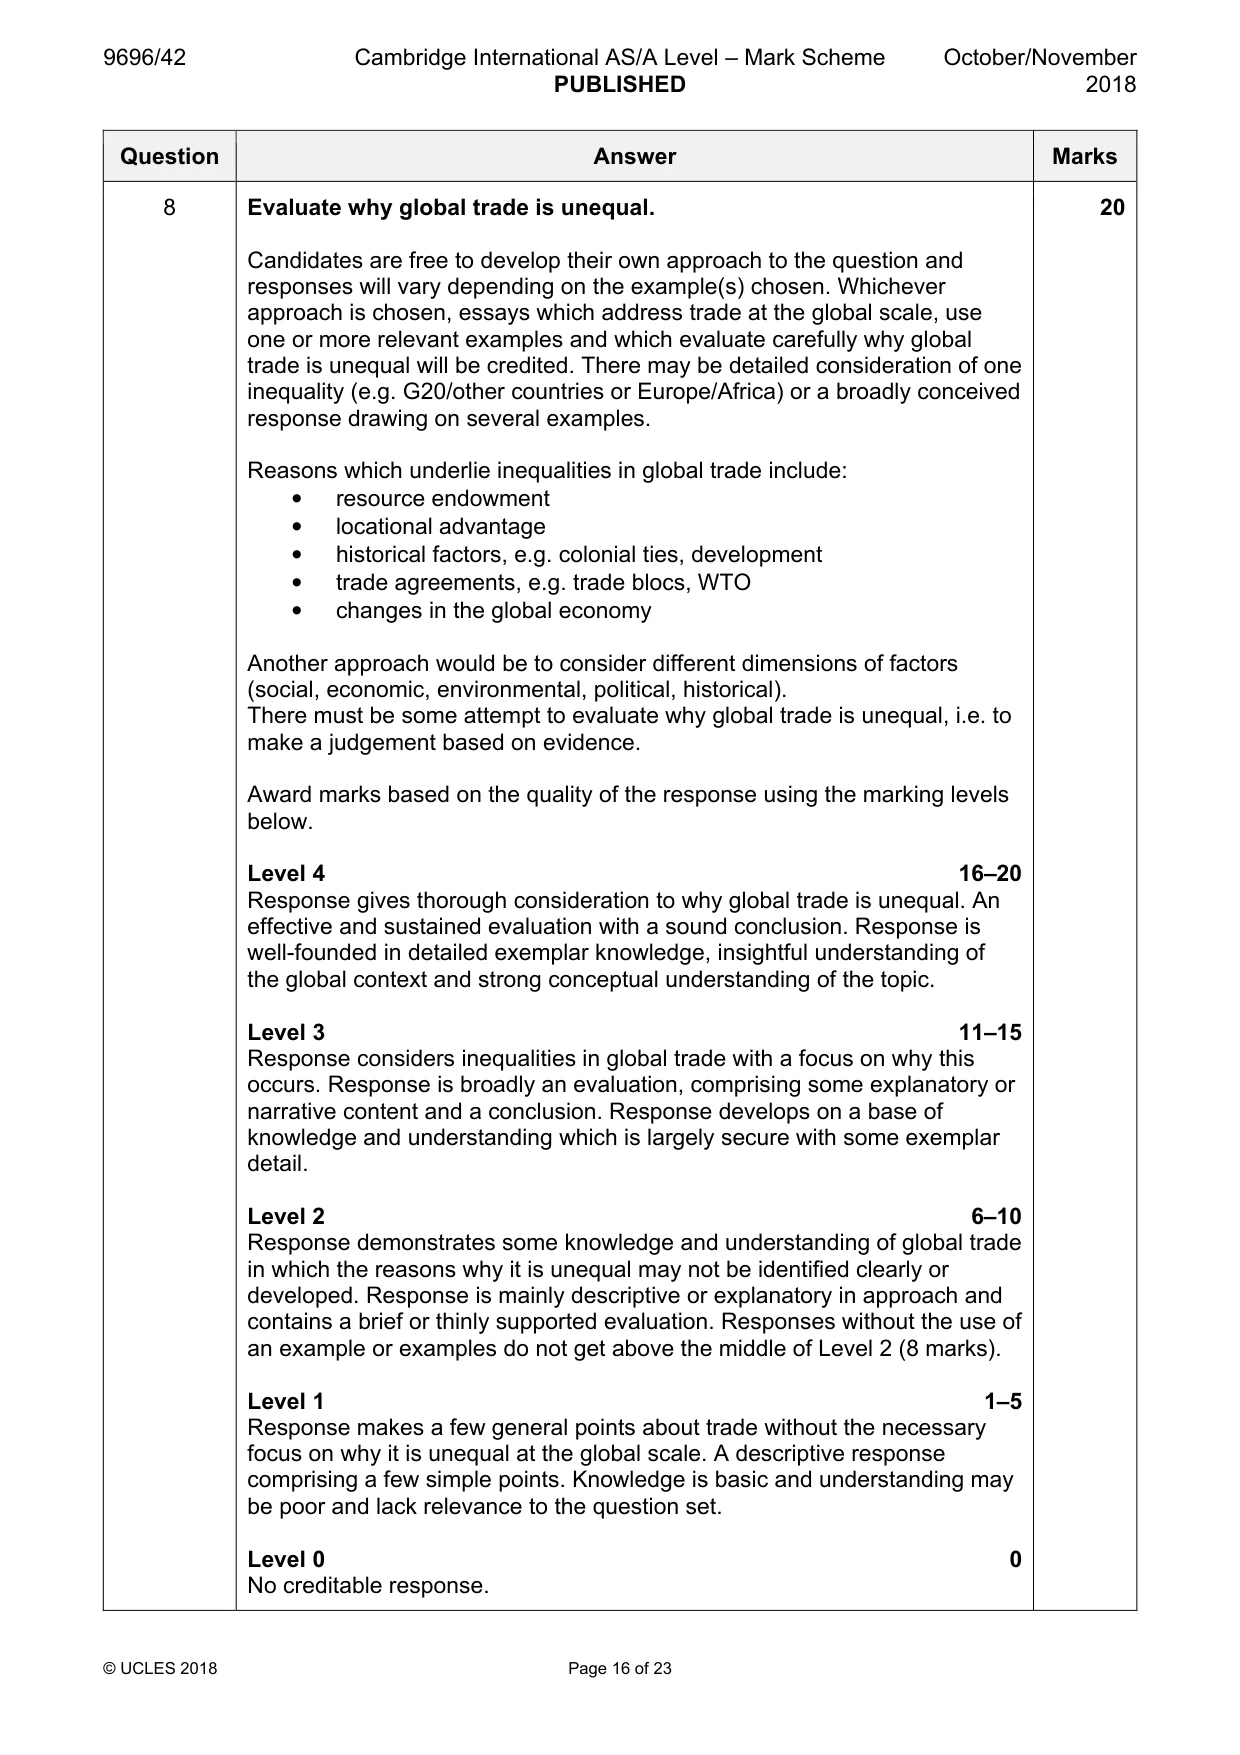
Mark scheme: 8 Evaluate why global trade is unequal. 20 Candidates are free to develop their own approach to the question and responses will vary depending on the example(s) chosen. Whichever approach is chosen, essays which address trade at the global scale, use one or more relevant examples and which evaluate carefully why global trade is unequal will be credited. There may be detailed consideration of one inequality (e.g. G20/other countries or Europe/Africa) or a broadly conceived response drawing on several examples. Reasons which underlie inequalities in global trade include: • resource endowment • locational advantage • historical factors, e.g. colonial ties, development • trade agreements, e.g. trade blocs, WTO • changes in the global economy Another approach would be to consider different dimensions of factors (social, economic, environmental, political, historical). There must be some attempt to evaluate why global trade is unequal, i.e. to make a judgement based on evidence. Award marks based on the quality of the response using the marking levels below. Level 4 16–20 Response gives thorough consideration to why global trade is unequal. An effective and sustained evaluation with a sound conclusion. Response is well-founded in detailed exemplar knowledge, insightful understanding of the global context and strong conceptual understanding of the topic. Level 3 11–15 Response considers inequalities in global trade with a focus on why this occurs. Response is broadly an evaluation, comprising some explanatory or narrative content and a conclusion. Response develops on a base of knowledge and understanding which is largely secure with some exemplar detail. Level 2 6–10 Response demonstrates some knowledge and understanding of global trade in which the reasons why it is unequal may not be identified clearly or developed. Response is mainly descriptive or explanatory in approach and contains a brief or thinly supported evaluation. Responses without the use of an example or examples do not get above the middle of Level 2 (8 marks). Level 1 1–5 Response makes a few general points about trade without the necessary focus on why it is unequal at the global scale. A descriptive response comprising a few simple points. Knowledge is basic and understanding may be poor and lack relevance to the question set. Level 0 0 No creditable response.
Q9 · Assess the view that the life cycle model of tourism is of limited usefulness in…
9 Assess the view that the life cycle model of tourism is of limited usefulness in understanding how tourism actually develops. [20] [Total: 30] Economic transition If answering this option, answer Question 10 and either Question 11 or Question 12.
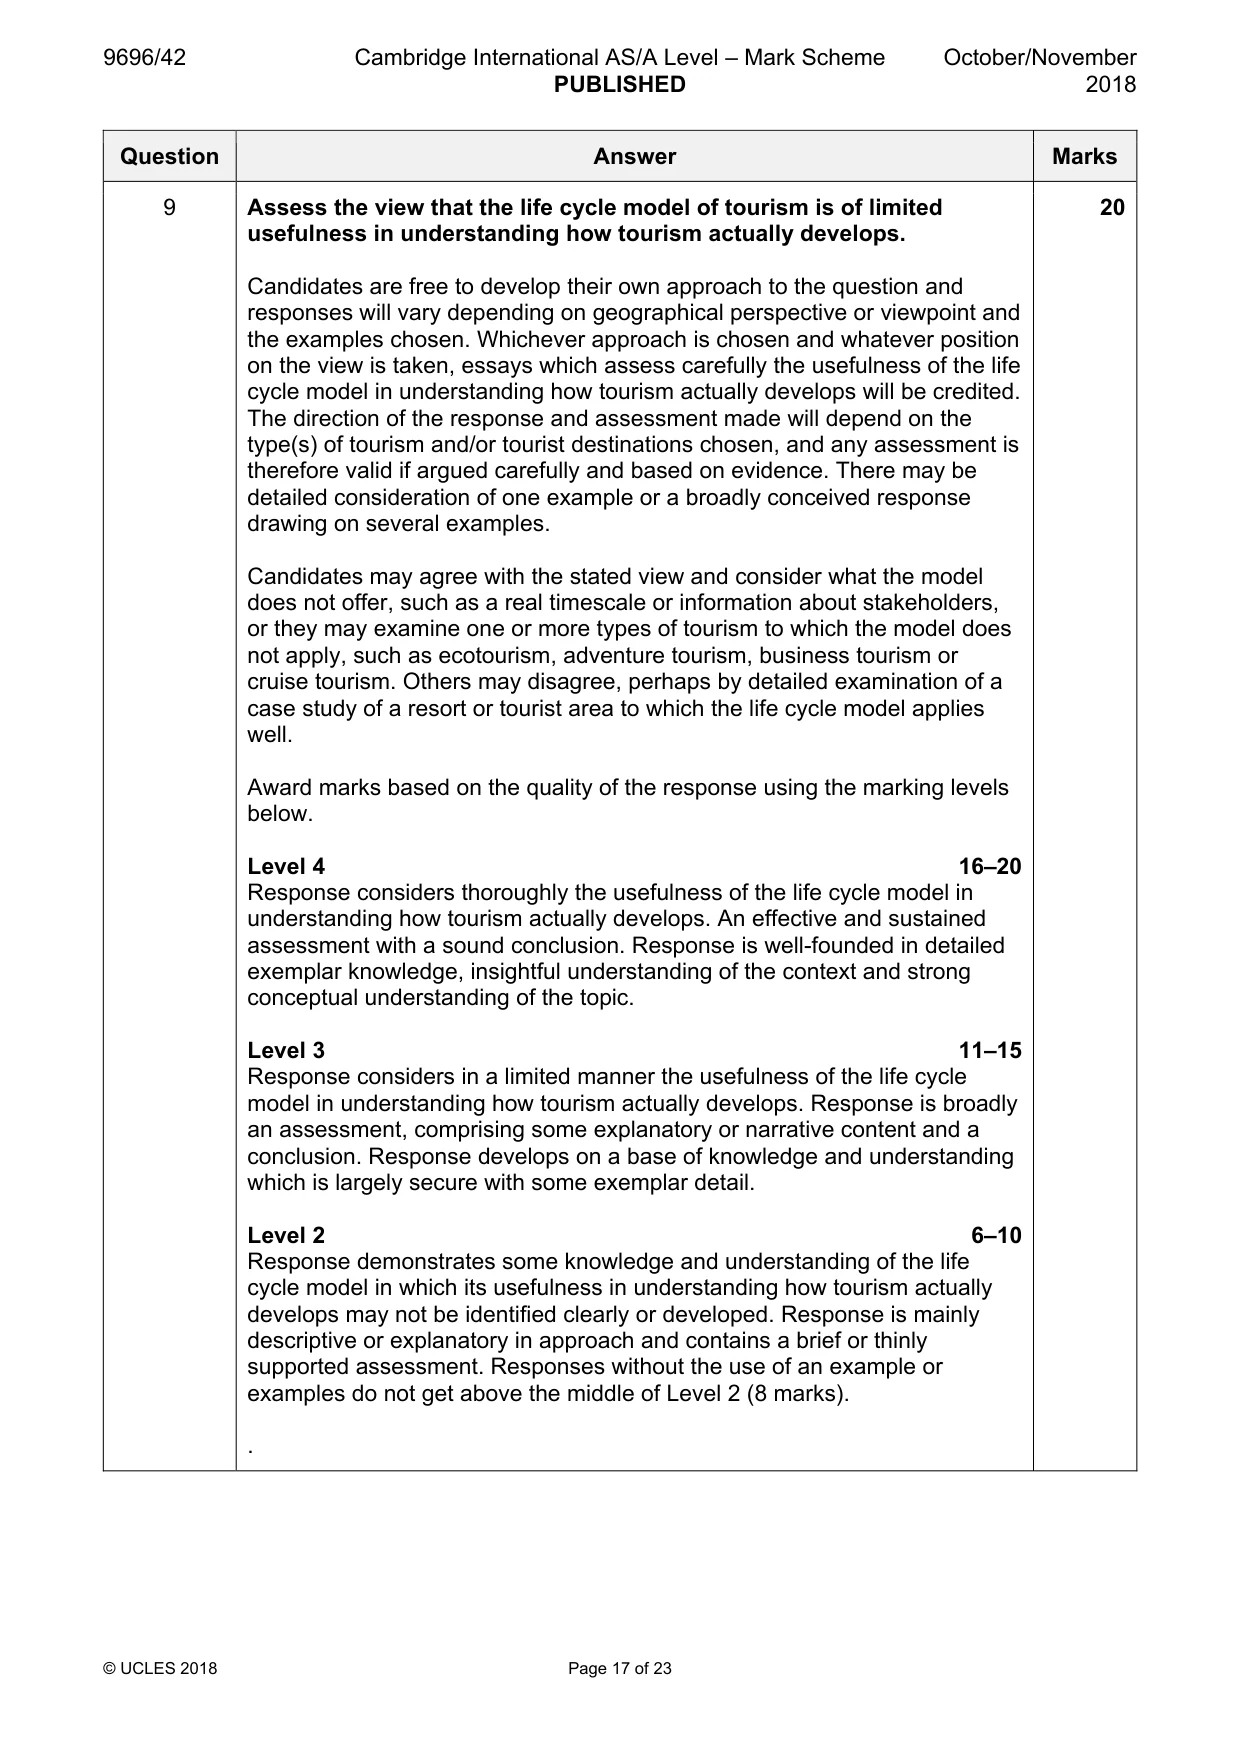
Mark scheme: 9 Assess the view that the life cycle model of tourism is of limited 20 usefulness in understanding how tourism actually develops. Candidates are free to develop their own approach to the question and responses will vary depending on geographical perspective or viewpoint and the examples chosen. Whichever approach is chosen and whatever position on the view is taken, essays which assess carefully the usefulness of the life cycle model in understanding how tourism actually develops will be credited. The direction of the response and assessment made will depend on the type(s) of tourism and/or tourist destinations chosen, and any assessment is therefore valid if argued carefully and based on evidence. There may be detailed consideration of one example or a broadly conceived response drawing on several examples. Candidates may agree with the stated view and consider what the model does not offer, such as a real timescale or information about stakeholders, or they may examine one or more types of tourism to which the model does not apply, such as ecotourism, adventure tourism, business tourism or cruise tourism. Others may disagree, perhaps by detailed examination of a case study of a resort or tourist area to which the life cycle model applies well. Award marks based on the quality of the response using the marking levels below. Level 4 16–20 Response considers thoroughly the usefulness of the life cycle model in understanding how tourism actually develops. An effective and sustained assessment with a sound conclusion. Response is well-founded in detailed exemplar knowledge, insightful understanding of the context and strong conceptual understanding of the topic. Level 3 11–15 Response considers in a limited manner the usefulness of the life cycle model in understanding how tourism actually develops. Response is broadly an assessment, comprising some explanatory or narrative content and a conclusion. Response develops on a base of knowledge and understanding which is largely secure with some exemplar detail. Level 2 6–10 Response demonstrates some knowledge and understanding of the life cycle model in which its usefulness in understanding how tourism actually develops may not be identified clearly or developed. Response is mainly descriptive or explanatory in approach and contains a brief or thinly supported assessment. Responses without the use of an example or examples do not get above the middle of Level 2 (8 marks). . Question Answer Marks 9 Level 1 1–5 Response makes a few general points about the development of tourism without the necessary focus on the life cycle model and its usefulness. A descriptive response comprising a few simple points. Knowledge is basic and understanding may be poor and lack relevance to the question set. Level 0 0 No creditable response Economic transition If answering this option, answer Question 10 and either Question 11 or Question 12.
Q10 · Annual percentage change in real GDP for the world and three groups of countries…
10 Fig. 10.1 shows annual percentage change in real GDP for the world and three groups of countries, 2010–14, and predicted for 2015–20. (a) Compare the trends in real GDP shown in Fig. 10.1. [4] (b) Explain why the predictions in Fig. 10.1 may prove to be inaccurate. [6]
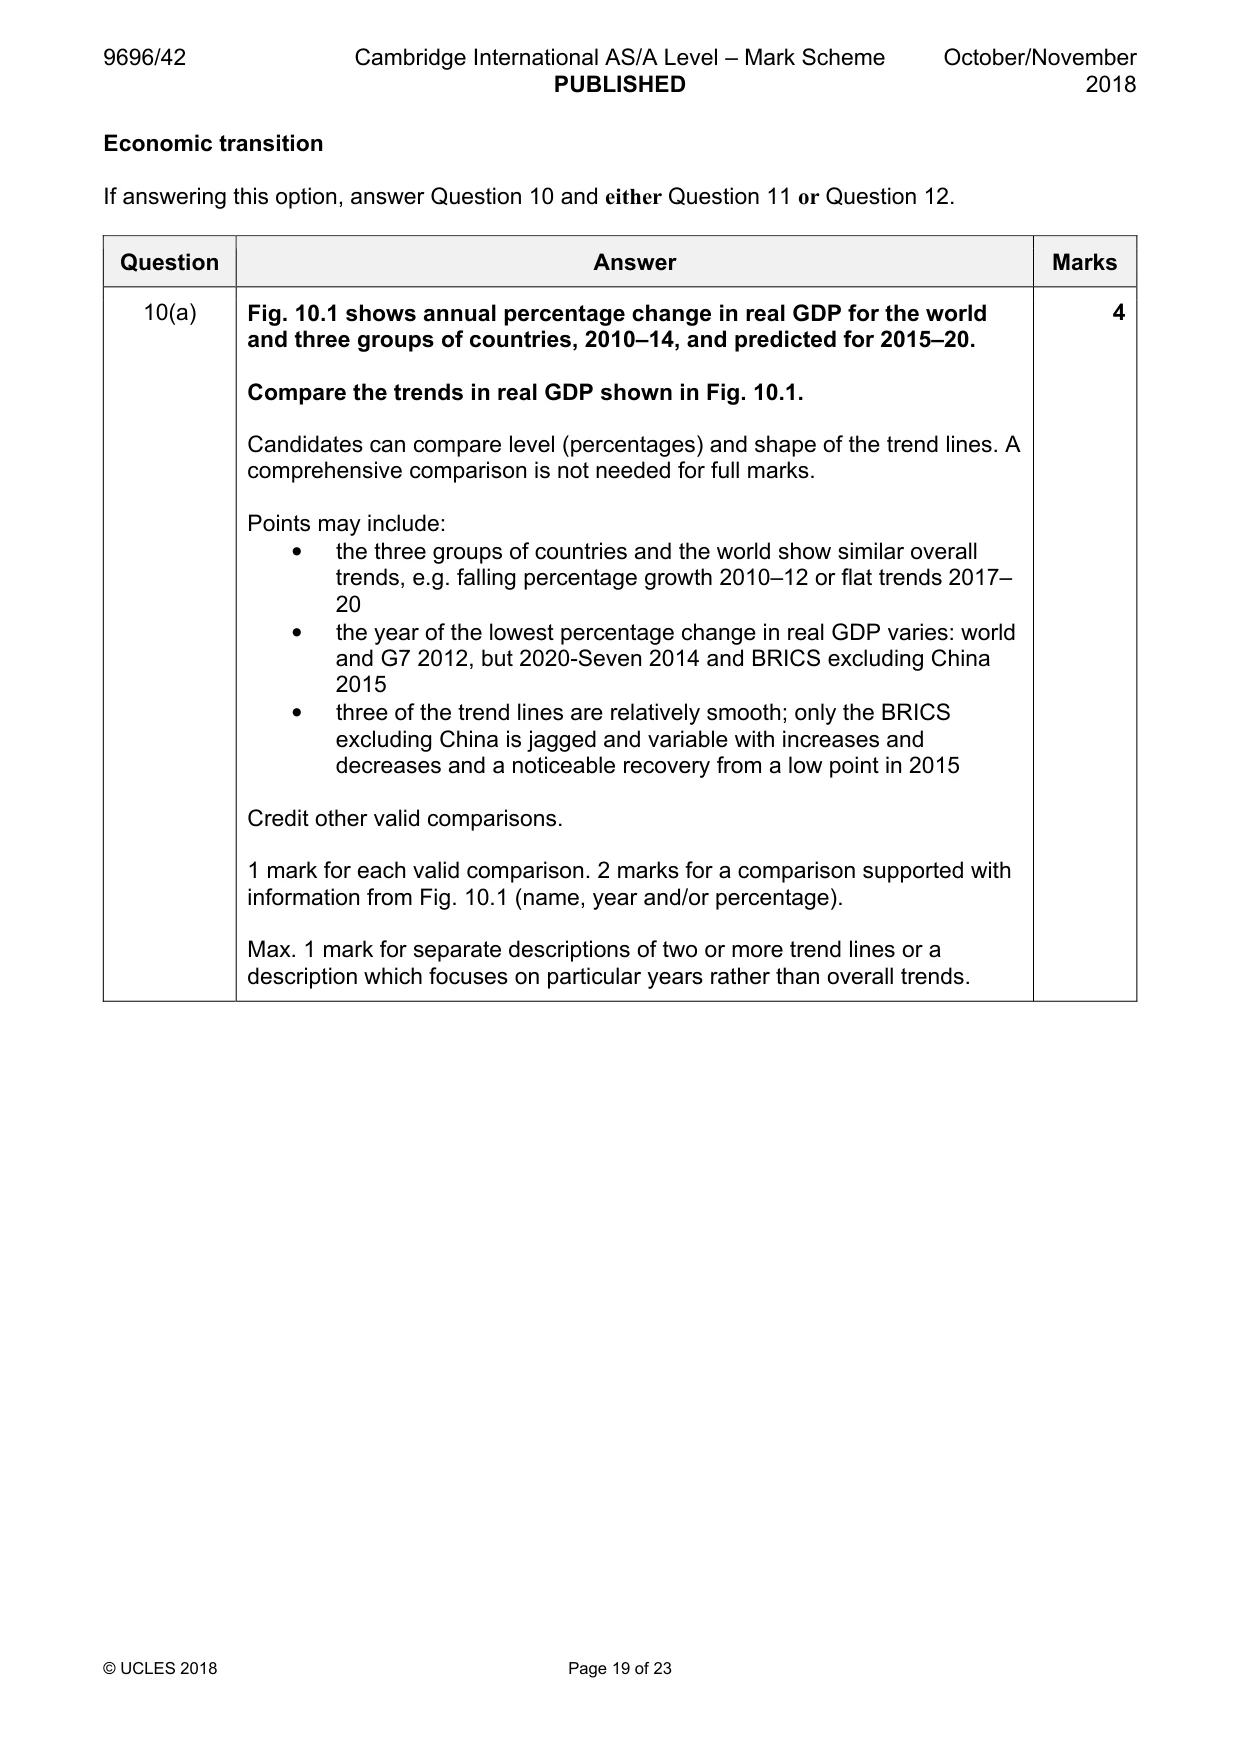
Mark scheme: 10(a) Fig. 10.1 shows annual percentage change in real GDP for the world 4 and three groups of countries, 2010–14, and predicted for 2015–20. Compare the trends in real GDP shown in Fig. 10.1. Candidates can compare level (percentages) and shape of the trend lines. A comprehensive comparison is not needed for full marks. Points may include: • the three groups of countries and the world show similar overall trends, e.g. falling percentage growth 2010–12 or flat trends 2017– 20 • the year of the lowest percentage change in real GDP varies: world and G7 2012, but 2020-Seven 2014 and BRICS excluding China 2015 • three of the trend lines are relatively smooth; only the BRICS excluding China is jagged and variable with increases and decreases and a noticeable recovery from a low point in 2015 Credit other valid comparisons. 1 mark for each valid comparison. 2 marks for a comparison supported with information from Fig. 10.1 (name, year and/or percentage). Max. 1 mark for separate descriptions of two or more trend lines or a description which focuses on particular years rather than overall trends. 10(b) Explain why the predictions in Fig. 10.1 may prove to be inaccurate. 6 Candidates should explain why the predictions of annual percentage change in real GDP in the figure may prove to be inaccurate. The answer does not need to be comprehensive to gain full marks. There are two broad areas which contribute to the inaccuracy of predictions: changes in the global economy and how these affect national economies; and statistical limitations. Explanatory ideas include: • uncertainty of global economy, e.g. growth, recession, markets • impacts of global change on national economic performance • unforeseen events, e.g. war, hazards, oil prices, regime change/a lot can happen in six years • major change in one large country, e.g. China or USA, could affect trend for whole group • limits of data collection • lack of available data and/or comparable data • limits of sampling and extrapolation from samples • assumptions of prediction and statistical modelling • other agendas operating (statistical manipulation) • other Award marks based on the quality of the explanation and breadth of the response using the marking levels below. Level 3 5–6 Response explains a range of ideas from both areas (economic change/ statistics) about the possible inaccuracy of the predictions; balance, however, is not required. Response is well-founded in detailed knowledge and strong conceptual understanding of the topic. Examples used are appropriate and integrated effectively into the response. Level 2 3–4 Response explains why the predictions may be inaccurate in a limited manner from at least one area. Response develops on a largely secure base of knowledge and understanding. Examples may lack detail or development. Level 1 1–2 Response comprises one or more descriptive points about the global economy/national economies with little or no explanation of the possible inaccuracy of the predictions. Knowledge is basic and understanding may be inaccurate. Examples are in name only or lacking entirely. Level 0 0 No creditable response.
Q11 · Discuss the view that it is economic factors which make countries attractive for foreign…
11 Discuss the view that it is economic factors which make countries attractive for foreign direct investment (FDI). [20]
Mark scheme: 11 Discuss the view that it is economic factors which make countries 20 attractive for foreign direct investment (FDI). Candidates are free to develop their own approach to the question and responses will vary depending on the example(s) chosen. Whichever approach is chosen, essays that discuss carefully the economic factors and other factors which make countries attractive for foreign direct investment (FDI) will be credited. There may be detailed consideration of a few factors or a broadly conceived response about several dimensions of factors. Factors attractive to FDI include: • economic, e.g. potential profitability, cost savings, market size, market penetration, development, growth forecast, income per person, infrastructure, financial incentives and packages offered • social/cultural, e.g. total population (market potential*), work ethic*, literacy, education*, English language • environmental, e.g. resource endowment*, locational advantage*, lack of environmental controls (save costs*) • political factors, e.g. stability, government schemes to attract FDI*, trade agreements*, trade blocs*, country-country partnerships The asterisk* shows how other factors can be linked to ‘economic’. There must be some attempt to identify the factors which make countries attractive to FDI, i.e. to present points for (and against) or different views as companies choose different countries for different reasons. Award marks based on the quality of the response using the marking levels below. Level 4 16–20 Response discusses thoroughly the factors which make countries attractive for FDI, both economic factors and other factors. An effective and sustained evaluation with a sound conclusion. Response is well-founded in detailed exemplar knowledge, insightful understanding of the global context and strong conceptual understanding of the topic. Level 3 11–15 Response discusses FDI with limited focus on economic factors and other factors which make countries attractive. Response is broadly evaluative, comprising some explanatory or narrative content and a conclusion. Response develops on a base of knowledge and understanding which is largely secure with some exemplar detail. Level 2 6–10 Response demonstrates some knowledge and understanding of FDI in which economic factors (and other factors) that make countries attractive for investment may not be identified clearly or developed. Response is mainly descriptive or explanatory in approach and contains a brief or thinly supported discussion. Responses without the use of an example or examples do not get above the middle of Level 2 (8 marks). 11 Level 1 1–5 Response makes a few general points about the global economy without the necessary focus on FDI and the factors which make countries attractive for investment. A descriptive response comprising a few simple points. Knowledge is basic and understanding may be poor and lack relevance to the question set. Level 0 0 No creditable response.
Q12 · How far do you agree that regional disparities within countries can never be overcome?
12 How far do you agree that regional disparities within countries can never be overcome? [20] [Total: 30]
Mark scheme: 12 How far do you agree that regional disparities within countries can 20 never be overcome? Candidates are free to develop their own approach to the question and responses will vary depending on geographical perspective or viewpoint and the country or countries chosen. Whichever approach is chosen, essays which assess carefully whether regional disparities within countries can never be overcome will be credited. There may be detailed consideration of one country with some general wider content, perhaps theoretical; or two countries may be considered; or a broadly conceived response drawing on several countries. There must be some attempt at assessing whether regional disparities within countries can never be overcome. Contextual understanding of different perspectives, such as in theory and in reality, or the differing experiences of countries, should be credited. Award marks based on the quality of the response using the marking levels below. Level 4 16–20 Response considers thoroughly whether regional disparities within countries can never be overcome. An effective and sustained assessment with a sound conclusion. Response is well-founded in detailed exemplar knowledge of one or more countries, insightful understanding of the context and strong conceptual understanding of the topic. Level 3 11–15 Response considers regional disparities within countries with limited focus on whether they can never be overcome. Response is broadly an assessment, comprising some explanatory or narrative content and a conclusion. Response develops on a base of knowledge and understanding which is largely secure with some exemplar detail. Level 2 6–10 Response demonstrates some knowledge and understanding of regional disparities within countries in which whether they can never be overcome may not be identified clearly or developed. Response is mainly descriptive or explanatory in approach and contains a brief or thinly supported assessment. Responses without the use of an example or examples do not get above the middle of Level 2 (8 marks). Level 1 1–5 Response makes a few general points about regional disparities without the necessary focus on whether they can never be overcome. A descriptive response comprising a few simple points. Knowledge is basic and understanding may be poor and lack relevance to the question set. Response may be at the wrong spatial scale (not within countries). Level 0 0 No creditable response.
What was in this paper
The subtopics covered by these 12 questions, and how many questions each got. Open one in a new tab to see every Cambridge question on it.
2The management of a degraded environment2Agricultural systems and food production1National development1Sustainable energy supplies1The globalisation of economic activity1The management of agricultural change1The management of change in manufacturing industry1The management of regional development1Trade flows and trading patterns1What you needed in this session
Cambridge’s own grade thresholds for 2018 Oct/Nov, Paper 4 · Variant 2. A higher threshold means an easier paper — the bar moves with how the cohort did.