Cambridge A Level Geography 9696 — 2018 Oct/Nov Paper 4 · Variant 3
9696/43/O/N/18 · 12 questions · 60 marks · ≈68 min
The question paper and its mark scheme, free to read here and free to download. This is Cambridge’s own paper, exactly as it was sat.
Question paper4 pages

Mark scheme23 pages
Answers below. Sit the paper first if you are practising.




Questions as text
Q1 · The generalised climatic impacts of El Niño from April to September
1 Fig. 1.1 shows the generalised climatic impacts of El Niño from April to September. (a) Describe the climatic impacts shown in Fig. 1.1. [4] (b) Explain how irrigation helps agriculture to overcome dry conditions. [6]
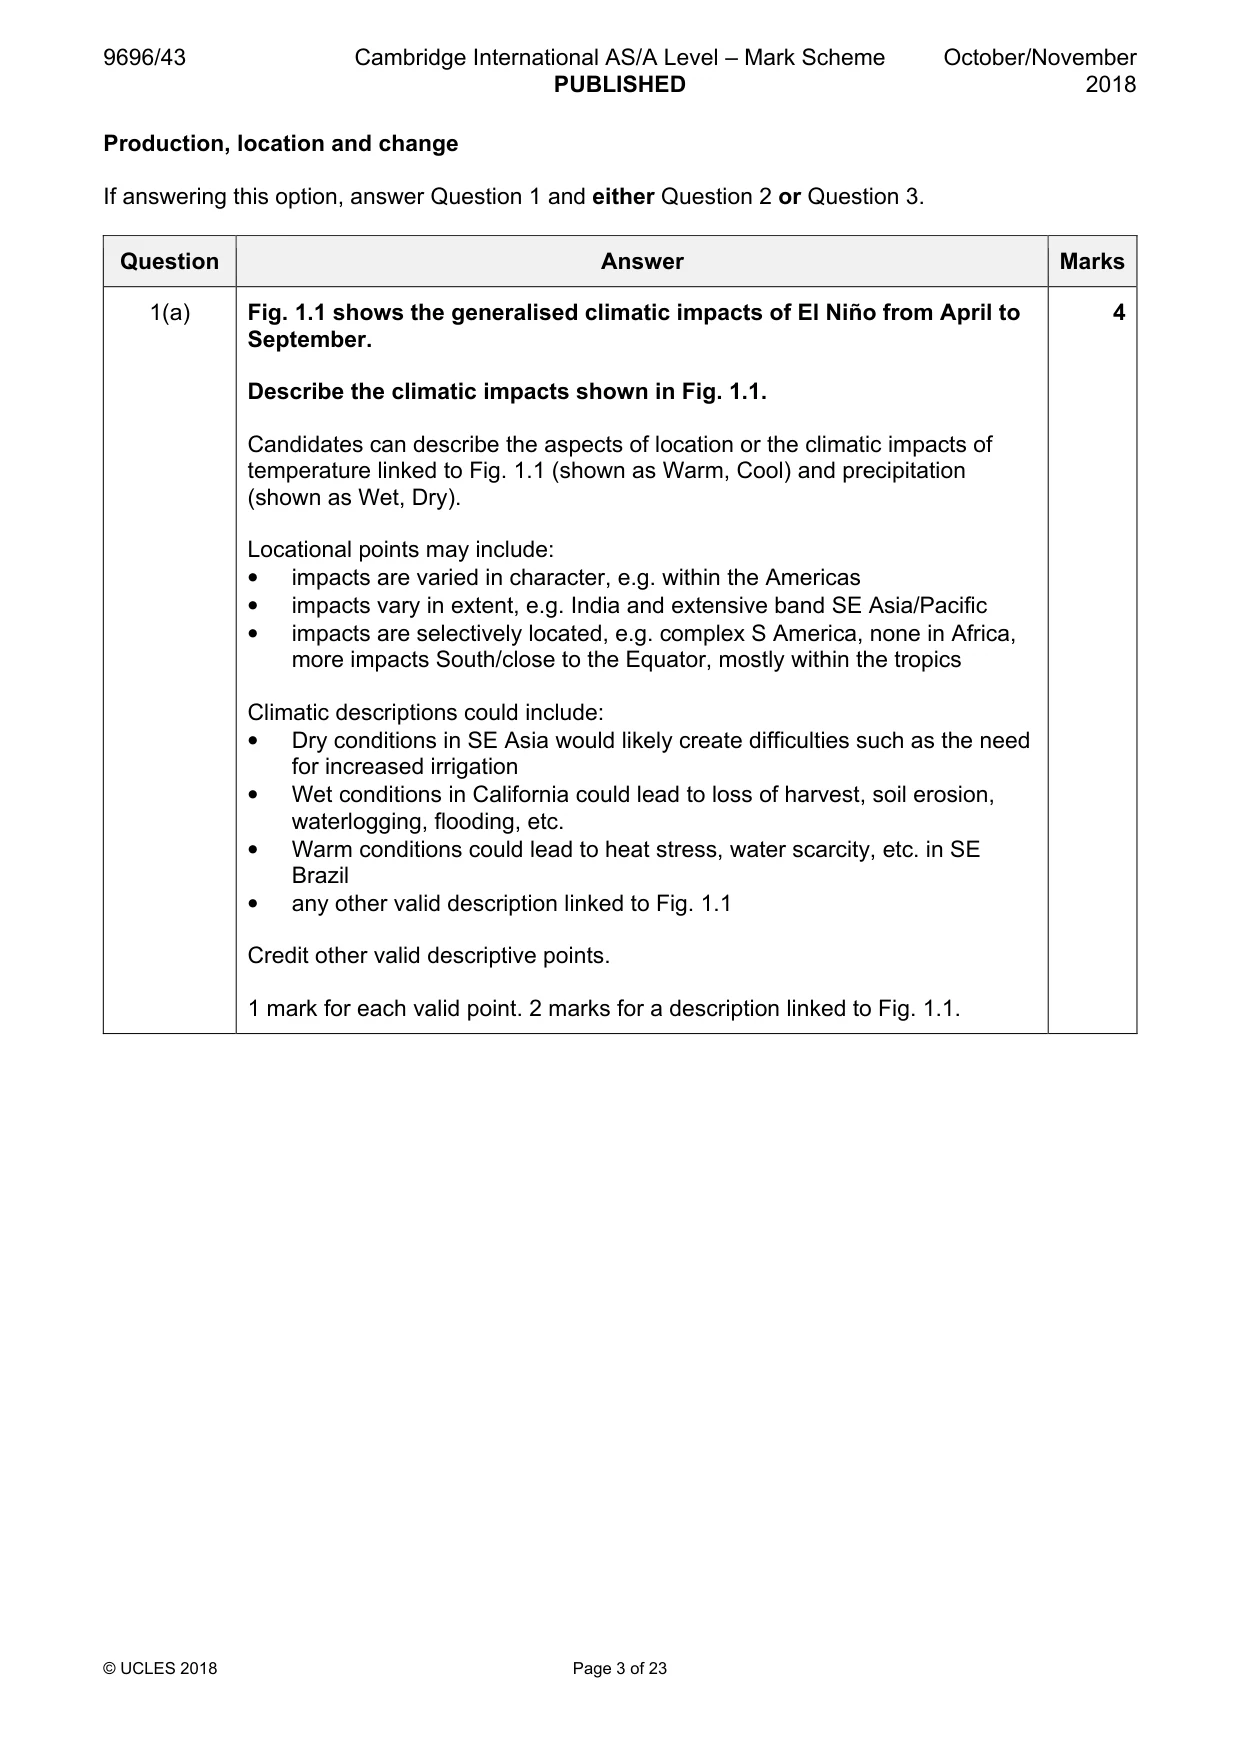
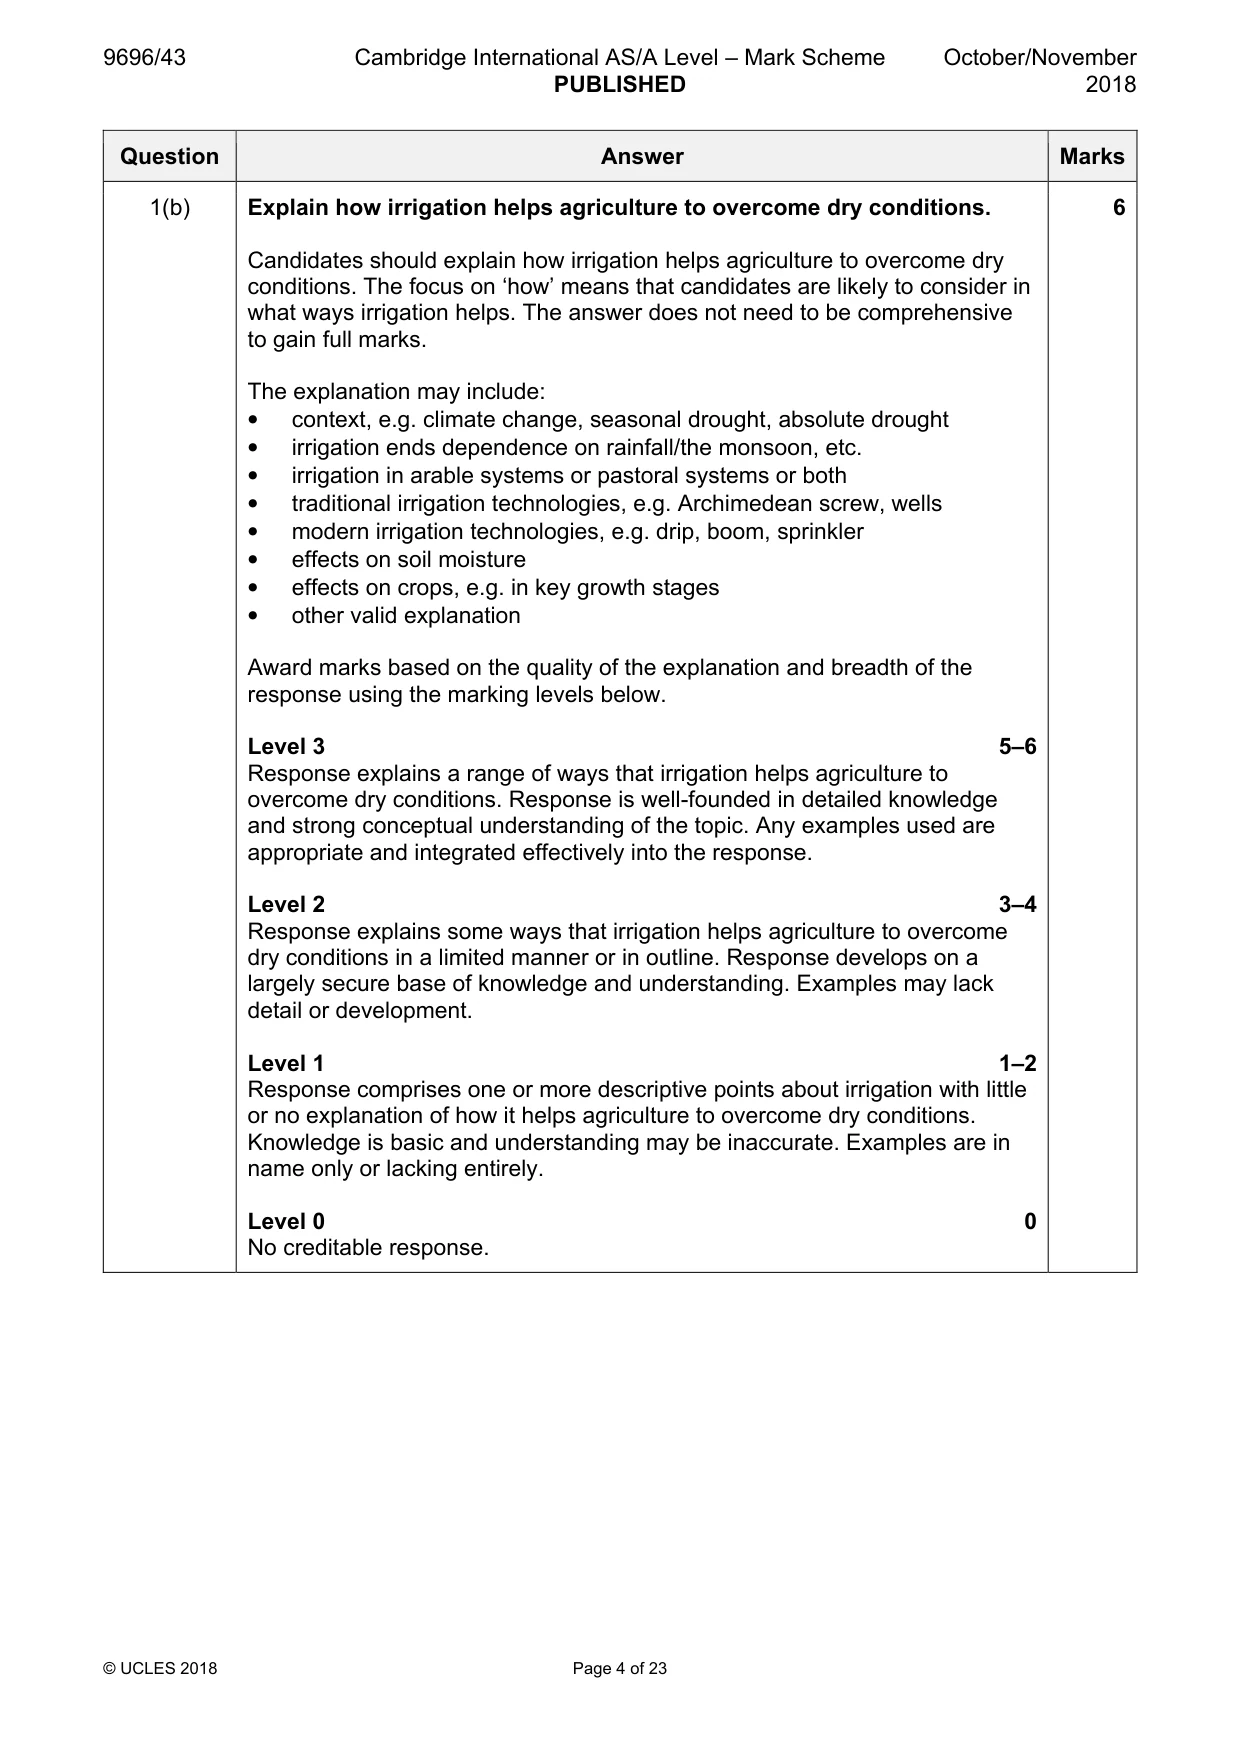
Mark scheme: Question Answer Marks 1(a) Fig. 1.1 shows the generalised climatic impacts of El Niño from April to 4 September. Describe the climatic impacts shown in Fig. 1.1. Candidates can describe the aspects of location or the climatic impacts of temperature linked to Fig. 1.1 (shown as Warm, Cool) and precipitation (shown as Wet, Dry). Locational points may include: • impacts are varied in character, e.g. within the Americas • impacts vary in extent, e.g. India and extensive band SE Asia/Pacific • impacts are selectively located, e.g. complex S America, none in Africa, more impacts South/close to the Equator, mostly within the tropics Climatic descriptions could include: • Dry conditions in SE Asia would likely create difficulties such as the need for increased irrigation • Wet conditions in California could lead to loss of harvest, soil erosion, waterlogging, flooding, etc. • Warm conditions could lead to heat stress, water scarcity, etc. in SE Brazil • any other valid description linked to Fig. 1.1 Credit other valid descriptive points. 1 mark for each valid point. 2 marks for a description linked to Fig. 1.1. 1(b) Explain how irrigation helps agriculture to overcome dry conditions. 6 Candidates should explain how irrigation helps agriculture to overcome dry conditions. The focus on ‘how’ means that candidates are likely to consider in what ways irrigation helps. The answer does not need to be comprehensive to gain full marks. The explanation may include: • context, e.g. climate change, seasonal drought, absolute drought • irrigation ends dependence on rainfall/the monsoon, etc. • irrigation in arable systems or pastoral systems or both • traditional irrigation technologies, e.g. Archimedean screw, wells • modern irrigation technologies, e.g. drip, boom, sprinkler • effects on soil moisture • effects on crops, e.g. in key growth stages • other valid explanation Award marks based on the quality of the explanation and breadth of the response using the marking levels below. Level 3 5–6 Response explains a range of ways that irrigation helps agriculture to overcome dry conditions. Response is well-founded in detailed knowledge and strong conceptual understanding of the topic. Any examples used are appropriate and integrated effectively into the response. Level 2 3–4 Response explains some ways that irrigation helps agriculture to overcome dry conditions in a limited manner or in outline. Response develops on a largely secure base of knowledge and understanding. Examples may lack detail or development. Level 1 1–2 Response comprises one or more descriptive points about irrigation with little or no explanation of how it helps agriculture to overcome dry conditions. Knowledge is basic and understanding may be inaccurate. Examples are in name only or lacking entirely. Level 0 0 No creditable response.
Q2 · With the help of one or more examples, evaluate the impacts of the intensification of…
2 With the help of one or more examples, evaluate the impacts of the intensification of agriculture. [20]
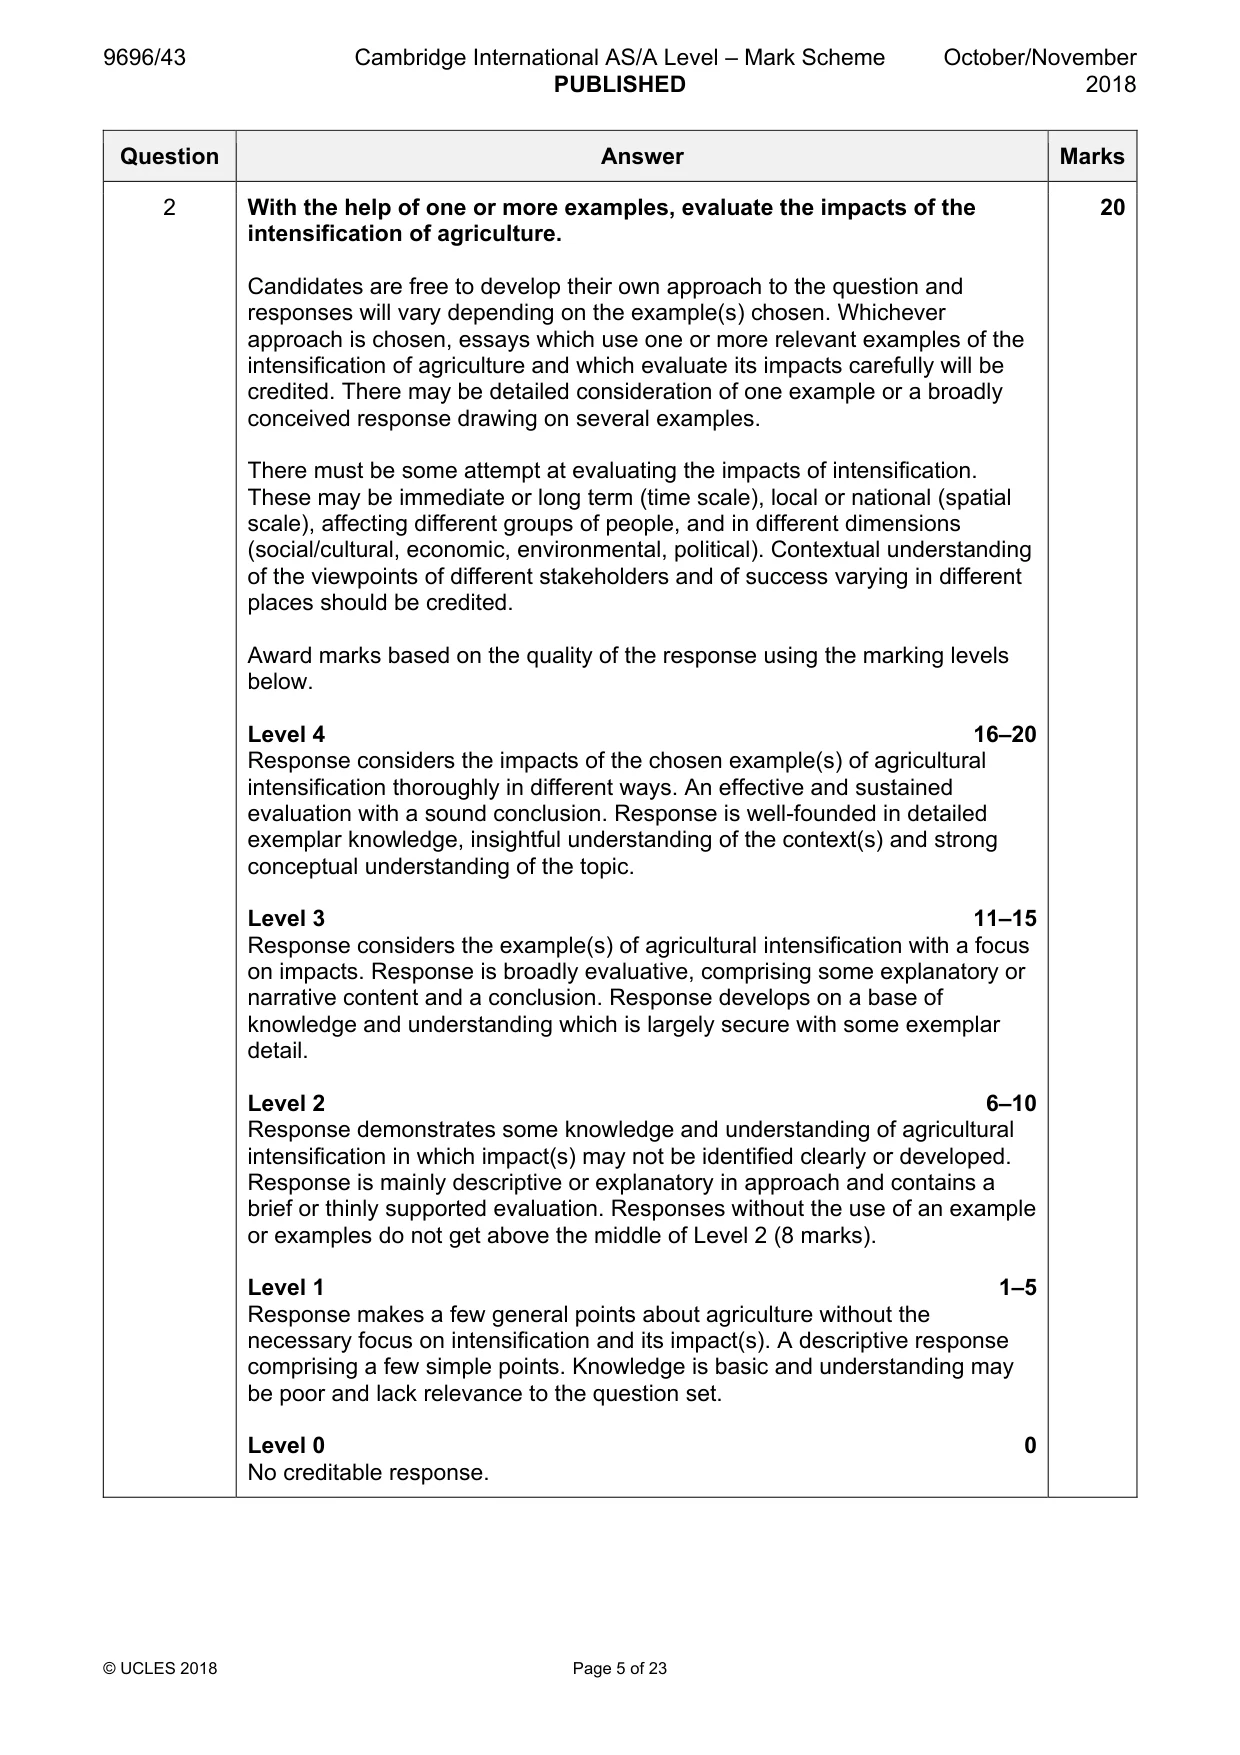
Mark scheme: 2 With the help of one or more examples, evaluate the impacts of the 20 intensification of agriculture. Candidates are free to develop their own approach to the question and responses will vary depending on the example(s) chosen. Whichever approach is chosen, essays which use one or more relevant examples of the intensification of agriculture and which evaluate its impacts carefully will be credited. There may be detailed consideration of one example or a broadly conceived response drawing on several examples. There must be some attempt at evaluating the impacts of intensification. These may be immediate or long term (time scale), local or national (spatial scale), affecting different groups of people, and in different dimensions (social/cultural, economic, environmental, political). Contextual understanding of the viewpoints of different stakeholders and of success varying in different places should be credited. Award marks based on the quality of the response using the marking levels below. Level 4 16–20 Response considers the impacts of the chosen example(s) of agricultural intensification thoroughly in different ways. An effective and sustained evaluation with a sound conclusion. Response is well-founded in detailed exemplar knowledge, insightful understanding of the context(s) and strong conceptual understanding of the topic. Level 3 11–15 Response considers the example(s) of agricultural intensification with a focus on impacts. Response is broadly evaluative, comprising some explanatory or narrative content and a conclusion. Response develops on a base of knowledge and understanding which is largely secure with some exemplar detail. Level 2 6–10 Response demonstrates some knowledge and understanding of agricultural intensification in which impact(s) may not be identified clearly or developed. Response is mainly descriptive or explanatory in approach and contains a brief or thinly supported evaluation. Responses without the use of an example or examples do not get above the middle of Level 2 (8 marks). Level 1 1–5 Response makes a few general points about agriculture without the necessary focus on intensification and its impact(s). A descriptive response comprising a few simple points. Knowledge is basic and understanding may be poor and lack relevance to the question set. Level 0 0 No creditable response.
Q3 · To what extent have changes in manufacturing overcome the issues that manufacturing faced…
3 To what extent have changes in manufacturing overcome the issues that manufacturing faced in one country you have studied? [20] [Total: 30] Environmental management If answering this option, answer Question 4 and either Question 5 or Question 6.
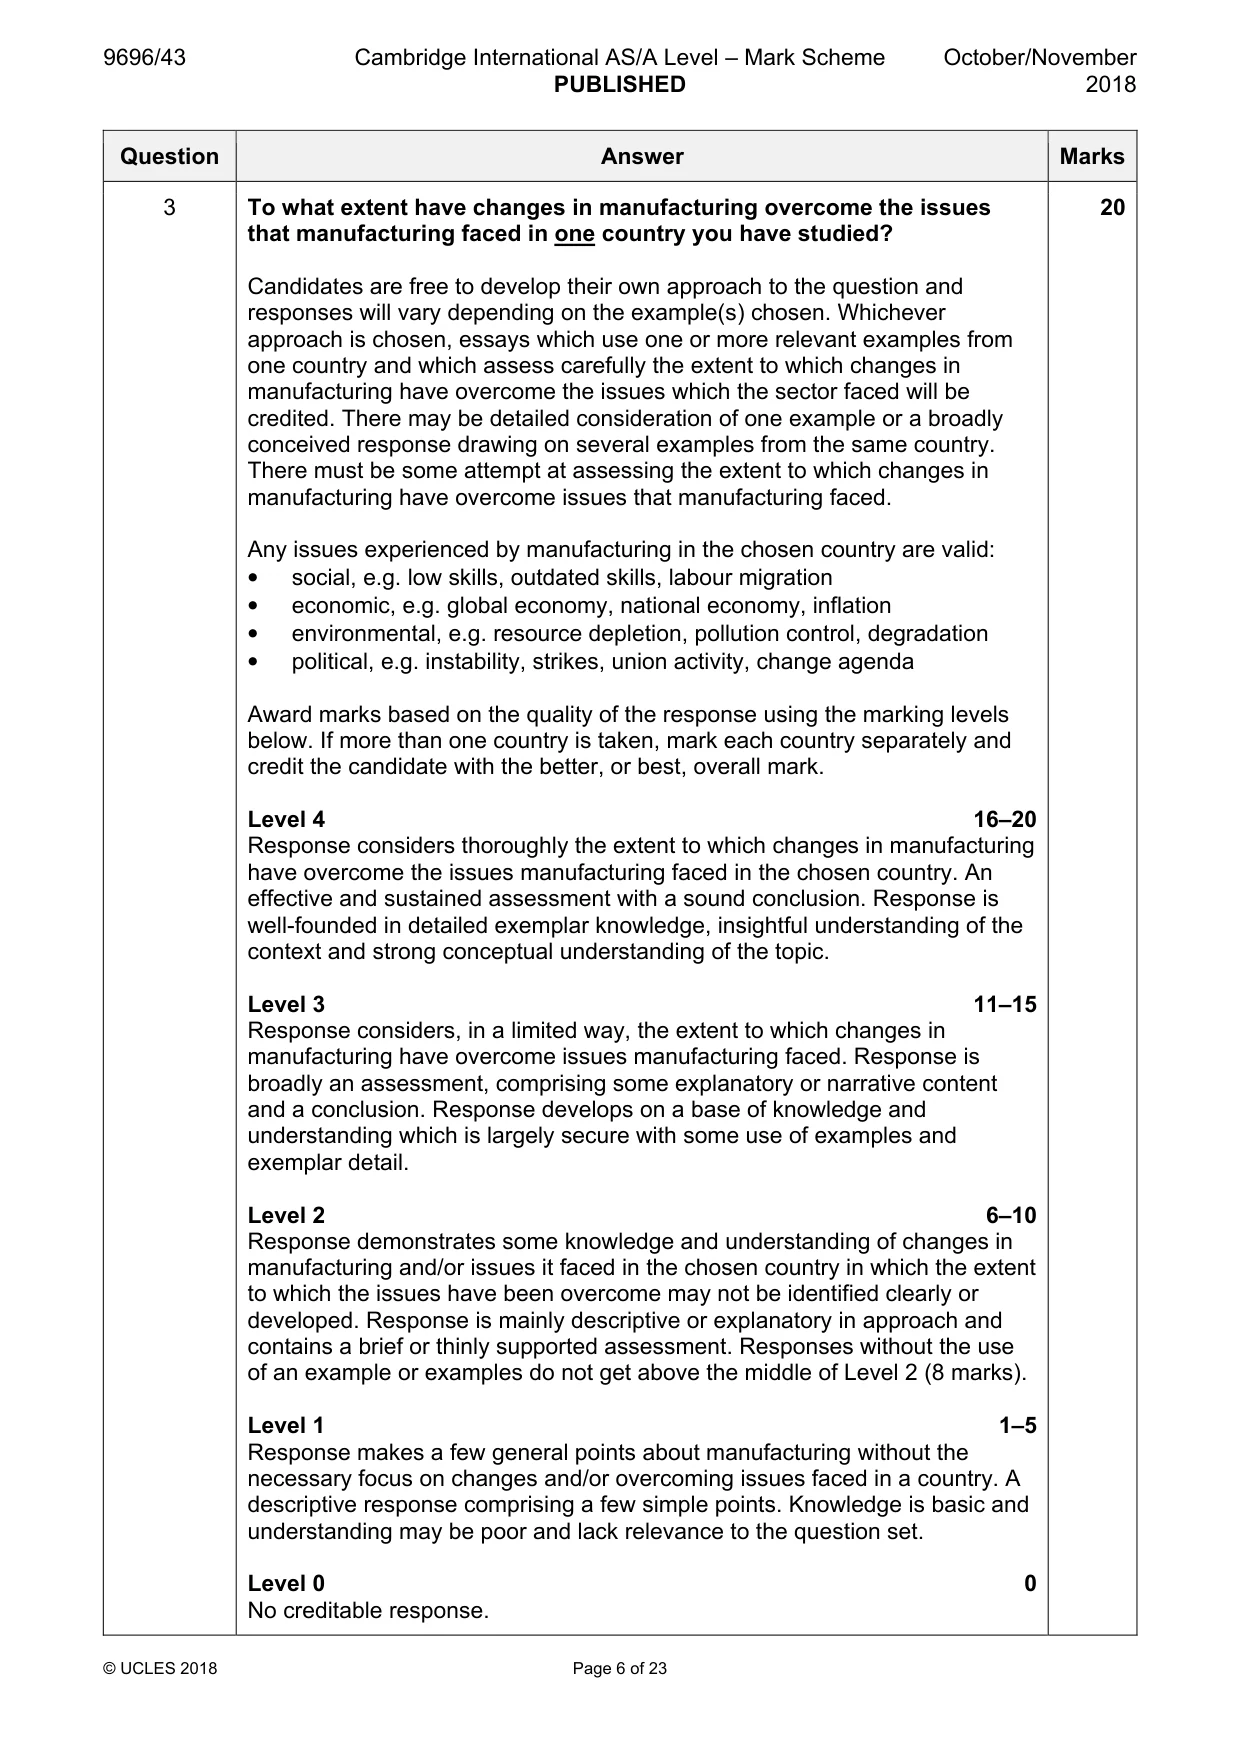
Mark scheme: 3 To what extent have changes in manufacturing overcome the issues 20 that manufacturing faced in one country you have studied? Candidates are free to develop their own approach to the question and responses will vary depending on the example(s) chosen. Whichever approach is chosen, essays which use one or more relevant examples from one country and which assess carefully the extent to which changes in manufacturing have overcome the issues which the sector faced will be credited. There may be detailed consideration of one example or a broadly conceived response drawing on several examples from the same country. There must be some attempt at assessing the extent to which changes in manufacturing have overcome issues that manufacturing faced. Any issues experienced by manufacturing in the chosen country are valid: • social, e.g. low skills, outdated skills, labour migration • economic, e.g. global economy, national economy, inflation • environmental, e.g. resource depletion, pollution control, degradation • political, e.g. instability, strikes, union activity, change agenda Award marks based on the quality of the response using the marking levels below. If more than one country is taken, mark each country separately and credit the candidate with the better, or best, overall mark. Level 4 16–20 Response considers thoroughly the extent to which changes in manufacturing have overcome the issues manufacturing faced in the chosen country. An effective and sustained assessment with a sound conclusion. Response is well-founded in detailed exemplar knowledge, insightful understanding of the context and strong conceptual understanding of the topic. Level 3 11–15 Response considers, in a limited way, the extent to which changes in manufacturing have overcome issues manufacturing faced. Response is broadly an assessment, comprising some explanatory or narrative content and a conclusion. Response develops on a base of knowledge and understanding which is largely secure with some use of examples and exemplar detail. Level 2 6–10 Response demonstrates some knowledge and understanding of changes in manufacturing and/or issues it faced in the chosen country in which the extent to which the issues have been overcome may not be identified clearly or developed. Response is mainly descriptive or explanatory in approach and contains a brief or thinly supported assessment. Responses without the use of an example or examples do not get above the middle of Level 2 (8 marks). Level 1 1–5 Response makes a few general points about manufacturing without the necessary focus on changes and/or overcoming issues faced in a country. A descriptive response comprising a few simple points. Knowledge is basic and understanding may be poor and lack relevance to the question set. Level 0 0 No creditable response. Environmental management If answering this option, answer Question 4 and either Question 5 or Question 6.
Q4 · A photograph which shows a section of the Ramapo River, USA, an HIC in North America
4 Fig. 4.1 is a photograph which shows a section of the Ramapo River, USA, an HIC in North America. (a) Describe the evidence in Fig. 4.1 which suggests the river is polluted. [3] (b) Suggest what can be done to improve water quality in the river shown in Fig. 4.1. [7]
Mark scheme: 4(a) Fig. 4.1 is a photograph which shows a section of the Ramapo River, 3 USA, an HIC in North America. Describe the evidence in Fig. 4.1 which suggests the river is polluted. Candidates should give evidence from the figure to support their description of a river which shows: • algal growth/bloom • probably due to eutrophication (excessive nitrates) • covering a large area and along the banks (extent) • it is a bright green, floating surface scum/film, which appears in clumps and strings • opaque/dark green discoloration of the water • it blocks out the light and impacts the ecosystem negatively/reduced oxygen 1 mark for each valid point. 4(b) Suggest what can be done to improve water quality in the river shown in 7 Fig. 4.1. Candidates should suggest what can be done to improve water quality in the river in the photograph. The answer does not need to be comprehensive to gain full marks. Eutrophication and algal growth or bloom result from very high levels of plant nutrients, often derived from excess agricultural fertilisers or slurry washed or carried into the river from surrounding agricultural land, or from other forms of water pollution such as sewage effluents from inadequate sanitation (because of its age, limited capacity or because of breaks or spillages). Other forms of water pollution are acceptable such as sedimentation, littering, pollution, etc. What can be done to improve water quality includes: • environmental survey of the river and catchment to map and establish the nature of the problem • obtaining finance for a large scale, medium to long-term project • consulting with stakeholders, e.g. farmers, water authority, tourism sector, local residents, fishermen • incentives to reduce use of agricultural fertilisers • education, e.g. of farmers, in local schools • training in greener, more environmentally-friendly agricultural production, e.g. organic farming, careful use of NPK fertilisers • diversification of rural economy, e.g. to forestry, recreation and tourism • investment in new efficient high-capacity sanitation system • enforcement measures and fines • monitoring of water quality • other Award marks based on the quality of the explanation and breadth of the response using the marking levels below. Level 3 6–7 Response explains a range of suggested actions associated with improving water quality in the river. Response is well-founded in detailed knowledge and strong conceptual understanding of the topic. Any examples used are appropriate and integrated effectively into the response. Level 2 3–5 Response explains suggested actions associated with improving water quality in the river in a limited manner. Response develops on a largely secure base of knowledge and understanding. Examples may lack detail or development. Level 1 1–2 Response comprises one or more descriptive points about water quality and pollution with little or no suggested action associated with improving water quality in the river. Knowledge is basic and understanding may be inaccurate. Examples are in name only or lacking entirely. Level 0 0 No creditable response.
Q5 · ‘Producing energy from renewable resources is not the answer to meeting energy demand.’…
5 ‘Producing energy from renewable resources is not the answer to meeting energy demand.’ How far do you agree? [20]
Mark scheme: 5 ‘Producing energy from renewable resources is not the answer to 20 meeting energy demand.’ How far do you agree? Candidates are free to develop their own approach to the question and responses will vary depending on geographical perspective or viewpoint and the example(s) chosen. Whichever approach is chosen, essays which use one or more relevant examples and which assess the statement carefully will be credited. Two or more renewable resources (the syllabus lists hydro- electric power (HEP), wind and biofuels) should be considered, although candidates may take any renewable, such as solar or geothermal. Nuclear is an acceptable renewable alternative to traditional non-renewables/fossil fuels. There may be detailed consideration of one example of each renewable resource or a broadly conceived response drawing on several examples. There must be some attempt at assessing the idea that producing energy from renewable resources is not the answer to meeting energy demand. This may be considered from different viewpoints. Agreement: • socially, e.g. inability to meet increasing domestic demand, unpopularity • economically, e.g. low output, variability, costs for LICs, lack of effective alternatives to oil for transport • environmentally, e.g. negative impacts, e.g. HEP on hydrology and catchments, wind on landscape quality, lack of suitable sites, seasonality • politically, e.g. pressure to use cheap, domestic resources Disagreement: • socially, e.g. increasing social conscience for green energy • economically, e.g. decreasing unit costs of solar/economies of scale from production, increasing cost of fossil fuels • environmentally, e.g. lower emissions • politically, e.g. meeting global targets, pressure groups, votes, conservation Contextual understanding of the different viewpoints of different stakeholders should be credited. Award marks based on the quality of the response using the marking levels below. Level 4 16–20 Response considers thoroughly whether producing energy from two or more renewable resources is the answer to meeting energy demand. An effective and sustained assessment which is multi-dimensional with a sound conclusion. Response is well-founded in detailed exemplar knowledge with insightful understanding of the context and strong conceptual understanding of the topic. 5 Level 3 11–15 Response considers whether producing energy from renewable resources is the answer to meeting energy demand. Response is broadly an assessment, comprising some explanatory or narrative content and a conclusion. Response develops on a base of knowledge and understanding which is largely secure with some exemplar detail. Level 2 6–10 Response demonstrates some knowledge and understanding of producing energy from one or more renewable resources in which whether it is the answer to meeting energy demand may not be identified clearly or developed. Response is mainly descriptive or explanatory in approach and contains a brief or thinly supported assessment. Responses without the use of an example or examples do not get above the middle of Level 2 (8 marks). Level 1 1–5 Response makes a few general points about renewable resources without the necessary focus on meeting energy demand. A descriptive response comprising a few simple points. Knowledge is basic and understanding may be poor and lack relevance to the question set. Level 0 0 No creditable response.
Q6 · Explain the constraints on improving the quality of one degraded environment and assess…
6 Explain the constraints on improving the quality of one degraded environment and assess the extent to which these constraints have been overcome. [20] [Total: 30] Global interdependence If answering this option, answer Question 7 and either Question 8 or Question 9.
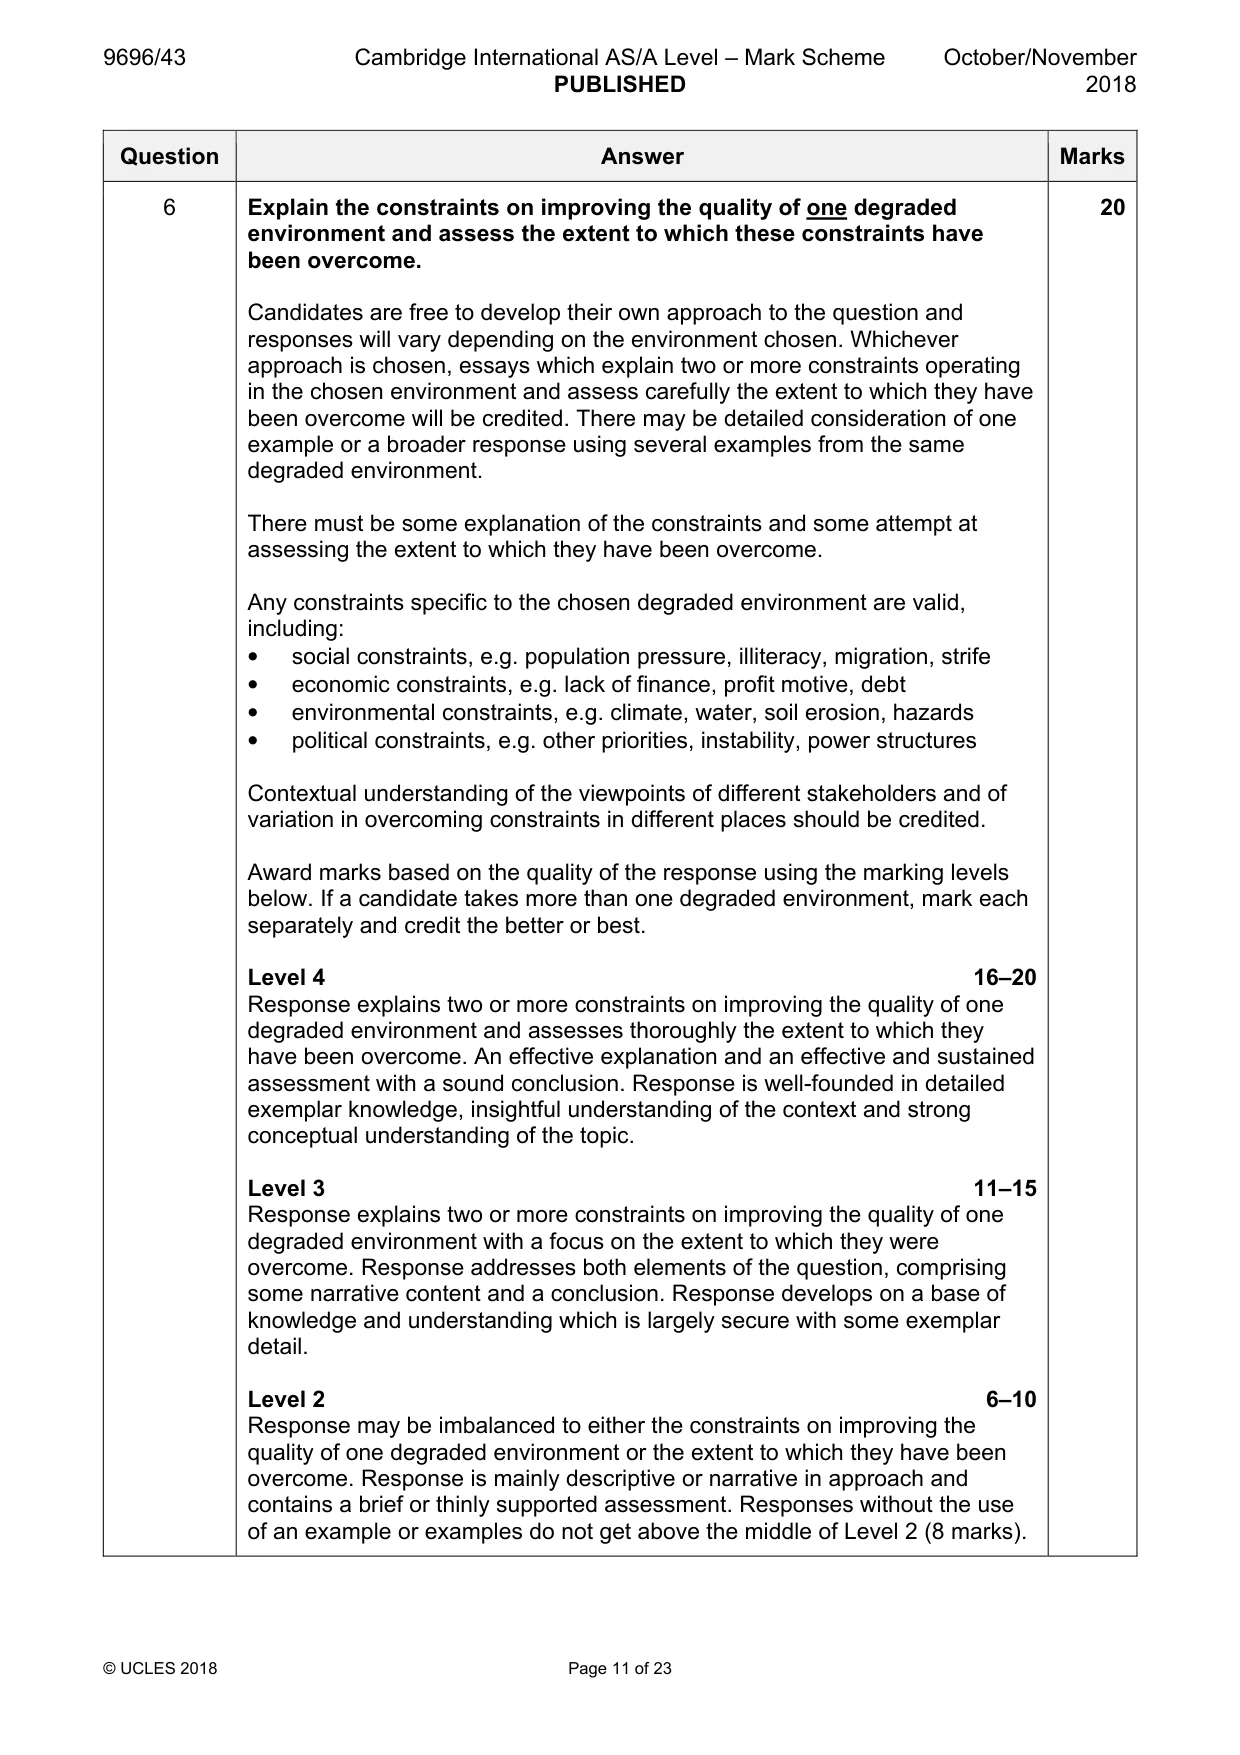
Mark scheme: 6 Explain the constraints on improving the quality of one degraded 20 environment and assess the extent to which these constraints have been overcome. Candidates are free to develop their own approach to the question and responses will vary depending on the environment chosen. Whichever approach is chosen, essays which explain two or more constraints operating in the chosen environment and assess carefully the extent to which they have been overcome will be credited. There may be detailed consideration of one example or a broader response using several examples from the same degraded environment. There must be some explanation of the constraints and some attempt at assessing the extent to which they have been overcome. Any constraints specific to the chosen degraded environment are valid, including: • social constraints, e.g. population pressure, illiteracy, migration, strife • economic constraints, e.g. lack of finance, profit motive, debt • environmental constraints, e.g. climate, water, soil erosion, hazards • political constraints, e.g. other priorities, instability, power structures Contextual understanding of the viewpoints of different stakeholders and of variation in overcoming constraints in different places should be credited. Award marks based on the quality of the response using the marking levels below. If a candidate takes more than one degraded environment, mark each separately and credit the better or best. Level 4 16–20 Response explains two or more constraints on improving the quality of one degraded environment and assesses thoroughly the extent to which they have been overcome. An effective explanation and an effective and sustained assessment with a sound conclusion. Response is well-founded in detailed exemplar knowledge, insightful understanding of the context and strong conceptual understanding of the topic. Level 3 11–15 Response explains two or more constraints on improving the quality of one degraded environment with a focus on the extent to which they were overcome. Response addresses both elements of the question, comprising some narrative content and a conclusion. Response develops on a base of knowledge and understanding which is largely secure with some exemplar detail. Level 2 6–10 Response may be imbalanced to either the constraints on improving the quality of one degraded environment or the extent to which they have been overcome. Response is mainly descriptive or narrative in approach and contains a brief or thinly supported assessment. Responses without the use of an example or examples do not get above the middle of Level 2 (8 marks). 6 Level 1 1–5 Response makes a few general points about a degraded environment without the necessary focus on constraints and the extent to which they have been overcome. A descriptive response in which knowledge is basic and understanding may be poor and lack relevance to the question set. Level 0 0 No creditable response. Global interdependence If answering this option, answer Question 7 and either Question 8 or Question 9.
Q7 · Monthly international tourist arrivals for the world in 2015
7 Fig. 7.1 shows monthly international tourist arrivals for the world in 2015. (a) Describe the pattern of international tourist arrivals shown in Fig. 7.1. [3] (b) Explain how tourist destinations attempt to increase the number of tourists in months of low demand as shown in Fig. 7.1. [7]
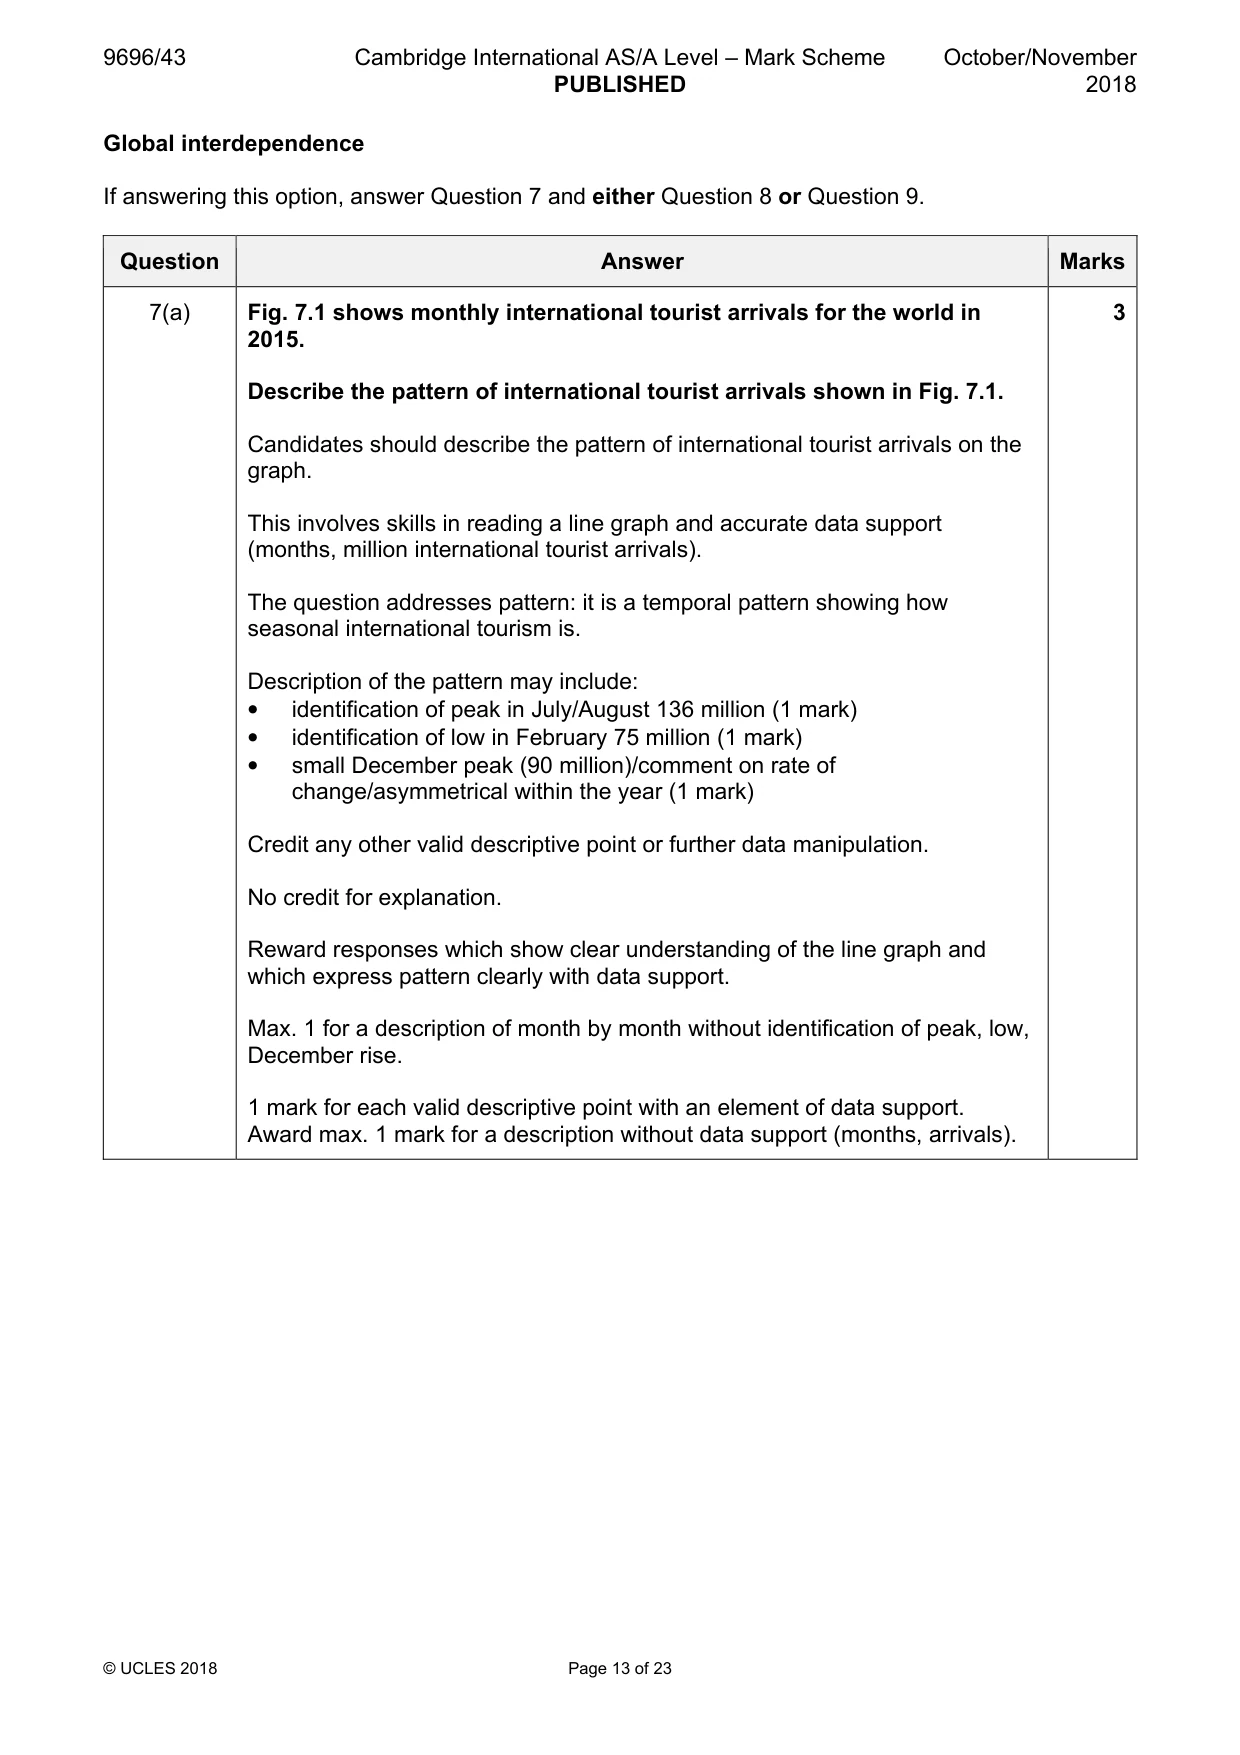
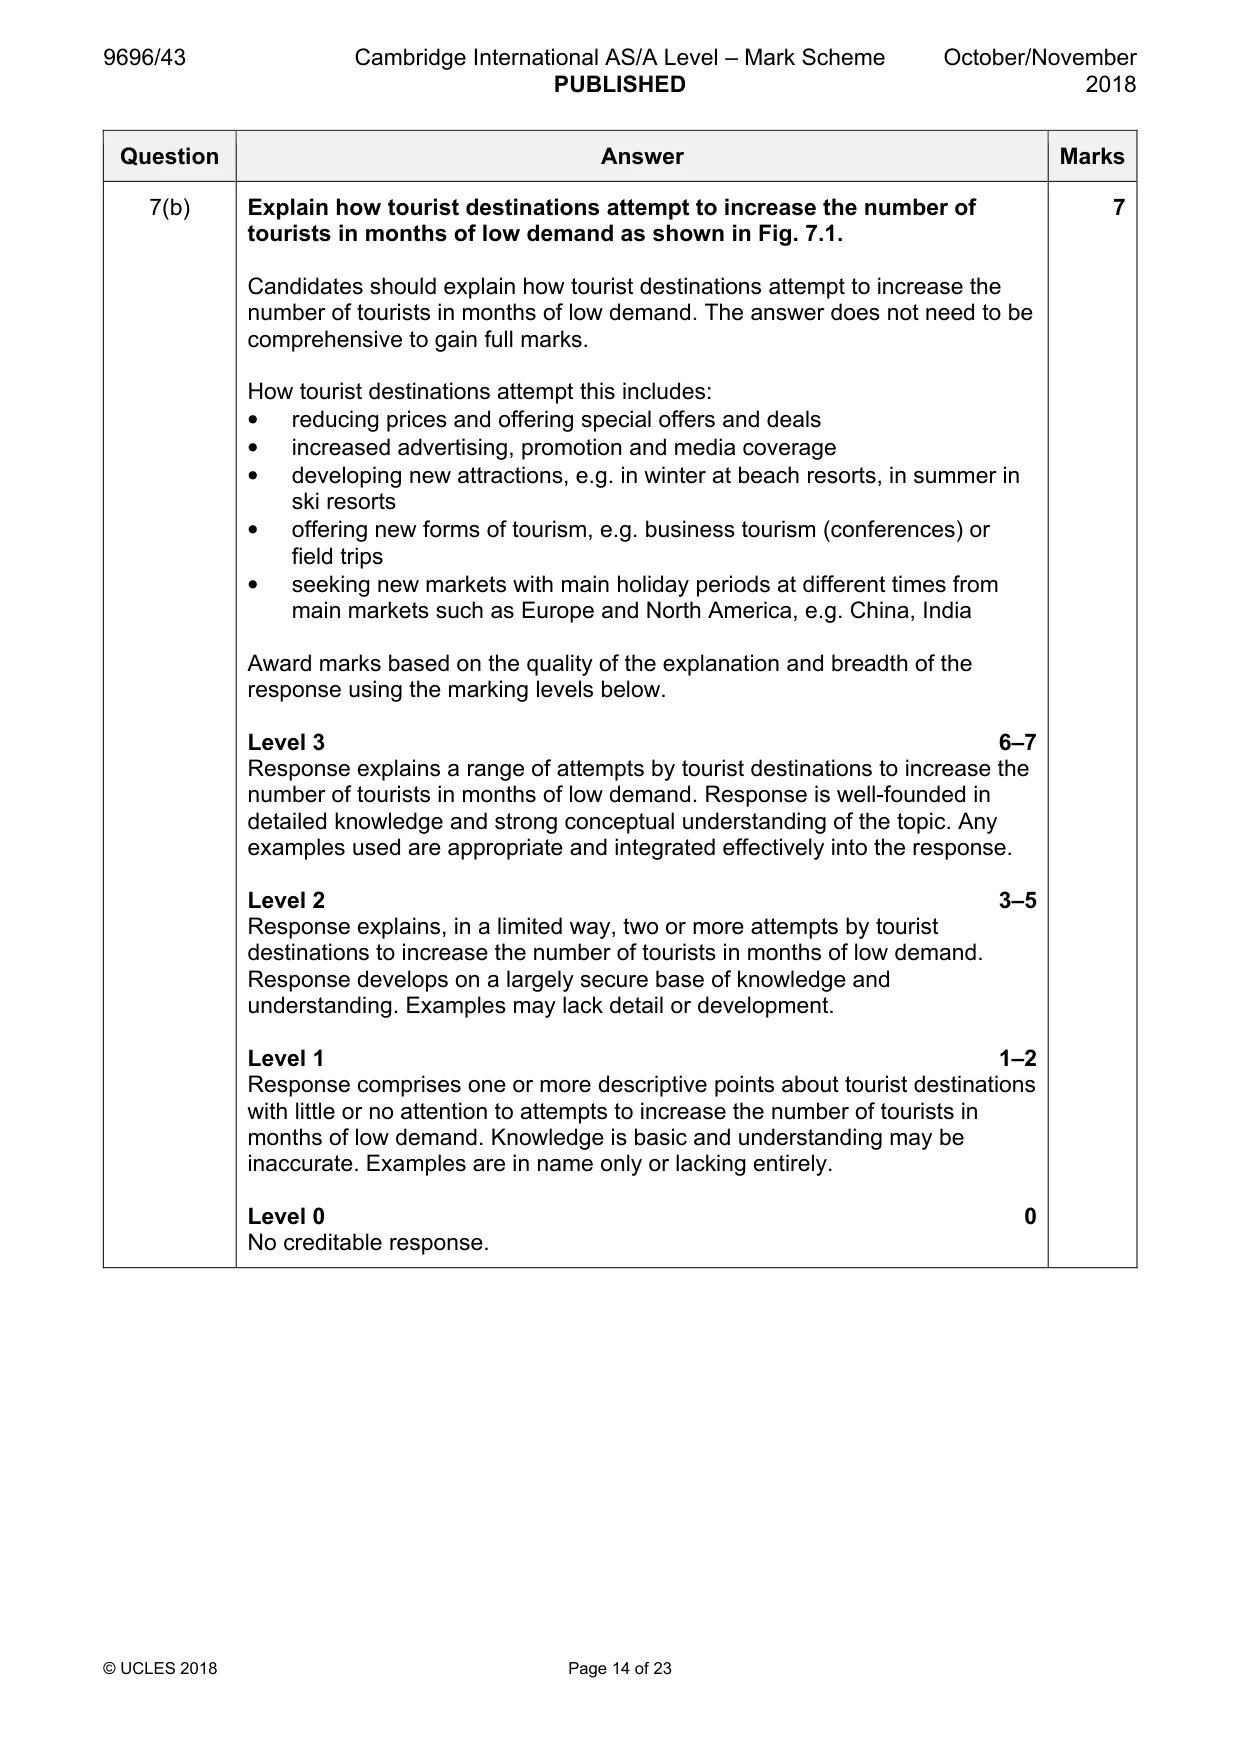
Mark scheme: 7(a) Fig. 7.1 shows monthly international tourist arrivals for the world in 3 2015. Describe the pattern of international tourist arrivals shown in Fig. 7.1. Candidates should describe the pattern of international tourist arrivals on the graph. This involves skills in reading a line graph and accurate data support (months, million international tourist arrivals). The question addresses pattern: it is a temporal pattern showing how seasonal international tourism is. Description of the pattern may include: • identification of peak in July/August 136 million (1 mark) • identification of low in February 75 million (1 mark) • small December peak (90 million)/comment on rate of change/asymmetrical within the year (1 mark) Credit any other valid descriptive point or further data manipulation. No credit for explanation. Reward responses which show clear understanding of the line graph and which express pattern clearly with data support. Max. 1 for a description of month by month without identification of peak, low, December rise. 1 mark for each valid descriptive point with an element of data support. Award max. 1 mark for a description without data support (months, arrivals). 7(b) Explain how tourist destinations attempt to increase the number of 7 tourists in months of low demand as shown in Fig. 7.1. Candidates should explain how tourist destinations attempt to increase the number of tourists in months of low demand. The answer does not need to be comprehensive to gain full marks. How tourist destinations attempt this includes: • reducing prices and offering special offers and deals • increased advertising, promotion and media coverage • developing new attractions, e.g. in winter at beach resorts, in summer in ski resorts • offering new forms of tourism, e.g. business tourism (conferences) or field trips • seeking new markets with main holiday periods at different times from main markets such as Europe and North America, e.g. China, India Award marks based on the quality of the explanation and breadth of the response using the marking levels below. Level 3 6–7 Response explains a range of attempts by tourist destinations to increase the number of tourists in months of low demand. Response is well-founded in detailed knowledge and strong conceptual understanding of the topic. Any examples used are appropriate and integrated effectively into the response. Level 2 3–5 Response explains, in a limited way, two or more attempts by tourist destinations to increase the number of tourists in months of low demand. Response develops on a largely secure base of knowledge and understanding. Examples may lack detail or development. Level 1 1–2 Response comprises one or more descriptive points about tourist destinations with little or no attention to attempts to increase the number of tourists in months of low demand. Knowledge is basic and understanding may be inaccurate. Examples are in name only or lacking entirely. Level 0 0 No creditable response.
Q8 · To what extent does resource endowment explain global patterns of trade flows?
8 To what extent does resource endowment explain global patterns of trade flows? [20]
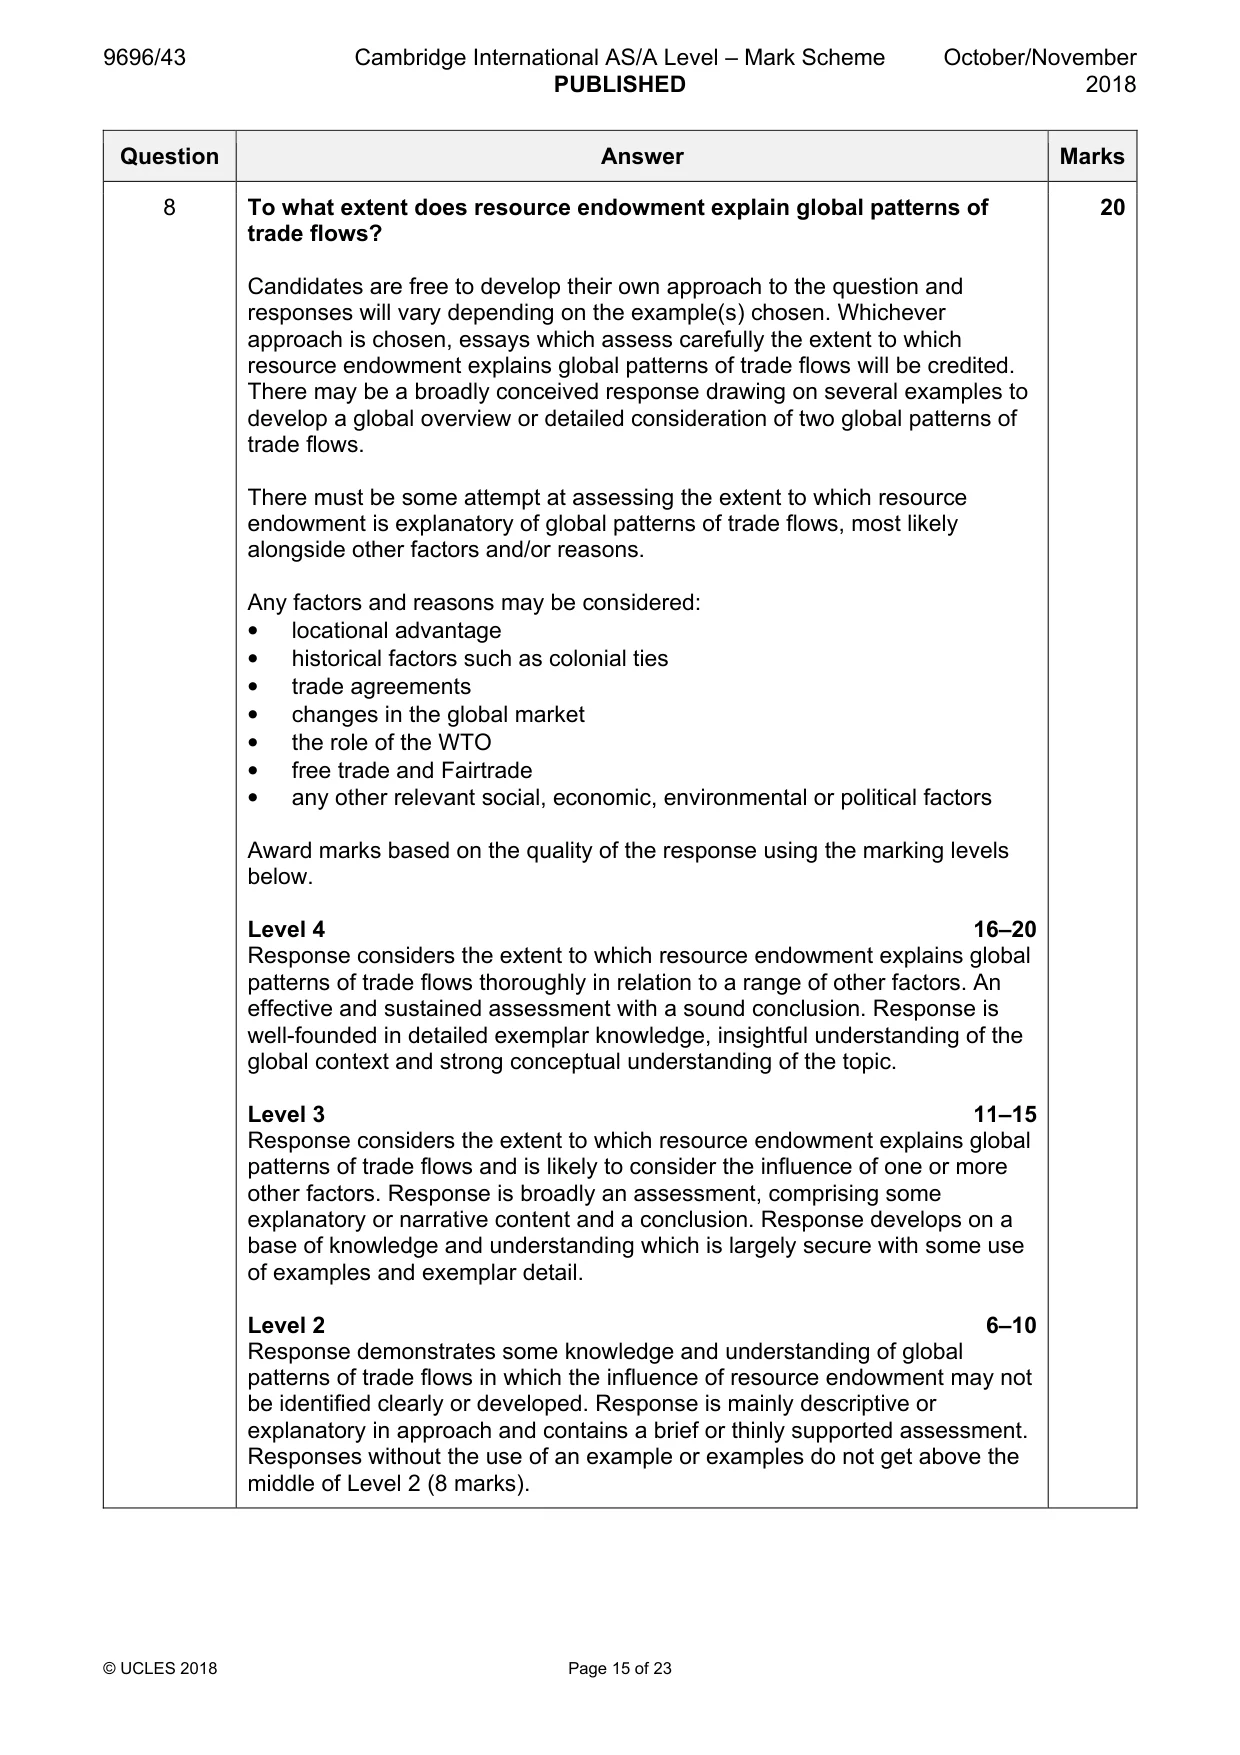
Mark scheme: 8 To what extent does resource endowment explain global patterns of 20 trade flows? Candidates are free to develop their own approach to the question and responses will vary depending on the example(s) chosen. Whichever approach is chosen, essays which assess carefully the extent to which resource endowment explains global patterns of trade flows will be credited. There may be a broadly conceived response drawing on several examples to develop a global overview or detailed consideration of two global patterns of trade flows. There must be some attempt at assessing the extent to which resource endowment is explanatory of global patterns of trade flows, most likely alongside other factors and/or reasons. Any factors and reasons may be considered: • locational advantage • historical factors such as colonial ties • trade agreements • changes in the global market • the role of the WTO • free trade and Fairtrade • any other relevant social, economic, environmental or political factors Award marks based on the quality of the response using the marking levels below. Level 4 16–20 Response considers the extent to which resource endowment explains global patterns of trade flows thoroughly in relation to a range of other factors. An effective and sustained assessment with a sound conclusion. Response is well-founded in detailed exemplar knowledge, insightful understanding of the global context and strong conceptual understanding of the topic. Level 3 11–15 Response considers the extent to which resource endowment explains global patterns of trade flows and is likely to consider the influence of one or more other factors. Response is broadly an assessment, comprising some explanatory or narrative content and a conclusion. Response develops on a base of knowledge and understanding which is largely secure with some use of examples and exemplar detail. Level 2 6–10 Response demonstrates some knowledge and understanding of global patterns of trade flows in which the influence of resource endowment may not be identified clearly or developed. Response is mainly descriptive or explanatory in approach and contains a brief or thinly supported assessment. Responses without the use of an example or examples do not get above the middle of Level 2 (8 marks). 8 Level 1 1–5 Response makes a few general points about global trade without the necessary focus on patterns of flows and the influence of resource endowment on them. A descriptive response comprising a few simple points. Knowledge is basic and understanding may be poor and lack relevance to the question set. Level 0 0 No creditable response.
Q9 · Assess the validity of the view that tourism which is truly environmentally sustainable…
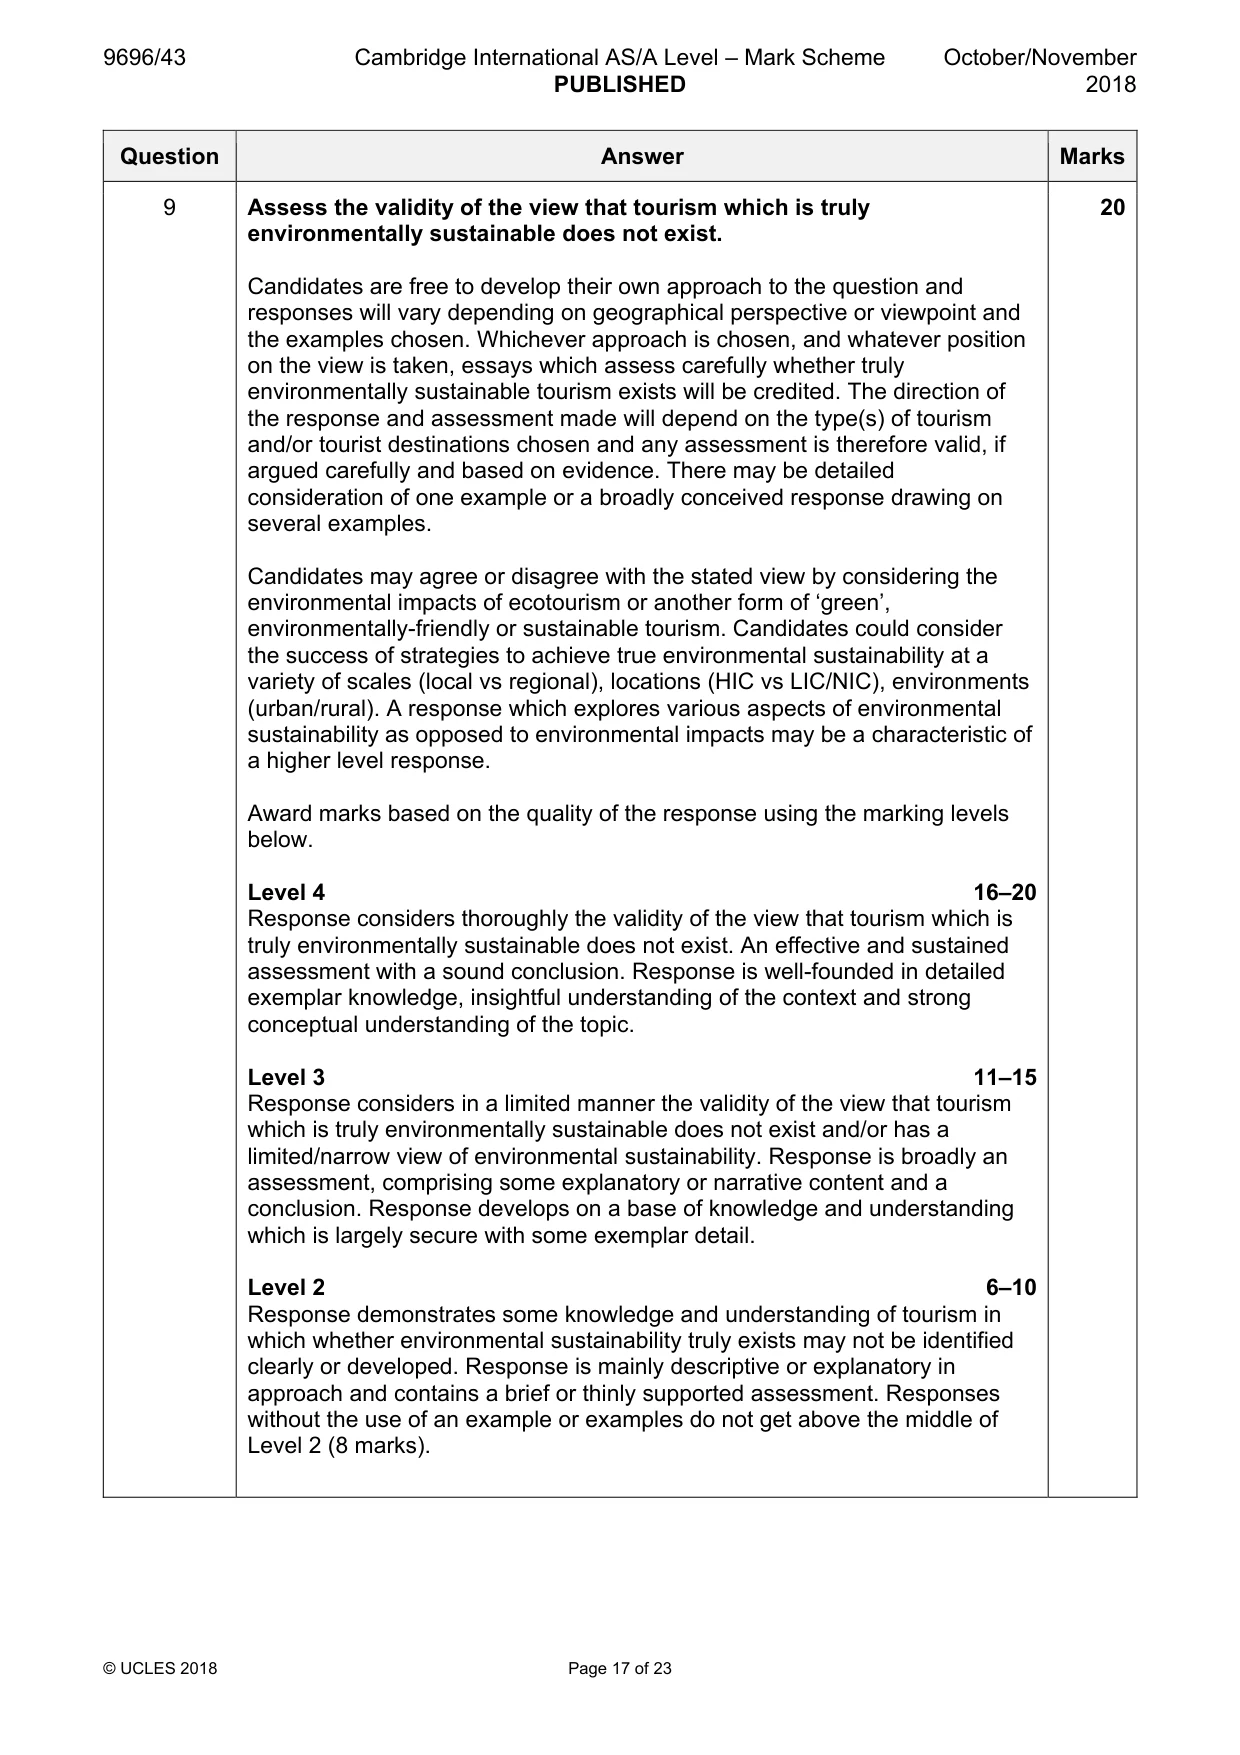
9 Assess the validity of the view that tourism which is truly environmentally sustainable does not exist. [20] [Total: 30] Economic transition If answering this option, answer Question 10 and either Question 11 or Question 12.
Mark scheme: 9 Assess the validity of the view that tourism which is truly 20 environmentally sustainable does not exist. Candidates are free to develop their own approach to the question and responses will vary depending on geographical perspective or viewpoint and the examples chosen. Whichever approach is chosen, and whatever position on the view is taken, essays which assess carefully whether truly environmentally sustainable tourism exists will be credited. The direction of the response and assessment made will depend on the type(s) of tourism and/or tourist destinations chosen and any assessment is therefore valid, if argued carefully and based on evidence. There may be detailed consideration of one example or a broadly conceived response drawing on several examples. Candidates may agree or disagree with the stated view by considering the environmental impacts of ecotourism or another form of ‘green’, environmentally-friendly or sustainable tourism. Candidates could consider the success of strategies to achieve true environmental sustainability at a variety of scales (local vs regional), locations (HIC vs LIC/NIC), environments (urban/rural). A response which explores various aspects of environmental sustainability as opposed to environmental impacts may be a characteristic of a higher level response. Award marks based on the quality of the response using the marking levels below. Level 4 16–20 Response considers thoroughly the validity of the view that tourism which is truly environmentally sustainable does not exist. An effective and sustained assessment with a sound conclusion. Response is well-founded in detailed exemplar knowledge, insightful understanding of the context and strong conceptual understanding of the topic. Level 3 11–15 Response considers in a limited manner the validity of the view that tourism which is truly environmentally sustainable does not exist and/or has a limited/narrow view of environmental sustainability. Response is broadly an assessment, comprising some explanatory or narrative content and a conclusion. Response develops on a base of knowledge and understanding which is largely secure with some exemplar detail. Level 2 6–10 Response demonstrates some knowledge and understanding of tourism in which whether environmental sustainability truly exists may not be identified clearly or developed. Response is mainly descriptive or explanatory in approach and contains a brief or thinly supported assessment. Responses without the use of an example or examples do not get above the middle of Level 2 (8 marks). 9 Level 1 1–5 Response makes a few general points about tourism without the necessary focus on environmental sustainability. A descriptive response comprising a few simple points. Knowledge is basic and understanding may be poor and lack relevance to the question set. Level 0 0 No creditable response. Economic transition If answering this option, answer Question 10 and either Question 11 or Question 12.
Q10 · Measures of the size of the economies of two MICs: China in Asia, and Mexico in North…
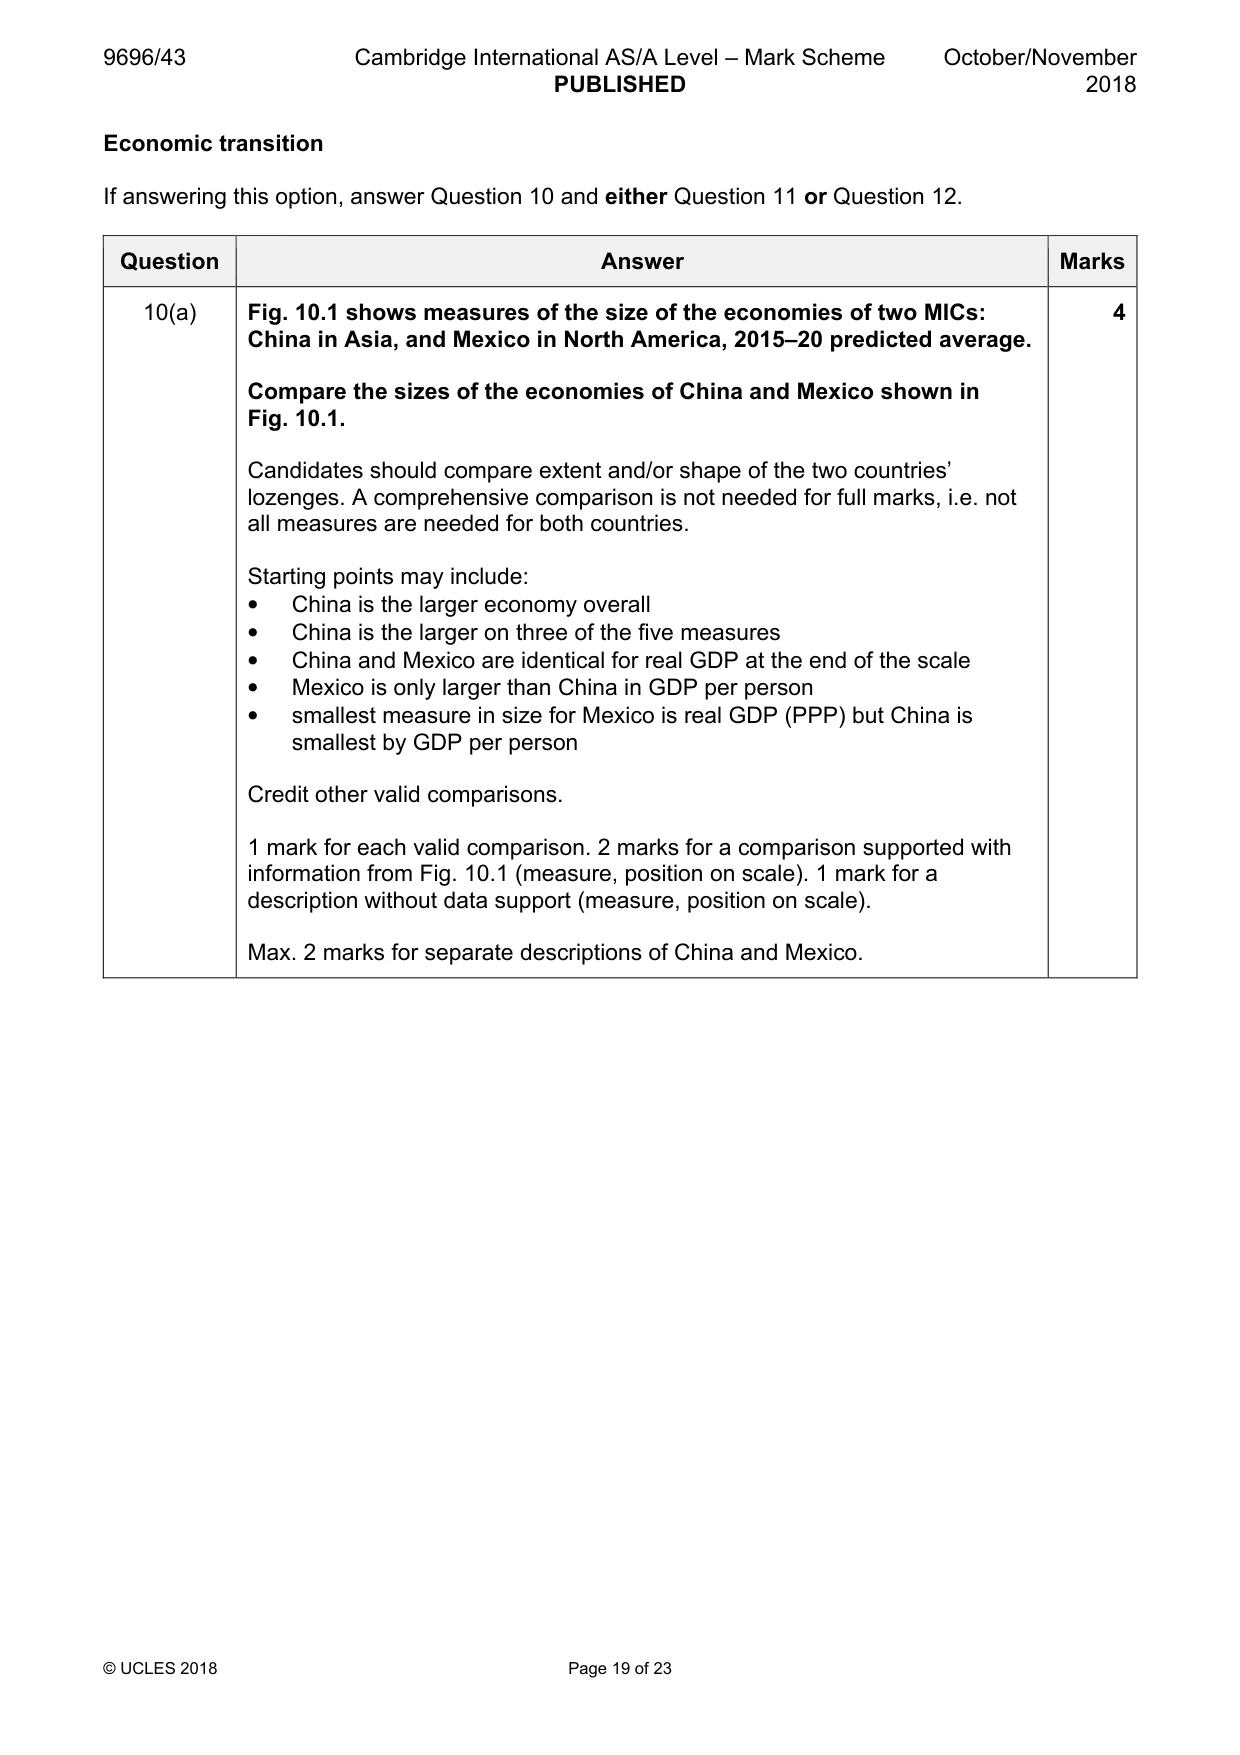
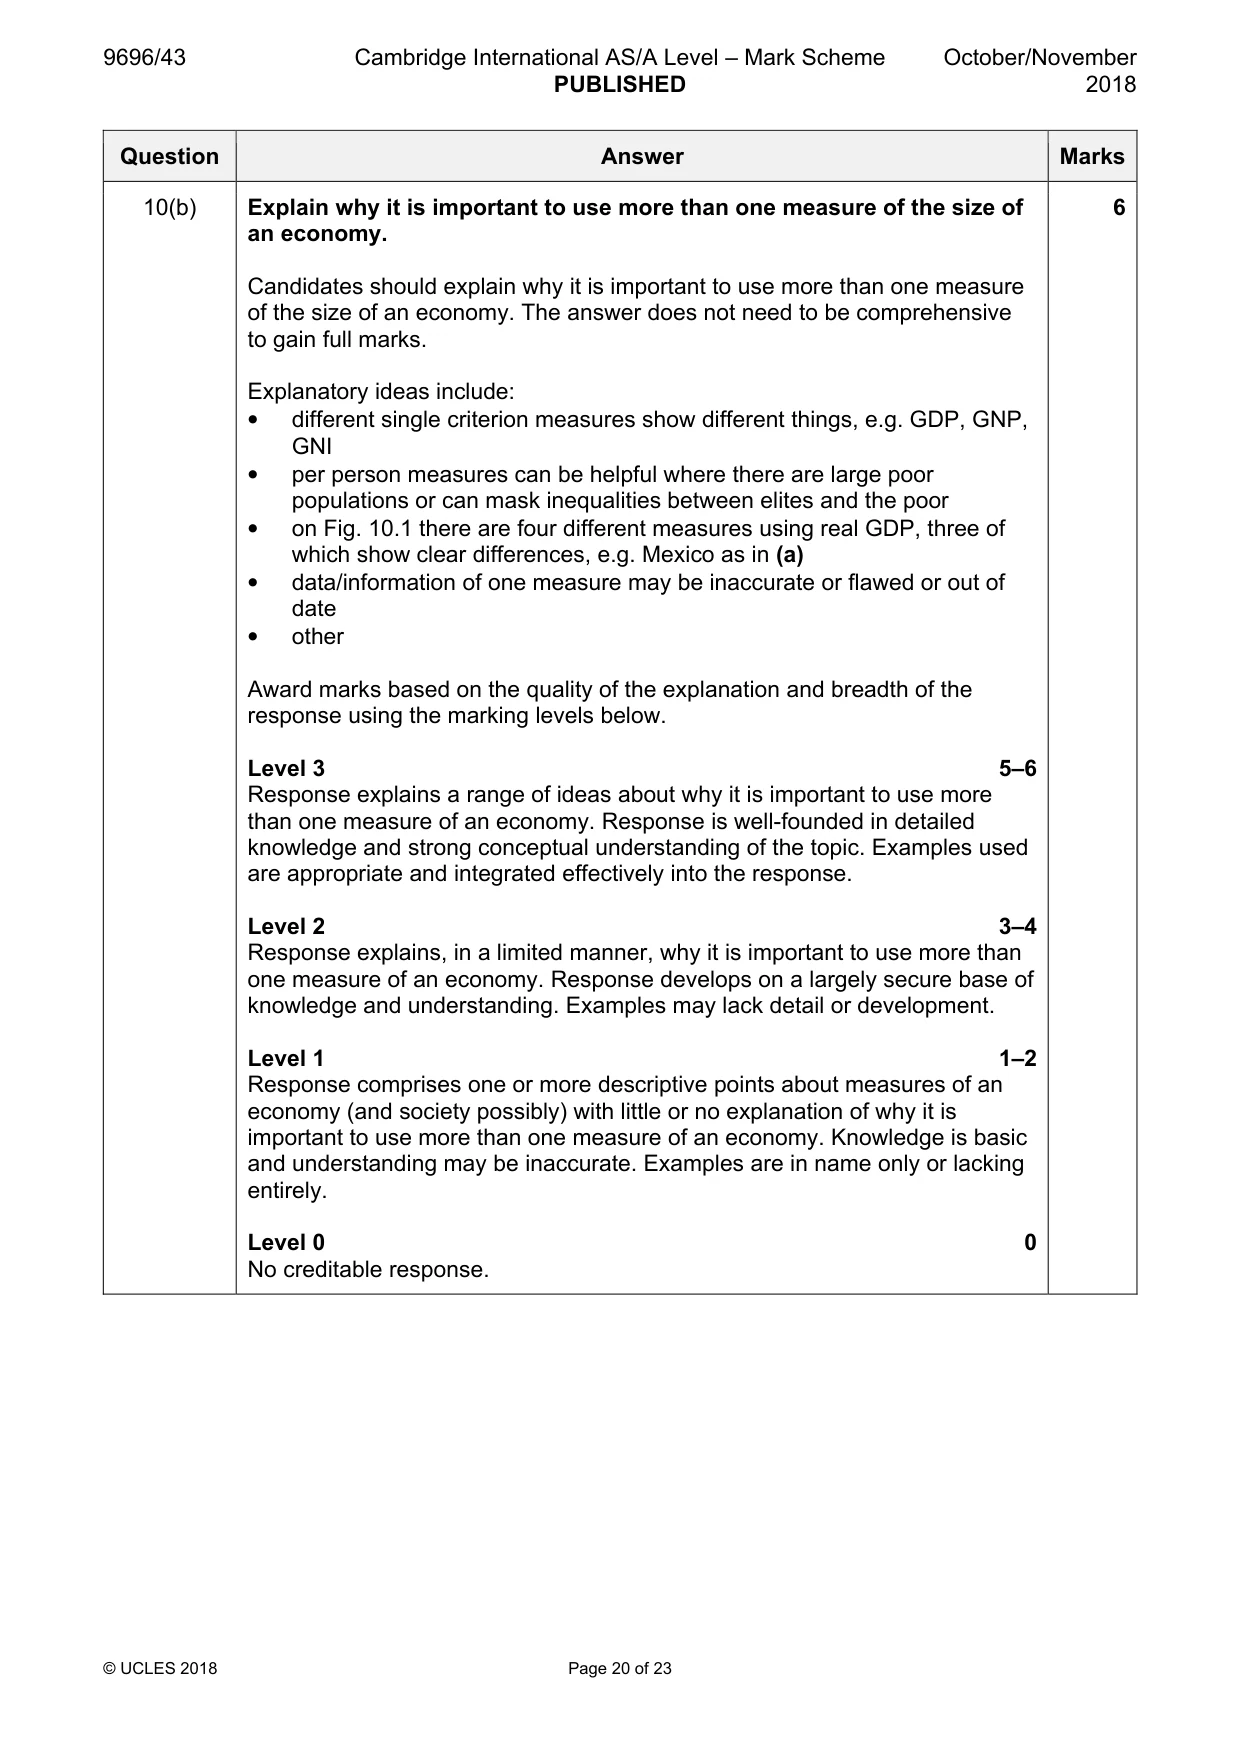
10 Fig. 10.1 shows measures of the size of the economies of two MICs: China in Asia, and Mexico in North America, 2015–20 predicted average. (a) Compare the sizes of the economies of China and Mexico shown in Fig. 10.1. [4] (b) Explain why it is important to use more than one measure of the size of an economy. [6]
Mark scheme: 10(a) Fig. 10.1 shows measures of the size of the economies of two MICs: 4 China in Asia, and Mexico in North America, 2015–20 predicted average. Compare the sizes of the economies of China and Mexico shown in Fig. 10.1. Candidates should compare extent and/or shape of the two countries’ lozenges. A comprehensive comparison is not needed for full marks, i.e. not all measures are needed for both countries. Starting points may include: • China is the larger economy overall • China is the larger on three of the five measures • China and Mexico are identical for real GDP at the end of the scale • Mexico is only larger than China in GDP per person • smallest measure in size for Mexico is real GDP (PPP) but China is smallest by GDP per person Credit other valid comparisons. 1 mark for each valid comparison. 2 marks for a comparison supported with information from Fig. 10.1 (measure, position on scale). 1 mark for a description without data support (measure, position on scale). Max. 2 marks for separate descriptions of China and Mexico. 10(b) Explain why it is important to use more than one measure of the size of 6 an economy. Candidates should explain why it is important to use more than one measure of the size of an economy. The answer does not need to be comprehensive to gain full marks. Explanatory ideas include: • different single criterion measures show different things, e.g. GDP, GNP, GNI • per person measures can be helpful where there are large poor populations or can mask inequalities between elites and the poor • on Fig. 10.1 there are four different measures using real GDP, three of which show clear differences, e.g. Mexico as in (a) • data/information of one measure may be inaccurate or flawed or out of date • other Award marks based on the quality of the explanation and breadth of the response using the marking levels below. Level 3 5–6 Response explains a range of ideas about why it is important to use more than one measure of an economy. Response is well-founded in detailed knowledge and strong conceptual understanding of the topic. Examples used are appropriate and integrated effectively into the response. Level 2 3–4 Response explains, in a limited manner, why it is important to use more than one measure of an economy. Response develops on a largely secure base of knowledge and understanding. Examples may lack detail or development. Level 1 1–2 Response comprises one or more descriptive points about measures of an economy (and society possibly) with little or no explanation of why it is important to use more than one measure of an economy. Knowledge is basic and understanding may be inaccurate. Examples are in name only or lacking entirely. Level 0 0 No creditable response.
Q11 · Assess why the location of economic activity within the global economy has changed
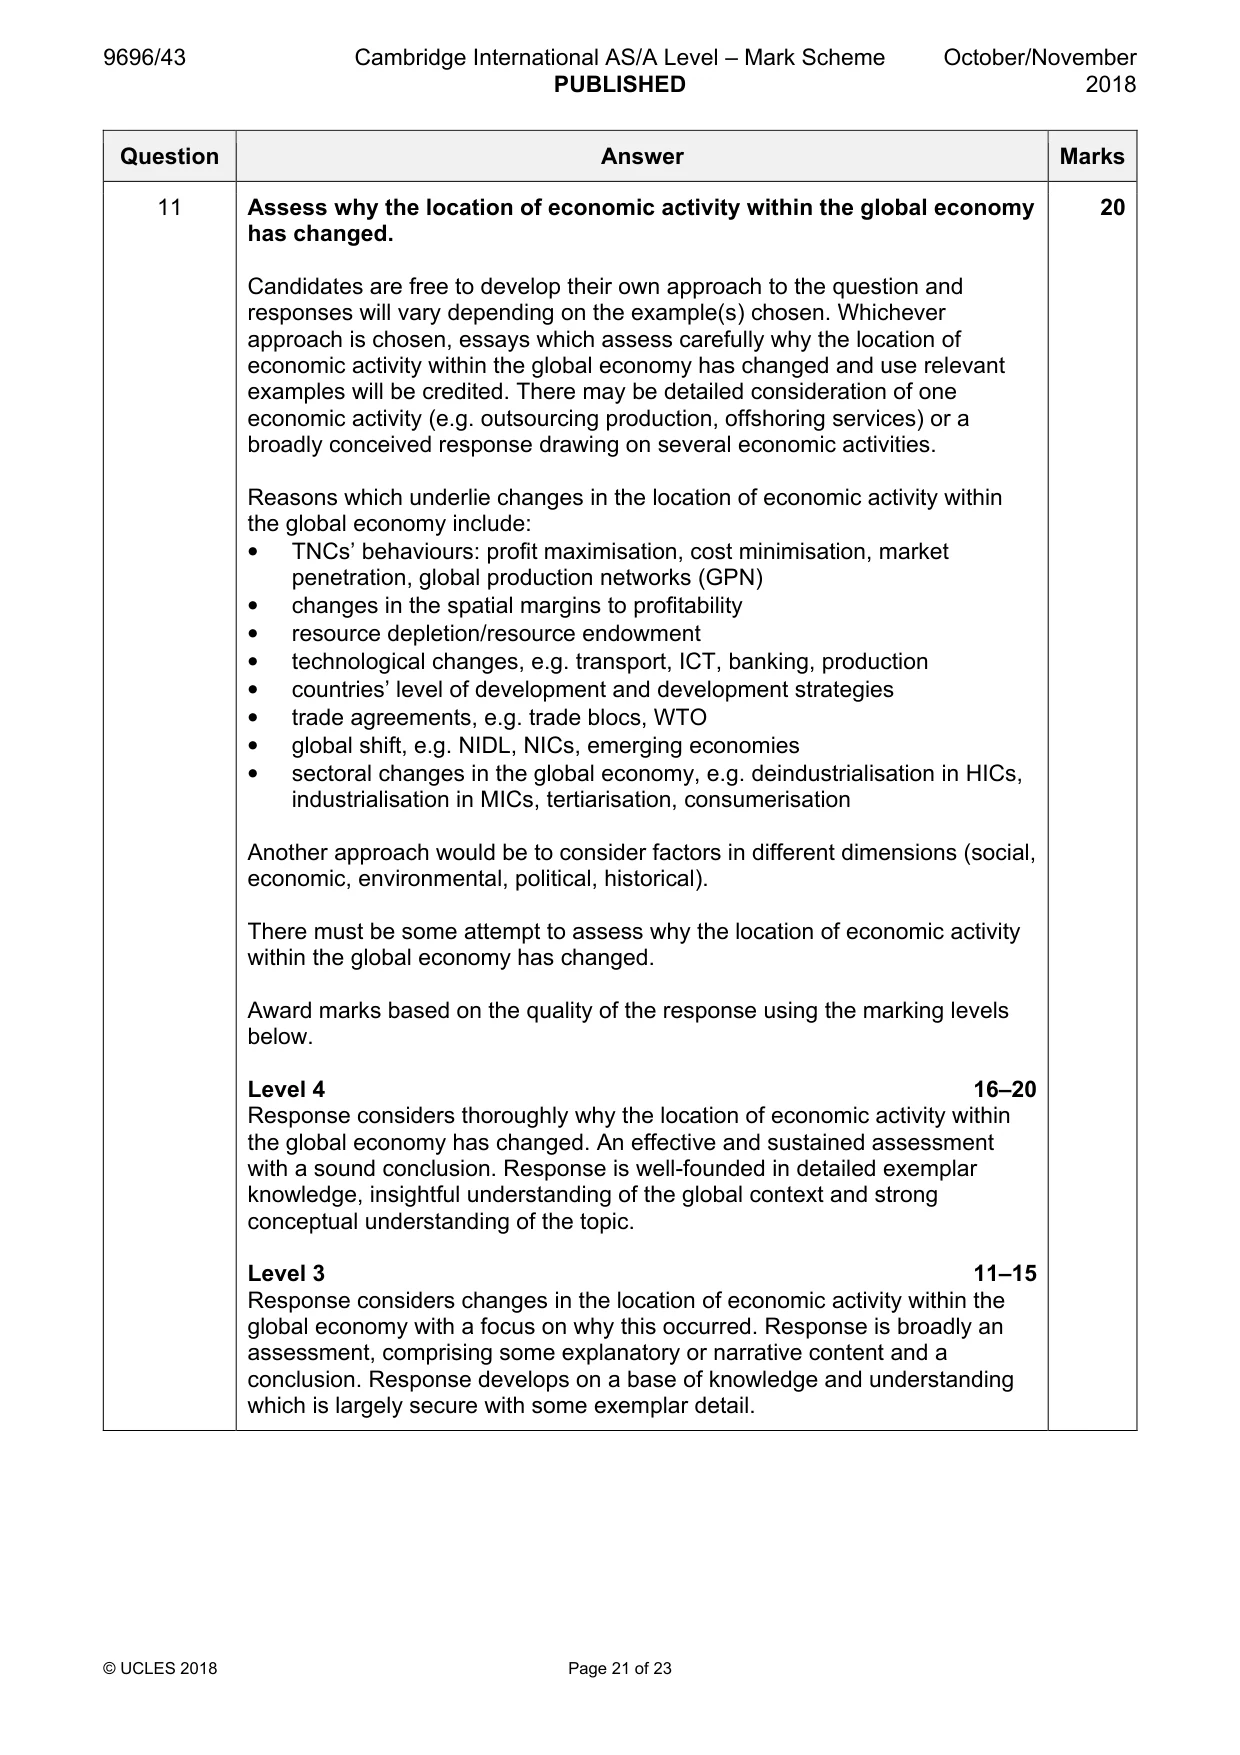
11 Assess why the location of economic activity within the global economy has changed. [20]
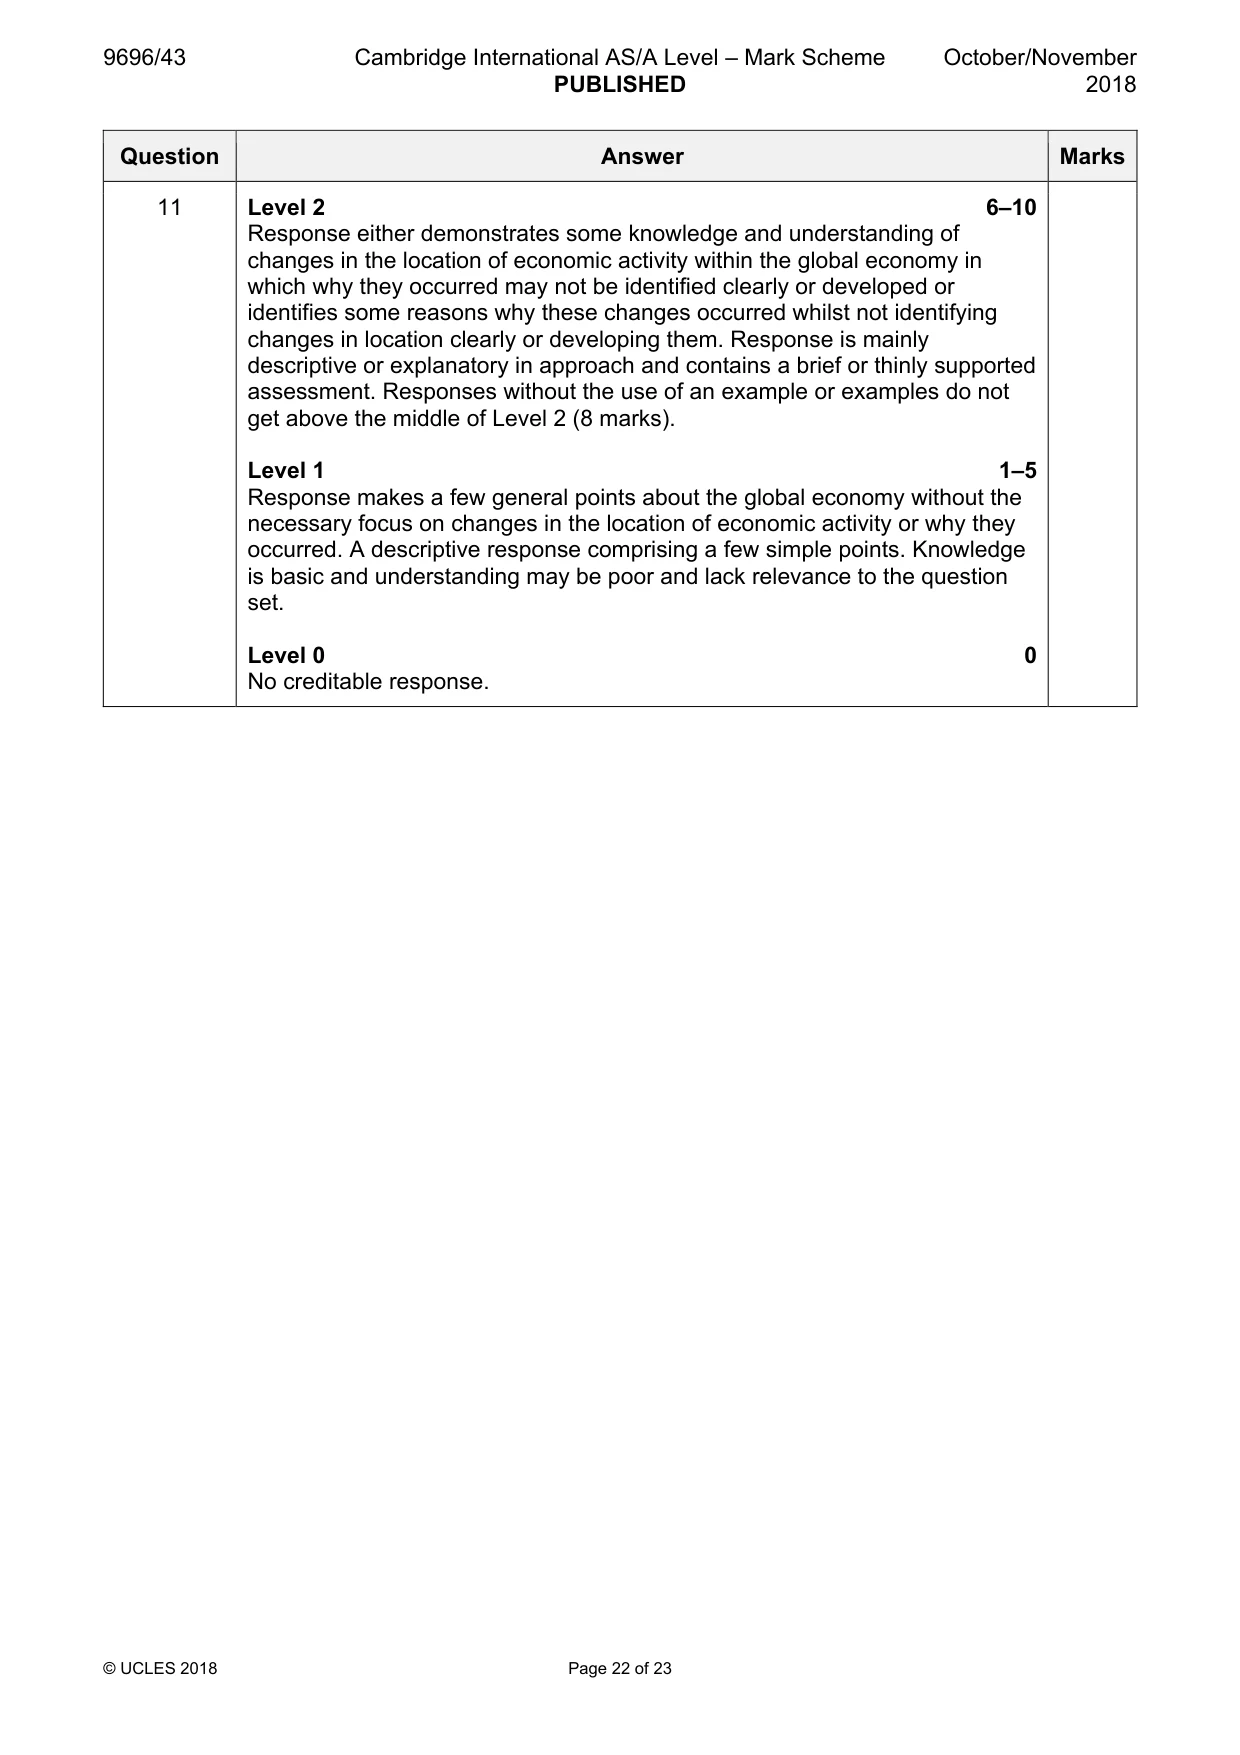
Mark scheme: 11 Assess why the location of economic activity within the global economy 20 has changed. Candidates are free to develop their own approach to the question and responses will vary depending on the example(s) chosen. Whichever approach is chosen, essays which assess carefully why the location of economic activity within the global economy has changed and use relevant examples will be credited. There may be detailed consideration of one economic activity (e.g. outsourcing production, offshoring services) or a broadly conceived response drawing on several economic activities. Reasons which underlie changes in the location of economic activity within the global economy include: • TNCs’ behaviours: profit maximisation, cost minimisation, market penetration, global production networks (GPN) • changes in the spatial margins to profitability • resource depletion/resource endowment • technological changes, e.g. transport, ICT, banking, production • countries’ level of development and development strategies • trade agreements, e.g. trade blocs, WTO • global shift, e.g. NIDL, NICs, emerging economies • sectoral changes in the global economy, e.g. deindustrialisation in HICs, industrialisation in MICs, tertiarisation, consumerisation Another approach would be to consider factors in different dimensions (social, economic, environmental, political, historical). There must be some attempt to assess why the location of economic activity within the global economy has changed. Award marks based on the quality of the response using the marking levels below. Level 4 16–20 Response considers thoroughly why the location of economic activity within the global economy has changed. An effective and sustained assessment with a sound conclusion. Response is well-founded in detailed exemplar knowledge, insightful understanding of the global context and strong conceptual understanding of the topic. Level 3 11–15 Response considers changes in the location of economic activity within the global economy with a focus on why this occurred. Response is broadly an assessment, comprising some explanatory or narrative content and a conclusion. Response develops on a base of knowledge and understanding which is largely secure with some exemplar detail. 11 Level 2 6–10 Response either demonstrates some knowledge and understanding of changes in the location of economic activity within the global economy in which why they occurred may not be identified clearly or developed or identifies some reasons why these changes occurred whilst not identifying changes in location clearly or developing them. Response is mainly descriptive or explanatory in approach and contains a brief or thinly supported assessment. Responses without the use of an example or examples do not get above the middle of Level 2 (8 marks). Level 1 1–5 Response makes a few general points about the global economy without the necessary focus on changes in the location of economic activity or why they occurred. A descriptive response comprising a few simple points. Knowledge is basic and understanding may be poor and lack relevance to the question set. Level 0 0 No creditable response.
Q12 · To what extent have the regional disparities within one country you have studied been…
12 To what extent have the regional disparities within one country you have studied been removed? [20] [Total: 30]
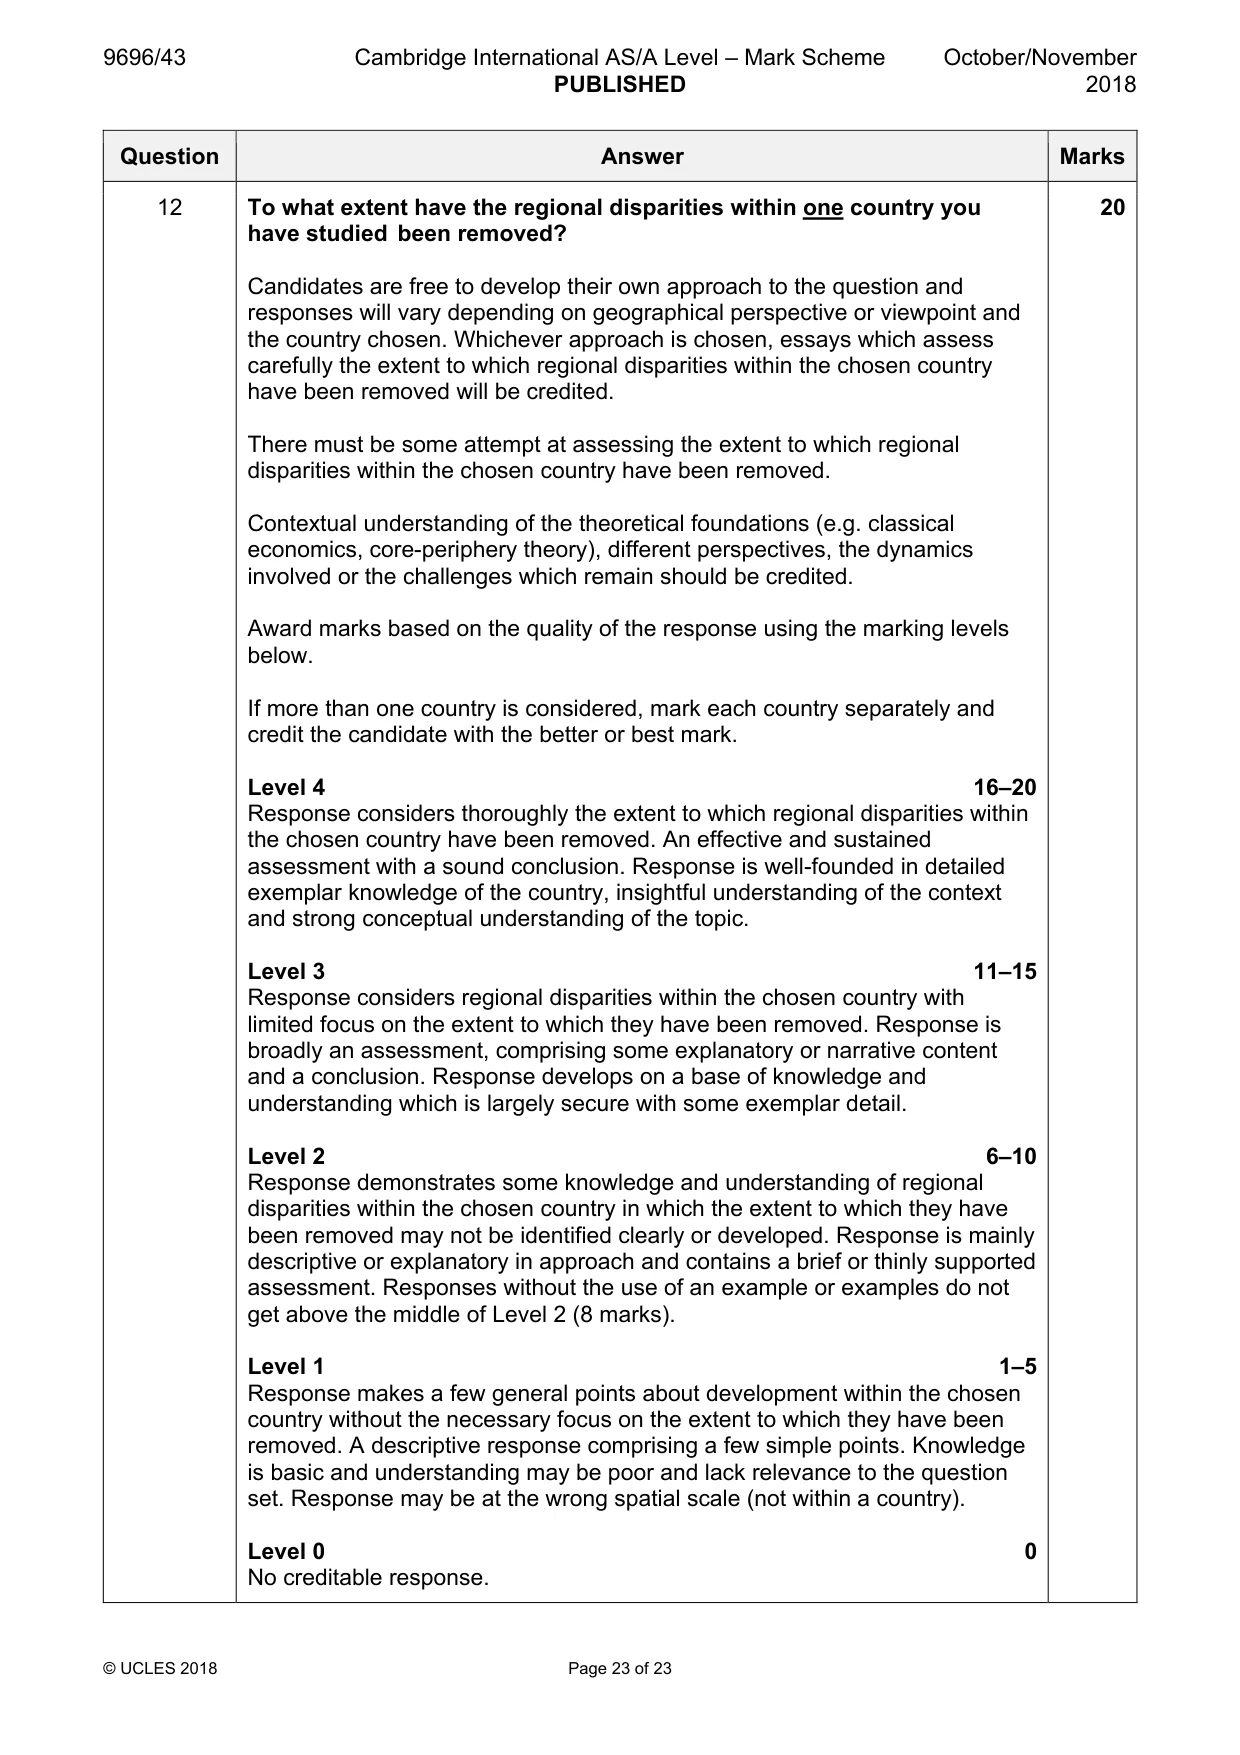
Mark scheme: 12 To what extent have the regional disparities within one country you 20 have studied been removed? Candidates are free to develop their own approach to the question and responses will vary depending on geographical perspective or viewpoint and the country chosen. Whichever approach is chosen, essays which assess carefully the extent to which regional disparities within the chosen country have been removed will be credited. There must be some attempt at assessing the extent to which regional disparities within the chosen country have been removed. Contextual understanding of the theoretical foundations (e.g. classical economics, core-periphery theory), different perspectives, the dynamics involved or the challenges which remain should be credited. Award marks based on the quality of the response using the marking levels below. If more than one country is considered, mark each country separately and credit the candidate with the better or best mark. Level 4 16–20 Response considers thoroughly the extent to which regional disparities within the chosen country have been removed. An effective and sustained assessment with a sound conclusion. Response is well-founded in detailed exemplar knowledge of the country, insightful understanding of the context and strong conceptual understanding of the topic. Level 3 11–15 Response considers regional disparities within the chosen country with limited focus on the extent to which they have been removed. Response is broadly an assessment, comprising some explanatory or narrative content and a conclusion. Response develops on a base of knowledge and understanding which is largely secure with some exemplar detail. Level 2 6–10 Response demonstrates some knowledge and understanding of regional disparities within the chosen country in which the extent to which they have been removed may not be identified clearly or developed. Response is mainly descriptive or explanatory in approach and contains a brief or thinly supported assessment. Responses without the use of an example or examples do not get above the middle of Level 2 (8 marks). Level 1 1–5 Response makes a few general points about development within the chosen country without the necessary focus on the extent to which they have been removed. A descriptive response comprising a few simple points. Knowledge is basic and understanding may be poor and lack relevance to the question set. Response may be at the wrong spatial scale (not within a country). Level 0 0 No creditable response.
What was in this paper
The subtopics covered by these 12 questions, and how many questions each got. Open one in a new tab to see every Cambridge question on it.
2The management of a tourist destination2National development1Sustainable energy supplies1The globalisation of economic activity1The human impact1The management of a degraded environment1The management of change in manufacturing industry1The management of regional development1Trade flows and trading patterns1What you needed in this session
Cambridge’s own grade thresholds for 2018 Oct/Nov, Paper 4 · Variant 3. A higher threshold means an easier paper — the bar moves with how the cohort did.