Cambridge A Level Geography 9696 — 2017 May/June Paper 3 · Variant 1
9696/31/M/J/17 · 50 marks · ≈56 min
The question paper and its mark scheme, free to read here and free to download. This is Cambridge’s own paper, exactly as it was sat.
Question paper4 pages

Mark scheme16 pages
Answers below. Sit the paper first if you are practising.





Paper as text
Question paper, page 1
* 7 3 0 4 8 6 6 5 0 0 * This document consists of 3 printed pages, 1 blank page and 2 Inserts. DC (NF) 134271/2 © UCLES 2017 [Turn over Cambridge International Examinations Cambridge International Advanced Subsidiary and Advanced Level GEOGRAPHY 9696/31 Paper 3 Advanced Human Options May/June 2017 1 hour 30 minutes No Additional Materials are required. READ THESE INSTRUCTIONS FIRST An answer booklet is provided inside this question paper. You should follow the instructions on the front cover of the answer booklet. If you need additional answer paper ask the invigilator for a continuation booklet. Answer two questions only. Each question answered must be from a different topic. Sketch maps and diagrams should be drawn whenever they serve to illustrate an answer. You should make reference to appropriate examples studied in the field or the classroom, even where such examples are not specifically requested by the question. The Table, Photograph and all the Figures referred to in the questions are contained in the Insert. The number of marks is given in brackets [ ] at the end of each question or part question.
Question paper, page 2
2 9696/31/M/J/17 © UCLES 2017 Production, location and change Only one question may be answered from this topic. 1 (a) Table 1 shows global changes in area of arable land and area of irrigated land in 1970 and 2012. (i) Describe the changes in area of arable land and area of irrigated land from 1970 to 2012 shown in Table 1. [3] (ii) Suggest reasons why the area of arable land needed to feed one person decreased from 1970 to 2012. [7] (b) For one country you have studied, assess the extent to which the need for agricultural change is caused by physical factors. [15] 2 (a) Describe and explain the role of capital in the location of manufacturing and related service industry. [10] (b) Assess the extent to which changes in the character and location of manufacturing industry and related services of one country are the result of its industrial policy. [15] Environmental management Only one question may be answered from this topic. 3 (a) Photograph A shows a maize field and a biofuel refinery in France, an MEDC in Europe. (i) Describe and explain the advantages of growing crops for biofuels. [5] (ii) Explain the disadvantages of one renewable source of energy. [5] (b) Using examples from one or more countries, assess the importance of different factors that influence the supply of energy. [15] 4 (a) With reference to examples, explain why the supply of water varies. [10] (b) ‘Economic factors are the main cause of environmental degradation.’ With reference to one or more examples, how far do you agree? [15]
Question paper, page 3
3 9696/31/M/J/17 © UCLES 2017 Global interdependence Only one question may be answered from this topic. 5 (a) Fig. 1 shows the pattern of trade for Japan, an MEDC in Asia, in 2012. (i) Describe the pattern of trade shown in Fig. 1. [5] (ii) Suggest reasons for the pattern of trade you described in (i). [5] (b) With reference to examples, explain why aid is more effective in some countries which receive it than in others. [15] 6 (a) With reference to examples, explain the environmental advantages and environmental disadvantages of tourism. [10] (b) With reference to one or more tourist destinations, assess the extent to which economic development has resulted from tourism. [15] Economic transition Only one question may be answered from this topic. 7 (a) Describe the nature and causes of global inequalities in social and economic wellbeing. [10] (b) Assess the importance of factors influencing the growth and spatial structure of one or more transnational corporations (TNCs). [15] 8 (a) Fig. 2 shows poverty in Vietnam, an NIC in Southeast Asia, in 2009. (i) Describe the pattern of poverty shown in Fig. 2. [5] (ii) Describe and explain the limitations of the information in Fig. 2 for studying development in Vietnam. [5] (b) ‘Regional disparities in development are best explained by the concept of core-periphery.’ With reference to one country, how far do you agree? [15]
Question paper, page 4
4 9696/31/M/J/17 © UCLES 2017 BLANK PAGE Permission to reproduce items where third-party owned material protected by copyright is included has been sought and cleared where possible. Every reasonable effort has been made by the publisher (UCLES) to trace copyright holders, but if any items requiring clearance have unwittingly been included, the publisher will be pleased to make amends at the earliest possible opportunity. To avoid the issue of disclosure of answer-related information to candidates, all copyright acknowledgements are reproduced online in the Cambridge International Examinations Copyright Acknowledgements Booklet. This is produced for each series of examinations and is freely available to download at www.cie.org.uk after the live examination series. Cambridge International Examinations is part of the Cambridge Assessment Group. Cambridge Assessment is the brand name of University of Cambridge Local Examinations Syndicate (UCLES), which is itself a department of the University of Cambridge.
Mark scheme, page 1
® IGCSE is a registered trademark. This document consists of 16 printed pages. © UCLES 2017 [Turn over Cambridge International Examinations Cambridge International Advanced Subsidiary and Advanced Level GEOGRAPHY 9696/31 Paper 3 Advanced Human Options May/June 2017 MARK SCHEME Maximum Mark: 50 Published This mark scheme is published as an aid to teachers and candidates, to indicate the requirements of the examination. It shows the basis on which Examiners were instructed to award marks. It does not indicate the details of the discussions that took place at an Examiners’ meeting before marking began, which would have considered the acceptability of alternative answers. Mark schemes should be read in conjunction with the question paper and the Principal Examiner Report for Teachers. Cambridge will not enter into discussions about these mark schemes. Cambridge is publishing the mark schemes for the May/June 2017 series for most Cambridge IGCSE®, Cambridge International A and AS Level and Cambridge Pre-U components, and some Cambridge O Level components.
Mark scheme, page 2
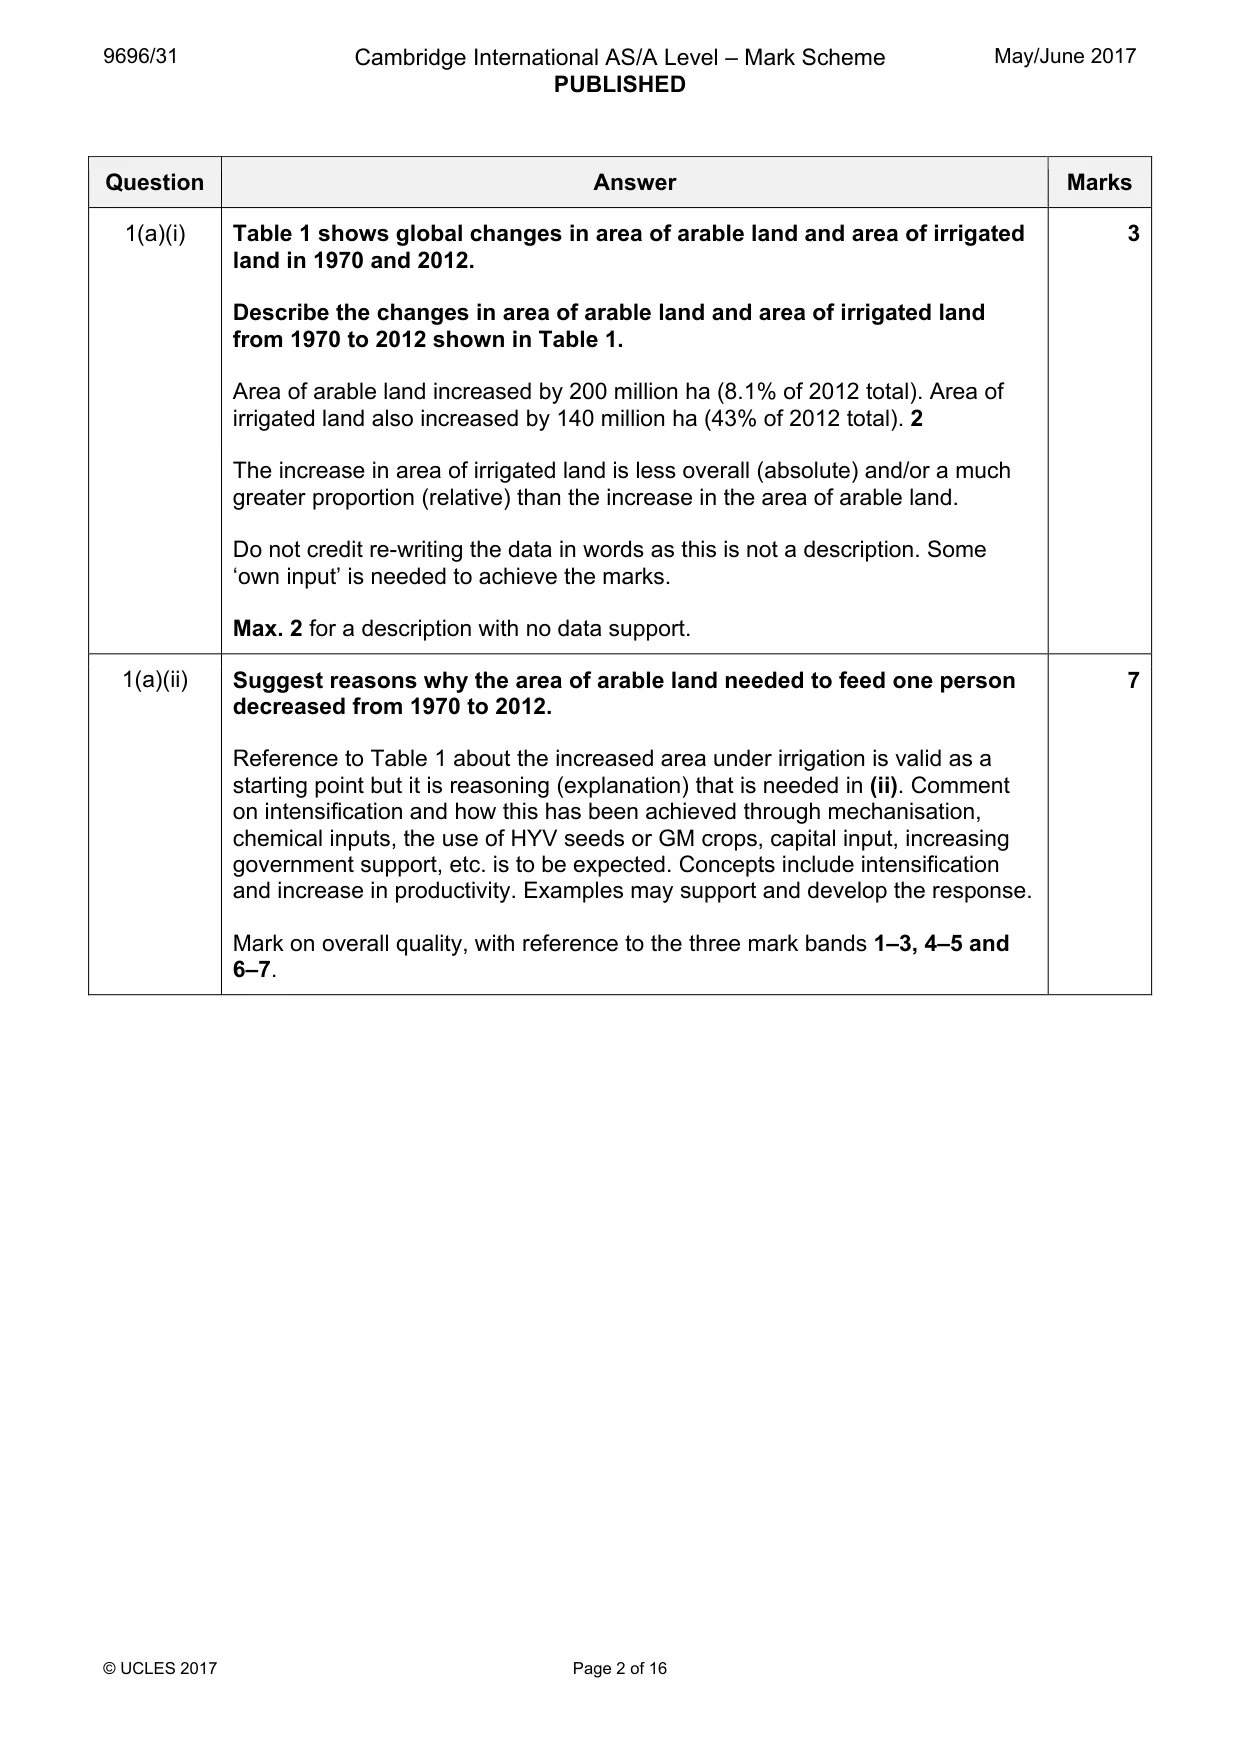
9696/31 Cambridge International AS/A Level – Mark Scheme PUBLISHED May/June 2017 © UCLES 2017 Page 2 of 16 Question Answer Marks 1(a)(i) Table 1 shows global changes in area of arable land and area of irrigated land in 1970 and 2012. Describe the changes in area of arable land and area of irrigated land from 1970 to 2012 shown in Table 1. Area of arable land increased by 200 million ha (8.1% of 2012 total). Area of irrigated land also increased by 140 million ha (43% of 2012 total). 2 The increase in area of irrigated land is less overall (absolute) and/or a much greater proportion (relative) than the increase in the area of arable land. Do not credit re-writing the data in words as this is not a description. Some ‘own input’ is needed to achieve the marks. Max. 2 for a description with no data support. 3 1(a)(ii) Suggest reasons why the area of arable land needed to feed one person decreased from 1970 to 2012. Reference to Table 1 about the increased area under irrigation is valid as a starting point but it is reasoning (explanation) that is needed in (ii). Comment on intensification and how this has been achieved through mechanisation, chemical inputs, the use of HYV seeds or GM crops, capital input, increasing government support, etc. is to be expected. Concepts include intensification and increase in productivity. Examples may support and develop the response. Mark on overall quality, with reference to the three mark bands 1–3, 4–5 and 6–7. 7
Mark scheme, page 3
9696/31 Cambridge International AS/A Level – Mark Scheme PUBLISHED May/June 2017 © UCLES 2017 Page 3 of 16 Question Answer Marks 1(b) For one country you have studied, assess the extent to which the need for agricultural change is caused by physical factors. From paragraph 1.2 of the syllabus: a case study, where candidates should have knowledge about the need for, and some of the difficulties in the management of agricultural change in one country. The difficulty aspect can form part of the need for change and comment on this and the assessment of the extent to which the need is caused by physical factors could form the basis of a higher-level response. Any view is acceptable. If more than one country, mark each separately and credit the best. Candidates will probably: Level 3 12–15 Develop a detailed and well-exemplified assessment, perhaps using a case study in a flexible way. Show good knowledge of how the need for change is caused by physical and other factors. Argue clearly with supporting evidence and come to a clear view, consistent with the evidence presented. Level 2 7–11 Make a reasonable attempt to assess the importance of physical factors with one or more other factors in a limited way with some supported examples. Satisfactory as far as it goes but lacking detail or development. At the lower end, more of a description with a top and tail approach to assessment. Level 1 1–6 A simple response of basic quality which may be general and descriptive lacking assessment. Refers to a narrow range of physical factors or little understanding of how the factors contribute to the need for agricultural change. Offer notes or fragments. No response, or no creditable response, 0. 15
Mark scheme, page 4
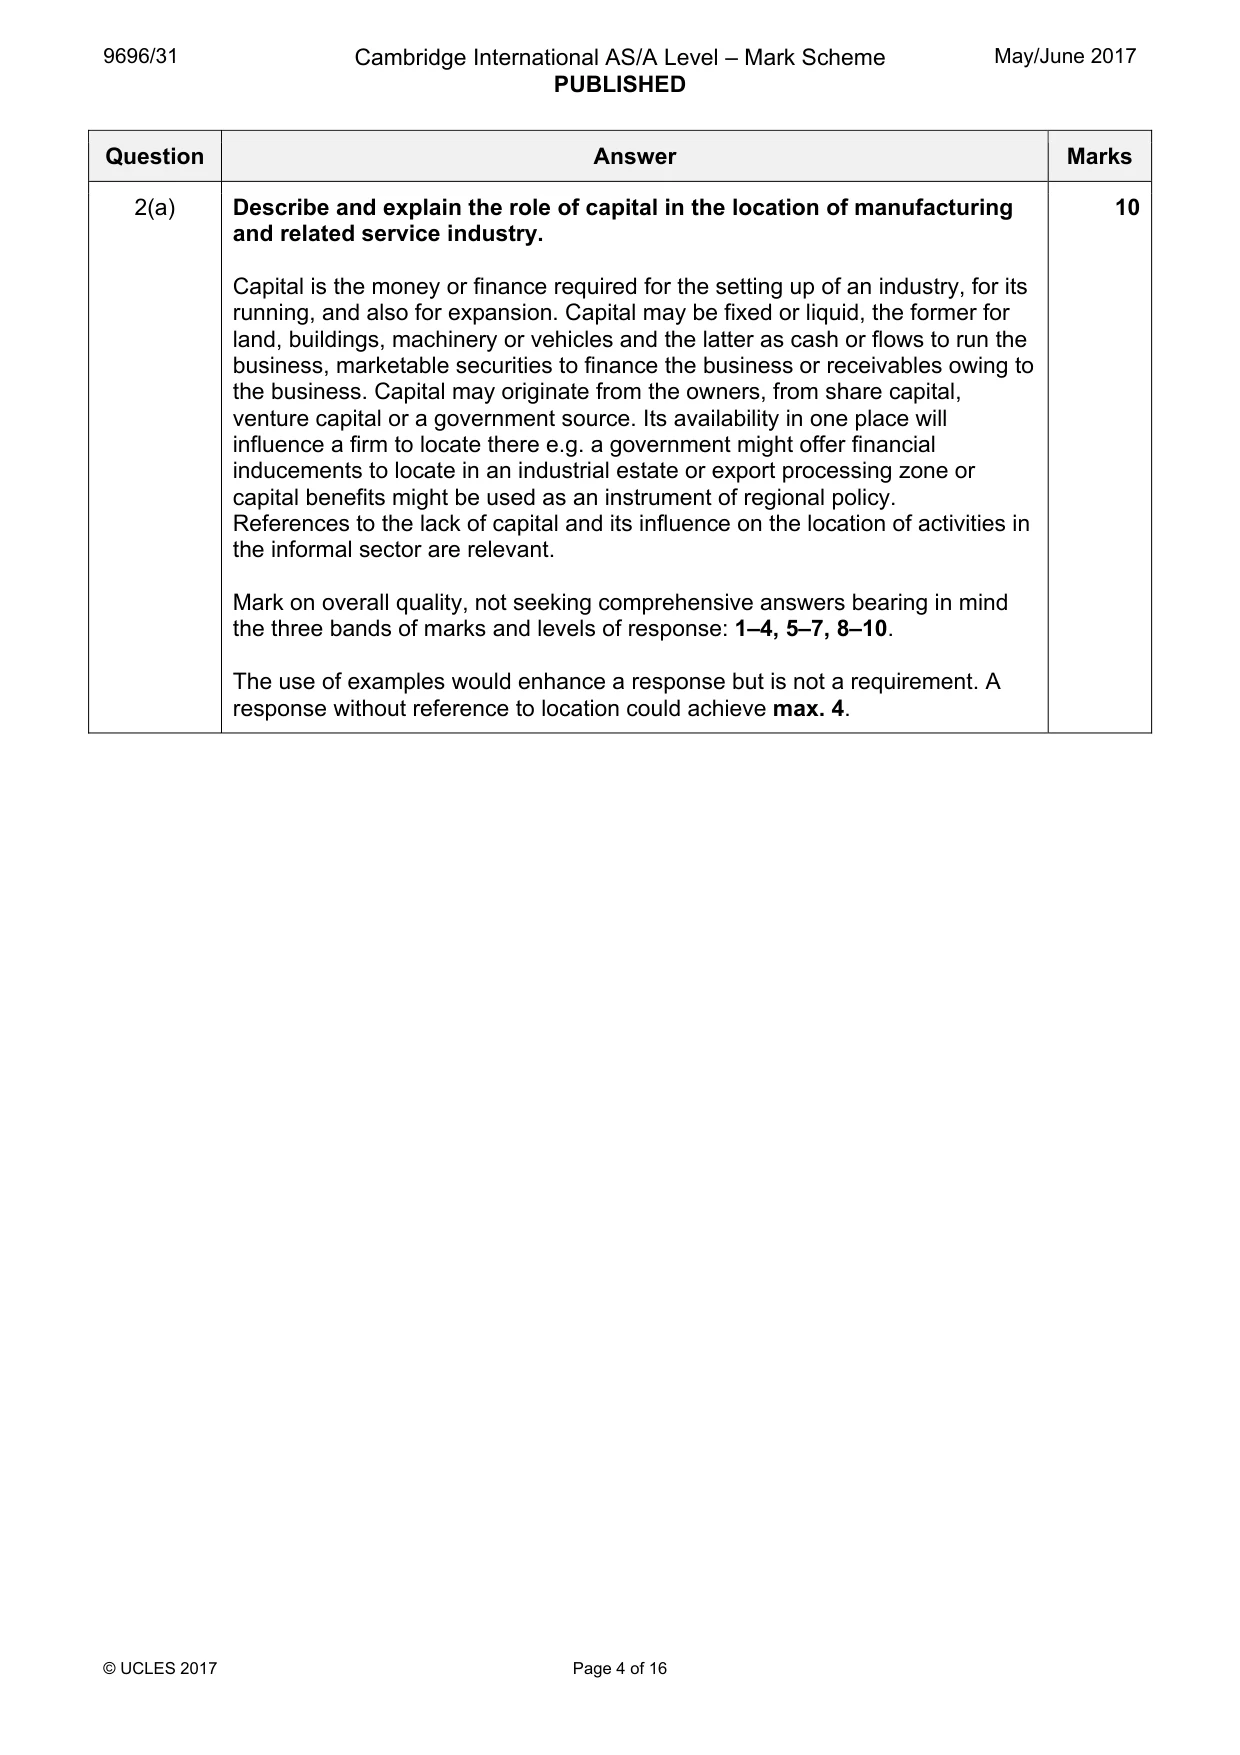
9696/31 Cambridge International AS/A Level – Mark Scheme PUBLISHED May/June 2017 © UCLES 2017 Page 4 of 16 Question Answer Marks 2(a) Describe and explain the role of capital in the location of manufacturing and related service industry. Capital is the money or finance required for the setting up of an industry, for its running, and also for expansion. Capital may be fixed or liquid, the former for land, buildings, machinery or vehicles and the latter as cash or flows to run the business, marketable securities to finance the business or receivables owing to the business. Capital may originate from the owners, from share capital, venture capital or a government source. Its availability in one place will influence a firm to locate there e.g. a government might offer financial inducements to locate in an industrial estate or export processing zone or capital benefits might be used as an instrument of regional policy. References to the lack of capital and its influence on the location of activities in the informal sector are relevant. Mark on overall quality, not seeking comprehensive answers bearing in mind the three bands of marks and levels of response: 1–4, 5–7, 8–10. The use of examples would enhance a response but is not a requirement. A response without reference to location could achieve max. 4. 10
Mark scheme, page 5
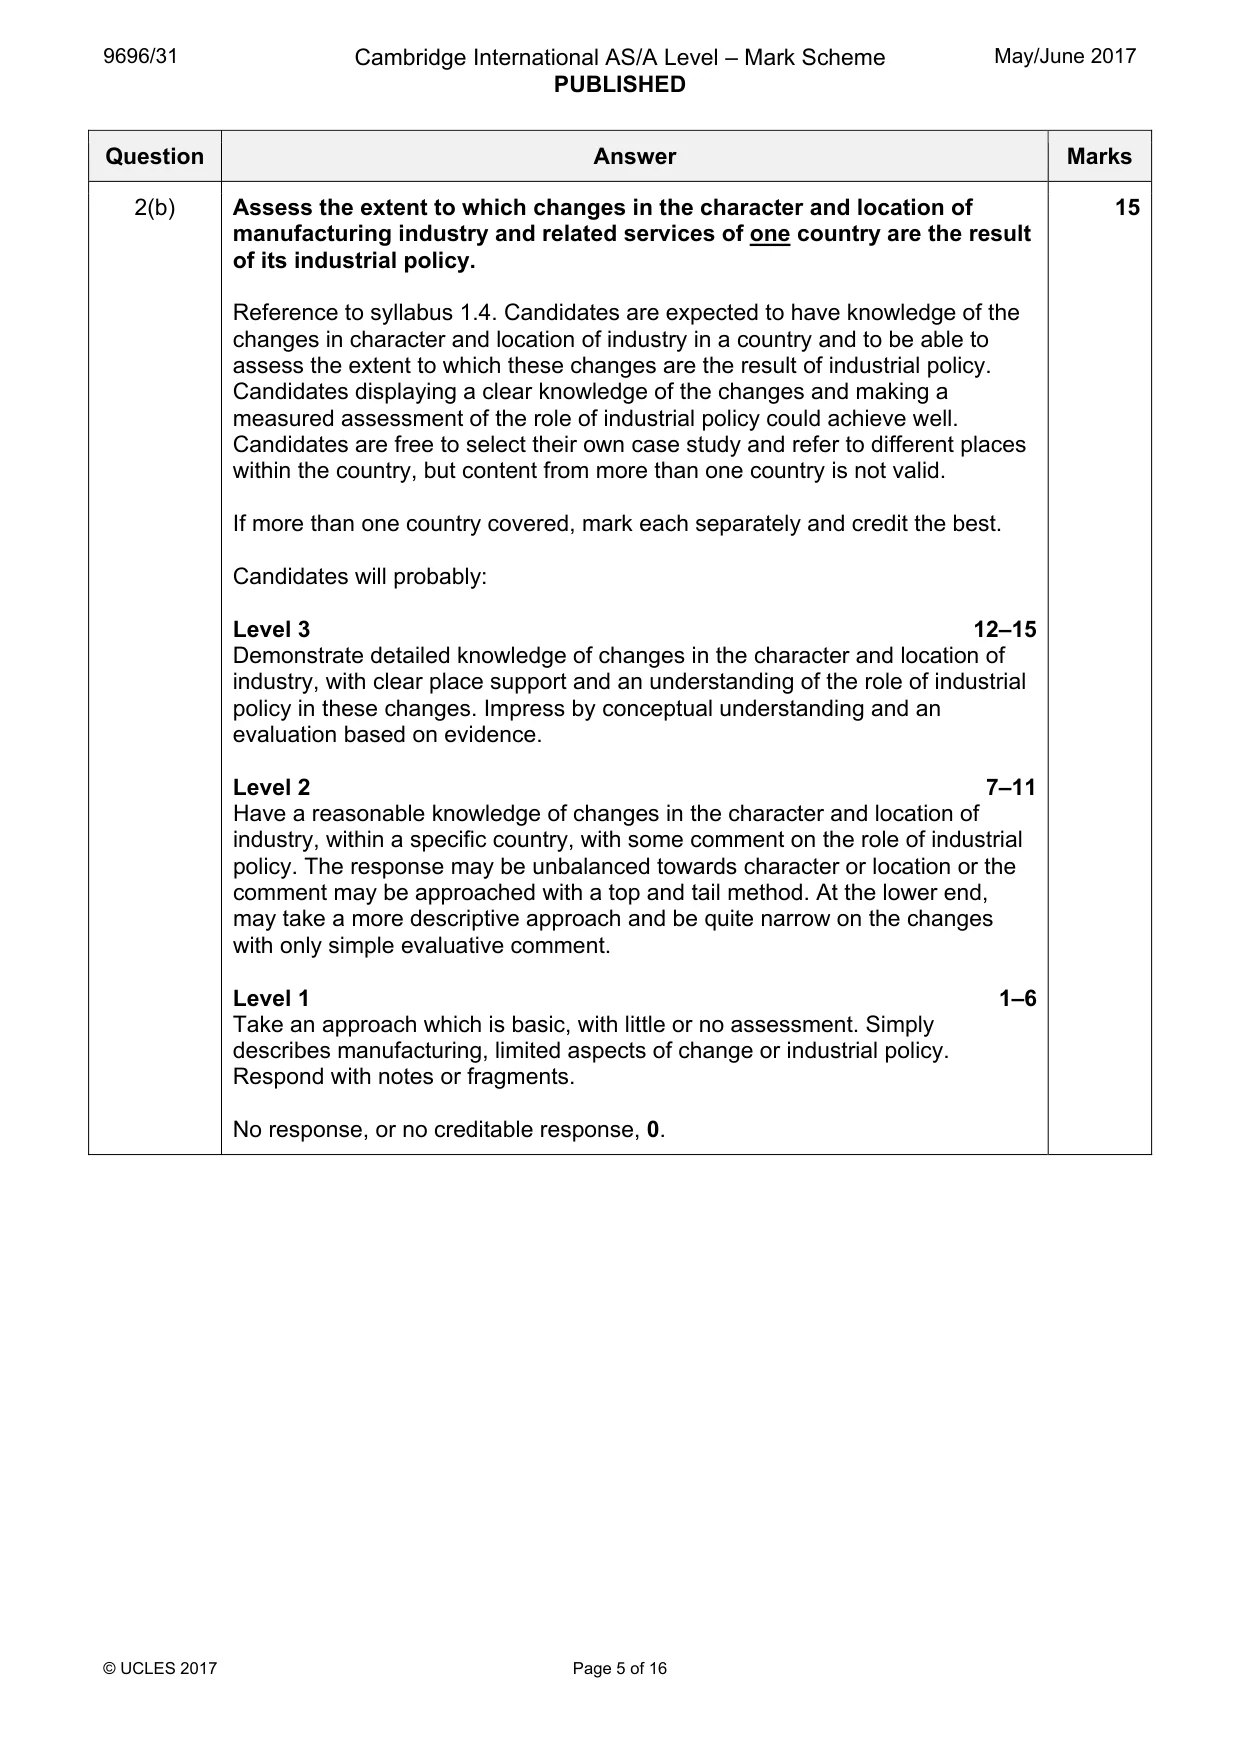
9696/31 Cambridge International AS/A Level – Mark Scheme PUBLISHED May/June 2017 © UCLES 2017 Page 5 of 16 Question Answer Marks 2(b) Assess the extent to which changes in the character and location of manufacturing industry and related services of one country are the result of its industrial policy. Reference to syllabus 1.4. Candidates are expected to have knowledge of the changes in character and location of industry in a country and to be able to assess the extent to which these changes are the result of industrial policy. Candidates displaying a clear knowledge of the changes and making a measured assessment of the role of industrial policy could achieve well. Candidates are free to select their own case study and refer to different places within the country, but content from more than one country is not valid. If more than one country covered, mark each separately and credit the best. Candidates will probably: Level 3 12–15 Demonstrate detailed knowledge of changes in the character and location of industry, with clear place support and an understanding of the role of industrial policy in these changes. Impress by conceptual understanding and an evaluation based on evidence. Level 2 7–11 Have a reasonable knowledge of changes in the character and location of industry, within a specific country, with some comment on the role of industrial policy. The response may be unbalanced towards character or location or the comment may be approached with a top and tail method. At the lower end, may take a more descriptive approach and be quite narrow on the changes with only simple evaluative comment. Level 1 1–6 Take an approach which is basic, with little or no assessment. Simply describes manufacturing, limited aspects of change or industrial policy. Respond with notes or fragments. No response, or no creditable response, 0. 15
Mark scheme, page 6
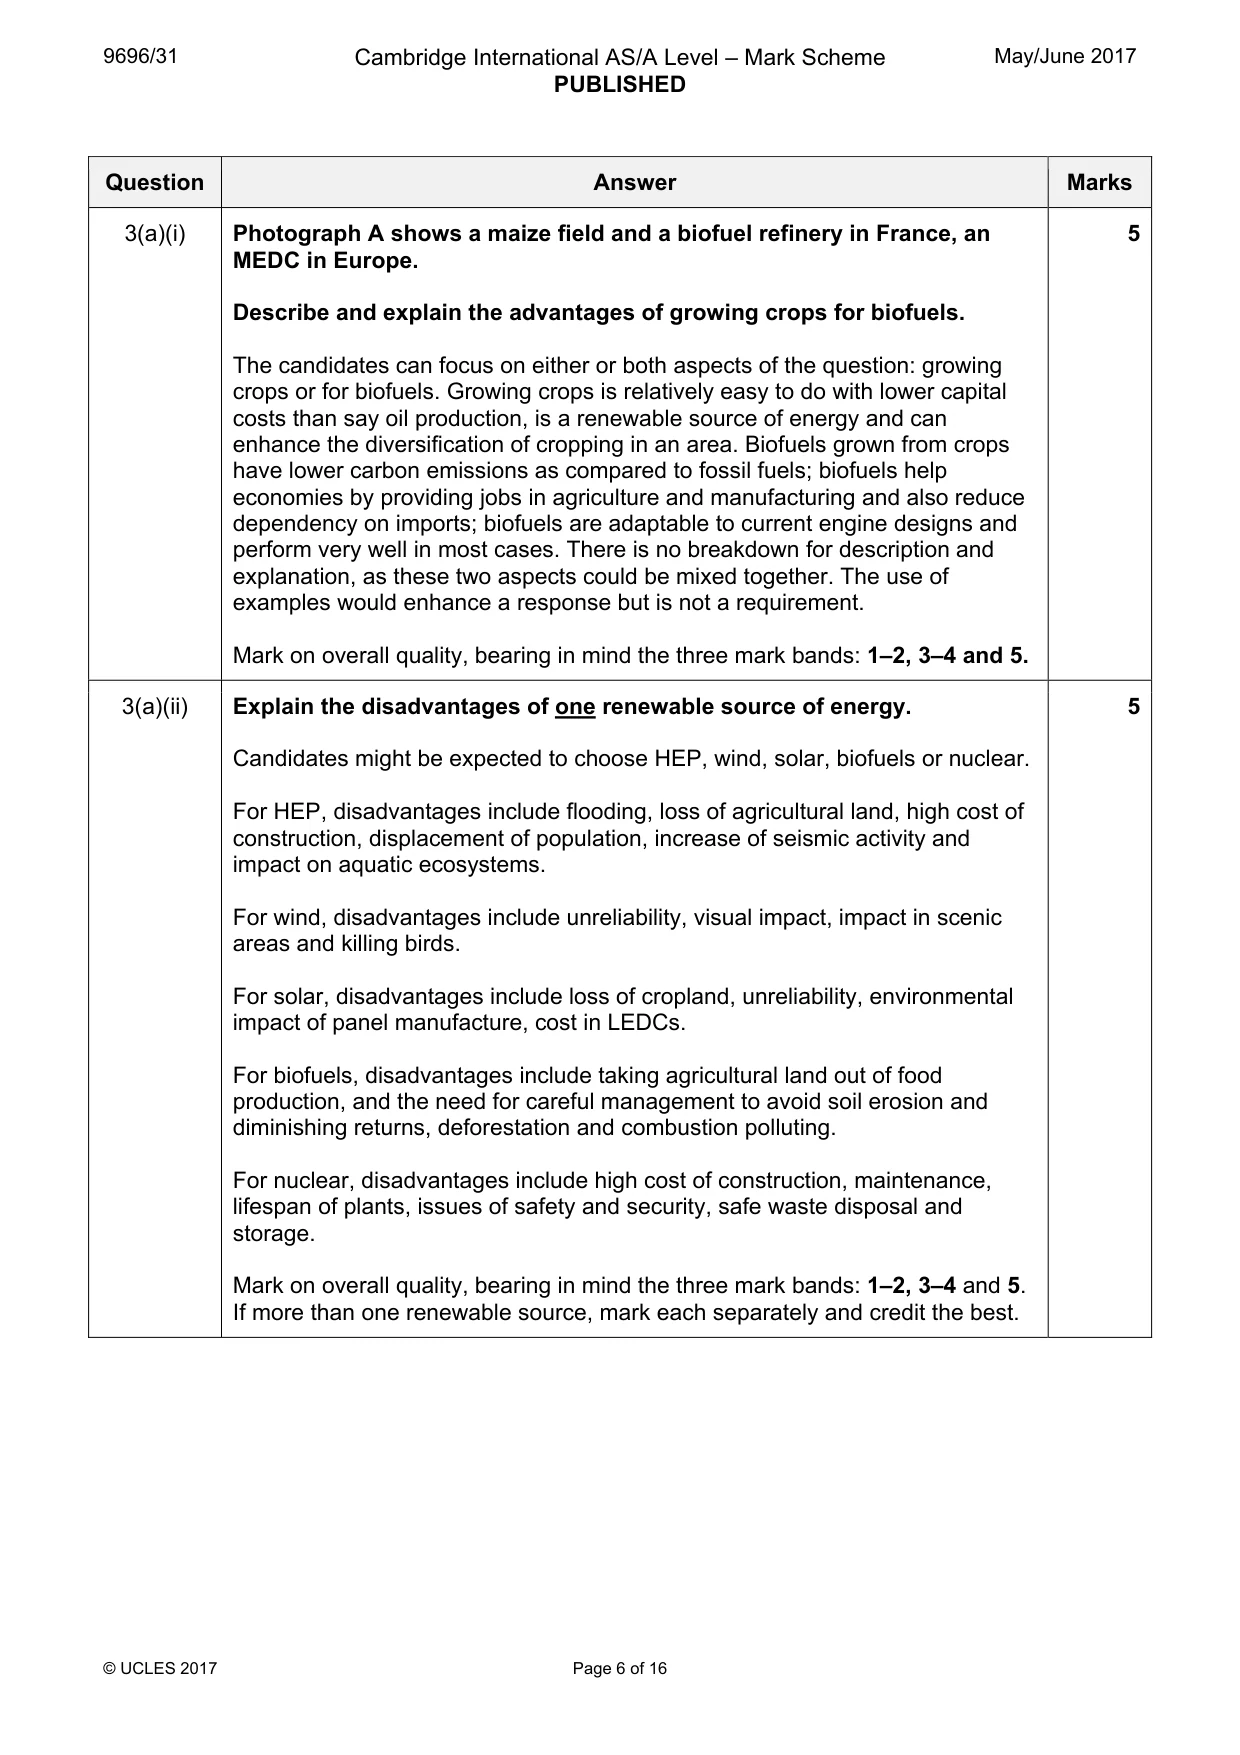
9696/31 Cambridge International AS/A Level – Mark Scheme PUBLISHED May/June 2017 © UCLES 2017 Page 6 of 16 Question Answer Marks 3(a)(i) Photograph A shows a maize field and a biofuel refinery in France, an MEDC in Europe. Describe and explain the advantages of growing crops for biofuels. The candidates can focus on either or both aspects of the question: growing crops or for biofuels. Growing crops is relatively easy to do with lower capital costs than say oil production, is a renewable source of energy and can enhance the diversification of cropping in an area. Biofuels grown from crops have lower carbon emissions as compared to fossil fuels; biofuels help economies by providing jobs in agriculture and manufacturing and also reduce dependency on imports; biofuels are adaptable to current engine designs and perform very well in most cases. There is no breakdown for description and explanation, as these two aspects could be mixed together. The use of examples would enhance a response but is not a requirement. Mark on overall quality, bearing in mind the three mark bands: 1–2, 3–4 and 5. 5 3(a)(ii) Explain the disadvantages of one renewable source of energy. Candidates might be expected to choose HEP, wind, solar, biofuels or nuclear. For HEP, disadvantages include flooding, loss of agricultural land, high cost of construction, displacement of population, increase of seismic activity and impact on aquatic ecosystems. For wind, disadvantages include unreliability, visual impact, impact in scenic areas and killing birds. For solar, disadvantages include loss of cropland, unreliability, environmental impact of panel manufacture, cost in LEDCs. For biofuels, disadvantages include taking agricultural land out of food production, and the need for careful management to avoid soil erosion and diminishing returns, deforestation and combustion polluting. For nuclear, disadvantages include high cost of construction, maintenance, lifespan of plants, issues of safety and security, safe waste disposal and storage. Mark on overall quality, bearing in mind the three mark bands: 1–2, 3–4 and 5. If more than one renewable source, mark each separately and credit the best. 5
Mark scheme, page 7
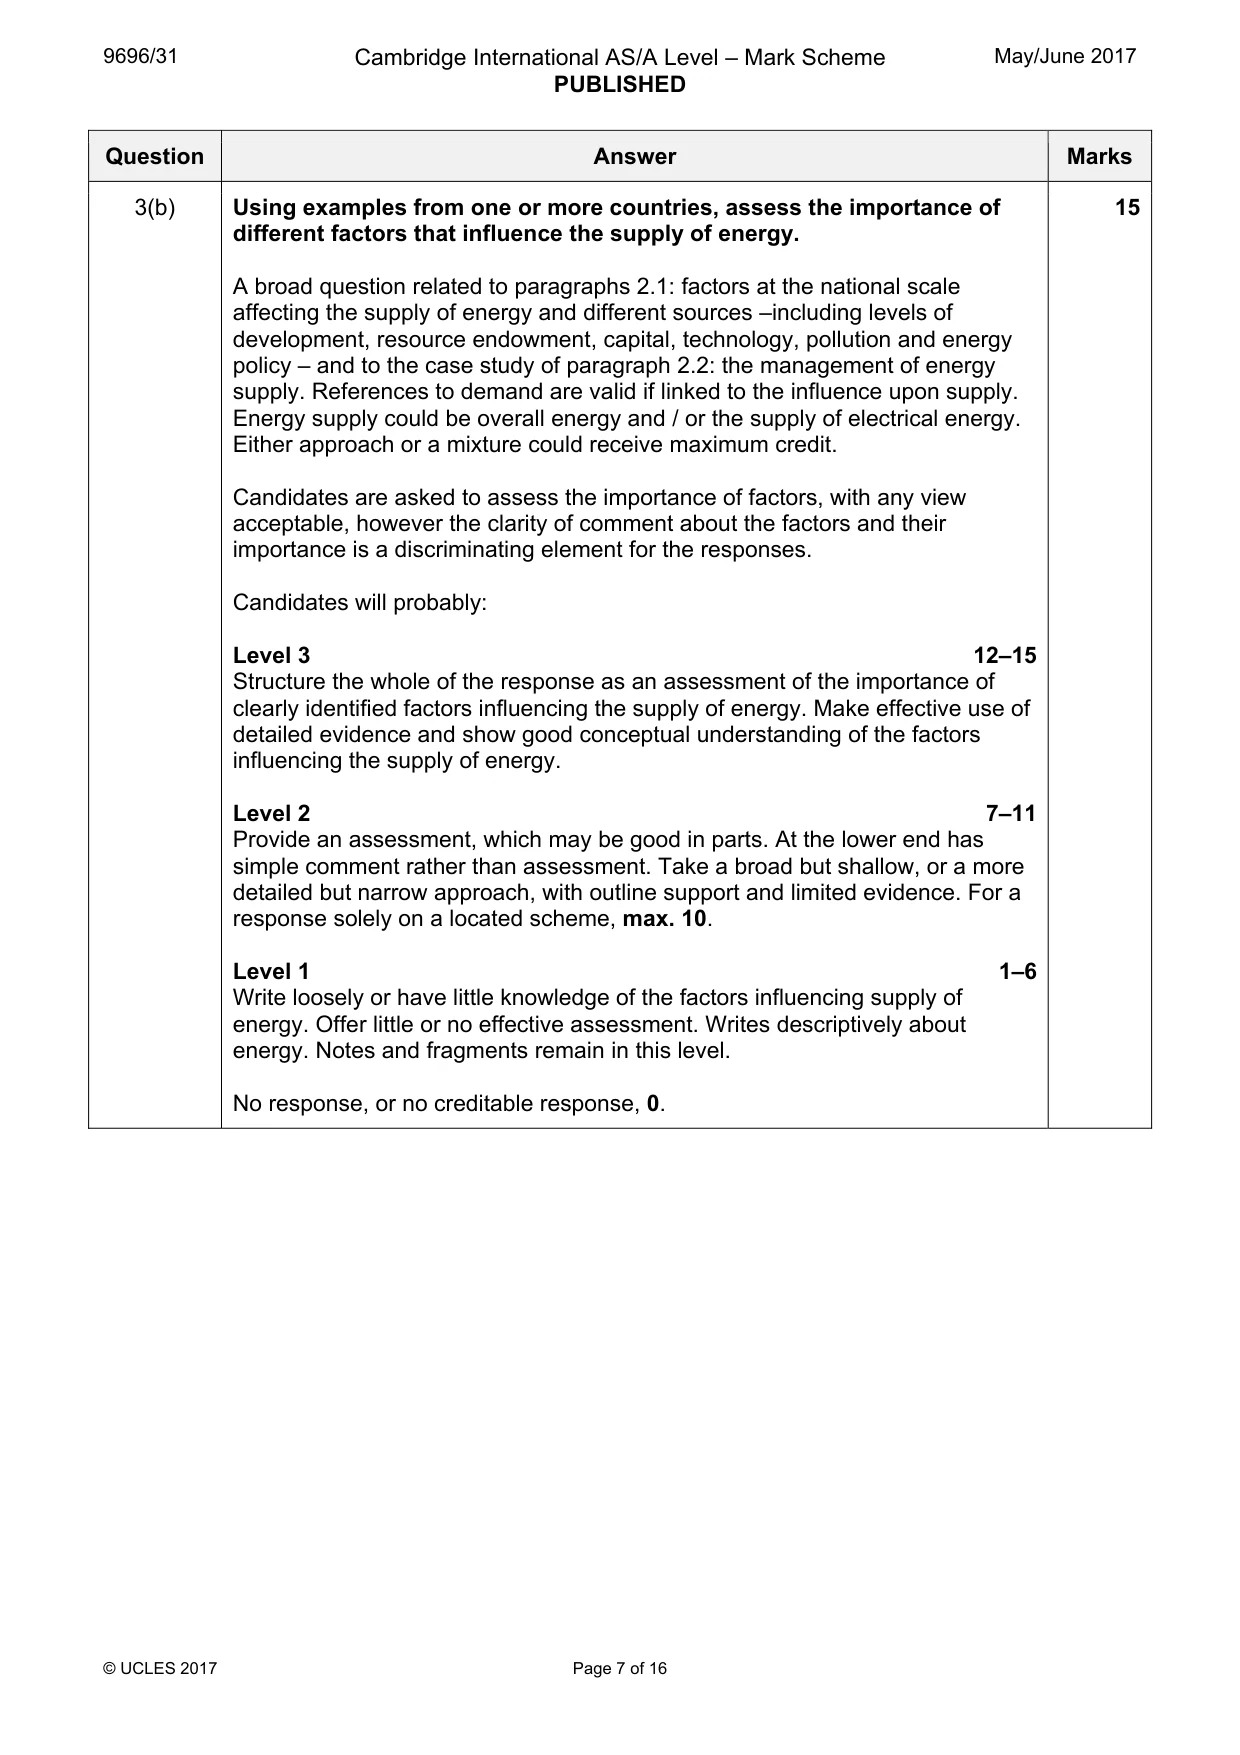
9696/31 Cambridge International AS/A Level – Mark Scheme PUBLISHED May/June 2017 © UCLES 2017 Page 7 of 16 Question Answer Marks 3(b) Using examples from one or more countries, assess the importance of different factors that influence the supply of energy. A broad question related to paragraphs 2.1: factors at the national scale affecting the supply of energy and different sources –including levels of development, resource endowment, capital, technology, pollution and energy policy – and to the case study of paragraph 2.2: the management of energy supply. References to demand are valid if linked to the influence upon supply. Energy supply could be overall energy and / or the supply of electrical energy. Either approach or a mixture could receive maximum credit. Candidates are asked to assess the importance of factors, with any view acceptable, however the clarity of comment about the factors and their importance is a discriminating element for the responses. Candidates will probably: Level 3 12–15 Structure the whole of the response as an assessment of the importance of clearly identified factors influencing the supply of energy. Make effective use of detailed evidence and show good conceptual understanding of the factors influencing the supply of energy. Level 2 7–11 Provide an assessment, which may be good in parts. At the lower end has simple comment rather than assessment. Take a broad but shallow, or a more detailed but narrow approach, with outline support and limited evidence. For a response solely on a located scheme, max. 10. Level 1 1–6 Write loosely or have little knowledge of the factors influencing supply of energy. Offer little or no effective assessment. Writes descriptively about energy. Notes and fragments remain in this level. No response, or no creditable response, 0. 15
Mark scheme, page 8
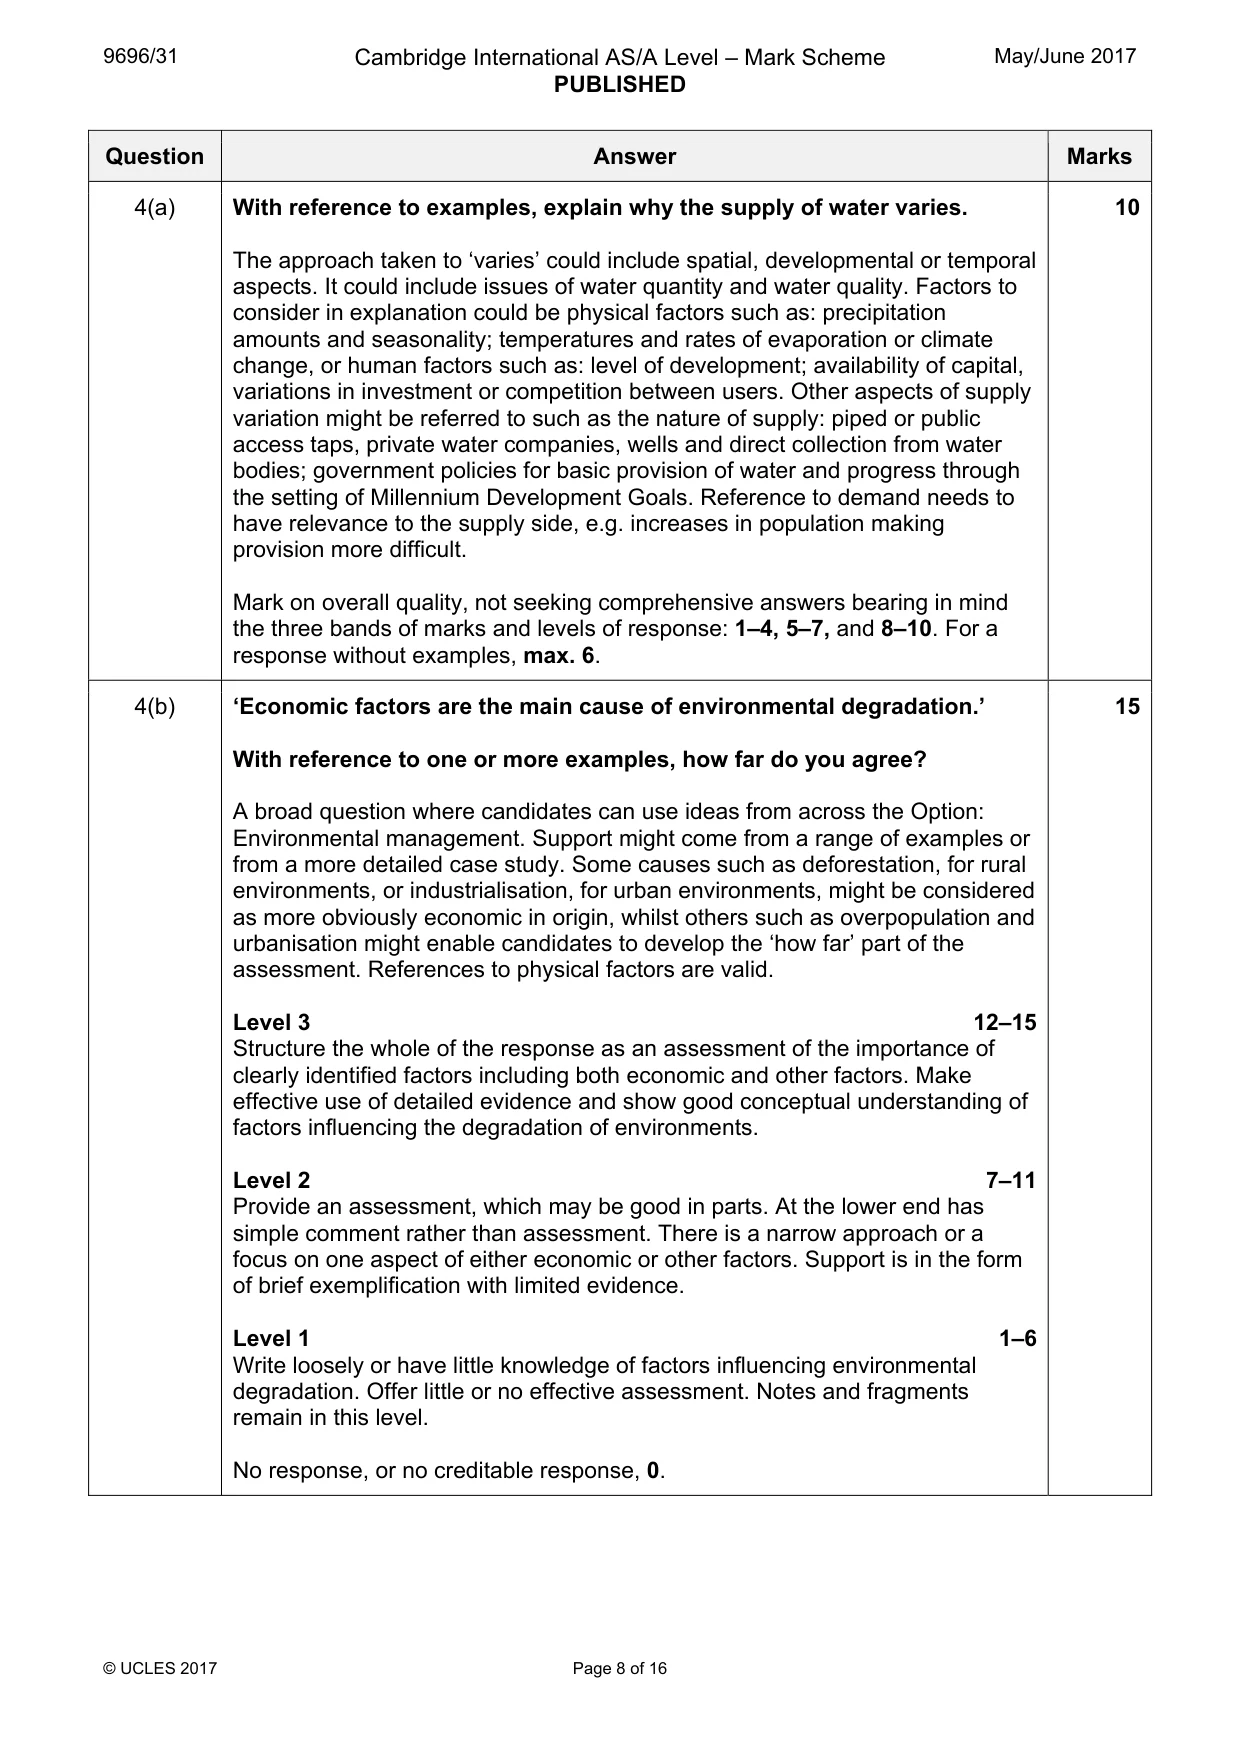
9696/31 Cambridge International AS/A Level – Mark Scheme PUBLISHED May/June 2017 © UCLES 2017 Page 8 of 16 Question Answer Marks 4(a) With reference to examples, explain why the supply of water varies. The approach taken to ‘varies’ could include spatial, developmental or temporal aspects. It could include issues of water quantity and water quality. Factors to consider in explanation could be physical factors such as: precipitation amounts and seasonality; temperatures and rates of evaporation or climate change, or human factors such as: level of development; availability of capital, variations in investment or competition between users. Other aspects of supply variation might be referred to such as the nature of supply: piped or public access taps, private water companies, wells and direct collection from water bodies; government policies for basic provision of water and progress through the setting of Millennium Development Goals. Reference to demand needs to have relevance to the supply side, e.g. increases in population making provision more difficult. Mark on overall quality, not seeking comprehensive answers bearing in mind the three bands of marks and levels of response: 1–4, 5–7, and 8–10. For a response without examples, max. 6. 10 4(b) ‘Economic factors are the main cause of environmental degradation.’ With reference to one or more examples, how far do you agree? A broad question where candidates can use ideas from across the Option: Environmental management. Support might come from a range of examples or from a more detailed case study. Some causes such as deforestation, for rural environments, or industrialisation, for urban environments, might be considered as more obviously economic in origin, whilst others such as overpopulation and urbanisation might enable candidates to develop the ‘how far’ part of the assessment. References to physical factors are valid. Level 3 12–15 Structure the whole of the response as an assessment of the importance of clearly identified factors including both economic and other factors. Make effective use of detailed evidence and show good conceptual understanding of factors influencing the degradation of environments. Level 2 7–11 Provide an assessment, which may be good in parts. At the lower end has simple comment rather than assessment. There is a narrow approach or a focus on one aspect of either economic or other factors. Support is in the form of brief exemplification with limited evidence. Level 1 1–6 Write loosely or have little knowledge of factors influencing environmental degradation. Offer little or no effective assessment. Notes and fragments remain in this level. No response, or no creditable response, 0. 15
Mark scheme, page 9
9696/31 Cambridge International AS/A Level – Mark Scheme PUBLISHED May/June 2017 © UCLES 2017 Page 9 of 16 Question Answer Marks 5(a)(i) Fig. 1 shows the pattern of trade for Japan, an MEDC in Asia, in 2012. Describe the pattern of trade shown in Fig. 1. Description should refer to the data presented. Pattern could be addressed via the direction of trade-imports / exports, the balance of trade-surplus / deficit and / or the countries and regions that are the trade partners. Not all global regions are presented, but comments on the rest of the world are valid. Mark on overall quality, not seeking comprehensive answers bearing in mind the three bands of marks and levels of response: 1–2, 3–4 and 5. 5 5(a)(ii) Suggest reasons for the pattern of trade you described in (i). Reasons do not require specific knowledge about Japan or the other countries and regions illustrated but is creditable. Reasons are likely to be in the form of broad suggestions related to factors such as: resource endowment, locational advantage, historical factors such as colonial ties, trade agreements and changes in global markets. Mark on overall quality, not seeking comprehensive answers bearing in mind the three bands of marks and levels of response: 1–2, 3–4 and 5. 5
Mark scheme, page 10
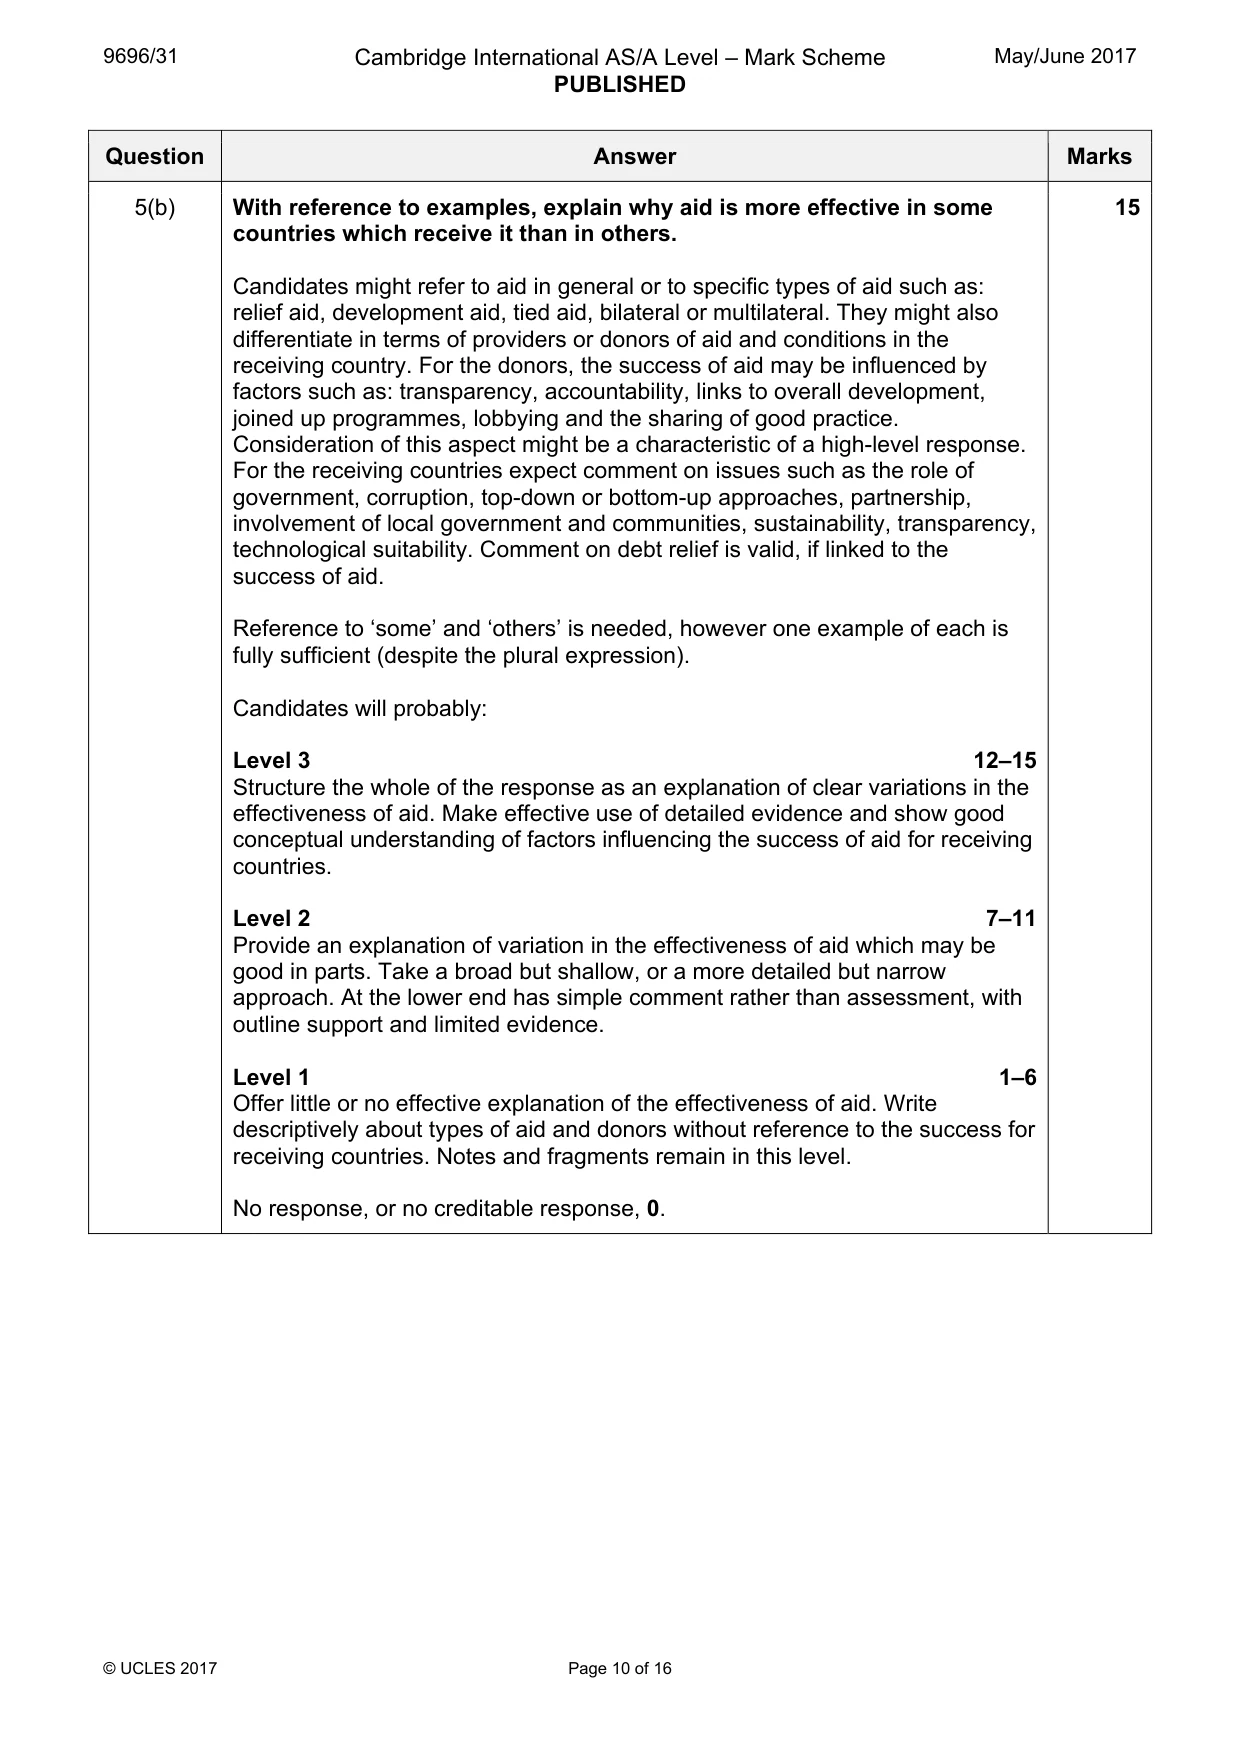
9696/31 Cambridge International AS/A Level – Mark Scheme PUBLISHED May/June 2017 © UCLES 2017 Page 10 of 16 Question Answer Marks 5(b) With reference to examples, explain why aid is more effective in some countries which receive it than in others. Candidates might refer to aid in general or to specific types of aid such as: relief aid, development aid, tied aid, bilateral or multilateral. They might also differentiate in terms of providers or donors of aid and conditions in the receiving country. For the donors, the success of aid may be influenced by factors such as: transparency, accountability, links to overall development, joined up programmes, lobbying and the sharing of good practice. Consideration of this aspect might be a characteristic of a high-level response. For the receiving countries expect comment on issues such as the role of government, corruption, top-down or bottom-up approaches, partnership, involvement of local government and communities, sustainability, transparency, technological suitability. Comment on debt relief is valid, if linked to the success of aid. Reference to ‘some’ and ‘others’ is needed, however one example of each is fully sufficient (despite the plural expression). Candidates will probably: Level 3 12–15 Structure the whole of the response as an explanation of clear variations in the effectiveness of aid. Make effective use of detailed evidence and show good conceptual understanding of factors influencing the success of aid for receiving countries. Level 2 7–11 Provide an explanation of variation in the effectiveness of aid which may be good in parts. Take a broad but shallow, or a more detailed but narrow approach. At the lower end has simple comment rather than assessment, with outline support and limited evidence. Level 1 1–6 Offer little or no effective explanation of the effectiveness of aid. Write descriptively about types of aid and donors without reference to the success for receiving countries. Notes and fragments remain in this level. No response, or no creditable response, 0. 15
Mark scheme, page 11
9696/31 Cambridge International AS/A Level – Mark Scheme PUBLISHED May/June 2017 © UCLES 2017 Page 11 of 16 Question Answer Marks 6(a) With reference to examples, explain the environmental advantages and environmental disadvantages of tourism. Environmental advantages might include ideas such as: revenue raised / use of ‘green taxes’ from tourism contributes to protection and management of the environment; a raised awareness of the importance of the environment both locally and for the industry itself; landscaping / planting improves the aesthetics of an area, etc. Environmental disadvantages might include pollution, erosion of footpaths, destruction of wildlife habitats, disturbance to animal behaviour, beach degradation, damage to coral reefs, etc. A quality response might clearly explain the link between a specific aspect of tourism and the environment backed up with support details, with a strong sense of place. There is no breakdown for advantages or disadvantages but for a response with only one of these, max. 6. For a response without examples, max. 6. Mark on overall quality, not seeking comprehensive answers bearing in mind the three bands of marks and levels of response: 1–4, 5–7 and 8–10. 10
Mark scheme, page 12
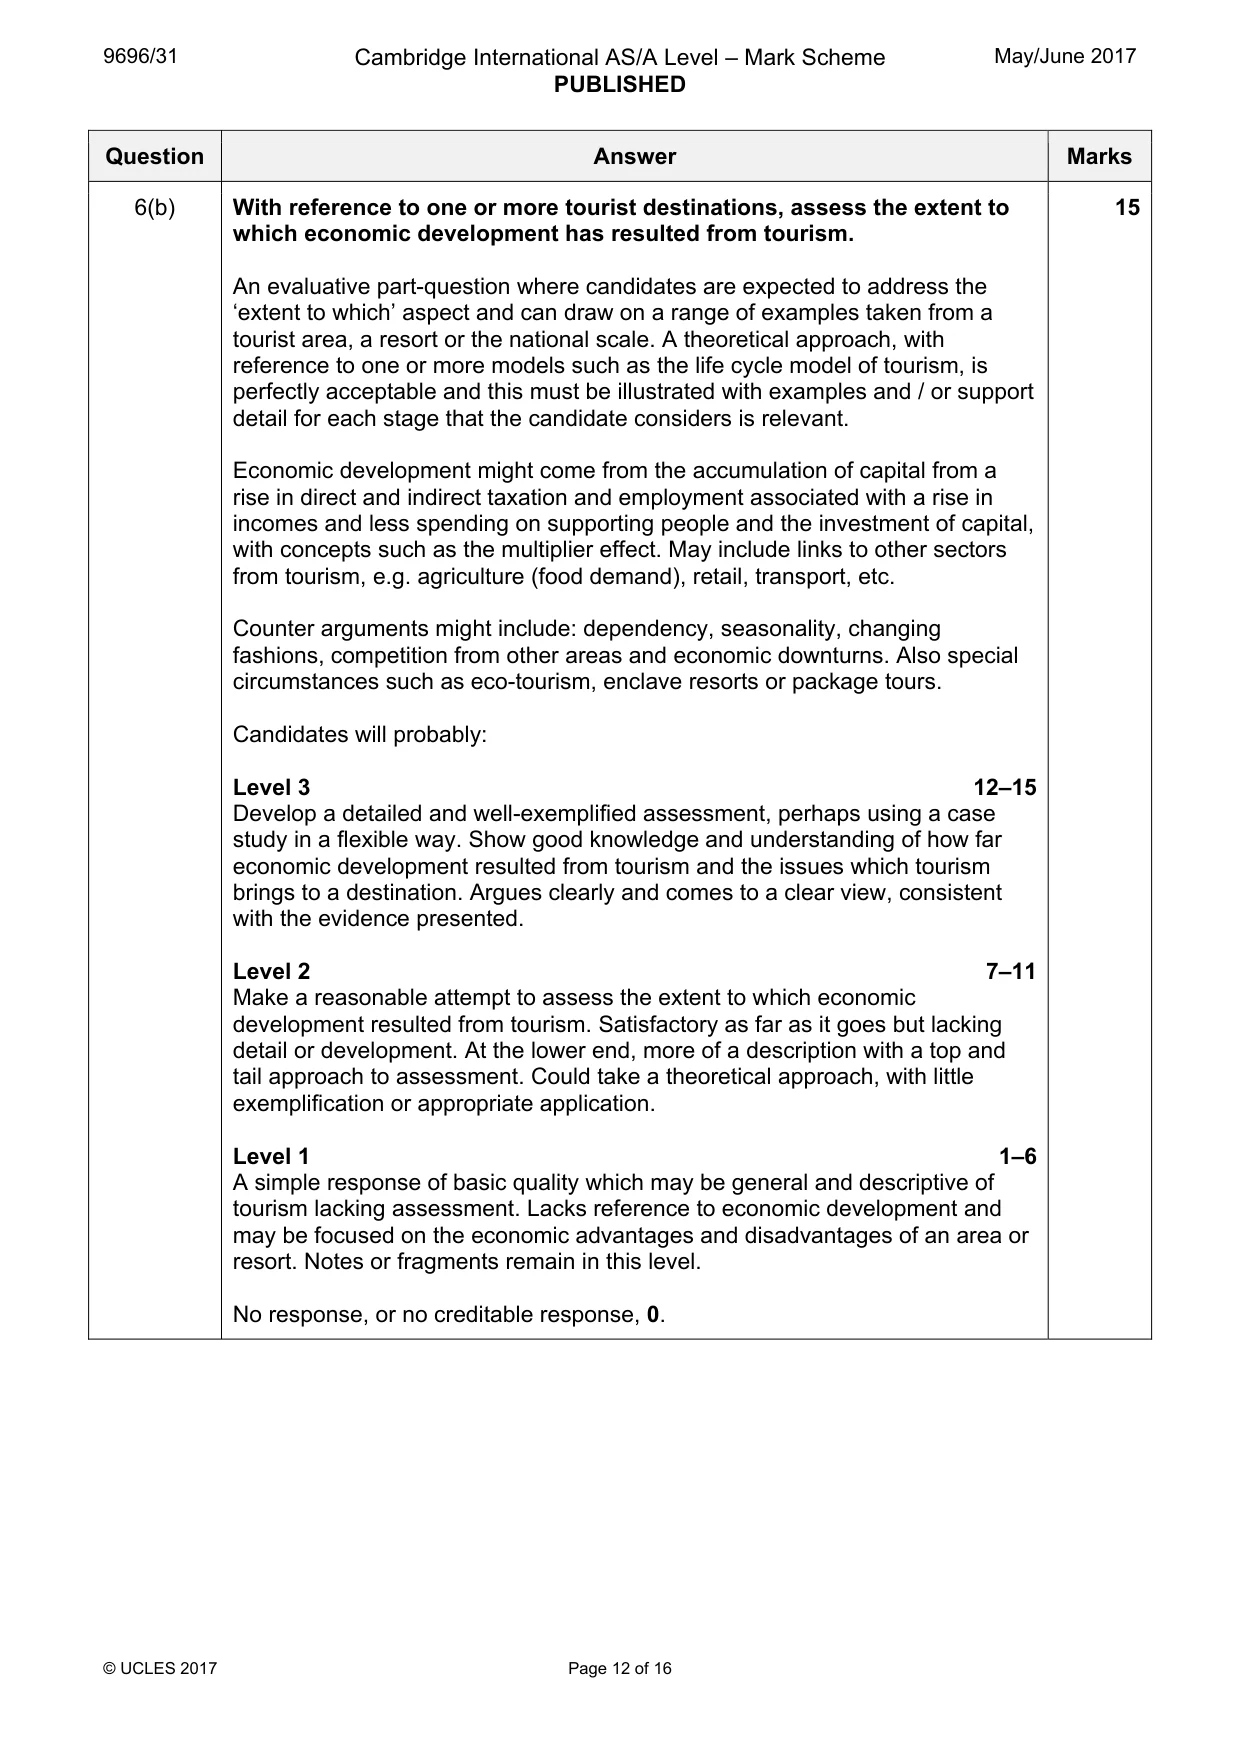
9696/31 Cambridge International AS/A Level – Mark Scheme PUBLISHED May/June 2017 © UCLES 2017 Page 12 of 16 Question Answer Marks 6(b) With reference to one or more tourist destinations, assess the extent to which economic development has resulted from tourism. An evaluative part-question where candidates are expected to address the ‘extent to which’ aspect and can draw on a range of examples taken from a tourist area, a resort or the national scale. A theoretical approach, with reference to one or more models such as the life cycle model of tourism, is perfectly acceptable and this must be illustrated with examples and / or support detail for each stage that the candidate considers is relevant. Economic development might come from the accumulation of capital from a rise in direct and indirect taxation and employment associated with a rise in incomes and less spending on supporting people and the investment of capital, with concepts such as the multiplier effect. May include links to other sectors from tourism, e.g. agriculture (food demand), retail, transport, etc. Counter arguments might include: dependency, seasonality, changing fashions, competition from other areas and economic downturns. Also special circumstances such as eco-tourism, enclave resorts or package tours. Candidates will probably: Level 3 12–15 Develop a detailed and well-exemplified assessment, perhaps using a case study in a flexible way. Show good knowledge and understanding of how far economic development resulted from tourism and the issues which tourism brings to a destination. Argues clearly and comes to a clear view, consistent with the evidence presented. Level 2 7–11 Make a reasonable attempt to assess the extent to which economic development resulted from tourism. Satisfactory as far as it goes but lacking detail or development. At the lower end, more of a description with a top and tail approach to assessment. Could take a theoretical approach, with little exemplification or appropriate application. Level 1 1–6 A simple response of basic quality which may be general and descriptive of tourism lacking assessment. Lacks reference to economic development and may be focused on the economic advantages and disadvantages of an area or resort. Notes or fragments remain in this level. No response, or no creditable response, 0. 15
Mark scheme, page 13
9696/31 Cambridge International AS/A Level – Mark Scheme PUBLISHED May/June 2017 © UCLES 2017 Page 13 of 16 Question Answer Marks 7(a) Describe the nature and causes of global inequalities in social and economic wellbeing. The nature should be briefly described and categorised, or may be embedded in the response, whilst the causes could be physical and / or human in origin and the overview should have a clear global element. This might come in terms of broad groupings such as: MEDCs / NICs / LEDCs or North / South or even the use of more specific regions, such as by continent. A sketch map would be a valid way of describing the distribution. A top band response should address all three aspects of the question. For a part (a) question, there is no need to take an approach with balance between social and economic wellbeing, indeed both could be considered as being related to each other and treated as one. Mark on overall quality, not seeking comprehensive answers bearing in mind the three bands of marks and levels of response: 1–4, 5–7, 8–10. 10
Mark scheme, page 14
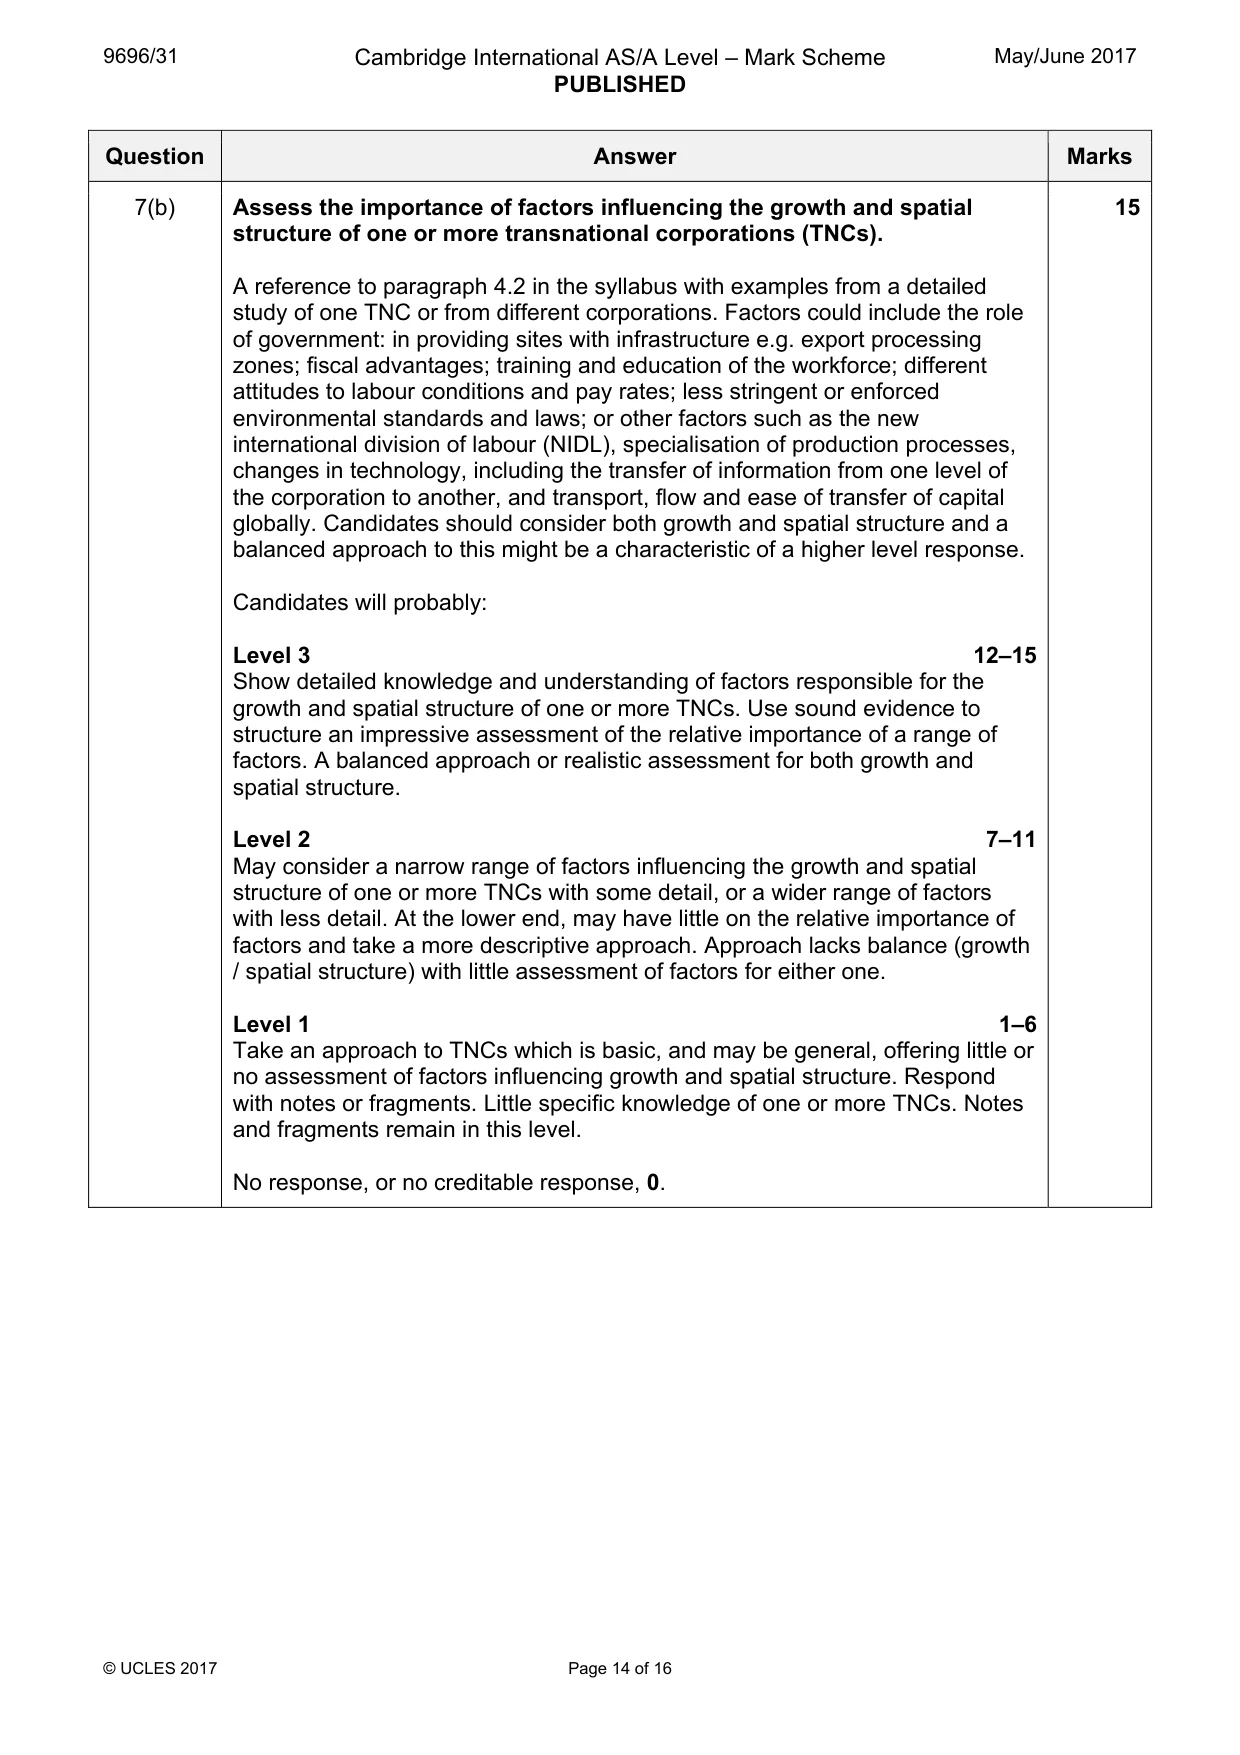
9696/31 Cambridge International AS/A Level – Mark Scheme PUBLISHED May/June 2017 © UCLES 2017 Page 14 of 16 Question Answer Marks 7(b) Assess the importance of factors influencing the growth and spatial structure of one or more transnational corporations (TNCs). A reference to paragraph 4.2 in the syllabus with examples from a detailed study of one TNC or from different corporations. Factors could include the role of government: in providing sites with infrastructure e.g. export processing zones; fiscal advantages; training and education of the workforce; different attitudes to labour conditions and pay rates; less stringent or enforced environmental standards and laws; or other factors such as the new international division of labour (NIDL), specialisation of production processes, changes in technology, including the transfer of information from one level of the corporation to another, and transport, flow and ease of transfer of capital globally. Candidates should consider both growth and spatial structure and a balanced approach to this might be a characteristic of a higher level response. Candidates will probably: Level 3 12–15 Show detailed knowledge and understanding of factors responsible for the growth and spatial structure of one or more TNCs. Use sound evidence to structure an impressive assessment of the relative importance of a range of factors. A balanced approach or realistic assessment for both growth and spatial structure. Level 2 7–11 May consider a narrow range of factors influencing the growth and spatial structure of one or more TNCs with some detail, or a wider range of factors with less detail. At the lower end, may have little on the relative importance of factors and take a more descriptive approach. Approach lacks balance (growth / spatial structure) with little assessment of factors for either one. Level 1 1–6 Take an approach to TNCs which is basic, and may be general, offering little or no assessment of factors influencing growth and spatial structure. Respond with notes or fragments. Little specific knowledge of one or more TNCs. Notes and fragments remain in this level. No response, or no creditable response, 0. 15
Mark scheme, page 15
9696/31 Cambridge International AS/A Level – Mark Scheme PUBLISHED May/June 2017 © UCLES 2017 Page 15 of 16 Question Answer Marks 8(a)(i) Fig. 2 shows poverty in Vietnam, an NIC in Southeast Asia, in 2009. Describe the pattern of poverty shown in Fig. 2. If 50% is taken as a boundary between high and low poverty then there are higher poverty levels in four areas: the North and more specifically the North West being the largest and 3 in the centre and south of centre such as the central Highlands, whilst the lowest levels are found in the North East, around the area named as the Red River Delta, and in the south comprising most of the South East area and Mekong River Delta. It is valid to say that there are more areas of lower than high poverty. Look for statements which are clearly pattern-based to award credit. Mark on overall quality, bearing in mind the three mark bands: 1–2, 3–4 and 5. 5 8(a)(ii) Describe and explain the limitations of the information in Fig. 2 for studying development in Vietnam. Limitations might refer to aspects such as: the date of the map; variations within districts are hidden; how poverty was measured, poverty is only one aspect of development; the data are for a fixed point in time and not dynamic. References to the map may be used to support a response. Mark on overall quality, bearing in mind the three mark bands: 1–2, 3–4 and 5. 5
Mark scheme, page 16
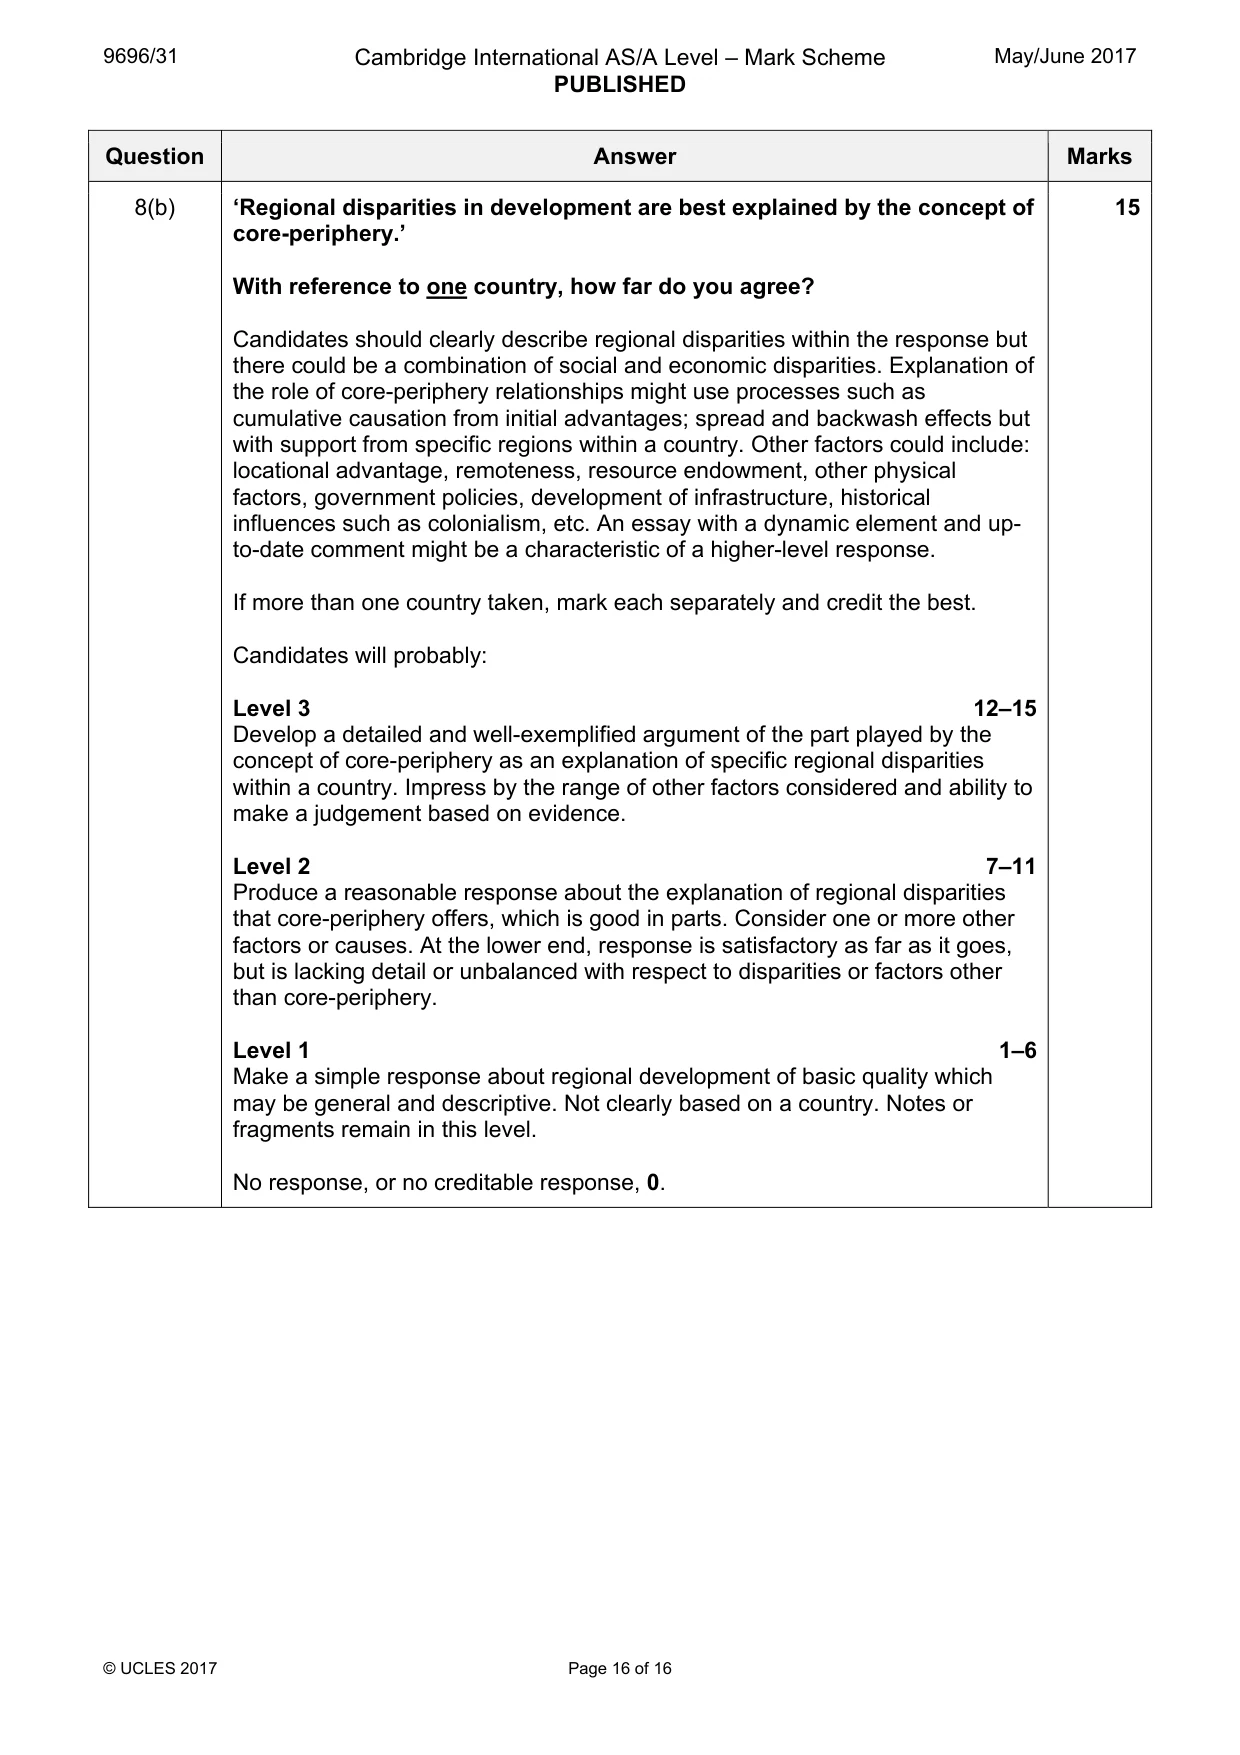
9696/31 Cambridge International AS/A Level – Mark Scheme PUBLISHED May/June 2017 © UCLES 2017 Page 16 of 16 Question Answer Marks 8(b) ‘Regional disparities in development are best explained by the concept of core-periphery.’ With reference to one country, how far do you agree? Candidates should clearly describe regional disparities within the response but there could be a combination of social and economic disparities. Explanation of the role of core-periphery relationships might use processes such as cumulative causation from initial advantages; spread and backwash effects but with support from specific regions within a country. Other factors could include: locational advantage, remoteness, resource endowment, other physical factors, government policies, development of infrastructure, historical influences such as colonialism, etc. An essay with a dynamic element and up- to-date comment might be a characteristic of a higher-level response. If more than one country taken, mark each separately and credit the best. Candidates will probably: Level 3 12–15 Develop a detailed and well-exemplified argument of the part played by the concept of core-periphery as an explanation of specific regional disparities within a country. Impress by the range of other factors considered and ability to make a judgement based on evidence. Level 2 7–11 Produce a reasonable response about the explanation of regional disparities that core-periphery offers, which is good in parts. Consider one or more other factors or causes. At the lower end, response is satisfactory as far as it goes, but is lacking detail or unbalanced with respect to disparities or factors other than core-periphery. Level 1 1–6 Make a simple response about regional development of basic quality which may be general and descriptive. Not clearly based on a country. Notes or fragments remain in this level. No response, or no creditable response, 0. 15
What you needed in this session
Cambridge’s own grade thresholds for 2017 May/June, Paper 3 · Variant 1. A higher threshold means an easier paper — the bar moves with how the cohort did.