Cambridge A Level Economics 9708 — 2023 Oct/Nov Paper 4 · Variant 2
9708/42/O/N/23 · 5 questions · 60 marks · ≈68 min
The question paper and its mark scheme, free to read here and free to download. This is Cambridge’s own paper, exactly as it was sat.
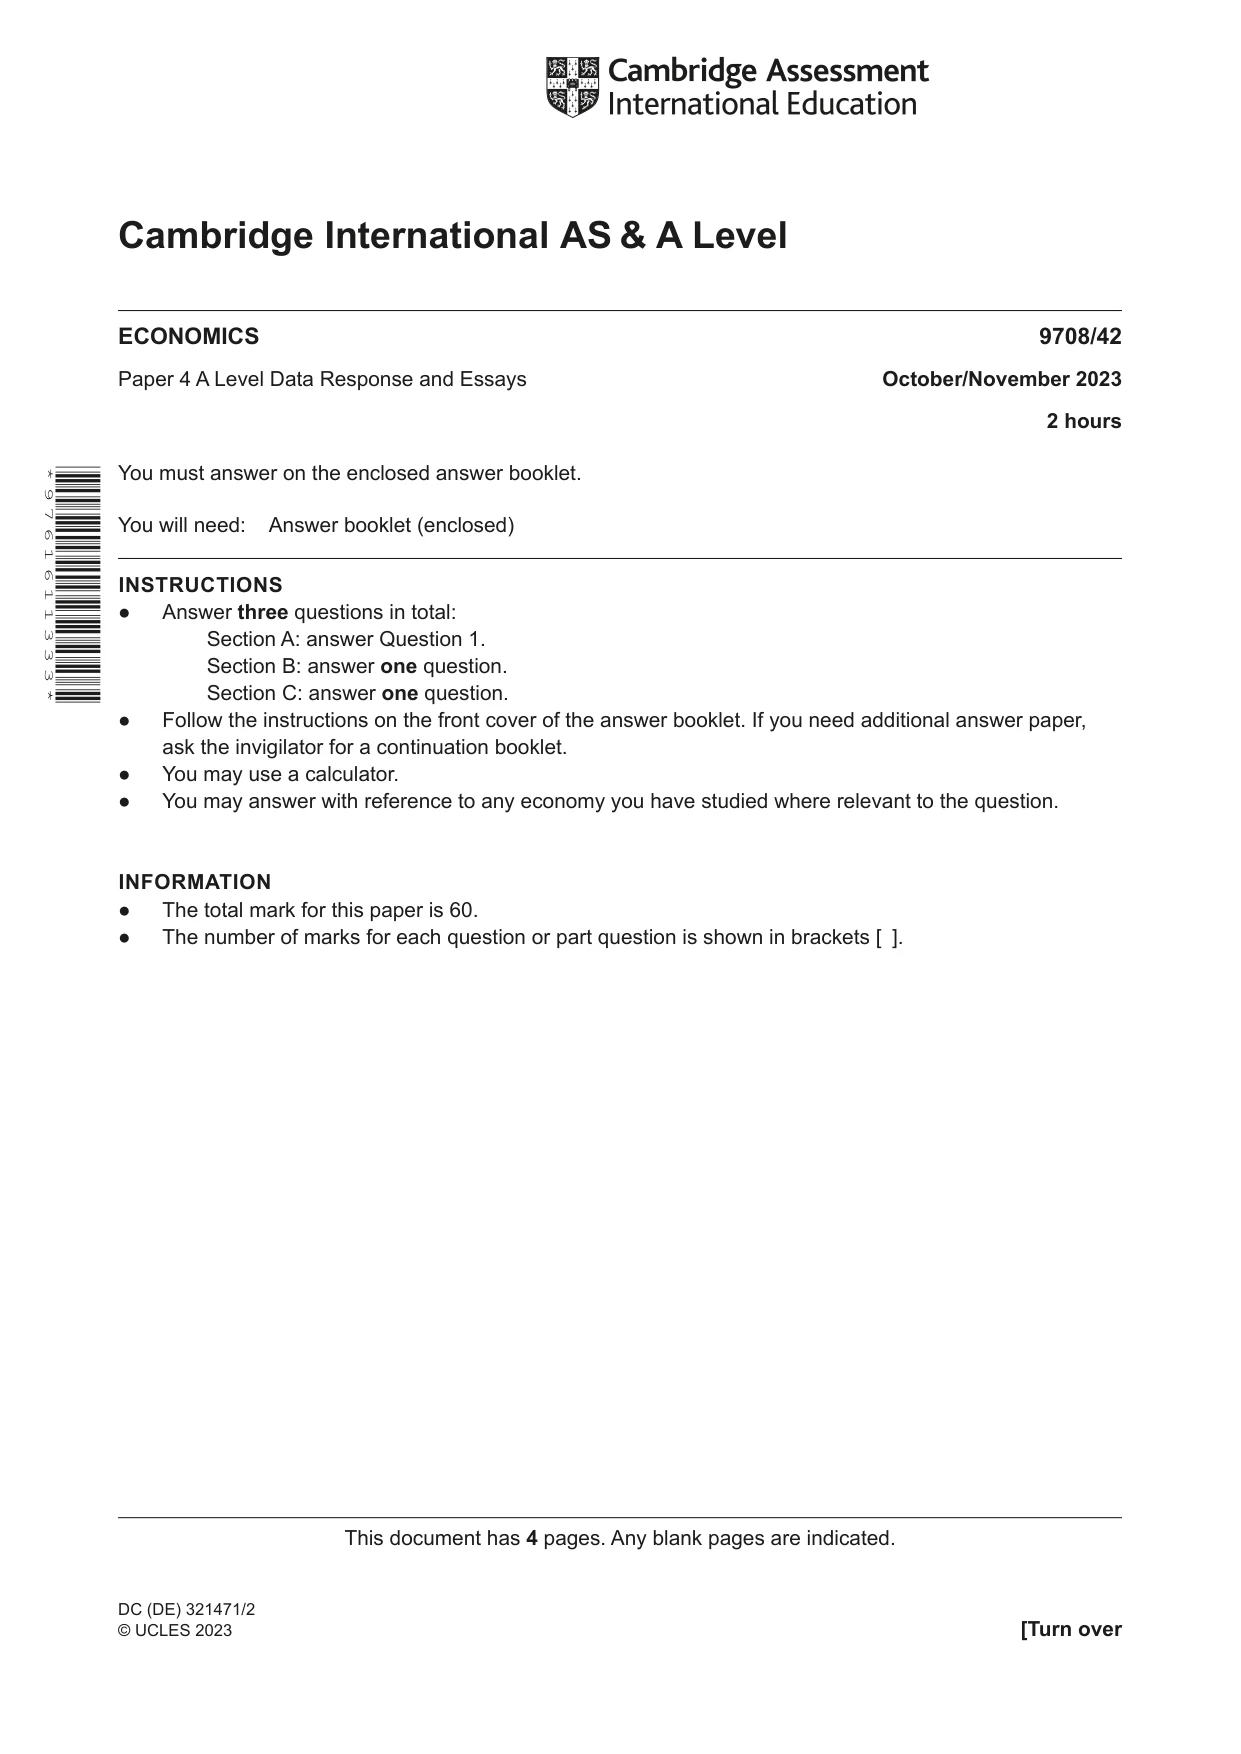
Question paper4 pages


Mark scheme14 pages
Answers below. Sit the paper first if you are practising.






Questions as text
Q1 · Traffic Control In 2020 Lagos, Nigeria’s largest city, banned the use of motorcycle taxis…
1 Traffic Control In 2020 Lagos, Nigeria’s largest city, banned the use of motorcycle taxis and tricycles from its most congested areas. Content removed due to copyright restrictions. Plans are in place to extend the system to 400km. Sources: dailytrust.com, 7 February 2020 and The Daily Telegraph, 3 March 2020 (a) Explain what is meant by equity and how the ban on motorcycle taxis and tricycles affects equity for commuters in Lagos. [3] (b) Explain, with the help of a diagram, what is meant by a negative externality and identify two examples of negative externalities from the article. [6] (c) From the evidence, consider whether the Singapore quota system or the ERP was more effective in solving the problem of traffic congestion. [6] (d) Assess whether government’s involvement in the provision of transport systems is because transport is a public good. [5]
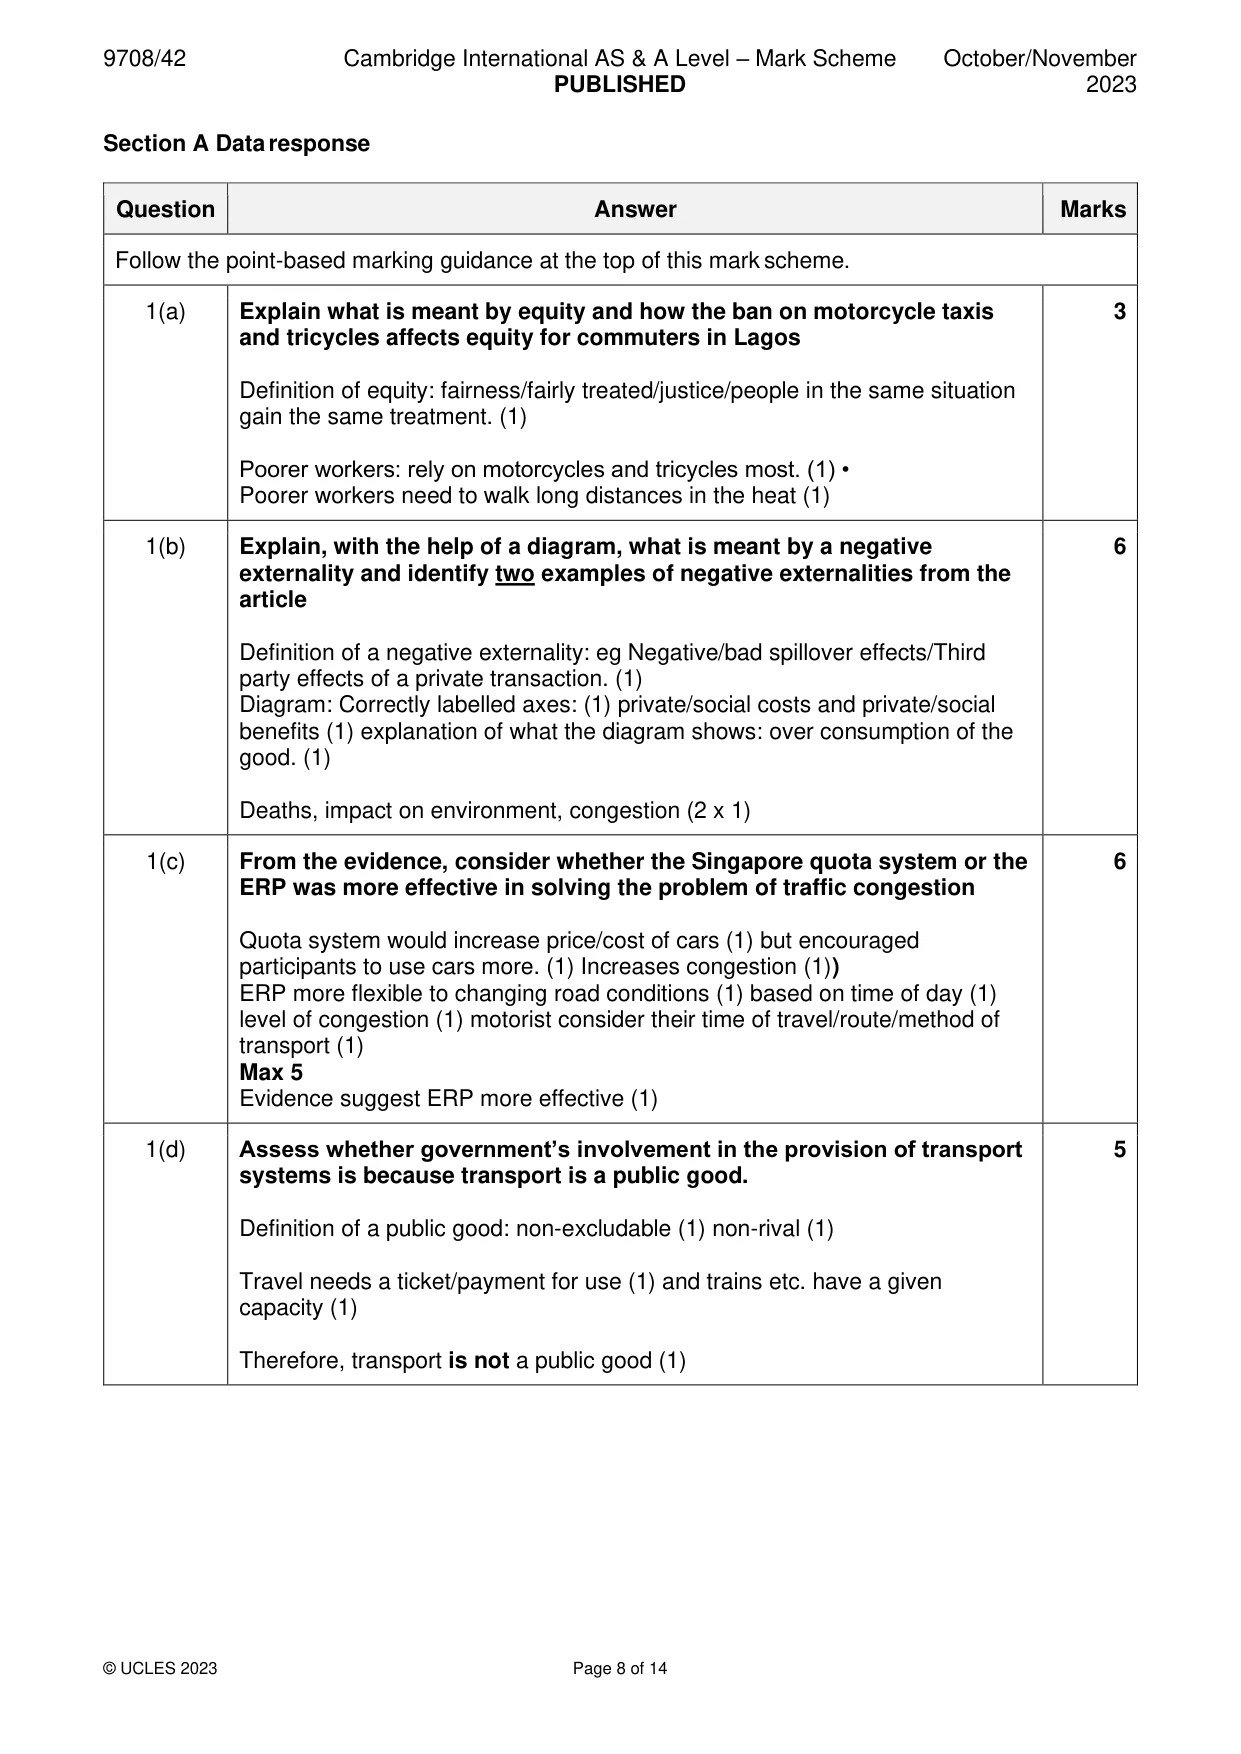
Mark scheme: Question Answer Marks Follow the point-based marking guidance at the top of this mark scheme. 1(a) Explain what is meant by equity and how the ban on motorcycle taxis 3 and tricycles affects equity for commuters in Lagos Definition of equity: fairness/fairly treated/justice/people in the same situation gain the same treatment. (1) Poorer workers: rely on motorcycles and tricycles most. (1) • Poorer workers need to walk long distances in the heat (1) 1(b) Explain, with the help of a diagram, what is meant by a negative 6 externality and identify two examples of negative externalities from the article Definition of a negative externality: eg Negative/bad spillover effects/Third party effects of a private transaction. (1) Diagram: Correctly labelled axes: (1) private/social costs and private/social benefits (1) explanation of what the diagram shows: over consumption of the good. (1) Deaths, impact on environment, congestion (2 x 1) 1(c) From the evidence, consider whether the Singapore quota system or the 6 ERP was more effective in solving the problem of traffic congestion Quota system would increase price/cost of cars (1) but encouraged participants to use cars more. (1) Increases congestion (1)) ERP more flexible to changing road conditions (1) based on time of day (1) level of congestion (1) motorist consider their time of travel/route/method of transport (1) Max 5 Evidence suggest ERP more effective (1) 1(d) Assess whether government’s involvement in the provision of transport 5 systems is because transport is a public good. Definition of a public good: non-excludable (1) non-rival (1) Travel needs a ticket/payment for use (1) and trains etc. have a given capacity (1) Therefore, transport is not a public good (1)
More questions on Private costs and benefits, externalities and social costs and benefits
Q2 · Evaluate the use of indifference curve analysis to derive the demand curve for a normal…
2 Evaluate the use of indifference curve analysis to derive the demand curve for a normal good and the demand curve for an inferior good. [20] OR
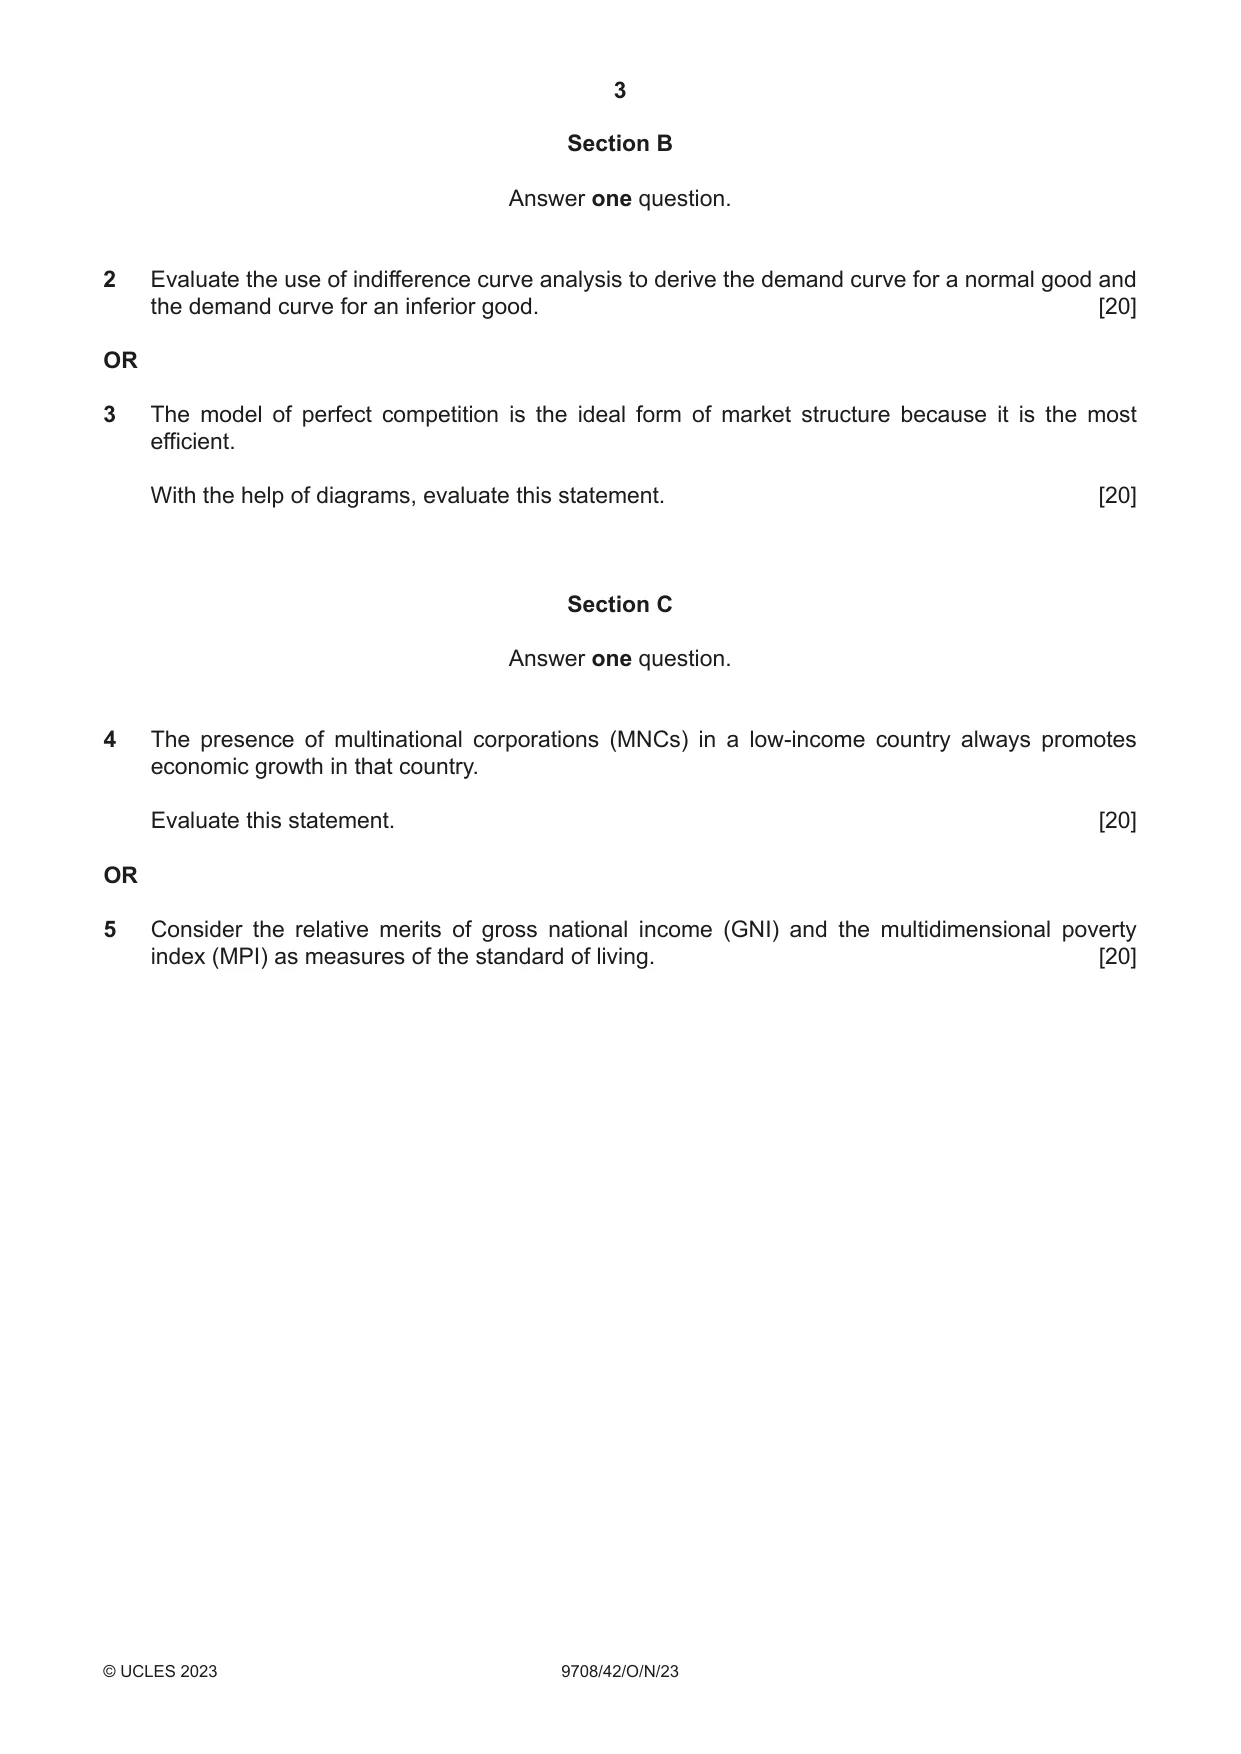
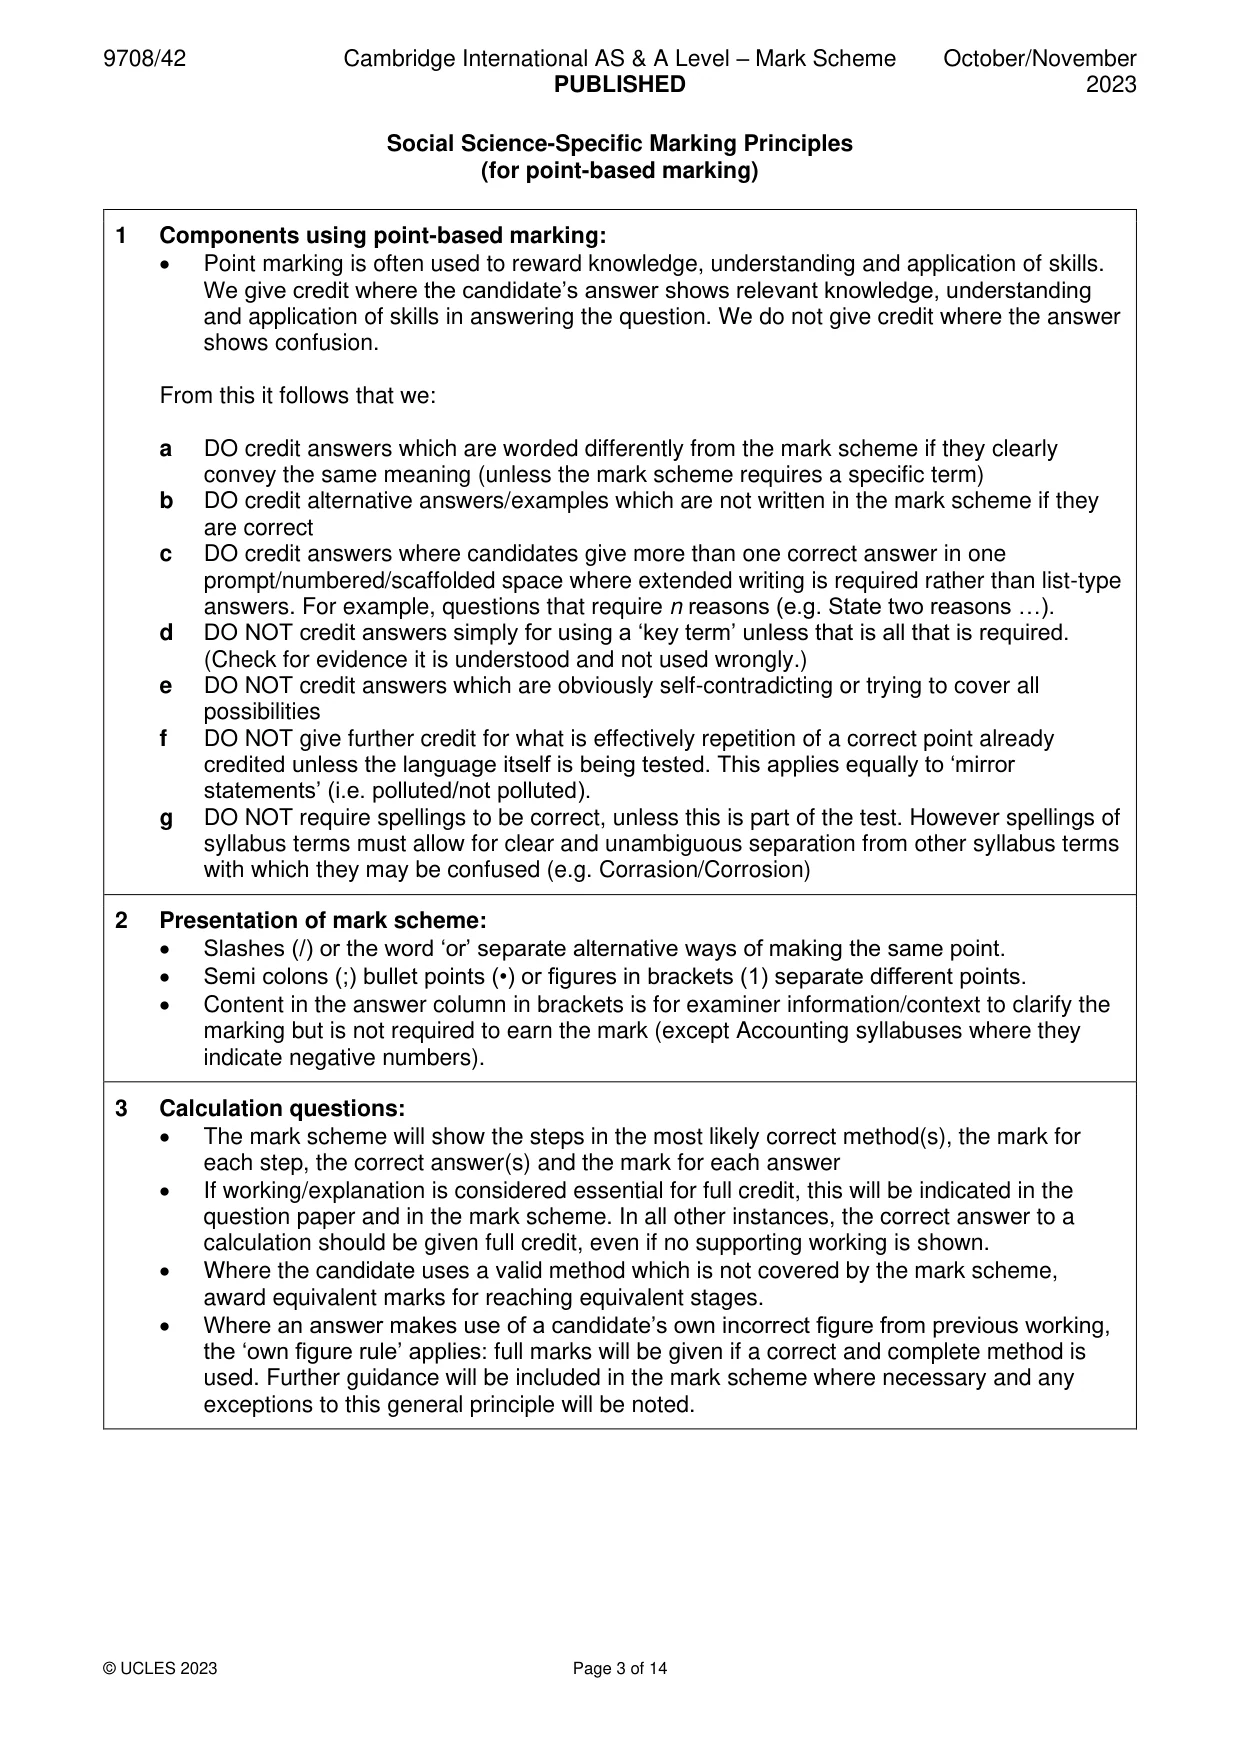
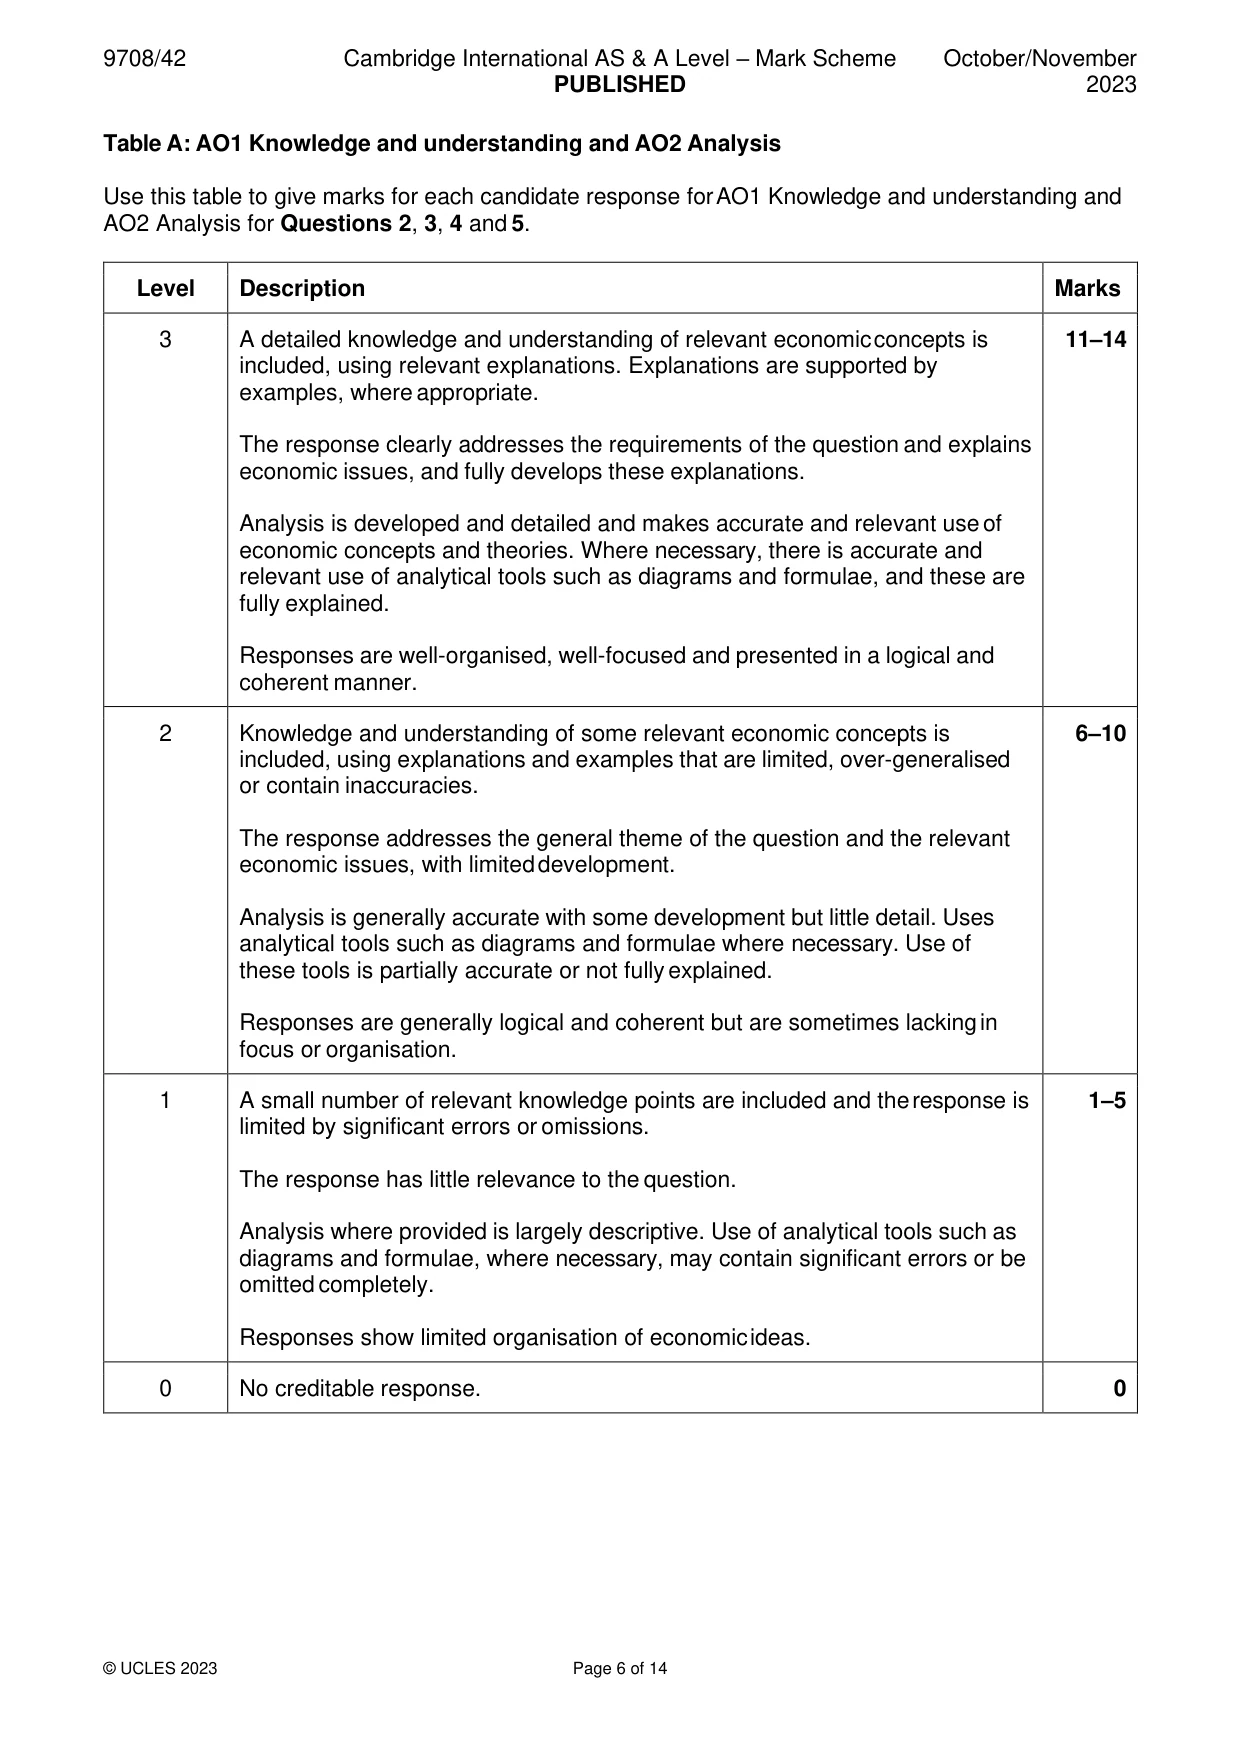
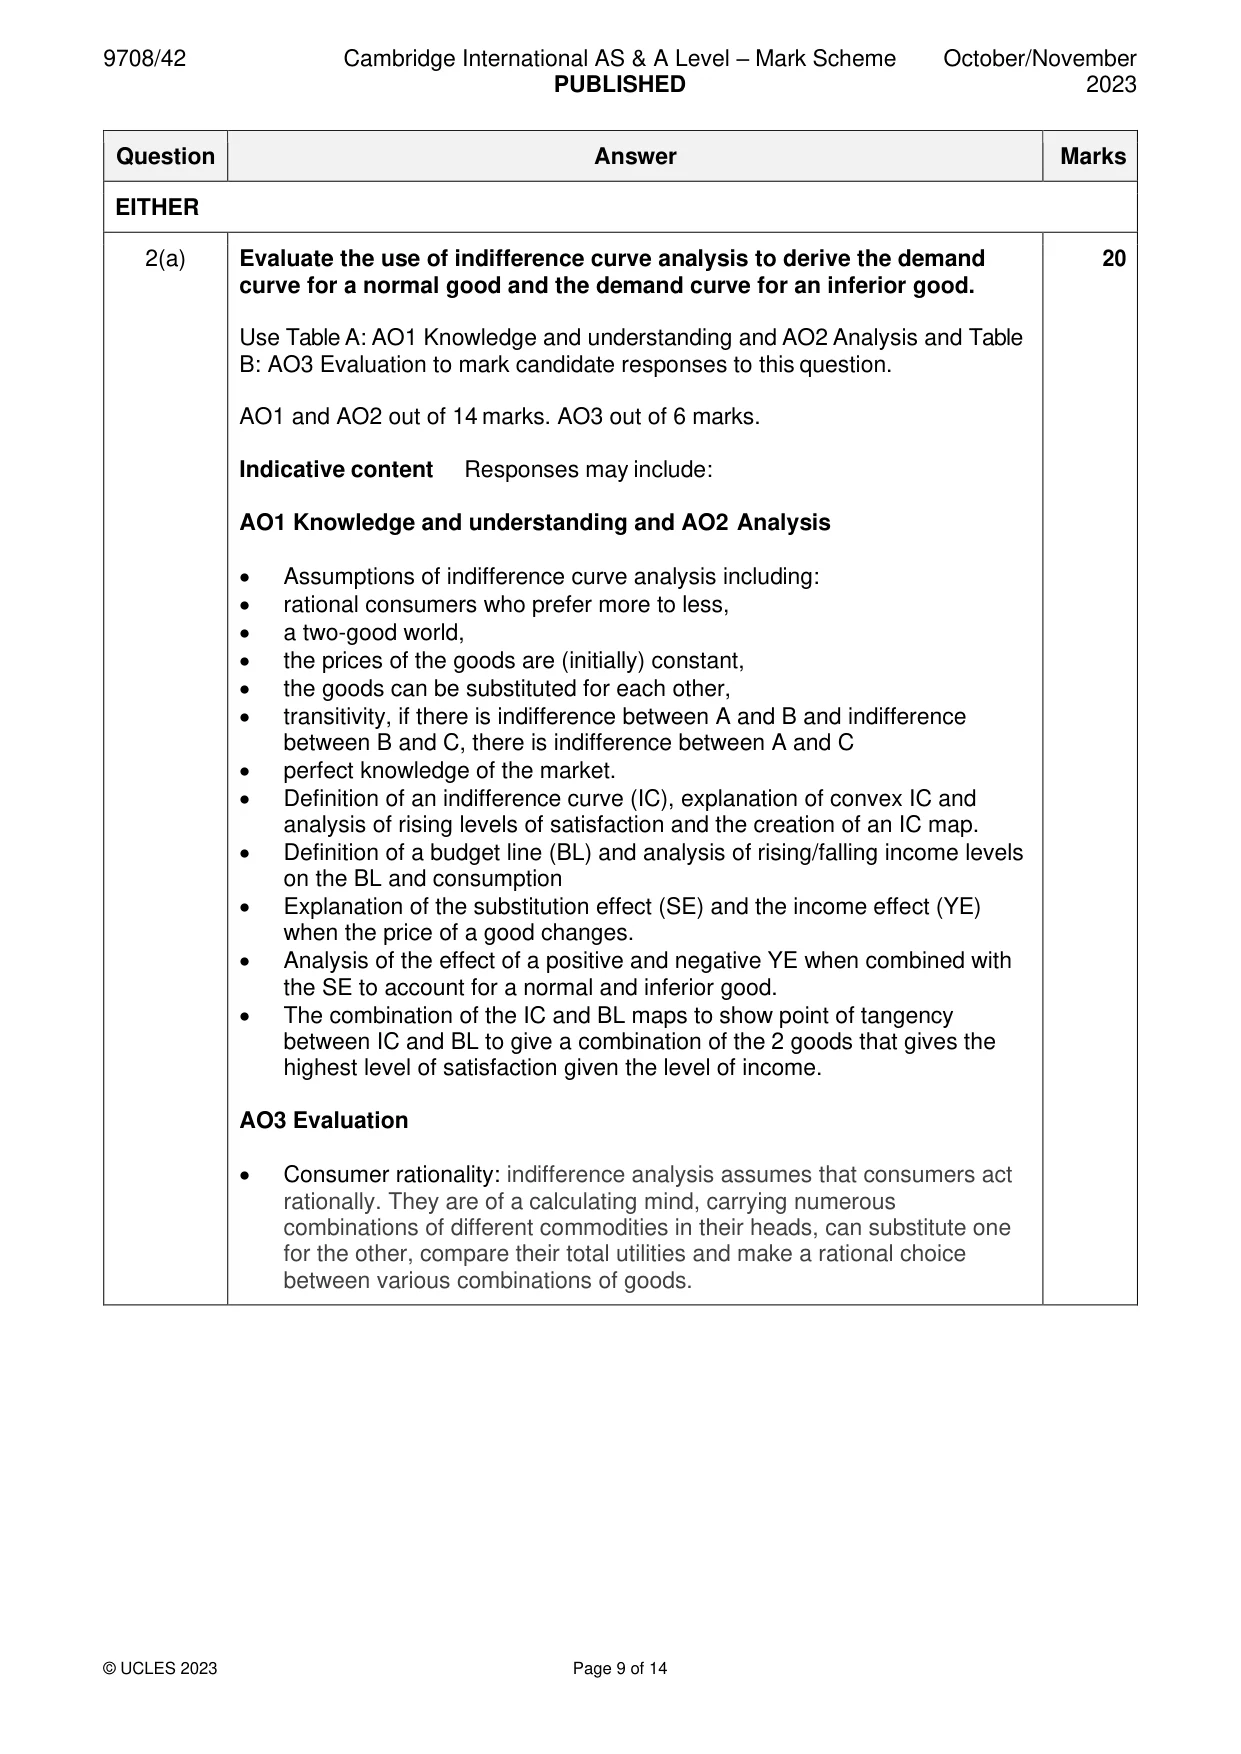
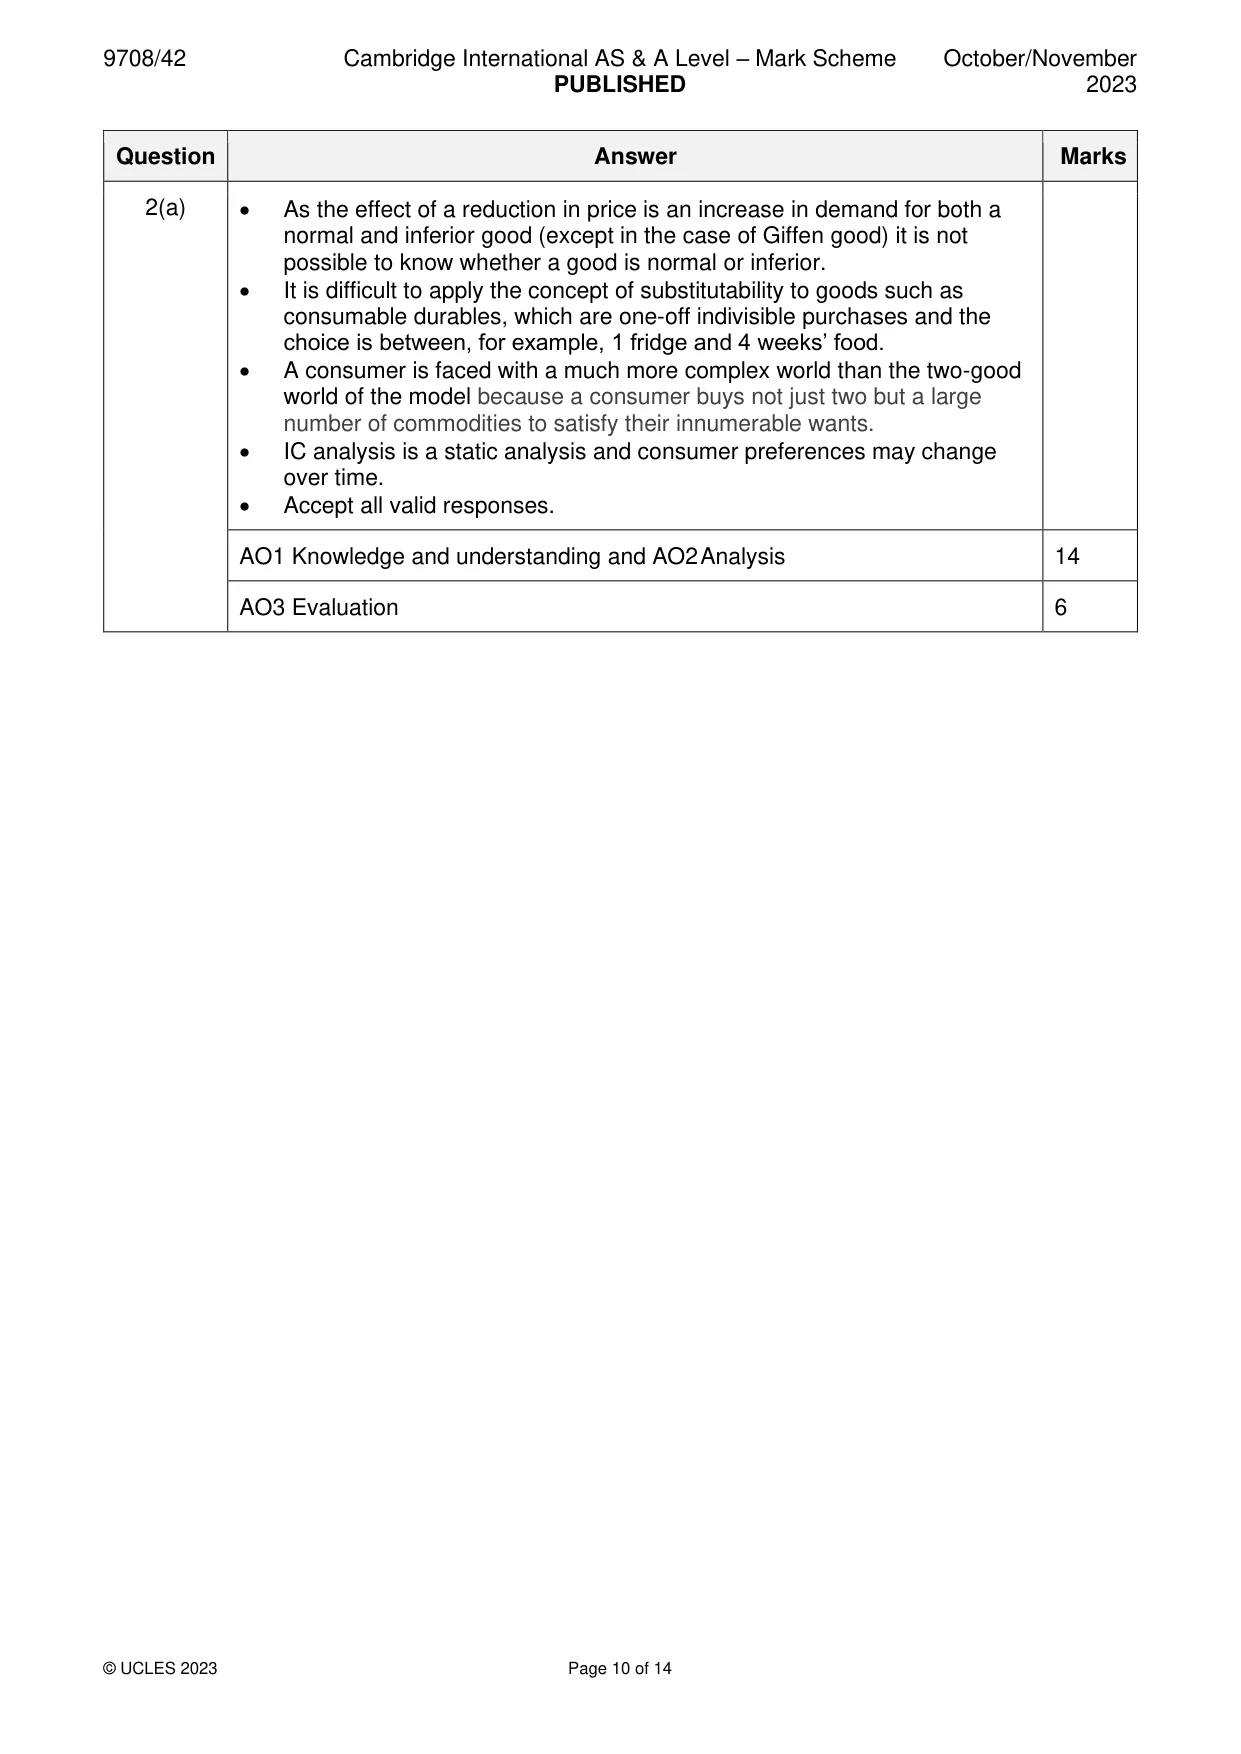
Mark scheme: 2(a) Evaluate the use of indifference curve analysis to derive the demand 20 curve for a normal good and the demand curve for an inferior good. Use Table A: AO1 Knowledge and understanding and AO2 Analysis and Table B: AO3 Evaluation to mark candidate responses to this question. AO1 and AO2 out of 14 marks. AO3 out of 6 marks. Indicative content Responses may include: AO1 Knowledge and understanding and AO2 Analysis • Assumptions of indifference curve analysis including: • rational consumers who prefer more to less, • a two-good world, • the prices of the goods are (initially) constant, • the goods can be substituted for each other, • transitivity, if there is indifference between A and B and indifference between B and C, there is indifference between A and C • perfect knowledge of the market. • Definition of an indifference curve (IC), explanation of convex IC and analysis of rising levels of satisfaction and the creation of an IC map. • Definition of a budget line (BL) and analysis of rising/falling income levels on the BL and consumption • Explanation of the substitution effect (SE) and the income effect (YE) when the price of a good changes. • Analysis of the effect of a positive and negative YE when combined with the SE to account for a normal and inferior good. • The combination of the IC and BL maps to show point of tangency between IC and BL to give a combination of the 2 goods that gives the highest level of satisfaction given the level of income. AO3 Evaluation • Consumer rationality: indifference analysis assumes that consumers act rationally. They are of a calculating mind, carrying numerous combinations of different commodities in their heads, can substitute one for the other, compare their total utilities and make a rational choice between various combinations of goods. 2(a) • As the effect of a reduction in price is an increase in demand for both a normal and inferior good (except in the case of Giffen good) it is not possible to know whether a good is normal or inferior. • It is difficult to apply the concept of substitutability to goods such as consumable durables, which are one-off indivisible purchases and the choice is between, for example, 1 fridge and 4 weeks’ food. • A consumer is faced with a much more complex world than the two-good world of the model because a consumer buys not just two but a large number of commodities to satisfy their innumerable wants. • IC analysis is a static analysis and consumer preferences may change over time. • Accept all valid responses. AO1 Knowledge and understanding and AO2 Analysis 14 AO3 Evaluation 6
Q3 · The model of perfect competition is the ideal form of market structure because it is the…
3 The model of perfect competition is the ideal form of market structure because it is the most efficient. With the help of diagrams, evaluate this statement. [20] Section C Answer one question.
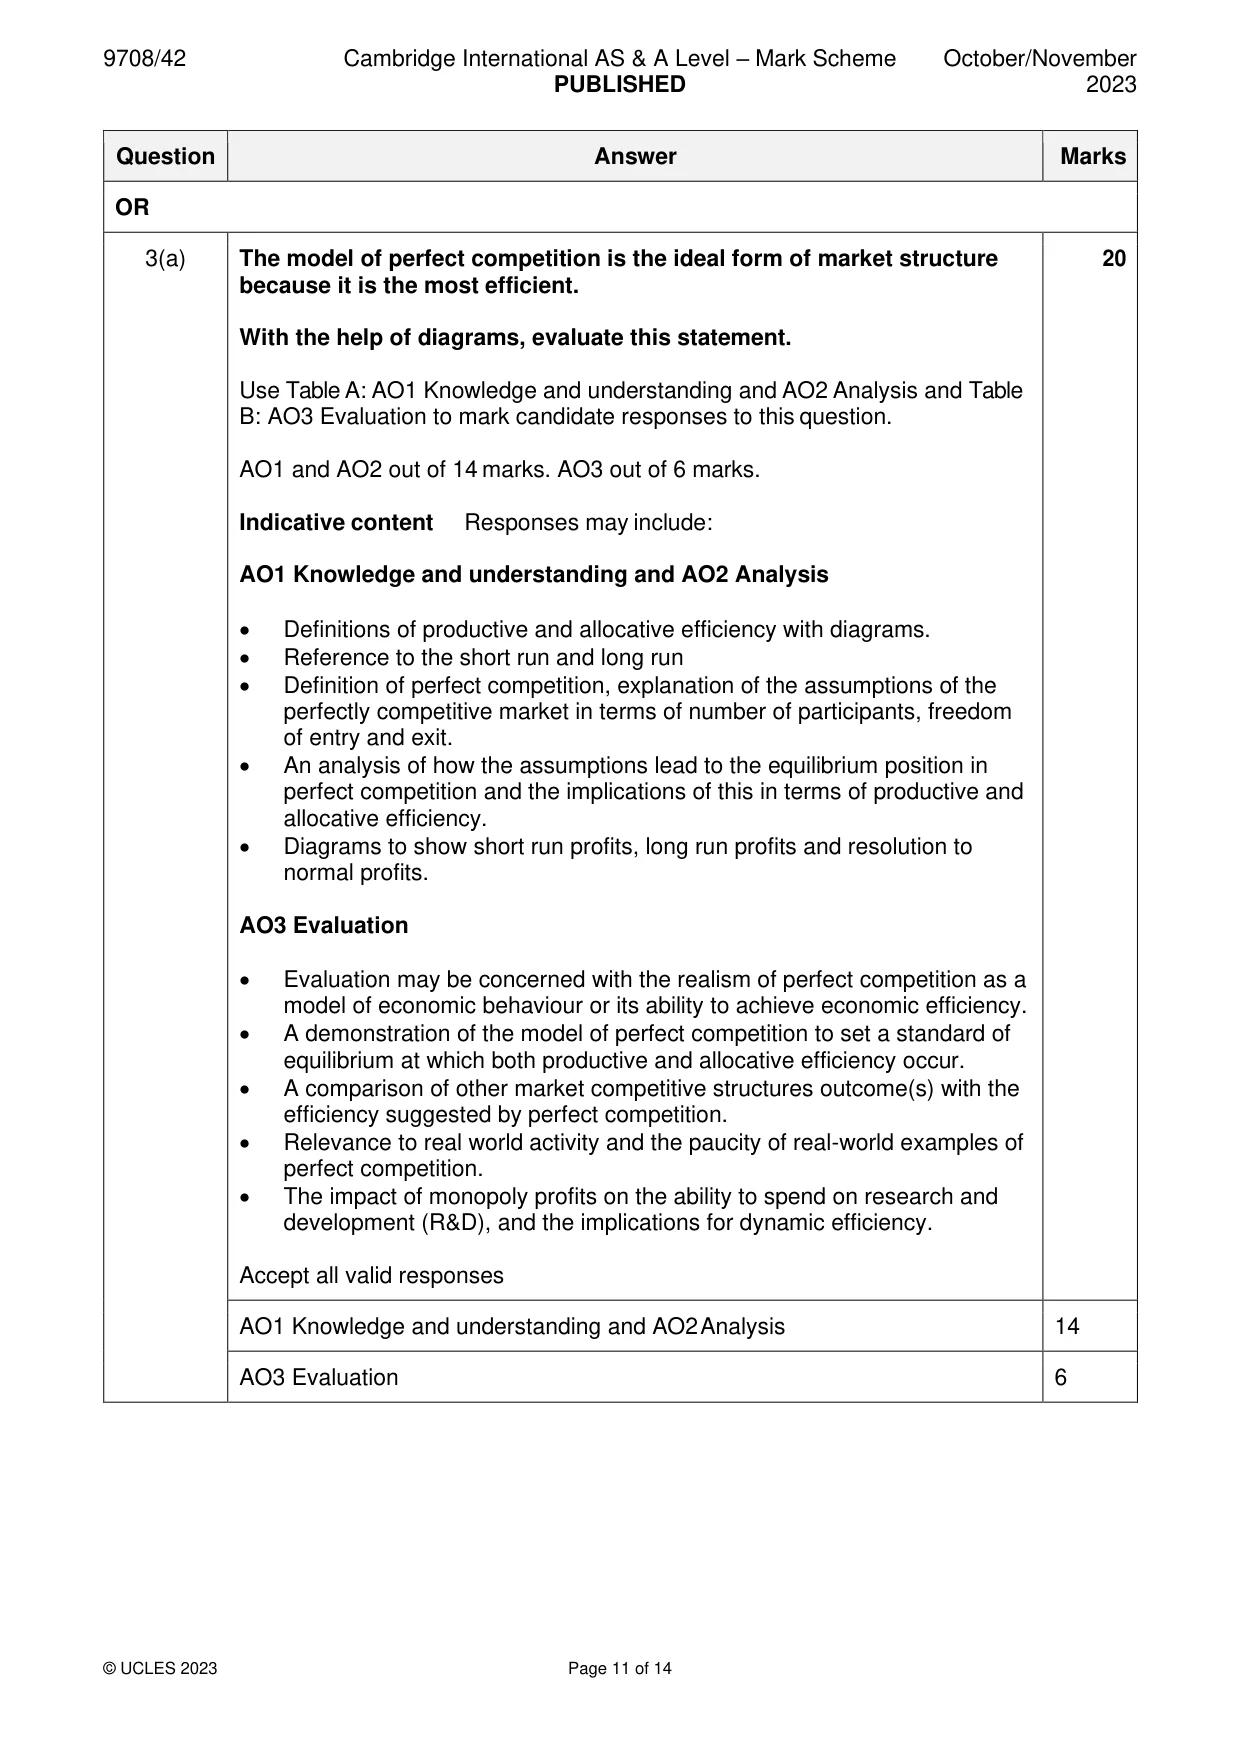
Mark scheme: 3(a) The model of perfect competition is the ideal form of market structure 20 because it is the most efficient. With the help of diagrams, evaluate this statement. Use Table A: AO1 Knowledge and understanding and AO2 Analysis and Table B: AO3 Evaluation to mark candidate responses to this question. AO1 and AO2 out of 14 marks. AO3 out of 6 marks. Indicative content Responses may include: AO1 Knowledge and understanding and AO2 Analysis • Definitions of productive and allocative efficiency with diagrams. • Reference to the short run and long run • Definition of perfect competition, explanation of the assumptions of the perfectly competitive market in terms of number of participants, freedom of entry and exit. • An analysis of how the assumptions lead to the equilibrium position in perfect competition and the implications of this in terms of productive and allocative efficiency. • Diagrams to show short run profits, long run profits and resolution to normal profits. AO3 Evaluation • Evaluation may be concerned with the realism of perfect competition as a model of economic behaviour or its ability to achieve economic efficiency. • A demonstration of the model of perfect competition to set a standard of equilibrium at which both productive and allocative efficiency occur. • A comparison of other market competitive structures outcome(s) with the efficiency suggested by perfect competition. • Relevance to real world activity and the paucity of real-world examples of perfect competition. • The impact of monopoly profits on the ability to spend on research and development (R&D), and the implications for dynamic efficiency. Accept all valid responses AO1 Knowledge and understanding and AO2 Analysis 14 AO3 Evaluation 6
Q4 · The presence of multinational corporations (MNCs) in a low-income country always promotes…
4 The presence of multinational corporations (MNCs) in a low-income country always promotes economic growth in that country. Evaluate this statement. [20] OR
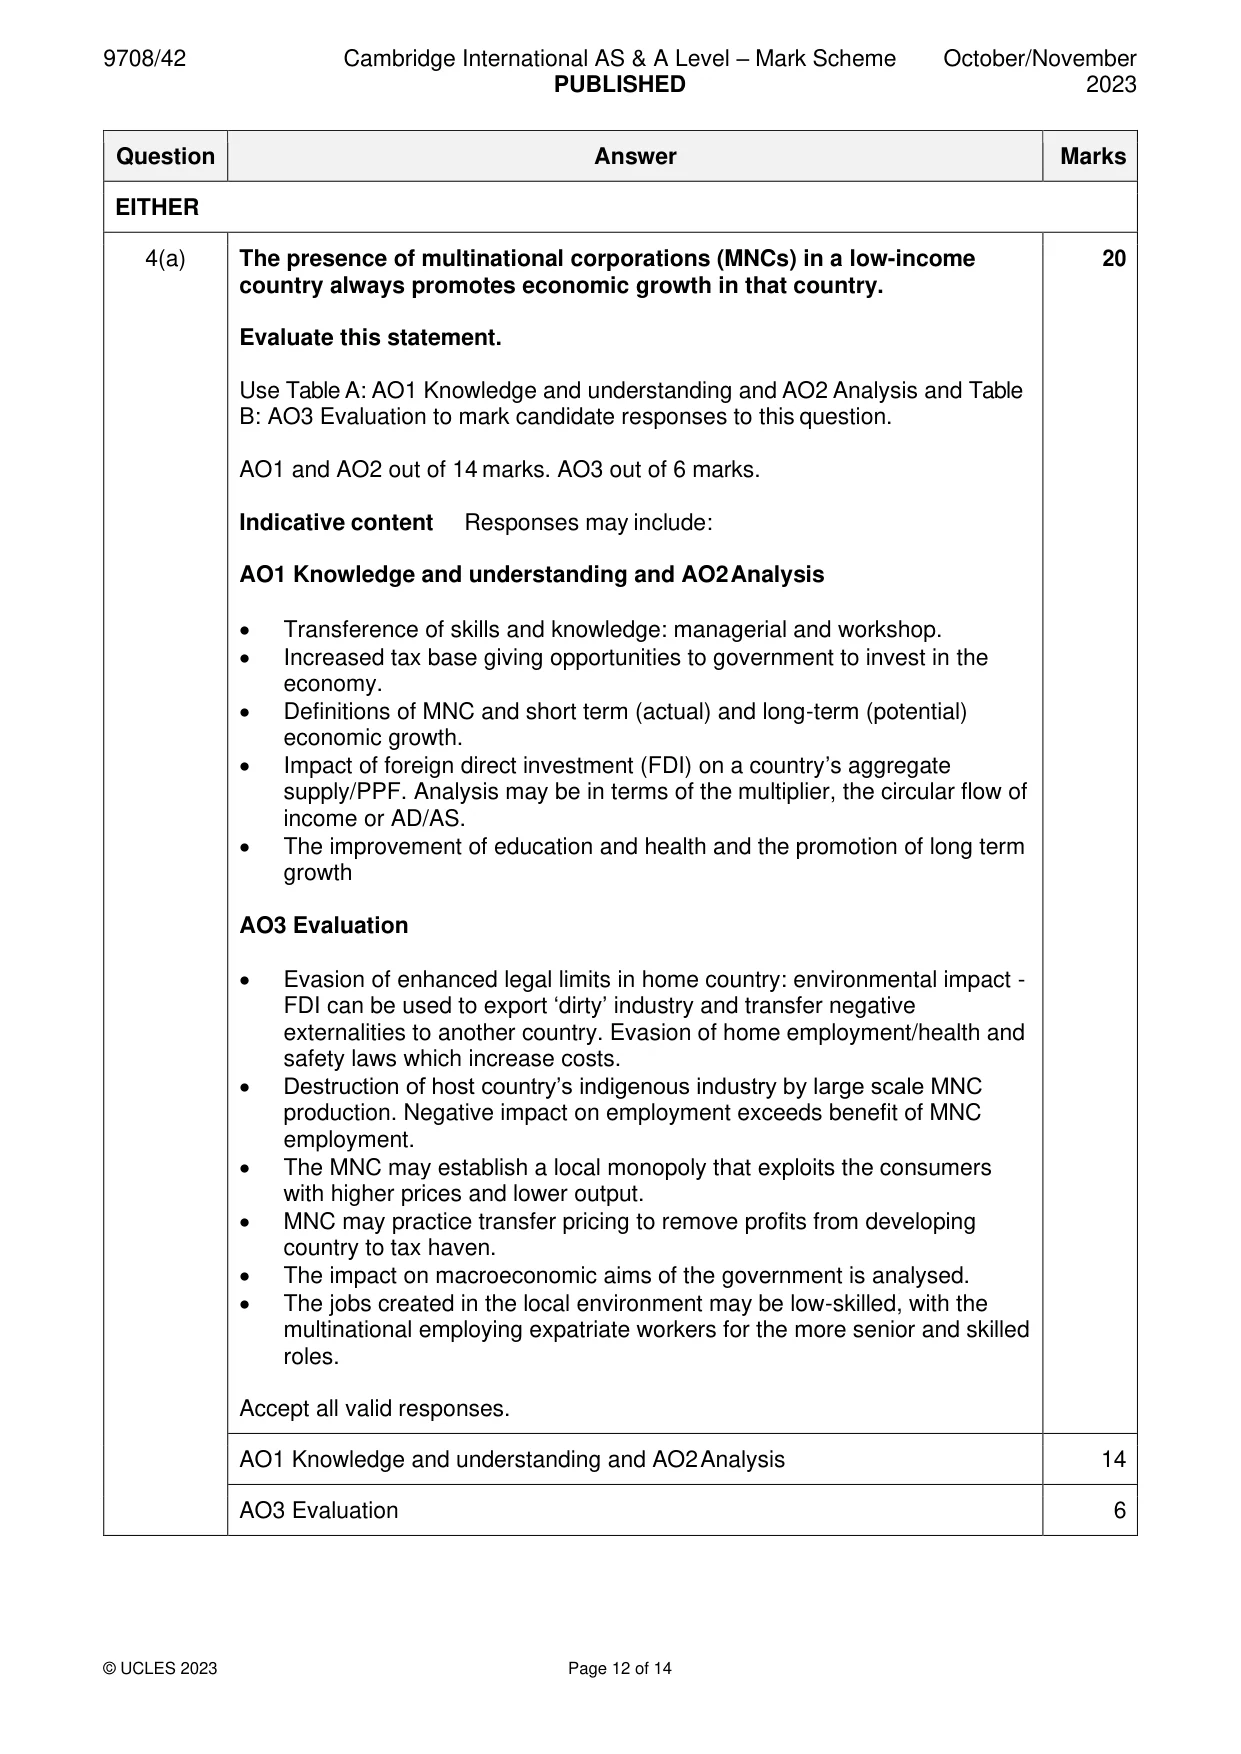
Mark scheme: 4(a) The presence of multinational corporations (MNCs) in a low-income 20 country always promotes economic growth in that country. Evaluate this statement. Use Table A: AO1 Knowledge and understanding and AO2 Analysis and Table B: AO3 Evaluation to mark candidate responses to this question. AO1 and AO2 out of 14 marks. AO3 out of 6 marks. Indicative content Responses may include: AO1 Knowledge and understanding and AO2 Analysis • Transference of skills and knowledge: managerial and workshop. • Increased tax base giving opportunities to government to invest in the economy. • Definitions of MNC and short term (actual) and long-term (potential) economic growth. • Impact of foreign direct investment (FDI) on a country’s aggregate supply/PPF. Analysis may be in terms of the multiplier, the circular flow of income or AD/AS. • The improvement of education and health and the promotion of long term growth AO3 Evaluation • Evasion of enhanced legal limits in home country: environmental impact - FDI can be used to export ‘dirty’ industry and transfer negative externalities to another country. Evasion of home employment/health and safety laws which increase costs. • Destruction of host country’s indigenous industry by large scale MNC production. Negative impact on employment exceeds benefit of MNC employment. • The MNC may establish a local monopoly that exploits the consumers with higher prices and lower output. • MNC may practice transfer pricing to remove profits from developing country to tax haven. • The impact on macroeconomic aims of the government is analysed. • The jobs created in the local environment may be low-skilled, with the multinational employing expatriate workers for the more senior and skilled roles. Accept all valid responses. AO1 Knowledge and understanding and AO2 Analysis 14 AO3 Evaluation 6
Q5 · Consider the relative merits of gross national income (GNI) and the multidimensional…
5 Consider the relative merits of gross national income (GNI) and the multidimensional poverty index (MPI) as measures of the standard of living. [20]
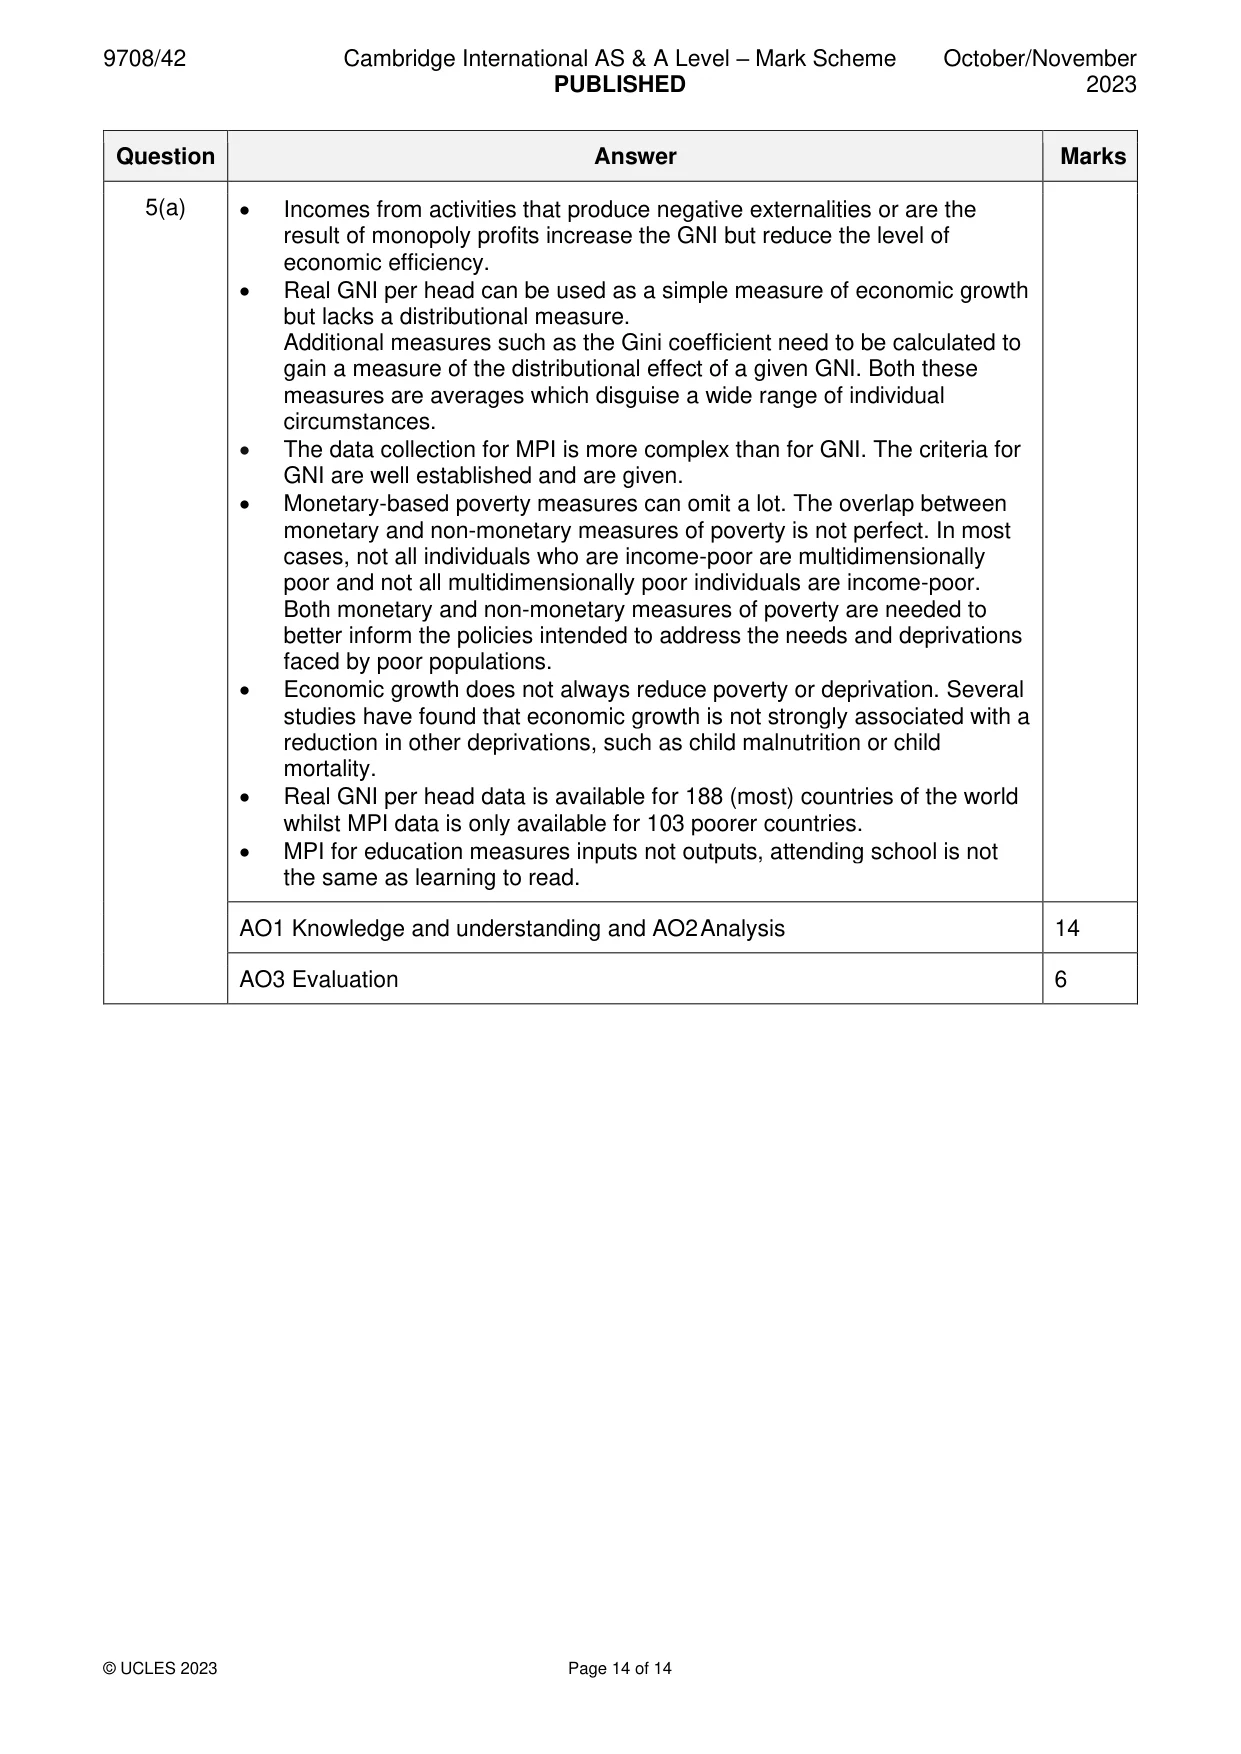
Mark scheme: 5(a) Consider the relative merits of gross national income (GNI) and the 20 multidimensional poverty index (MPI) as measures of the standard of living. Use Table A: AO1 Knowledge and understanding and AO2 Analysis and Table B: AO3 Evaluation to mark candidate responses to this question. AO1 and AO2 out of 14 marks. AO3 out of 6 marks. AO1 Knowledge and understanding and AO2 Analysis • Definition of GNI: the total income earned within a country in a year plus net receipts from abroad of compensation of employees, property income and net taxes less subsidies on production. This is an aggregate measure of an economy’s income. • GNI measures in monetary terms. • For many developing countries which rely on remittances from overseas workers, this will boost the value of GNI. • Other countries that have invested overseas will receive a stream of dividends and interest that boosts their GNI. • Definition of the MPI • Some explicit breakdown of the categories which are involved in the construction of MPI • Health: 1/3rd weighting includes child mortality and nutrition (1/6th each); • Education: 1/3rd weighting includes years of schooling and school attendance (1/6th each); and • Standard of living 1/3 weighting includes cooking fuel, sanitation, drinking water, electricity, housing and assets (1/18th each). • The measures are fundamentally different in their approaches GNI is concerned with money values whilst MPI is concerned with the adequacy of provision of a number of essential services and goods linked to the Millennium Development Goals. AO3 Evaluation Evaluation may be by individual measure or by comparing the measures. • GNI The comprehensiveness of the data collection: • The GNI figures needs deflating for the effects of price increases and changes in the population to achieve real GNI per head, which allows for comparisons over time. • The range of incomes which are included ‘the dark economy’, illegal activity – drugs crime etc. the ability to count all income flows between countries. 5(a) • Incomes from activities that produce negative externalities or are the result of monopoly profits increase the GNI but reduce the level of economic efficiency. • Real GNI per head can be used as a simple measure of economic growth but lacks a distributional measure. Additional measures such as the Gini coefficient need to be calculated to gain a measure of the distributional effect of a given GNI. Both these measures are averages which disguise a wide range of individual circumstances. • The data collection for MPI is more complex than for GNI. The criteria for GNI are well established and are given. • Monetary-based poverty measures can omit a lot. The overlap between monetary and non-monetary measures of poverty is not perfect. In most cases, not all individuals who are income-poor are multidimensionally poor and not all multidimensionally poor individuals are income-poor. Both monetary and non-monetary measures of poverty are needed to better inform the policies intended to address the needs and deprivations faced by poor populations. • Economic growth does not always reduce poverty or deprivation. Several studies have found that economic growth is not strongly associated with a reduction in other deprivations, such as child malnutrition or child mortality. • Real GNI per head data is available for 188 (most) countries of the world whilst MPI data is only available for 103 poorer countries. • MPI for education measures inputs not outputs, attending school is not the same as learning to read. AO1 Knowledge and understanding and AO2 Analysis 14 AO3 Evaluation 6
More questions on Characteristics of countries at different levels of development
What was in this paper
The subtopics covered by these 5 questions, and how many questions each got. Open one in a new tab to see every Cambridge question on it.
What you needed in this session
Cambridge’s own grade thresholds for 2023 Oct/Nov, Paper 4 · Variant 2. A higher threshold means an easier paper — the bar moves with how the cohort did.