Cambridge A Level Economics 9708 — 2023 Oct/Nov Paper 4 · Variant 3
9708/43/O/N/23 · 4 questions · 60 marks · ≈68 min
The question paper and its mark scheme, free to read here and free to download. This is Cambridge’s own paper, exactly as it was sat.
Question paper4 pages
Mark scheme16 pages
Answers below. Sit the paper first if you are practising.


Questions as text
Q1 · The decline of South Africa’s economy South Africa is the most industrialised country in…
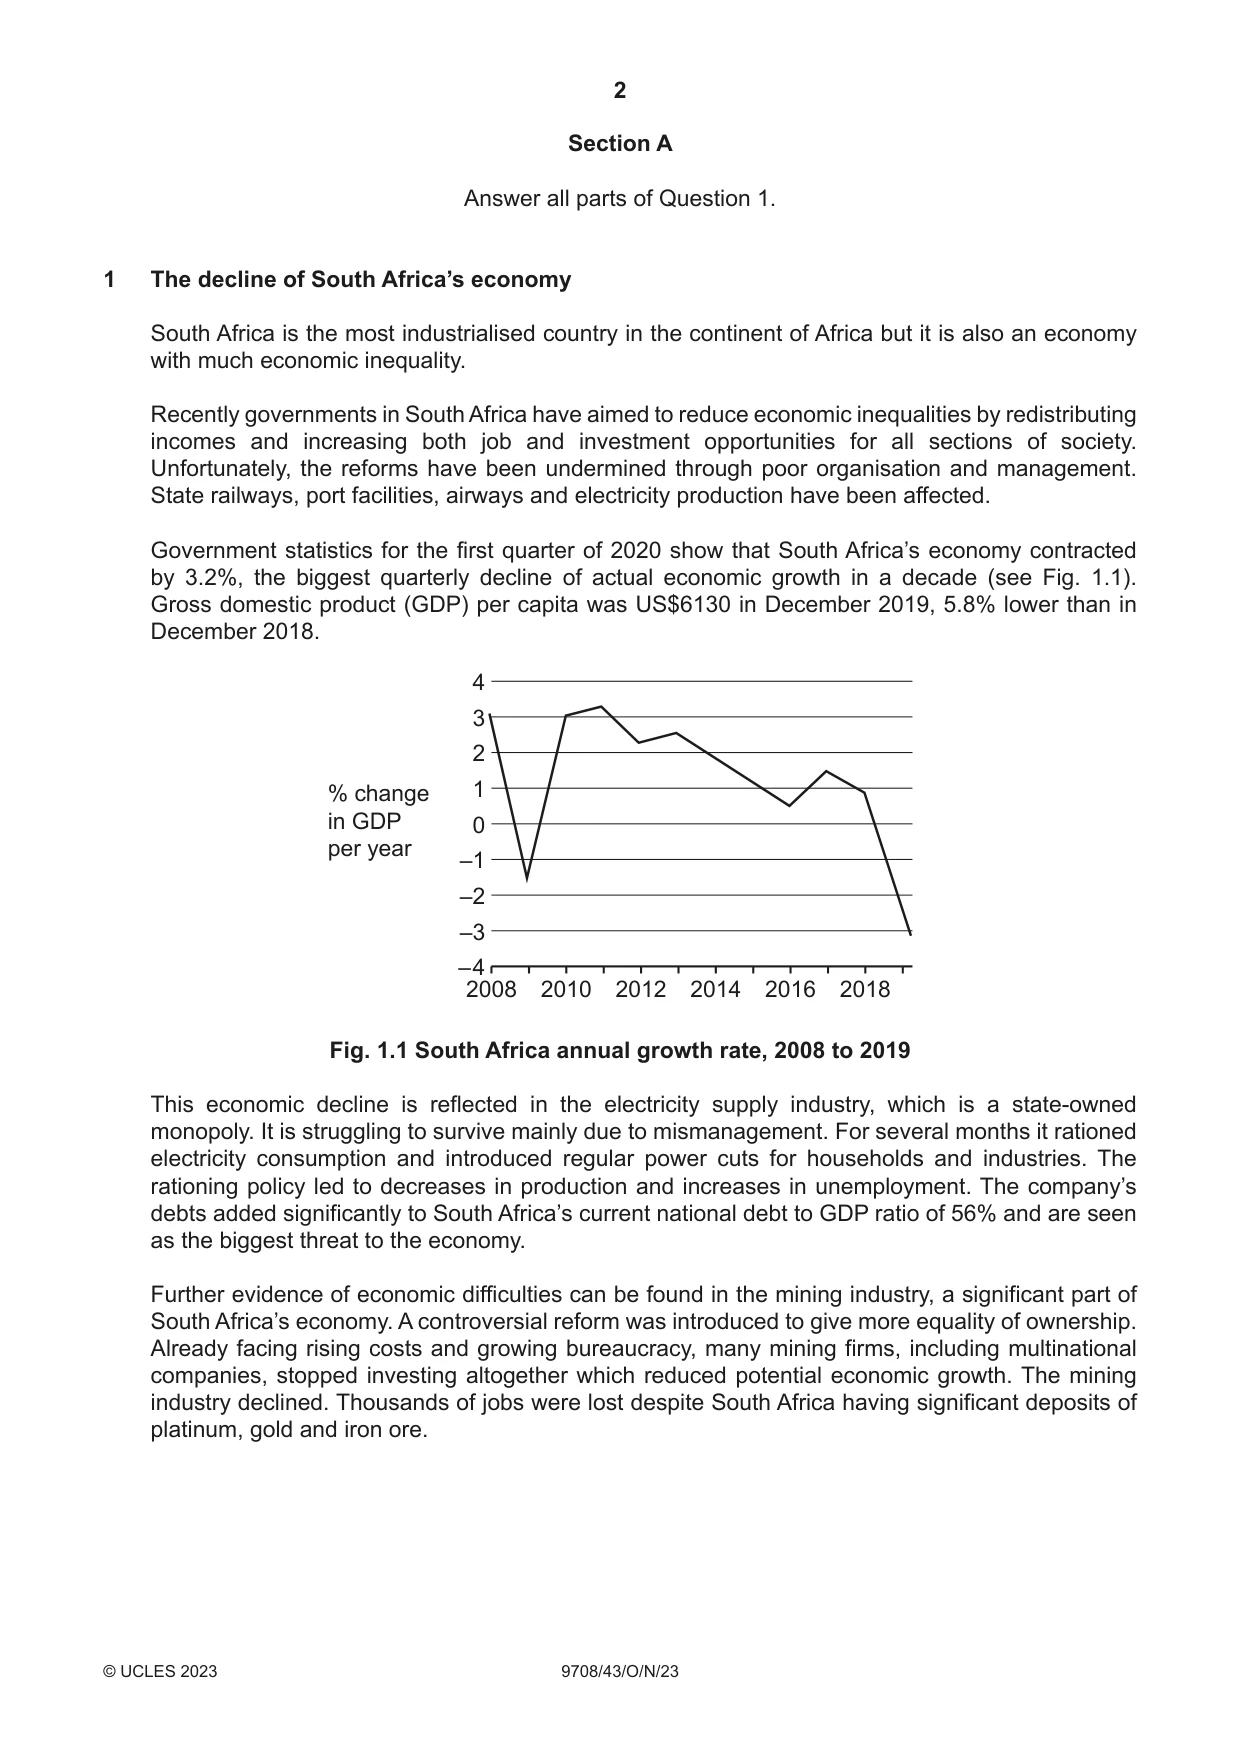
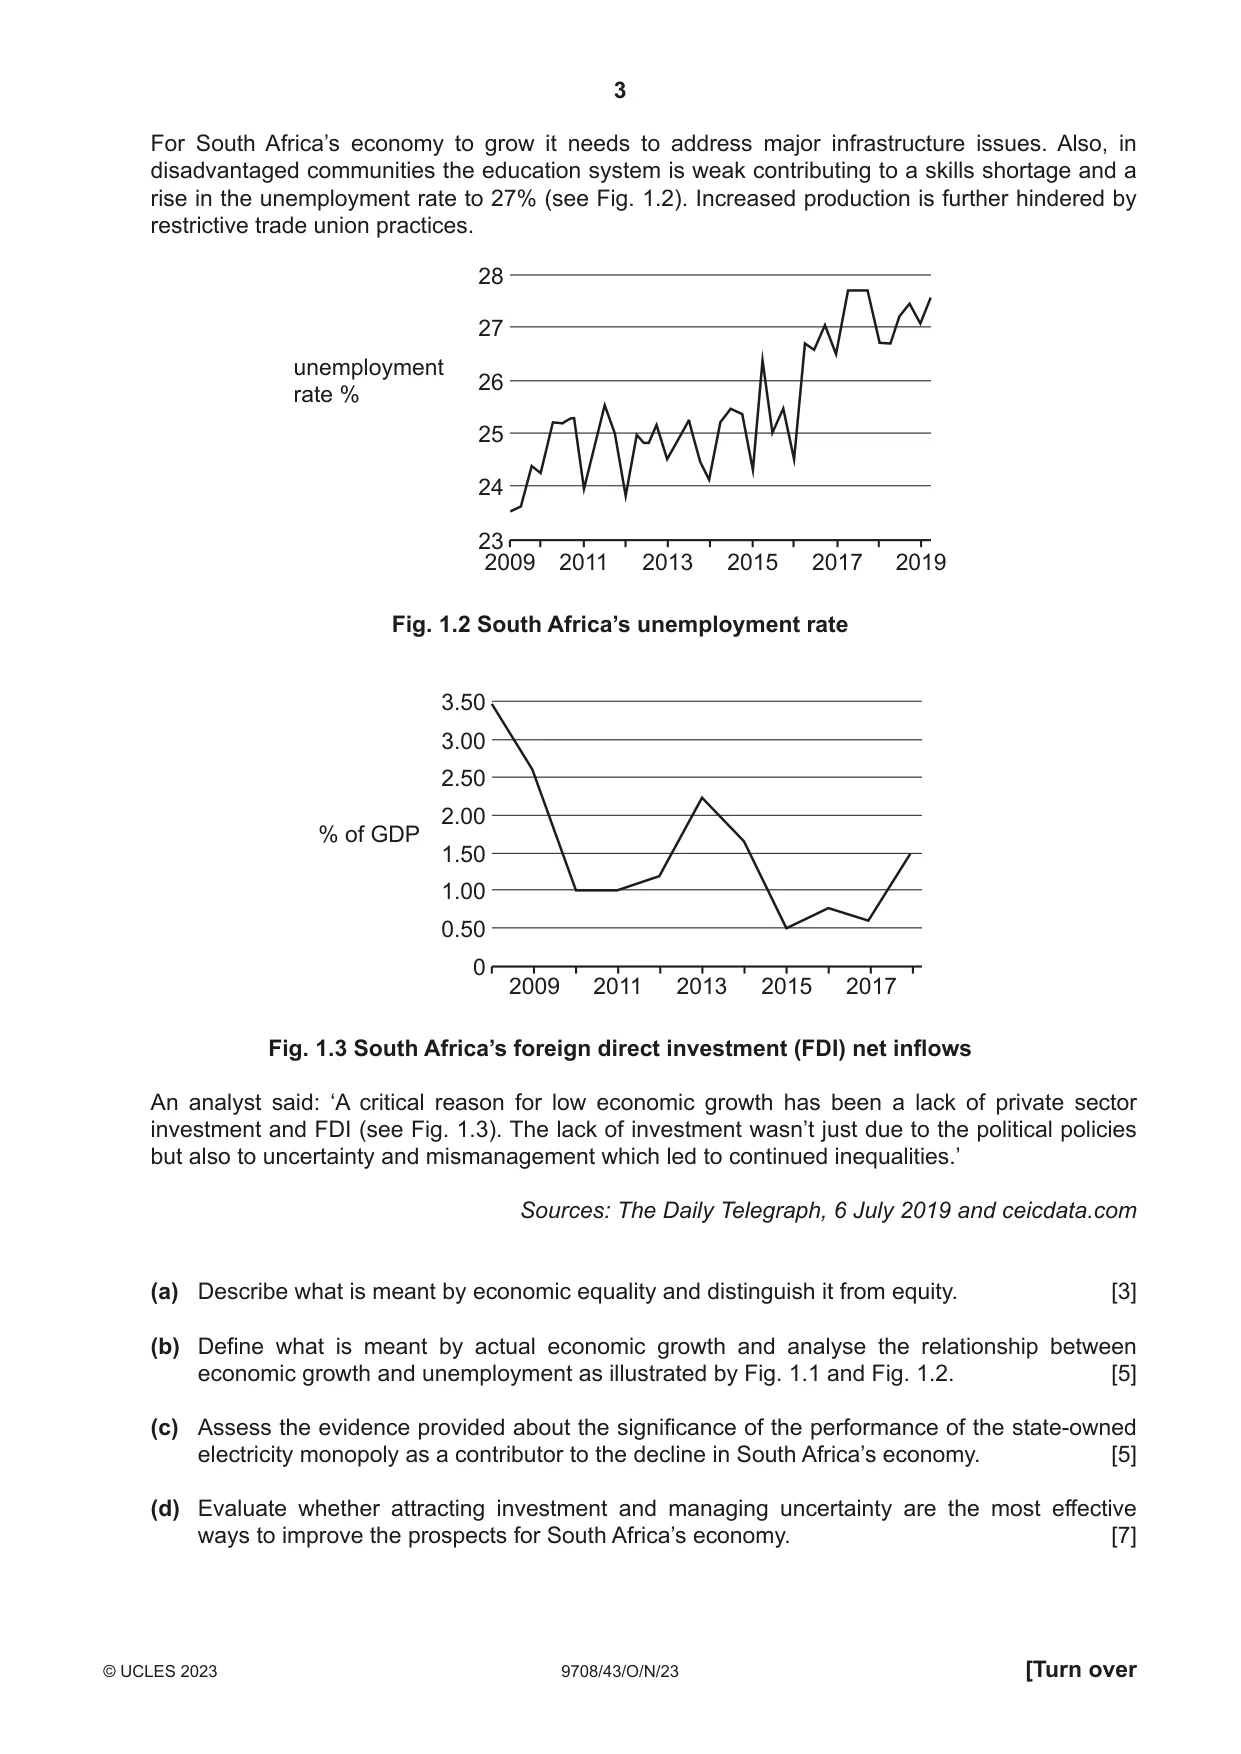
1 The decline of South Africa’s economy South Africa is the most industrialised country in the continent of Africa but it is also an economy with much economic inequality. Recently governments in South Africa have aimed to reduce economic inequalities by redistributing incomes and increasing both job and investment opportunities for all sections of society. Unfortunately, the reforms have been undermined through poor organisation and management. State railways, port facilities, airways and electricity production have been affected. Government statistics for the first quarter of 2020 show that South Africa’s economy contracted by 3.2%, the biggest quarterly decline of actual economic growth in a decade (see Fig. 1.1). Gross domestic product (GDP) per capita was US$6130 in December 2019, 5.8% lower than in December 2018. 4 3 2 % change 1 in GDP 0 per year –1 –2 –3 – 4 2008 2010 2012 2014 2016 2018 Fig. 1.1 South Africa annual growth rate, 2008 to 2019 This economic decline is reflected in the electricity supply industry, which is a state-owned monopoly. It is struggling to survive mainly due to mismanagement. For several months it rationed electricity consumption and introduced regular power cuts for households and industries. The rationing policy led to decreases in production and increases in unemployment. The company’s debts added significantly to South Africa’s current national debt to GDP ratio of 56% and are seen as the biggest threat to the economy. Further evidence of economic difficulties can be found in the mining industry, a significant part of South Africa’s economy. A controversial reform was introduced to give more equality of ownership. Already facing rising costs and growing bureaucracy, many mining firms, including multinational companies, stopped investing altogether which reduced potential economic growth. The mining industry declined. Thousands of jobs were lost despite South Africa having significant deposits of platinum, gold and iron ore. For South Africa’s economy to grow it needs to address major infrastructure issues. Also, in disadvantaged communities the education system is weak contributing to a skills shortage and a rise in the unemployment rate to 27% (see Fig. 1.2). Increased production is further hindered by restrictive trade union practices. 28 27 unemployment 26 rate % 25 24 23 2009 2011 2013 2015 2017 2019 Fig. 1.2 South Africa’s unemployment rate 3.50 3.00 2.50 2.00 % of GDP 1.50 1.00 0.50 0 2009 2011 2013 2015 2017 Fig. 1.3 South Africa’s foreign direct investment (FDI) net inflows An analyst said: ‘A critical reason for low economic growth has been a lack of private sector investment and FDI (see Fig. 1.3). The lack of investment wasn’t just due to the political policies but also to uncertainty and mismanagement which led to continued inequalities.’ Sources: The Daily Telegraph, 6 July 2019 and ceicdata.com (a) Describe what is meant by economic equality and distinguish it from equity. [3] (b) Define what is meant by actual economic growth and analyse the relationship between economic growth and unemployment as illustrated by Fig. 1.1 and Fig. 1.2. [5] (c) Assess the evidence provided about the significance of the performance of the state-owned electricity monopoly as a contributor to the decline in South Africa’s economy. [5] (d) Evaluate whether attracting investment and managing uncertainty are the most effective ways to improve the prospects for South Africa’s economy. [7]
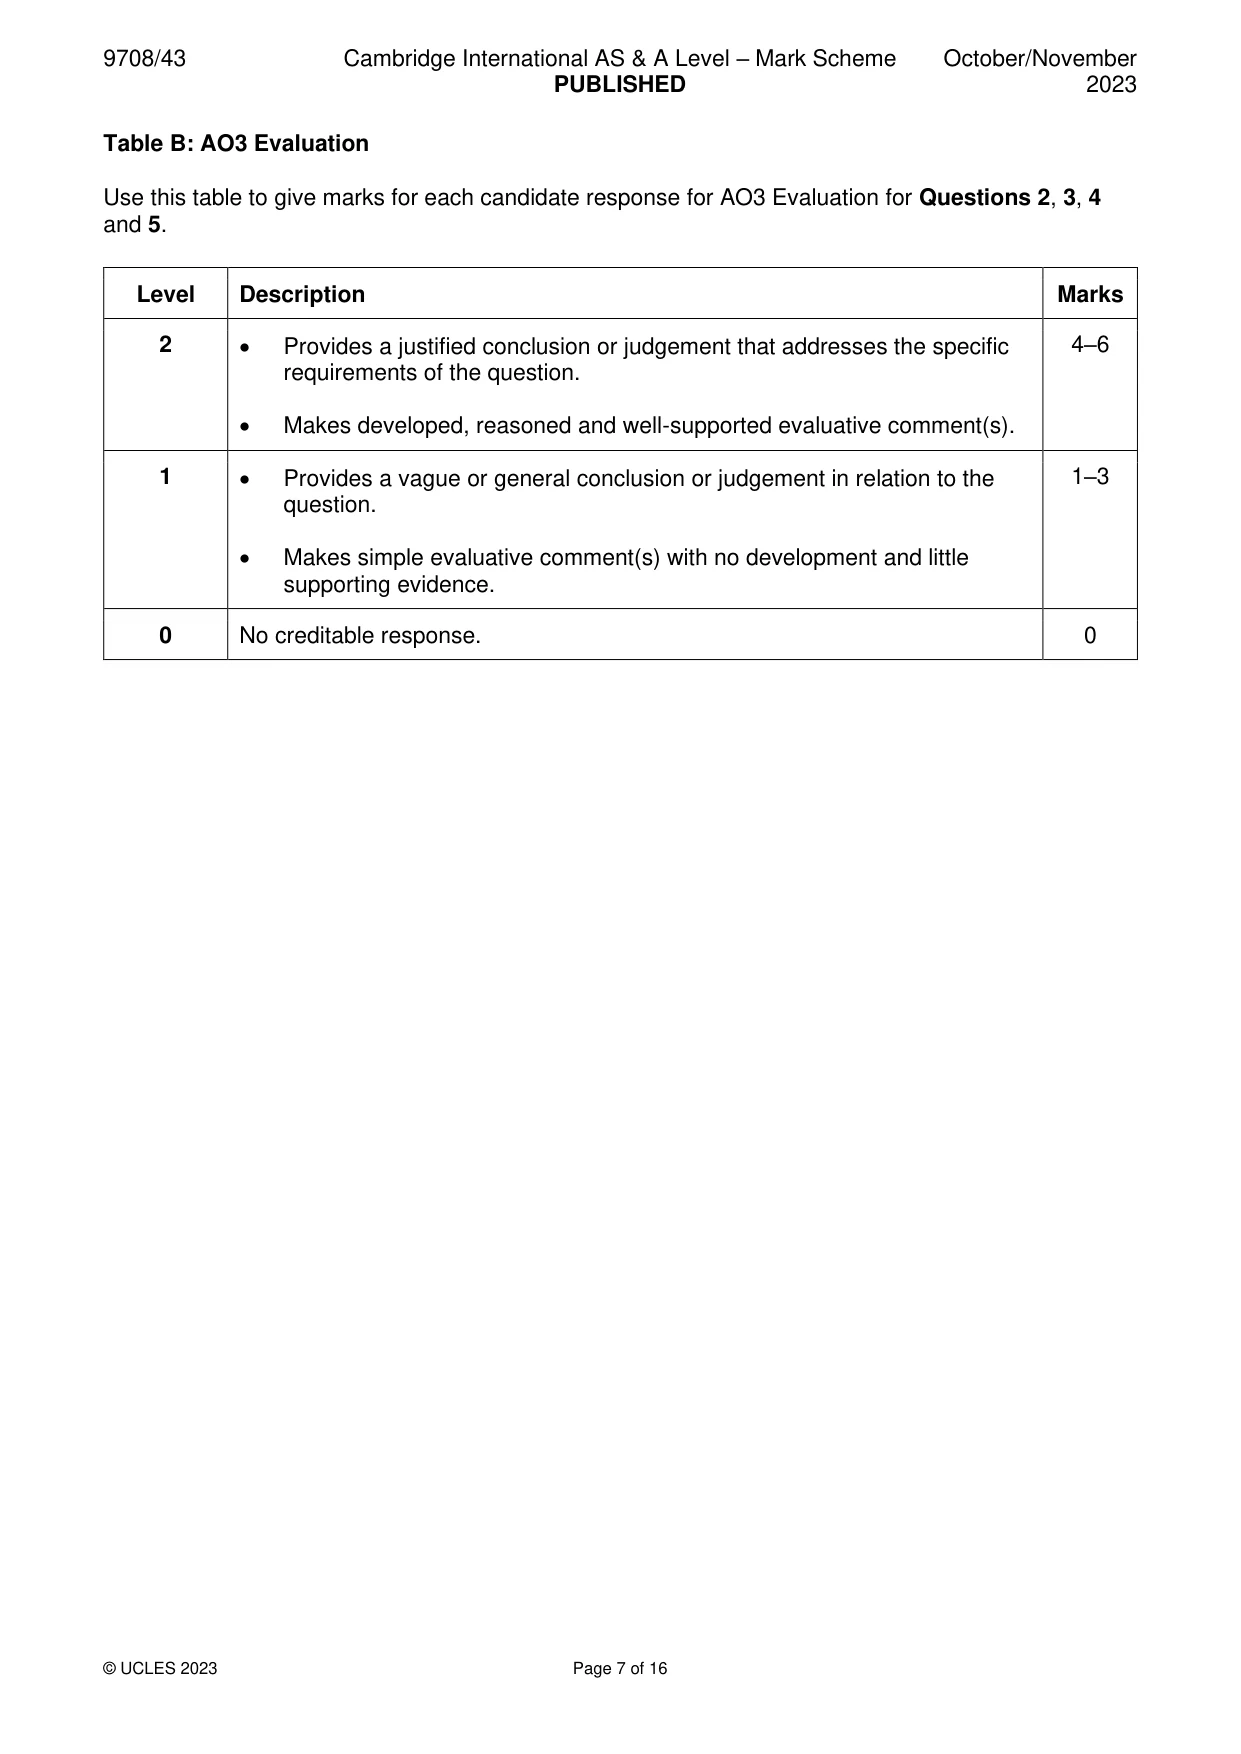
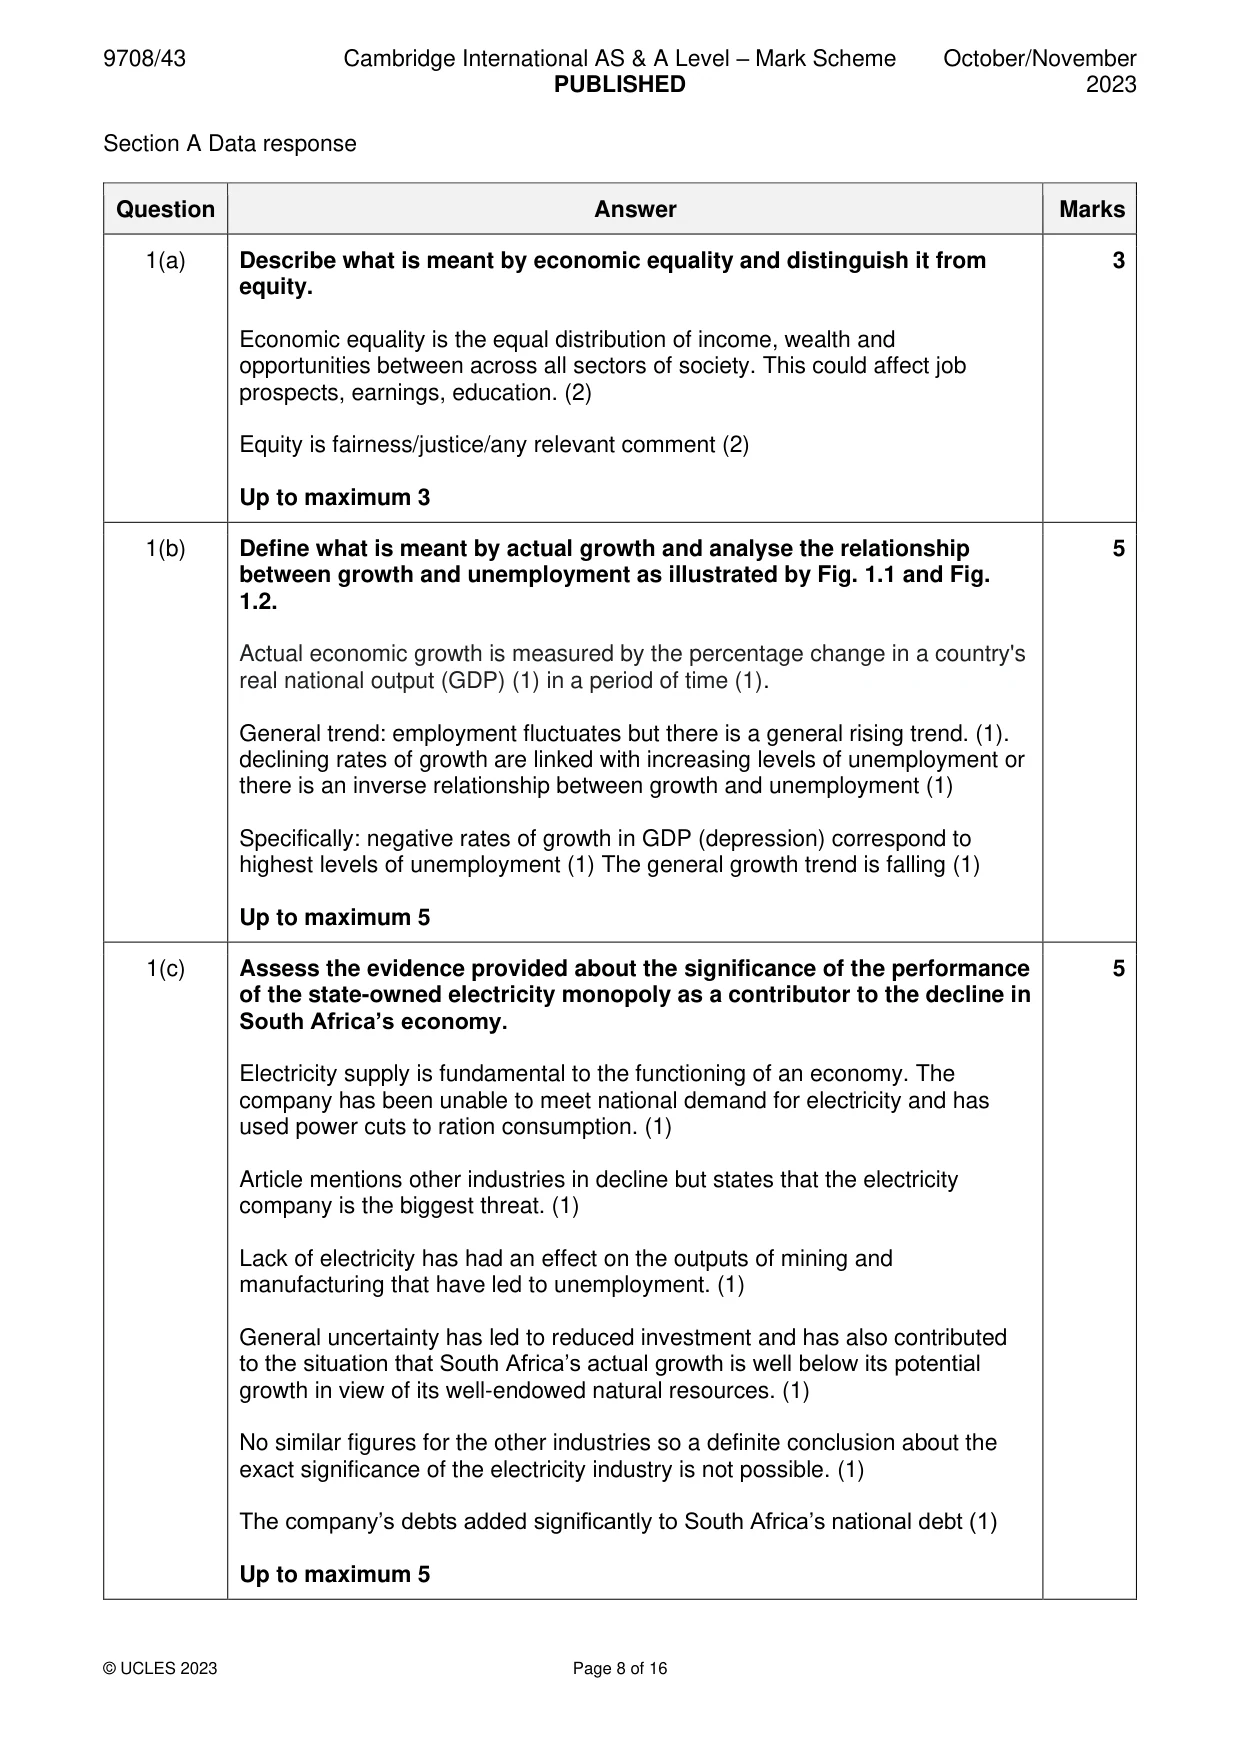
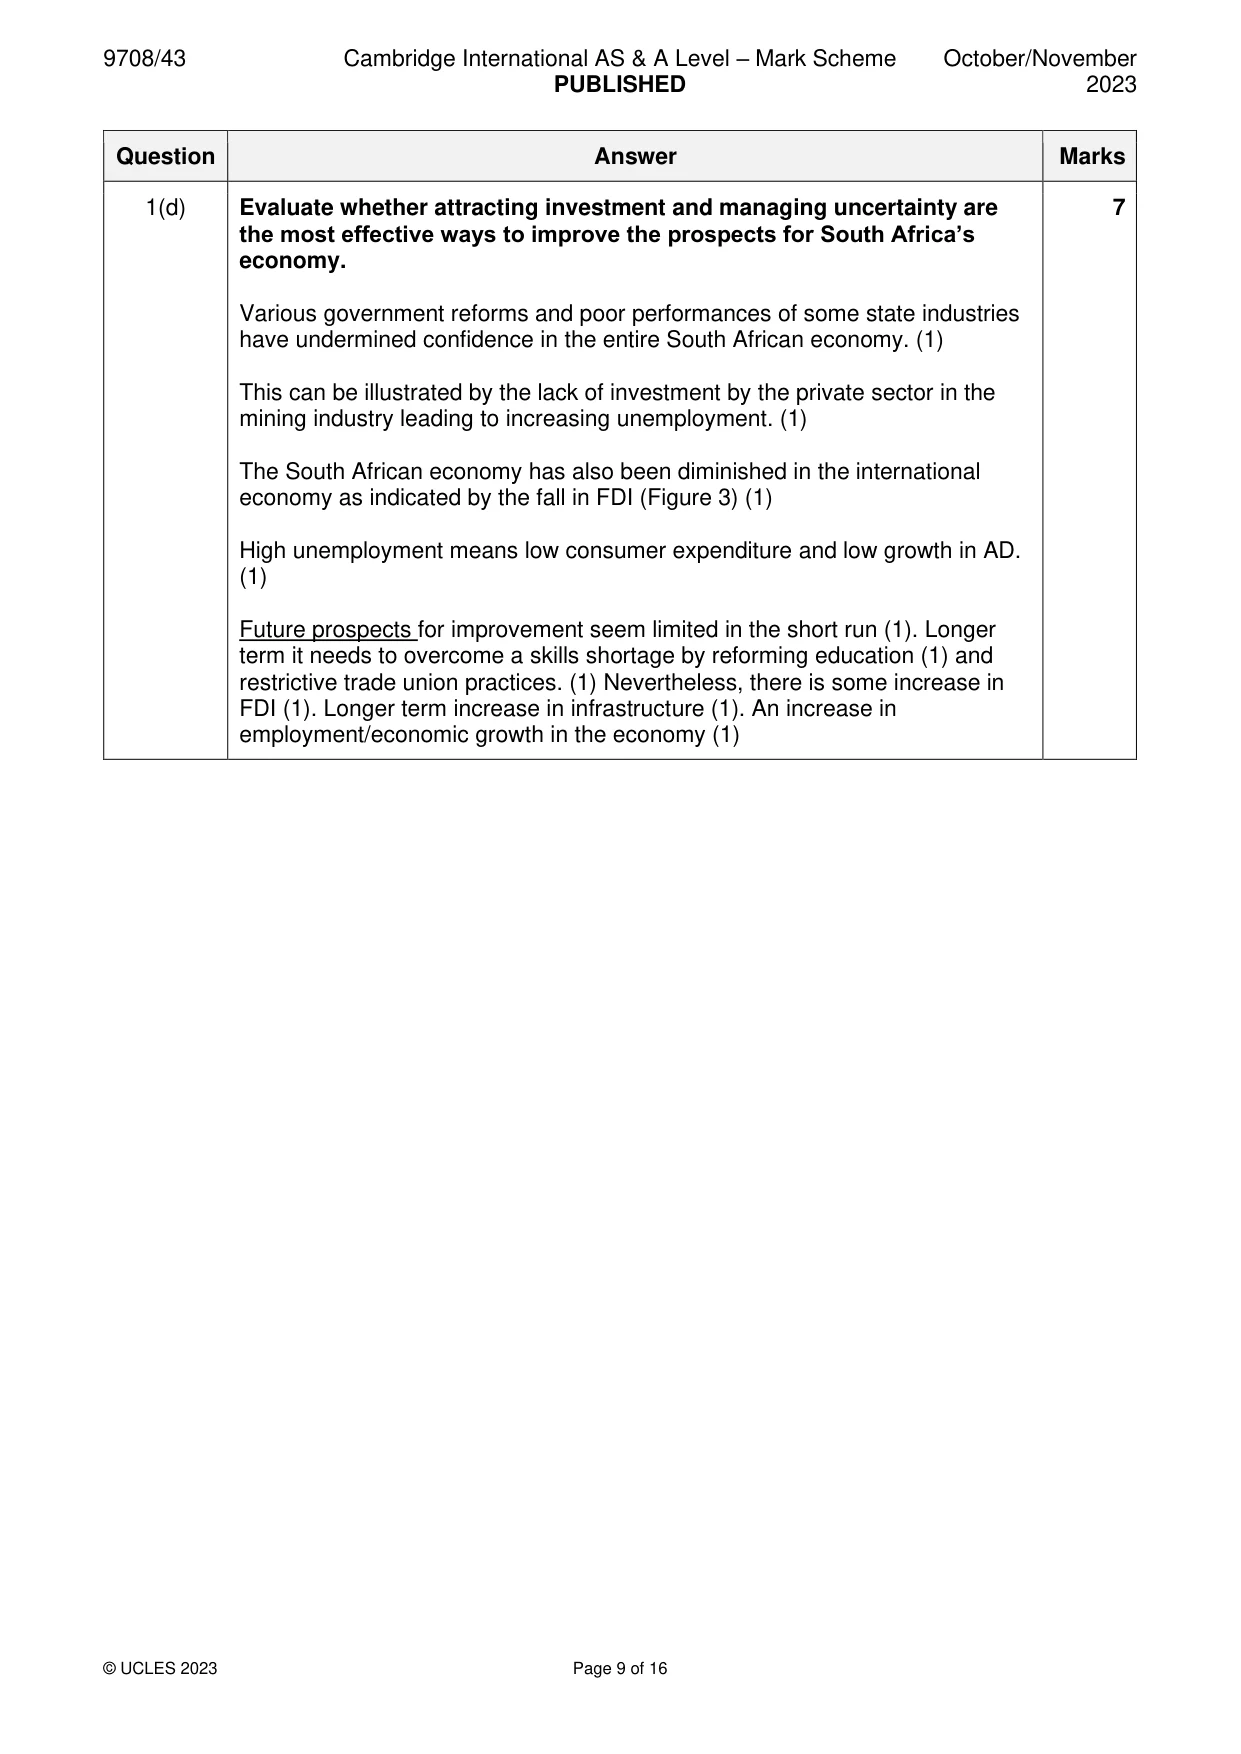
Mark scheme: Question Answer Marks 1(a) Describe what is meant by economic equality and distinguish it from 3 equity. Economic equality is the equal distribution of income, wealth and opportunities between across all sectors of society. This could affect job prospects, earnings, education. (2) Equity is fairness/justice/any relevant comment (2) Up to maximum 3 1(b) Define what is meant by actual growth and analyse the relationship 5 between growth and unemployment as illustrated by Fig. 1.1 and Fig. 1.2. Actual economic growth is measured by the percentage change in a country's real national output (GDP) (1) in a period of time (1). General trend: employment fluctuates but there is a general rising trend. (1). declining rates of growth are linked with increasing levels of unemployment or there is an inverse relationship between growth and unemployment (1) Specifically: negative rates of growth in GDP (depression) correspond to highest levels of unemployment (1) The general growth trend is falling (1) Up to maximum 5 1(c) Assess the evidence provided about the significance of the performance 5 of the state-owned electricity monopoly as a contributor to the decline in South Africa’s economy. Electricity supply is fundamental to the functioning of an economy. The company has been unable to meet national demand for electricity and has used power cuts to ration consumption. (1) Article mentions other industries in decline but states that the electricity company is the biggest threat. (1) Lack of electricity has had an effect on the outputs of mining and manufacturing that have led to unemployment. (1) General uncertainty has led to reduced investment and has also contributed to the situation that South Africa’s actual growth is well below its potential growth in view of its well-endowed natural resources. (1) No similar figures for the other industries so a definite conclusion about the exact significance of the electricity industry is not possible. (1) The company’s debts added significantly to South Africa’s national debt (1) Up to maximum 5 1(d) Evaluate whether attracting investment and managing uncertainty are 7 the most effective ways to improve the prospects for South Africa’s economy. Various government reforms and poor performances of some state industries have undermined confidence in the entire South African economy. (1) This can be illustrated by the lack of investment by the private sector in the mining industry leading to increasing unemployment. (1) The South African economy has also been diminished in the international economy as indicated by the fall in FDI (Figure 3) (1) High unemployment means low consumer expenditure and low growth in AD. (1) Future prospects for improvement seem limited in the short run (1). Longer term it needs to overcome a skills shortage by reforming education (1) and restrictive trade union practices. (1) Nevertheless, there is some increase in FDI (1). Longer term increase in infrastructure (1). An increase in employment/economic growth in the economy (1)
More questions on Effectiveness of policy options to meet all macroeconomic objectives
Q2 · Pollution is caused when consumers or producers make decisions based on self-interest
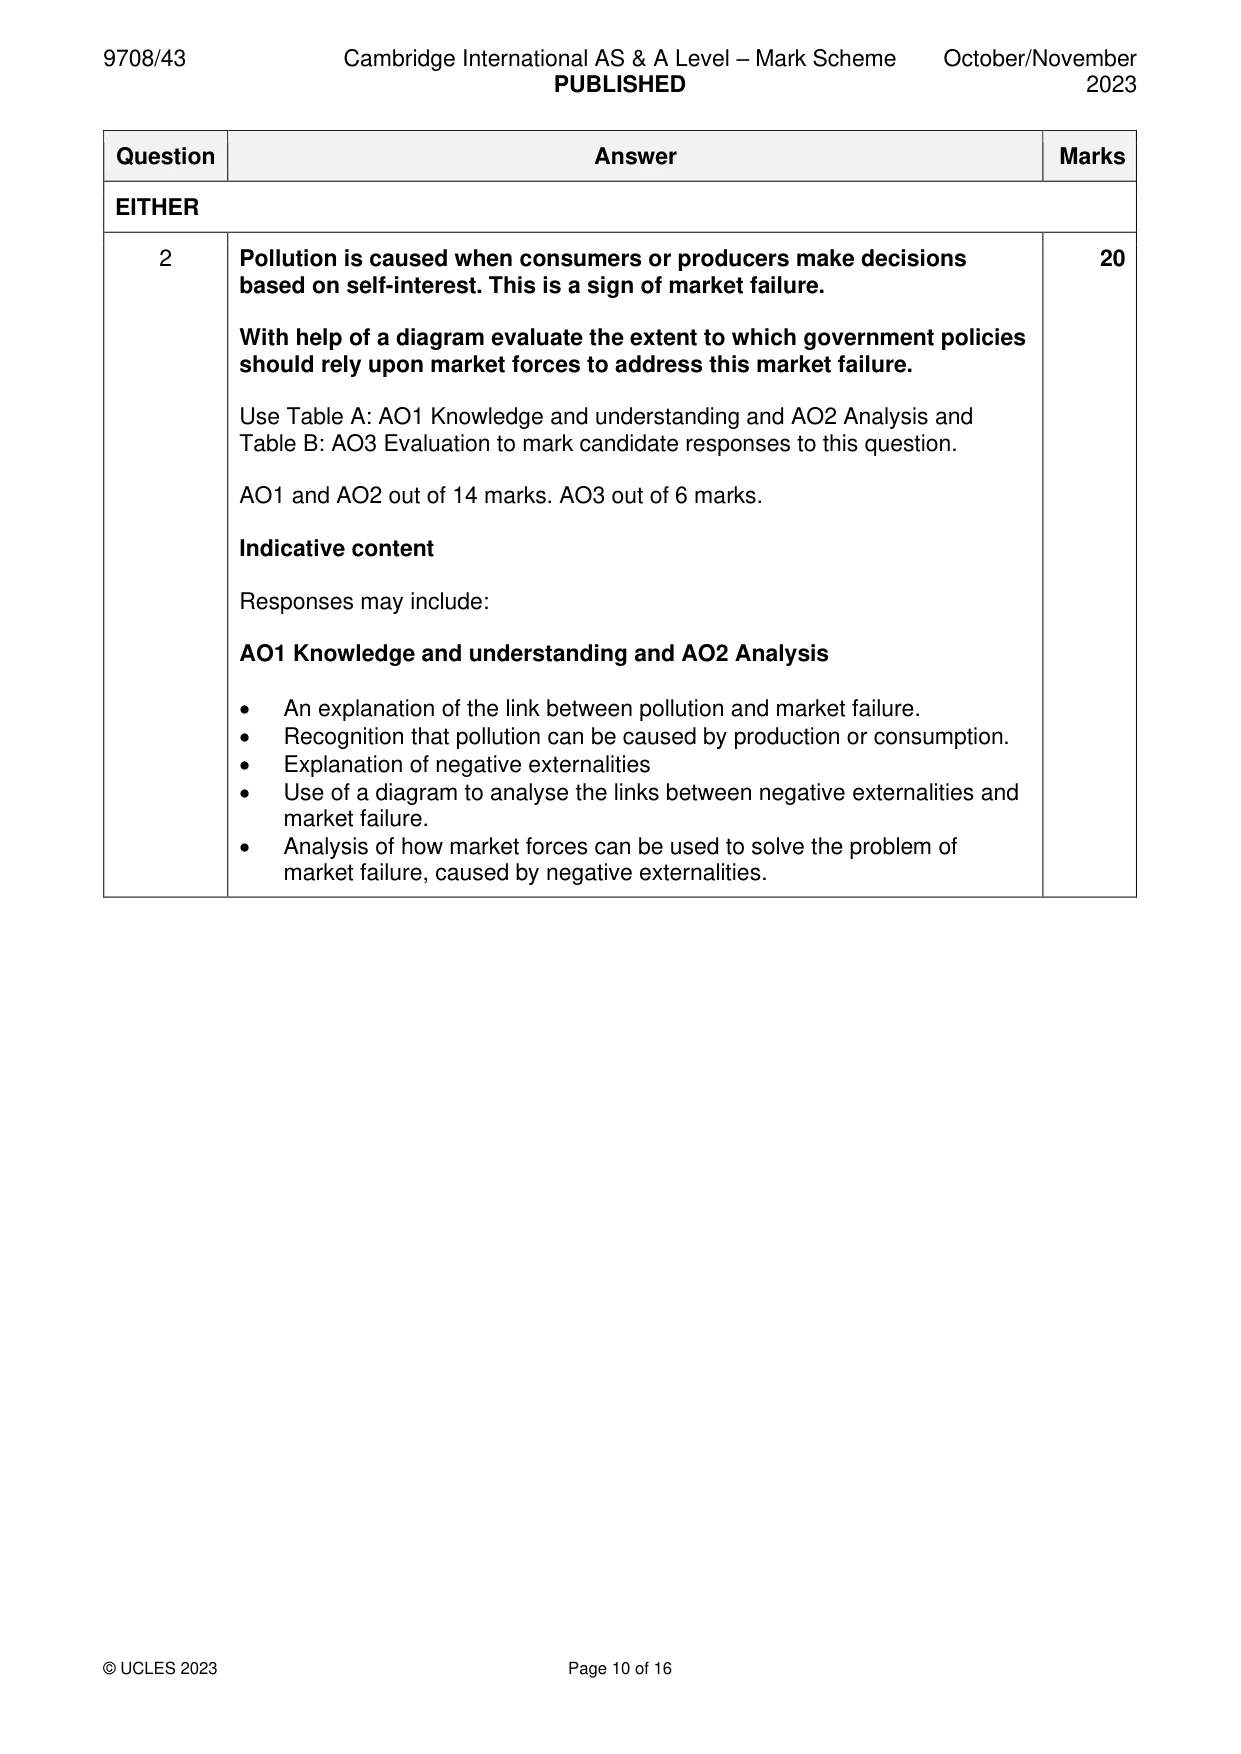
2 Pollution is caused when consumers or producers make decisions based on self-interest. This is a sign of market failure. With the help of a diagram, evaluate the extent to which government policies should rely upon market forces to address this market failure. [20] OR
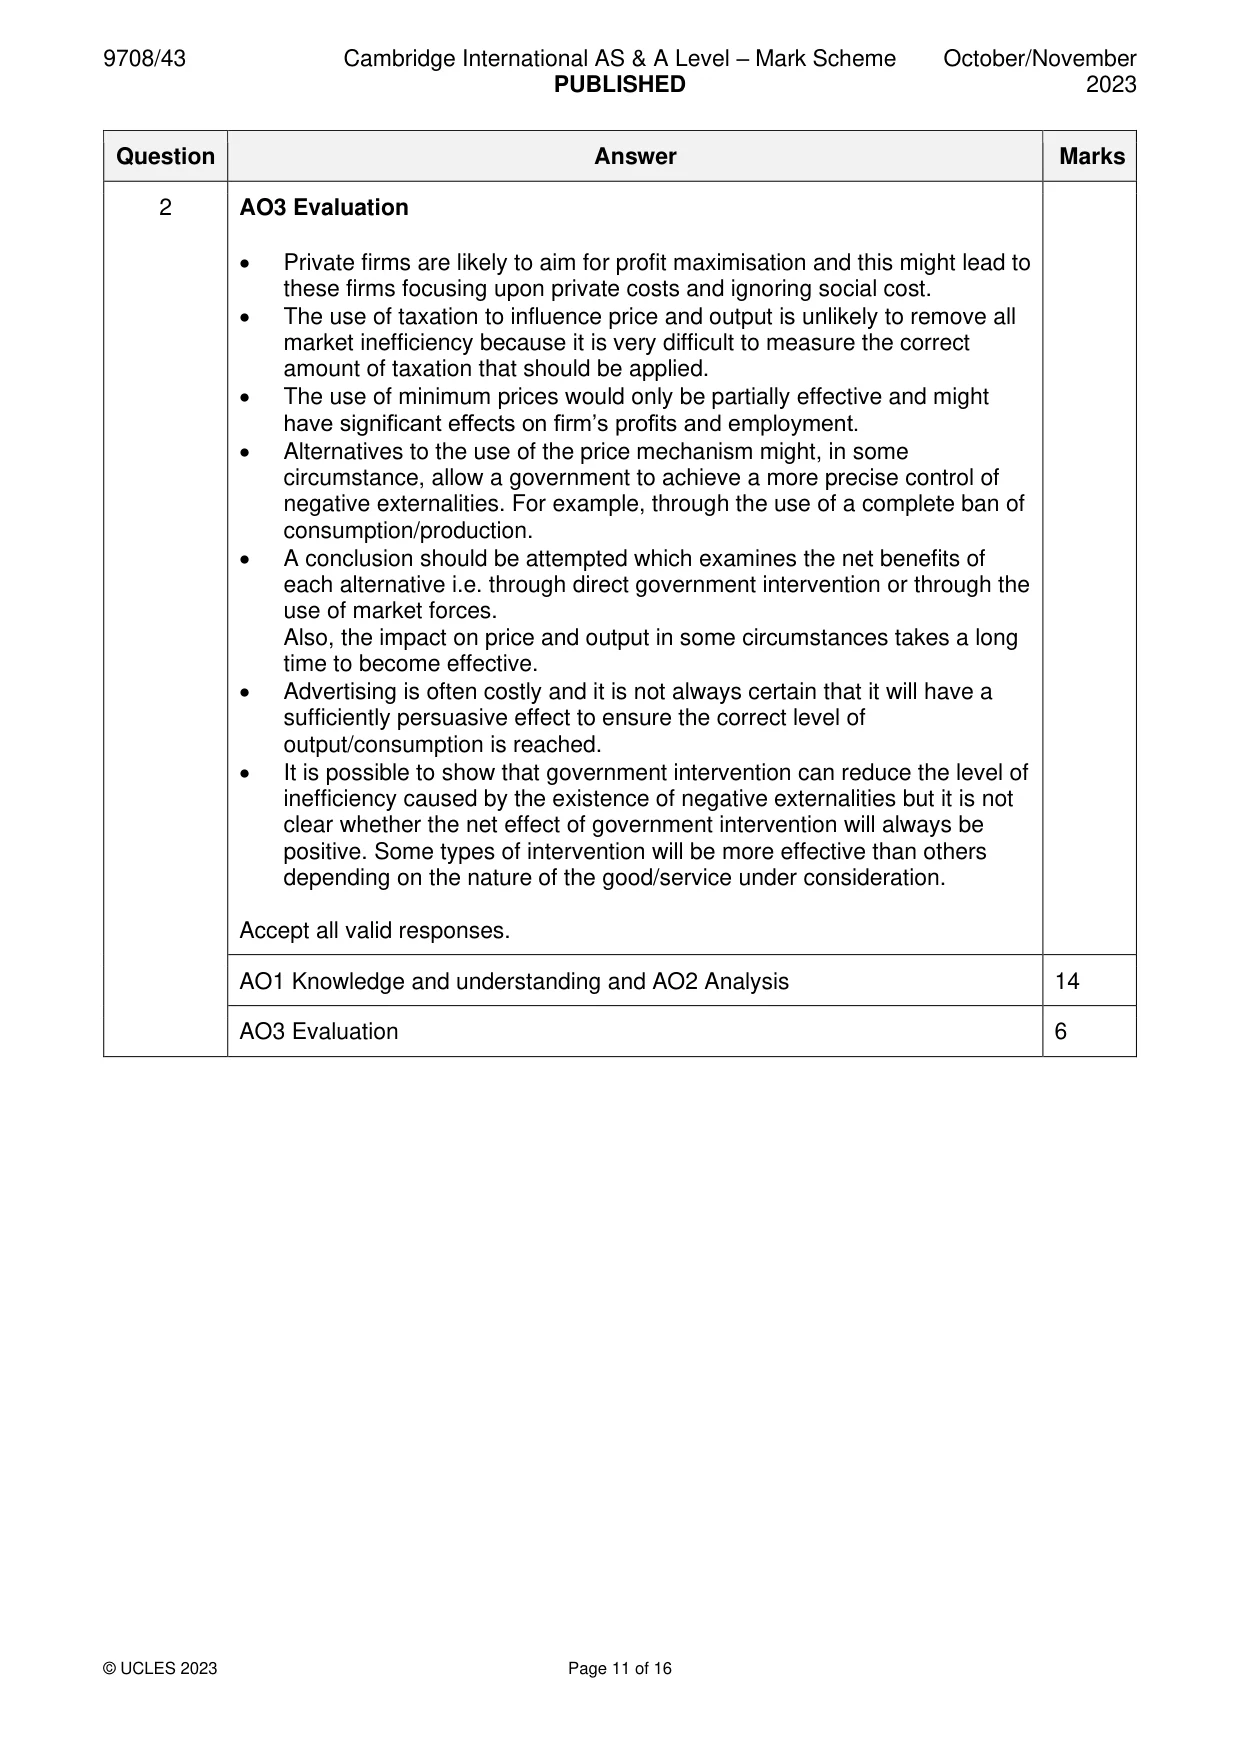
Mark scheme: 2 Pollution is caused when consumers or producers make decisions 20 based on self-interest. This is a sign of market failure. With help of a diagram evaluate the extent to which government policies should rely upon market forces to address this market failure. Use Table A: AO1 Knowledge and understanding and AO2 Analysis and Table B: AO3 Evaluation to mark candidate responses to this question. AO1 and AO2 out of 14 marks. AO3 out of 6 marks. Indicative content Responses may include: AO1 Knowledge and understanding and AO2 Analysis • An explanation of the link between pollution and market failure. • Recognition that pollution can be caused by production or consumption. • Explanation of negative externalities • Use of a diagram to analyse the links between negative externalities and market failure. • Analysis of how market forces can be used to solve the problem of market failure, caused by negative externalities. 2 AO3 Evaluation • Private firms are likely to aim for profit maximisation and this might lead to these firms focusing upon private costs and ignoring social cost. • The use of taxation to influence price and output is unlikely to remove all market inefficiency because it is very difficult to measure the correct amount of taxation that should be applied. • The use of minimum prices would only be partially effective and might have significant effects on firm’s profits and employment. • Alternatives to the use of the price mechanism might, in some circumstance, allow a government to achieve a more precise control of negative externalities. For example, through the use of a complete ban of consumption/production. • A conclusion should be attempted which examines the net benefits of each alternative i.e. through direct government intervention or through the use of market forces. Also, the impact on price and output in some circumstances takes a long time to become effective. • Advertising is often costly and it is not always certain that it will have a sufficiently persuasive effect to ensure the correct level of output/consumption is reached. • It is possible to show that government intervention can reduce the level of inefficiency caused by the existence of negative externalities but it is not clear whether the net effect of government intervention will always be positive. Some types of intervention will be more effective than others depending on the nature of the good/service under consideration. Accept all valid responses. AO1 Knowledge and understanding and AO2 Analysis 14 AO3 Evaluation 6
Q3 · Evaluate the view that monopolistically competitive firms will always charge lower prices…
3 Evaluate the view that monopolistically competitive firms will always charge lower prices and operate more efficiently than a monopoly firm. [20] Section C Answer one question. EITHER
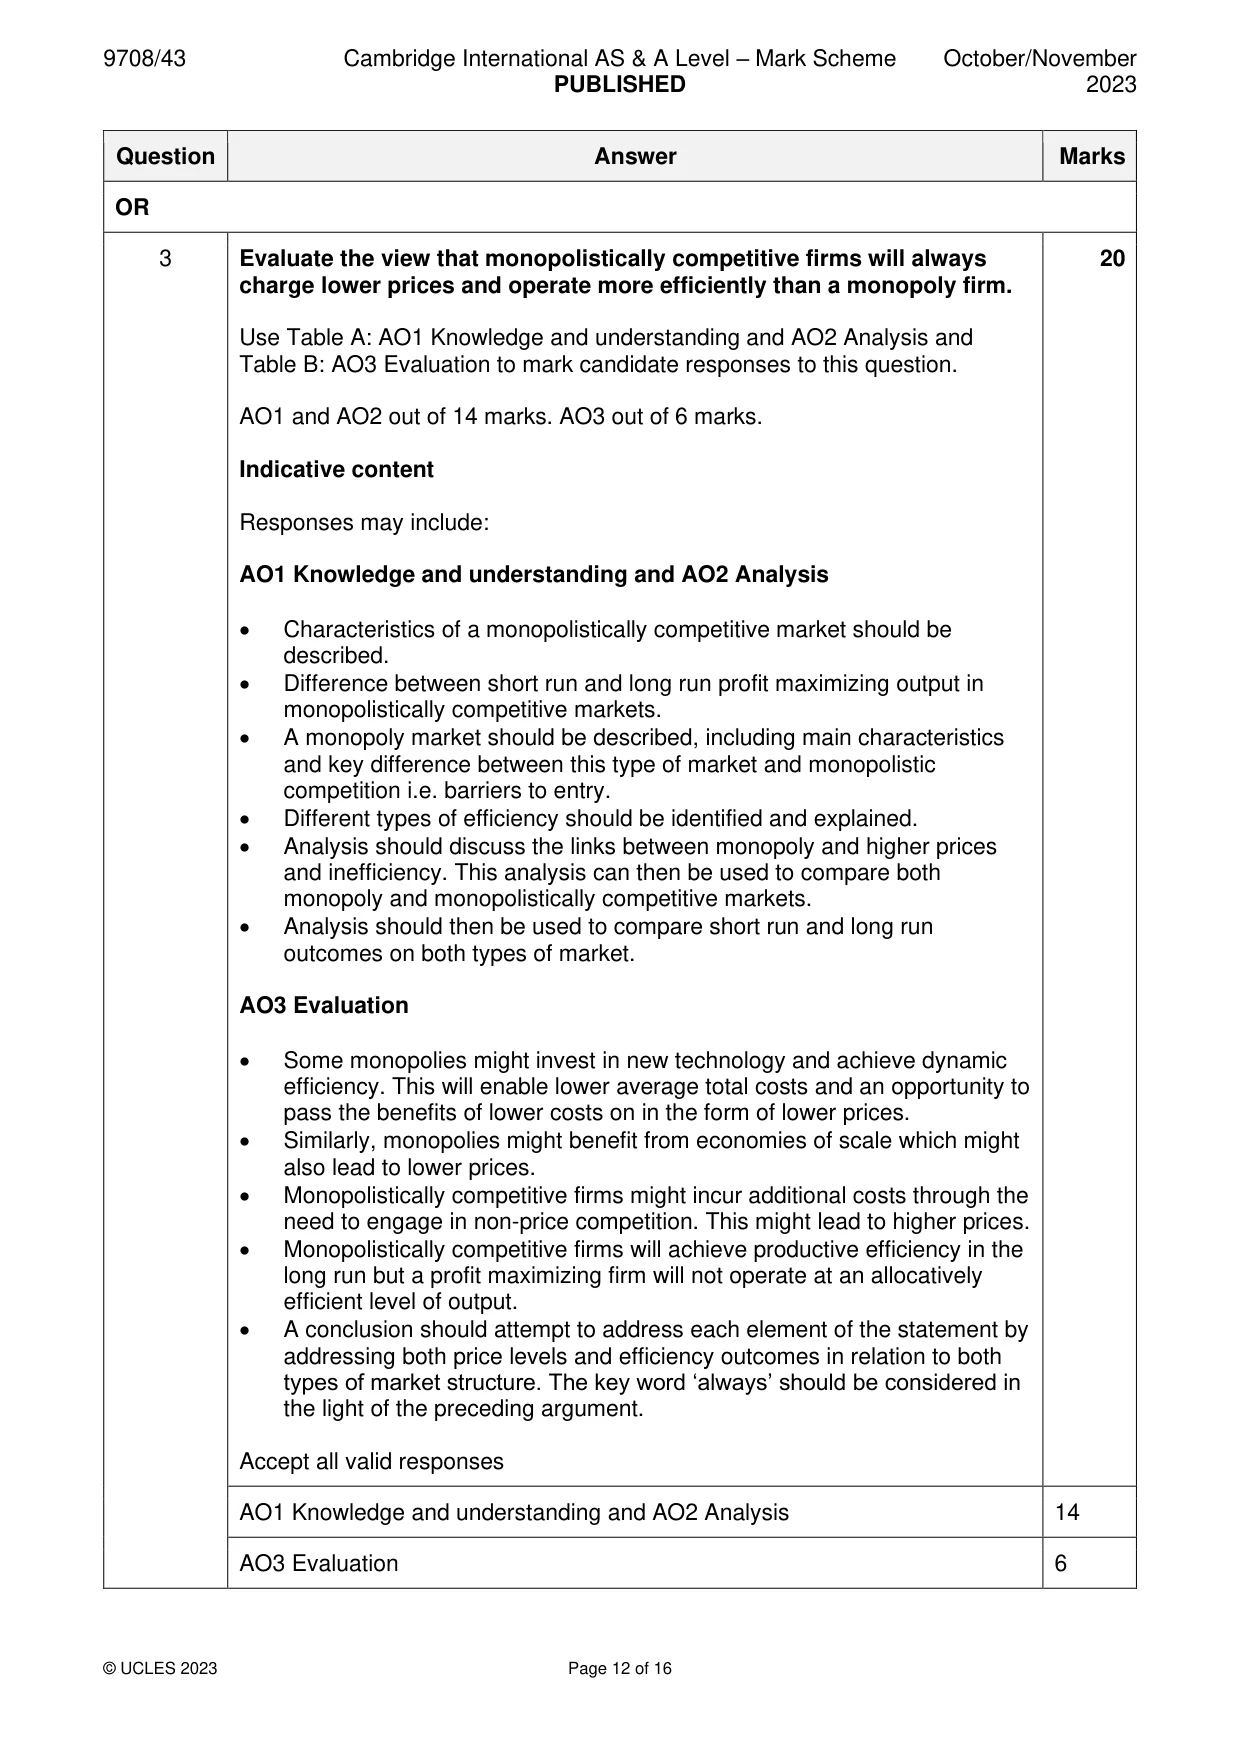
Mark scheme: 3 Evaluate the view that monopolistically competitive firms will always 20 charge lower prices and operate more efficiently than a monopoly firm. Use Table A: AO1 Knowledge and understanding and AO2 Analysis and Table B: AO3 Evaluation to mark candidate responses to this question. AO1 and AO2 out of 14 marks. AO3 out of 6 marks. Indicative content Responses may include: AO1 Knowledge and understanding and AO2 Analysis • Characteristics of a monopolistically competitive market should be described. • Difference between short run and long run profit maximizing output in monopolistically competitive markets. • A monopoly market should be described, including main characteristics and key difference between this type of market and monopolistic competition i.e. barriers to entry. • Different types of efficiency should be identified and explained. • Analysis should discuss the links between monopoly and higher prices and inefficiency. This analysis can then be used to compare both monopoly and monopolistically competitive markets. • Analysis should then be used to compare short run and long run outcomes on both types of market. AO3 Evaluation • Some monopolies might invest in new technology and achieve dynamic efficiency. This will enable lower average total costs and an opportunity to pass the benefits of lower costs on in the form of lower prices. • Similarly, monopolies might benefit from economies of scale which might also lead to lower prices. • Monopolistically competitive firms might incur additional costs through the need to engage in non-price competition. This might lead to higher prices. • Monopolistically competitive firms will achieve productive efficiency in the long run but a profit maximizing firm will not operate at an allocatively efficient level of output. • A conclusion should attempt to address each element of the statement by addressing both price levels and efficiency outcomes in relation to both types of market structure. The key word ‘always’ should be considered in the light of the preceding argument. Accept all valid responses AO1 Knowledge and understanding and AO2 Analysis 14 AO3 Evaluation 6
Q4 · With the help of a diagram, assess the effectiveness of using fiscal policy to close a…
4 With the help of a diagram, assess the effectiveness of using fiscal policy to close a negative output gap in an economy [20] OR
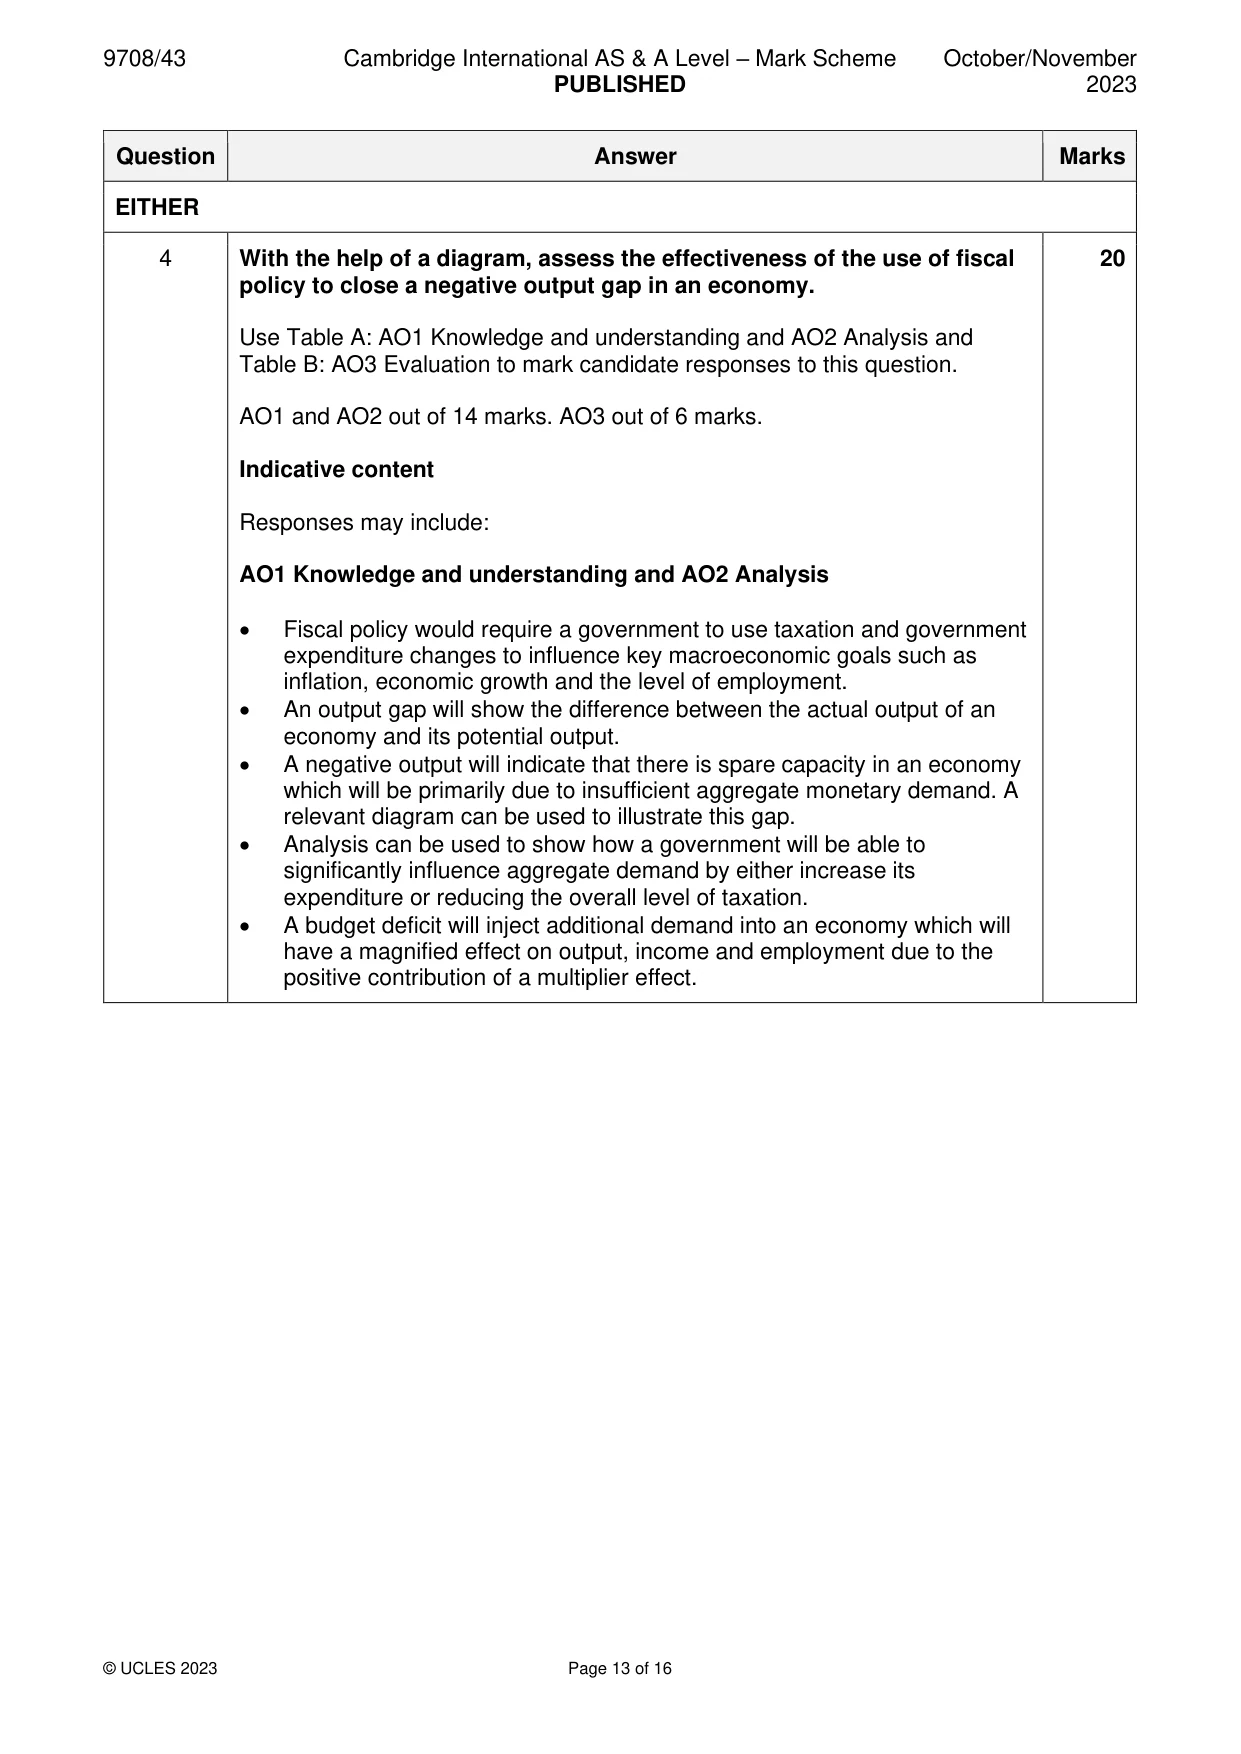
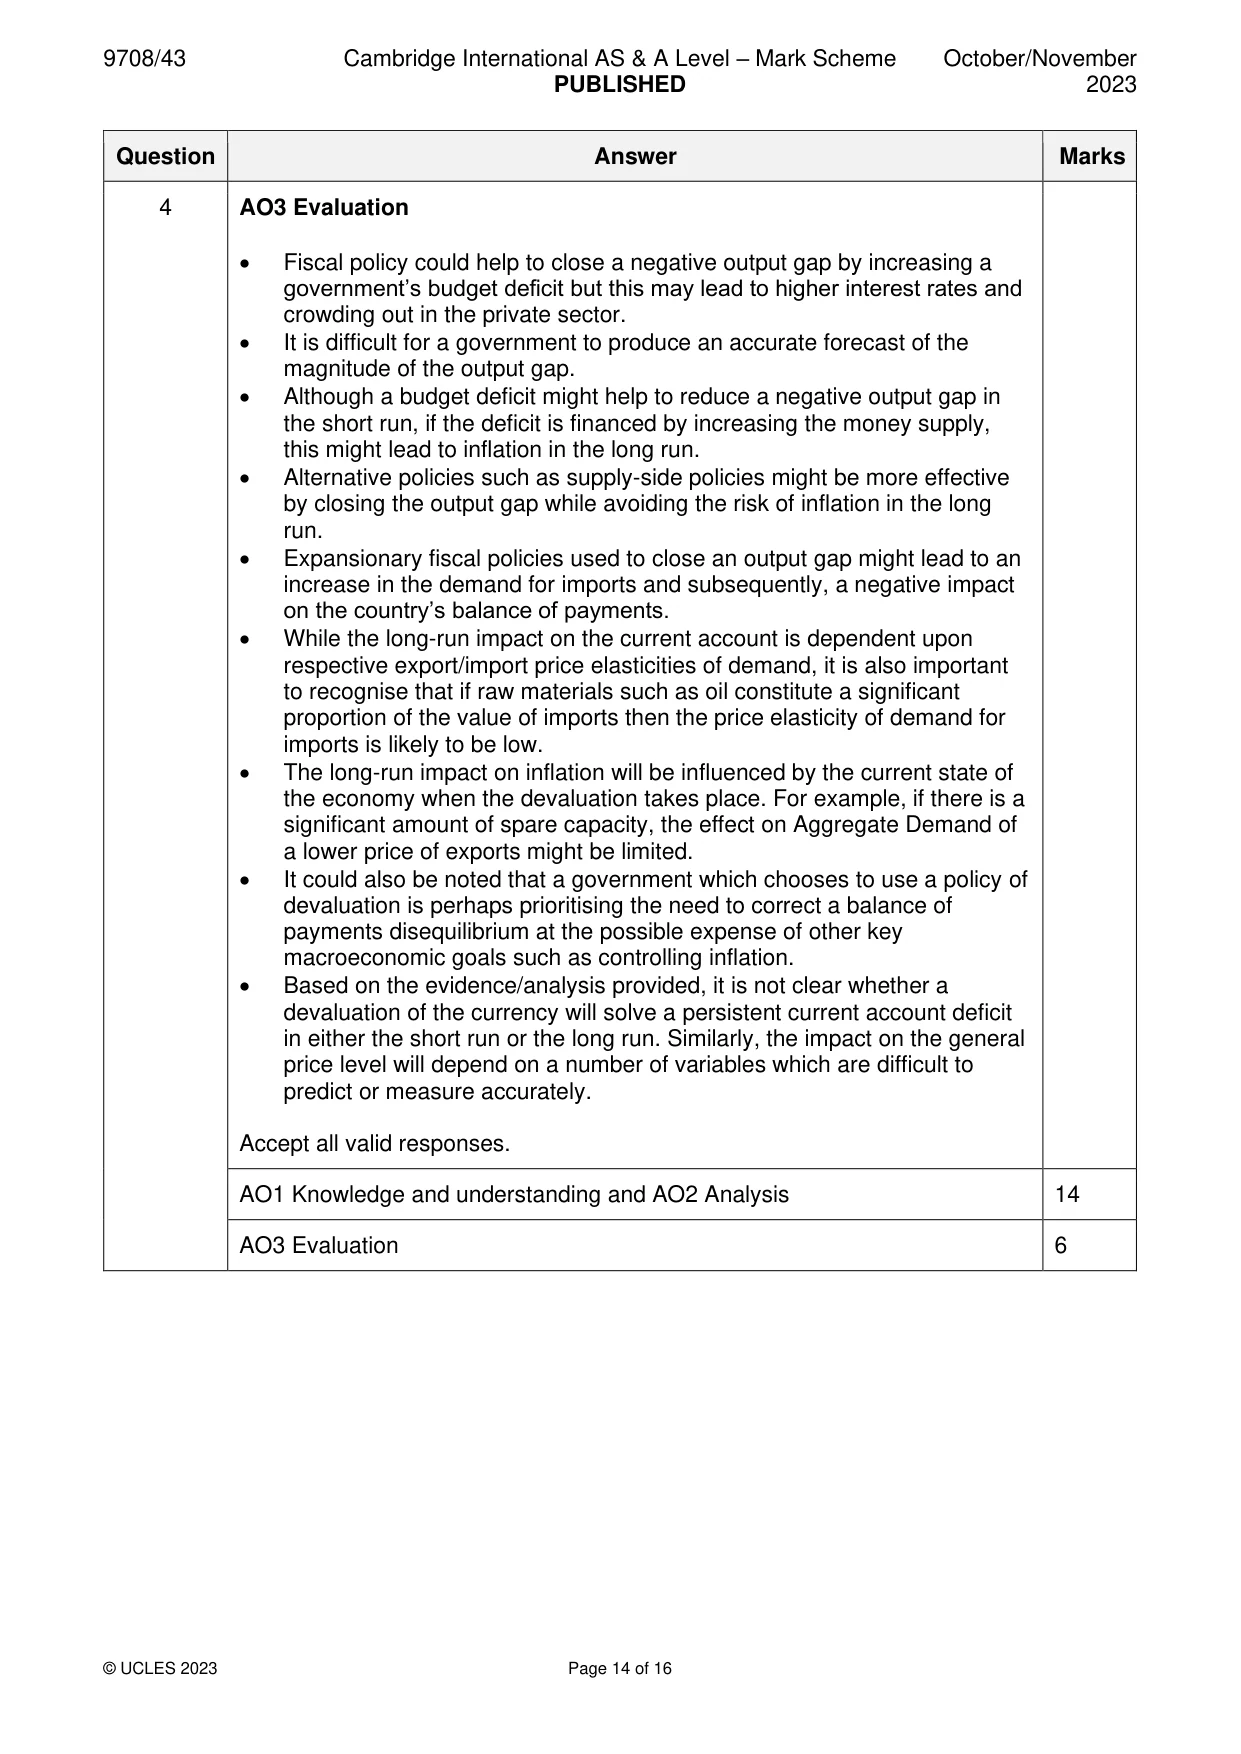
Mark scheme: 4 With the help of a diagram, assess the effectiveness of the use of fiscal 20 policy to close a negative output gap in an economy. Use Table A: AO1 Knowledge and understanding and AO2 Analysis and Table B: AO3 Evaluation to mark candidate responses to this question. AO1 and AO2 out of 14 marks. AO3 out of 6 marks. Indicative content Responses may include: AO1 Knowledge and understanding and AO2 Analysis • Fiscal policy would require a government to use taxation and government expenditure changes to influence key macroeconomic goals such as inflation, economic growth and the level of employment. • An output gap will show the difference between the actual output of an economy and its potential output. • A negative output will indicate that there is spare capacity in an economy which will be primarily due to insufficient aggregate monetary demand. A relevant diagram can be used to illustrate this gap. • Analysis can be used to show how a government will be able to significantly influence aggregate demand by either increase its expenditure or reducing the overall level of taxation. • A budget deficit will inject additional demand into an economy which will have a magnified effect on output, income and employment due to the positive contribution of a multiplier effect. 4 AO3 Evaluation • Fiscal policy could help to close a negative output gap by increasing a government’s budget deficit but this may lead to higher interest rates and crowding out in the private sector. • It is difficult for a government to produce an accurate forecast of the magnitude of the output gap. • Although a budget deficit might help to reduce a negative output gap in the short run, if the deficit is financed by increasing the money supply, this might lead to inflation in the long run. • Alternative policies such as supply-side policies might be more effective by closing the output gap while avoiding the risk of inflation in the long run. • Expansionary fiscal policies used to close an output gap might lead to an increase in the demand for imports and subsequently, a negative impact on the country’s balance of payments. • While the long-run impact on the current account is dependent upon respective export/import price elasticities of demand, it is also important to recognise that if raw materials such as oil constitute a significant proportion of the value of imports then the price elasticity of demand for imports is likely to be low. • The long-run impact on inflation will be influenced by the current state of the economy when the devaluation takes place. For example, if there is a significant amount of spare capacity, the effect on Aggregate Demand of a lower price of exports might be limited. • It could also be noted that a government which chooses to use a policy of devaluation is perhaps prioritising the need to correct a balance of payments disequilibrium at the possible expense of other key macroeconomic goals such as controlling inflation. • Based on the evidence/analysis provided, it is not clear whether a devaluation of the currency will solve a persistent current account deficit in either the short run or the long run. Similarly, the impact on the general price level will depend on a number of variables which are difficult to predict or measure accurately. Accept all valid responses. AO1 Knowledge and understanding and AO2 Analysis 14 AO3 Evaluation 6
What was in this paper
The subtopics covered by these 4 questions, and how many questions each got. Open one in a new tab to see every Cambridge question on it.
What you needed in this session
Cambridge’s own grade thresholds for 2023 Oct/Nov, Paper 4 · Variant 3. A higher threshold means an easier paper — the bar moves with how the cohort did.