Cambridge A Level Economics 9708 — 2023 May/June Paper 2 · Variant 1
9708/21/M/J/23 · 5 questions · 60 marks · ≈68 min
The question paper and its mark scheme, free to read here and free to download. This is Cambridge’s own paper, exactly as it was sat.
Question paper4 pages
Mark scheme18 pages
Answers below. Sit the paper first if you are practising.
Questions as text
Q1 · Unemployment in India Changes in the rate of unemployment in India between July 2020 and…
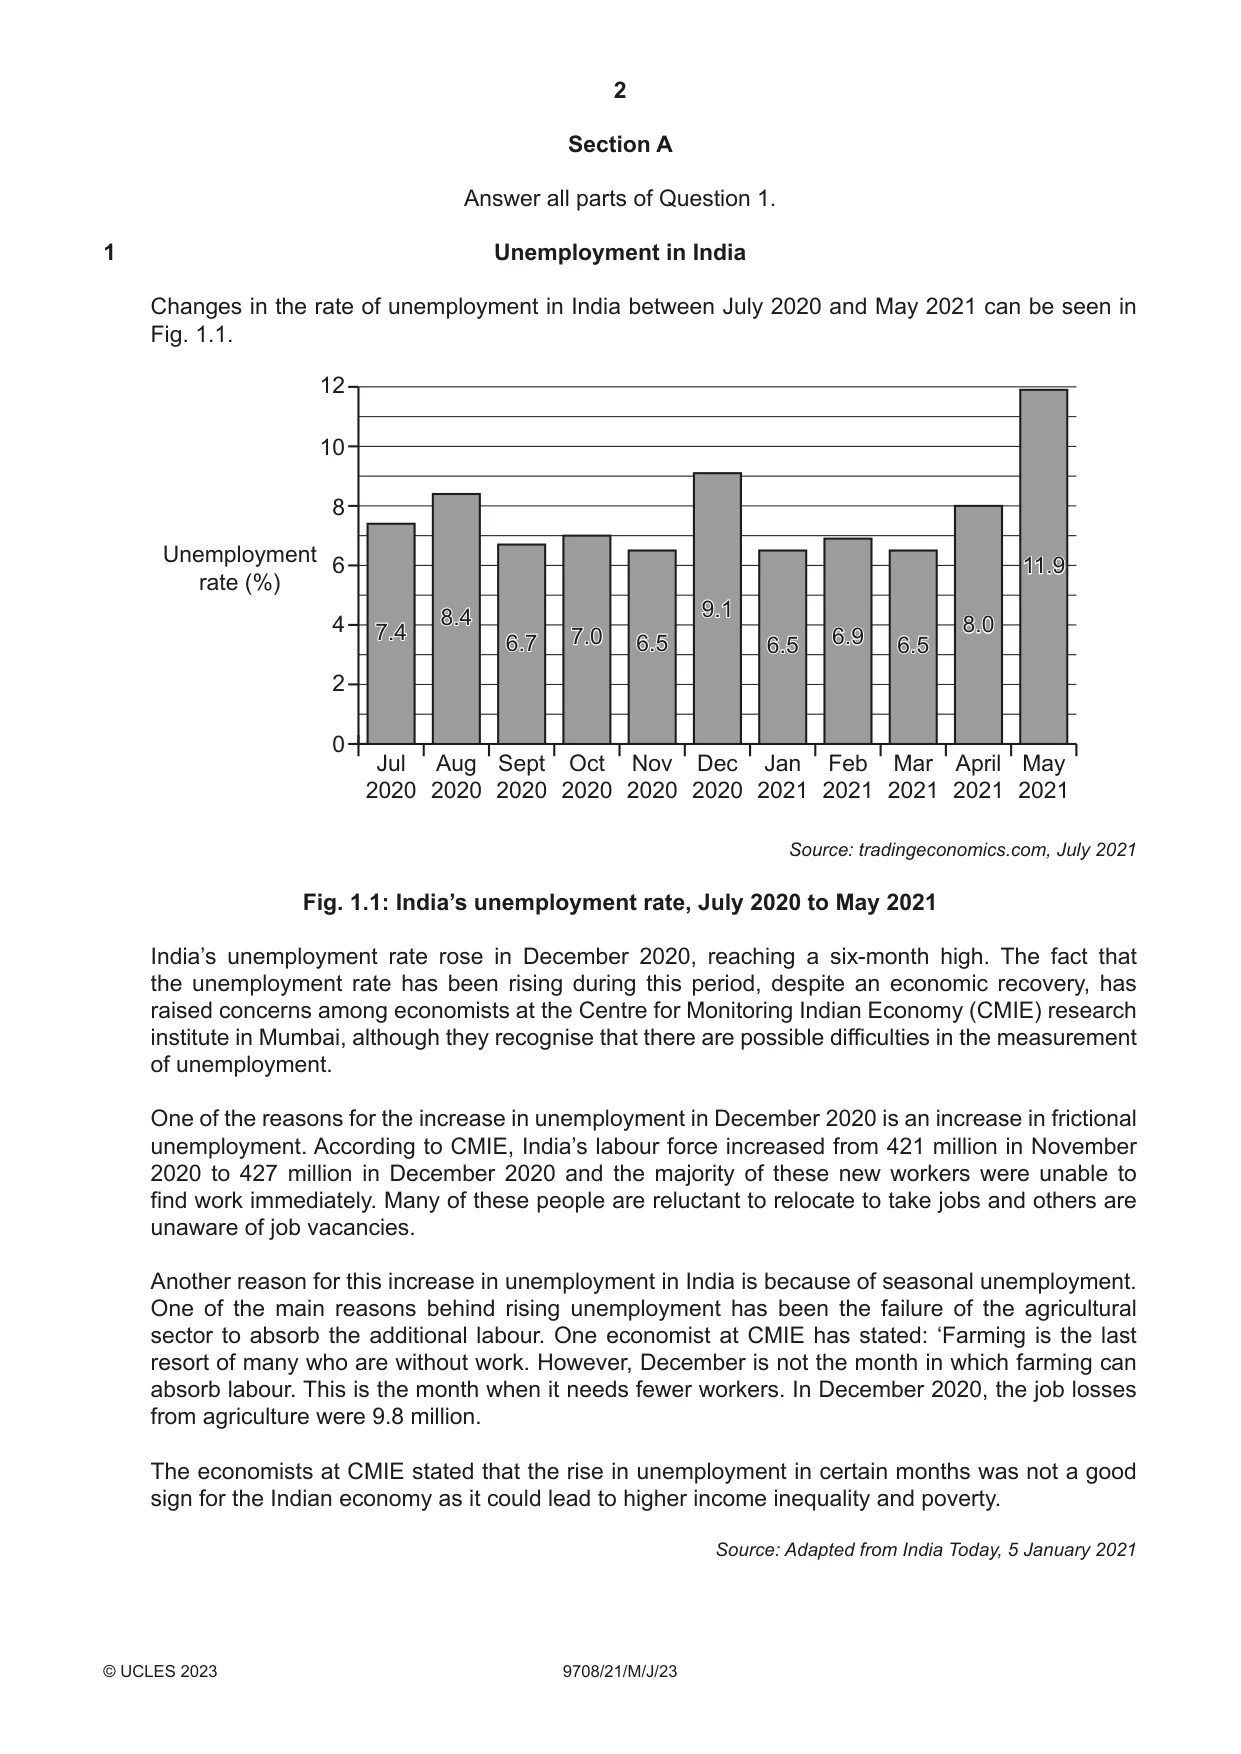
1 Unemployment in India Changes in the rate of unemployment in India between July 2020 and May 2021 can be seen in Fig. 1.1. 12 10 8 Unemployment 6 11.911.9 rate (%) 9.19.1 8.48.4 4 8.08.0 7.47.4 7.07.0 6.96.9 6.76.7 6.56.5 6.56.5 6.56.5 2 0 Jul Aug Sept Oct Nov Dec Jan Feb Mar April May 2020 2020 2020 2020 2020 2020 2021 2021 2021 2021 2021 Source: tradingeconomics.com, July 2021 Fig. 1.1: India’s unemployment rate, July 2020 to May 2021 India’s unemployment rate rose in December 2020, reaching a six-month high. The fact that the unemployment rate has been rising during this period, despite an economic recovery, has raised concerns among economists at the Centre for Monitoring Indian Economy (CMIE) research institute in Mumbai, although they recognise that there are possible difficulties in the measurement of unemployment. One of the reasons for the increase in unemployment in December 2020 is an increase in frictional unemployment. According to CMIE, India’s labour force increased from 421 million in November 2020 to 427 million in December 2020 and the majority of these new workers were unable to find work immediately. Many of these people are reluctant to relocate to take jobs and others are unaware of job vacancies. Another reason for this increase in unemployment in India is because of seasonal unemployment. One of the main reasons behind rising unemployment has been the failure of the agricultural sector to absorb the additional labour. One economist at CMIE has stated: ‘Farming is the last resort of many who are without work. However, December is not the month in which farming can absorb labour. This is the month when it needs fewer workers. In December 2020, the job losses from agriculture were 9.8 million. The economists at CMIE stated that the rise in unemployment in certain months was not a good sign for the Indian economy as it could lead to higher income inequality and poverty. Source: Adapted from India Today, 5 January 2021 (a) Using the data in Fig. 1.1, calculate the change in India’s unemployment rate between July 2020 and May 2021. [2] (b) Using the information provided, explain how agriculture caused seasonal unemployment in India in December 2020. [2] (c) Consider the extent to which difficulties may arise in the measurement of unemployment in India. [4] (d) Assess whether seasonal unemployment is likely to be a more serious problem than frictional unemployment for India’s economy. [6] (e) Assess the possible measures that could be taken to increase employment in a country such as India. [6]
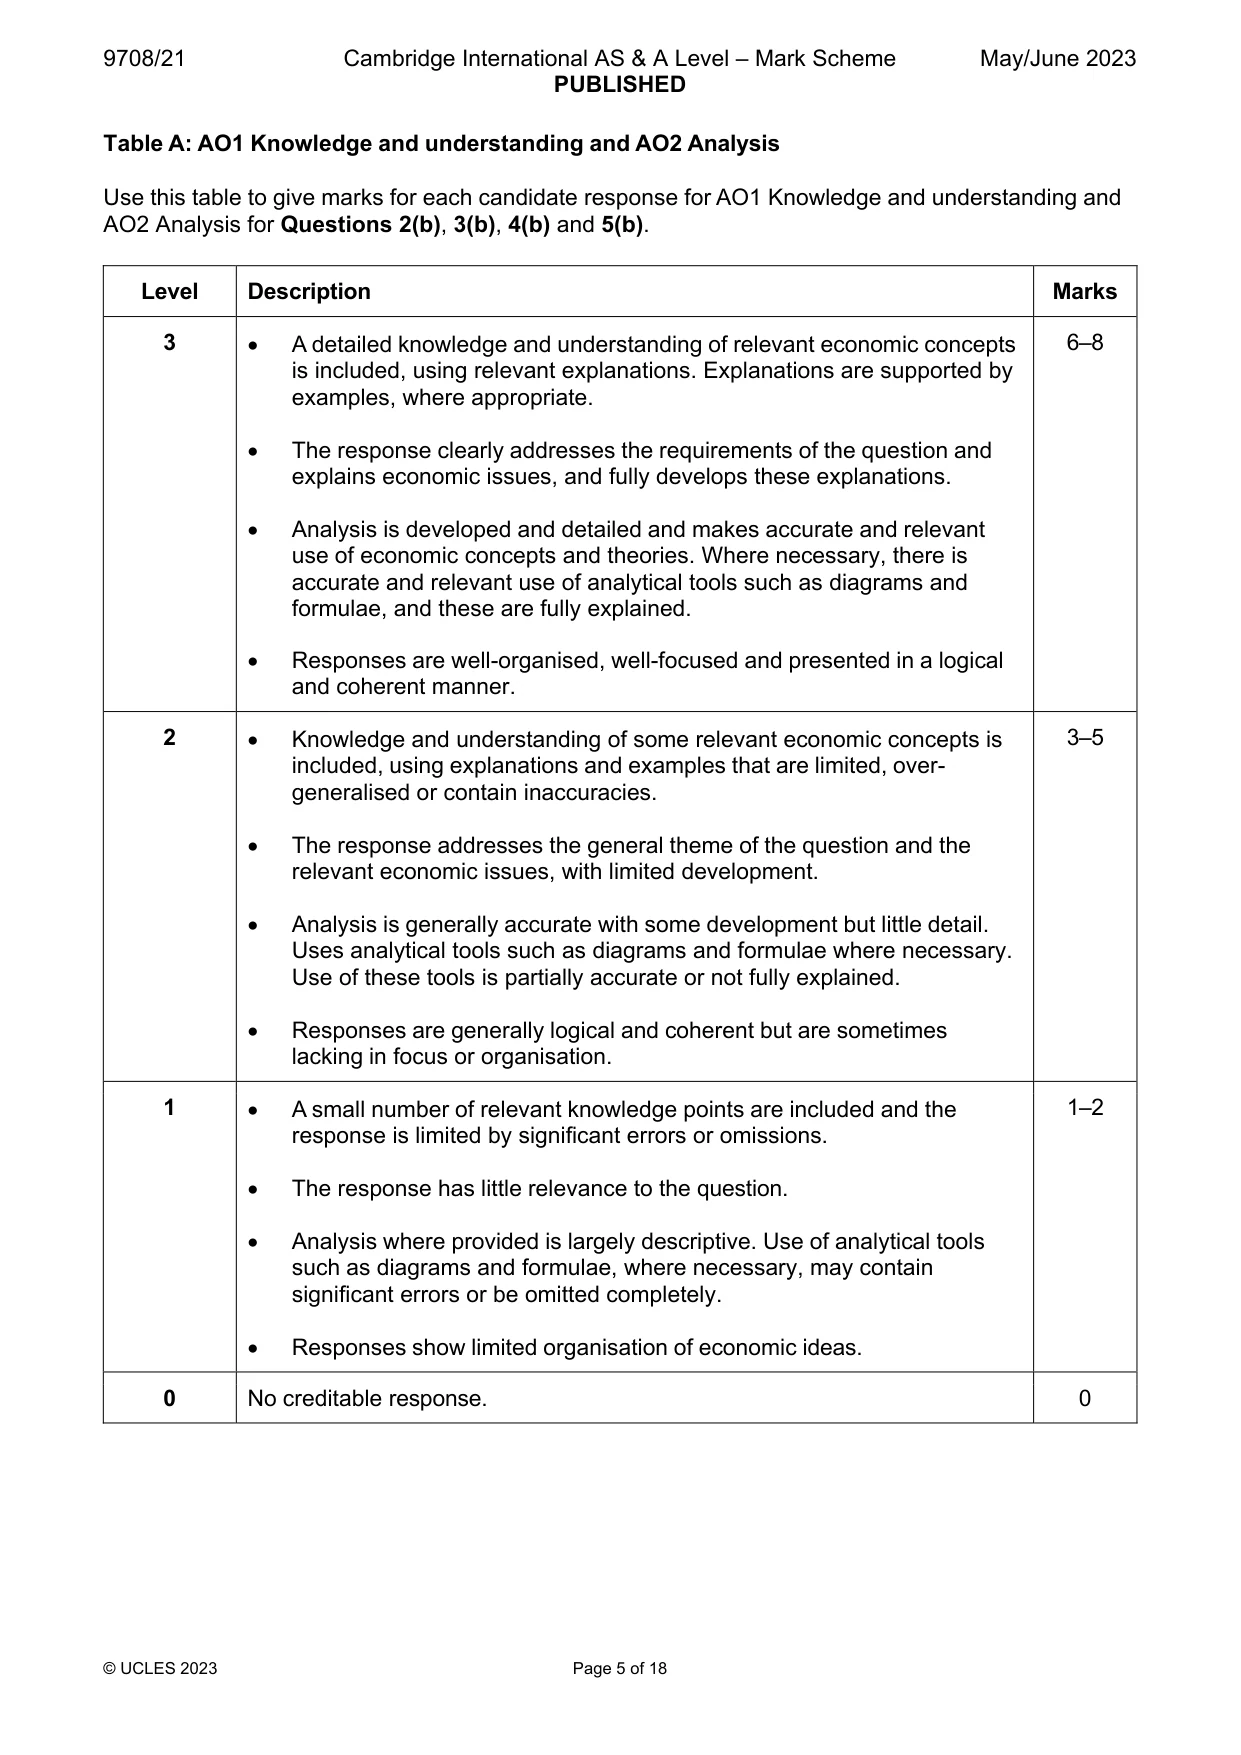
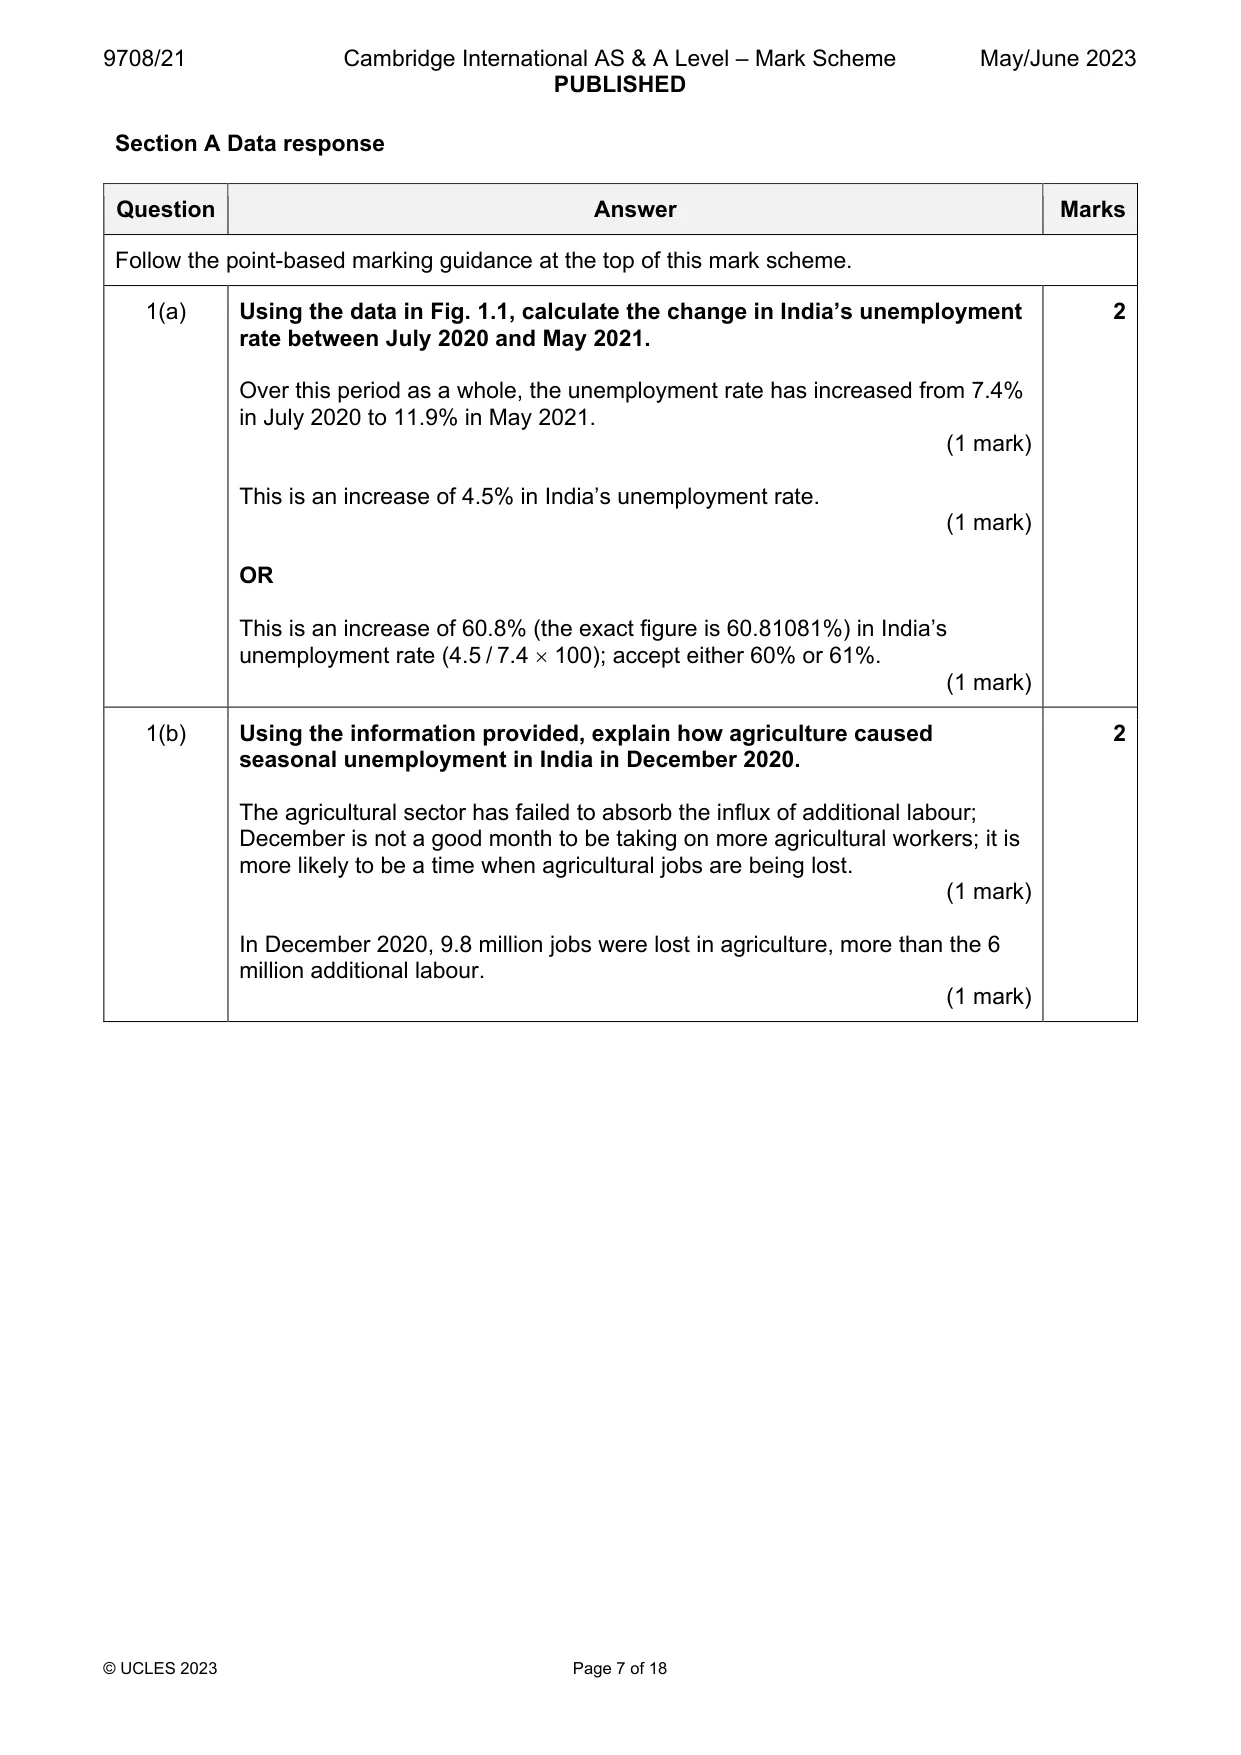
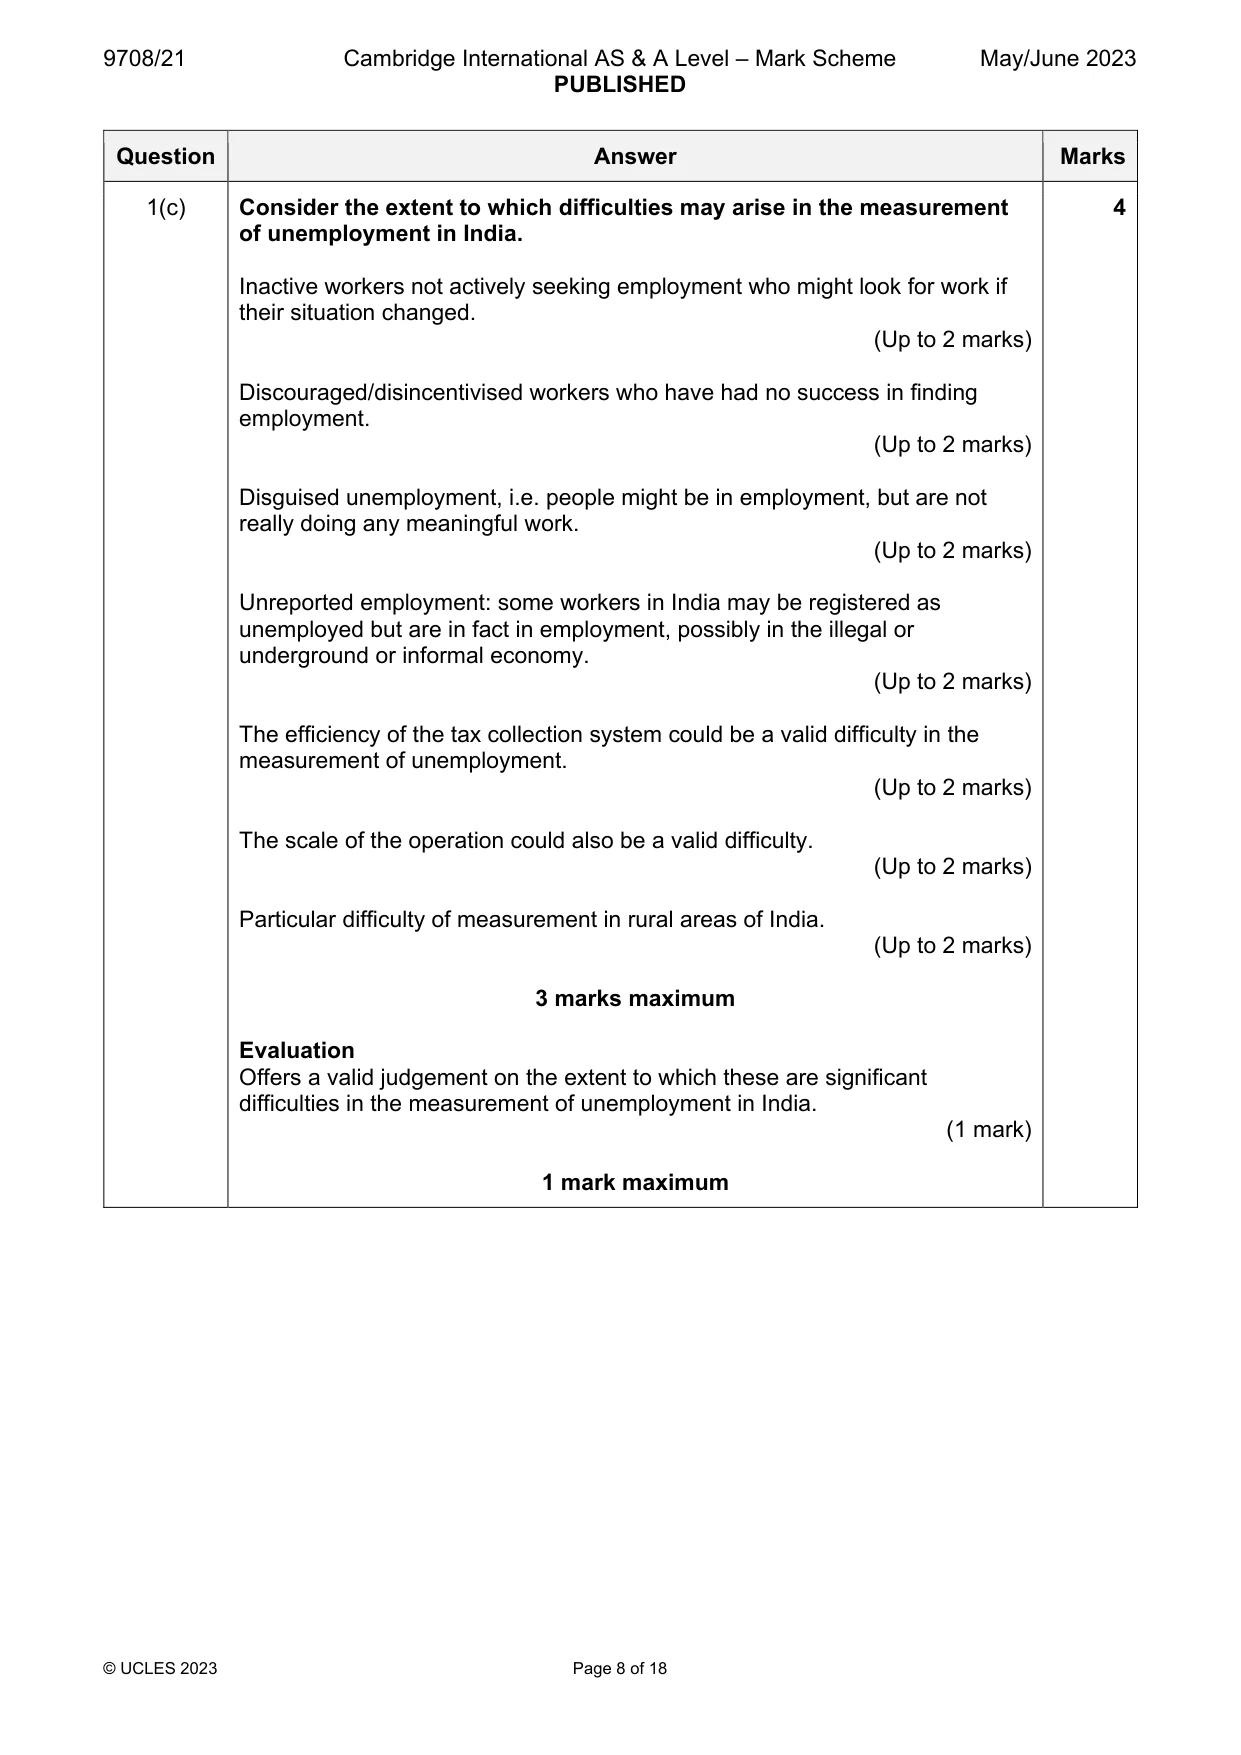
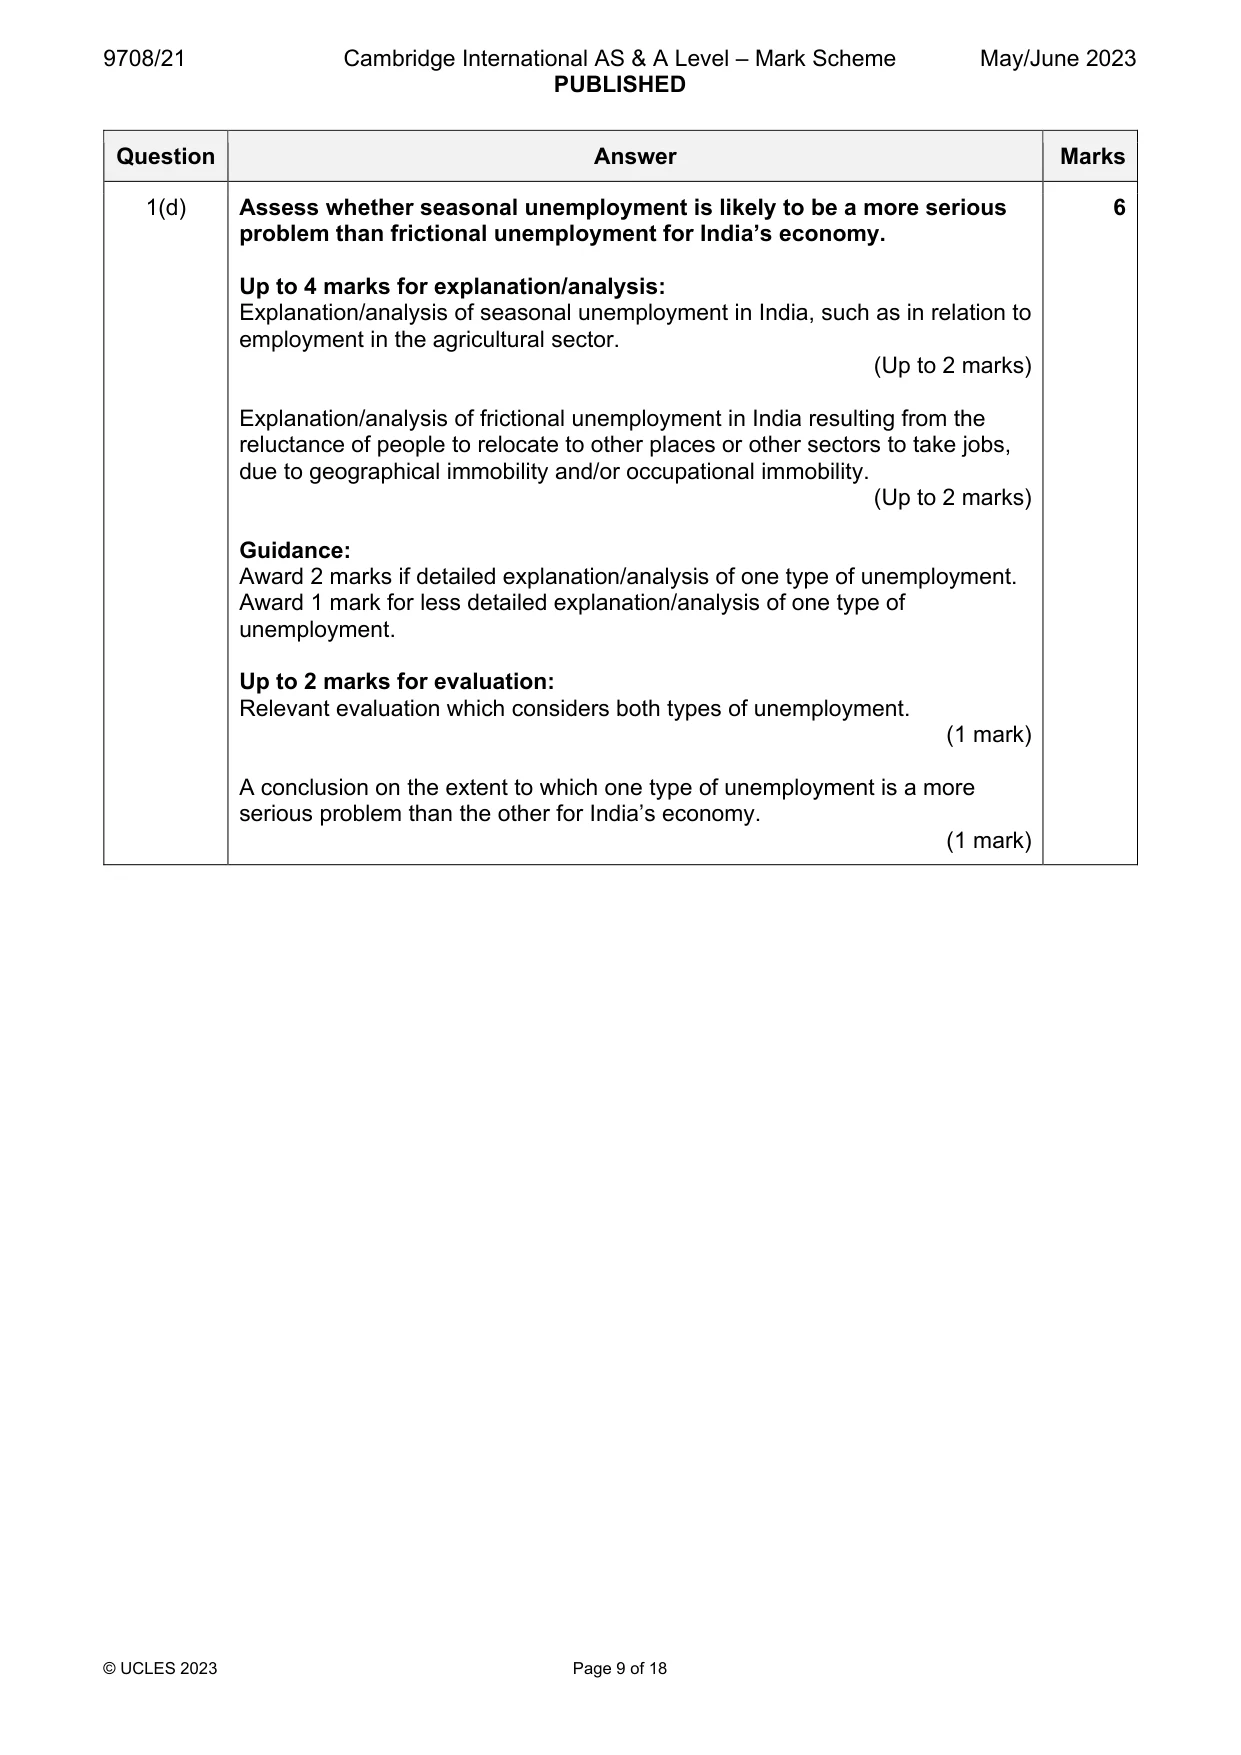
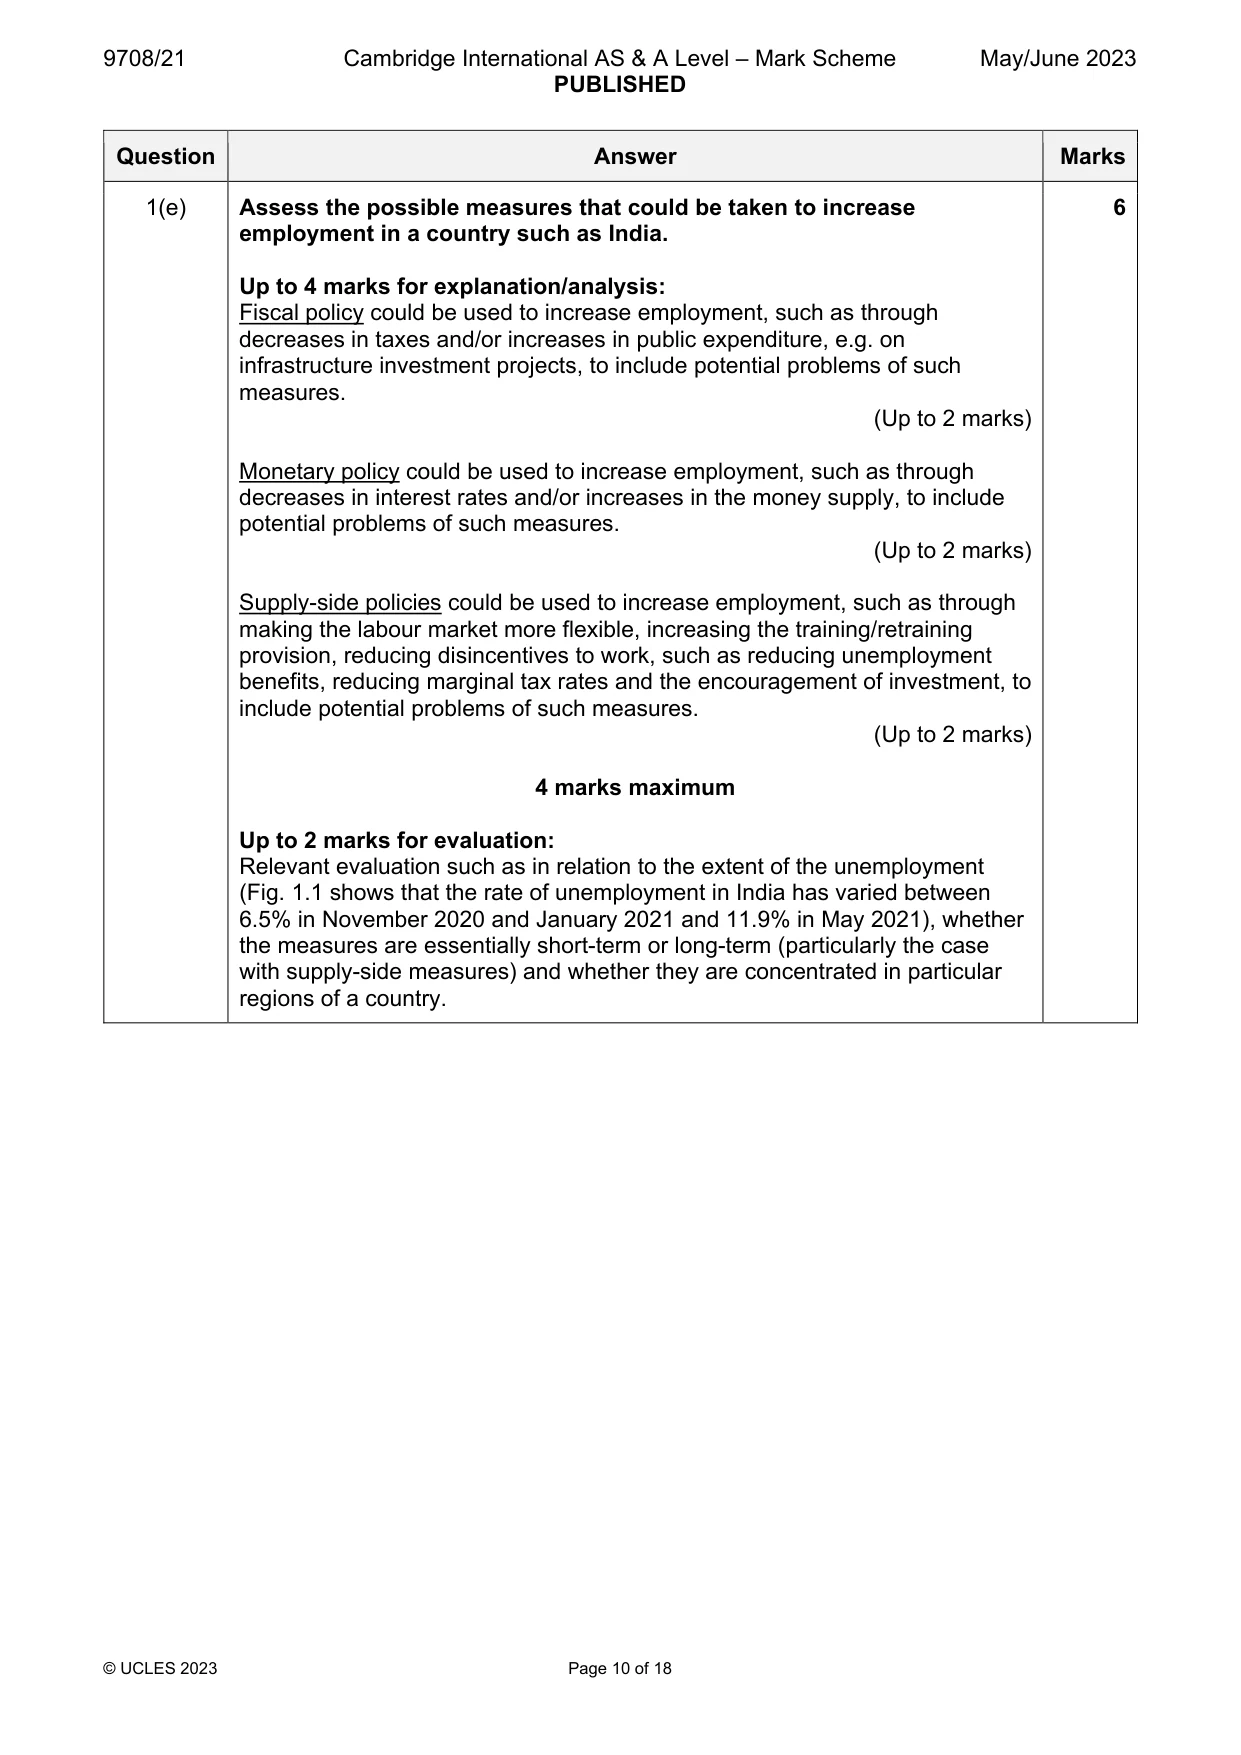
Mark scheme: Question Answer Marks Follow the point-based marking guidance at the top of this mark scheme. 1(a) Using the data in Fig. 1.1, calculate the change in India’s unemployment 2 rate between July 2020 and May 2021. Over this period as a whole, the unemployment rate has increased from 7.4% in July 2020 to 11.9% in May 2021. (1 mark) This is an increase of 4.5% in India’s unemployment rate. (1 mark) OR This is an increase of 60.8% (the exact figure is 60.81081%) in India’s unemployment rate (4.5 / 7.4 100); accept either 60% or 61%. (1 mark) 1(b) Using the information provided, explain how agriculture caused 2 seasonal unemployment in India in December 2020. The agricultural sector has failed to absorb the influx of additional labour; December is not a good month to be taking on more agricultural workers; it is more likely to be a time when agricultural jobs are being lost. (1 mark) In December 2020, 9.8 million jobs were lost in agriculture, more than the 6 million additional labour. (1 mark) 1(c) Consider the extent to which difficulties may arise in the measurement 4 of unemployment in India. Inactive workers not actively seeking employment who might look for work if their situation changed. (Up to 2 marks) Discouraged/disincentivised workers who have had no success in finding employment. (Up to 2 marks) Disguised unemployment, i.e. people might be in employment, but are not really doing any meaningful work. (Up to 2 marks) Unreported employment: some workers in India may be registered as unemployed but are in fact in employment, possibly in the illegal or underground or informal economy. (Up to 2 marks) The efficiency of the tax collection system could be a valid difficulty in the measurement of unemployment. (Up to 2 marks) The scale of the operation could also be a valid difficulty. (Up to 2 marks) Particular difficulty of measurement in rural areas of India. (Up to 2 marks) 3 marks maximum Evaluation Offers a valid judgement on the extent to which these are significant difficulties in the measurement of unemployment in India. (1 mark) 1 mark maximum 1(d) Assess whether seasonal unemployment is likely to be a more serious 6 problem than frictional unemployment for India’s economy. Up to 4 marks for explanation/analysis: Explanation/analysis of seasonal unemployment in India, such as in relation to employment in the agricultural sector. (Up to 2 marks) Explanation/analysis of frictional unemployment in India resulting from the reluctance of people to relocate to other places or other sectors to take jobs, due to geographical immobility and/or occupational immobility. (Up to 2 marks) Guidance: Award 2 marks if detailed explanation/analysis of one type of unemployment. Award 1 mark for less detailed explanation/analysis of one type of unemployment. Up to 2 marks for evaluation: Relevant evaluation which considers both types of unemployment. (1 mark) A conclusion on the extent to which one type of unemployment is a more serious problem than the other for India’s economy. (1 mark) 1(e) Assess the possible measures that could be taken to increase 6 employment in a country such as India. Up to 4 marks for explanation/analysis: Fiscal policy could be used to increase employment, such as through decreases in taxes and/or increases in public expenditure, e.g. on infrastructure investment projects, to include potential problems of such measures. (Up to 2 marks) Monetary policy could be used to increase employment, such as through decreases in interest rates and/or increases in the money supply, to include potential problems of such measures. (Up to 2 marks) Supply-side policies could be used to increase employment, such as through making the labour market more flexible, increasing the training/retraining provision, reducing disincentives to work, such as reducing unemployment benefits, reducing marginal tax rates and the encouragement of investment, to include potential problems of such measures. (Up to 2 marks) 4 marks maximum Up to 2 marks for evaluation: Relevant evaluation such as in relation to the extent of the unemployment (Fig. 1.1 shows that the rate of unemployment in India has varied between 6.5% in November 2020 and January 2021 and 11.9% in May 2021), whether the measures are essentially short-term or long-term (particularly the case with supply-side measures) and whether they are concentrated in particular regions of a country.
Q2 · With the help of a diagram, explain the difference between the causes of a movement…
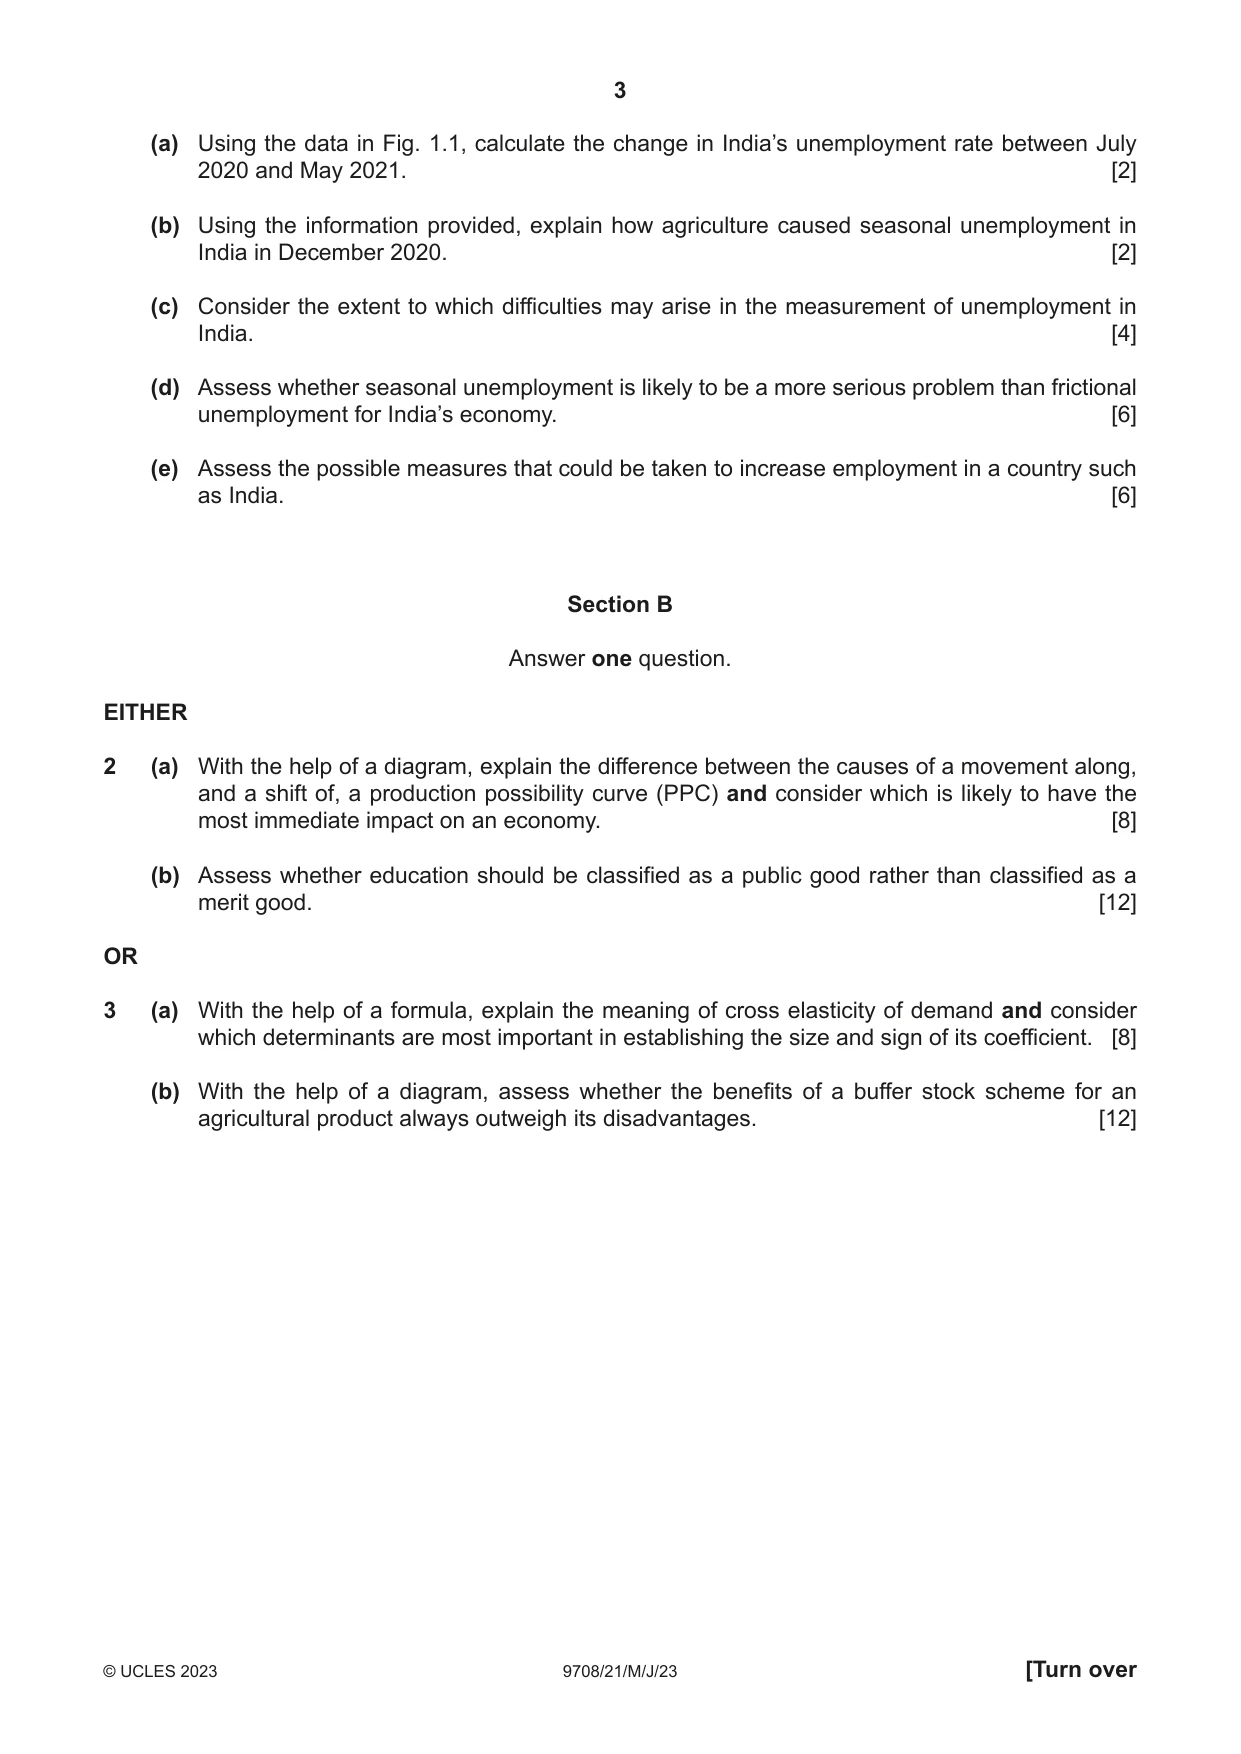
2 (a) With the help of a diagram, explain the difference between the causes of a movement along, and a shift of, a production possibility curve (PPC) and consider which is likely to have the most immediate impact on an economy. [8] (b) Assess whether education should be classified as a public good rather than classified as a merit good. [12] OR
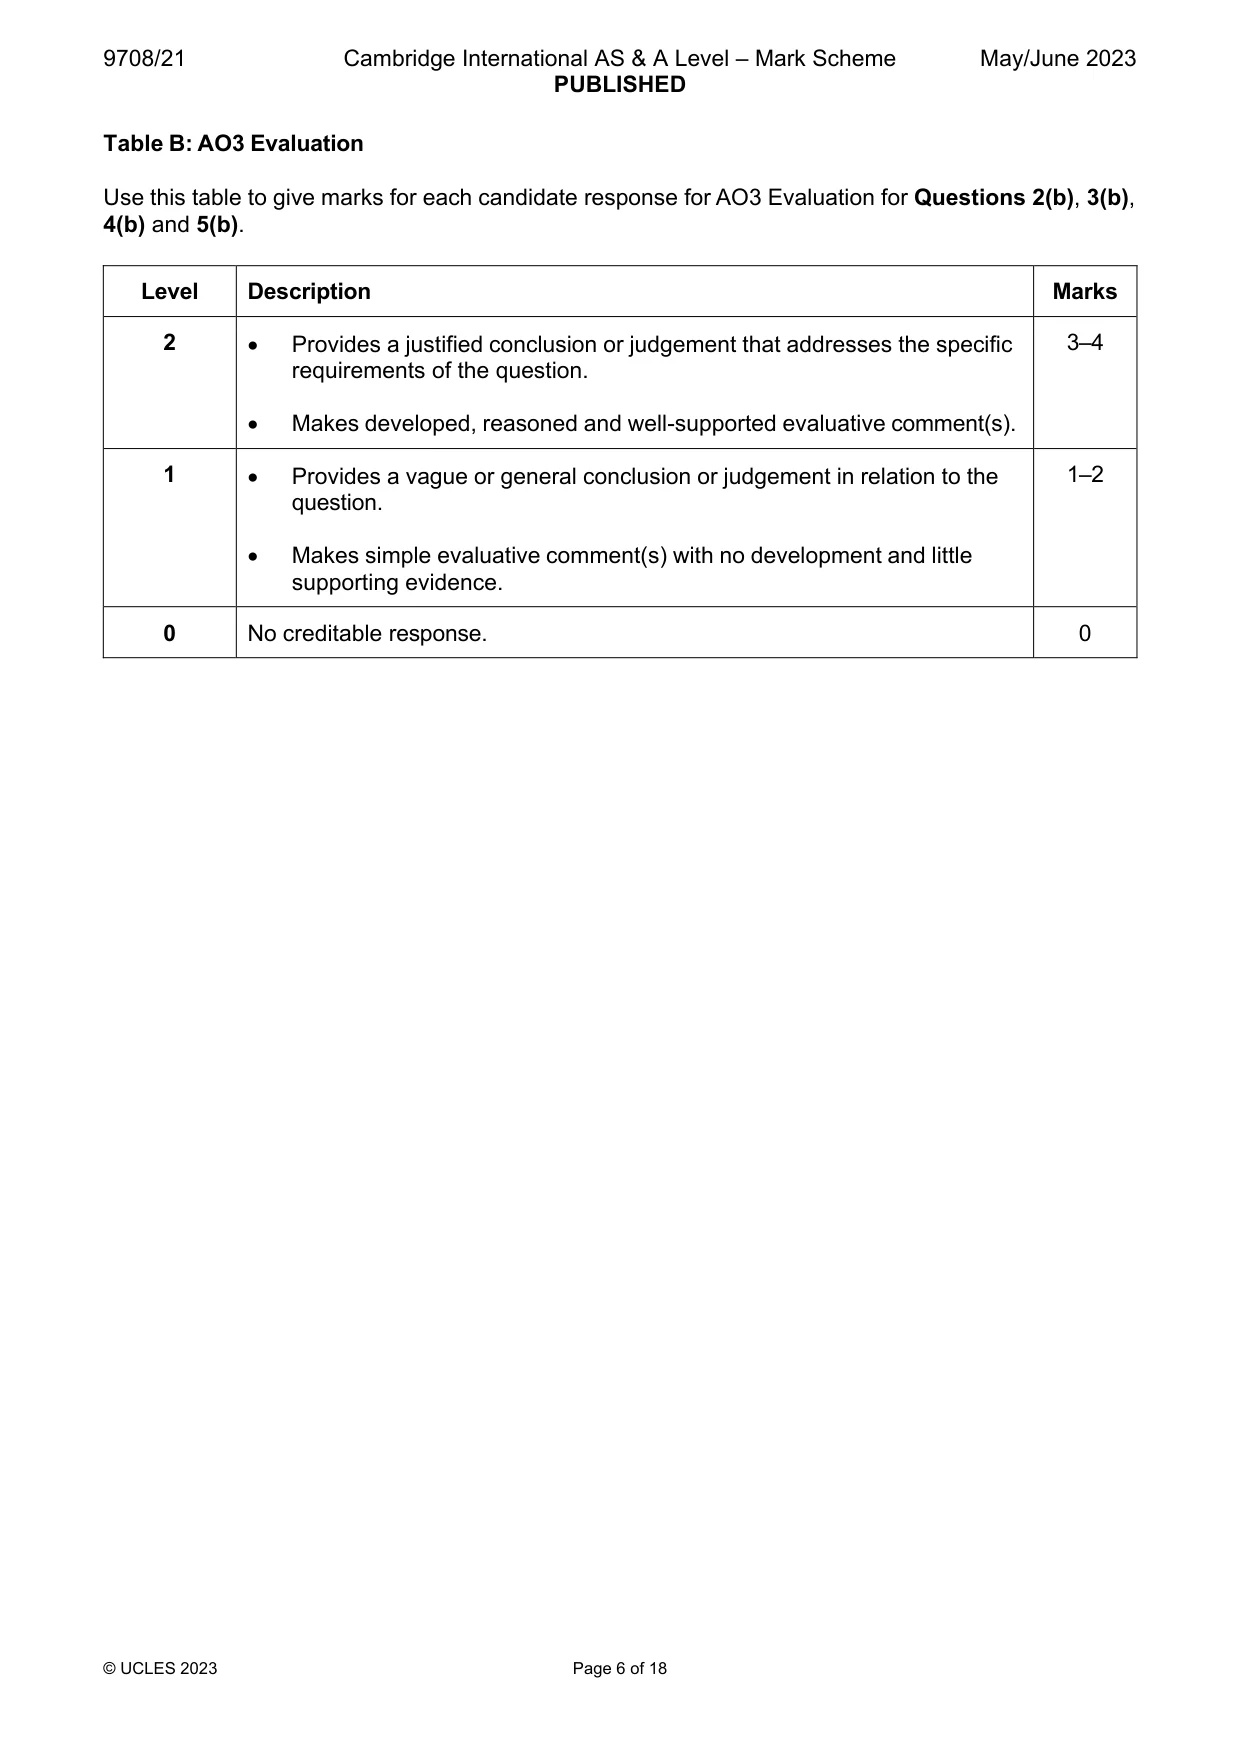
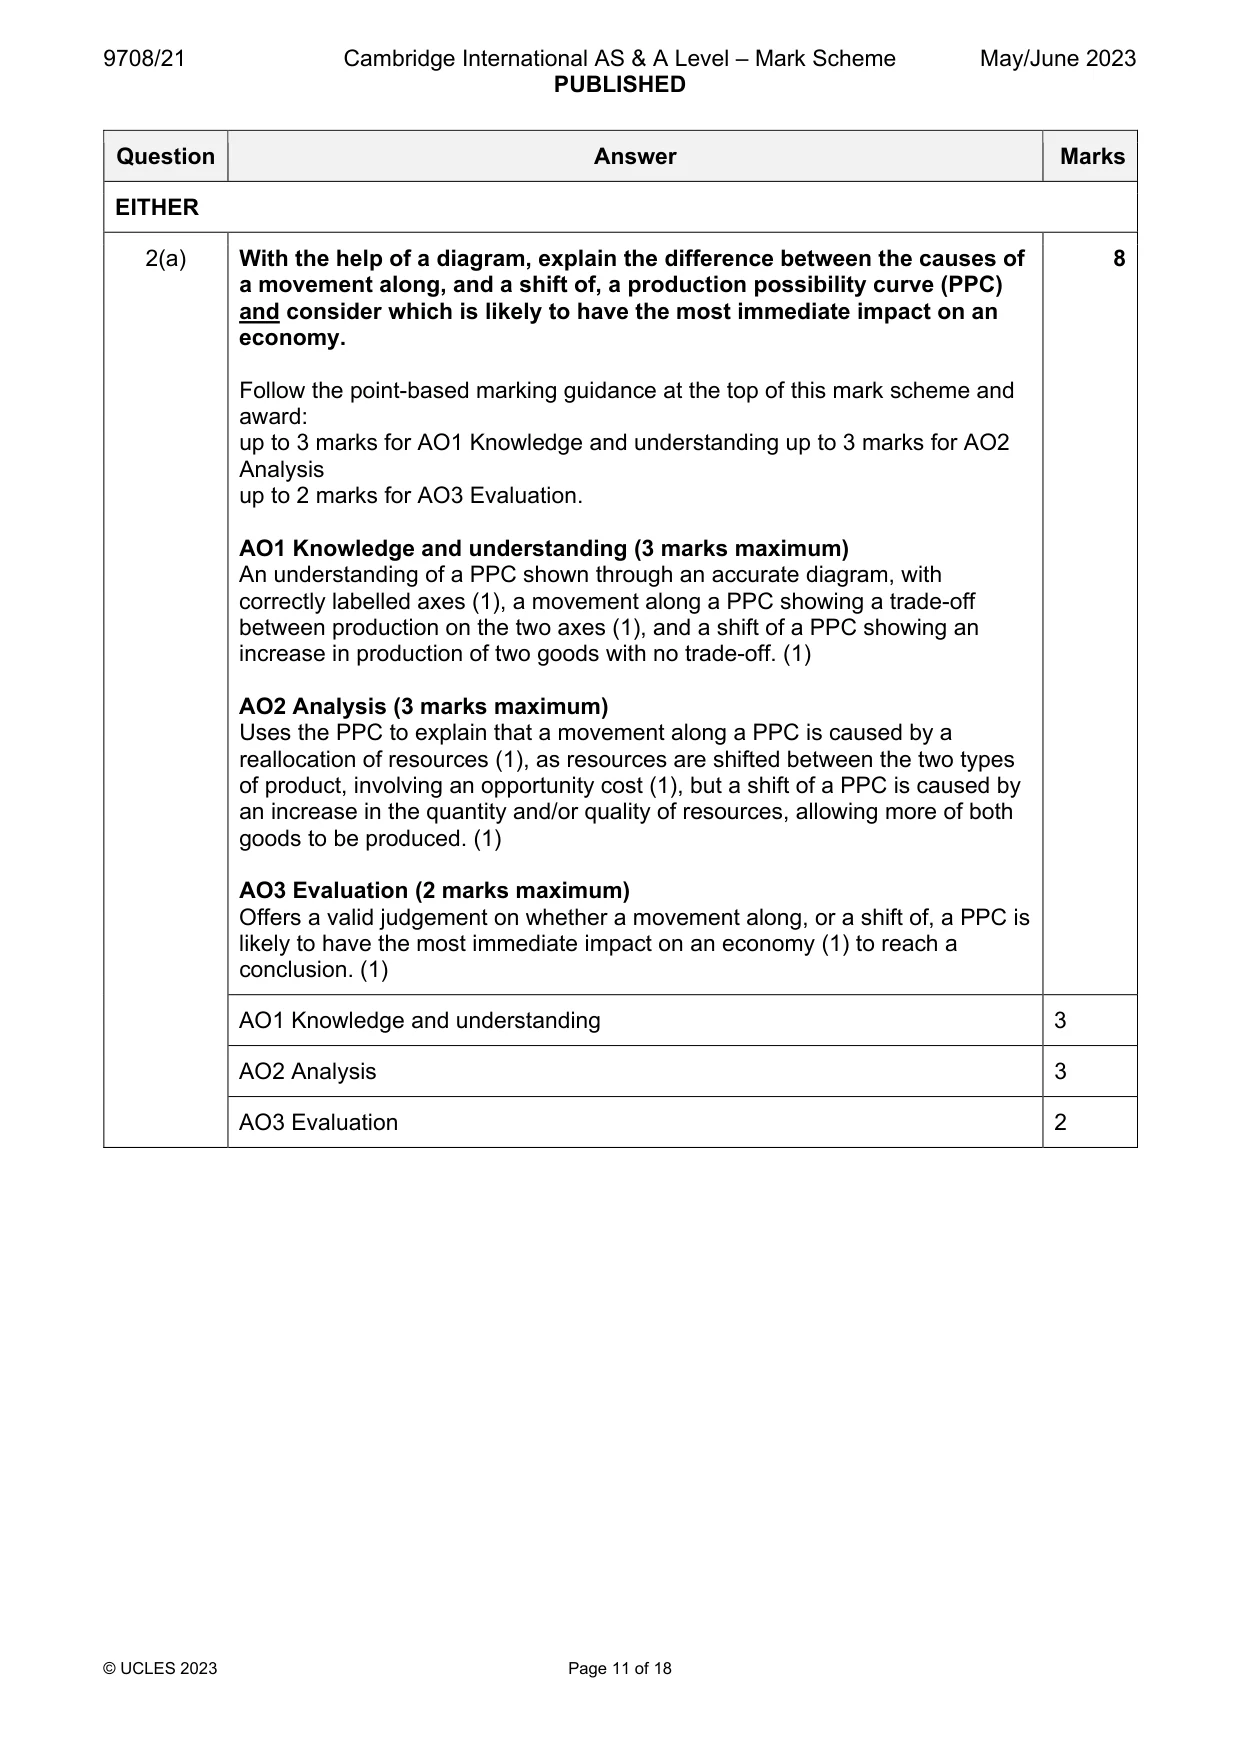
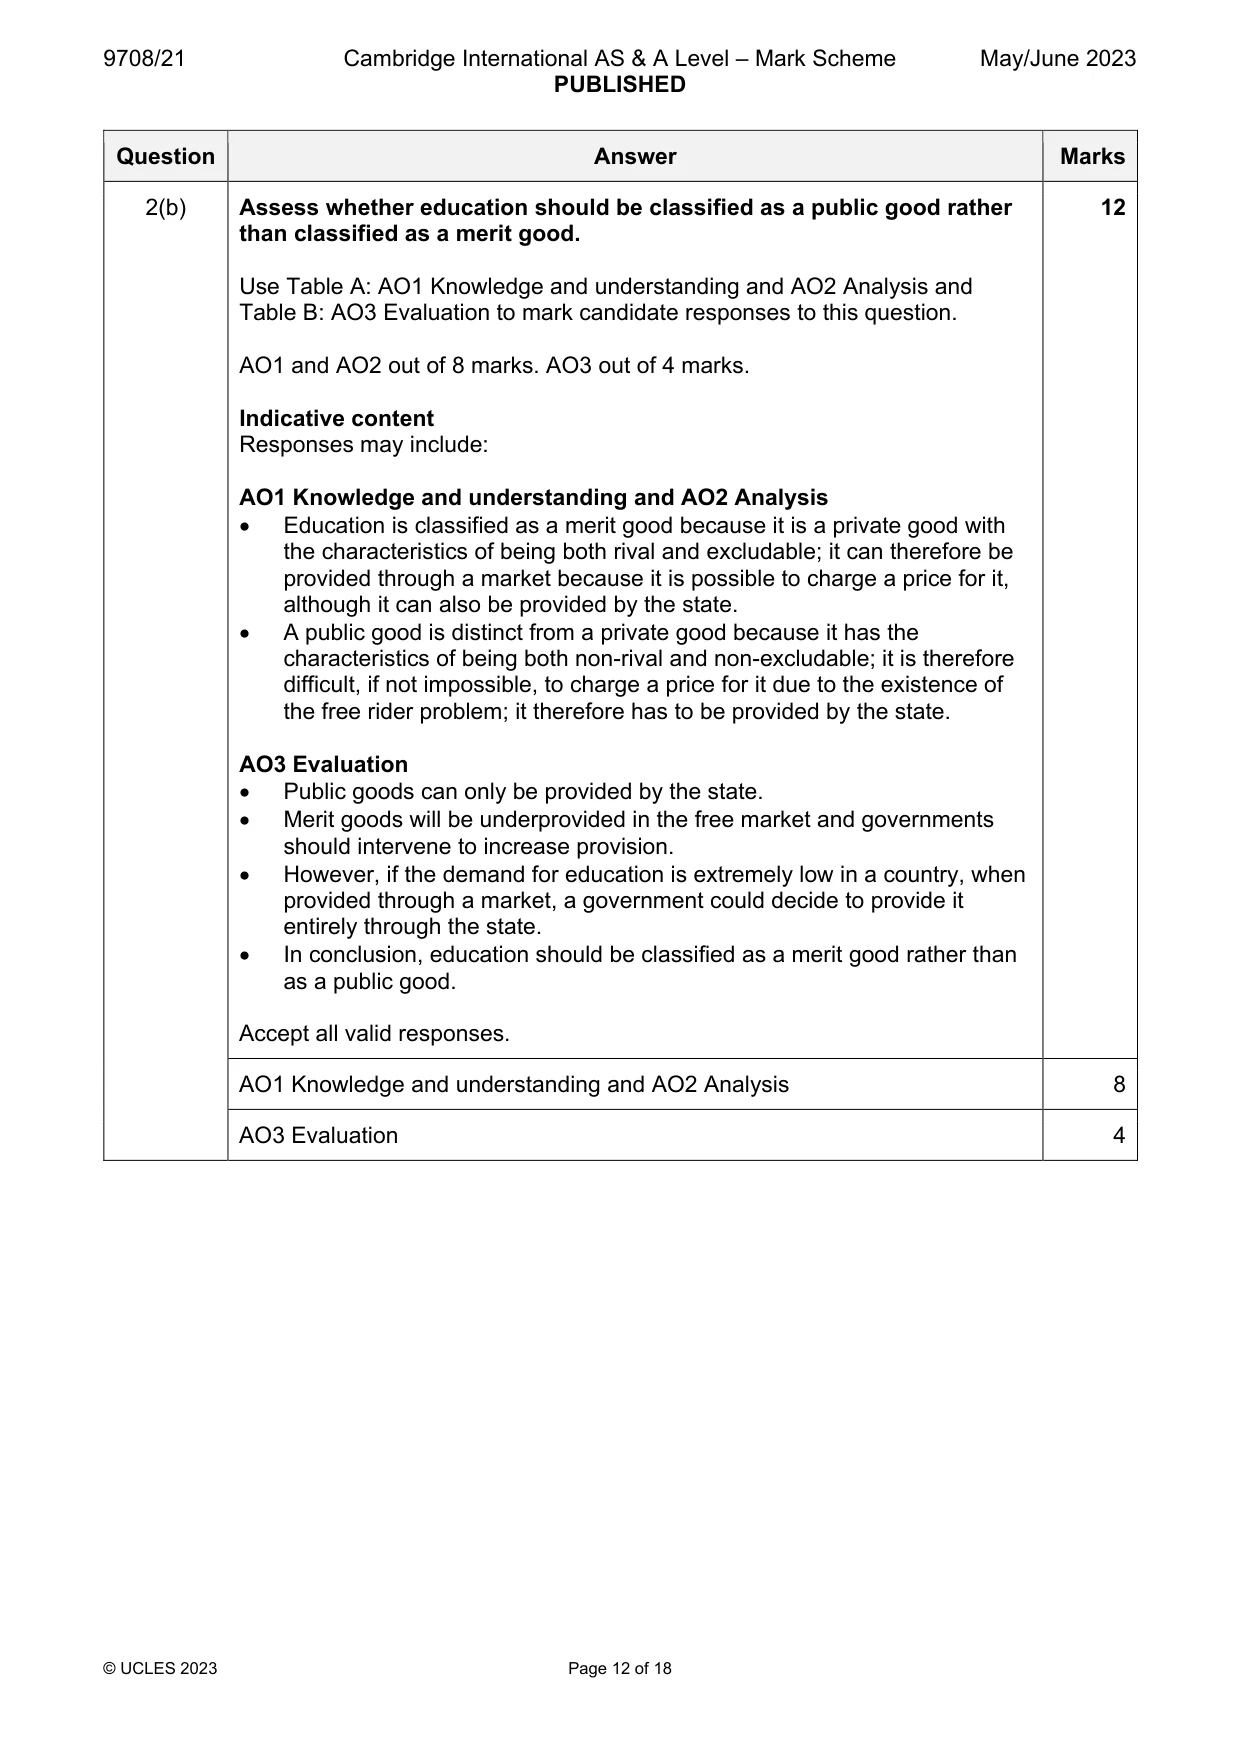
Mark scheme: 2(a) With the help of a diagram, explain the difference between the causes of 8 a movement along, and a shift of, a production possibility curve (PPC) and consider which is likely to have the most immediate impact on an economy. Follow the point-based marking guidance at the top of this mark scheme and award: up to 3 marks for AO1 Knowledge and understanding up to 3 marks for AO2 Analysis up to 2 marks for AO3 Evaluation. AO1 Knowledge and understanding (3 marks maximum) An understanding of a PPC shown through an accurate diagram, with correctly labelled axes (1), a movement along a PPC showing a trade-off between production on the two axes (1), and a shift of a PPC showing an increase in production of two goods with no trade-off. (1) AO2 Analysis (3 marks maximum) Uses the PPC to explain that a movement along a PPC is caused by a reallocation of resources (1), as resources are shifted between the two types of product, involving an opportunity cost (1), but a shift of a PPC is caused by an increase in the quantity and/or quality of resources, allowing more of both goods to be produced. (1) AO3 Evaluation (2 marks maximum) Offers a valid judgement on whether a movement along, or a shift of, a PPC is likely to have the most immediate impact on an economy (1) to reach a conclusion. (1) AO1 Knowledge and understanding 3 AO2 Analysis 3 AO3 Evaluation 2 2(b) Assess whether education should be classified as a public good rather 12 than classified as a merit good. Use Table A: AO1 Knowledge and understanding and AO2 Analysis and Table B: AO3 Evaluation to mark candidate responses to this question. AO1 and AO2 out of 8 marks. AO3 out of 4 marks. Indicative content Responses may include: AO1 Knowledge and understanding and AO2 Analysis Education is classified as a merit good because it is a private good with the characteristics of being both rival and excludable; it can therefore be provided through a market because it is possible to charge a price for it, although it can also be provided by the state. A public good is distinct from a private good because it has the characteristics of being both non-rival and non-excludable; it is therefore difficult, if not impossible, to charge a price for it due to the existence of the free rider problem; it therefore has to be provided by the state. AO3 Evaluation Public goods can only be provided by the state. Merit goods will be underprovided in the free market and governments should intervene to increase provision. However, if the demand for education is extremely low in a country, when provided through a market, a government could decide to provide it entirely through the state. In conclusion, education should be classified as a merit good rather than as a public good. Accept all valid responses. AO1 Knowledge and understanding and AO2 Analysis 8 AO3 Evaluation 4
Q3 · With the help of a formula, explain the meaning of cross elasticity of demand and…
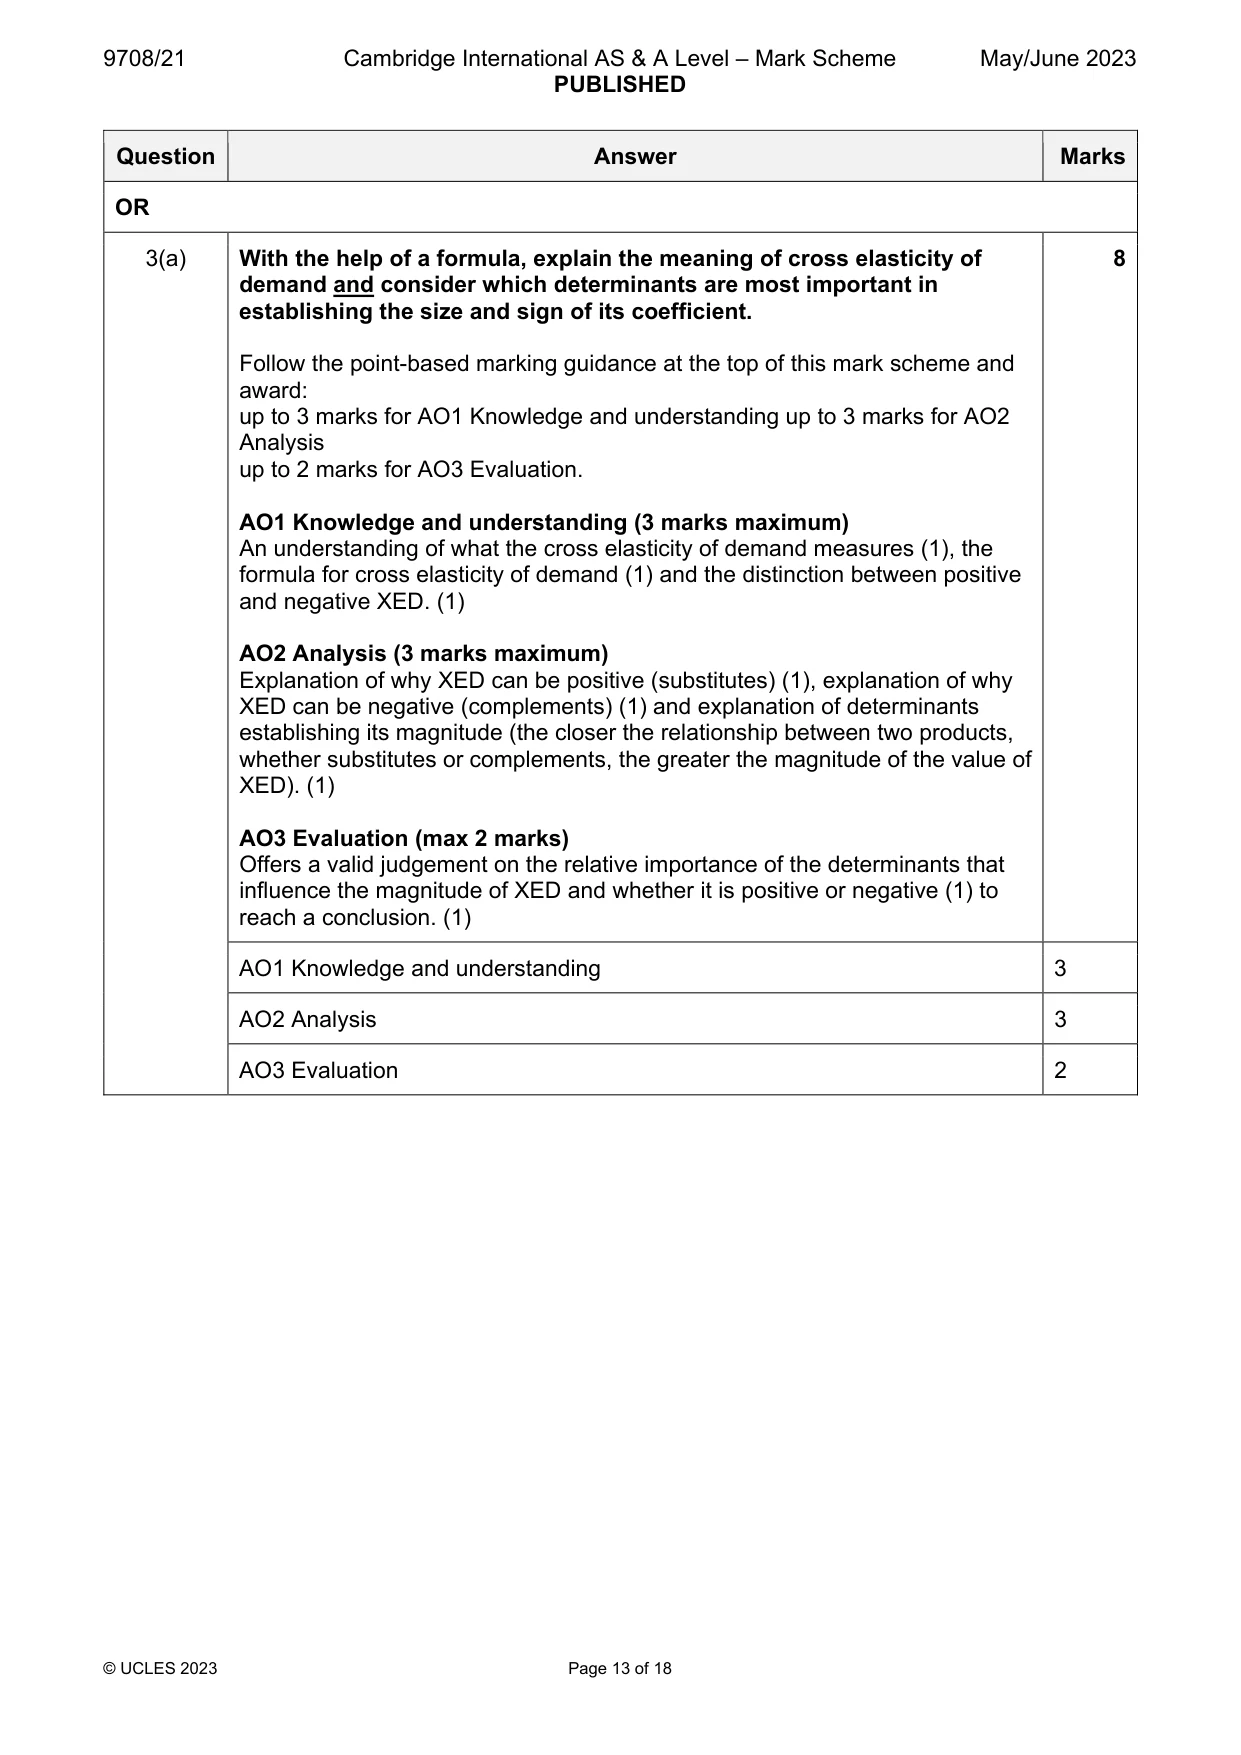
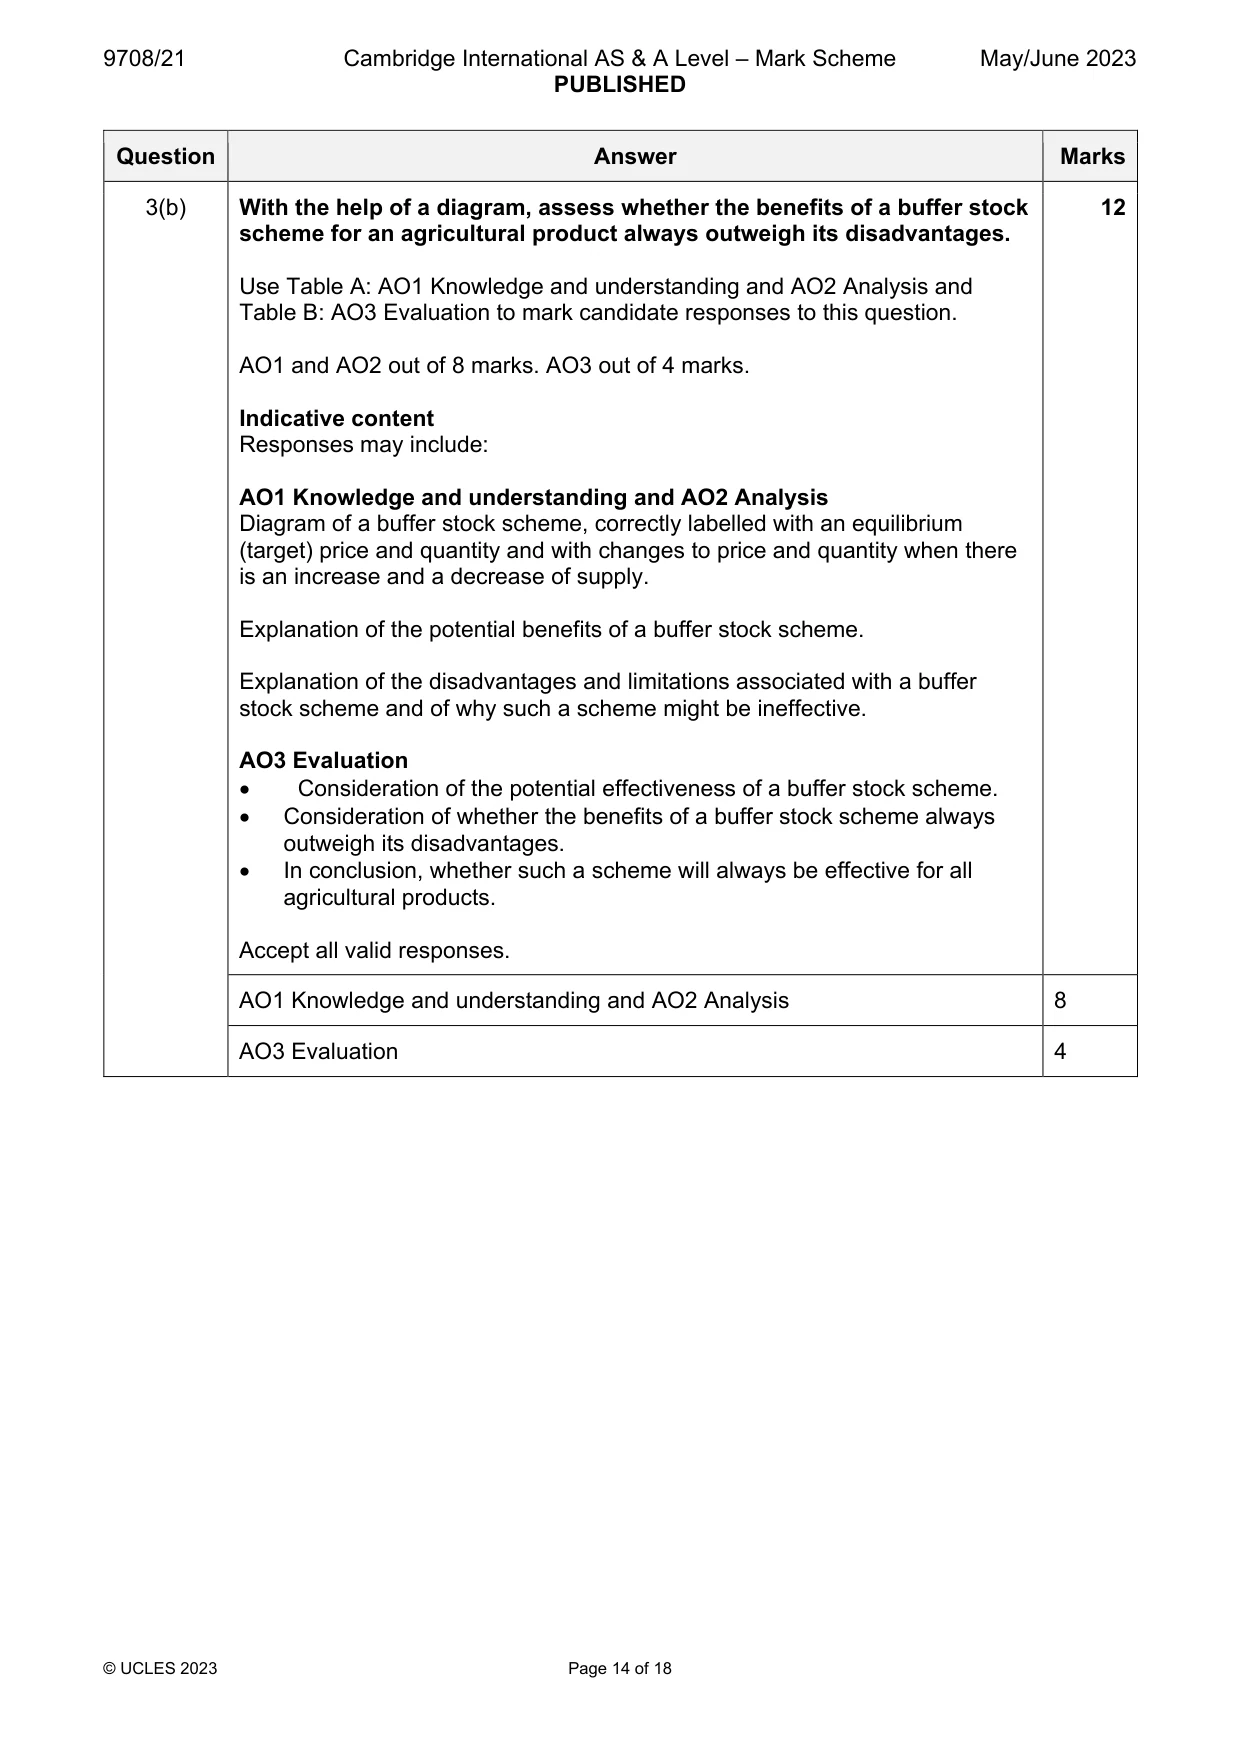
3 (a) With the help of a formula, explain the meaning of cross elasticity of demand and consider which determinants are most important in establishing the size and sign of its coefficient. [8] (b) With the help of a diagram, assess whether the benefits of a buffer stock scheme for an agricultural product always outweigh its disadvantages. [12] Section C Answer one question. EITHER
Mark scheme: 3(a) With the help of a formula, explain the meaning of cross elasticity of 8 demand and consider which determinants are most important in establishing the size and sign of its coefficient. Follow the point-based marking guidance at the top of this mark scheme and award: up to 3 marks for AO1 Knowledge and understanding up to 3 marks for AO2 Analysis up to 2 marks for AO3 Evaluation. AO1 Knowledge and understanding (3 marks maximum) An understanding of what the cross elasticity of demand measures (1), the formula for cross elasticity of demand (1) and the distinction between positive and negative XED. (1) AO2 Analysis (3 marks maximum) Explanation of why XED can be positive (substitutes) (1), explanation of why XED can be negative (complements) (1) and explanation of determinants establishing its magnitude (the closer the relationship between two products, whether substitutes or complements, the greater the magnitude of the value of XED). (1) AO3 Evaluation (max 2 marks) Offers a valid judgement on the relative importance of the determinants that influence the magnitude of XED and whether it is positive or negative (1) to reach a conclusion. (1) AO1 Knowledge and understanding 3 AO2 Analysis 3 AO3 Evaluation 2 3(b) With the help of a diagram, assess whether the benefits of a buffer stock 12 scheme for an agricultural product always outweigh its disadvantages. Use Table A: AO1 Knowledge and understanding and AO2 Analysis and Table B: AO3 Evaluation to mark candidate responses to this question. AO1 and AO2 out of 8 marks. AO3 out of 4 marks. Indicative content Responses may include: AO1 Knowledge and understanding and AO2 Analysis Diagram of a buffer stock scheme, correctly labelled with an equilibrium (target) price and quantity and with changes to price and quantity when there is an increase and a decrease of supply. Explanation of the potential benefits of a buffer stock scheme. Explanation of the disadvantages and limitations associated with a buffer stock scheme and of why such a scheme might be ineffective. AO3 Evaluation Consideration of the potential effectiveness of a buffer stock scheme. Consideration of whether the benefits of a buffer stock scheme always outweigh its disadvantages. In conclusion, whether such a scheme will always be effective for all agricultural products. Accept all valid responses. AO1 Knowledge and understanding and AO2 Analysis 8 AO3 Evaluation 4
More questions on Methods and effects of government intervention in markets
Q4 · With the help of an AD/AS diagram(s), explain cost-push inflation and demand-pull…
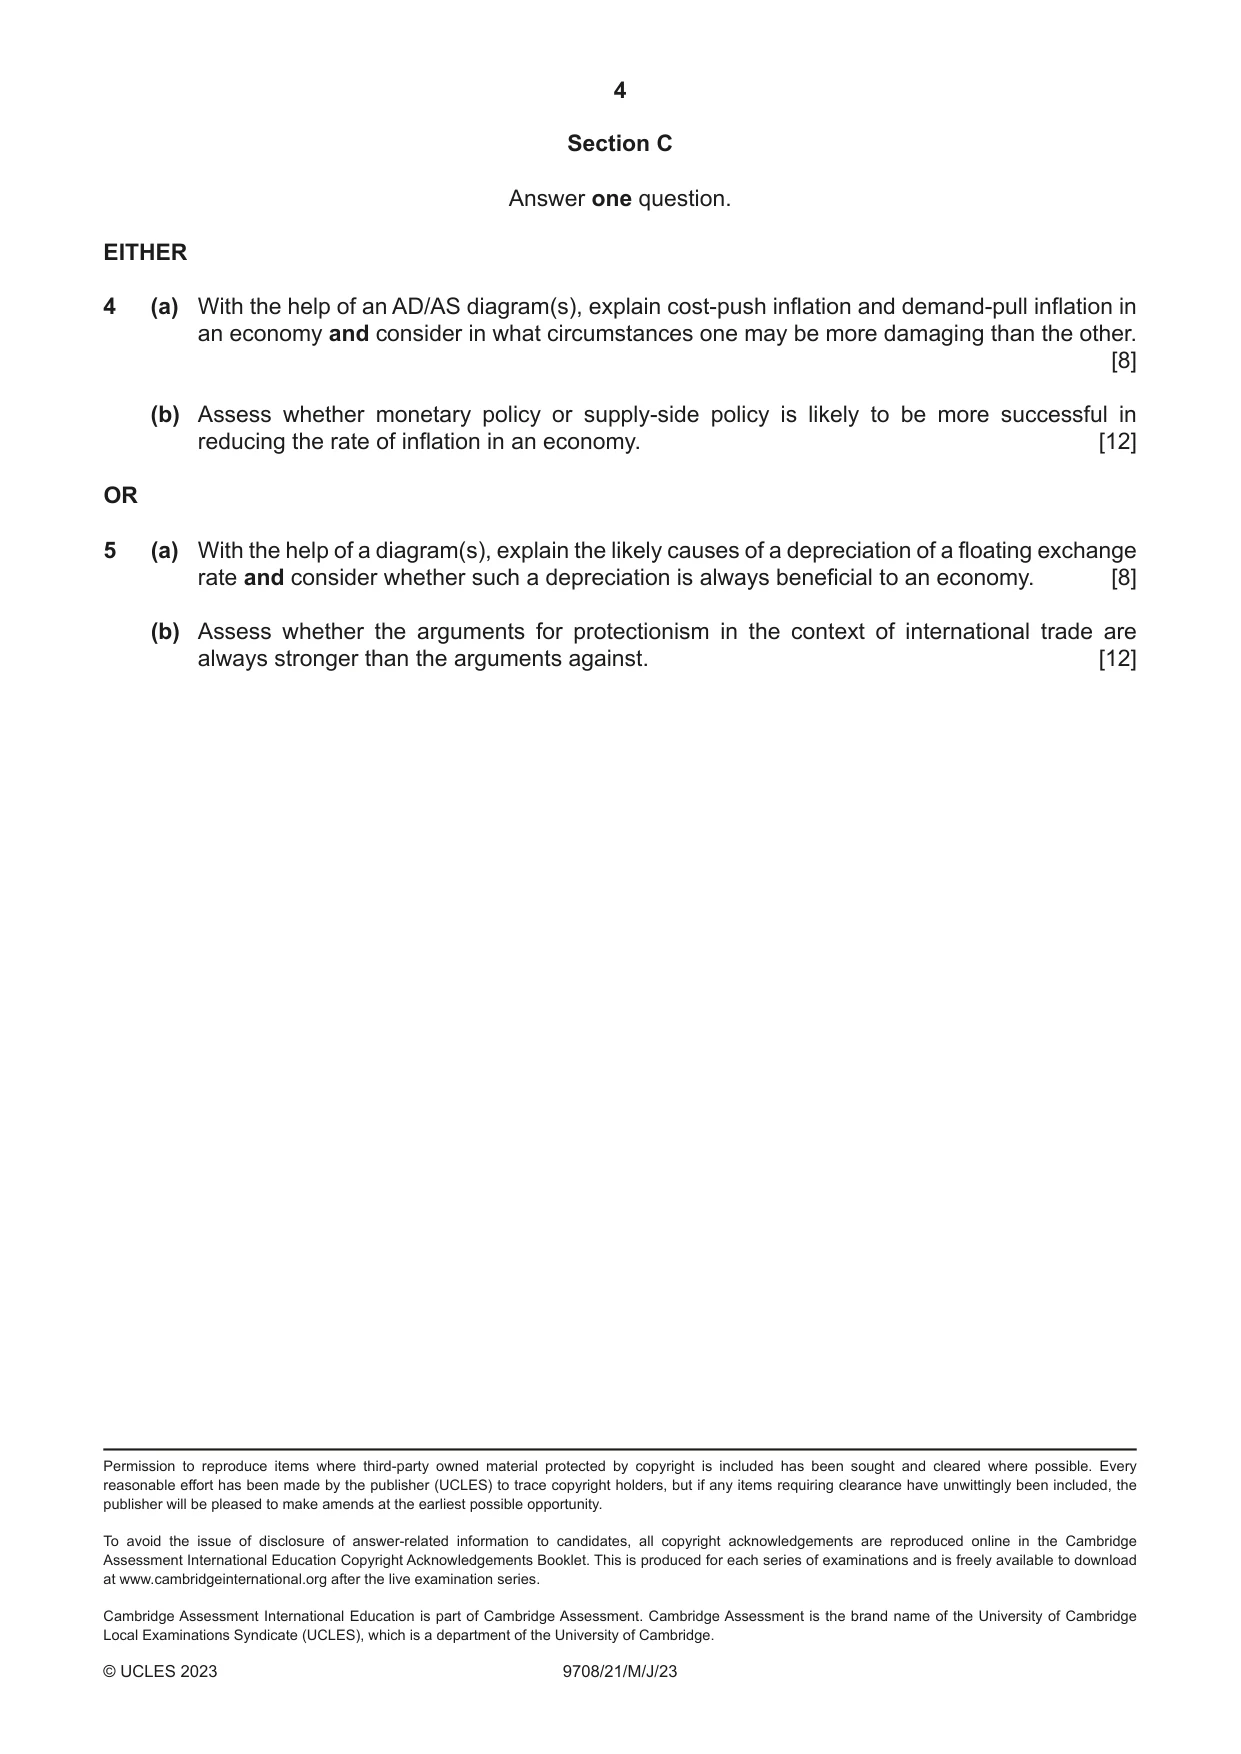
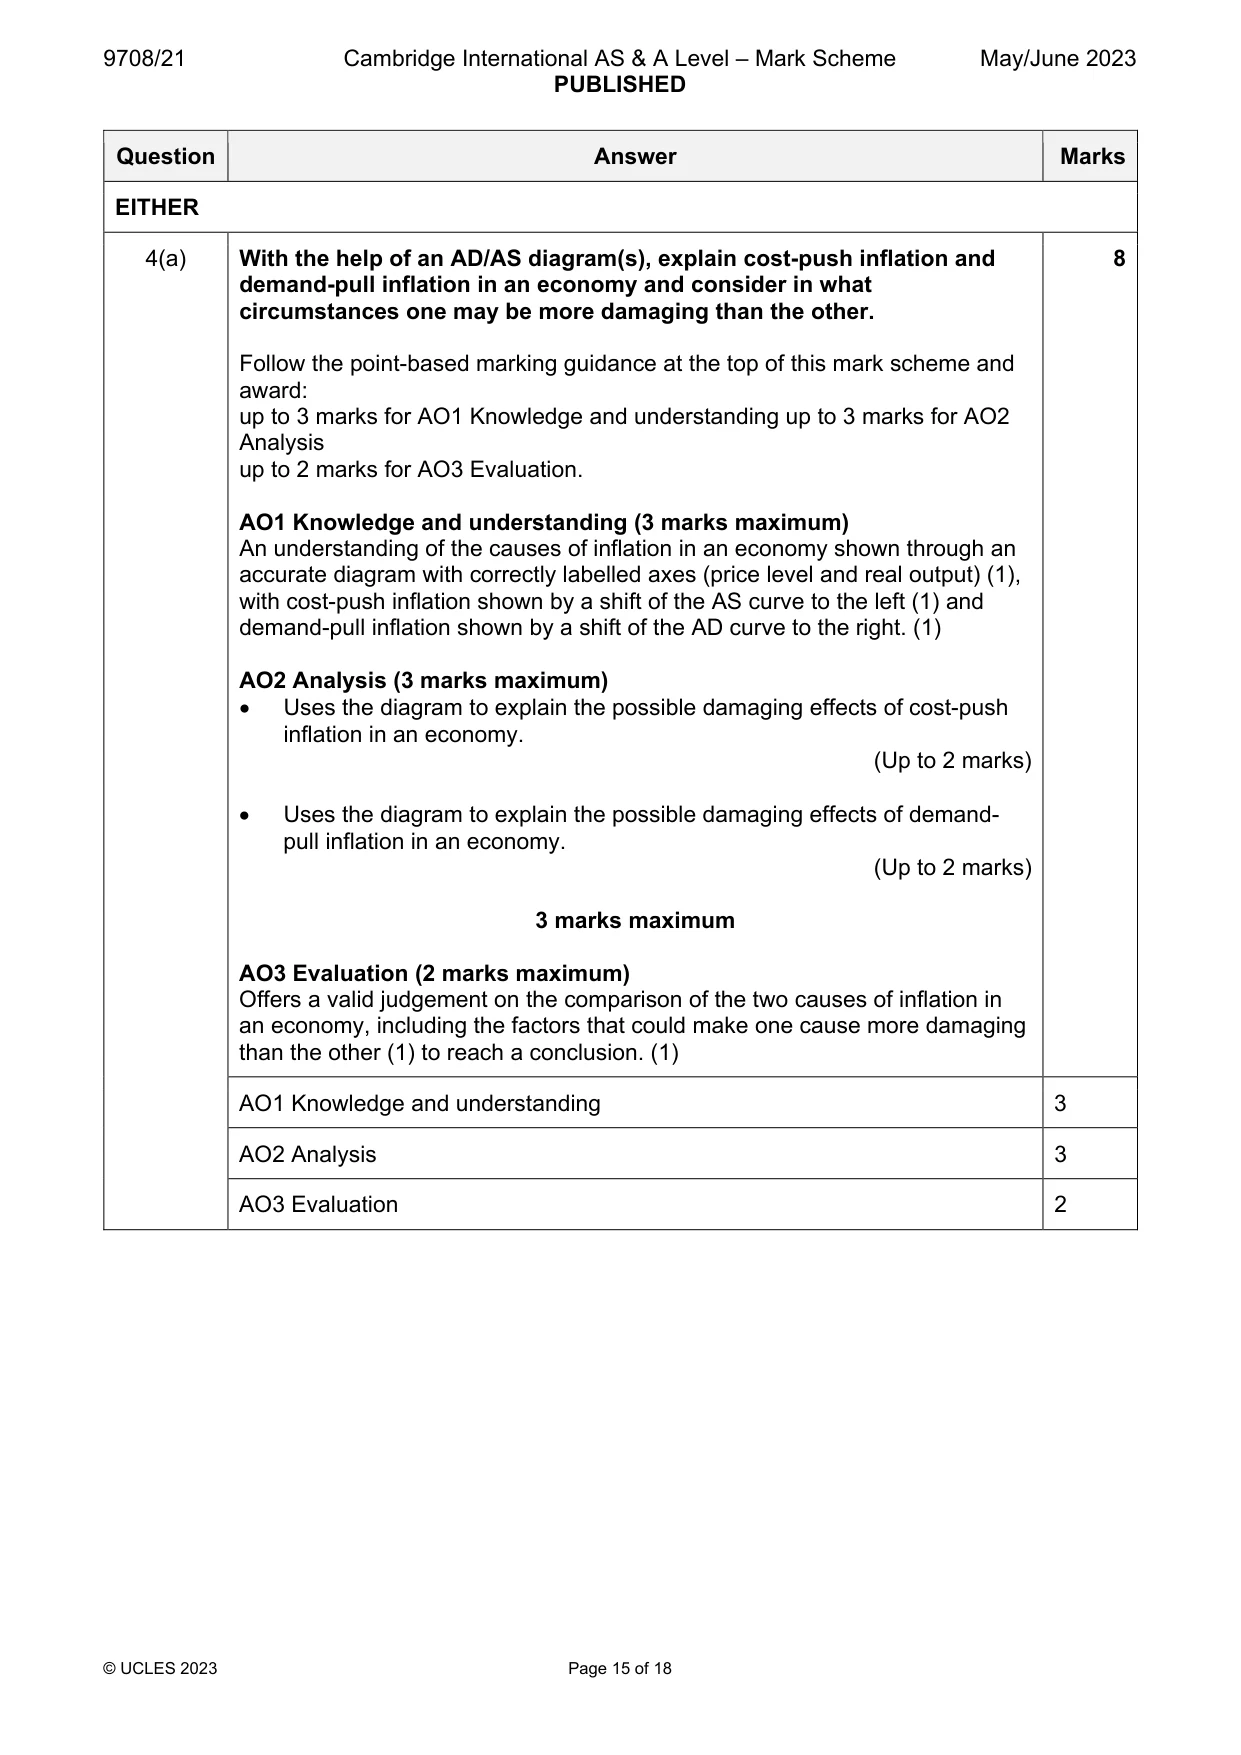
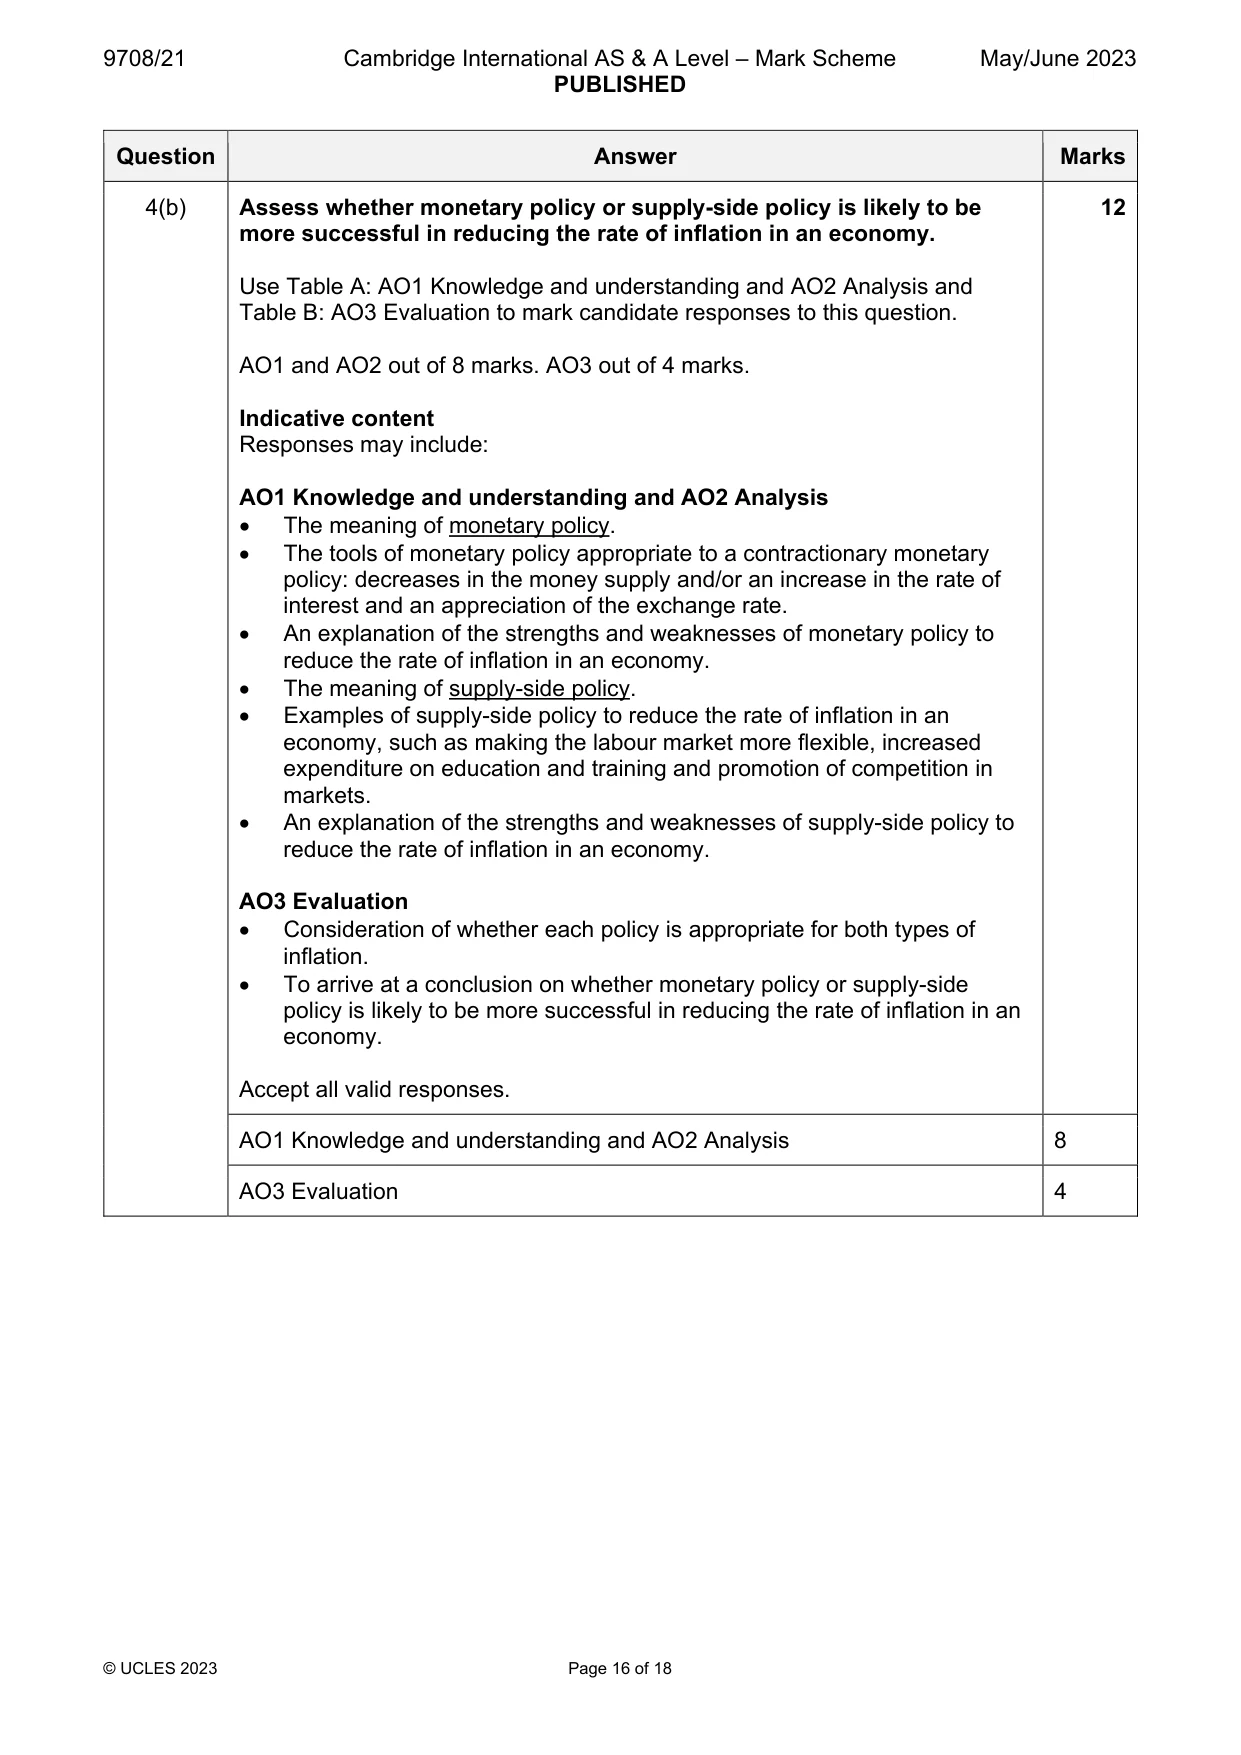
4 (a) With the help of an AD/AS diagram(s), explain cost-push inflation and demand-pull inflation in an economy and consider in what circumstances one may be more damaging than the other. [8] (b) Assess whether monetary policy or supply-side policy is likely to be more successful in reducing the rate of inflation in an economy. [12] OR
Mark scheme: 4(a) With the help of an AD/AS diagram(s), explain cost-push inflation and 8 demand-pull inflation in an economy and consider in what circumstances one may be more damaging than the other. Follow the point-based marking guidance at the top of this mark scheme and award: up to 3 marks for AO1 Knowledge and understanding up to 3 marks for AO2 Analysis up to 2 marks for AO3 Evaluation. AO1 Knowledge and understanding (3 marks maximum) An understanding of the causes of inflation in an economy shown through an accurate diagram with correctly labelled axes (price level and real output) (1), with cost-push inflation shown by a shift of the AS curve to the left (1) and demand-pull inflation shown by a shift of the AD curve to the right. (1) AO2 Analysis (3 marks maximum) Uses the diagram to explain the possible damaging effects of cost-push inflation in an economy. (Up to 2 marks) Uses the diagram to explain the possible damaging effects of demand- pull inflation in an economy. (Up to 2 marks) 3 marks maximum AO3 Evaluation (2 marks maximum) Offers a valid judgement on the comparison of the two causes of inflation in an economy, including the factors that could make one cause more damaging than the other (1) to reach a conclusion. (1) AO1 Knowledge and understanding 3 AO2 Analysis 3 AO3 Evaluation 2 4(b) Assess whether monetary policy or supply-side policy is likely to be 12 more successful in reducing the rate of inflation in an economy. Use Table A: AO1 Knowledge and understanding and AO2 Analysis and Table B: AO3 Evaluation to mark candidate responses to this question. AO1 and AO2 out of 8 marks. AO3 out of 4 marks. Indicative content Responses may include: AO1 Knowledge and understanding and AO2 Analysis The meaning of monetary policy. The tools of monetary policy appropriate to a contractionary monetary policy: decreases in the money supply and/or an increase in the rate of interest and an appreciation of the exchange rate. An explanation of the strengths and weaknesses of monetary policy to reduce the rate of inflation in an economy. The meaning of supply-side policy. Examples of supply-side policy to reduce the rate of inflation in an economy, such as making the labour market more flexible, increased expenditure on education and training and promotion of competition in markets. An explanation of the strengths and weaknesses of supply-side policy to reduce the rate of inflation in an economy. AO3 Evaluation Consideration of whether each policy is appropriate for both types of inflation. To arrive at a conclusion on whether monetary policy or supply-side policy is likely to be more successful in reducing the rate of inflation in an economy. Accept all valid responses. AO1 Knowledge and understanding and AO2 Analysis 8 AO3 Evaluation 4
More questions on Effectiveness of policy options to meet all macroeconomic objectives
Q5 · With the help of a diagram(s), explain the likely causes of a depreciation of a floating…
5 (a) With the help of a diagram(s), explain the likely causes of a depreciation of a floating exchange rate and consider whether such a depreciation is always beneficial to an economy. [8] (b) Assess whether the arguments for protectionism in the context of international trade are always stronger than the arguments against. [12]
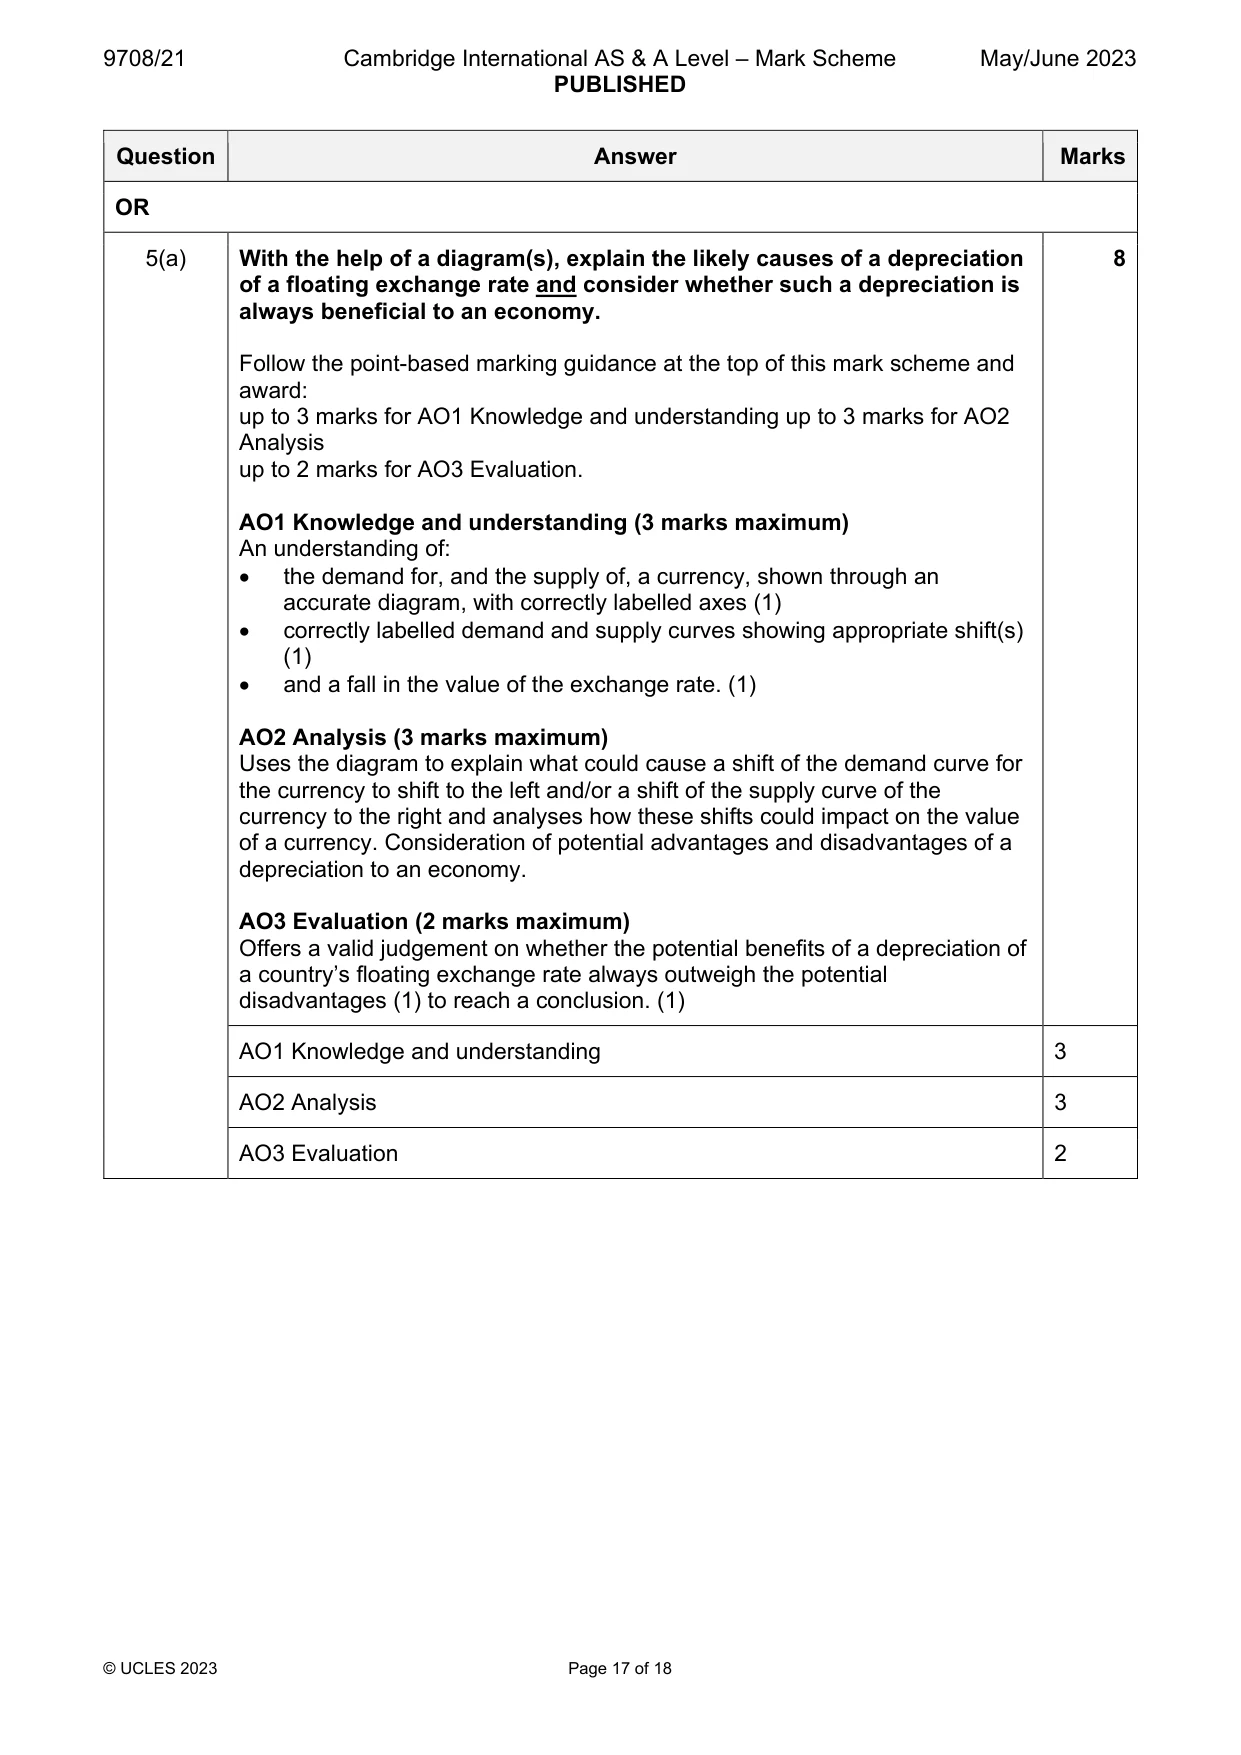
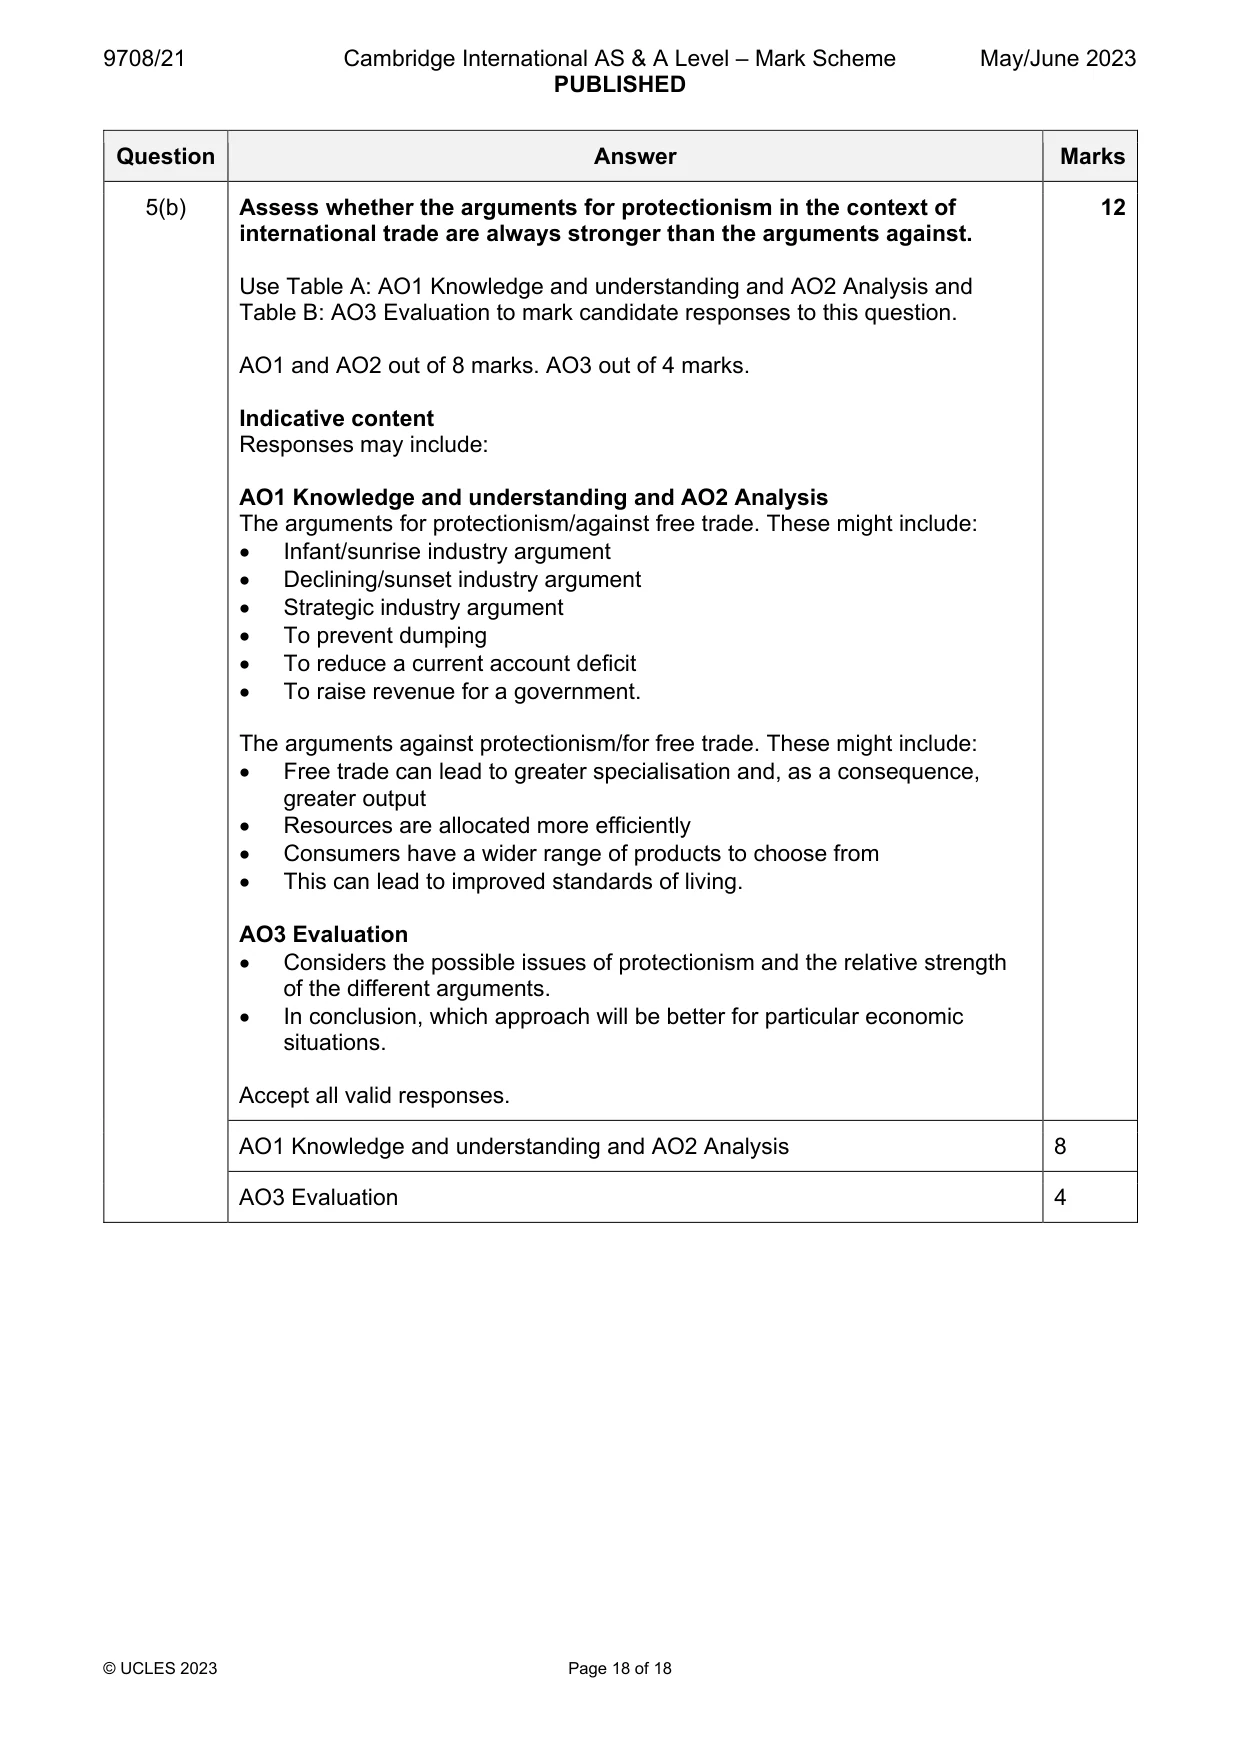
Mark scheme: 5(a) With the help of a diagram(s), explain the likely causes of a depreciation 8 of a floating exchange rate and consider whether such a depreciation is always beneficial to an economy. Follow the point-based marking guidance at the top of this mark scheme and award: up to 3 marks for AO1 Knowledge and understanding up to 3 marks for AO2 Analysis up to 2 marks for AO3 Evaluation. AO1 Knowledge and understanding (3 marks maximum) An understanding of: the demand for, and the supply of, a currency, shown through an accurate diagram, with correctly labelled axes (1) correctly labelled demand and supply curves showing appropriate shift(s) (1) and a fall in the value of the exchange rate. (1) AO2 Analysis (3 marks maximum) Uses the diagram to explain what could cause a shift of the demand curve for the currency to shift to the left and/or a shift of the supply curve of the currency to the right and analyses how these shifts could impact on the value of a currency. Consideration of potential advantages and disadvantages of a depreciation to an economy. AO3 Evaluation (2 marks maximum) Offers a valid judgement on whether the potential benefits of a depreciation of a country’s floating exchange rate always outweigh the potential disadvantages (1) to reach a conclusion. (1) AO1 Knowledge and understanding 3 AO2 Analysis 3 AO3 Evaluation 2 5(b) Assess whether the arguments for protectionism in the context of 12 international trade are always stronger than the arguments against. Use Table A: AO1 Knowledge and understanding and AO2 Analysis and Table B: AO3 Evaluation to mark candidate responses to this question. AO1 and AO2 out of 8 marks. AO3 out of 4 marks. Indicative content Responses may include: AO1 Knowledge and understanding and AO2 Analysis The arguments for protectionism/against free trade. These might include: Infant/sunrise industry argument Declining/sunset industry argument Strategic industry argument To prevent dumping To reduce a current account deficit To raise revenue for a government. The arguments against protectionism/for free trade. These might include: Free trade can lead to greater specialisation and, as a consequence, greater output Resources are allocated more efficiently Consumers have a wider range of products to choose from This can lead to improved standards of living. AO3 Evaluation Considers the possible issues of protectionism and the relative strength of the different arguments. In conclusion, which approach will be better for particular economic situations. Accept all valid responses. AO1 Knowledge and understanding and AO2 Analysis 8 AO3 Evaluation 4
What was in this paper
The subtopics covered by these 5 questions, and how many questions each got. Open one in a new tab to see every Cambridge question on it.
What you needed in this session
Cambridge’s own grade thresholds for 2023 May/June, Paper 2 · Variant 1. A higher threshold means an easier paper — the bar moves with how the cohort did.