Cambridge A Level Economics 9708 — 2021 Oct/Nov Paper 4 · Variant 2
9708/42/O/N/21 · 7 questions · 70 marks · ≈79 min
The question paper and its mark scheme, free to read here and free to download. This is Cambridge’s own paper, exactly as it was sat.
Question paper4 pages


Mark scheme11 pages
Answers below. Sit the paper first if you are practising.



Questions as text
Q1 · Competition in the skies over Europe In the sixteen months to April 2019 thirteen…
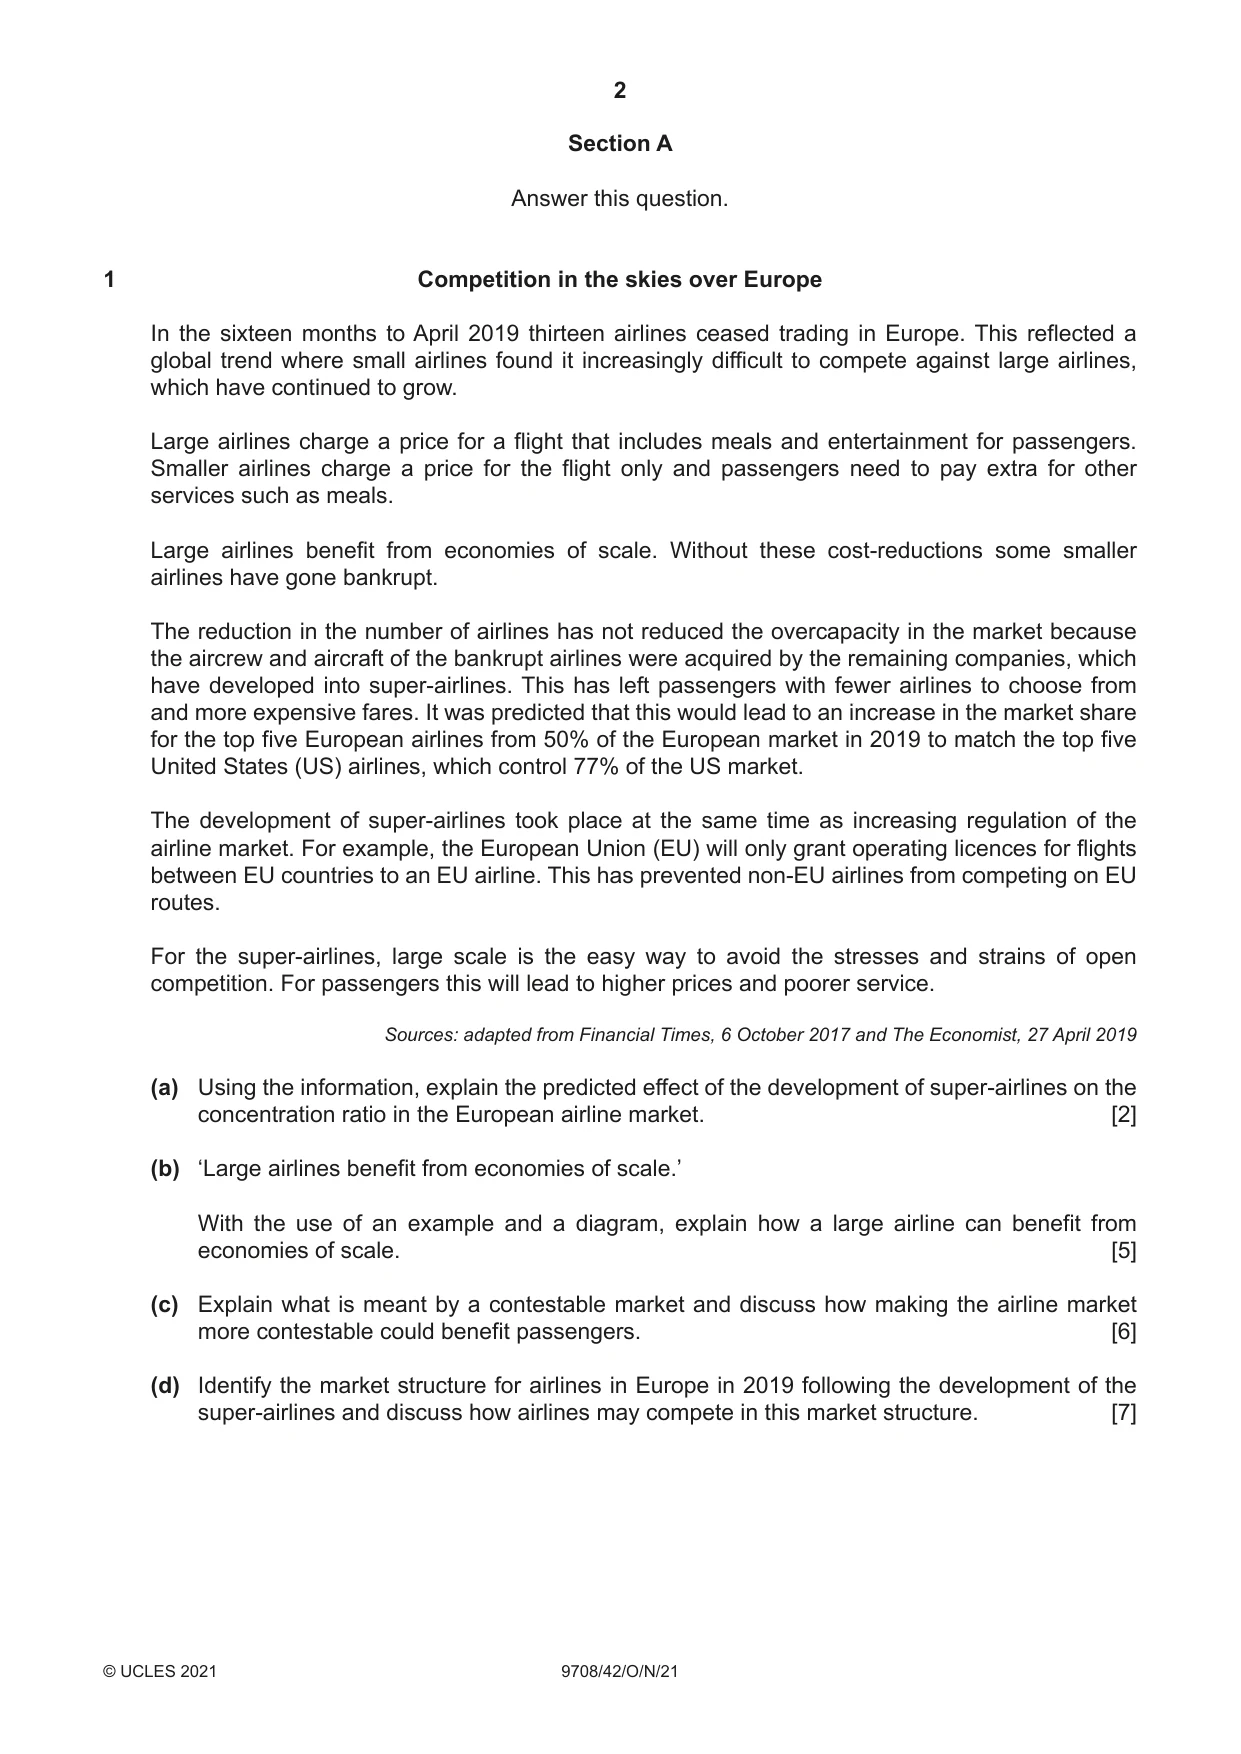
1 Competition in the skies over Europe In the sixteen months to April 2019 thirteen airlines ceased trading in Europe. This reflected a global trend where small airlines found it increasingly difficult to compete against large airlines, which have continued to grow. Large airlines charge a price for a flight that includes meals and entertainment for passengers. Smaller airlines charge a price for the flight only and passengers need to pay extra for other services such as meals. Large airlines benefit from economies of scale. Without these cost-reductions some smaller airlines have gone bankrupt. The reduction in the number of airlines has not reduced the overcapacity in the market because the aircrew and aircraft of the bankrupt airlines were acquired by the remaining companies, which have developed into super-airlines. This has left passengers with fewer airlines to choose from and more expensive fares. It was predicted that this would lead to an increase in the market share for the top five European airlines from 50% of the European market in 2019 to match the top five United States (US) airlines, which control 77% of the US market. The development of super-airlines took place at the same time as increasing regulation of the airline market. For example, the European Union (EU) will only grant operating licences for flights between EU countries to an EU airline. This has prevented non-EU airlines from competing on EU routes. For the super-airlines, large scale is the easy way to avoid the stresses and strains of open competition. For passengers this will lead to higher prices and poorer service. Sources: adapted from Financial Times, 6 October 2017 and The Economist, 27 April 2019 (a) Using the information, explain the predicted effect of the development of super-airlines on the concentration ratio in the European airline market. [2] (b) ‘Large airlines benefit from economies of scale.’ With the use of an example and a diagram, explain how a large airline can benefit from economies of scale. [5] (c) Explain what is meant by a contestable market and discuss how making the airline market more contestable could benefit passengers. [6] (d) Identify the market structure for airlines in Europe in 2019 following the development of the super-airlines and discuss how airlines may compete in this market structure. [7]
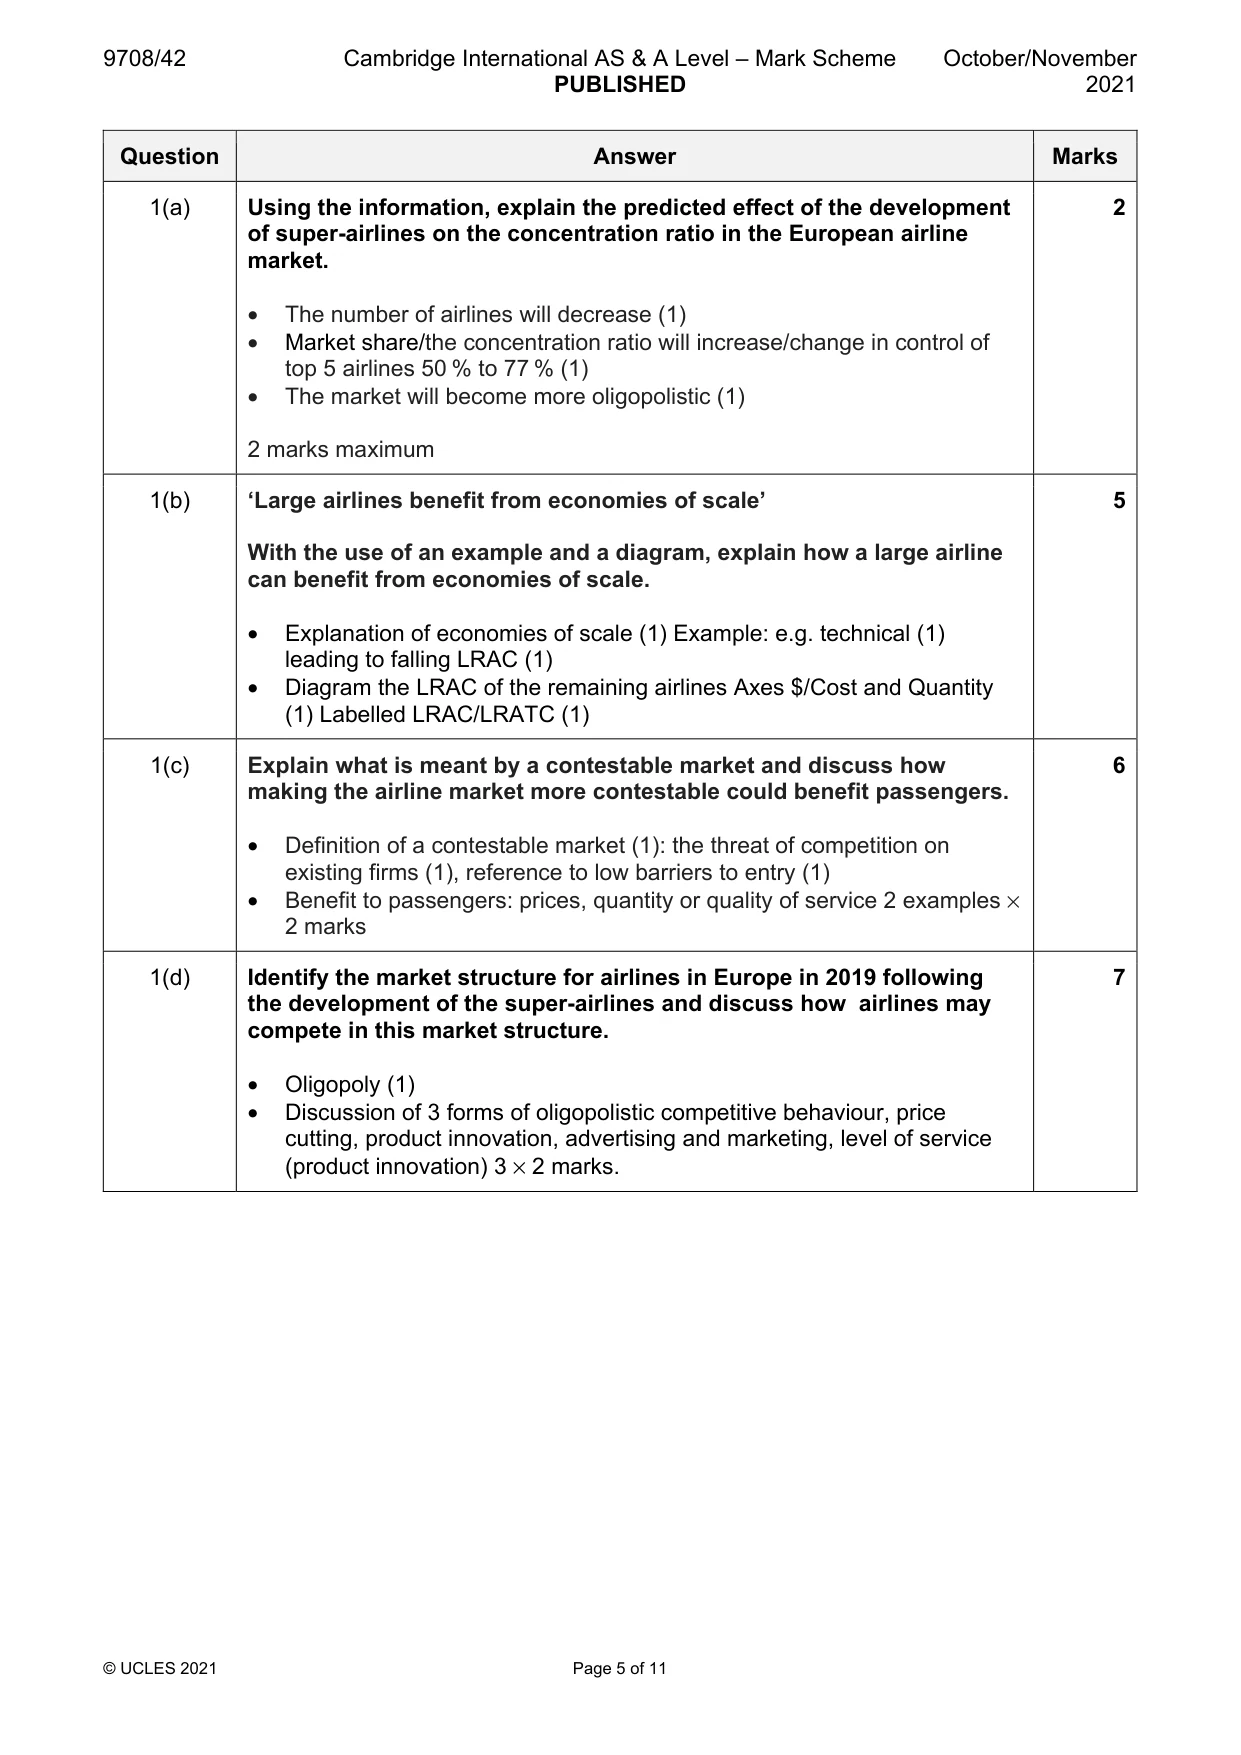
Mark scheme: Question Answer Marks 1(a) Using the information, explain the predicted effect of the development 2 of super-airlines on the concentration ratio in the European airline market. • The number of airlines will decrease (1) • Market share/the concentration ratio will increase/change in control of top 5 airlines 50 % to 77 % (1) • The market will become more oligopolistic (1) 2 marks maximum 1(b) ‘Large airlines benefit from economies of scale’ 5 With the use of an example and a diagram, explain how a large airline can benefit from economies of scale. • Explanation of economies of scale (1) Example: e.g. technical (1) leading to falling LRAC (1) • Diagram the LRAC of the remaining airlines Axes $/Cost and Quantity (1) Labelled LRAC/LRATC (1) 1(c) Explain what is meant by a contestable market and discuss how 6 making the airline market more contestable could benefit passengers. • Definition of a contestable market (1): the threat of competition on existing firms (1), reference to low barriers to entry (1) • Benefit to passengers: prices, quantity or quality of service 2 examples × 2 marks 1(d) Identify the market structure for airlines in Europe in 2019 following 7 the development of the super-airlines and discuss how airlines may compete in this market structure. • Oligopoly (1) • Discussion of 3 forms of oligopolistic competitive behaviour, price cutting, product innovation, advertising and marketing, level of service (product innovation) 3 × 2 marks.
Q2 · Discuss whether market failure can be successfully eliminated by governments
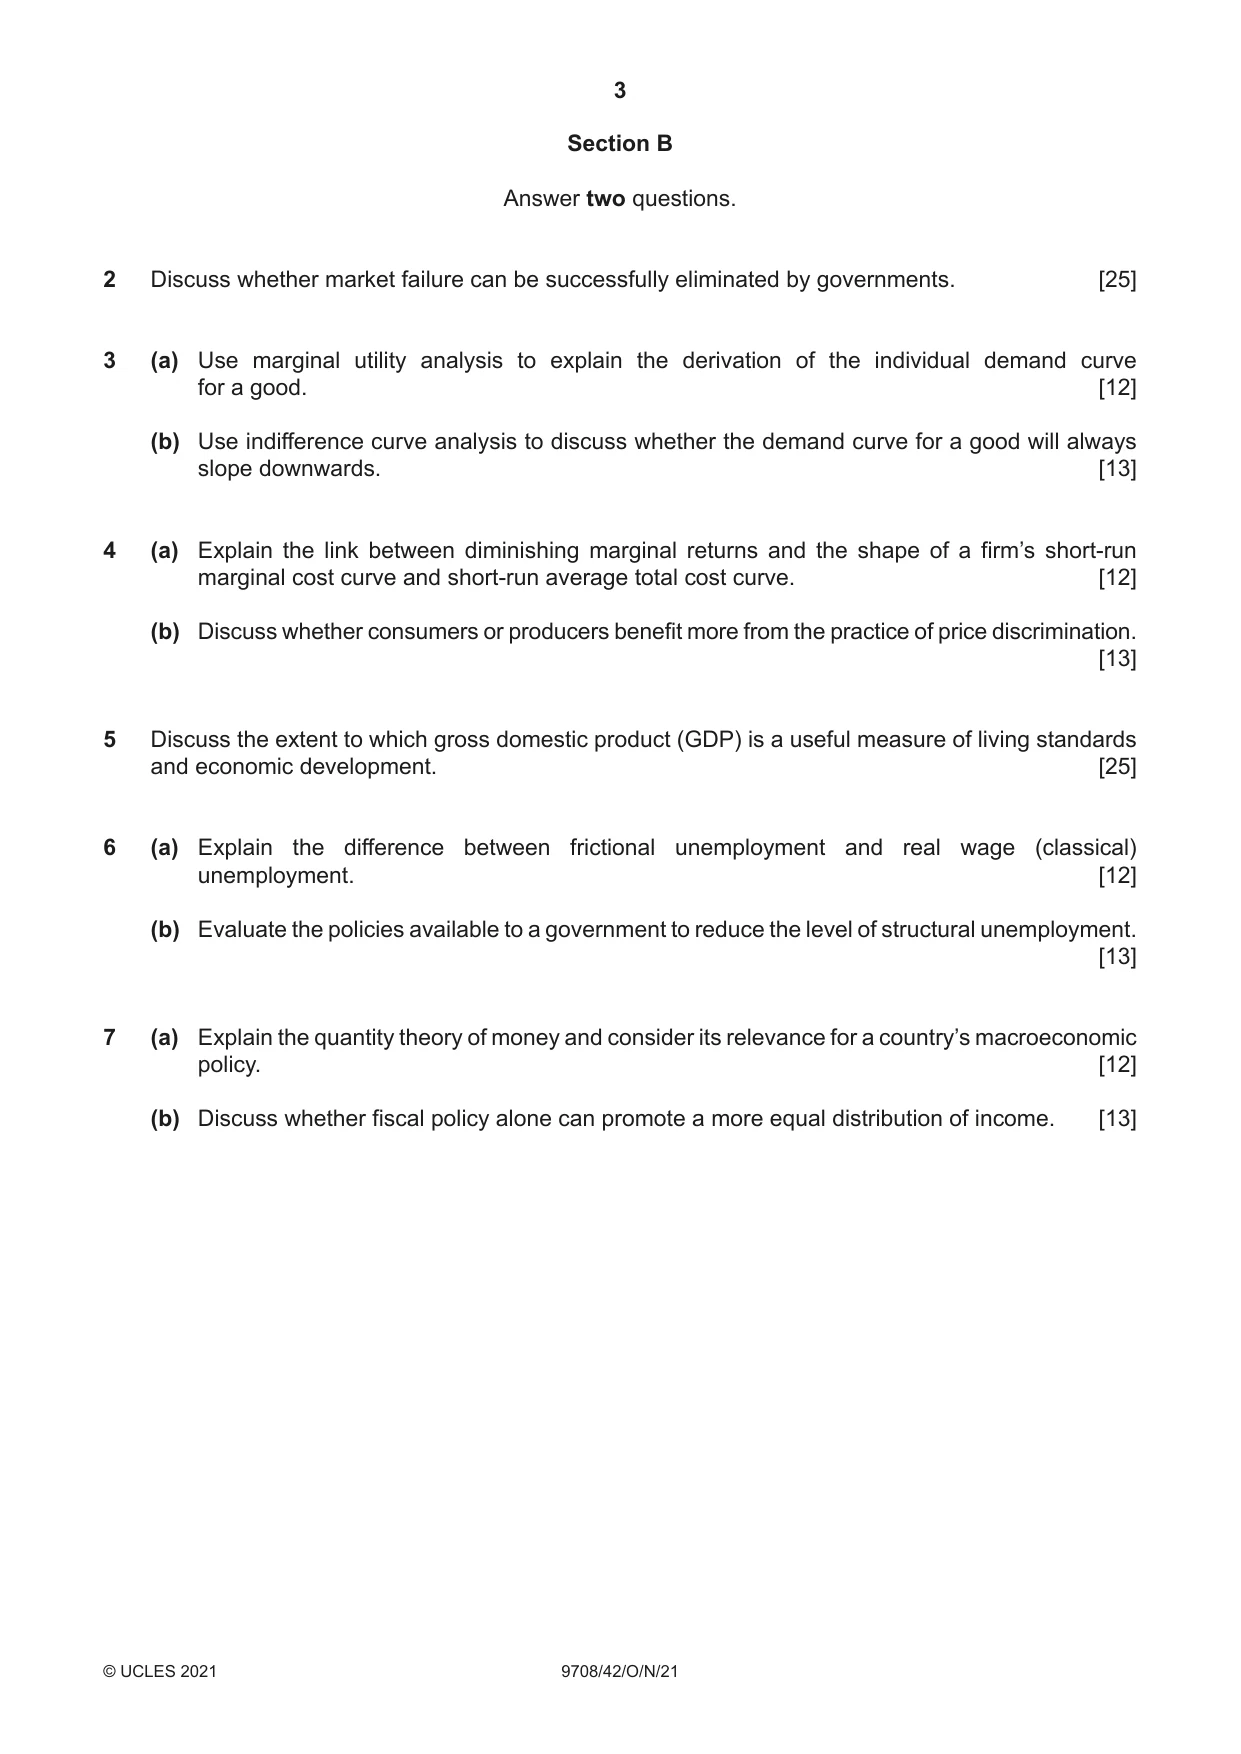
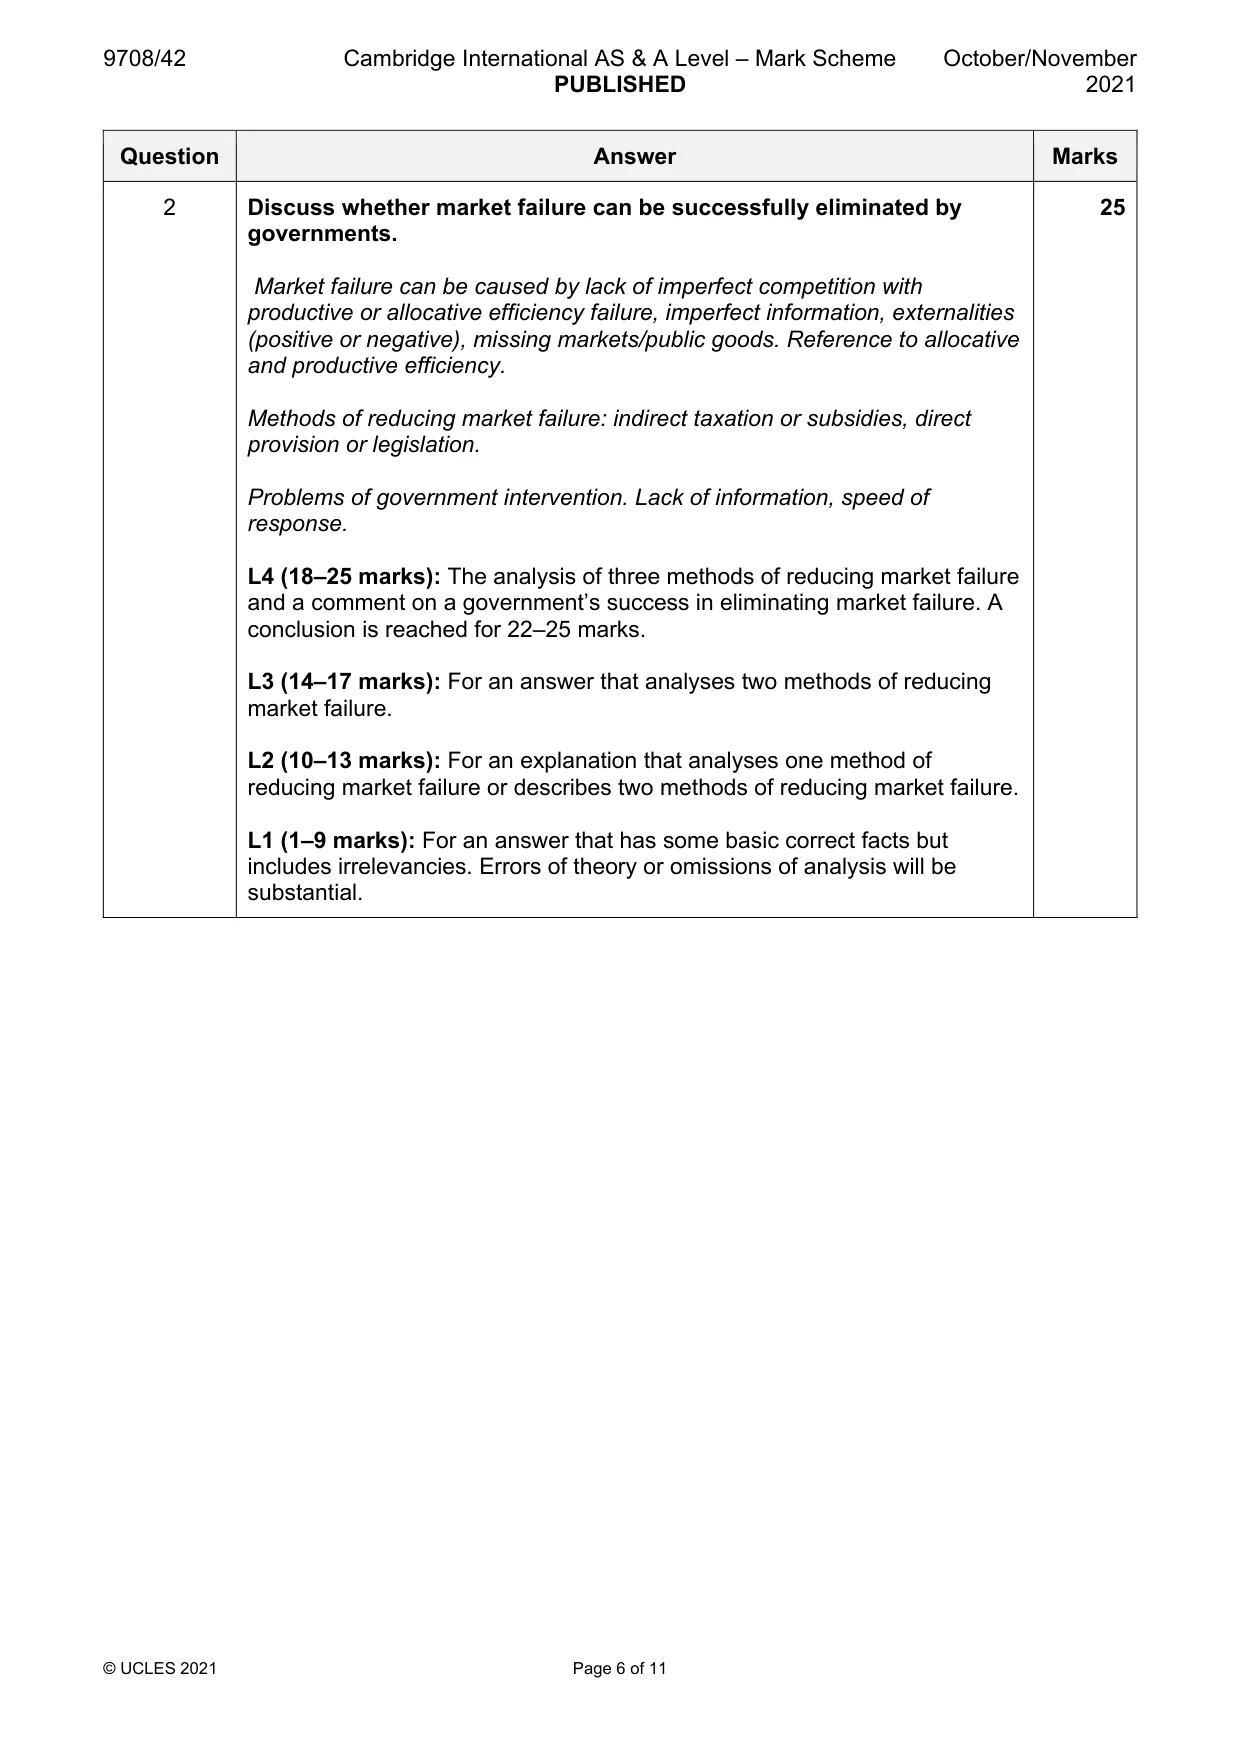
2 Discuss whether market failure can be successfully eliminated by governments. [25]
Mark scheme: 2 Discuss whether market failure can be successfully eliminated by 25 governments. Market failure can be caused by lack of imperfect competition with productive or allocative efficiency failure, imperfect information, externalities (positive or negative), missing markets/public goods. Reference to allocative and productive efficiency. Methods of reducing market failure: indirect taxation or subsidies, direct provision or legislation. Problems of government intervention. Lack of information, speed of response. L4 (18–25 marks): The analysis of three methods of reducing market failure and a comment on a government’s success in eliminating market failure. A conclusion is reached for 22–25 marks. L3 (14–17 marks): For an answer that analyses two methods of reducing market failure. L2 (10–13 marks): For an explanation that analyses one method of reducing market failure or describes two methods of reducing market failure. L1 (1–9 marks): For an answer that has some basic correct facts but includes irrelevancies. Errors of theory or omissions of analysis will be substantial.
Q3 · Use marginal utility analysis to explain the derivation of the individual demand curve…
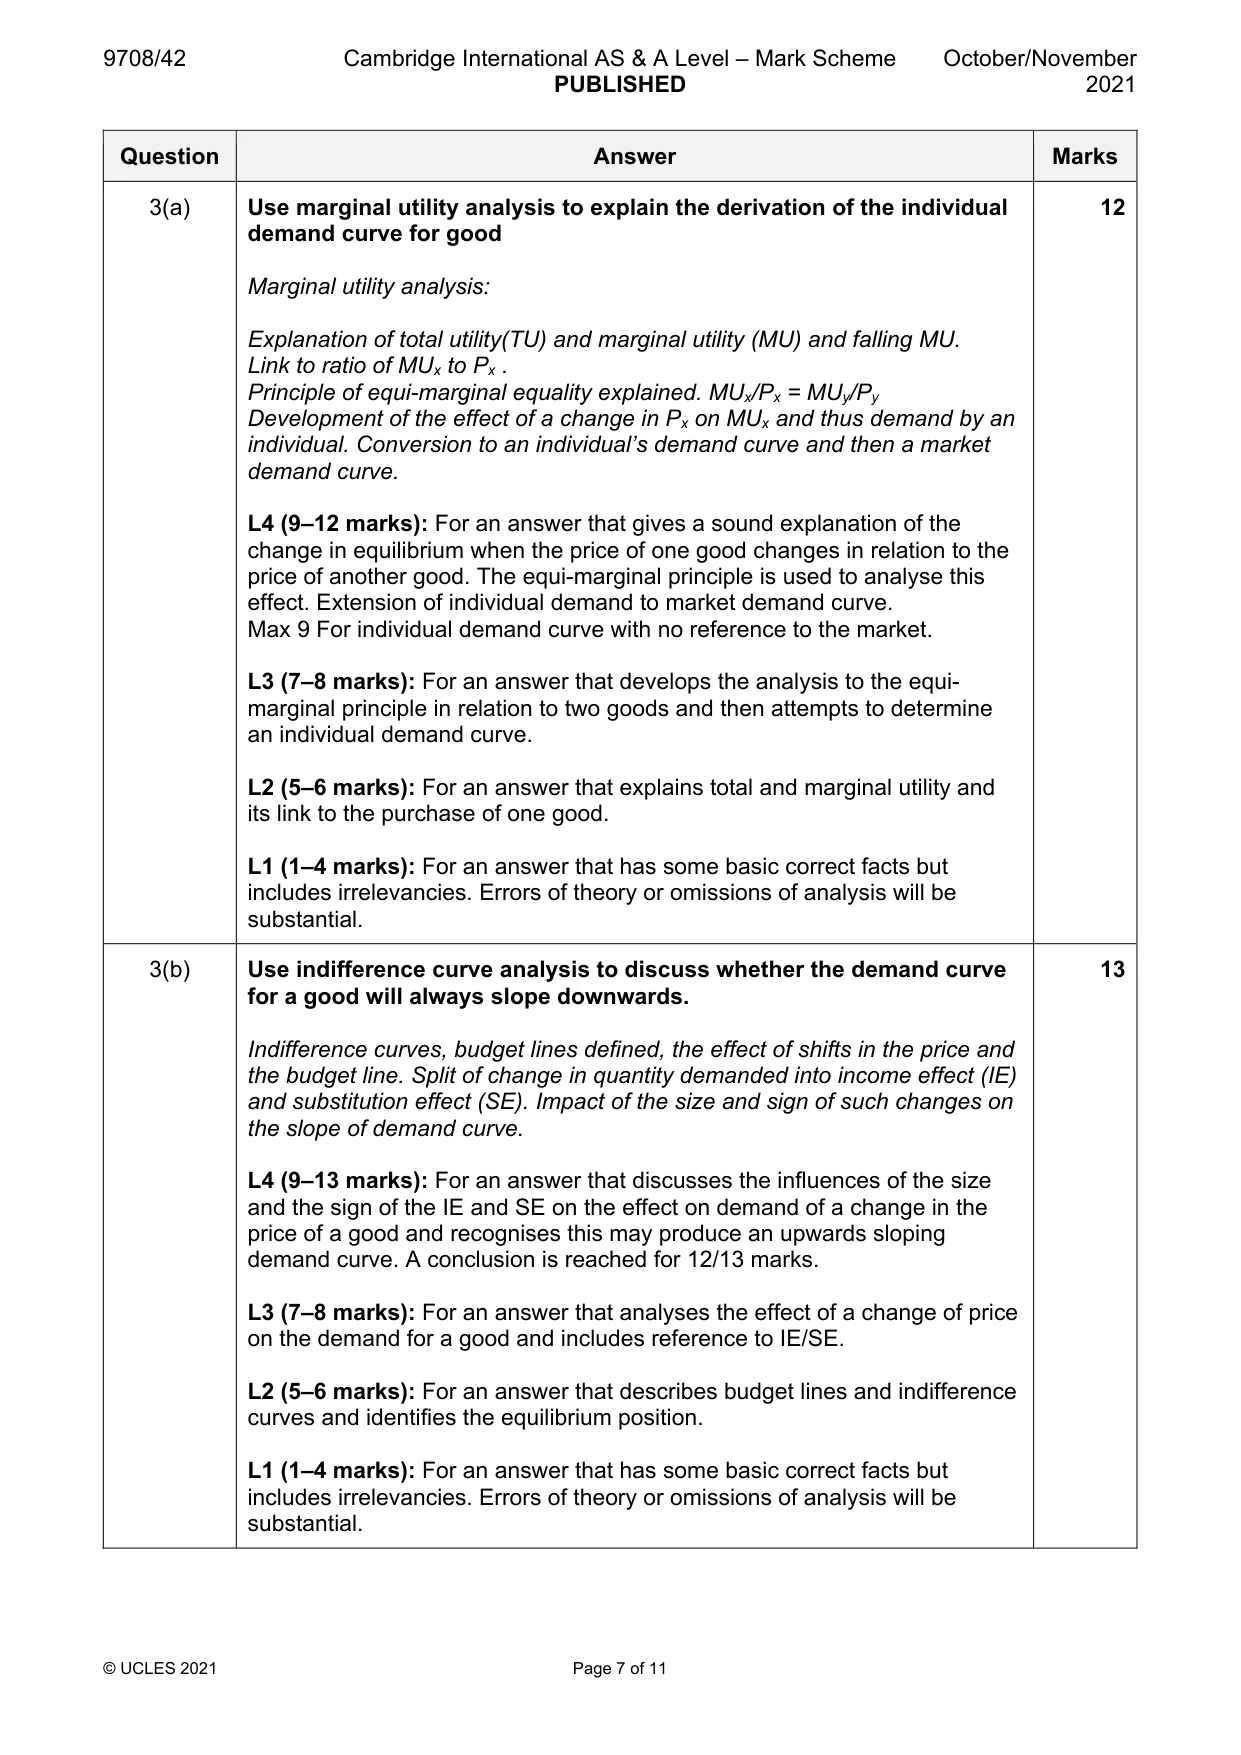
3 (a) Use marginal utility analysis to explain the derivation of the individual demand curve for a good. [12] (b) Use indifference curve analysis to discuss whether the demand curve for a good will always slope downwards. [13]
Mark scheme: 3(a) Use marginal utility analysis to explain the derivation of the individual 12 demand curve for good Marginal utility analysis: Explanation of total utility(TU) and marginal utility (MU) and falling MU. Link to ratio of MUx to Px . Principle of equi-marginal equality explained. MUx/Px = MUy/Py Development of the effect of a change in Px on MUx and thus demand by an individual. Conversion to an individual’s demand curve and then a market demand curve. L4 (9–12 marks): For an answer that gives a sound explanation of the change in equilibrium when the price of one good changes in relation to the price of another good. The equi-marginal principle is used to analyse this effect. Extension of individual demand to market demand curve. Max 9 For individual demand curve with no reference to the market. L3 (7–8 marks): For an answer that develops the analysis to the equi- marginal principle in relation to two goods and then attempts to determine an individual demand curve. L2 (5–6 marks): For an answer that explains total and marginal utility and its link to the purchase of one good. L1 (1–4 marks): For an answer that has some basic correct facts but includes irrelevancies. Errors of theory or omissions of analysis will be substantial. 3(b) Use indifference curve analysis to discuss whether the demand curve 13 for a good will always slope downwards. Indifference curves, budget lines defined, the effect of shifts in the price and the budget line. Split of change in quantity demanded into income effect (IE) and substitution effect (SE). Impact of the size and sign of such changes on the slope of demand curve. L4 (9–13 marks): For an answer that discusses the influences of the size and the sign of the IE and SE on the effect on demand of a change in the price of a good and recognises this may produce an upwards sloping demand curve. A conclusion is reached for 12/13 marks. L3 (7–8 marks): For an answer that analyses the effect of a change of price on the demand for a good and includes reference to IE/SE. L2 (5–6 marks): For an answer that describes budget lines and indifference curves and identifies the equilibrium position. L1 (1–4 marks): For an answer that has some basic correct facts but includes irrelevancies. Errors of theory or omissions of analysis will be substantial.
Q4 · Explain the link between diminishing marginal returns and the shape of a firm’s short-run…
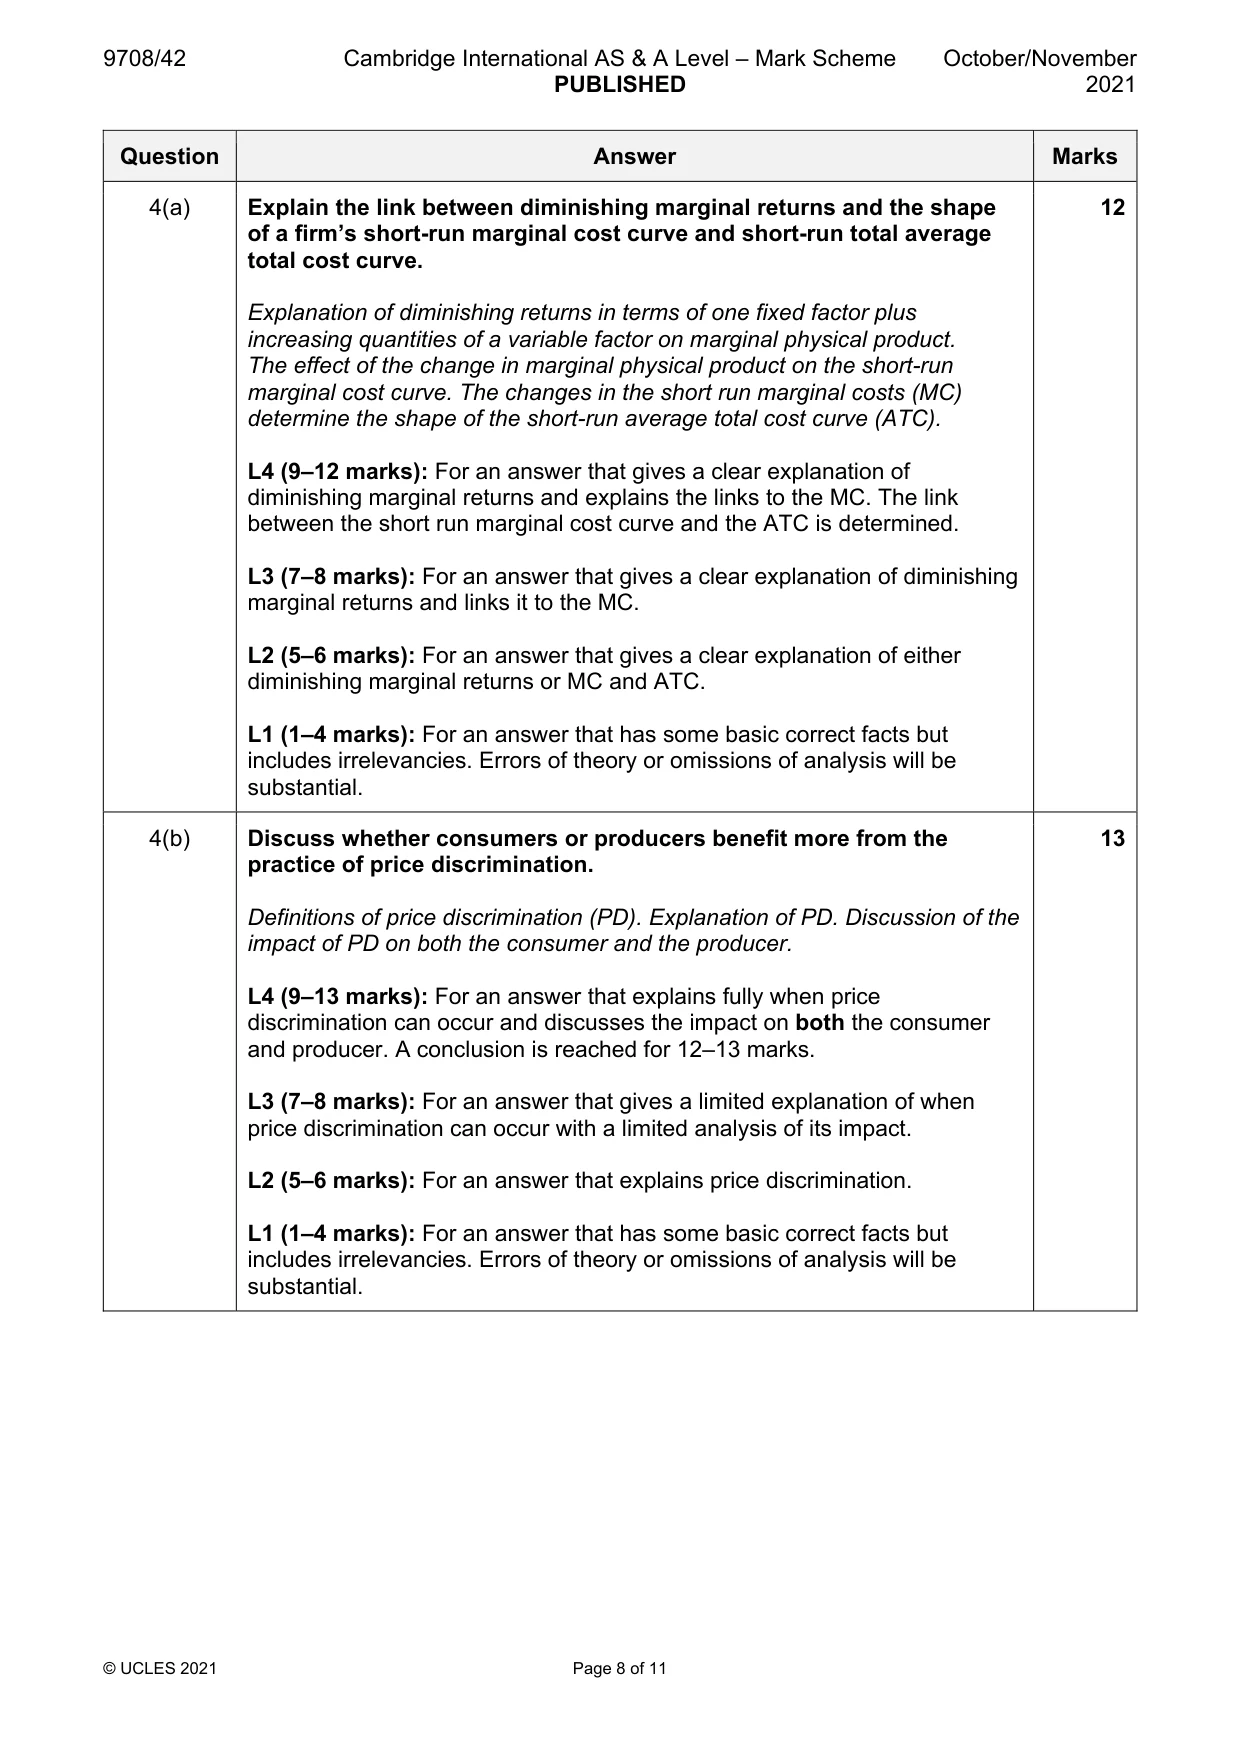
4 (a) Explain the link between diminishing marginal returns and the shape of a firm’s short-run marginal cost curve and short-run average total cost curve. [12] (b) Discuss whether consumers or producers benefit more from the practice of price discrimination. [13]
Mark scheme: 4(a) Explain the link between diminishing marginal returns and the shape 12 of a firm’s short-run marginal cost curve and short-run total average total cost curve. Explanation of diminishing returns in terms of one fixed factor plus increasing quantities of a variable factor on marginal physical product. The effect of the change in marginal physical product on the short-run marginal cost curve. The changes in the short run marginal costs (MC) determine the shape of the short-run average total cost curve (ATC). L4 (9–12 marks): For an answer that gives a clear explanation of diminishing marginal returns and explains the links to the MC. The link between the short run marginal cost curve and the ATC is determined. L3 (7–8 marks): For an answer that gives a clear explanation of diminishing marginal returns and links it to the MC. L2 (5–6 marks): For an answer that gives a clear explanation of either diminishing marginal returns or MC and ATC. L1 (1–4 marks): For an answer that has some basic correct facts but includes irrelevancies. Errors of theory or omissions of analysis will be substantial. 4(b) Discuss whether consumers or producers benefit more from the 13 practice of price discrimination. Definitions of price discrimination (PD). Explanation of PD. Discussion of the impact of PD on both the consumer and the producer. L4 (9–13 marks): For an answer that explains fully when price discrimination can occur and discusses the impact on both the consumer and producer. A conclusion is reached for 12–13 marks. L3 (7–8 marks): For an answer that gives a limited explanation of when price discrimination can occur with a limited analysis of its impact. L2 (5–6 marks): For an answer that explains price discrimination. L1 (1–4 marks): For an answer that has some basic correct facts but includes irrelevancies. Errors of theory or omissions of analysis will be substantial.
Q5 · Discuss the extent to which gross domestic product (GDP) is a useful measure of living…
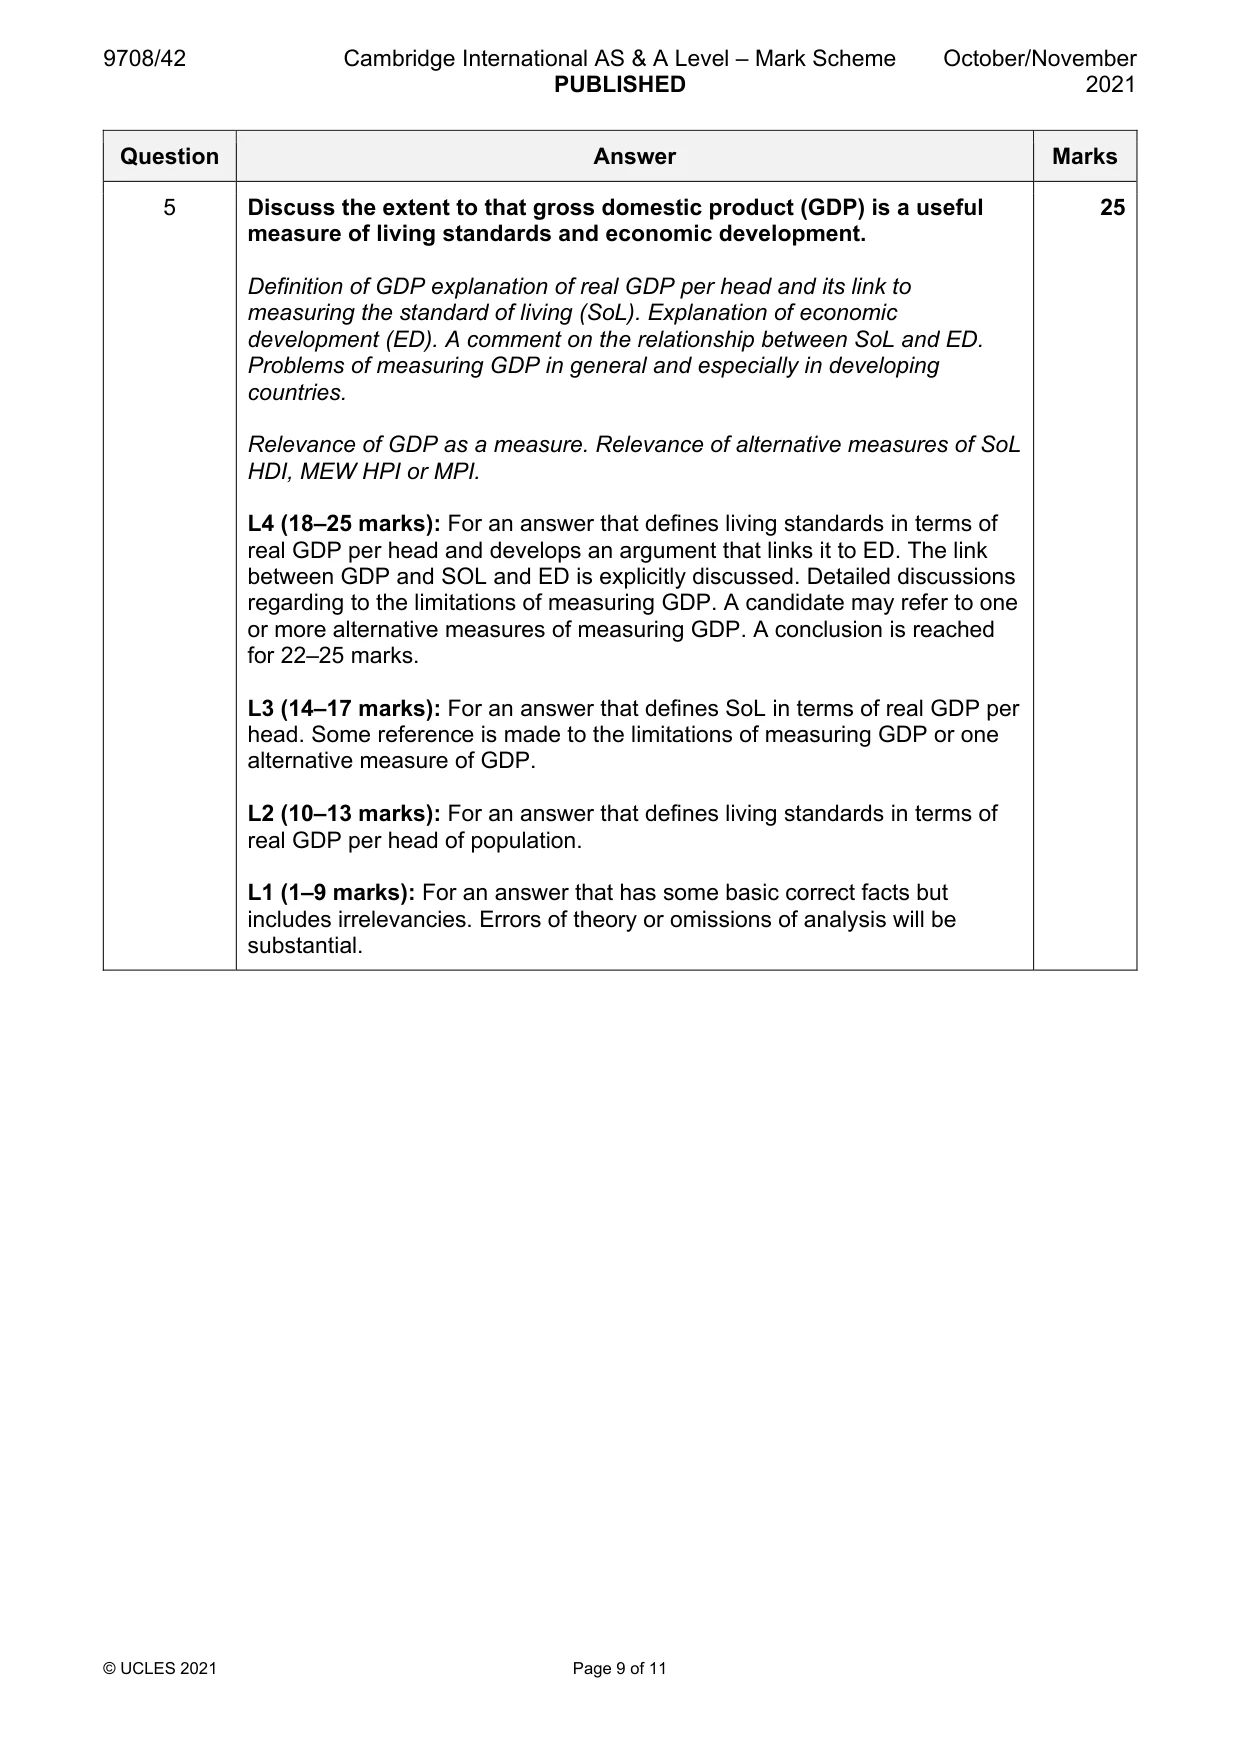
5 Discuss the extent to which gross domestic product (GDP) is a useful measure of living standards and economic development. [25]
Mark scheme: 5 Discuss the extent to that gross domestic product (GDP) is a useful 25 measure of living standards and economic development. Definition of GDP explanation of real GDP per head and its link to measuring the standard of living (SoL). Explanation of economic development (ED). A comment on the relationship between SoL and ED. Problems of measuring GDP in general and especially in developing countries. Relevance of GDP as a measure. Relevance of alternative measures of SoL HDI, MEW HPI or MPI. L4 (18–25 marks): For an answer that defines living standards in terms of real GDP per head and develops an argument that links it to ED. The link between GDP and SOL and ED is explicitly discussed. Detailed discussions regarding to the limitations of measuring GDP. A candidate may refer to one or more alternative measures of measuring GDP. A conclusion is reached for 22–25 marks. L3 (14–17 marks): For an answer that defines SoL in terms of real GDP per head. Some reference is made to the limitations of measuring GDP or one alternative measure of GDP. L2 (10–13 marks): For an answer that defines living standards in terms of real GDP per head of population. L1 (1–9 marks): For an answer that has some basic correct facts but includes irrelevancies. Errors of theory or omissions of analysis will be substantial.
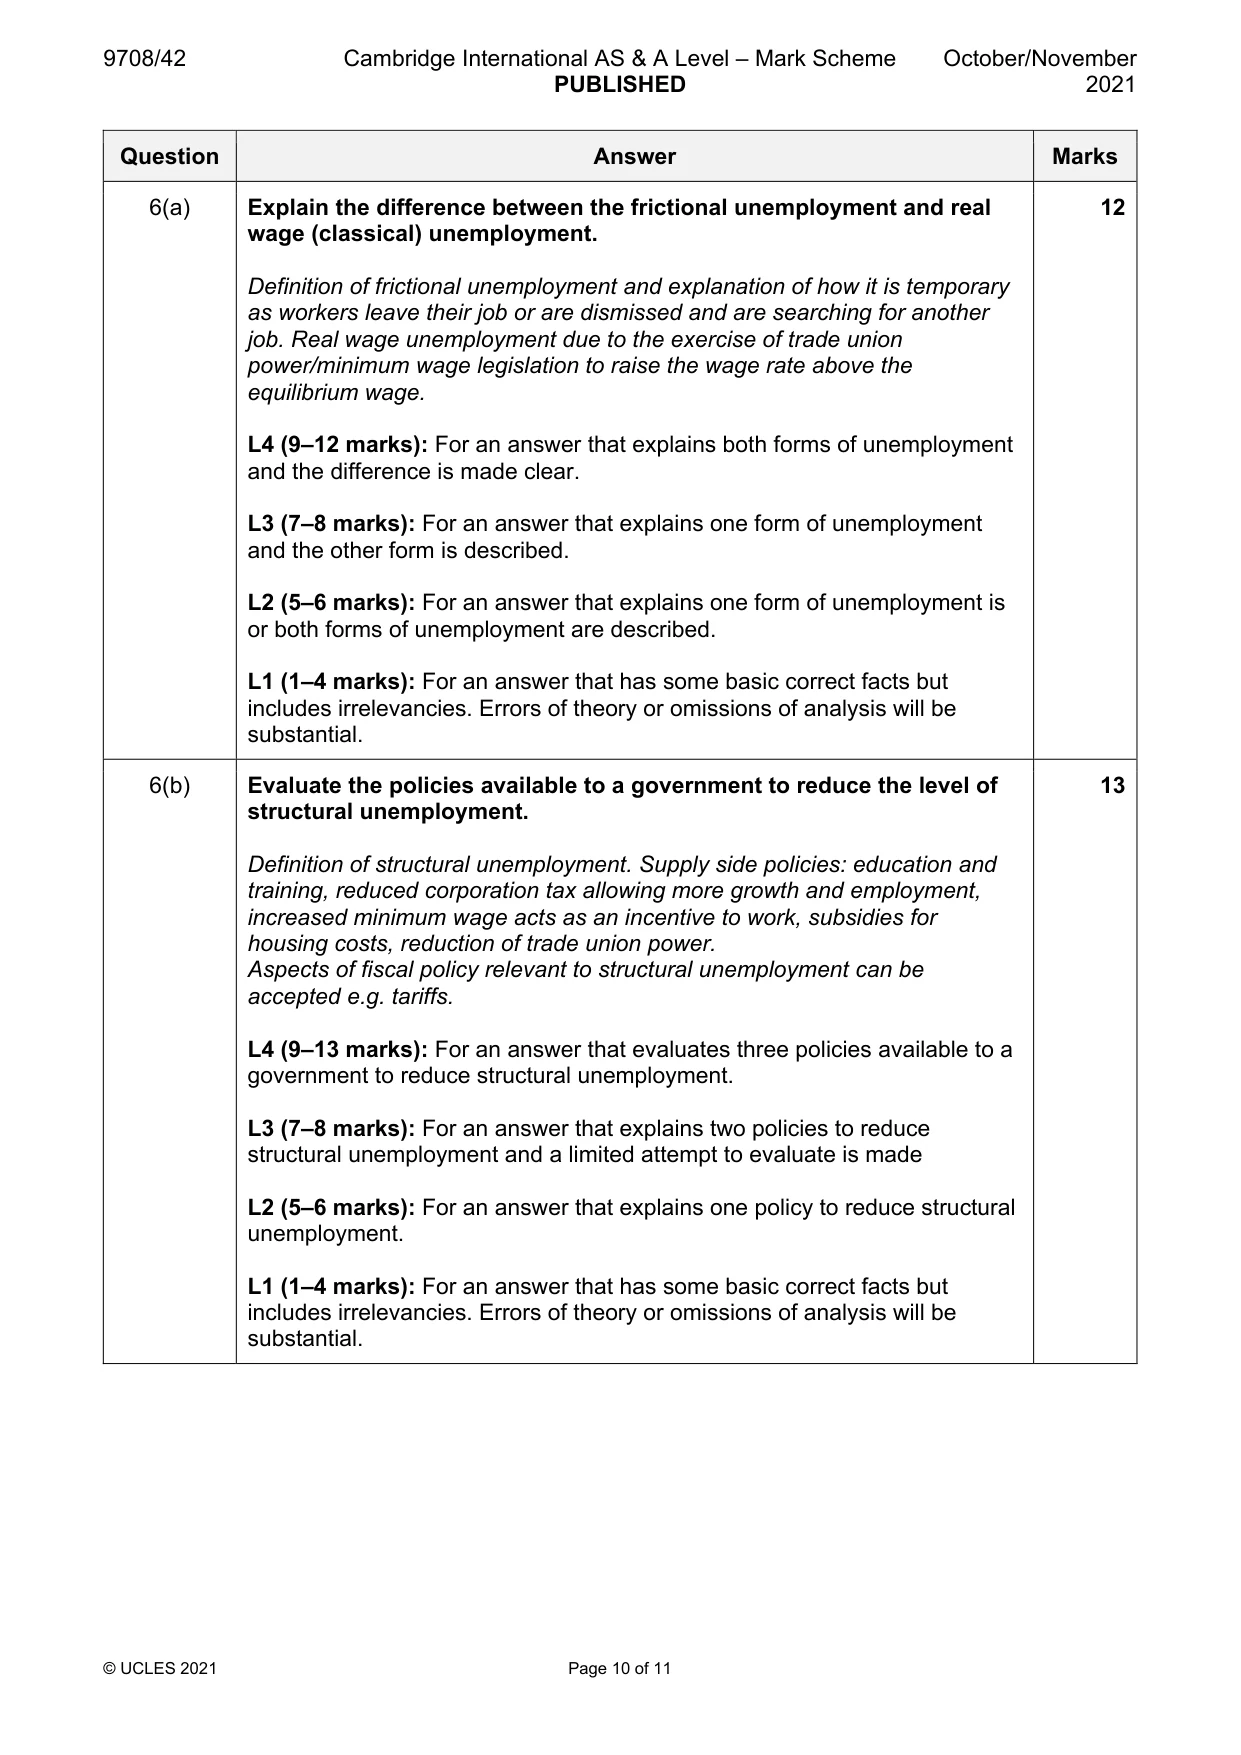
Q6 · Explain the difference between frictional unemployment and real wage (classical)…
6 (a) Explain the difference between frictional unemployment and real wage (classical) unemployment. [12] (b) Evaluate the policies available to a government to reduce the level of structural unemployment. [13]
Mark scheme: 6(a) Explain the difference between the frictional unemployment and real 12 wage (classical) unemployment. Definition of frictional unemployment and explanation of how it is temporary as workers leave their job or are dismissed and are searching for another job. Real wage unemployment due to the exercise of trade union power/minimum wage legislation to raise the wage rate above the equilibrium wage. L4 (9–12 marks): For an answer that explains both forms of unemployment and the difference is made clear. L3 (7–8 marks): For an answer that explains one form of unemployment and the other form is described. L2 (5–6 marks): For an answer that explains one form of unemployment is or both forms of unemployment are described. L1 (1–4 marks): For an answer that has some basic correct facts but includes irrelevancies. Errors of theory or omissions of analysis will be substantial. 6(b) Evaluate the policies available to a government to reduce the level of 13 structural unemployment. Definition of structural unemployment. Supply side policies: education and training, reduced corporation tax allowing more growth and employment, increased minimum wage acts as an incentive to work, subsidies for housing costs, reduction of trade union power. Aspects of fiscal policy relevant to structural unemployment can be accepted e.g. tariffs. L4 (9–13 marks): For an answer that evaluates three policies available to a government to reduce structural unemployment. L3 (7–8 marks): For an answer that explains two policies to reduce structural unemployment and a limited attempt to evaluate is made L2 (5–6 marks): For an answer that explains one policy to reduce structural unemployment. L1 (1–4 marks): For an answer that has some basic correct facts but includes irrelevancies. Errors of theory or omissions of analysis will be substantial.
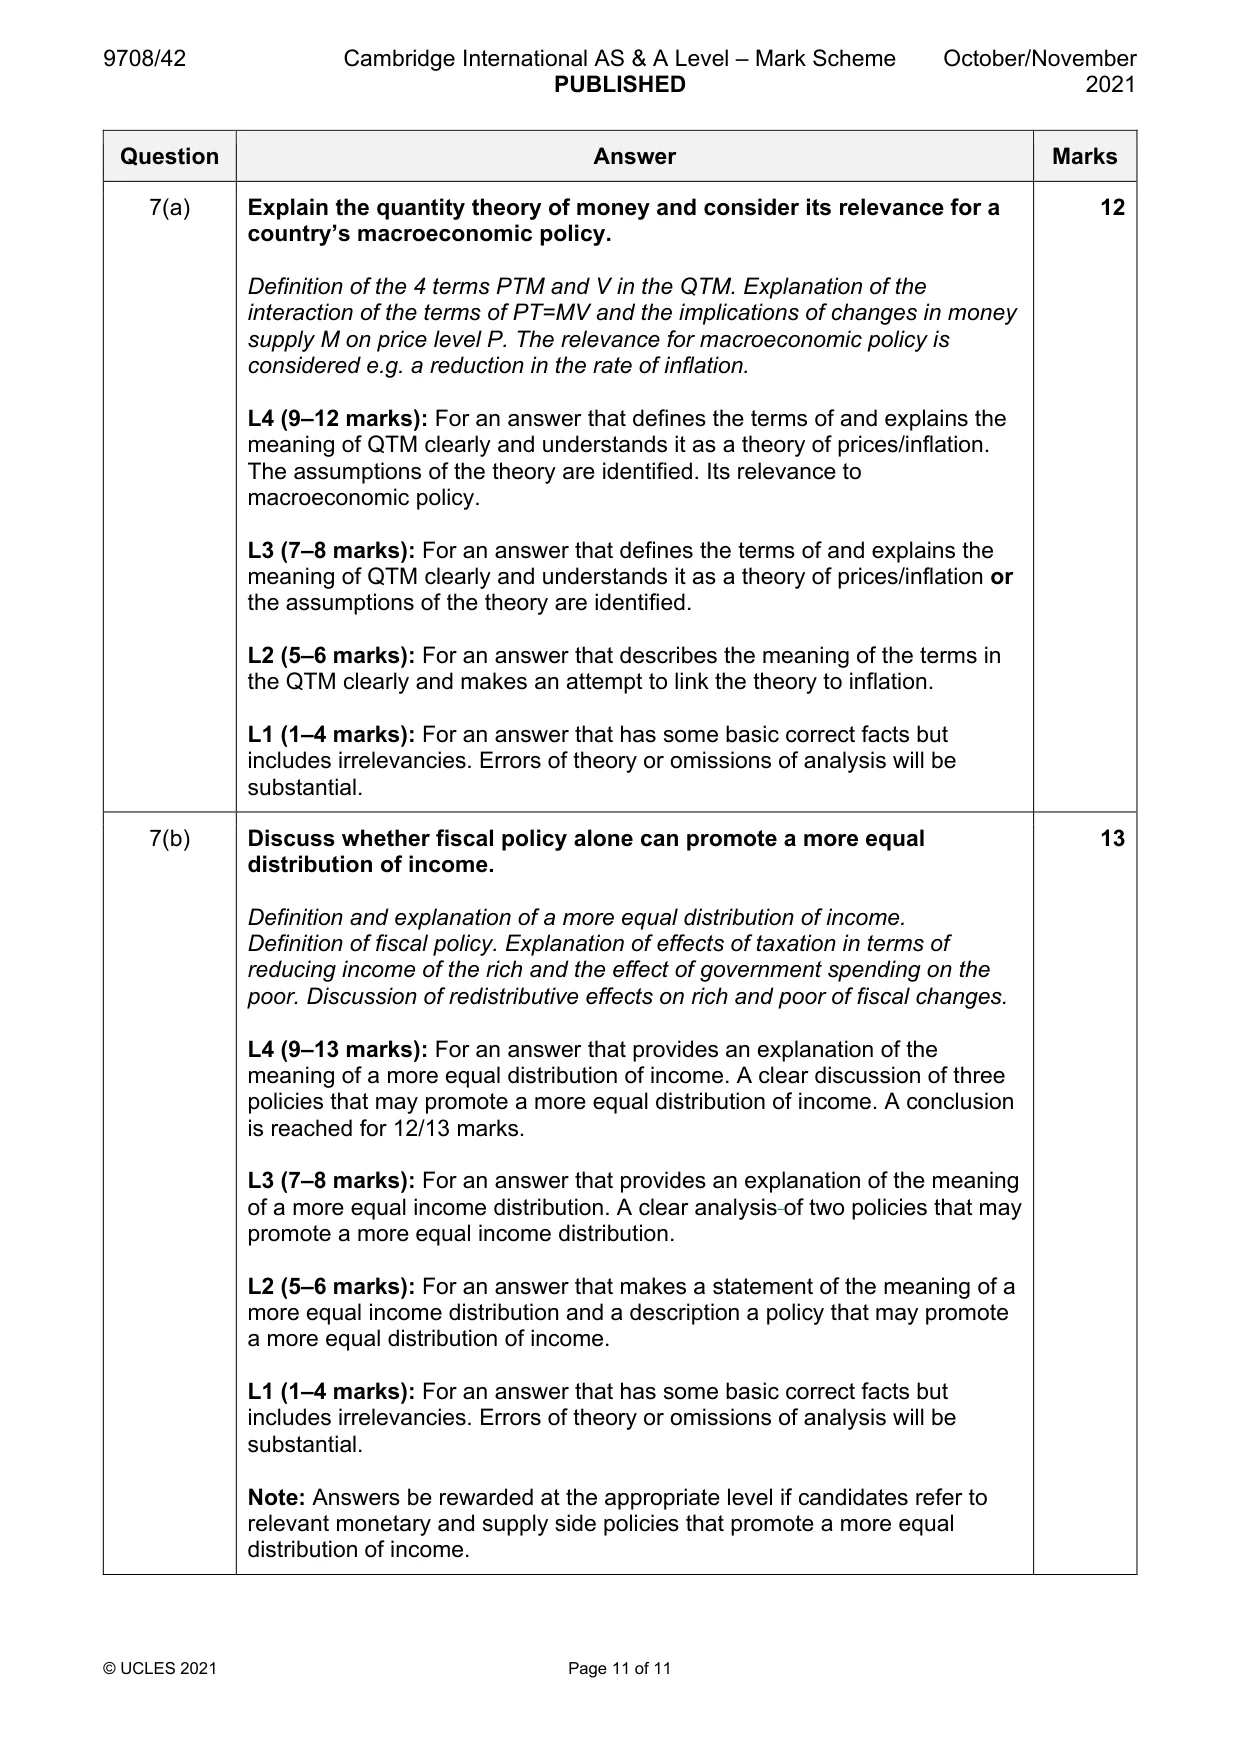
Q7 · Explain the quantity theory of money and consider its relevance for a country’s…
7 (a) Explain the quantity theory of money and consider its relevance for a country’s macroeconomic policy. [12] (b) Discuss whether fiscal policy alone can promote a more equal distribution of income. [13]
Mark scheme: 7(a) Explain the quantity theory of money and consider its relevance for a 12 country’s macroeconomic policy. Definition of the 4 terms PTM and V in the QTM. Explanation of the interaction of the terms of PT=MV and the implications of changes in money supply M on price level P. The relevance for macroeconomic policy is considered e.g. a reduction in the rate of inflation. L4 (9–12 marks): For an answer that defines the terms of and explains the meaning of QTM clearly and understands it as a theory of prices/inflation. The assumptions of the theory are identified. Its relevance to macroeconomic policy. L3 (7–8 marks): For an answer that defines the terms of and explains the meaning of QTM clearly and understands it as a theory of prices/inflation or the assumptions of the theory are identified. L2 (5–6 marks): For an answer that describes the meaning of the terms in the QTM clearly and makes an attempt to link the theory to inflation. L1 (1–4 marks): For an answer that has some basic correct facts but includes irrelevancies. Errors of theory or omissions of analysis will be substantial. 7(b) Discuss whether fiscal policy alone can promote a more equal 13 distribution of income. Definition and explanation of a more equal distribution of income. Definition of fiscal policy. Explanation of effects of taxation in terms of reducing income of the rich and the effect of government spending on the poor. Discussion of redistributive effects on rich and poor of fiscal changes. L4 (9–13 marks): For an answer that provides an explanation of the meaning of a more equal distribution of income. A clear discussion of three policies that may promote a more equal distribution of income. A conclusion is reached for 12/13 marks. L3 (7–8 marks): For an answer that provides an explanation of the meaning of a more equal income distribution. A clear analysis of two policies that may promote a more equal income distribution. L2 (5–6 marks): For an answer that makes a statement of the meaning of a more equal income distribution and a description a policy that may promote a more equal distribution of income. L1 (1–4 marks): For an answer that has some basic correct facts but includes irrelevancies. Errors of theory or omissions of analysis will be substantial. Note: Answers be rewarded at the appropriate level if candidates refer to relevant monetary and supply side policies that promote a more equal distribution of income.
More questions on Equity and redistribution of income and wealth
What was in this paper
The subtopics covered by these 7 questions, and how many questions each got. Open one in a new tab to see every Cambridge question on it.
What you needed in this session
Cambridge’s own grade thresholds for 2021 Oct/Nov, Paper 4 · Variant 2. A higher threshold means an easier paper — the bar moves with how the cohort did.