Cambridge A Level Economics 9708 — 2017 Oct/Nov Paper 2 · Variant 3
9708/23/O/N/17 · 4 questions · 40 marks · ≈45 min
The question paper and its mark scheme, free to read here and free to download. This is Cambridge’s own paper, exactly as it was sat.
Question paper4 pages
Mark scheme7 pages
Answers below. Sit the paper first if you are practising.
Questions as text
Q1 · The world market for rice Table 1: The World Price of Rice (World average price index…
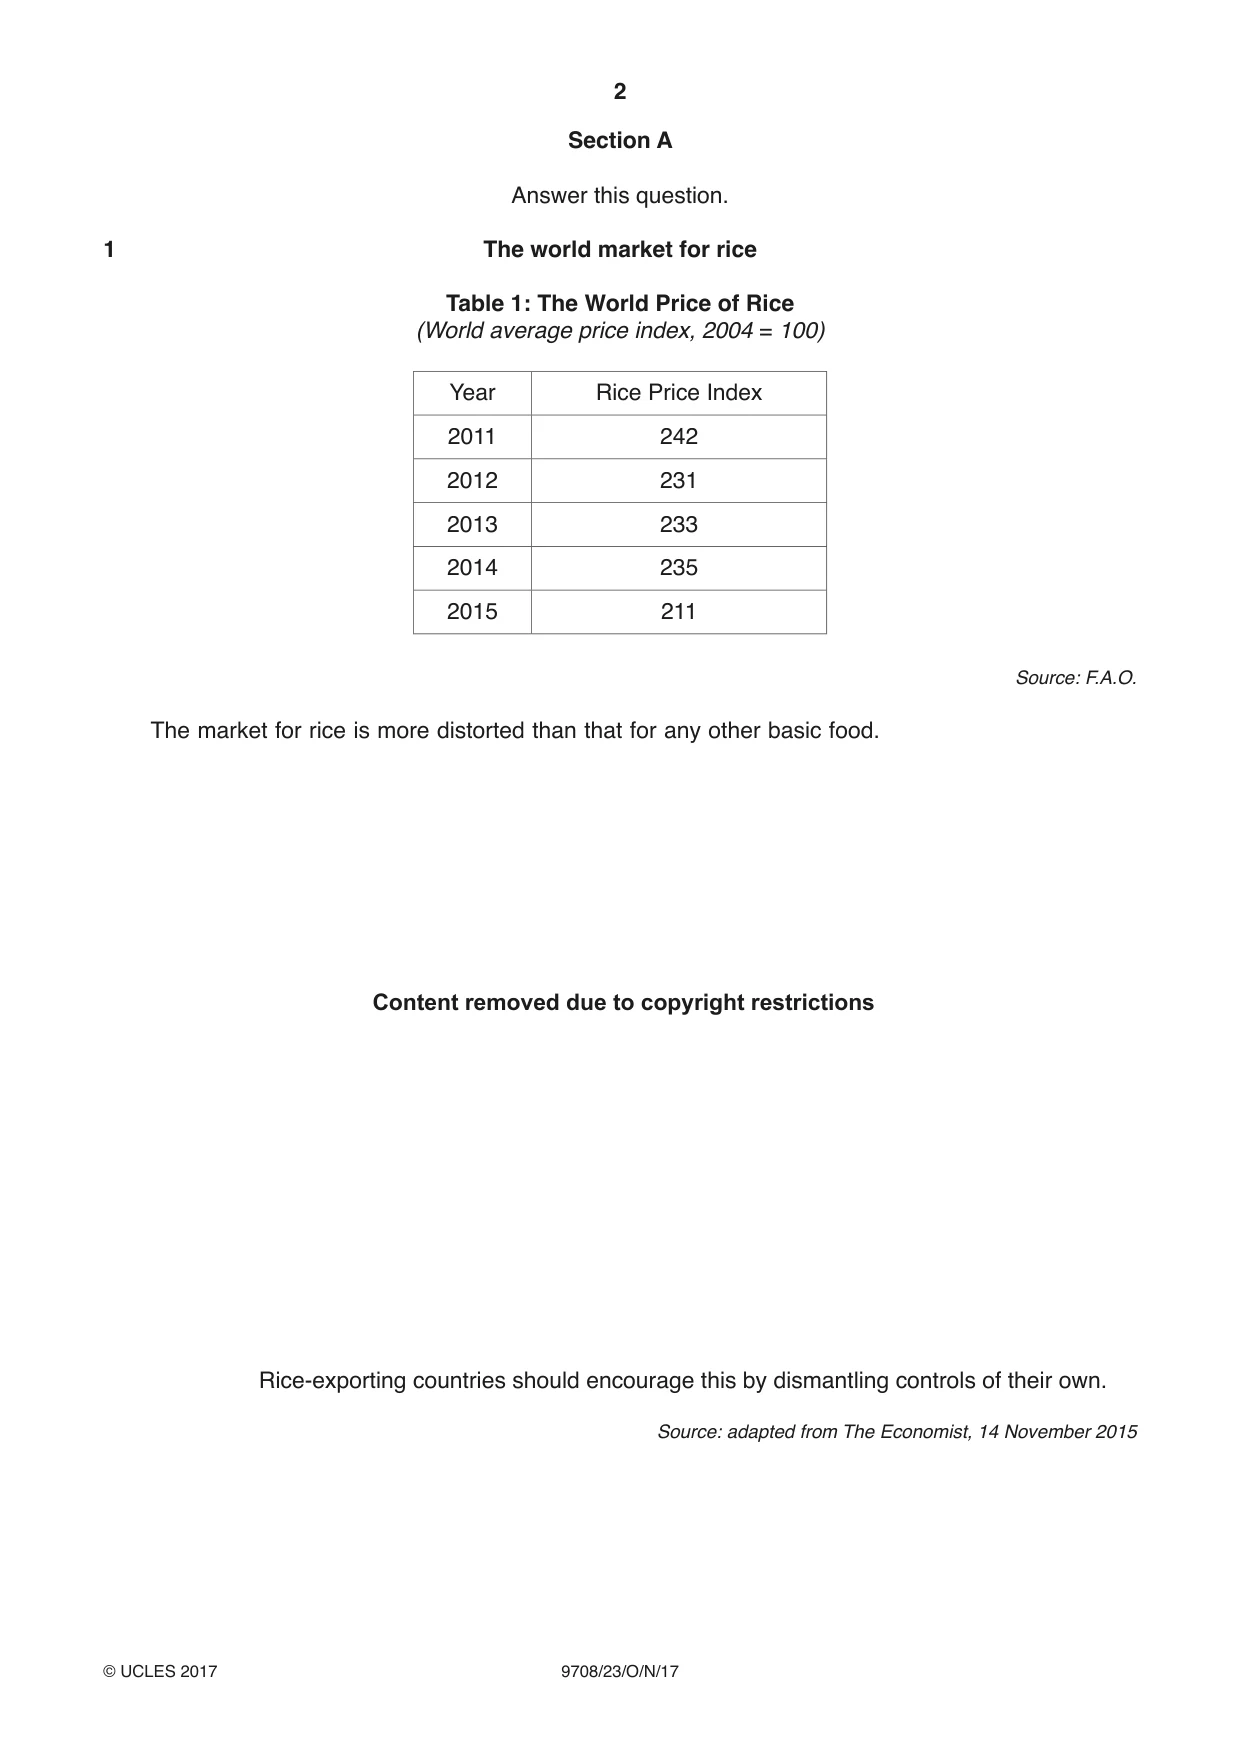
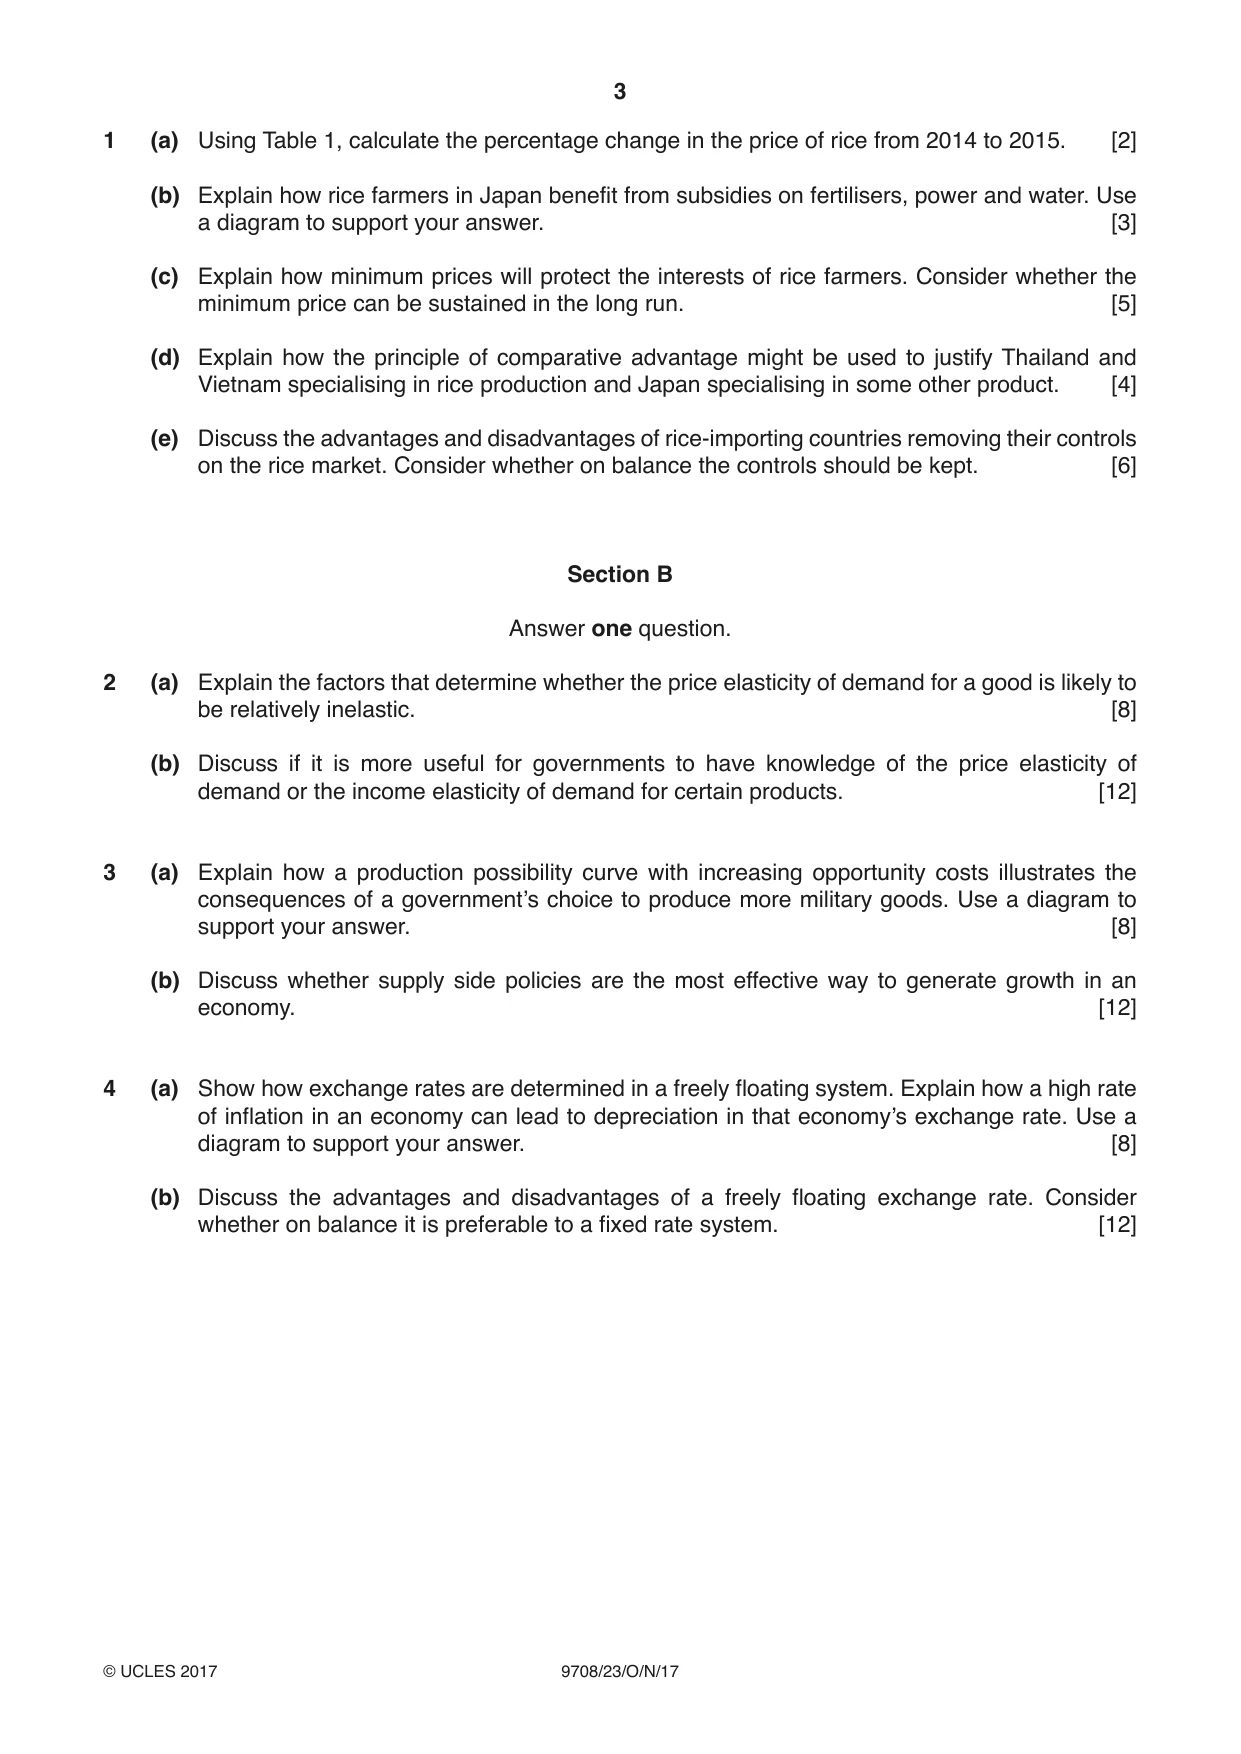
1 The world market for rice Table 1: The World Price of Rice (World average price index, 2004 = 100) Year Rice Price Index 2011 242 2012 231 2013 233 2014 235 2015 211 Source: F.A.O. The market for rice is more distorted than that for any other basic food. Content removed due to copyright restrictions more rice. Rice-exporting countries should encourage this by dismantling controls of their own. Source: adapted from The Economist, 14 November 2015 1 (a) Using Table 1, calculate the percentage change in the price of rice from 2014 to 2015. [2] (b) Explain how rice farmers in Japan benefit from subsidies on fertilisers, power and water. Use a diagram to support your answer. [3] (c) Explain how minimum prices will protect the interests of rice farmers. Consider whether the minimum price can be sustained in the long run. [5] (d) Explain how the principle of comparative advantage might be used to justify Thailand and Vietnam specialising in rice production and Japan specialising in some other product. [4] (e) Discuss the advantages and disadvantages of rice-importing countries removing their controls on the rice market. Consider whether on balance the controls should be kept. [6]
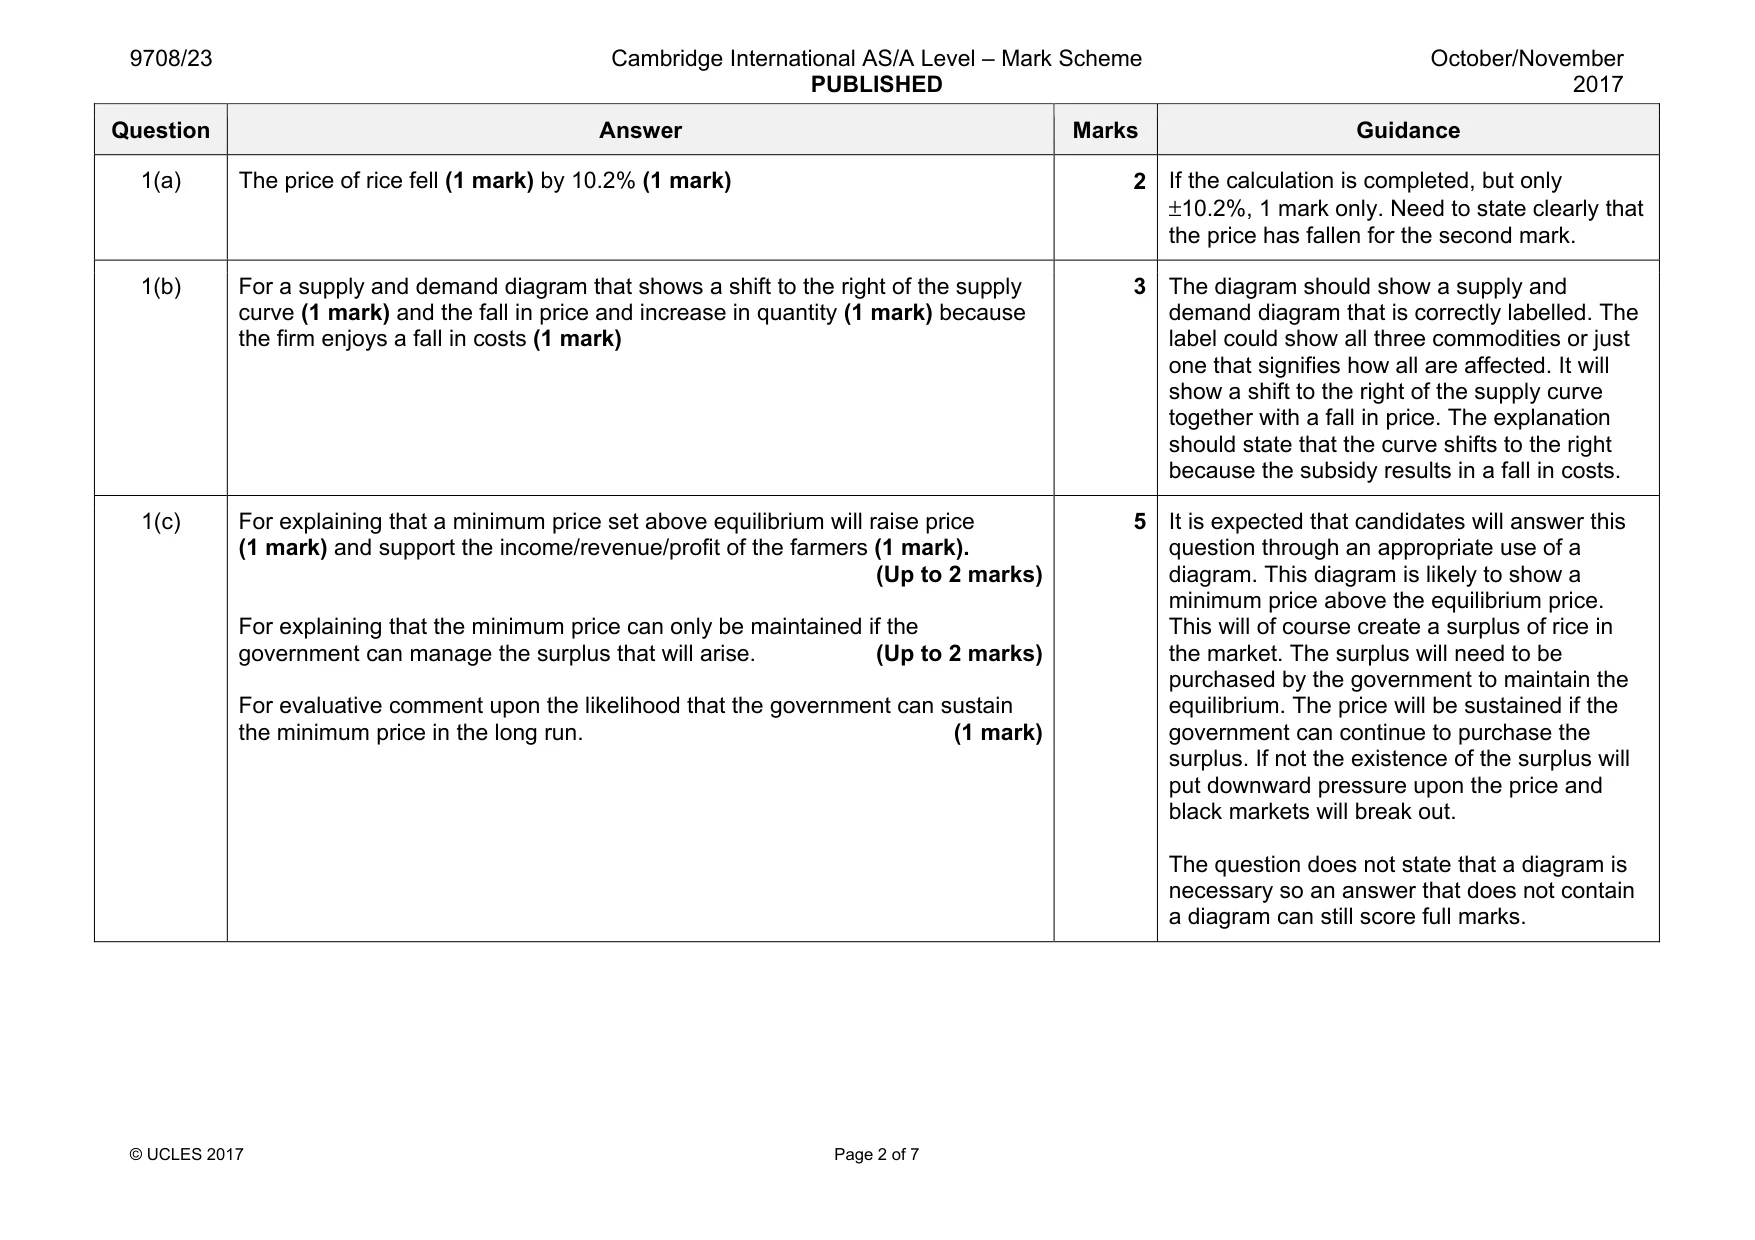
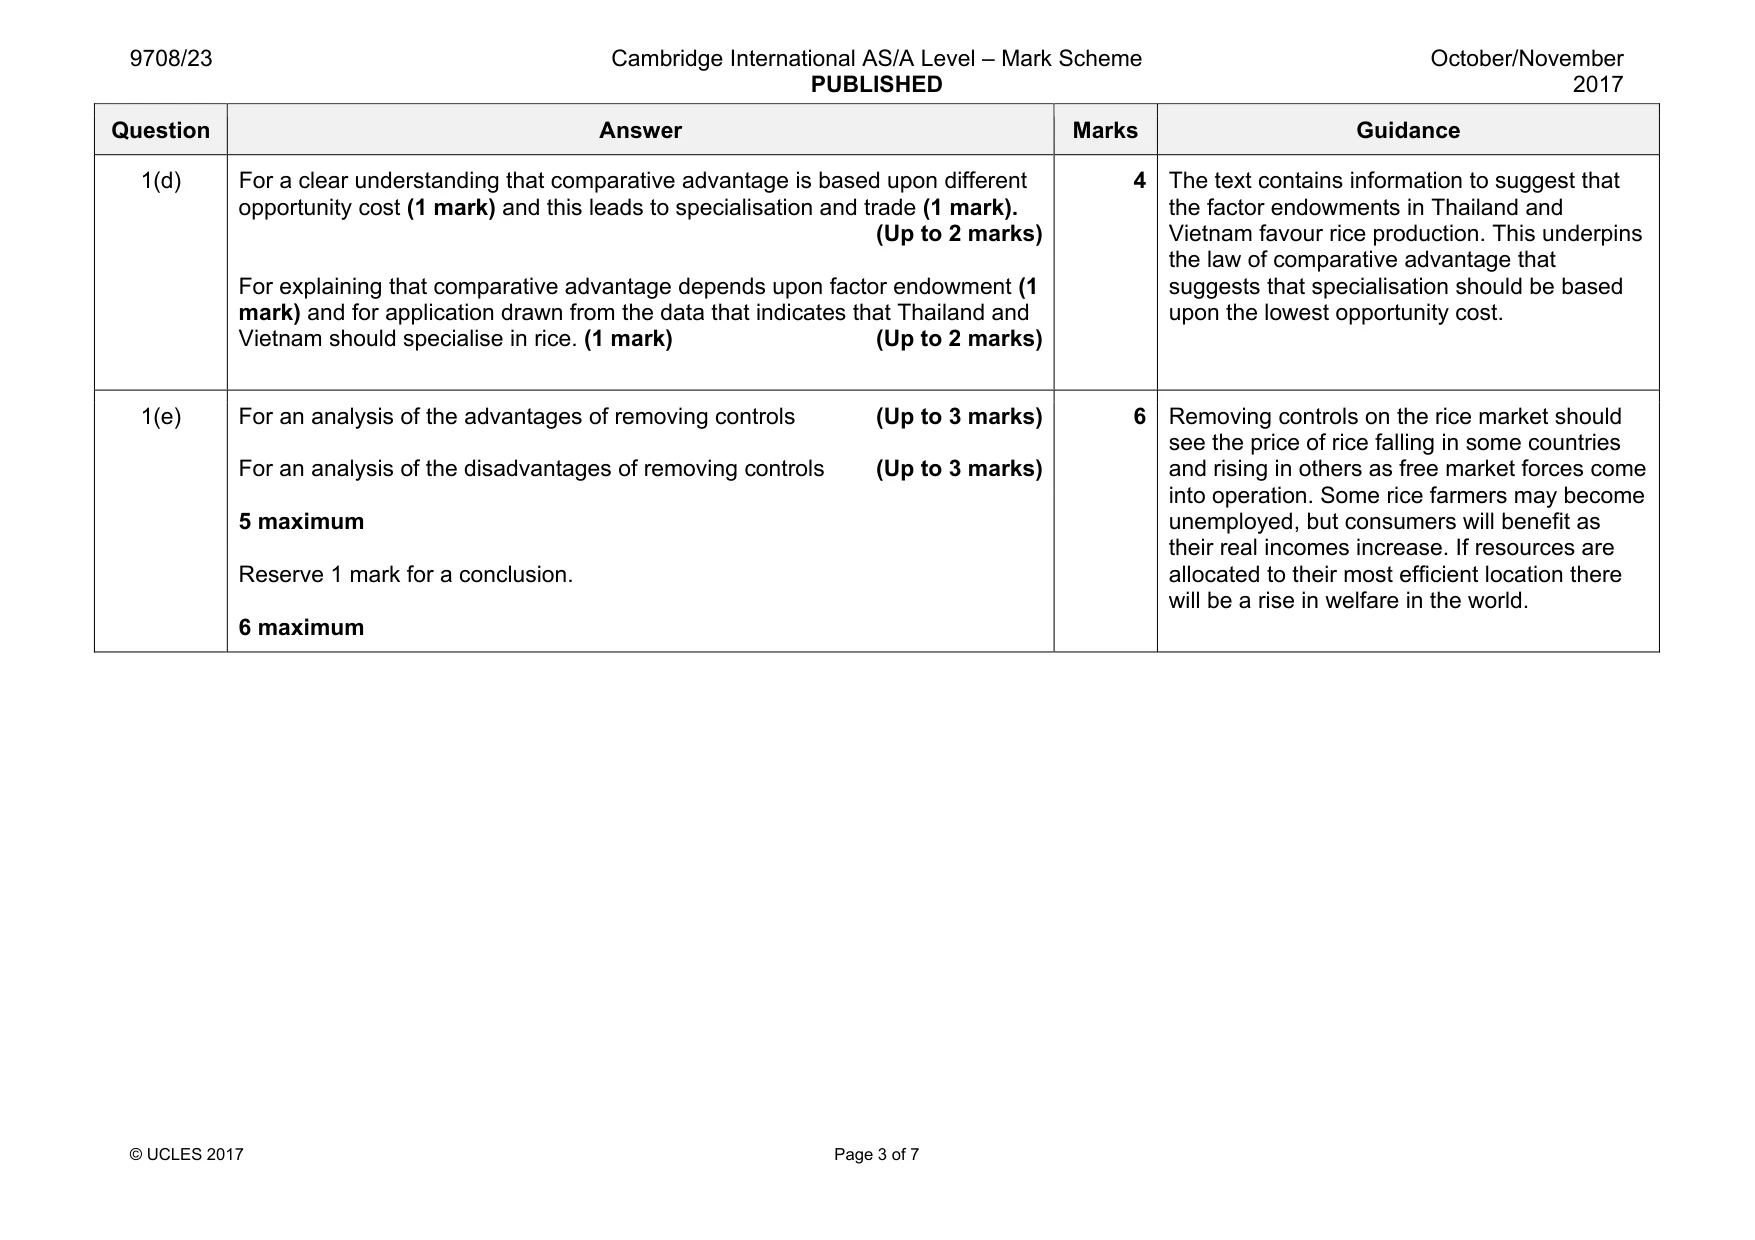
Mark scheme: 1(a) The price of rice fell (1 mark) by 10.2% (1 mark) 2 If the calculation is completed, but only ±10.2%, 1 mark only. Need to state clearly that the price has fallen for the second mark. 1(b) For a supply and demand diagram that shows a shift to the right of the supply curve (1 mark) and the fall in price and increase in quantity (1 mark) because the firm enjoys a fall in costs (1 mark) 3 The diagram should show a supply and demand diagram that is correctly labelled. The label could show all three commodities or just one that signifies how all are affected. It will show a shift to the right of the supply curve together with a fall in price. The explanation should state that the curve shifts to the right because the subsidy results in a fall in costs. 1(c) For explaining that a minimum price set above equilibrium will raise price (1 mark) and support the income/revenue/profit of the farmers (1 mark). (Up to 2 marks) For explaining that the minimum price can only be maintained if the government can manage the surplus that will arise. (Up to 2 marks) For evaluative comment upon the likelihood that the government can sustain the minimum price in the long run. (1 mark) 5 It is expected that candidates will answer this question through an appropriate use of a diagram. This diagram is likely to show a minimum price above the equilibrium price. This will of course create a surplus of rice in the market. The surplus will need to be purchased by the government to maintain the equilibrium. The price will be sustained if the government can continue to purchase the surplus. If not the existence of the surplus will put downward pressure upon the price and black markets will break out. The question does not state that a diagram is necessary so an answer that does not contain a diagram can still score full marks. Question Answer Marks Guidance 1(d) For a clear understanding that comparative advantage is based upon different opportunity cost (1 mark) and this leads to specialisation and trade (1 mark). (Up to 2 marks) For explaining that comparative advantage depends upon factor endowment (1 mark) and for application drawn from the data that indicates that Thailand and Vietnam should specialise in rice. (1 mark) (Up to 2 marks) 4 The text contains information to suggest that the factor endowments in Thailand and Vietnam favour rice production. This underpins the law of comparative advantage that suggests that specialisation should be based upon the lowest opportunity cost. 1(e) For an analysis of the advantages of removing controls (Up to 3 marks) For an analysis of the disadvantages of removing controls (Up to 3 marks) 5 maximum Reserve 1 mark for a conclusion. 6 maximum 6 Removing controls on the rice market should see the price of rice falling in some countries and rising in others as free market forces come into operation. Some rice farmers may become unemployed, but consumers will benefit as their real incomes increase. If resources are allocated to their most efficient location there will be a rise in welfare in the world.
More questions on Methods and effects of government intervention in markets
Q2 · Explain the factors that determine whether the price elasticity of demand for a good is…
2 (a) Explain the factors that determine whether the price elasticity of demand for a good is likely to be relatively inelastic. [8] (b) Discuss if it is more useful for governments to have knowledge of the price elasticity of demand or the income elasticity of demand for certain products. [12]
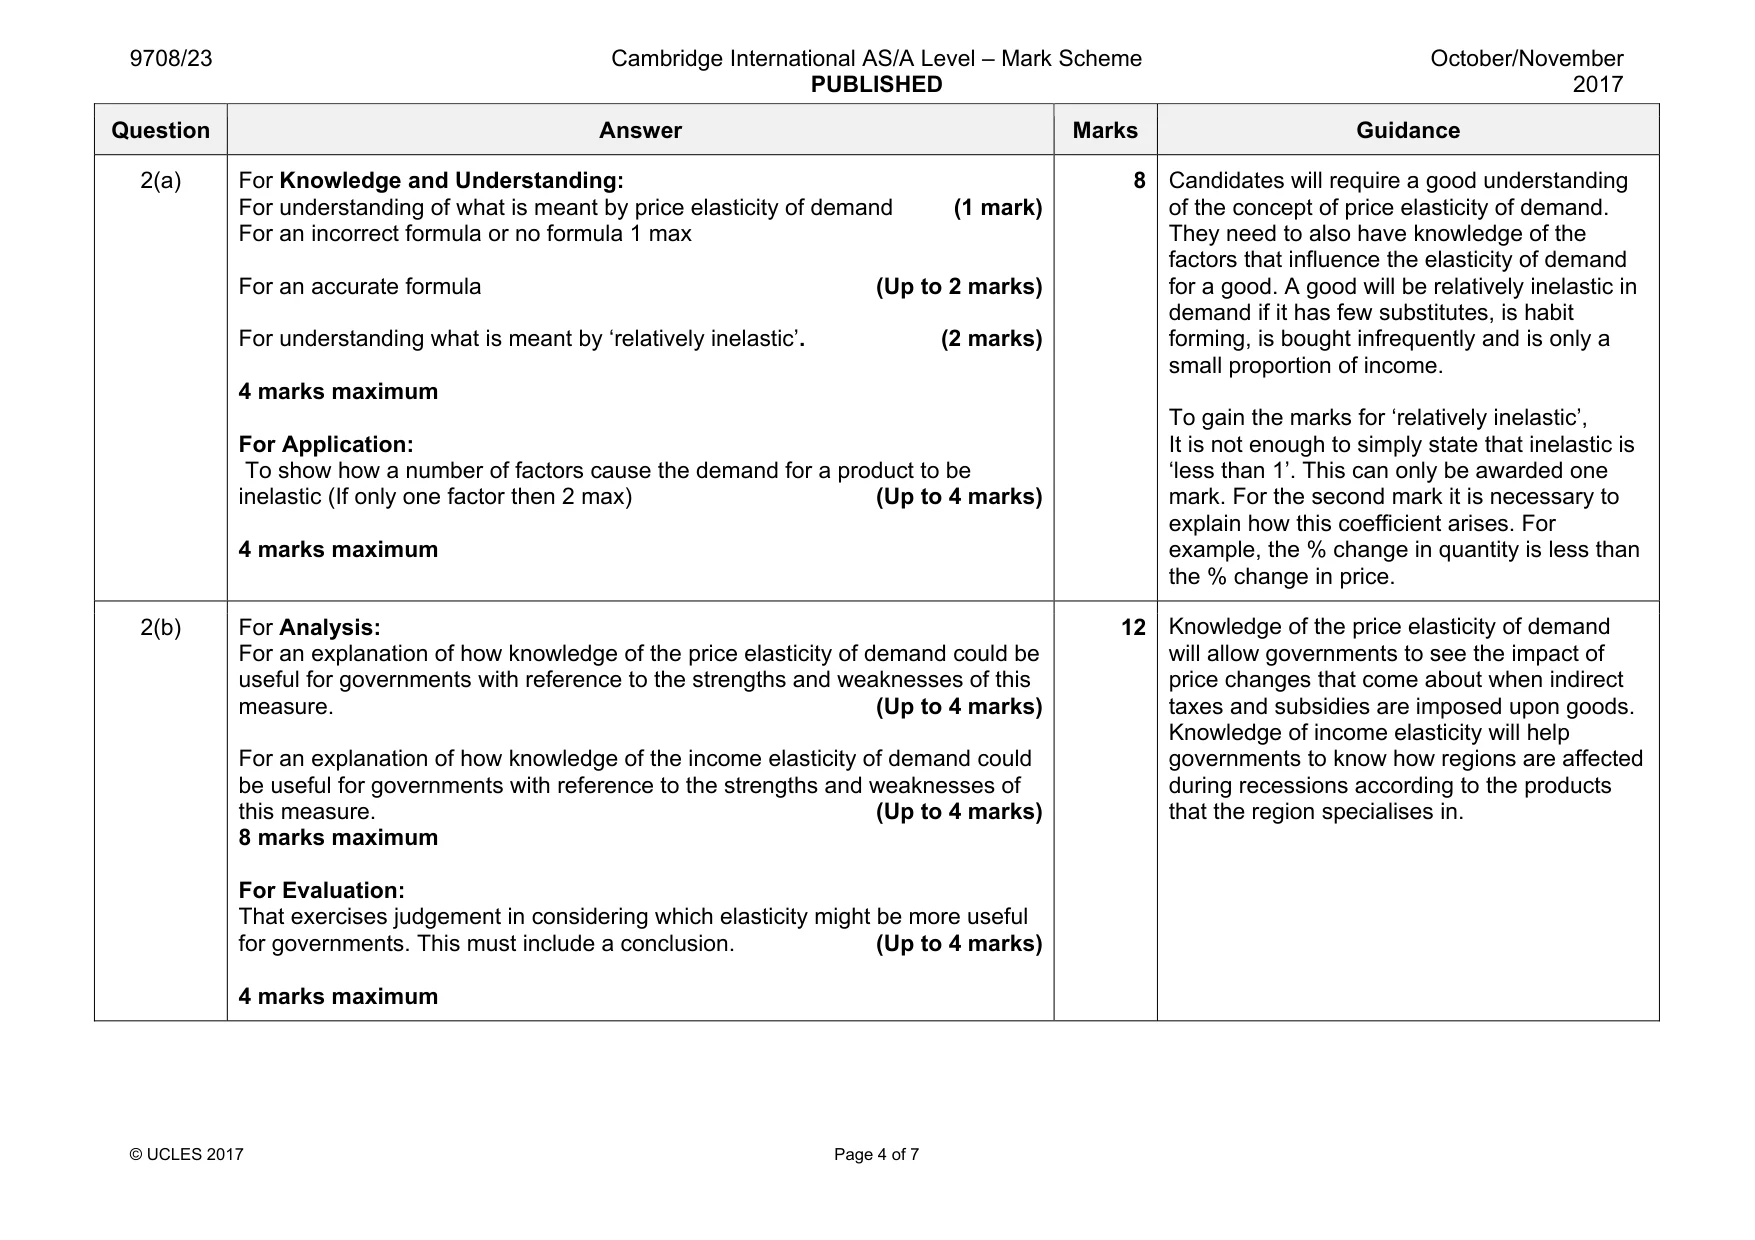
Mark scheme: 2(a) For Knowledge and Understanding: For understanding of what is meant by price elasticity of demand (1 mark) For an incorrect formula or no formula 1 max For an accurate formula (Up to 2 marks) For understanding what is meant by ‘relatively inelastic’. (2 marks) 4 marks maximum For Application: To show how a number of factors cause the demand for a product to be inelastic (If only one factor then 2 max) (Up to 4 marks) 4 marks maximum 8 of the concept of price elasticity of demand. They need to also have knowledge of the factors that influence the elasticity of demand for a good. A good will be relatively inelastic in demand if it has few substitutes, is habit forming, is bought infrequently and is only a small proportion of income. To gain the marks for ‘relatively inelastic’, It is not enough to simply state that inelastic is ‘less than 1’. This can only be awarded one mark. For the second mark it is necessary to explain how this coefficient arises. For example, the % change in quantity is less than the % change in price. 2(b) For Analysis: For an explanation of how knowledge of the price elasticity of demand could be useful for governments with reference to the strengths and weaknesses of this measure. (Up to 4 marks) For an explanation of how knowledge of the income elasticity of demand could be useful for governments with reference to the strengths and weaknesses of this measure. (Up to 4 marks) 8 marks maximum For Evaluation: That exercises judgement in considering which elasticity might be more useful for governments. This must include a conclusion. (Up to 4 marks) 4 marks maximum 12 Knowledge of the price elasticity of demand will allow governments to see the impact of price changes that come about when indirect taxes and subsidies are imposed upon goods. Knowledge of income elasticity will help governments to know how regions are affected during recessions according to the products that the region specialises in.
More questions on Price elasticity, income elasticity and cross elasticity of demand
Q3 · Explain how a production possibility curve with increasing opportunity costs illustrates…
3 (a) Explain how a production possibility curve with increasing opportunity costs illustrates the consequences of a government’s choice to produce more military goods. Use a diagram to support your answer. [8] (b) Discuss whether supply side policies are the most effective way to generate growth in an economy. [12]
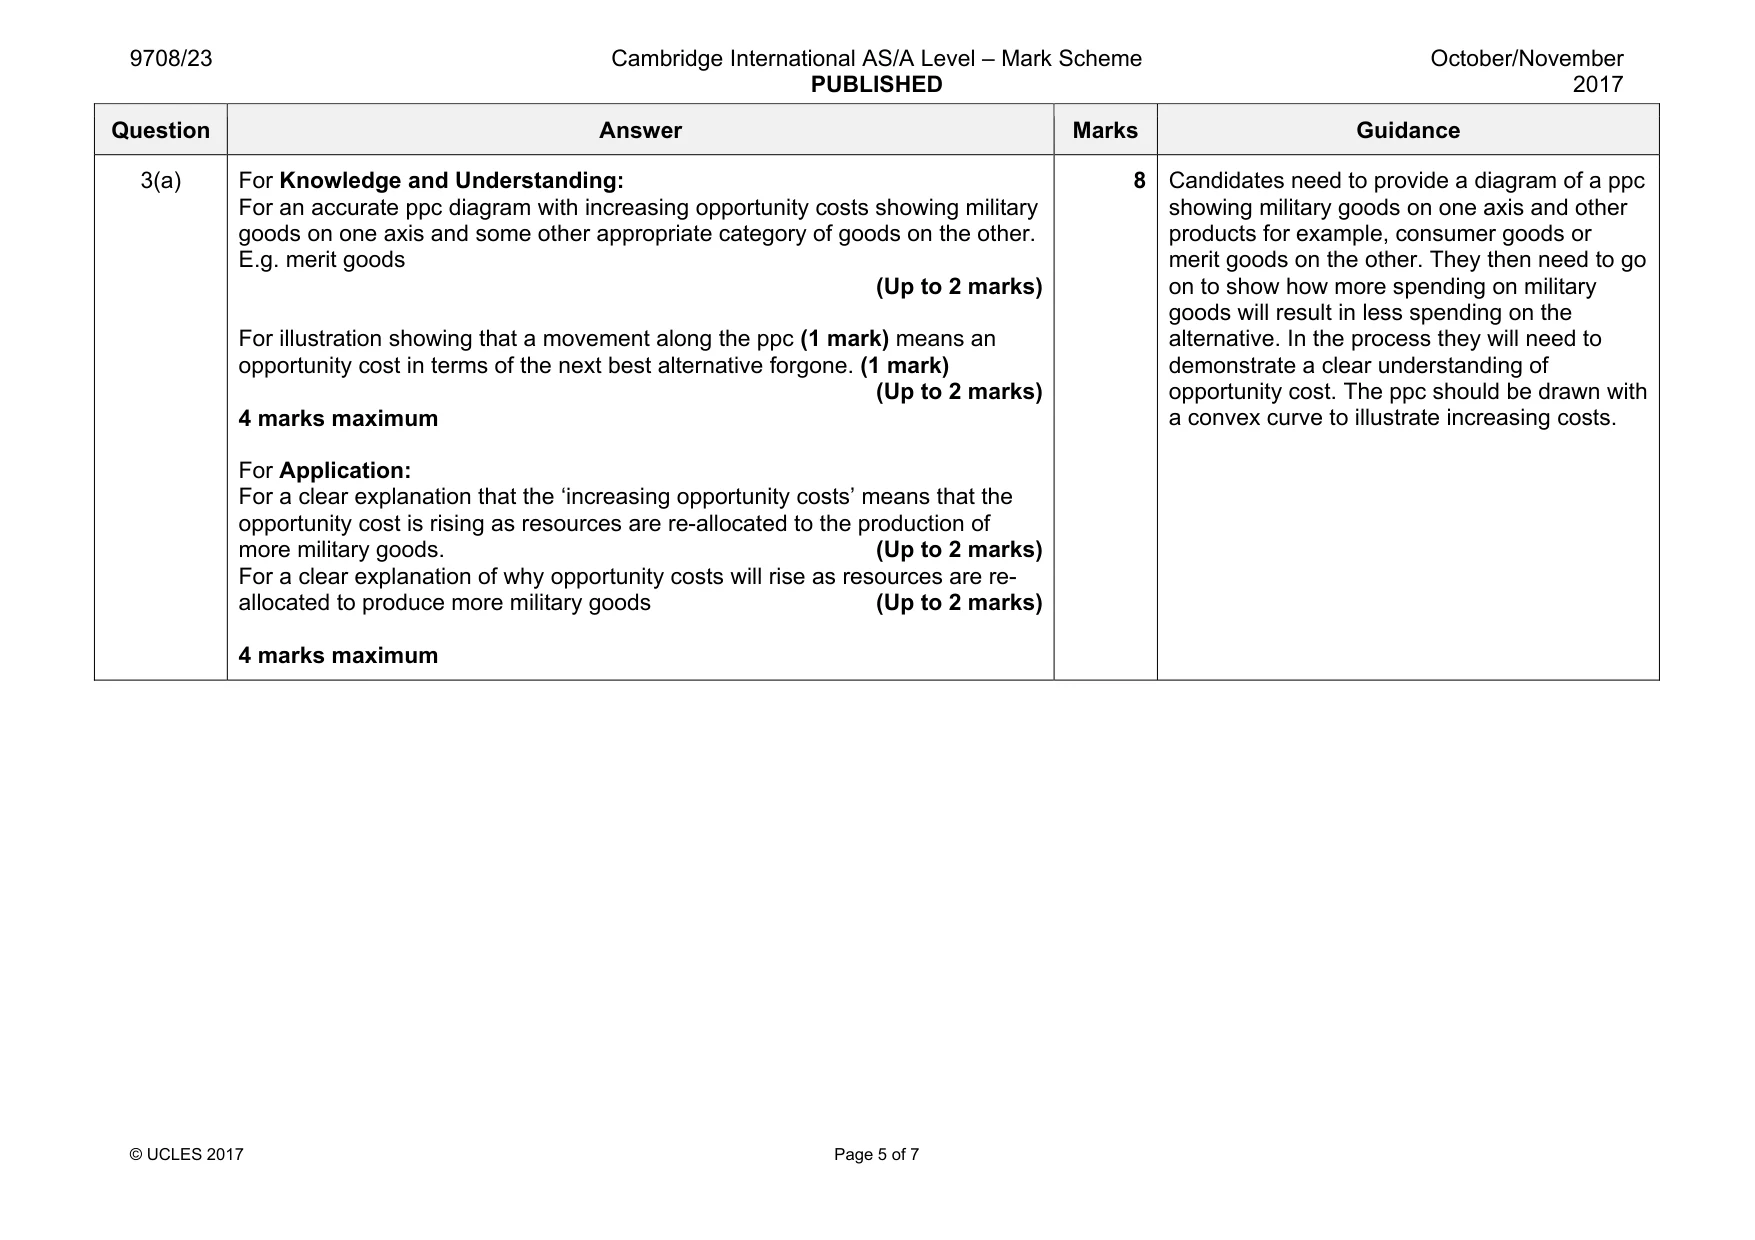
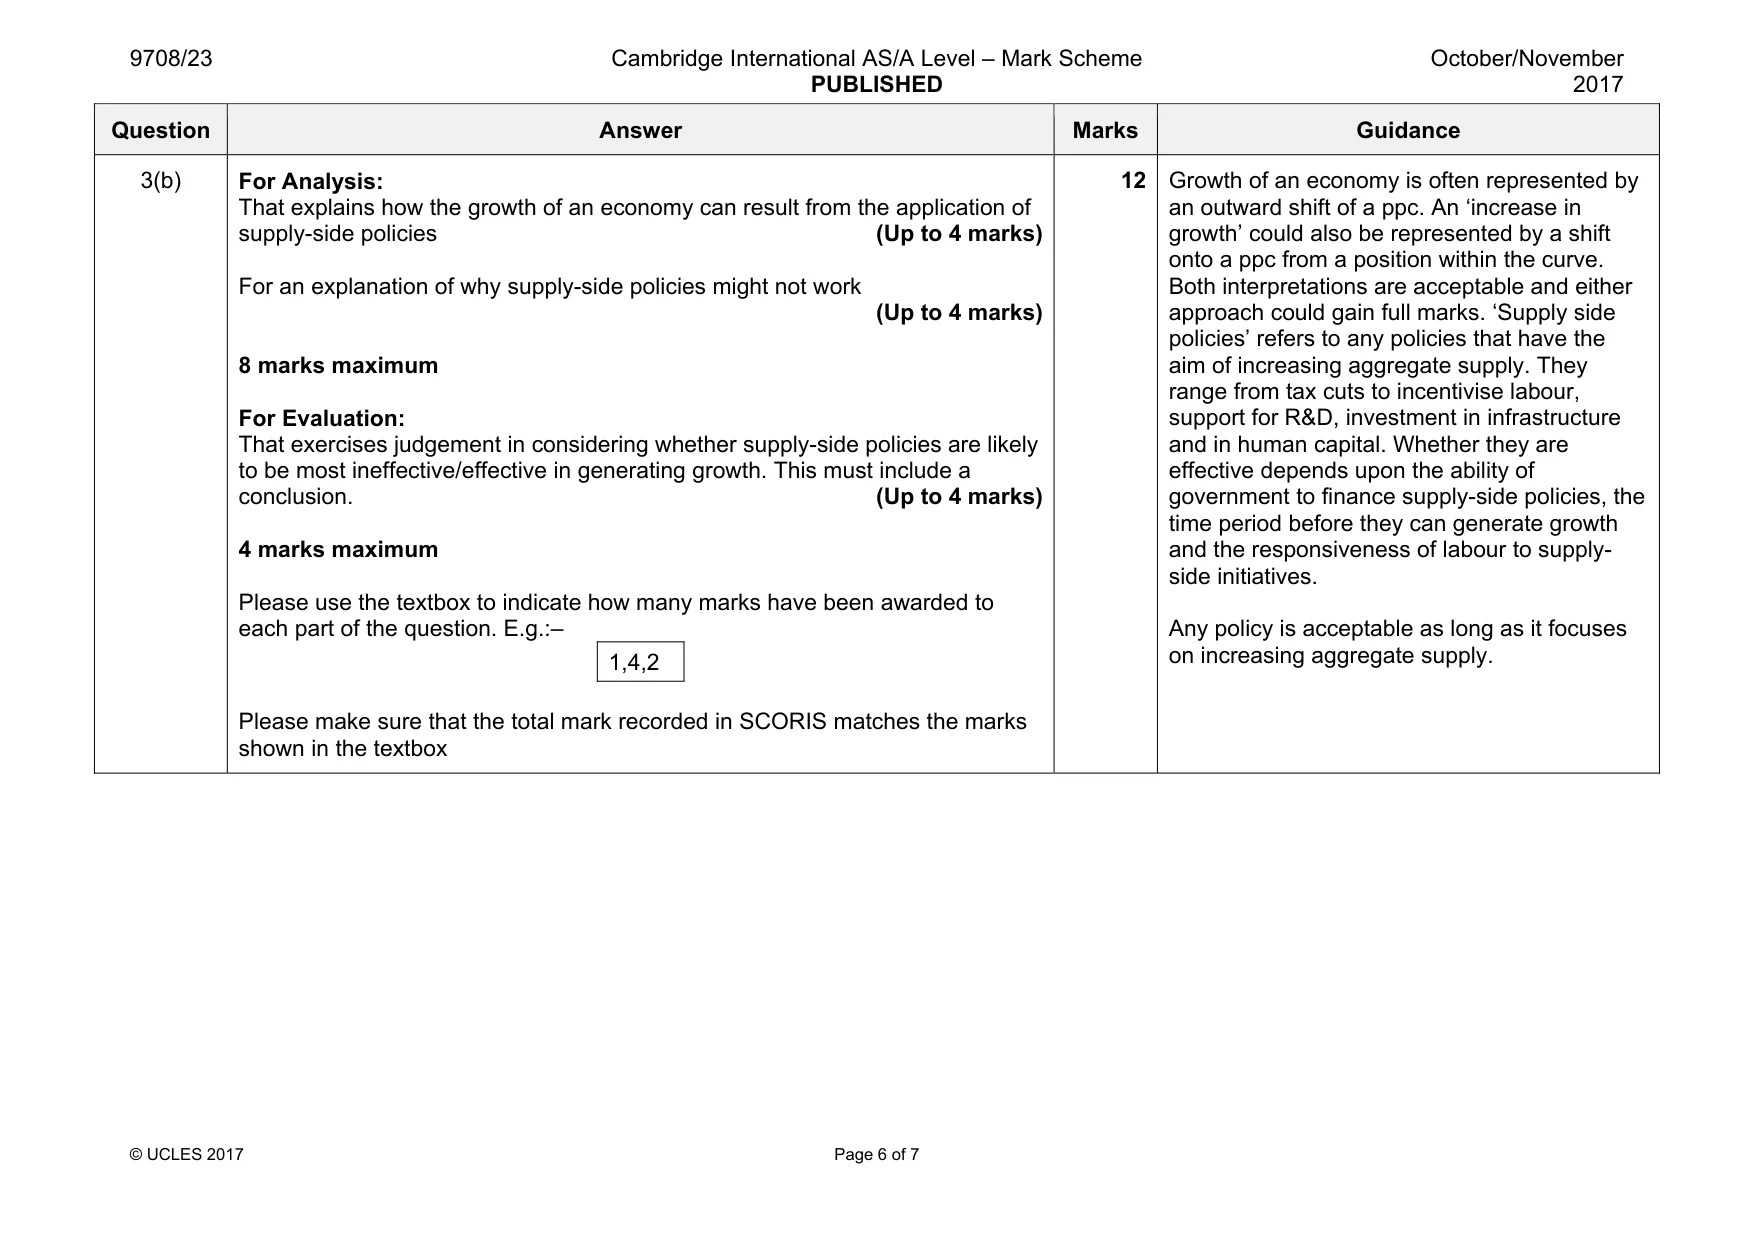
Mark scheme: 3(a) For Knowledge and Understanding: For an accurate ppc diagram with increasing opportunity costs showing military goods on one axis and some other appropriate category of goods on the other. E.g. merit goods (Up to 2 marks) For illustration showing that a movement along the ppc (1 mark) means an opportunity cost in terms of the next best alternative forgone. (1 mark) (Up to 2 marks) 4 marks maximum For Application: For a clear explanation that the ‘increasing opportunity costs’ means that the opportunity cost is rising as resources are re-allocated to the production of more military goods. (Up to 2 marks) For a clear explanation of why opportunity costs will rise as resources are re- allocated to produce more military goods (Up to 2 marks) 4 marks maximum 8 showing military goods on one axis and other products for example, consumer goods or merit goods on the other. They then need to go on to show how more spending on military goods will result in less spending on the alternative. In the process they will need to demonstrate a clear understanding of opportunity cost. The ppc should be drawn with a convex curve to illustrate increasing costs. Question Answer Marks Guidance 3(b) For Analysis: That explains how the growth of an economy can result from the application of supply-side policies (Up to 4 marks) For an explanation of why supply-side policies might not work (Up to 4 marks) 8 marks maximum For Evaluation: That exercises judgement in considering whether supply-side policies are likely to be most ineffective/effective in generating growth. This must include a conclusion. (Up to 4 marks) 4 marks maximum Please use the textbox to indicate how many marks have been awarded to each part of the question. E.g.:– 1,4,2 Please make sure that the total mark recorded in SCORIS matches the marks shown in the textbox 12 Growth of an economy is often represented by an outward shift of a ppc. An ‘increase in growth’ could also be represented by a shift onto a ppc from a position within the curve. Both interpretations are acceptable and either approach could gain full marks. ‘Supply side policies’ refers to any policies that have the aim of increasing aggregate supply. They range from tax cuts to incentivise labour, support for R&D, investment in infrastructure and in human capital. Whether they are effective depends upon the ability of government to finance supply-side policies, the time period before they can generate growth and the responsiveness of labour to supply- side initiatives. Any policy is acceptable as long as it focuses on increasing aggregate supply.
Q4 · Show how exchange rates are determined in a freely floating system
4 (a) Show how exchange rates are determined in a freely floating system. Explain how a high rate of inflation in an economy can lead to depreciation in that economy’s exchange rate. Use a diagram to support your answer. [8] (b) Discuss the advantages and disadvantages of a freely floating exchange rate. Consider whether on balance it is preferable to a fixed rate system. [12]
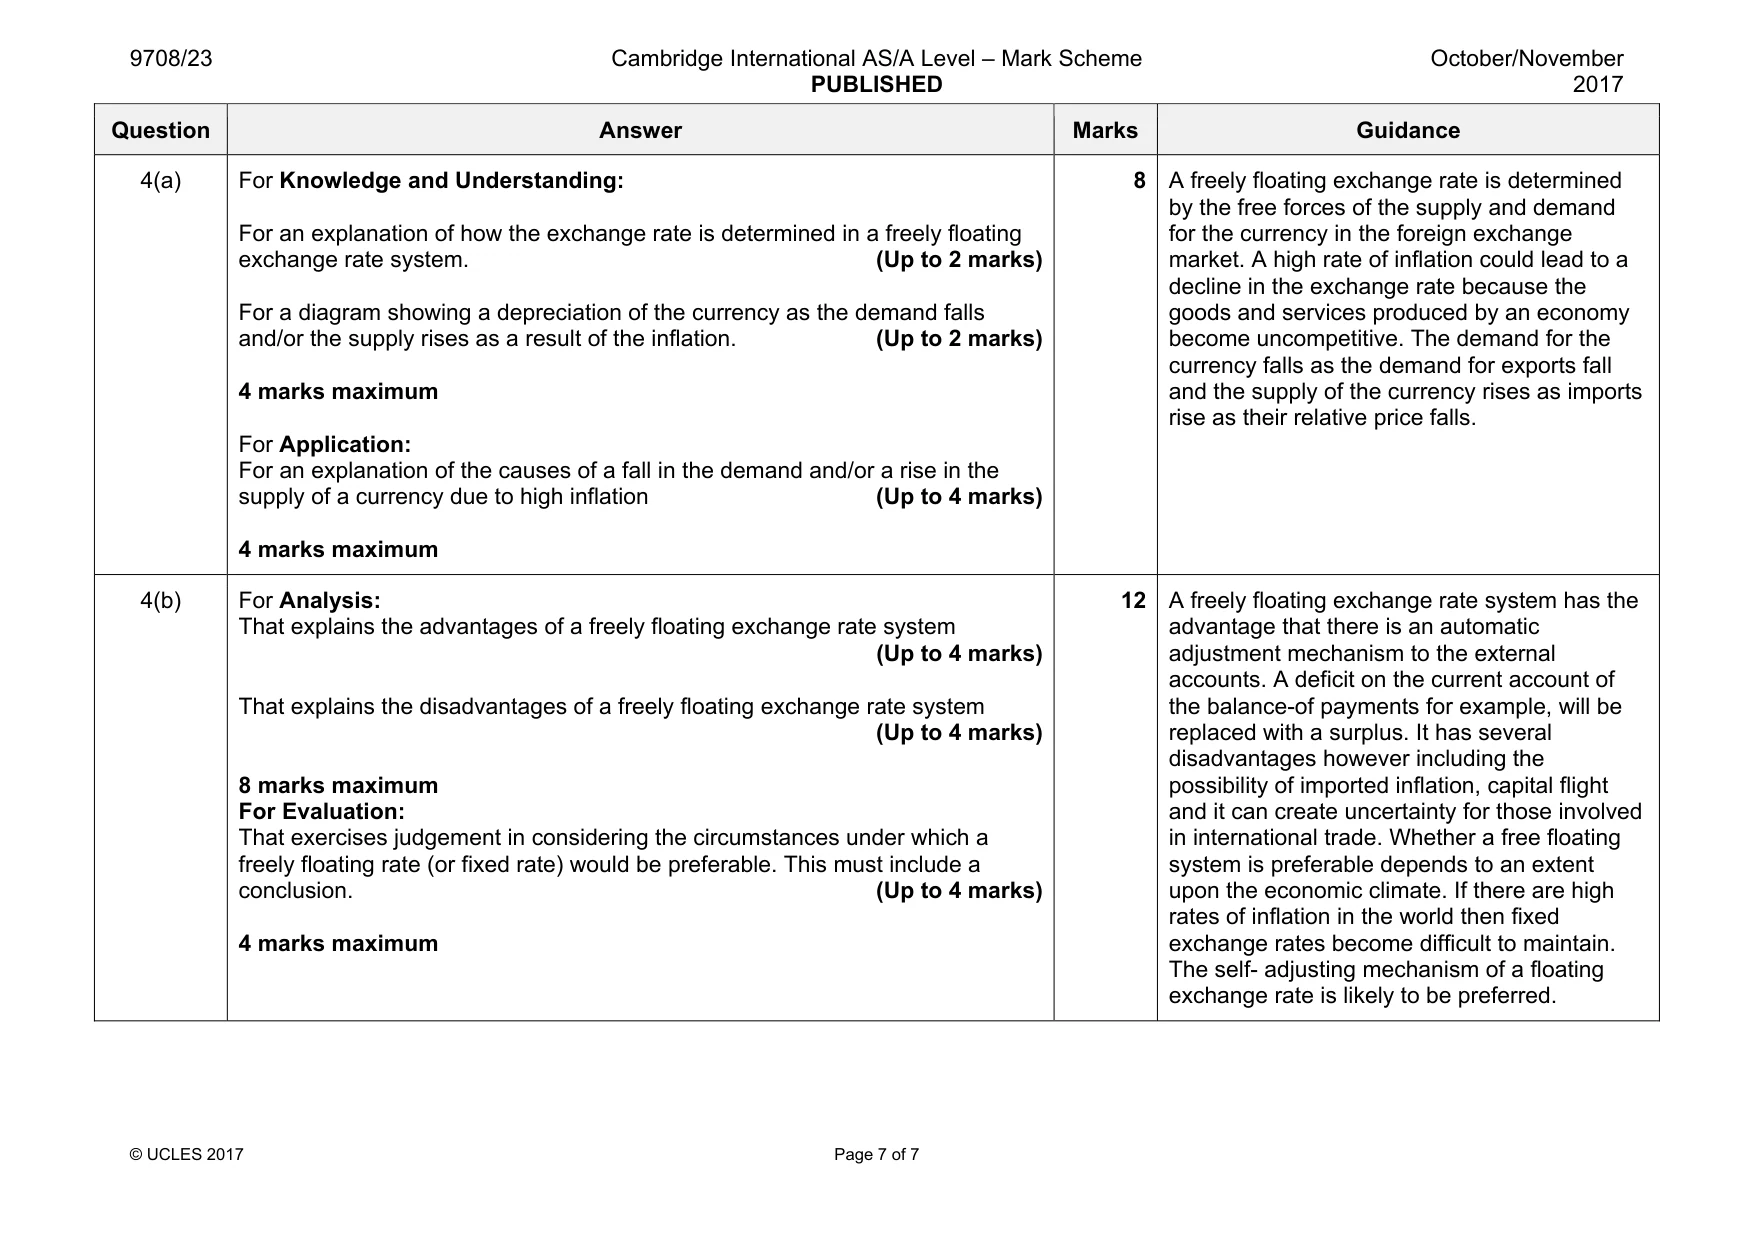
Mark scheme: 4(a) For Knowledge and Understanding: For an explanation of how the exchange rate is determined in a freely floating exchange rate system. (Up to 2 marks) For a diagram showing a depreciation of the currency as the demand falls and/or the supply rises as a result of the inflation. (Up to 2 marks) 4 marks maximum For Application: For an explanation of the causes of a fall in the demand and/or a rise in the supply of a currency due to high inflation (Up to 4 marks) 4 marks maximum 8 by the free forces of the supply and demand for the currency in the foreign exchange market. A high rate of inflation could lead to a decline in the exchange rate because the goods and services produced by an economy become uncompetitive. The demand for the currency falls as the demand for exports fall and the supply of the currency rises as imports rise as their relative price falls. 4(b) For Analysis: That explains the advantages of a freely floating exchange rate system (Up to 4 marks) That explains the disadvantages of a freely floating exchange rate system (Up to 4 marks) 8 marks maximum For Evaluation: That exercises judgement in considering the circumstances under which a freely floating rate (or fixed rate) would be preferable. This must include a conclusion. (Up to 4 marks) 4 marks maximum 12 A freely floating exchange rate system has the advantage that there is an automatic adjustment mechanism to the external accounts. A deficit on the current account of the balance-of payments for example, will be replaced with a surplus. It has several disadvantages however including the possibility of imported inflation, capital flight and it can create uncertainty for those involved in international trade. Whether a free floating system is preferable depends to an extent upon the economic climate. If there are high rates of inflation in the world then fixed exchange rates become difficult to maintain. The self- adjusting mechanism of a floating exchange rate is likely to be preferred.
What was in this paper
The subtopics covered by these 4 questions, and how many questions each got. Open one in a new tab to see every Cambridge question on it.
What you needed in this session
Cambridge’s own grade thresholds for 2017 Oct/Nov, Paper 2 · Variant 3. A higher threshold means an easier paper — the bar moves with how the cohort did.