Cambridge A Level Economics 9708 — 2017 Oct/Nov Paper 2 · Variant 2
9708/22/O/N/17 · 4 questions · 40 marks · ≈45 min
The question paper and its mark scheme, free to read here and free to download. This is Cambridge’s own paper, exactly as it was sat.
Question paper4 pages
Mark scheme9 pages
Answers below. Sit the paper first if you are practising.
Questions as text
Q1 · Japan’s Economic Difficulties Table 1: Japan Consumer Prices Index, June 2013–December…
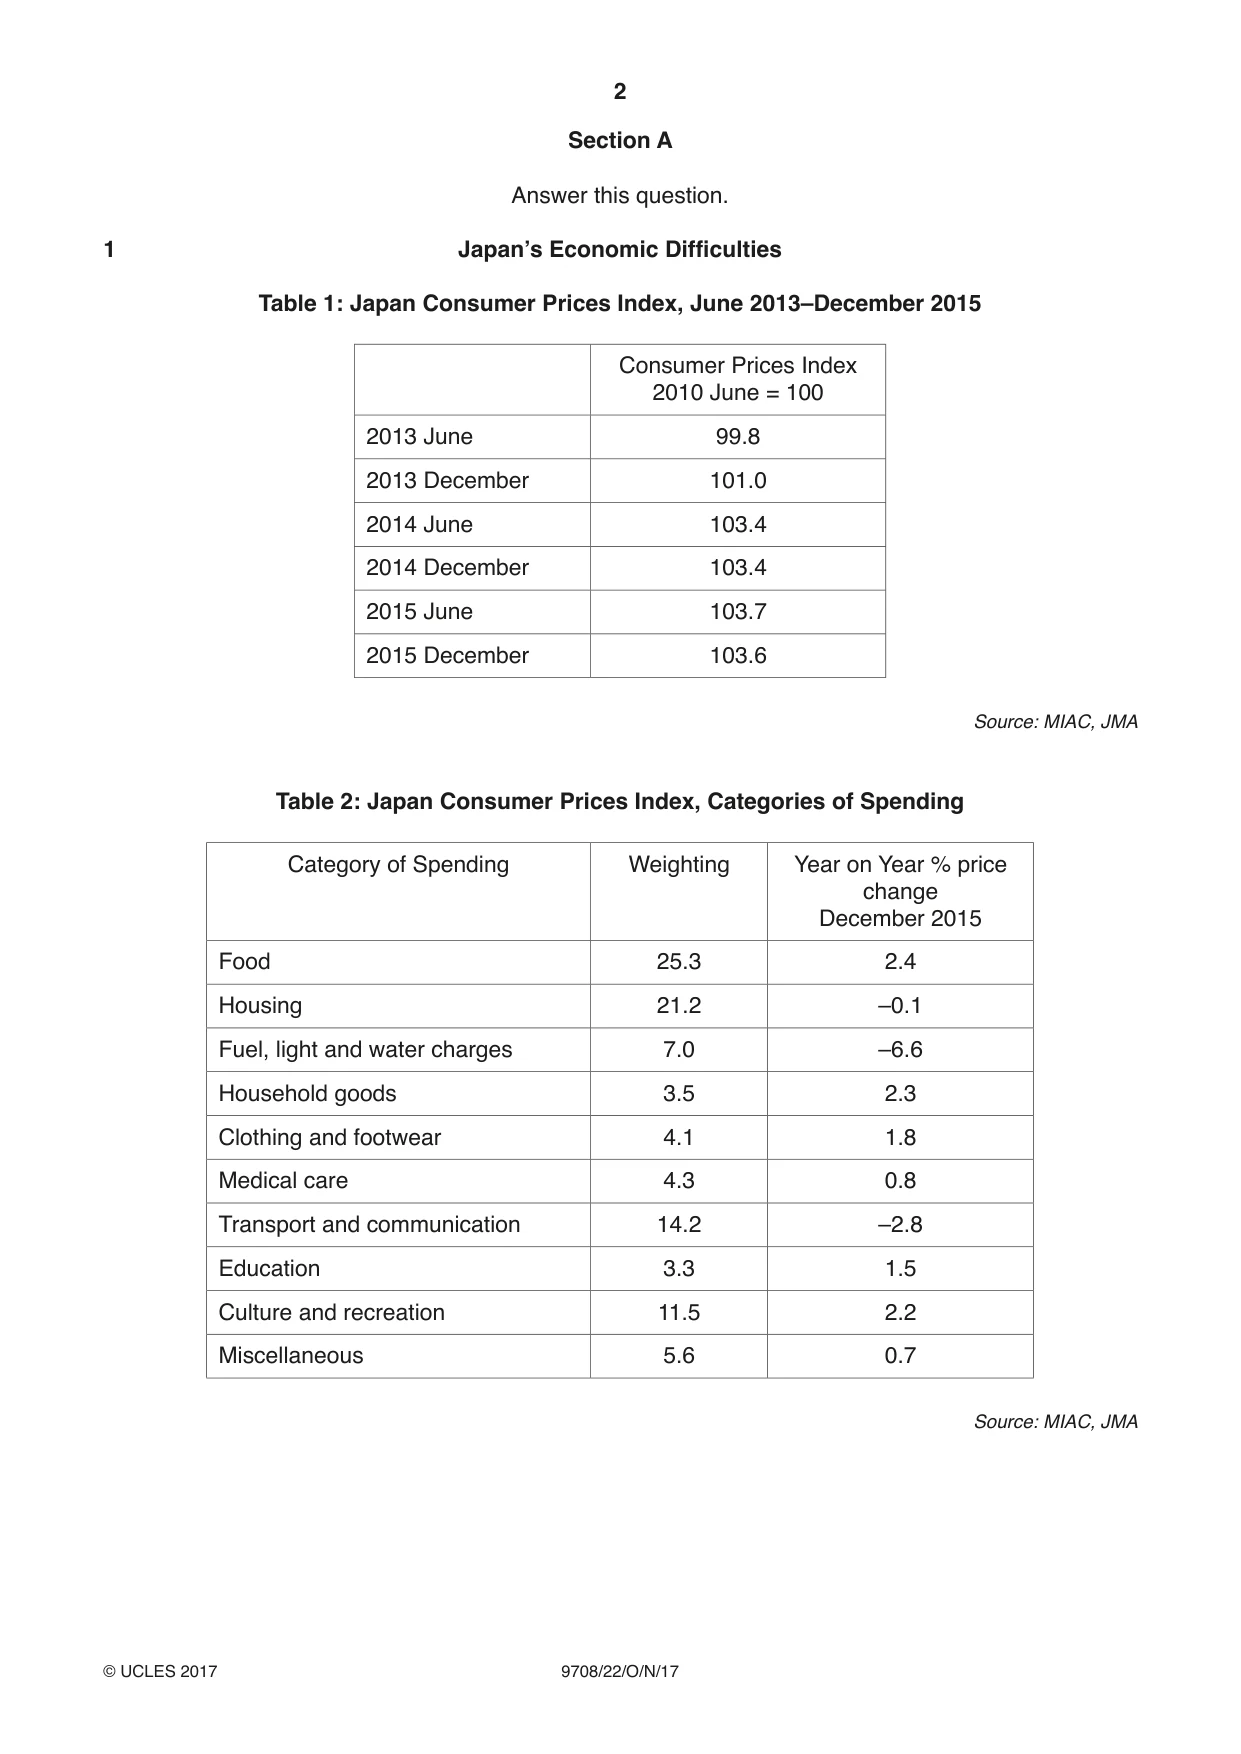
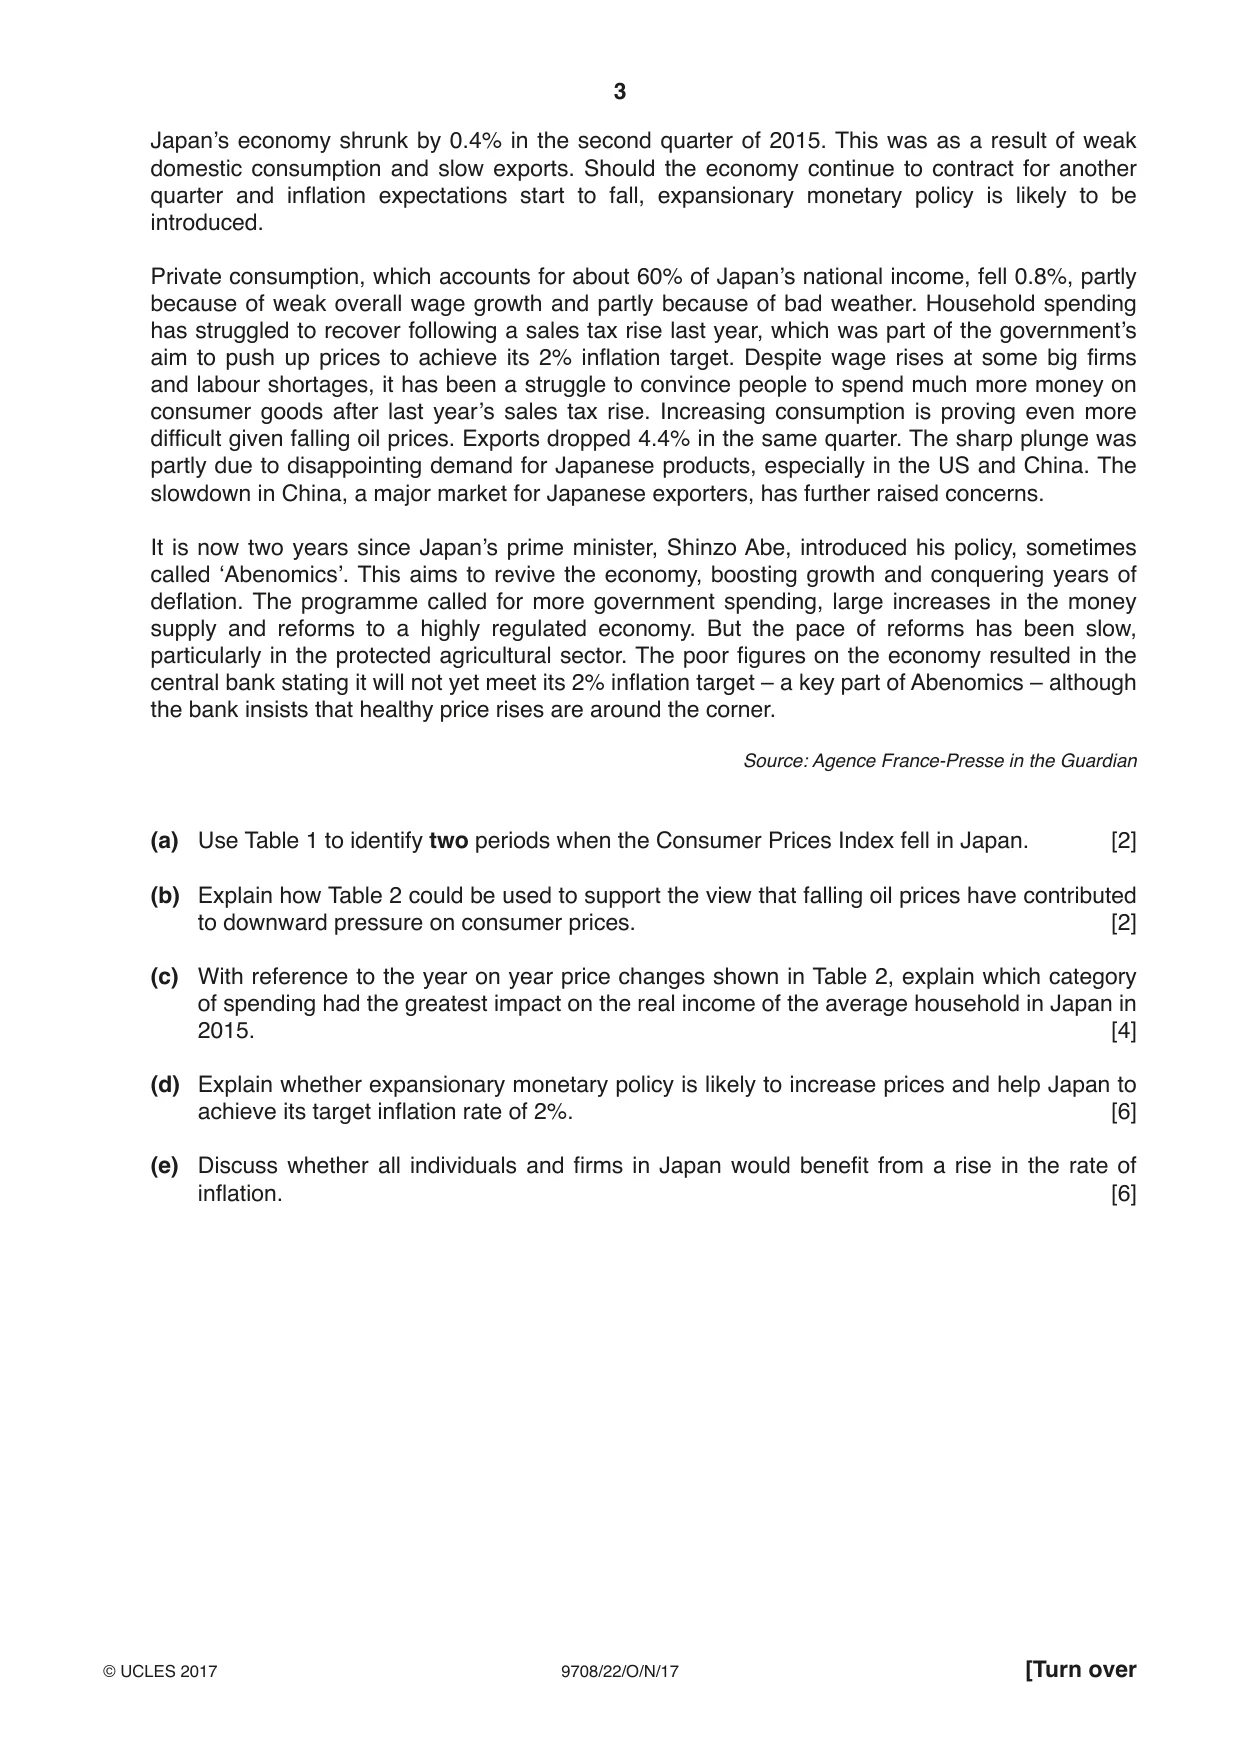
1 Japan’s Economic Difficulties Table 1: Japan Consumer Prices Index, June 2013–December 2015 Consumer Prices Index 2010 June = 100 2013 June 99.8 2013 December 101.0 2014 June 103.4 2014 December 103.4 2015 June 103.7 2015 December 103.6 Source: MIAC, JMA Table 2: Japan Consumer Prices Index, Categories of Spending Category of Spending Weighting Year on Year % price change December 2015 Food 25.3 2.4 Housing 21.2 –0.1 Fuel, light and water charges 7.0 –6.6 Household goods 3.5 2.3 Clothing and footwear 4.1 1.8 Medical care 4.3 0.8 Transport and communication 14.2 –2.8 Education 3.3 1.5 Culture and recreation 11.5 2.2 Miscellaneous 5.6 0.7 Source: MIAC, JMA Japan’s economy shrunk by 0.4% in the second quarter of 2015. This was as a result of weak domestic consumption and slow exports. Should the economy continue to contract for another quarter and inflation expectations start to fall, expansionary monetary policy is likely to be introduced. Private consumption, which accounts for about 60% of Japan’s national income, fell 0.8%, partly because of weak overall wage growth and partly because of bad weather. Household spending has struggled to recover following a sales tax rise last year, which was part of the government’s aim to push up prices to achieve its 2% inflation target. Despite wage rises at some big firms and labour shortages, it has been a struggle to convince people to spend much more money on consumer goods after last year’s sales tax rise. Increasing consumption is proving even more difficult given falling oil prices. Exports dropped 4.4% in the same quarter. The sharp plunge was partly due to disappointing demand for Japanese products, especially in the US and China. The slowdown in China, a major market for Japanese exporters, has further raised concerns. It is now two years since Japan’s prime minister, Shinzo Abe, introduced his policy, sometimes called ‘Abenomics’. This aims to revive the economy, boosting growth and conquering years of deflation. The programme called for more government spending, large increases in the money supply and reforms to a highly regulated economy. But the pace of reforms has been slow, particularly in the protected agricultural sector. The poor figures on the economy resulted in the central bank stating it will not yet meet its 2% inflation target – a key part of Abenomics – although the bank insists that healthy price rises are around the corner. Source: Agence France-Presse in the Guardian (a) Use Table 1 to identify two periods when the Consumer Prices Index fell in Japan. [2] (b) Explain how Table 2 could be used to support the view that falling oil prices have contributed to downward pressure on consumer prices. [2] (c) With reference to the year on year price changes shown in Table 2, explain which category of spending had the greatest impact on the real income of the average household in Japan in 2015. [4] (d) Explain whether expansionary monetary policy is likely to increase prices and help Japan to achieve its target inflation rate of 2%. [6] (e) Discuss whether all individuals and firms in Japan would benefit from a rise in the rate of inflation. [6]
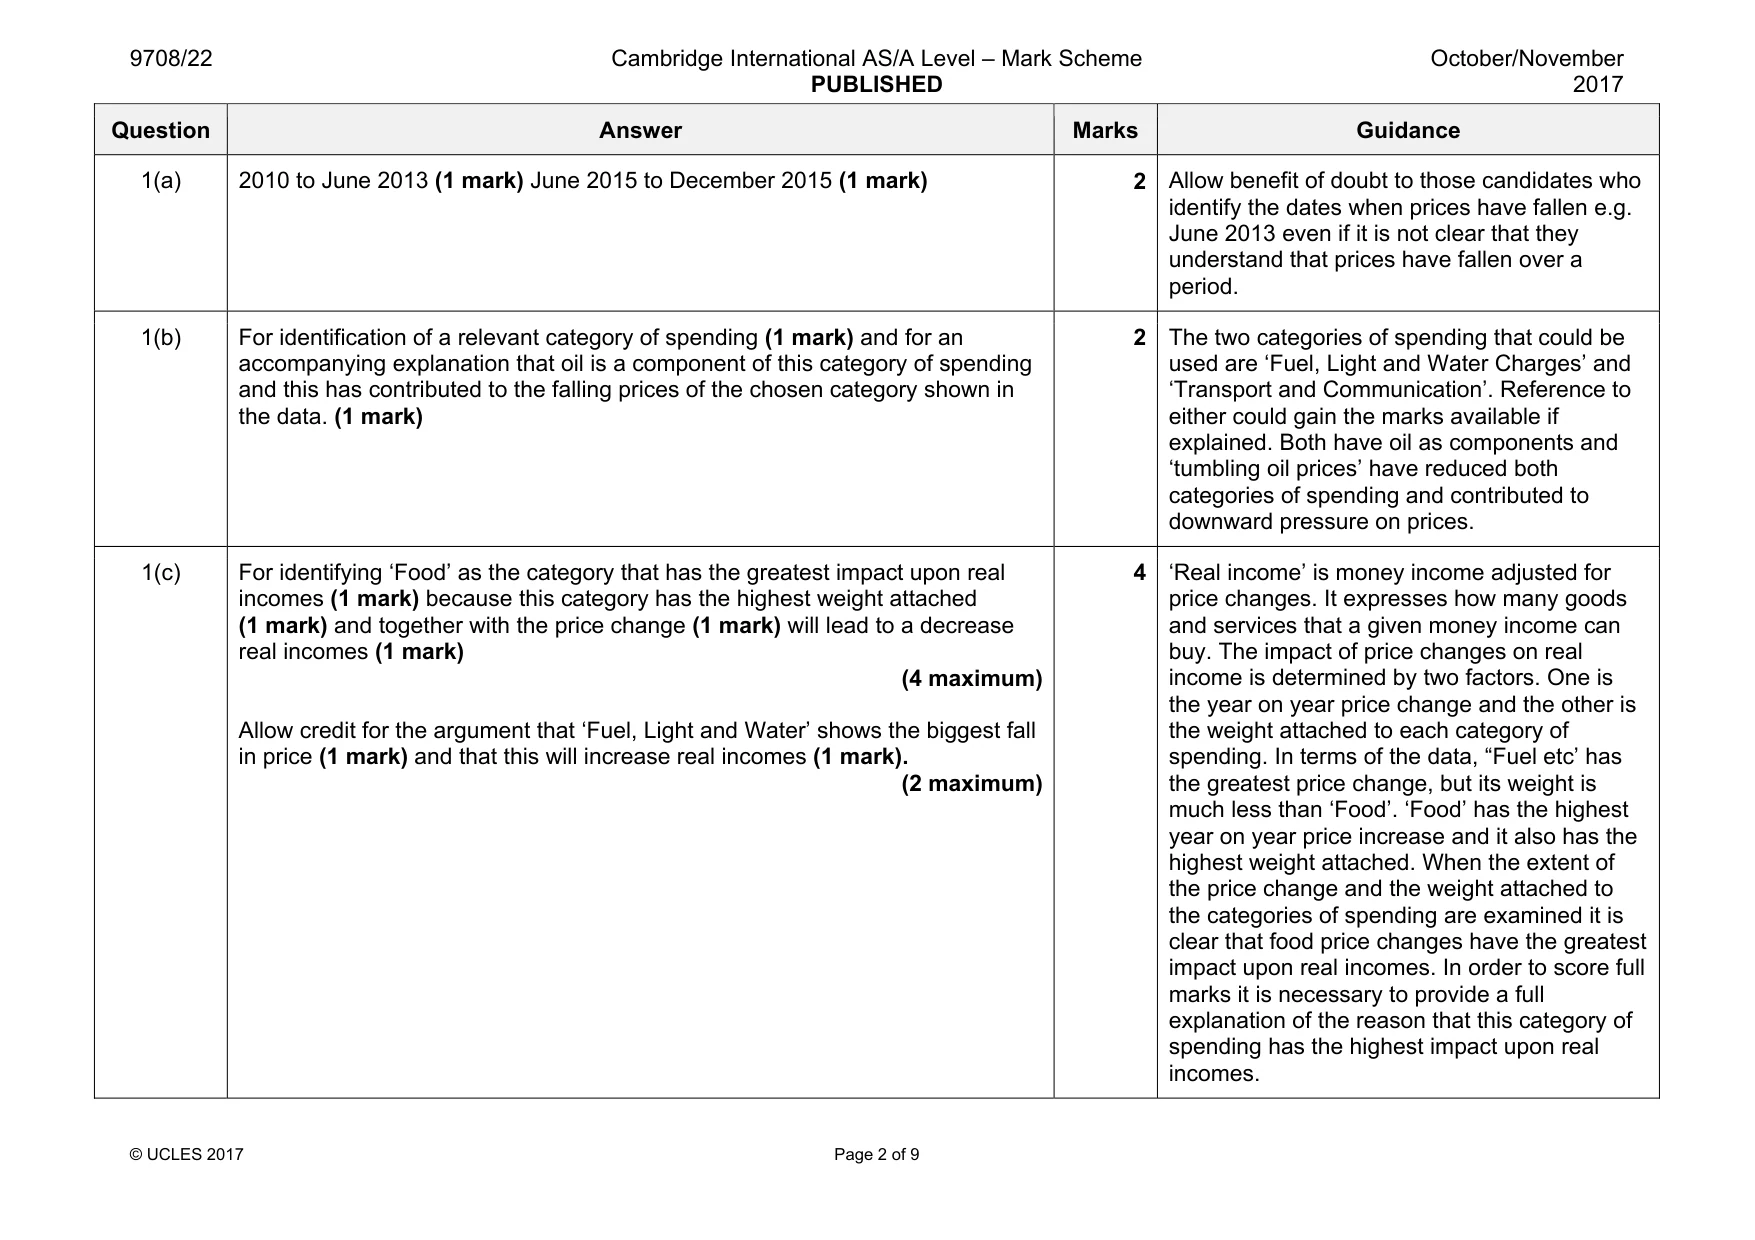
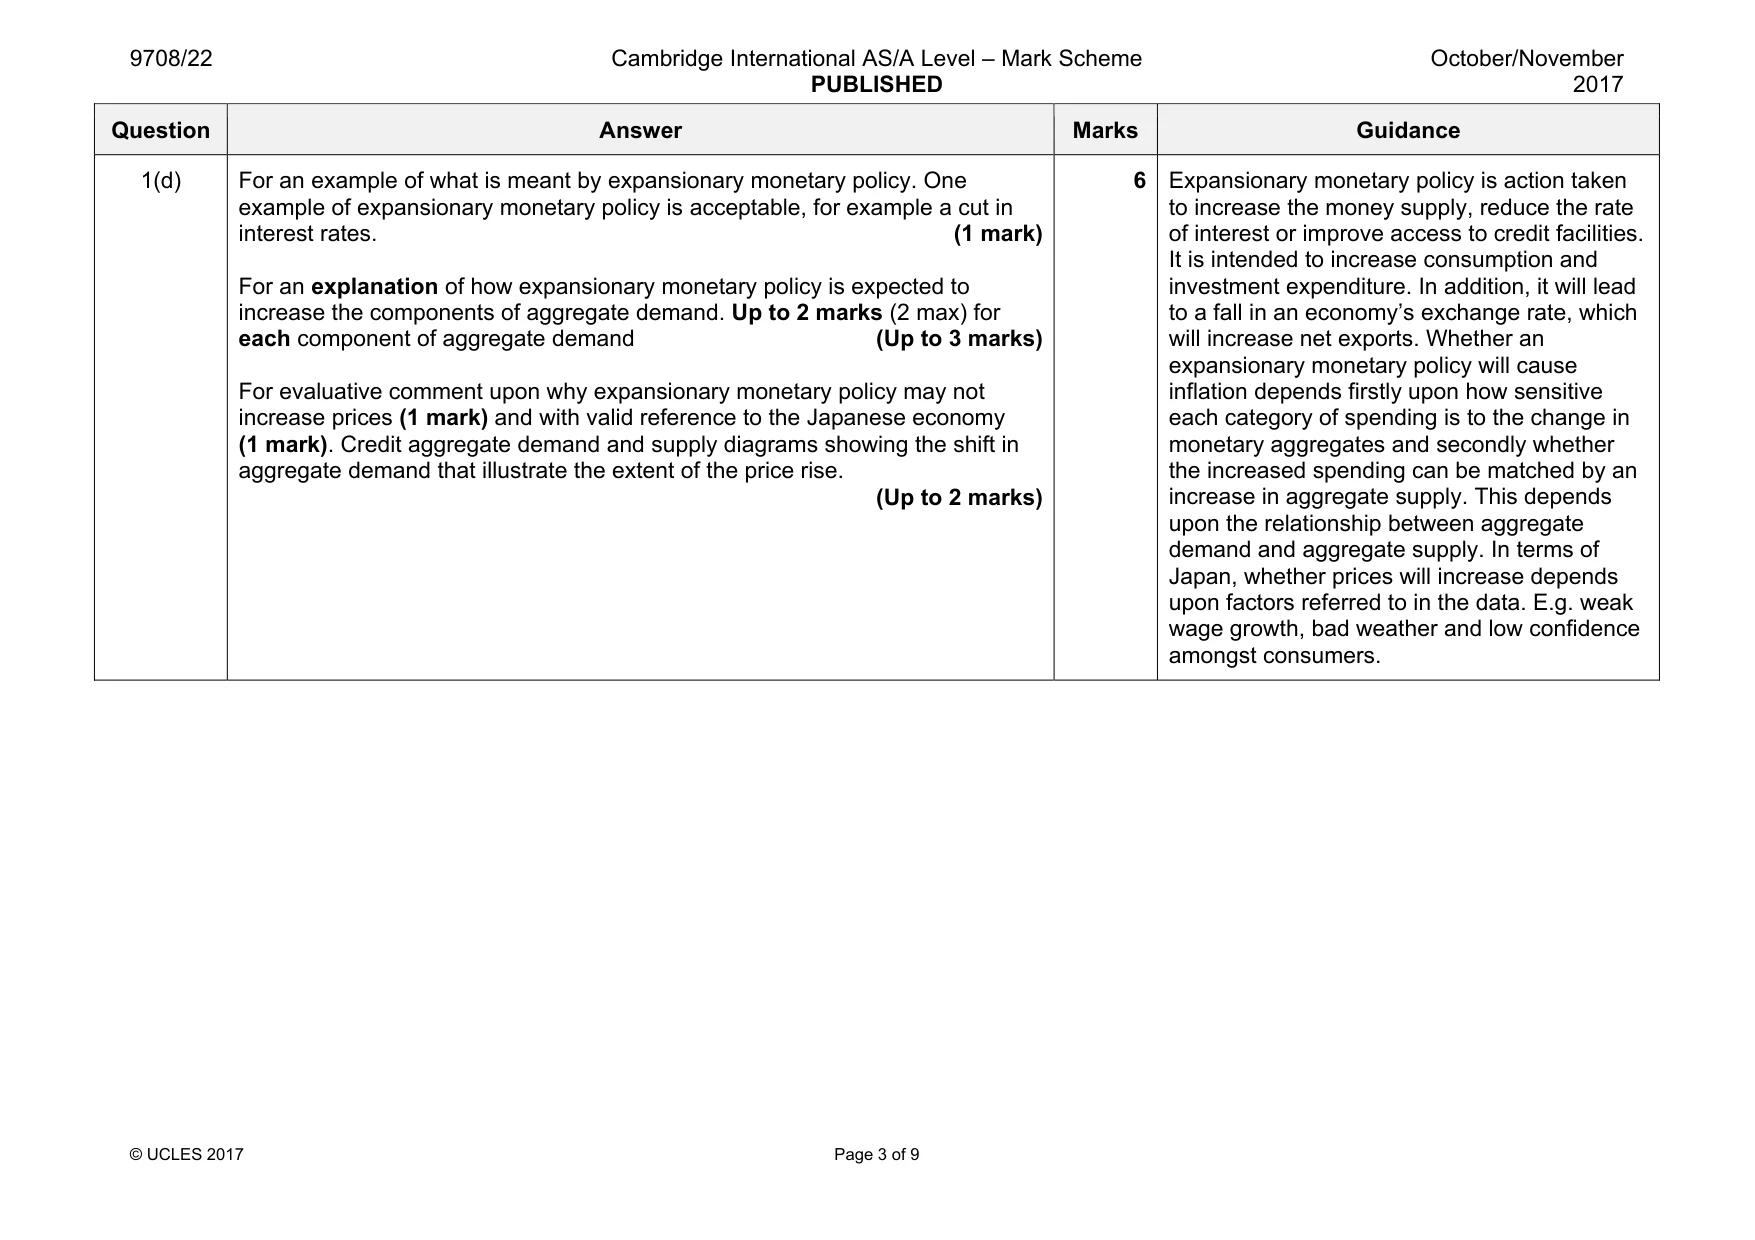
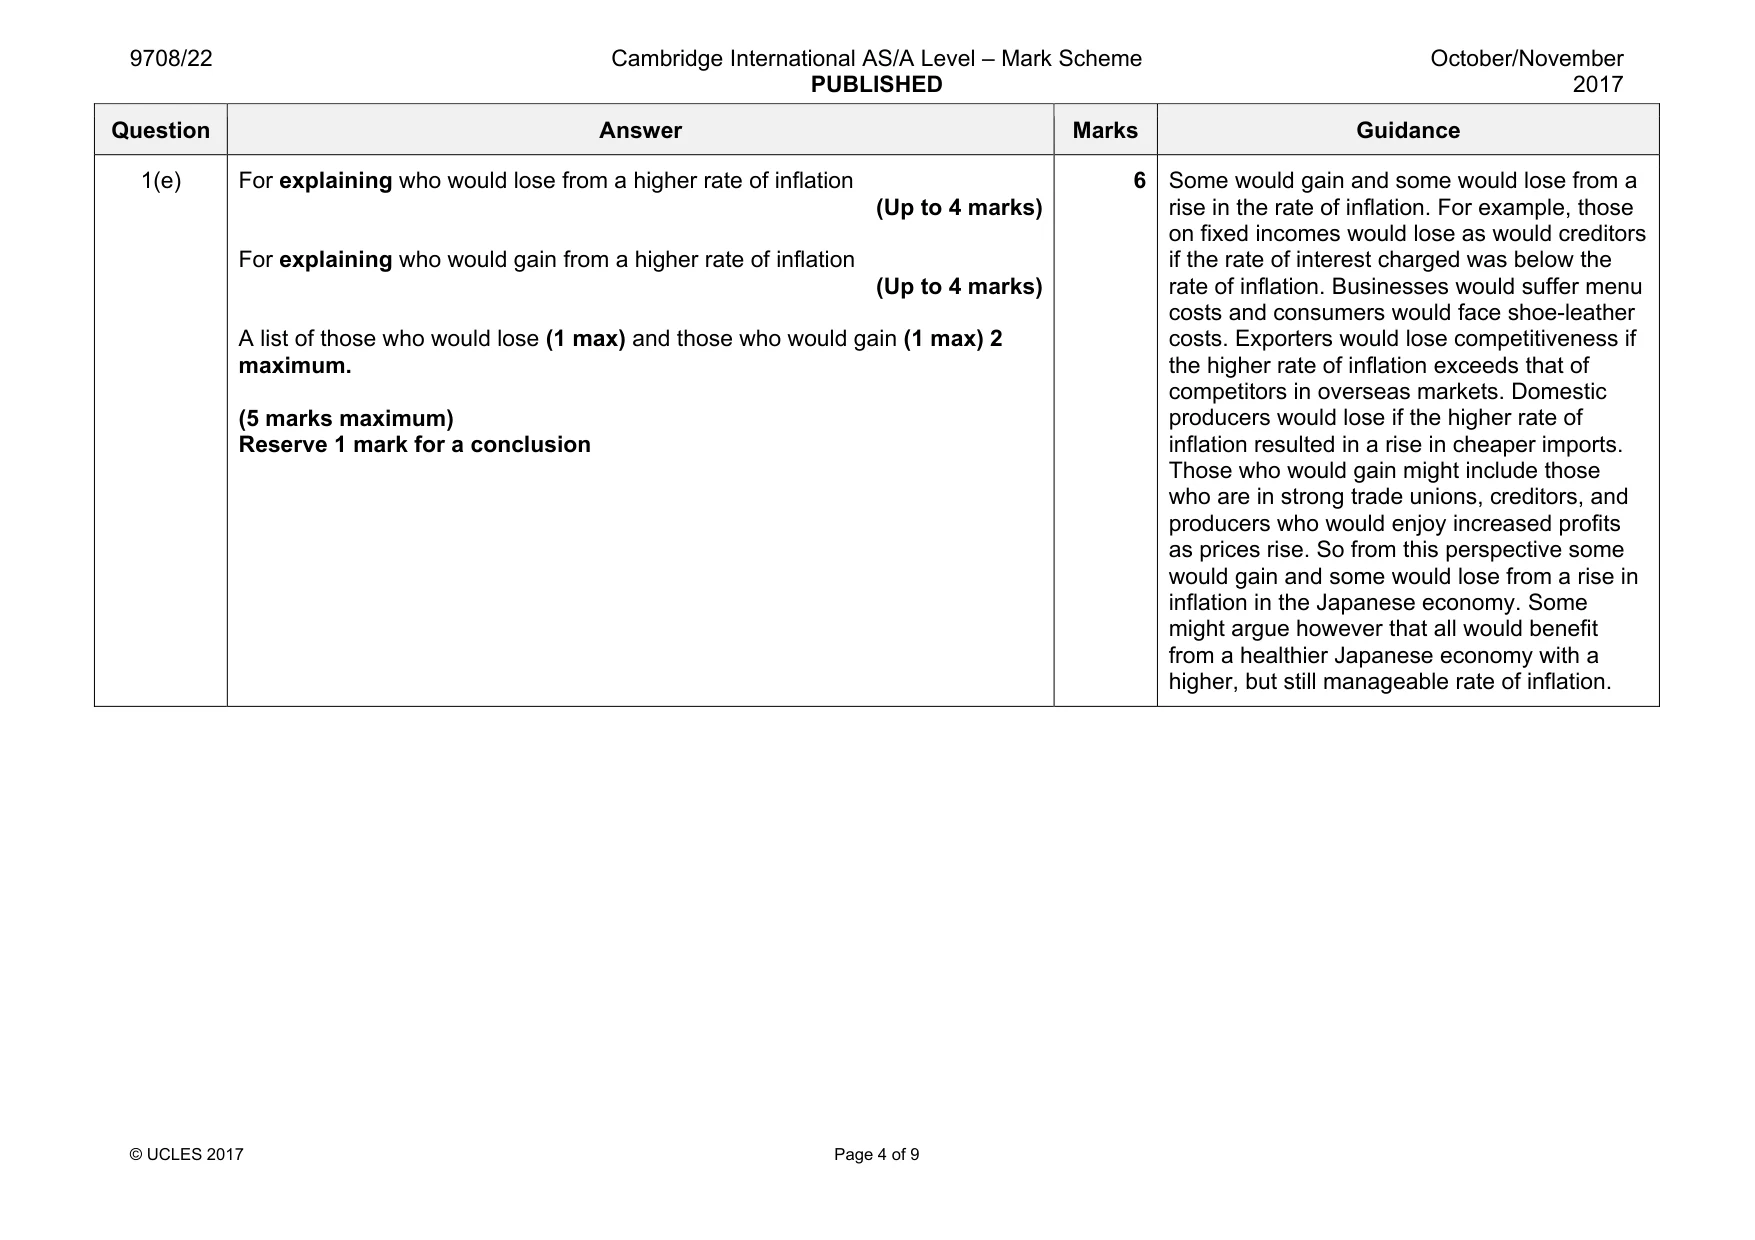
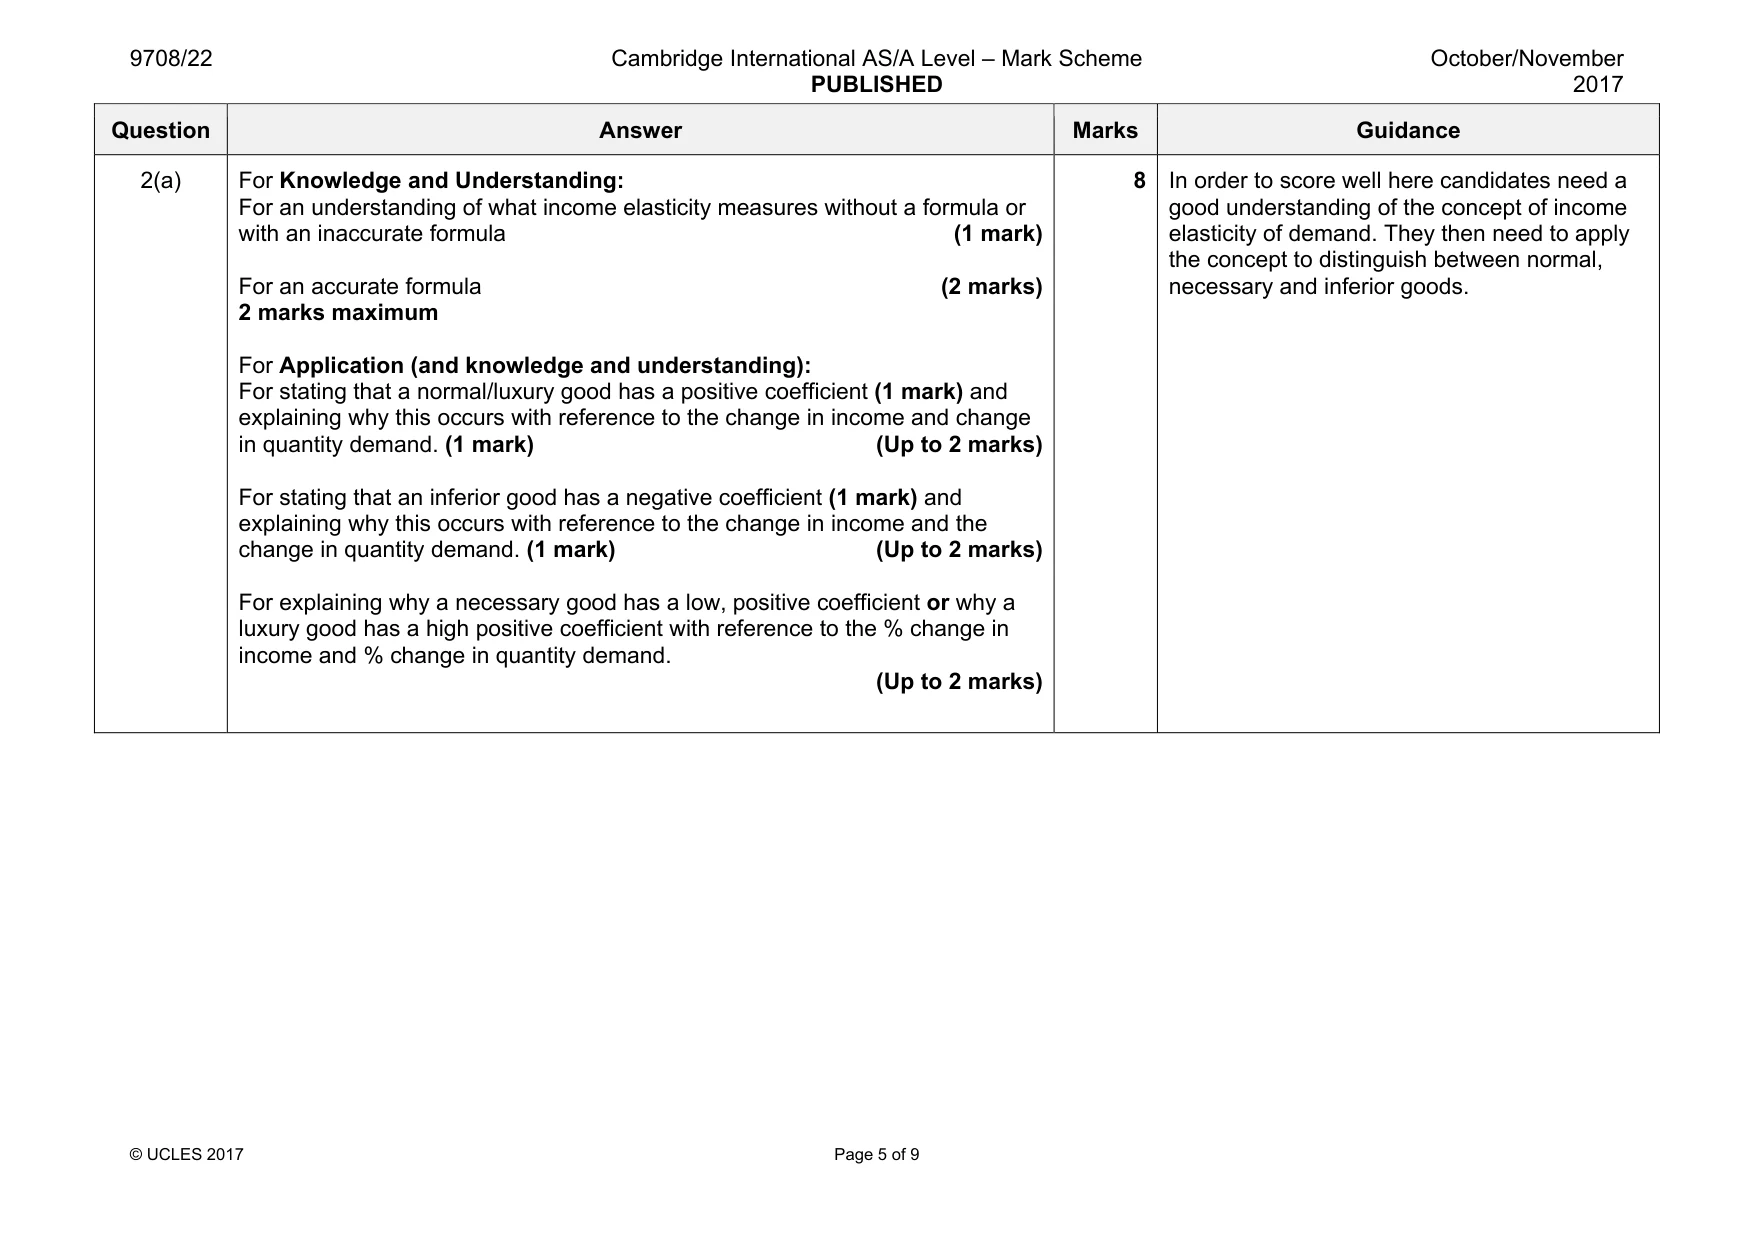
Mark scheme: 1(a) 2010 to June 2013 (1 mark) June 2015 to December 2015 (1 mark) 2 Allow benefit of doubt to those candidates who identify the dates when prices have fallen e.g. June 2013 even if it is not clear that they understand that prices have fallen over a period. 1(b) For identification of a relevant category of spending (1 mark) and for an accompanying explanation that oil is a component of this category of spending and this has contributed to the falling prices of the chosen category shown in the data. (1 mark) 2 The two categories of spending that could be used are ‘Fuel, Light and Water Charges’ and ‘Transport and Communication’. Reference to either could gain the marks available if explained. Both have oil as components and ‘tumbling oil prices’ have reduced both categories of spending and contributed to downward pressure on prices. 1(c) For identifying ‘Food’ as the category that has the greatest impact upon real incomes (1 mark) because this category has the highest weight attached (1 mark) and together with the price change (1 mark) will lead to a decrease real incomes (1 mark) (4 maximum) Allow credit for the argument that ‘Fuel, Light and Water’ shows the biggest fall in price (1 mark) and that this will increase real incomes (1 mark). (2 maximum) 4 ‘Real income’ is money income adjusted for price changes. It expresses how many goods and services that a given money income can buy. The impact of price changes on real income is determined by two factors. One is the year on year price change and the other is the weight attached to each category of spending. In terms of the data, “Fuel etc’ has the greatest price change, but its weight is much less than ‘Food’. ‘Food’ has the highest year on year price increase and it also has the highest weight attached. When the extent of the price change and the weight attached to the categories of spending are examined it is clear that food price changes have the greatest impact upon real incomes. In order to score full marks it is necessary to provide a full explanation of the reason that this category of spending has the highest impact upon real incomes. Question Answer Marks Guidance 1(d) For an example of what is meant by expansionary monetary policy. One example of expansionary monetary policy is acceptable, for example a cut in interest rates. (1 mark) For an explanation of how expansionary monetary policy is expected to increase the components of aggregate demand. Up to 2 marks (2 max) for each component of aggregate demand (Up to 3 marks) For evaluative comment upon why expansionary monetary policy may not increase prices (1 mark) and with valid reference to the Japanese economy (1 mark). Credit aggregate demand and supply diagrams showing the shift in aggregate demand that illustrate the extent of the price rise. (Up to 2 marks) 6 Expansionary monetary policy is action taken to increase the money supply, reduce the rate of interest or improve access to credit facilities. It is intended to increase consumption and investment expenditure. In addition, it will lead to a fall in an economy’s exchange rate, which will increase net exports. Whether an expansionary monetary policy will cause inflation depends firstly upon how sensitive each category of spending is to the change in monetary aggregates and secondly whether the increased spending can be matched by an increase in aggregate supply. This depends upon the relationship between aggregate demand and aggregate supply. In terms of Japan, whether prices will increase depends upon factors referred to in the data. E.g. weak wage growth, bad weather and low confidence amongst consumers. Question Answer Marks Guidance 1(e) For explaining who would lose from a higher rate of inflation (Up to 4 marks) For explaining who would gain from a higher rate of inflation (Up to 4 marks) A list of those who would lose (1 max) and those who would gain (1 max) 2 maximum. (5 marks maximum) Reserve 1 mark for a conclusion 6 Some would gain and some would lose from a rise in the rate of inflation. For example, those on fixed incomes would lose as would creditors if the rate of interest charged was below the rate of inflation. Businesses would suffer menu costs and consumers would face shoe-leather costs. Exporters would lose competitiveness if the higher rate of inflation exceeds that of competitors in overseas markets. Domestic producers would lose if the higher rate of inflation resulted in a rise in cheaper imports. Those who would gain might include those who are in strong trade unions, creditors, and producers who would enjoy increased profits as prices rise. So from this perspective some would gain and some would lose from a rise in inflation in the Japanese economy. Some might argue however that all would benefit from a healthier Japanese economy with a higher, but still manageable rate of inflation.
Q2 · Explain how economists use the concept of income elasticity of demand to distinguish…
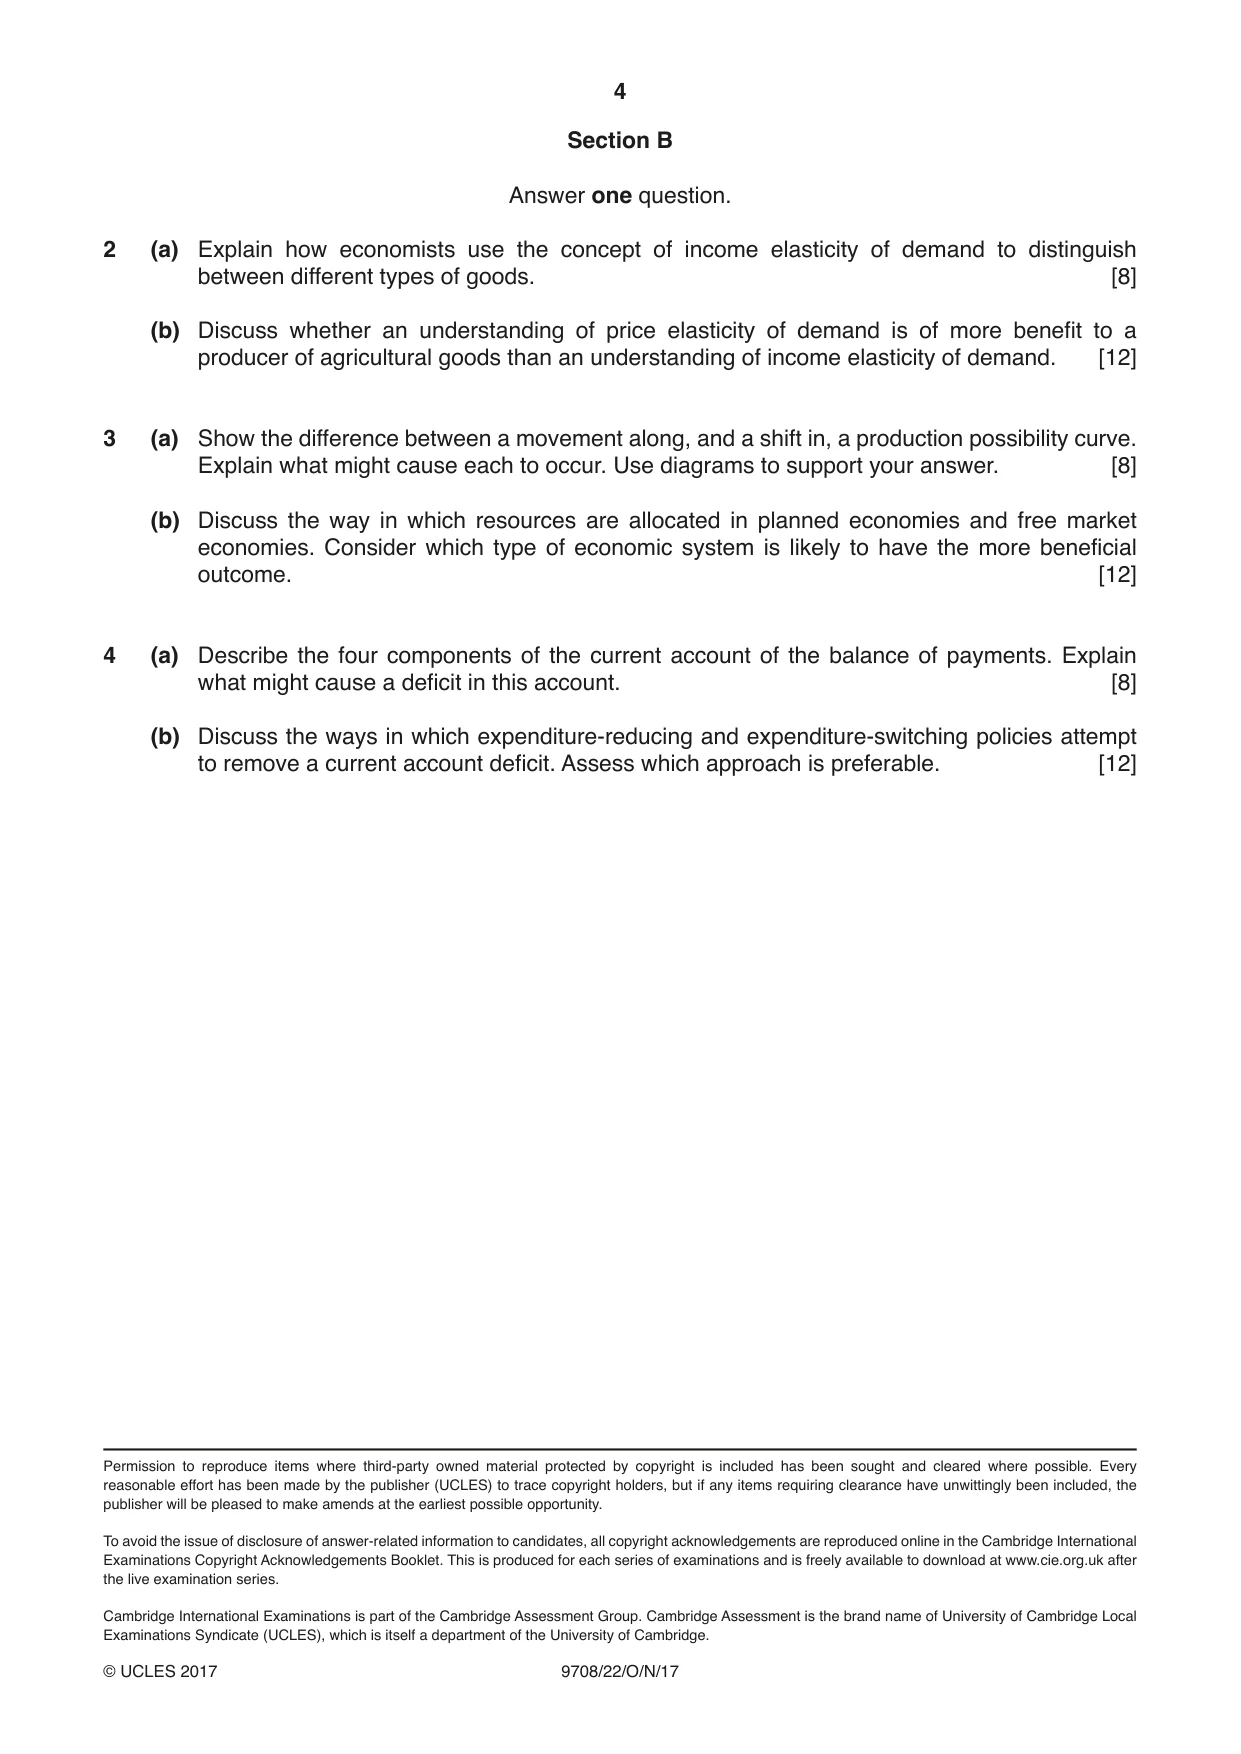
2 (a) Explain how economists use the concept of income elasticity of demand to distinguish between different types of goods. [8] (b) Discuss whether an understanding of price elasticity of demand is of more benefit to a producer of agricultural goods than an understanding of income elasticity of demand. [12]
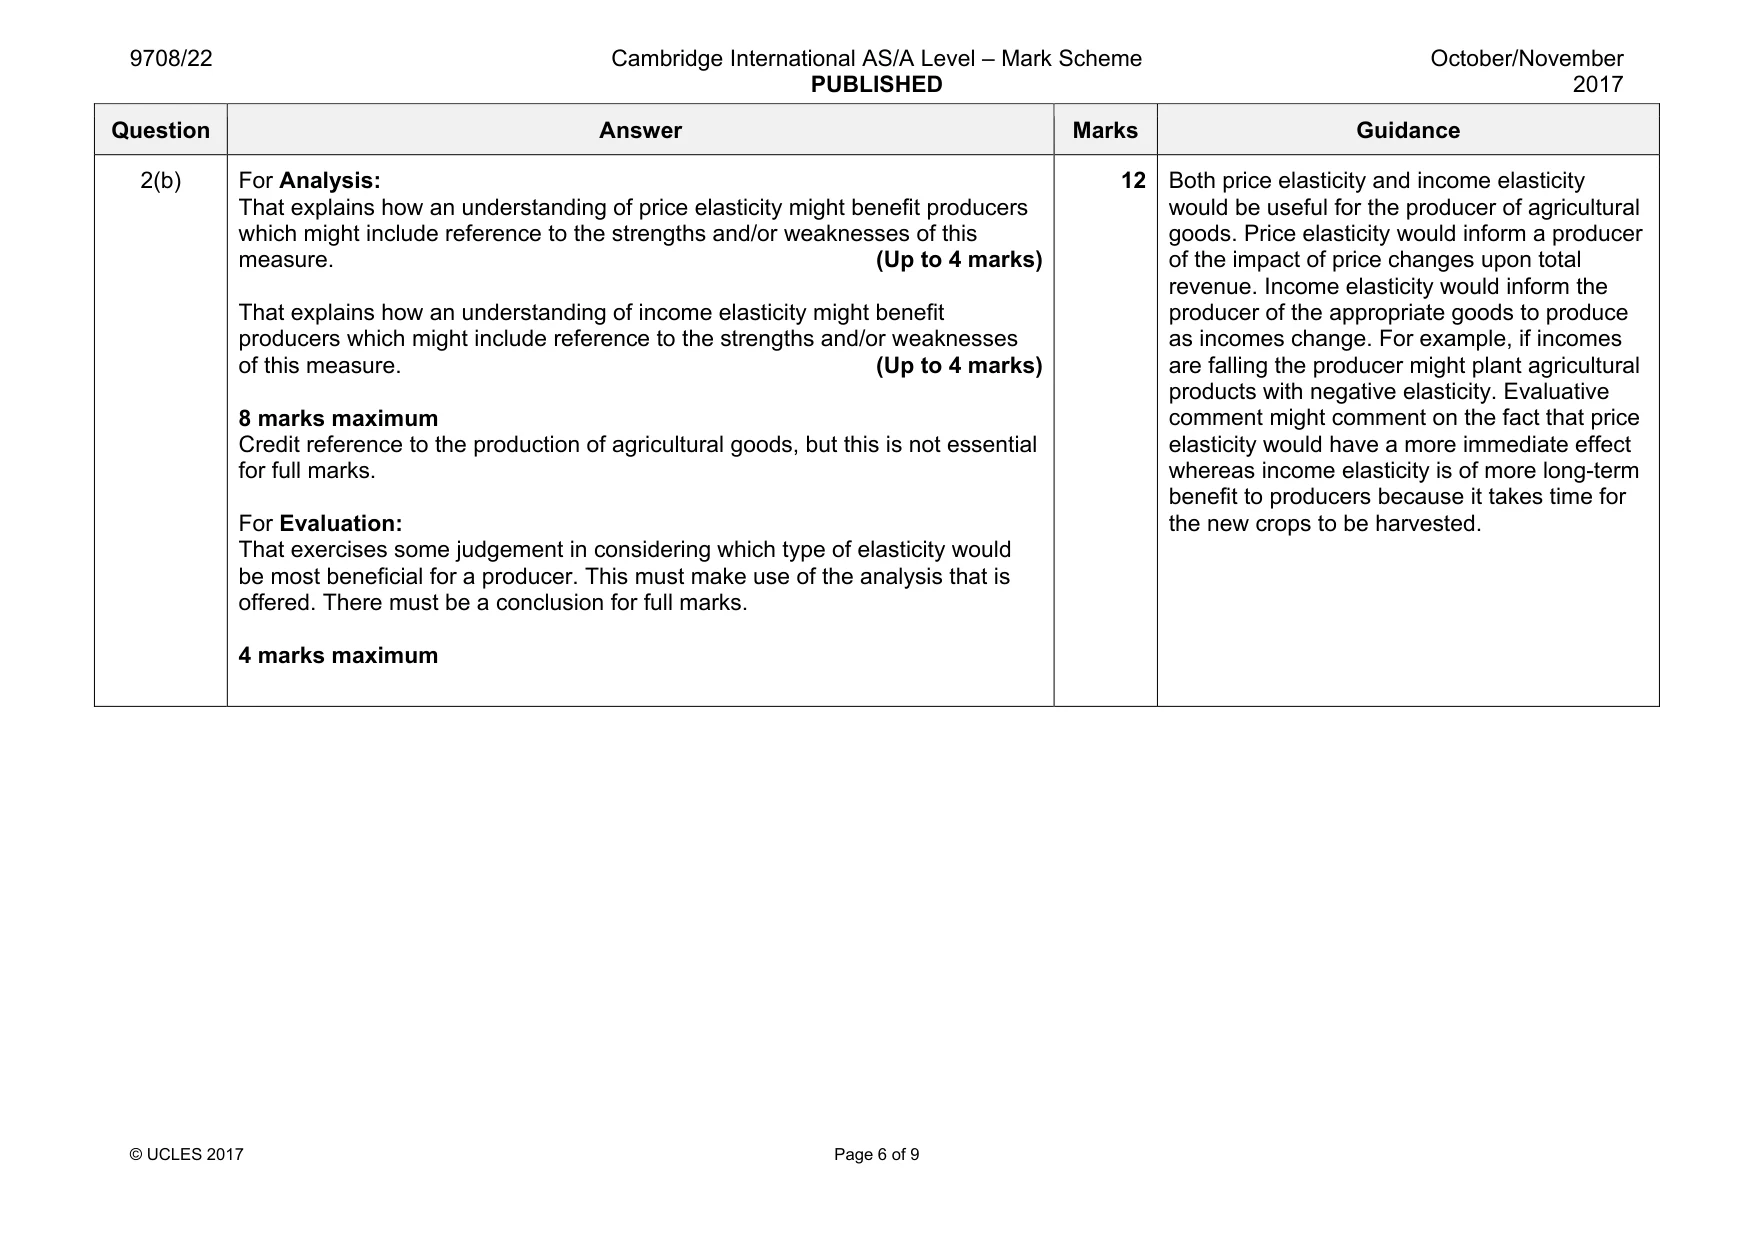
Mark scheme: 2(a) For Knowledge and Understanding: For an understanding of what income elasticity measures without a formula or with an inaccurate formula (1 mark) For an accurate formula (2 marks) 2 marks maximum For Application (and knowledge and understanding): For stating that a normal/luxury good has a positive coefficient (1 mark) and explaining why this occurs with reference to the change in income and change in quantity demand. (1 mark) (Up to 2 marks) For stating that an inferior good has a negative coefficient (1 mark) and explaining why this occurs with reference to the change in income and the change in quantity demand. (1 mark) (Up to 2 marks) For explaining why a necessary good has a low, positive coefficient or why a luxury good has a high positive coefficient with reference to the % change in income and % change in quantity demand. (Up to 2 marks) 8 good understanding of the concept of income elasticity of demand. They then need to apply the concept to distinguish between normal, necessary and inferior goods. Question Answer Marks Guidance 2(b) For Analysis: That explains how an understanding of price elasticity might benefit producers which might include reference to the strengths and/or weaknesses of this measure. (Up to 4 marks) That explains how an understanding of income elasticity might benefit producers which might include reference to the strengths and/or weaknesses of this measure. (Up to 4 marks) 8 marks maximum Credit reference to the production of agricultural goods, but this is not essential for full marks. For Evaluation: That exercises some judgement in considering which type of elasticity would be most beneficial for a producer. This must make use of the analysis that is offered. There must be a conclusion for full marks. 4 marks maximum 12 Both price elasticity and income elasticity would be useful for the producer of agricultural goods. Price elasticity would inform a producer of the impact of price changes upon total revenue. Income elasticity would inform the producer of the appropriate goods to produce as incomes change. For example, if incomes are falling the producer might plant agricultural products with negative elasticity. Evaluative comment might comment on the fact that price elasticity would have a more immediate effect whereas income elasticity is of more long-term benefit to producers because it takes time for the new crops to be harvested.
More questions on Price elasticity, income elasticity and cross elasticity of demand
Q3 · Show the difference between a movement along, and a shift in, a production possibility…
3 (a) Show the difference between a movement along, and a shift in, a production possibility curve. Explain what might cause each to occur. Use diagrams to support your answer. [8] (b) Discuss the way in which resources are allocated in planned economies and free market economies. Consider which type of economic system is likely to have the more beneficial outcome. [12]
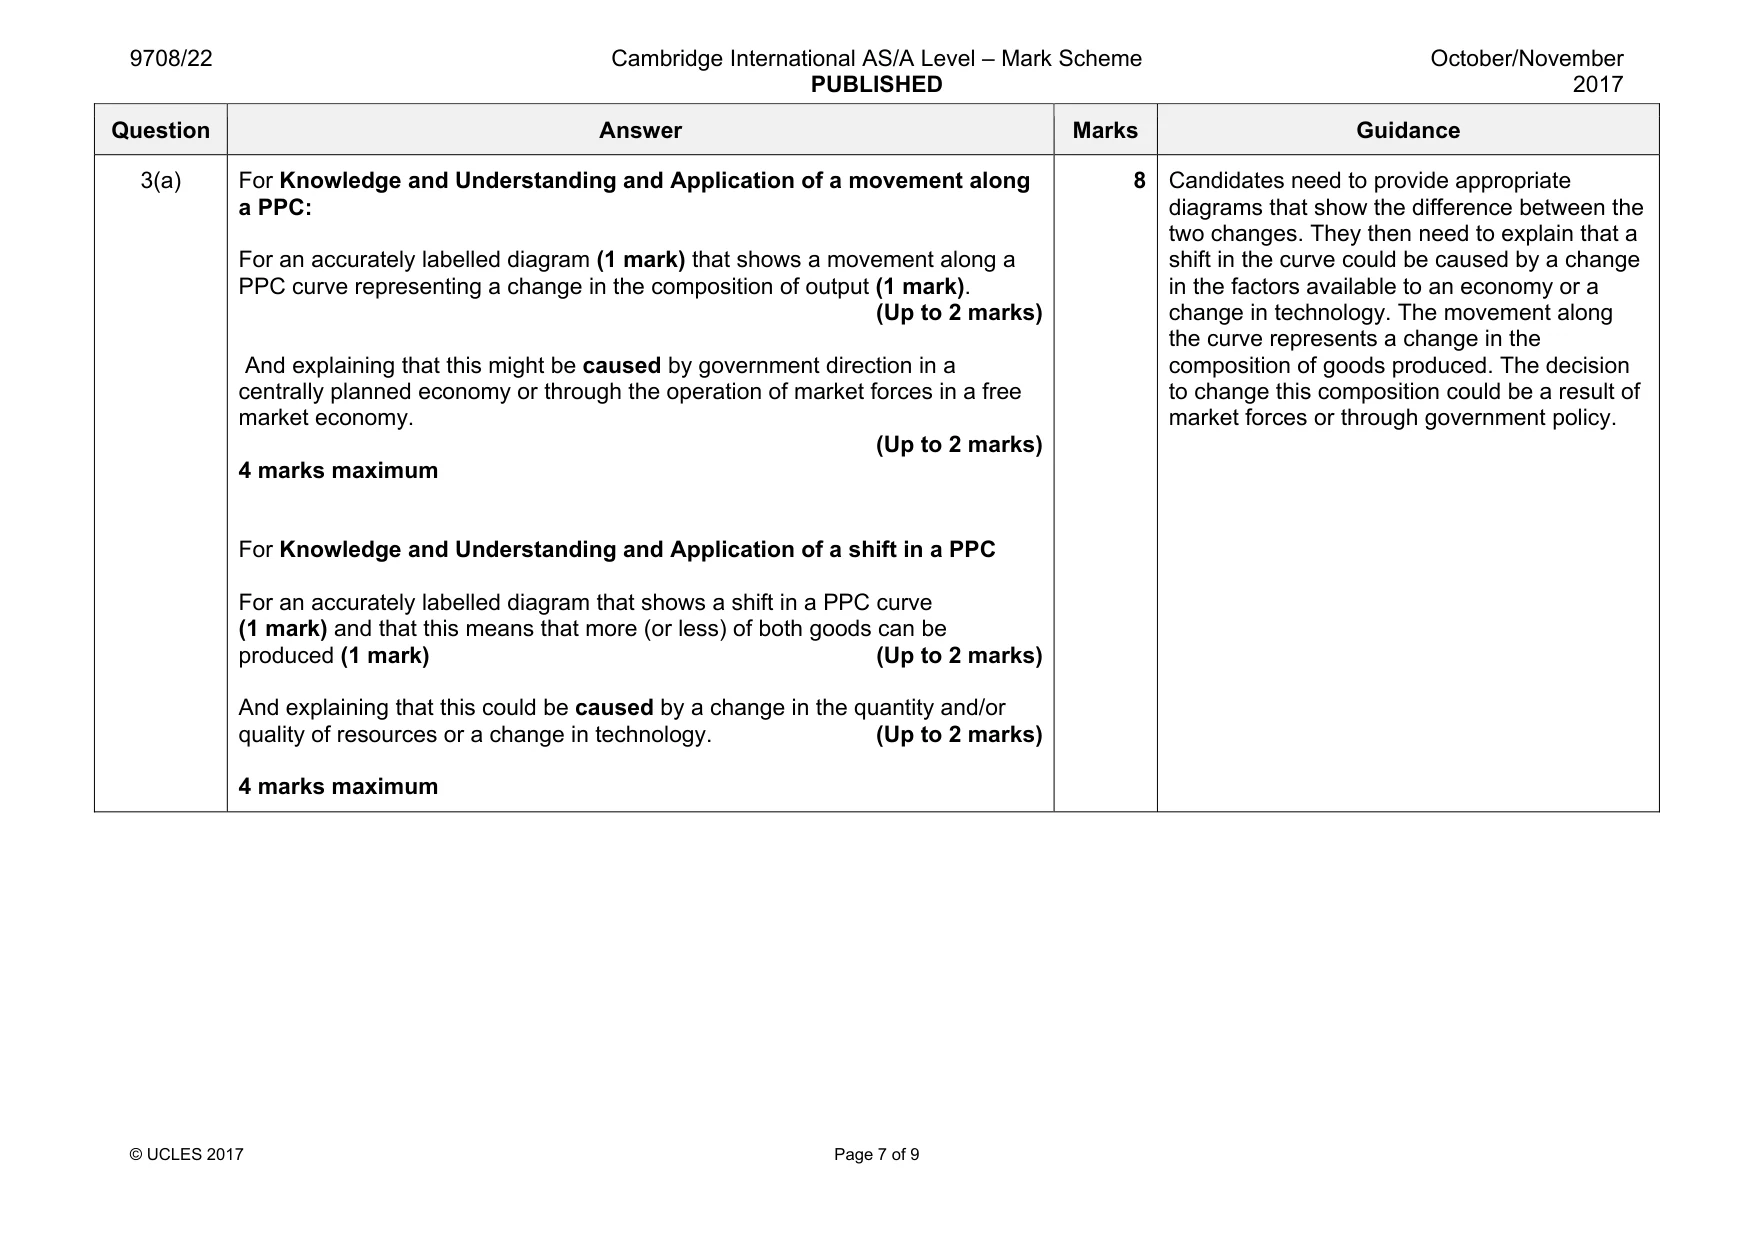
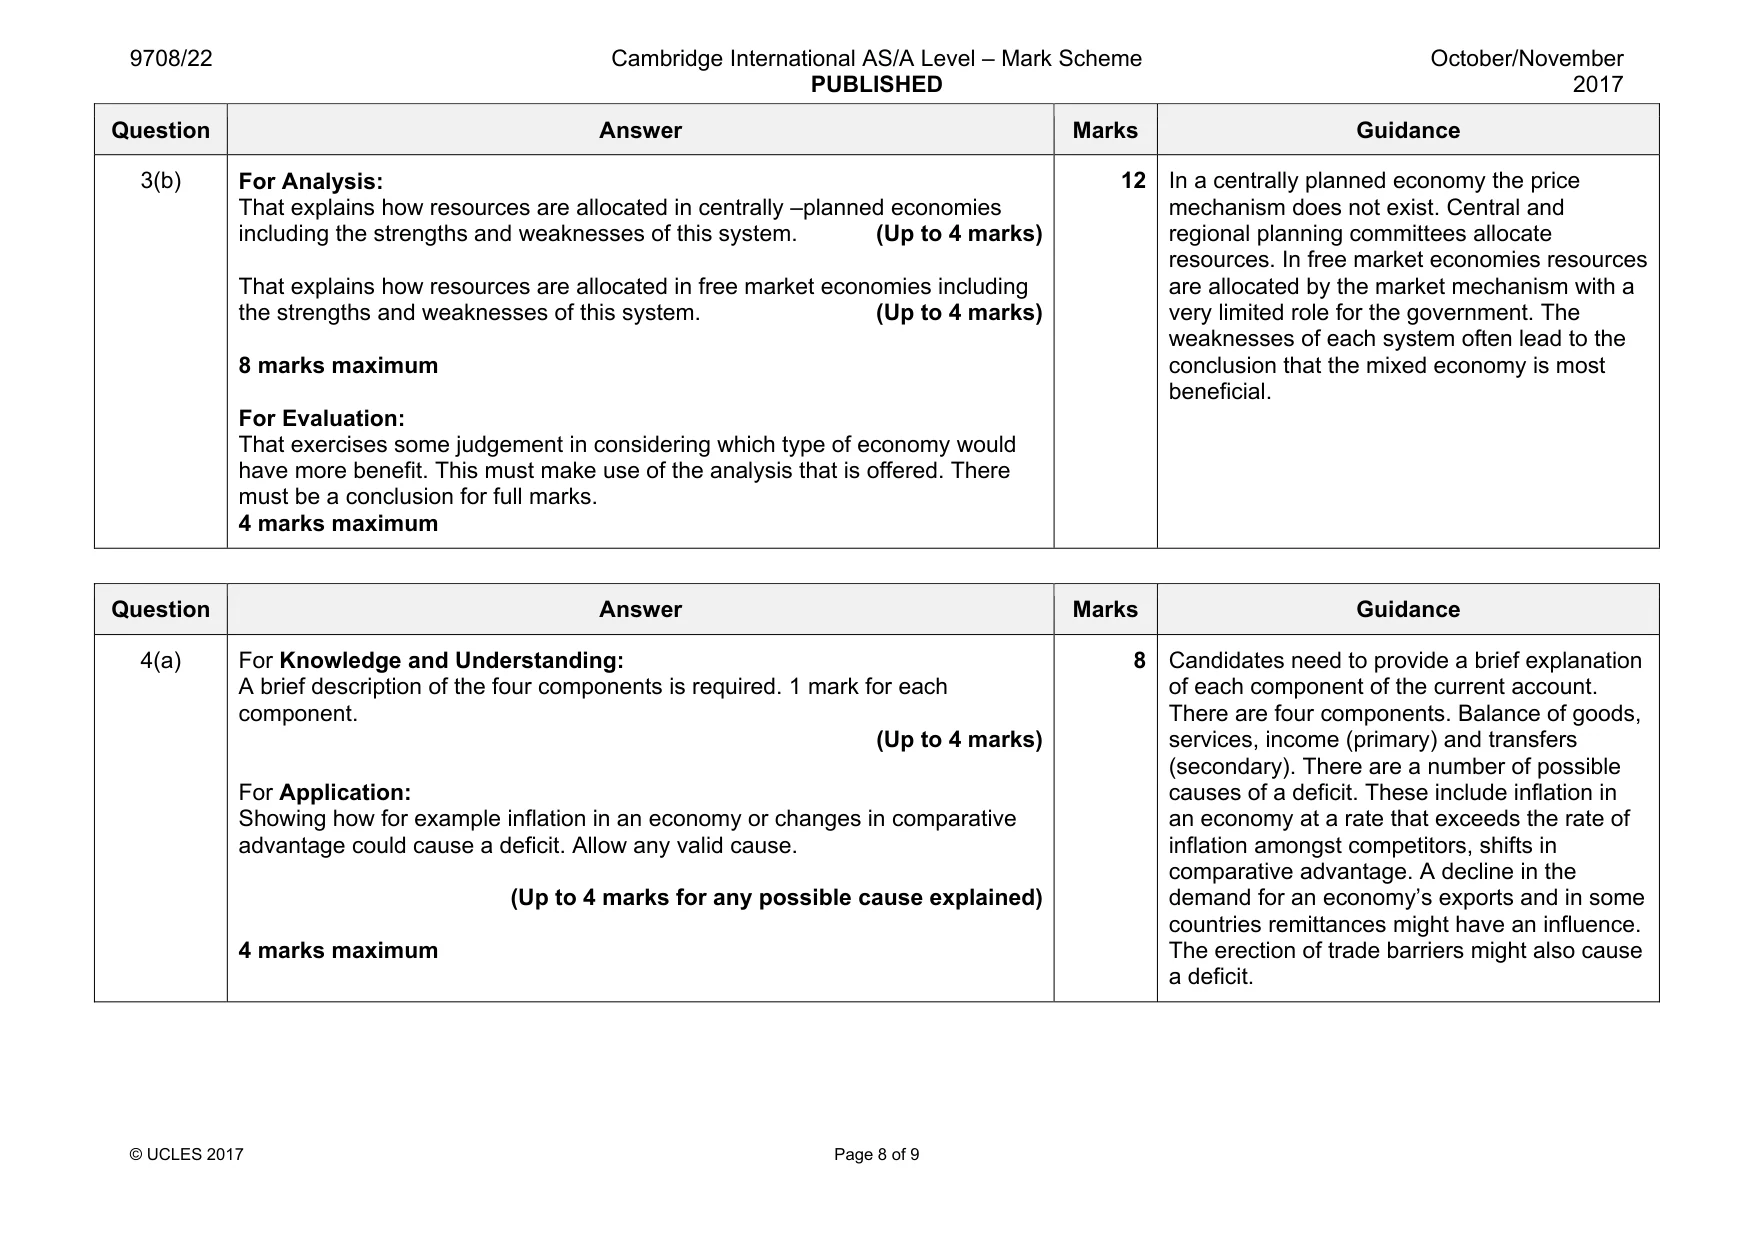
Mark scheme: 3(a) For Knowledge and Understanding and Application of a movement along a PPC: For an accurately labelled diagram (1 mark) that shows a movement along a PPC curve representing a change in the composition of output (1 mark). (Up to 2 marks) And explaining that this might be caused by government direction in a centrally planned economy or through the operation of market forces in a free market economy. (Up to 2 marks) 4 marks maximum For Knowledge and Understanding and Application of a shift in a PPC For an accurately labelled diagram that shows a shift in a PPC curve (1 mark) and that this means that more (or less) of both goods can be produced (1 mark) (Up to 2 marks) And explaining that this could be caused by a change in the quantity and/or quality of resources or a change in technology. (Up to 2 marks) 4 marks maximum 8 diagrams that show the difference between the two changes. They then need to explain that a shift in the curve could be caused by a change in the factors available to an economy or a change in technology. The movement along the curve represents a change in the composition of goods produced. The decision to change this composition could be a result of market forces or through government policy. Question Answer Marks Guidance 3(b) For Analysis: That explains how resources are allocated in centrally –planned economies including the strengths and weaknesses of this system. (Up to 4 marks) That explains how resources are allocated in free market economies including the strengths and weaknesses of this system. (Up to 4 marks) 8 marks maximum For Evaluation: That exercises some judgement in considering which type of economy would have more benefit. This must make use of the analysis that is offered. There must be a conclusion for full marks. 4 marks maximum 12 In a centrally planned economy the price mechanism does not exist. Central and regional planning committees allocate resources. In free market economies resources are allocated by the market mechanism with a very limited role for the government. The weaknesses of each system often lead to the conclusion that the mixed economy is most beneficial.
More questions on Resource allocation in different economic systems
Q4 · Describe the four components of the current account of the balance of payments
4 (a) Describe the four components of the current account of the balance of payments. Explain what might cause a deficit in this account. [8] (b) Discuss the ways in which expenditure-reducing and expenditure-switching policies attempt to remove a current account deficit. Assess which approach is preferable. [12]
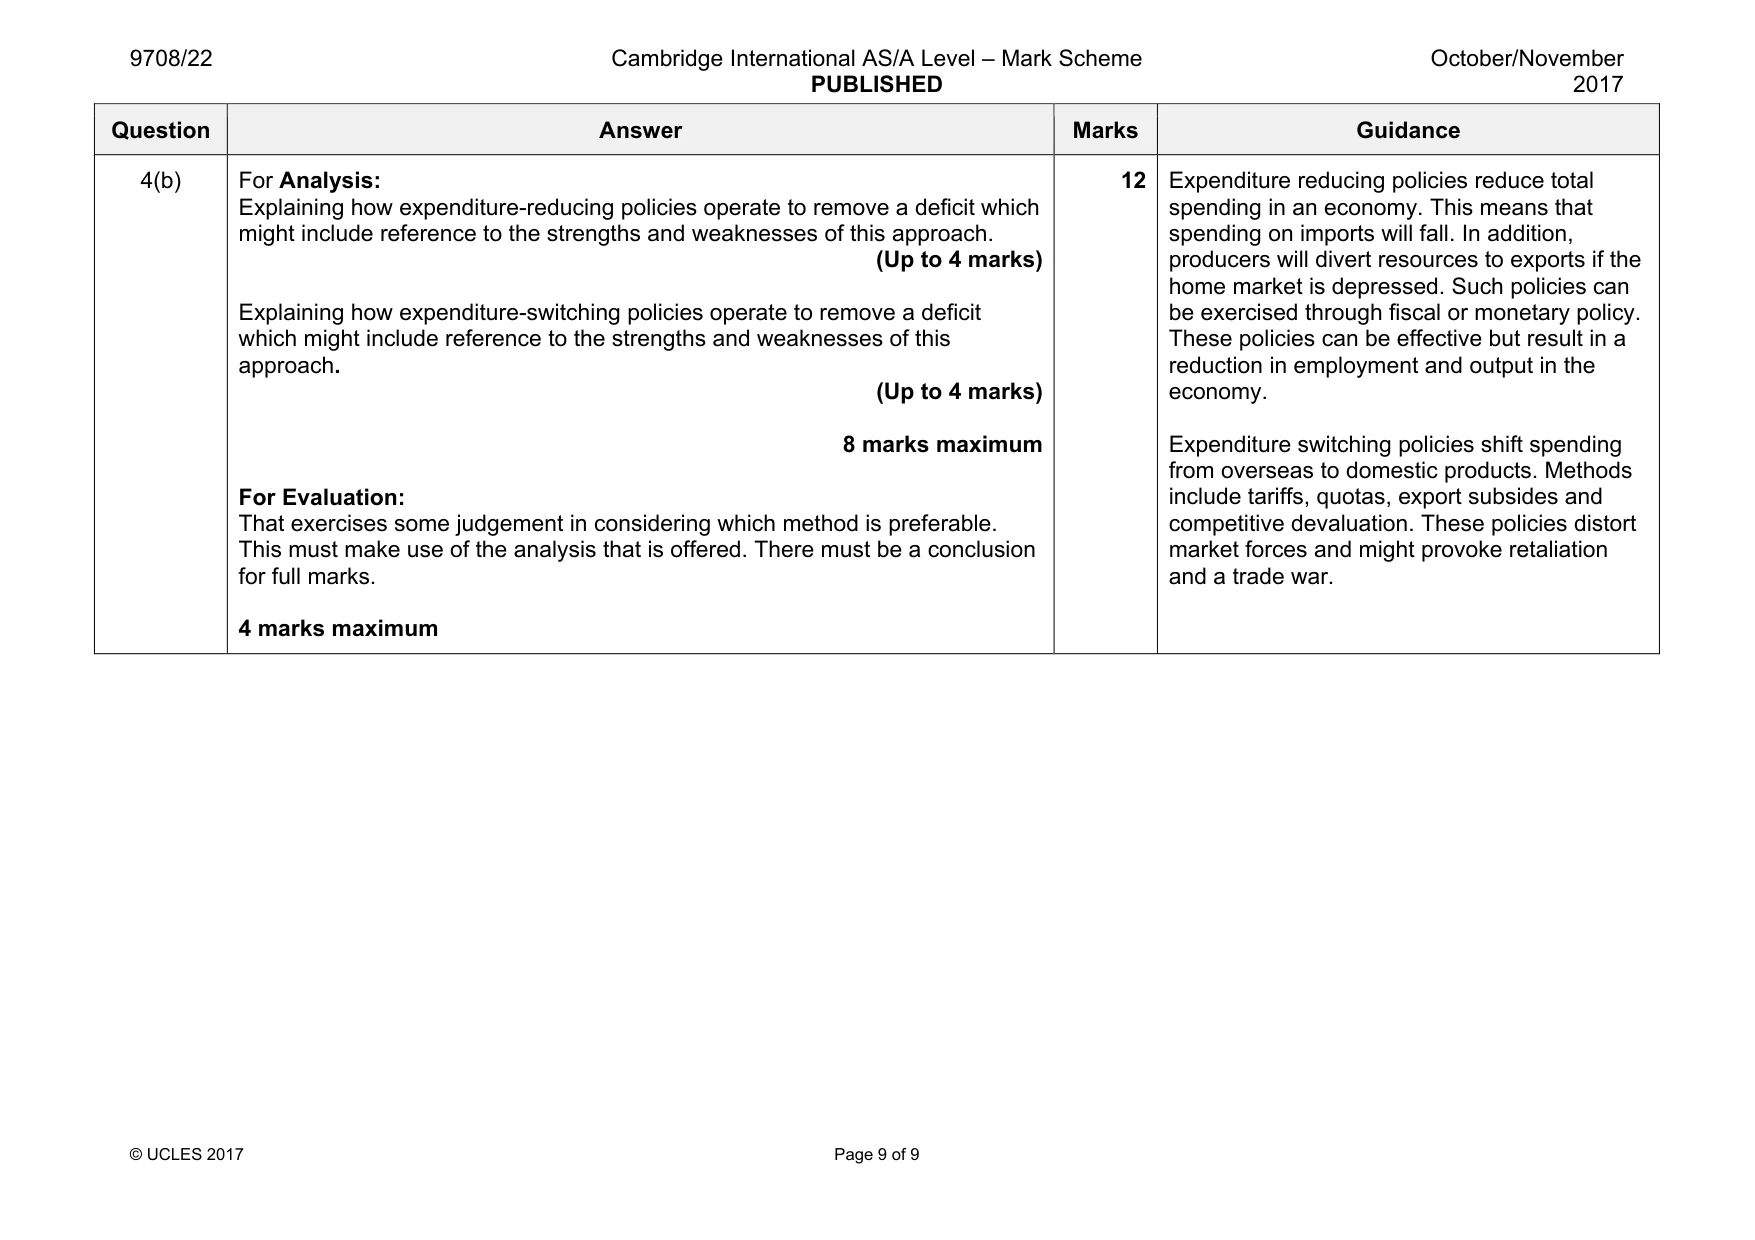
Mark scheme: 4(a) For Knowledge and Understanding: A brief description of the four components is required. 1 mark for each component. (Up to 4 marks) For Application: Showing how for example inflation in an economy or changes in comparative advantage could cause a deficit. Allow any valid cause. (Up to 4 marks for any possible cause explained) 4 marks maximum 8 of each component of the current account. There are four components. Balance of goods, services, income (primary) and transfers (secondary). There are a number of possible causes of a deficit. These include inflation in an economy at a rate that exceeds the rate of inflation amongst competitors, shifts in comparative advantage. A decline in the demand for an economy’s exports and in some countries remittances might have an influence. The erection of trade barriers might also cause a deficit. Question Answer Marks Guidance 4(b) For Analysis: Explaining how expenditure-reducing policies operate to remove a deficit which might include reference to the strengths and weaknesses of this approach. (Up to 4 marks) Explaining how expenditure-switching policies operate to remove a deficit which might include reference to the strengths and weaknesses of this approach. (Up to 4 marks) 8 marks maximum For Evaluation: That exercises some judgement in considering which method is preferable. This must make use of the analysis that is offered. There must be a conclusion for full marks. 4 marks maximum 12 Expenditure reducing policies reduce total spending in an economy. This means that spending on imports will fall. In addition, producers will divert resources to exports if the home market is depressed. Such policies can be exercised through fiscal or monetary policy. These policies can be effective but result in a reduction in employment and output in the economy. Expenditure switching policies shift spending from overseas to domestic products. Methods include tariffs, quotas, export subsides and competitive devaluation. These policies distort market forces and might provoke retaliation and a trade war.
More questions on Policies to correct imbalances in the current account of the balance of payments
What was in this paper
The subtopics covered by these 4 questions, and how many questions each got. Open one in a new tab to see every Cambridge question on it.
What you needed in this session
Cambridge’s own grade thresholds for 2017 Oct/Nov, Paper 2 · Variant 2. A higher threshold means an easier paper — the bar moves with how the cohort did.