Cambridge A Level Economics 9708 — 2017 May/June Paper 4 · Variant 2
9708/42/M/J/17 · 7 questions · 70 marks · ≈79 min
The question paper and its mark scheme, free to read here and free to download. This is Cambridge’s own paper, exactly as it was sat.
Question paper4 pages

Mark scheme8 pages
Answers below. Sit the paper first if you are practising.

Questions as text
Q1 · Monetary policy and economic growth Between 2009 and 2014, the central bank of the United…
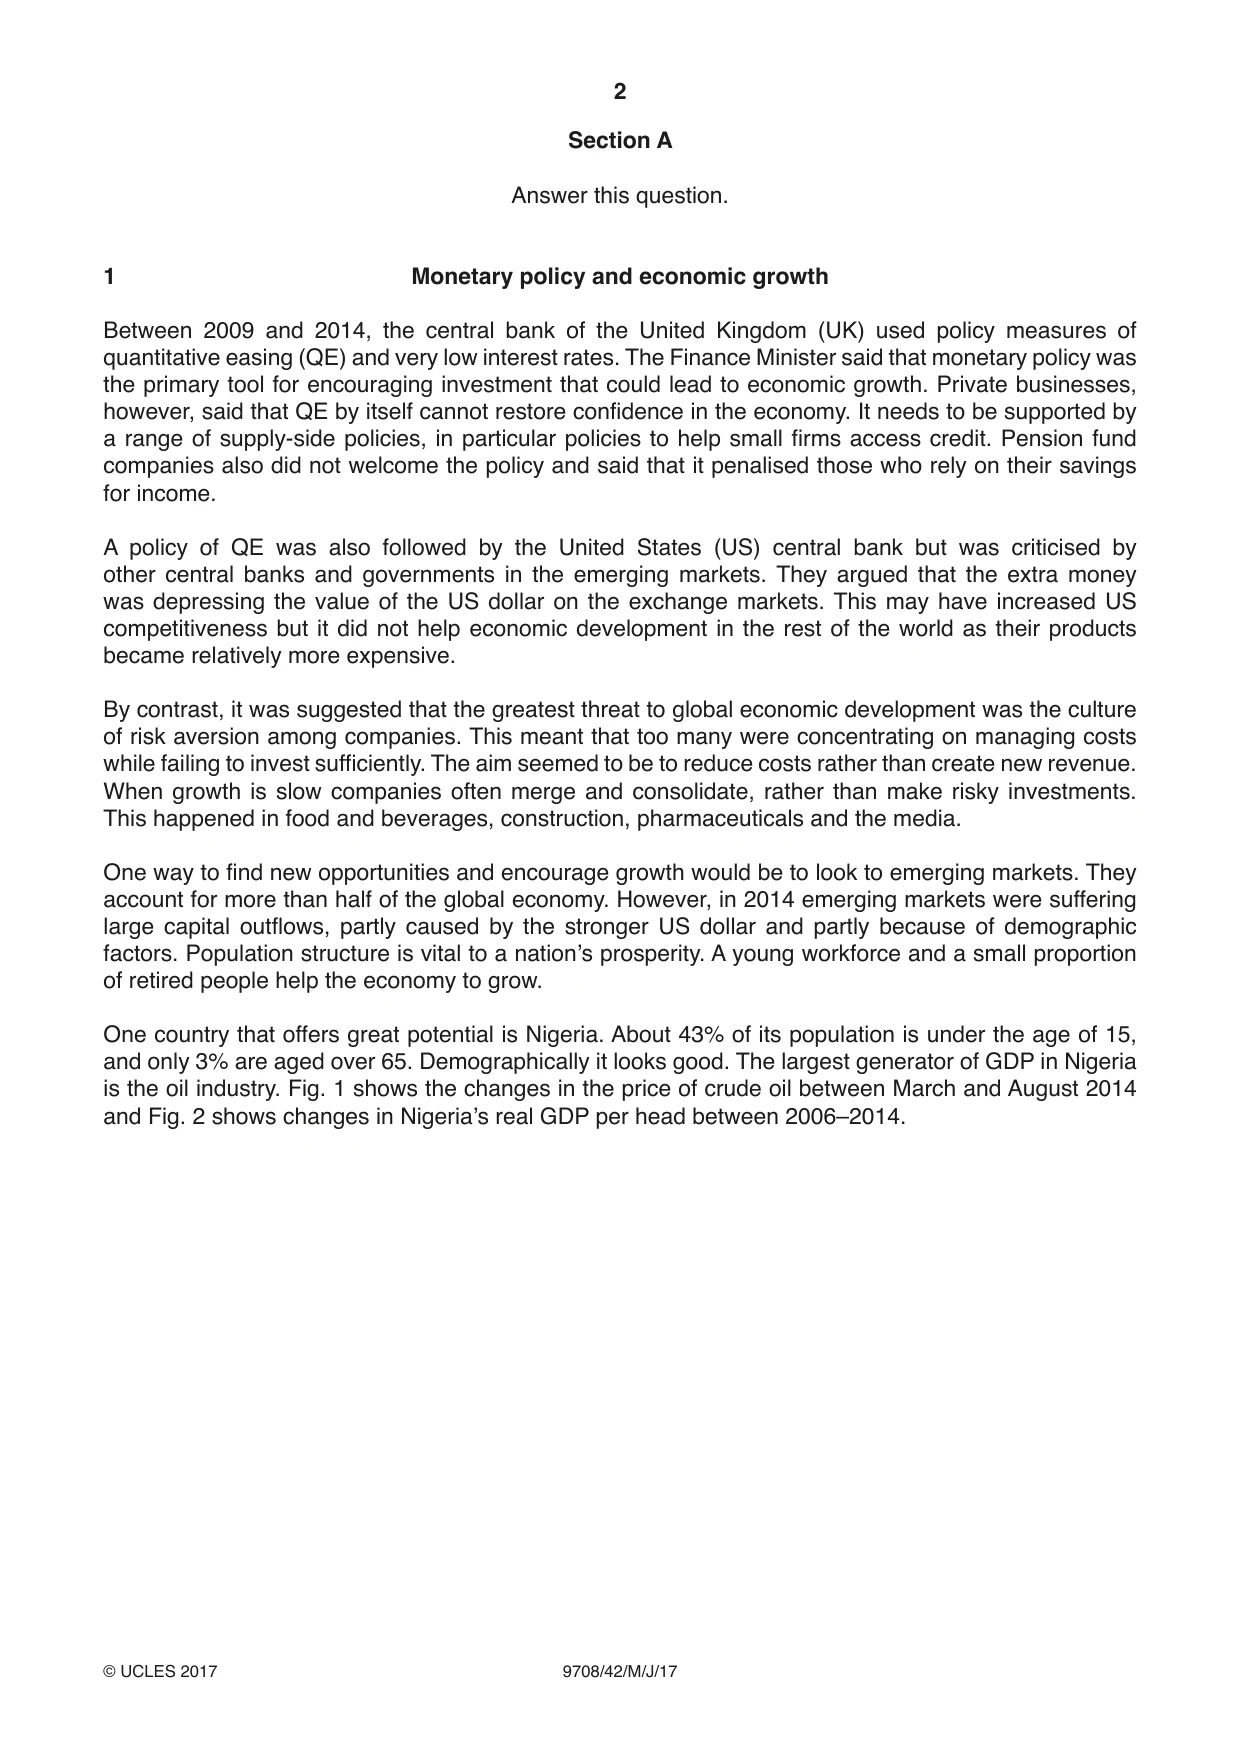
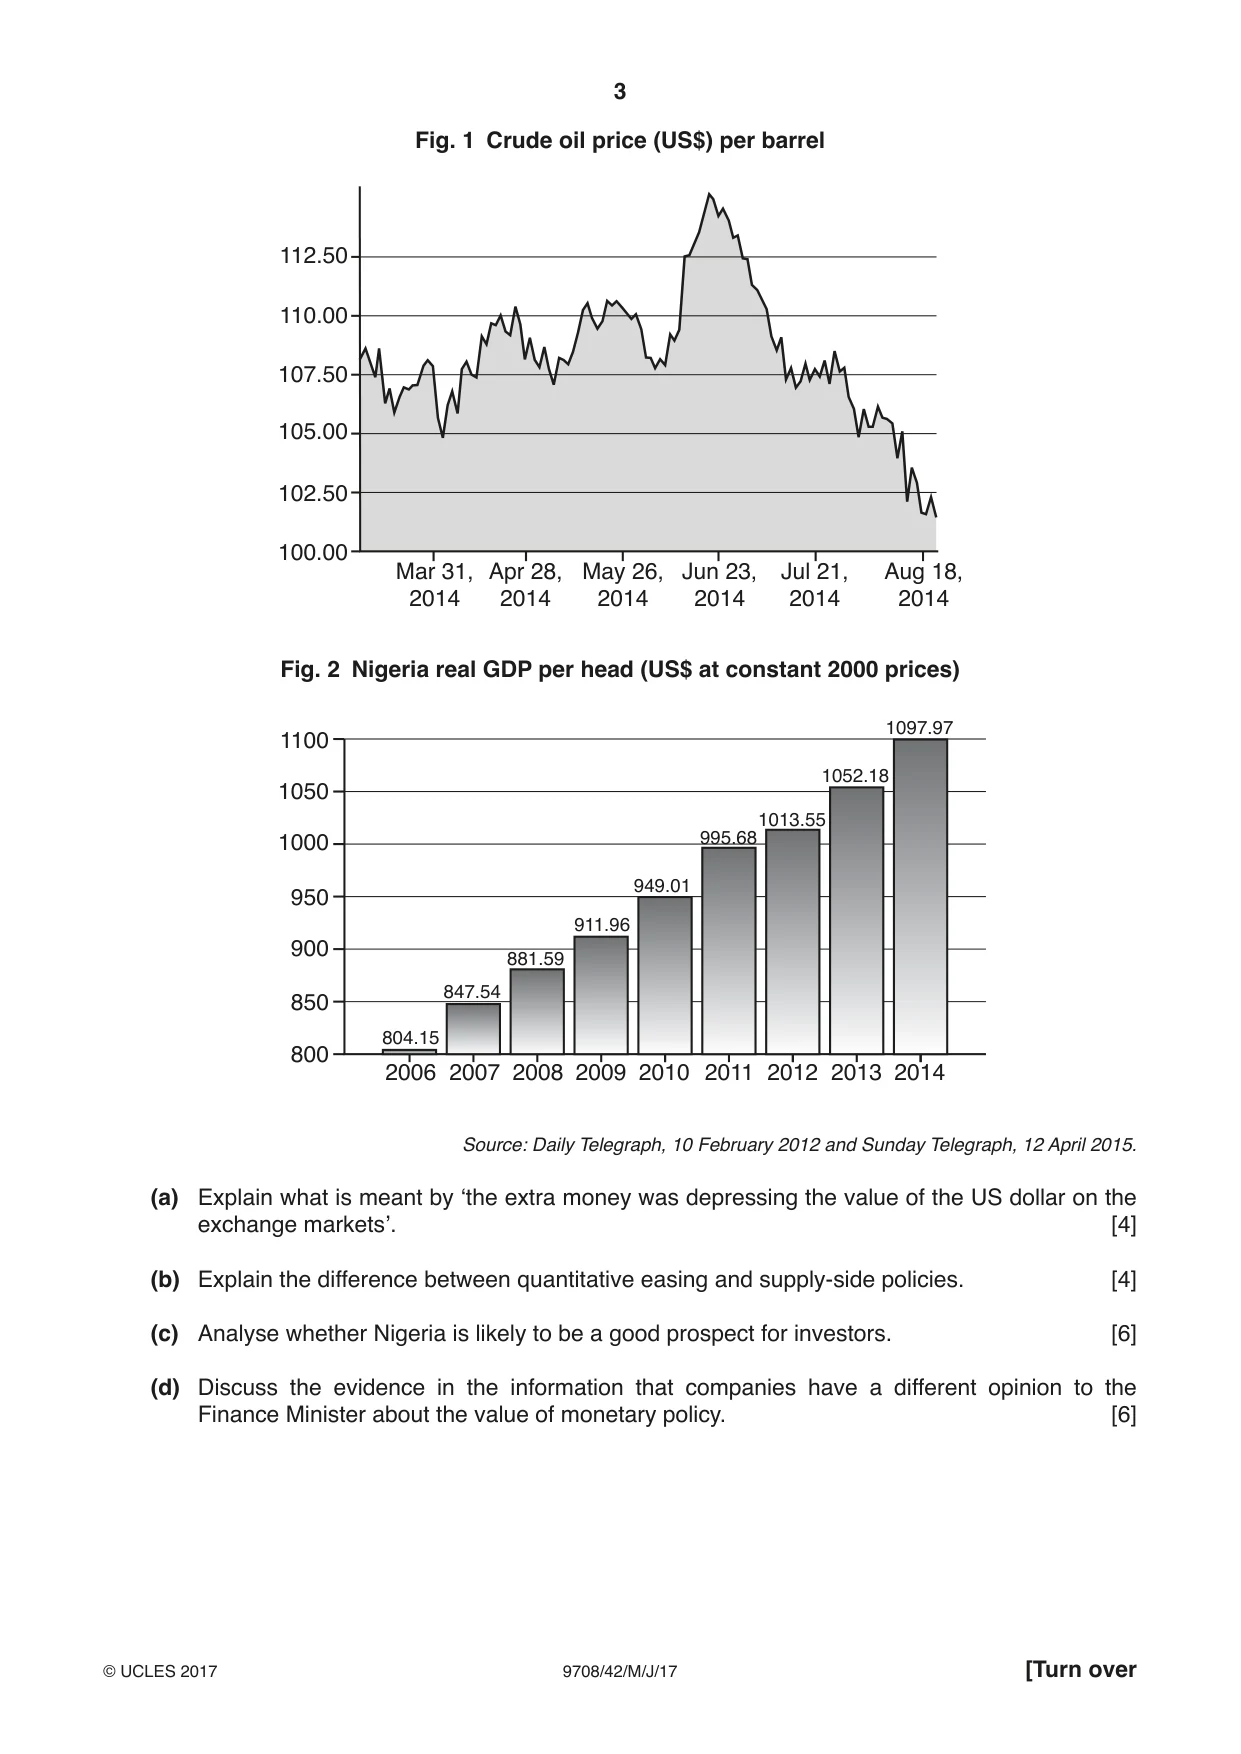
1 Monetary policy and economic growth Between 2009 and 2014, the central bank of the United Kingdom (UK) used policy measures of quantitative easing (QE) and very low interest rates. The Finance Minister said that monetary policy was the primary tool for encouraging investment that could lead to economic growth. Private businesses, however, said that QE by itself cannot restore confidence in the economy. It needs to be supported by a range of supply-side policies, in particular policies to help small firms access credit. Pension fund companies also did not welcome the policy and said that it penalised those who rely on their savings for income. A policy of QE was also followed by the United States (US) central bank but was criticised by other central banks and governments in the emerging markets. They argued that the extra money was depressing the value of the US dollar on the exchange markets. This may have increased US competitiveness but it did not help economic development in the rest of the world as their products became relatively more expensive. By contrast, it was suggested that the greatest threat to global economic development was the culture of risk aversion among companies. This meant that too many were concentrating on managing costs while failing to invest sufficiently. The aim seemed to be to reduce costs rather than create new revenue. When growth is slow companies often merge and consolidate, rather than make risky investments. This happened in food and beverages, construction, pharmaceuticals and the media. One way to find new opportunities and encourage growth would be to look to emerging markets. They account for more than half of the global economy. However, in 2014 emerging markets were suffering large capital outflows, partly caused by the stronger US dollar and partly because of demographic factors. Population structure is vital to a nation’s prosperity. A young workforce and a small proportion of retired people help the economy to grow. One country that offers great potential is Nigeria. About 43% of its population is under the age of 15, and only 3% are aged over 65. Demographically it looks good. The largest generator of GDP in Nigeria is the oil industry. Fig. 1 shows the changes in the price of crude oil between March and August 2014 and Fig. 2 shows changes in Nigeria’s real GDP per head between 2006–2014. Fig. 1 Crude oil price (US$) per barrel 112.50 110.00 107.50 105.00 102.50 100.00 Mar 31, Apr 28, May 26, Jun 23, Jul 21, Aug 18, 2014 2014 2014 2014 2014 2014 Fig. 2 Nigeria real GDP per head (US$ at constant 2000 prices) 1097.97 1100 1052.18 1050 1013.55 1000 995.68 949.01 950 911.96 900 881.59 847.54 850 804.15 800 2006 2007 2008 2009 2010 2011 2012 2013 2014 Source: Daily Telegraph, 10 February 2012 and Sunday Telegraph, 12 April 2015. (a) Explain what is meant by ‘the extra money was depressing the value of the US dollar on the exchange markets’. [4] (b) Explain the difference between quantitative easing and supply-side policies. [4] (c) Analyse whether Nigeria is likely to be a good prospect for investors. [6] (d) Discuss the evidence in the information that companies have a different opinion to the Finance Minister about the value of monetary policy. [6]
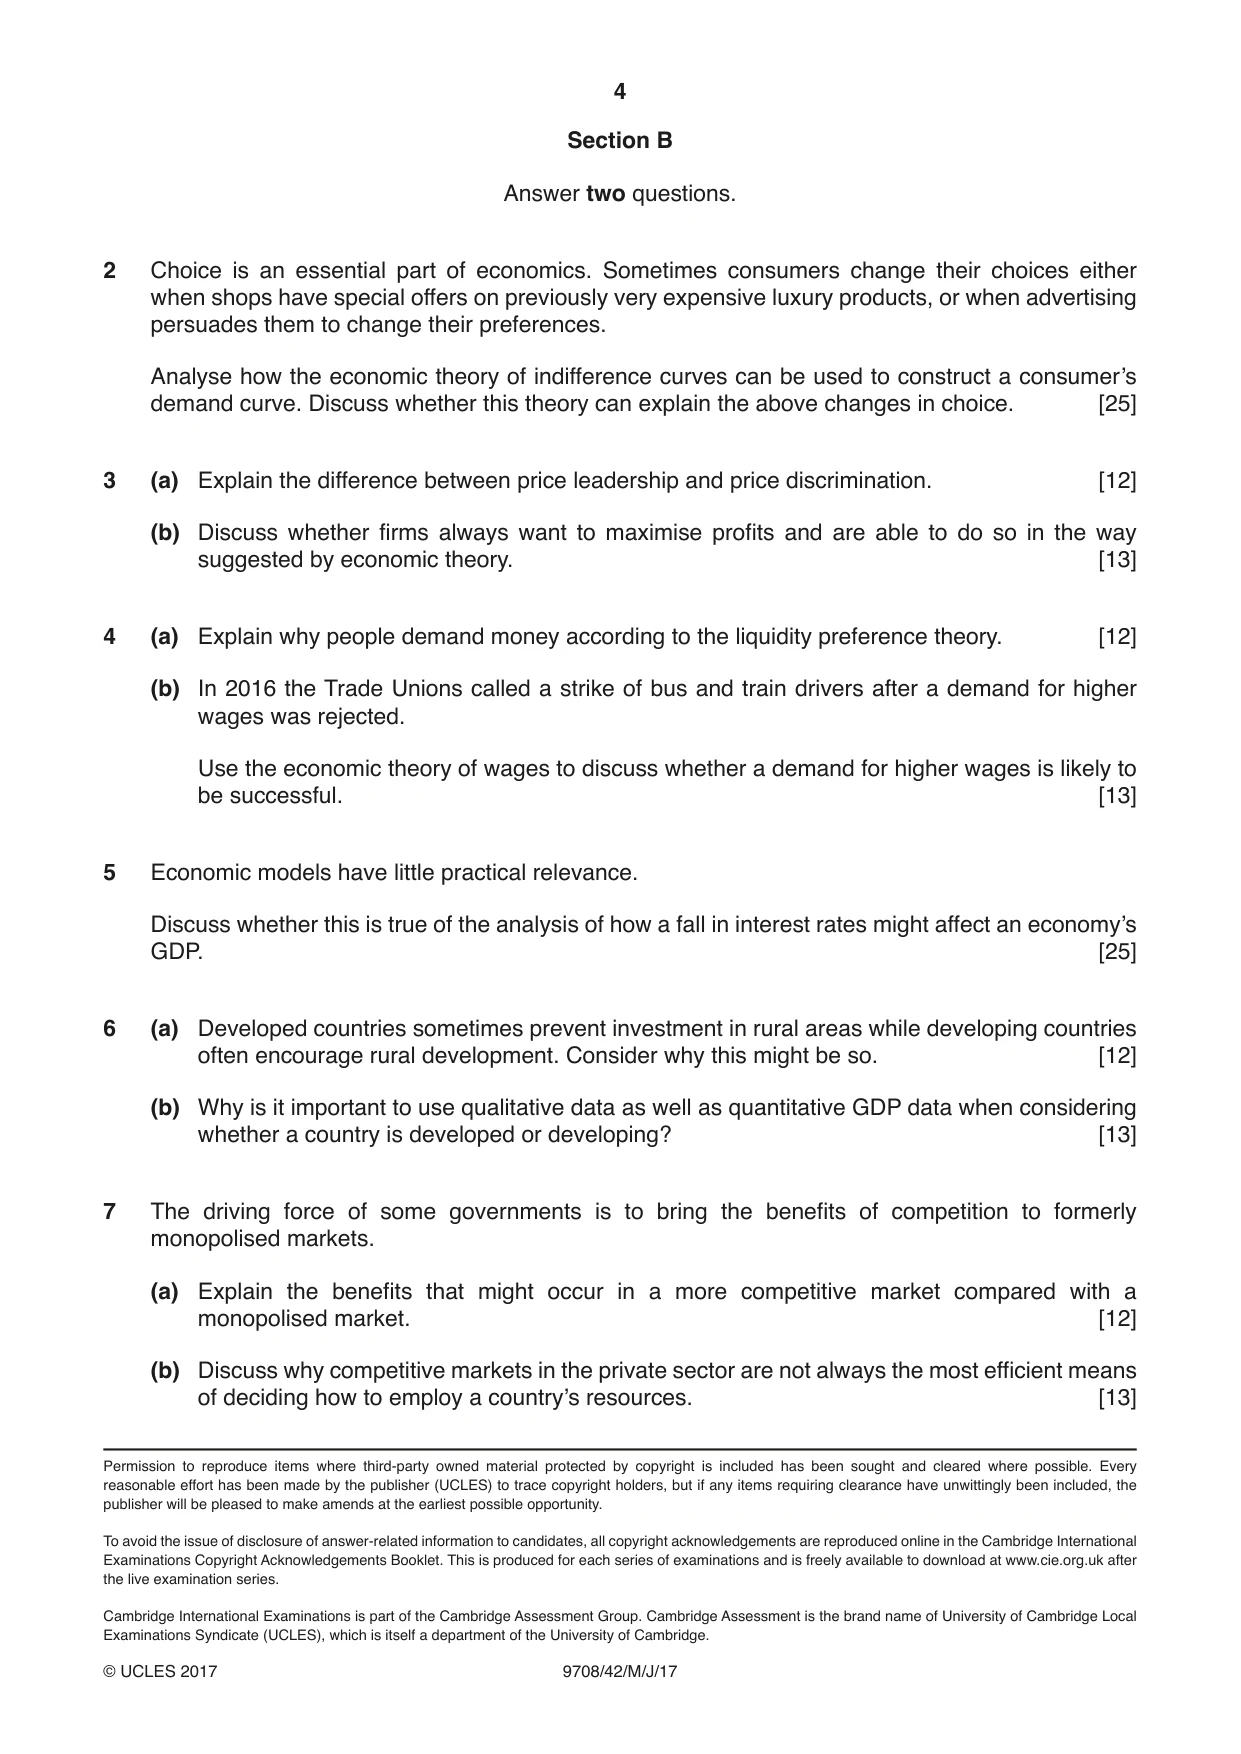
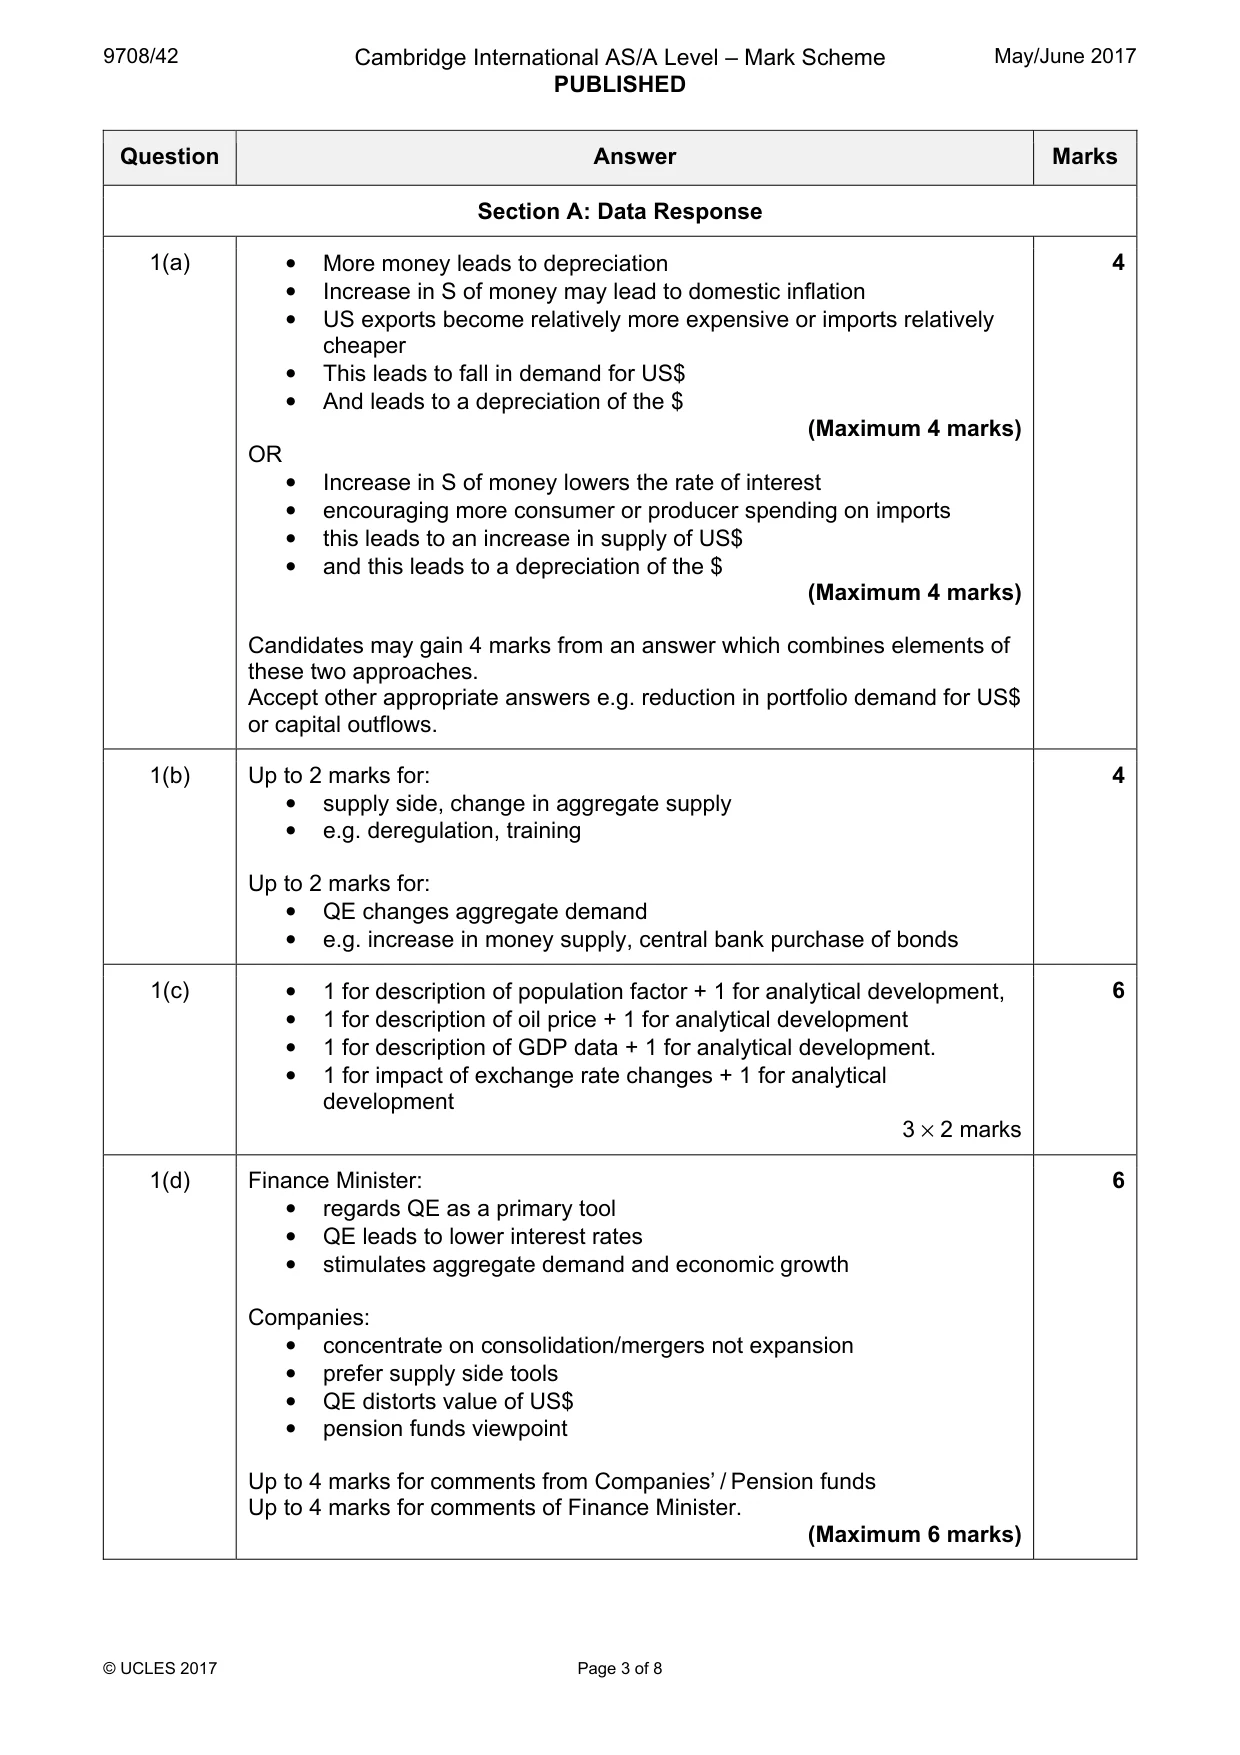
Mark scheme: Question Answer Marks Section A: Data Response 1(a) • More money leads to depreciation 4 • Increase in S of money may lead to domestic inflation • US exports become relatively more expensive or imports relatively cheaper • This leads to fall in demand for US$ • And leads to a depreciation of the $ (Maximum 4 marks) OR • Increase in S of money lowers the rate of interest • encouraging more consumer or producer spending on imports • this leads to an increase in supply of US$ • and this leads to a depreciation of the $ (Maximum 4 marks) Candidates may gain 4 marks from an answer which combines elements of these two approaches. Accept other appropriate answers e.g. reduction in portfolio demand for US$ or capital outflows. 1(b) Up to 2 marks for: 4 • supply side, change in aggregate supply • e.g. deregulation, training Up to 2 marks for: • QE changes aggregate demand • e.g. increase in money supply, central bank purchase of bonds 1(c) • 1 for description of population factor + 1 for analytical development, 6 • 1 for description of oil price + 1 for analytical development • 1 for description of GDP data + 1 for analytical development. • 1 for impact of exchange rate changes + 1 for analytical development 3 × 2 marks 1(d) Finance Minister: 6 • regards QE as a primary tool • QE leads to lower interest rates • stimulates aggregate demand and economic growth Companies: • concentrate on consolidation/mergers not expansion • prefer supply side tools • QE distorts value of US$ • pension funds viewpoint Up to 4 marks for comments from Companies’ / Pension funds Up to 4 marks for comments of Finance Minister. (Maximum 6 marks)
More questions on Characteristics of countries at different levels of development
Q2 · Choice is an essential part of economics
2 Choice is an essential part of economics. Sometimes consumers change their choices either when shops have special offers on previously very expensive luxury products, or when advertising persuades them to change their preferences. Analyse how the economic theory of indifference curves can be used to construct a consumer’s demand curve. Discuss whether this theory can explain the above changes in choice. [25]
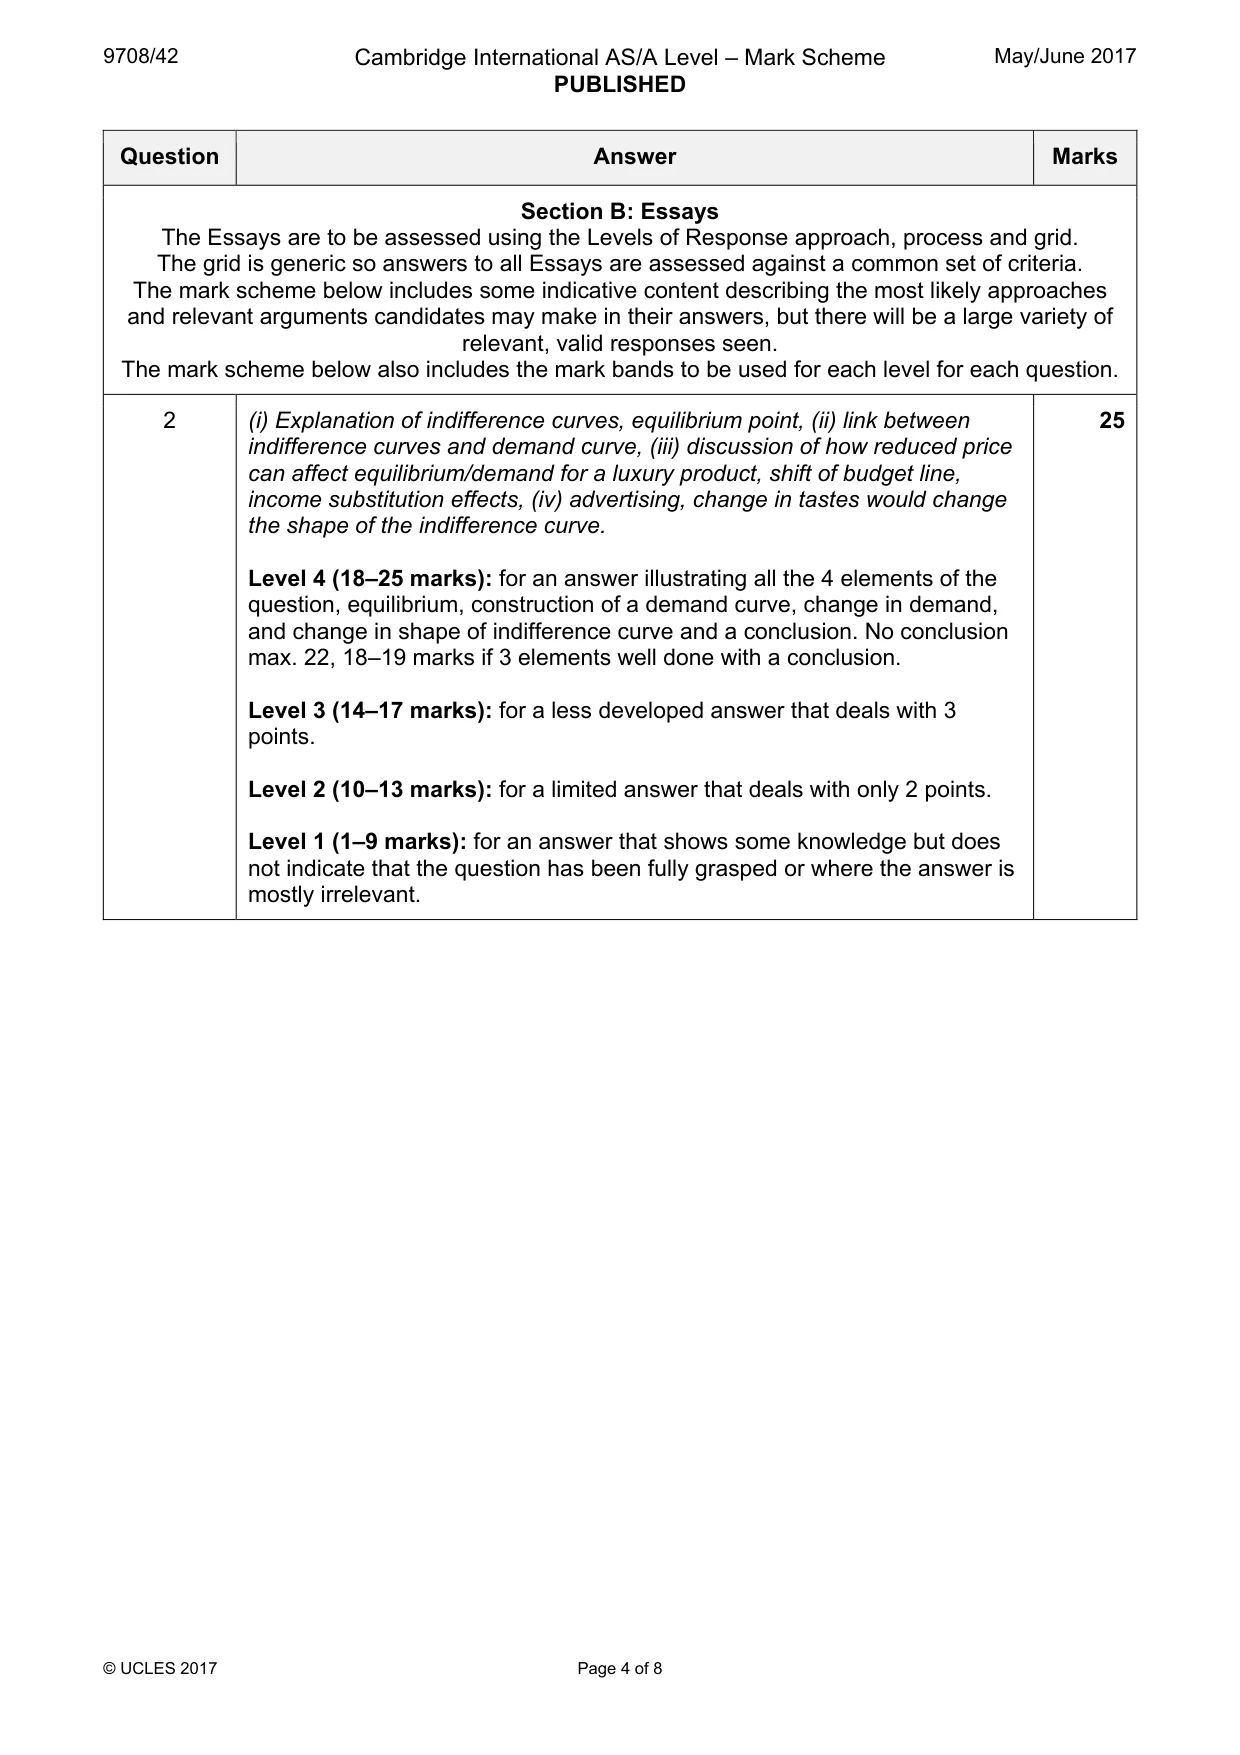
Mark scheme: 2 (i) Explanation of indifference curves, equilibrium point, (ii) link between 25 indifference curves and demand curve, (iii) discussion of how reduced price can affect equilibrium/demand for a luxury product, shift of budget line, income substitution effects, (iv) advertising, change in tastes would change the shape of the indifference curve. Level 4 (18–25 marks): for an answer illustrating all the 4 elements of the question, equilibrium, construction of a demand curve, change in demand, and change in shape of indifference curve and a conclusion. No conclusion max. 22, 18–19 marks if 3 elements well done with a conclusion. Level 3 (14–17 marks): for a less developed answer that deals with 3 points. Level 2 (10–13 marks): for a limited answer that deals with only 2 points. Level 1 (1–9 marks): for an answer that shows some knowledge but does not indicate that the question has been fully grasped or where the answer is mostly irrelevant.
Q3 · Explain the difference between price leadership and price discrimination
3 (a) Explain the difference between price leadership and price discrimination. [12] (b) Discuss whether firms always want to maximise profits and are able to do so in the way suggested by economic theory. [13]
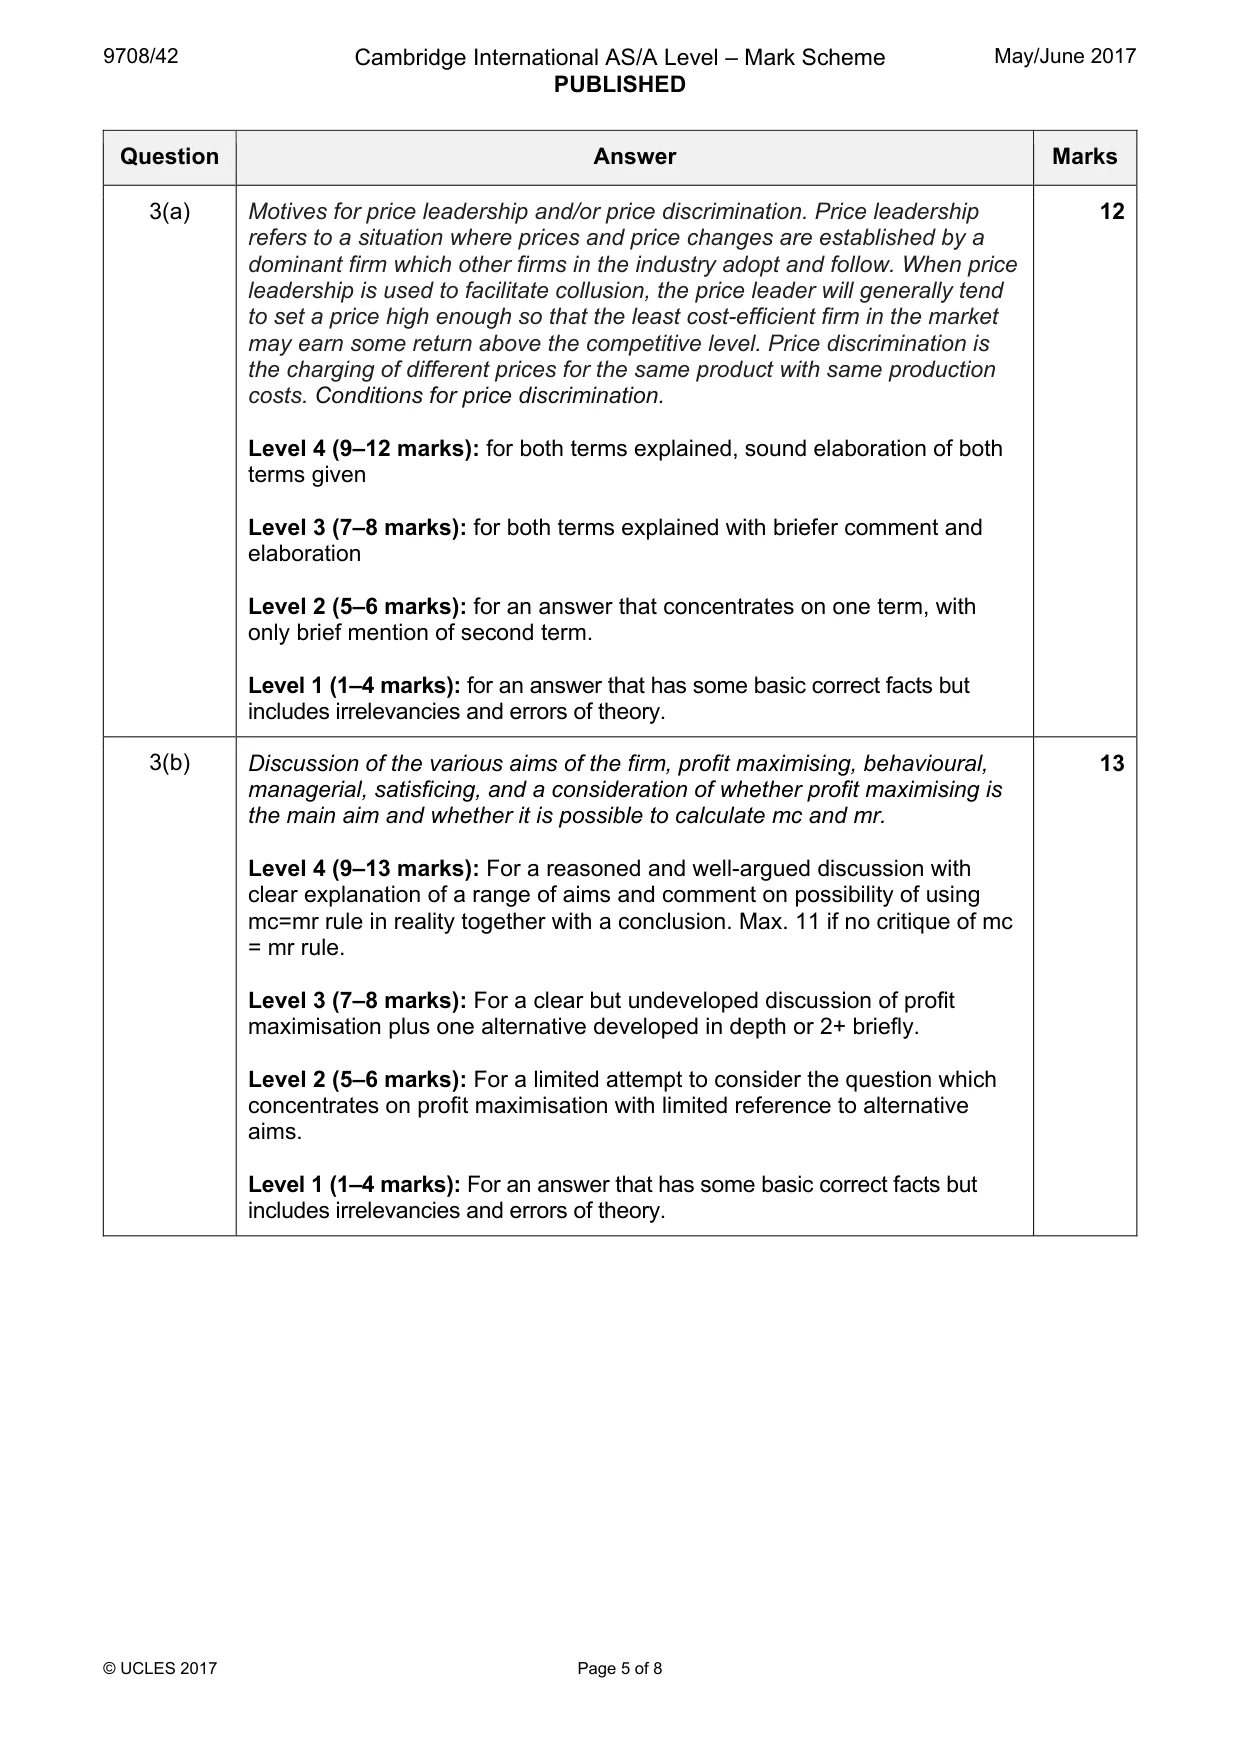
Mark scheme: 3(a) Motives for price leadership and/or price discrimination. Price leadership 12 refers to a situation where prices and price changes are established by a dominant firm which other firms in the industry adopt and follow. When price leadership is used to facilitate collusion, the price leader will generally tend to set a price high enough so that the least cost-efficient firm in the market may earn some return above the competitive level. Price discrimination is the charging of different prices for the same product with same production costs. Conditions for price discrimination. Level 4 (9–12 marks): for both terms explained, sound elaboration of both terms given Level 3 (7–8 marks): for both terms explained with briefer comment and elaboration Level 2 (5–6 marks): for an answer that concentrates on one term, with only brief mention of second term. Level 1 (1–4 marks): for an answer that has some basic correct facts but includes irrelevancies and errors of theory. 3(b) Discussion of the various aims of the firm, profit maximising, behavioural, 13 managerial, satisficing, and a consideration of whether profit maximising is the main aim and whether it is possible to calculate mc and mr. Level 4 (9–13 marks): For a reasoned and well-argued discussion with clear explanation of a range of aims and comment on possibility of using mc=mr rule in reality together with a conclusion. Max. 11 if no critique of mc = mr rule. Level 3 (7–8 marks): For a clear but undeveloped discussion of profit maximisation plus one alternative developed in depth or 2+ briefly. Level 2 (5–6 marks): For a limited attempt to consider the question which concentrates on profit maximisation with limited reference to alternative aims. Level 1 (1–4 marks): For an answer that has some basic correct facts but includes irrelevancies and errors of theory.
More questions on Differing objectives and policies of firms
Q4 · Explain why people demand money according to the liquidity preference theory
4 (a) Explain why people demand money according to the liquidity preference theory. [12] (b) In 2016 the Trade Unions called a strike of bus and train drivers after a demand for higher wages was rejected. Use the economic theory of wages to discuss whether a demand for higher wages is likely to be successful. [13]
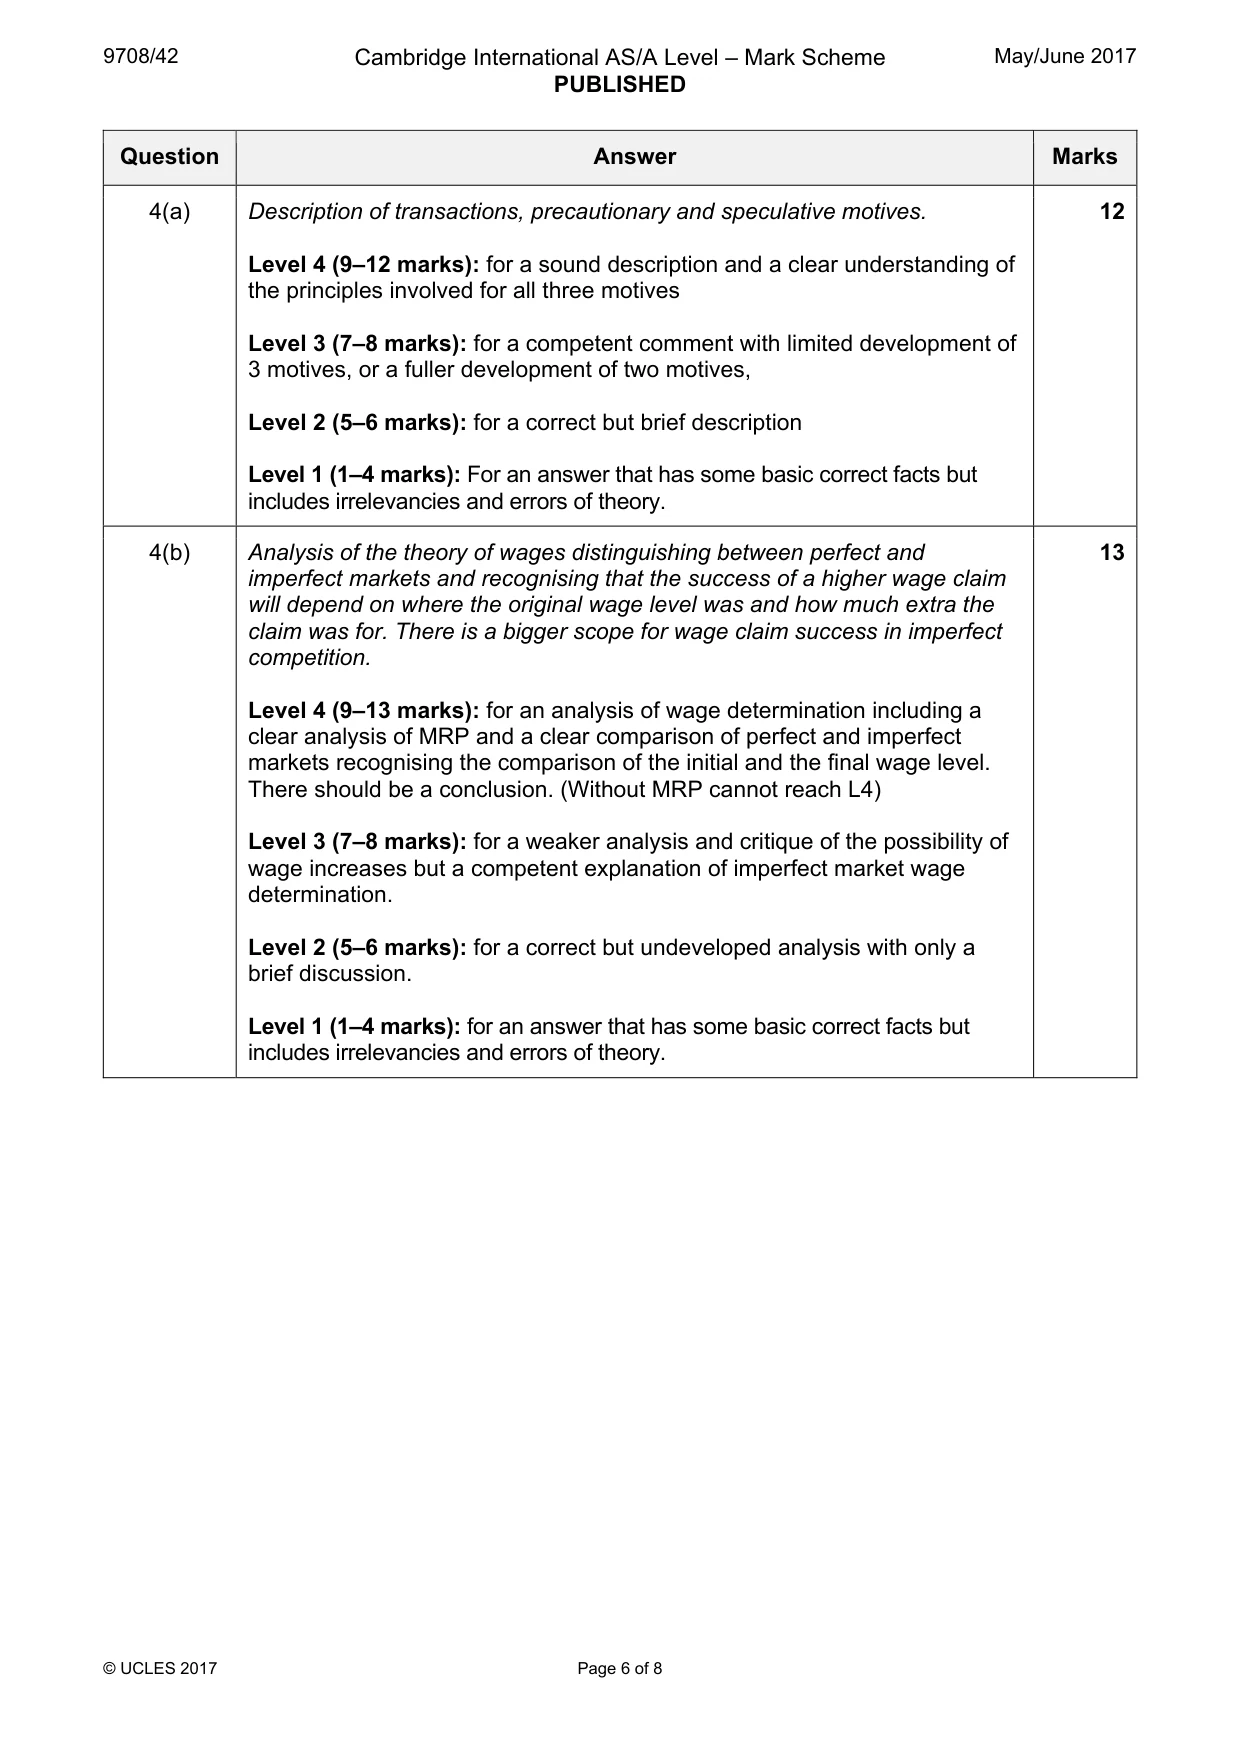
Mark scheme: 4(a) Description of transactions, precautionary and speculative motives. 12 Level 4 (9–12 marks): for a sound description and a clear understanding of the principles involved for all three motives Level 3 (7–8 marks): for a competent comment with limited development of 3 motives, or a fuller development of two motives, Level 2 (5–6 marks): for a correct but brief description Level 1 (1–4 marks): For an answer that has some basic correct facts but includes irrelevancies and errors of theory. 4(b) Analysis of the theory of wages distinguishing between perfect and 13 imperfect markets and recognising that the success of a higher wage claim will depend on where the original wage level was and how much extra the claim was for. There is a bigger scope for wage claim success in imperfect competition. Level 4 (9–13 marks): for an analysis of wage determination including a clear analysis of MRP and a clear comparison of perfect and imperfect markets recognising the comparison of the initial and the final wage level. There should be a conclusion. (Without MRP cannot reach L4) Level 3 (7–8 marks): for a weaker analysis and critique of the possibility of wage increases but a competent explanation of imperfect market wage determination. Level 2 (5–6 marks): for a correct but undeveloped analysis with only a brief discussion. Level 1 (1–4 marks): for an answer that has some basic correct facts but includes irrelevancies and errors of theory.
More questions on Labour market forces and government intervention
Q5 · Economic models have little practical relevance
5 Economic models have little practical relevance. Discuss whether this is true of the analysis of how a fall in interest rates might affect an economy’s GDP. [25]
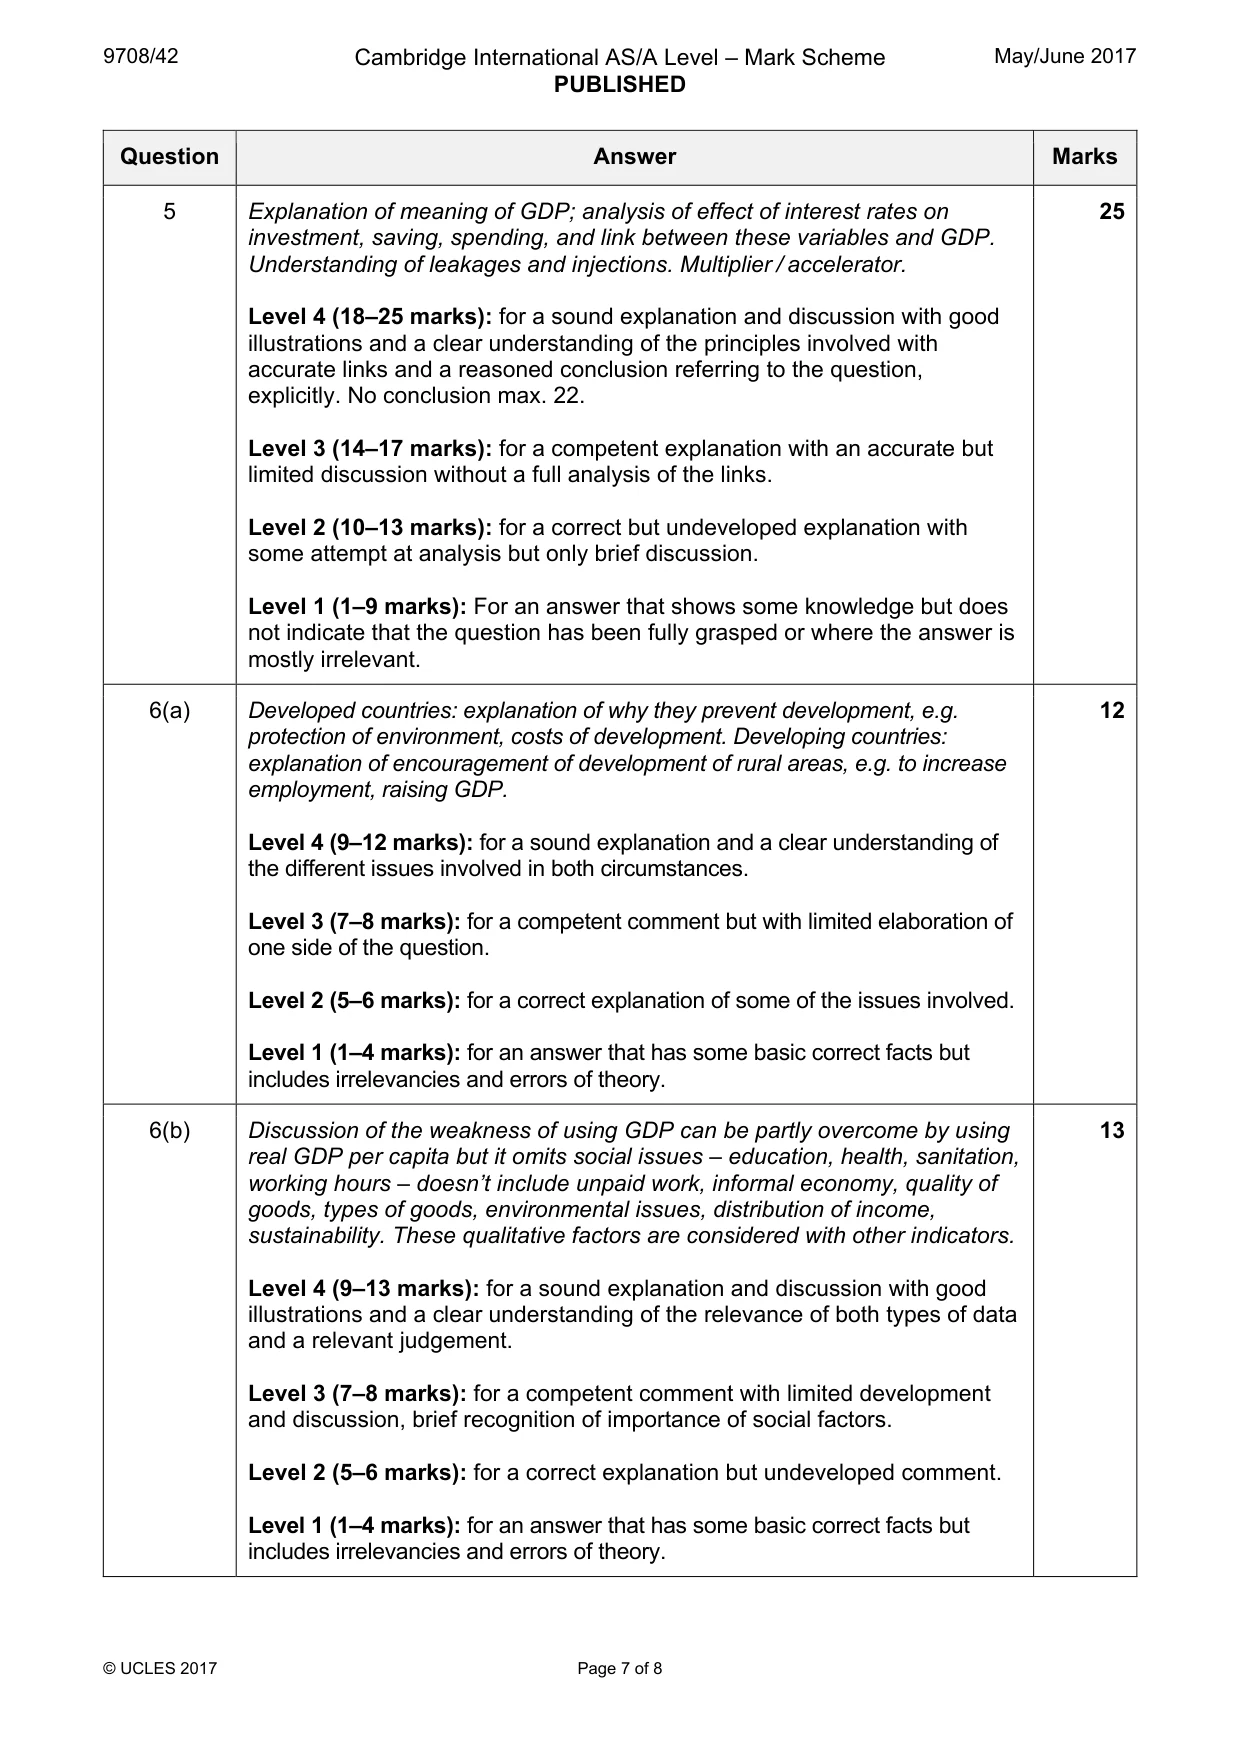
Mark scheme: 5 Explanation of meaning of GDP; analysis of effect of interest rates on 25 investment, saving, spending, and link between these variables and GDP. Understanding of leakages and injections. Multiplier / accelerator. Level 4 (18–25 marks): for a sound explanation and discussion with good illustrations and a clear understanding of the principles involved with accurate links and a reasoned conclusion referring to the question, explicitly. No conclusion max. 22. Level 3 (14–17 marks): for a competent explanation with an accurate but limited discussion without a full analysis of the links. Level 2 (10–13 marks): for a correct but undeveloped explanation with some attempt at analysis but only brief discussion. Level 1 (1–9 marks): For an answer that shows some knowledge but does not indicate that the question has been fully grasped or where the answer is mostly irrelevant.
Q6 · Developed countries sometimes prevent investment in rural areas while developing…
6 (a) Developed countries sometimes prevent investment in rural areas while developing countries often encourage rural development. Consider why this might be so. [12] (b) Why is it important to use qualitative data as well as quantitative GDP data when considering whether a country is developed or developing? [13]
Mark scheme: 6(a) Developed countries: explanation of why they prevent development, e.g. 12 protection of environment, costs of development. Developing countries: explanation of encouragement of development of rural areas, e.g. to increase employment, raising GDP. Level 4 (9–12 marks): for a sound explanation and a clear understanding of the different issues involved in both circumstances. Level 3 (7–8 marks): for a competent comment but with limited elaboration of one side of the question. Level 2 (5–6 marks): for a correct explanation of some of the issues involved. Level 1 (1–4 marks): for an answer that has some basic correct facts but includes irrelevancies and errors of theory. 6(b) Discussion of the weakness of using GDP can be partly overcome by using 13 real GDP per capita but it omits social issues – education, health, sanitation, working hours – doesn’t include unpaid work, informal economy, quality of goods, types of goods, environmental issues, distribution of income, sustainability. These qualitative factors are considered with other indicators. Level 4 (9–13 marks): for a sound explanation and discussion with good illustrations and a clear understanding of the relevance of both types of data and a relevant judgement. Level 3 (7–8 marks): for a competent comment with limited development and discussion, brief recognition of importance of social factors. Level 2 (5–6 marks): for a correct explanation but undeveloped comment. Level 1 (1–4 marks): for an answer that has some basic correct facts but includes irrelevancies and errors of theory.
More questions on Characteristics of countries at different levels of development
Q7 · The driving force of some governments is to bring the benefits of competition to formerly…
7 The driving force of some governments is to bring the benefits of competition to formerly monopolised markets. (a) Explain the benefits that might occur in a more competitive market compared with a monopolised market. [12] (b) Discuss why competitive markets in the private sector are not always the most efficient means of deciding how to employ a country’s resources. [13]
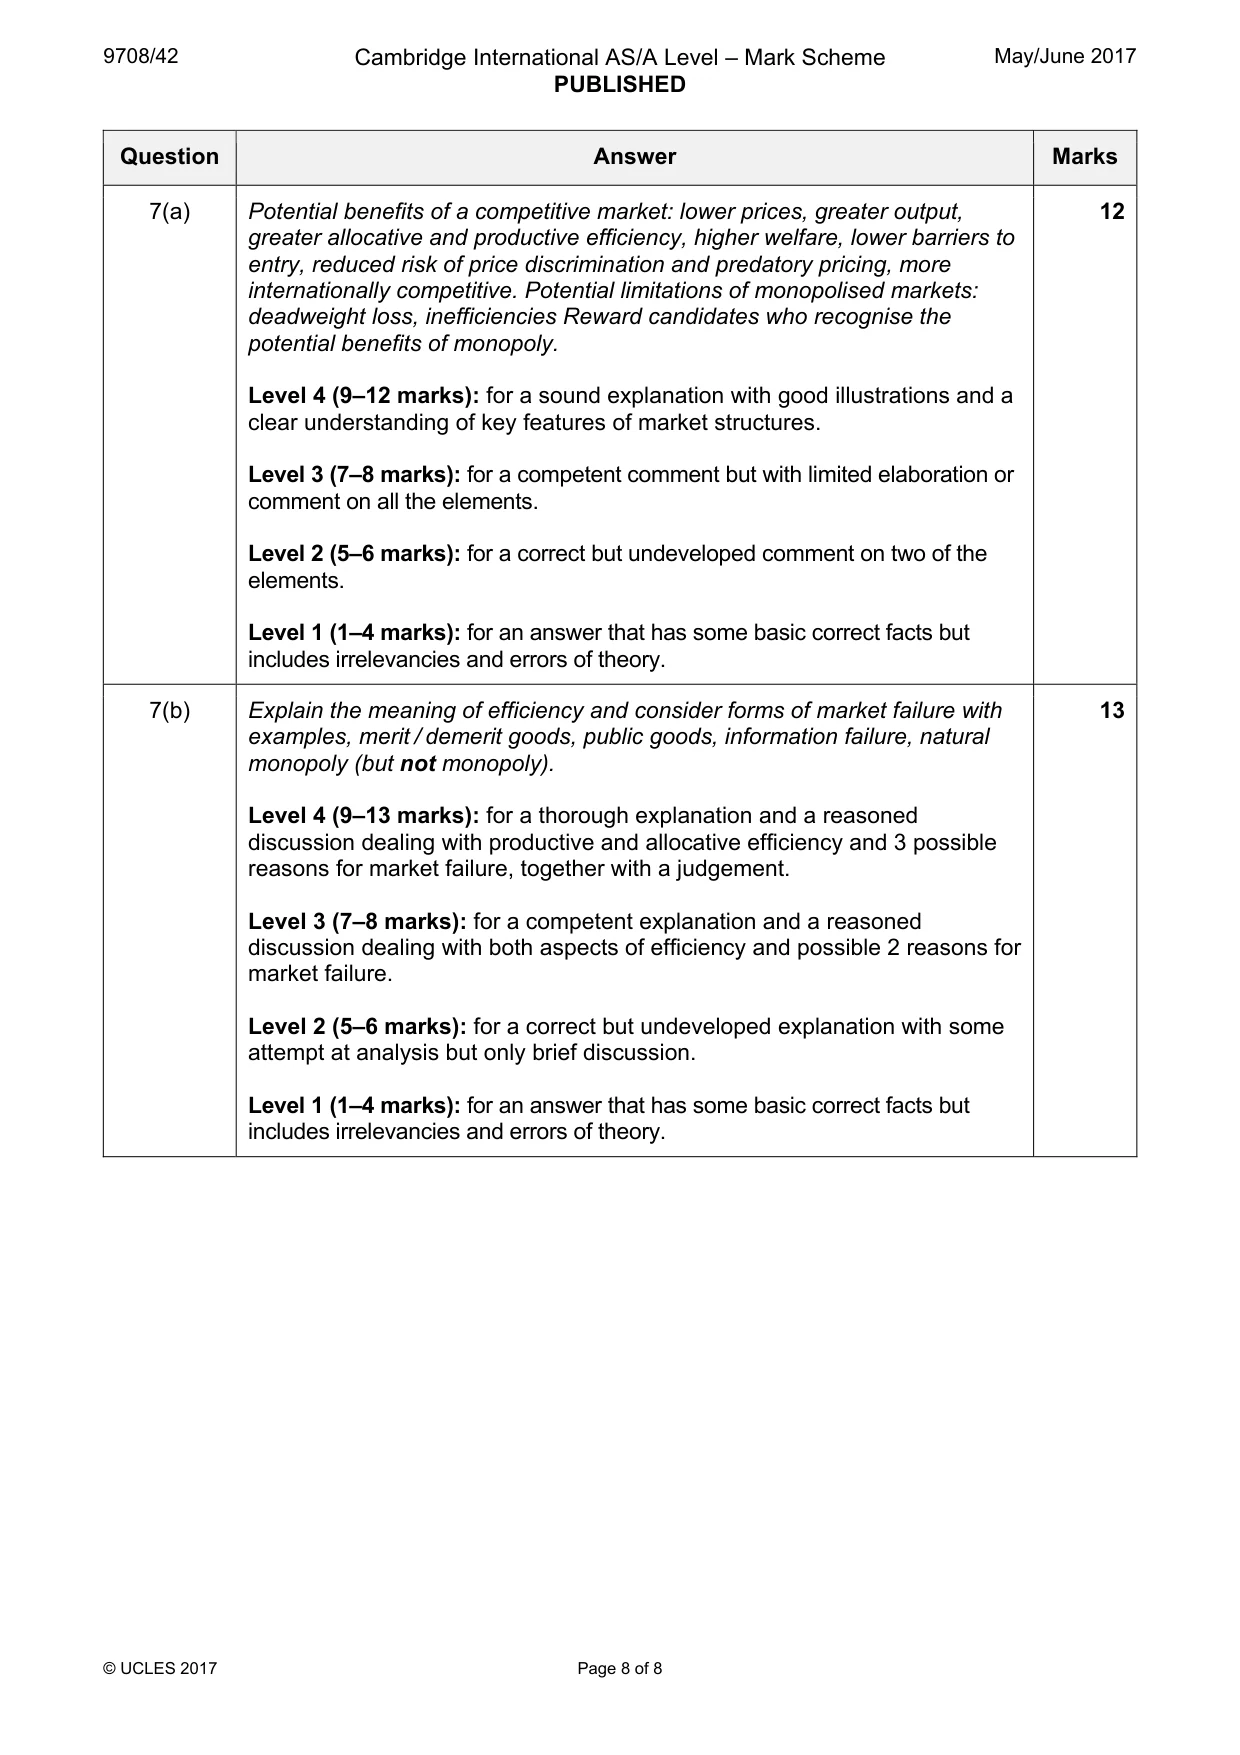
Mark scheme: 7(a) Potential benefits of a competitive market: lower prices, greater output, 12 greater allocative and productive efficiency, higher welfare, lower barriers to entry, reduced risk of price discrimination and predatory pricing, more internationally competitive. Potential limitations of monopolised markets: deadweight loss, inefficiencies Reward candidates who recognise the potential benefits of monopoly. Level 4 (9–12 marks): for a sound explanation with good illustrations and a clear understanding of key features of market structures. Level 3 (7–8 marks): for a competent comment but with limited elaboration or comment on all the elements. Level 2 (5–6 marks): for a correct but undeveloped comment on two of the elements. Level 1 (1–4 marks): for an answer that has some basic correct facts but includes irrelevancies and errors of theory. 7(b) Explain the meaning of efficiency and consider forms of market failure with 13 examples, merit / demerit goods, public goods, information failure, natural monopoly (but not monopoly). Level 4 (9–13 marks): for a thorough explanation and a reasoned discussion dealing with productive and allocative efficiency and 3 possible reasons for market failure, together with a judgement. Level 3 (7–8 marks): for a competent explanation and a reasoned discussion dealing with both aspects of efficiency and possible 2 reasons for market failure. Level 2 (5–6 marks): for a correct but undeveloped explanation with some attempt at analysis but only brief discussion. Level 1 (1–4 marks): for an answer that has some basic correct facts but includes irrelevancies and errors of theory.
What was in this paper
The subtopics covered by these 7 questions, and how many questions each got. Open one in a new tab to see every Cambridge question on it.
What you needed in this session
Cambridge’s own grade thresholds for 2017 May/June, Paper 4 · Variant 2. A higher threshold means an easier paper — the bar moves with how the cohort did.