Cambridge A Level Chemistry 9701 — 2022 May/June Paper 5 · Variant 2
9701/52/M/J/22 · 2 questions · 30 marks · ≈34 min
The question paper and its mark scheme, free to read here and free to download. This is Cambridge’s own paper, exactly as it was sat.
Question paper12 pages


Mark scheme7 pages
Answers below. Sit the paper first if you are practising.
Questions as text
Q1 · A student plans an experiment to find a value for the molar volume, Vm, of hydrogen gas…
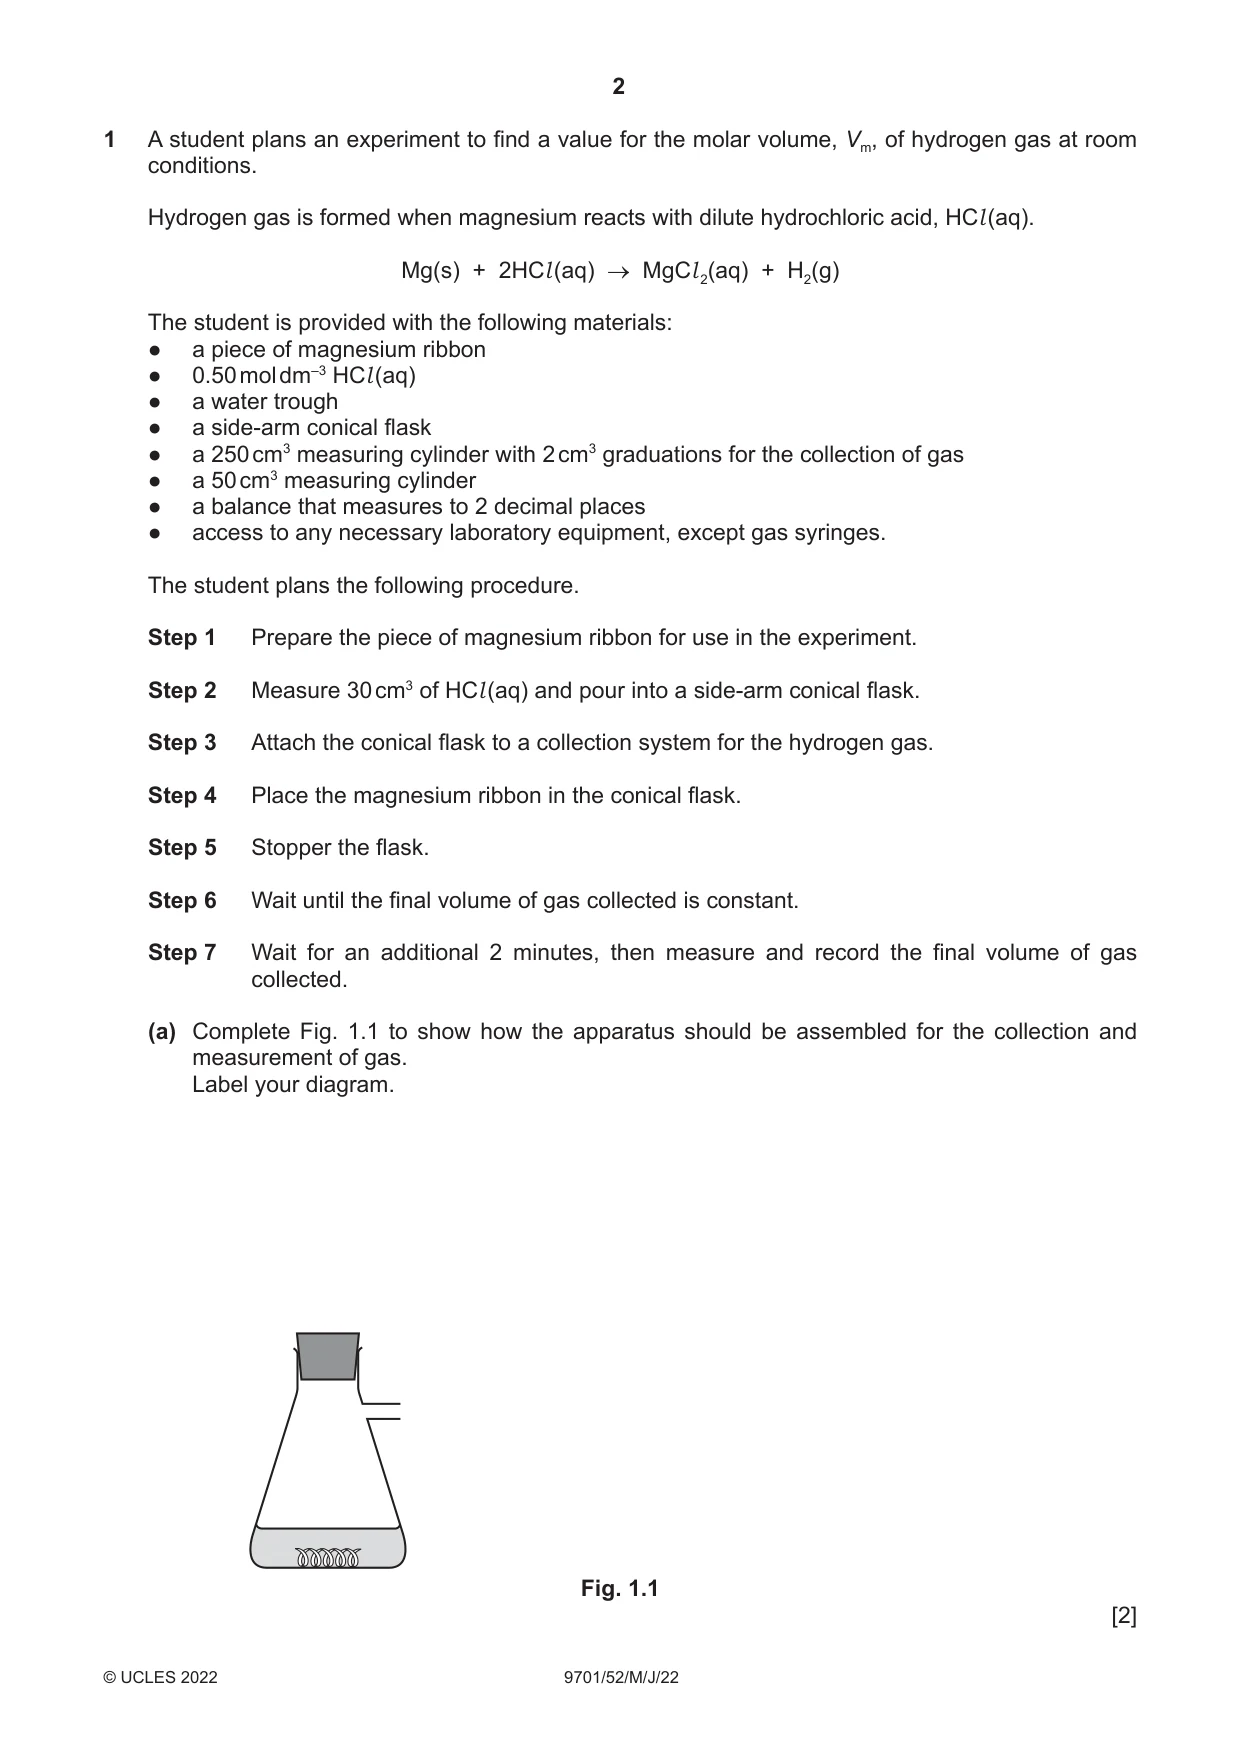
1 A student plans an experiment to find a value for the molar volume, Vm, of hydrogen gas at room conditions. Hydrogen gas is formed when magnesium reacts with dilute hydrochloric acid, HCl (aq). Mg(s) + 2HCl (aq) → MgCl 2(aq) + H2(g) The student is provided with the following materials: ● a piece of magnesium ribbon ● 0.50 mol dm–3 HCl (aq) ● a water trough ● a side-arm conical flask ● a 250 cm3 measuring cylinder with 2 cm3 graduations for the collection of gas ● a 50 cm3 measuring cylinder ● a balance that measures to 2 decimal places ● access to any necessary laboratory equipment, except gas syringes. The student plans the following procedure. Step 1 Prepare the piece of magnesium ribbon for use in the experiment. Step 2 Measure 30 cm3 of HCl (aq) and pour into a side-arm conical flask. Step 3 Attach the conical flask to a collection system for the hydrogen gas. Step 4 Place the magnesium ribbon in the conical flask. Step 5 Stopper the flask. Step 6 Wait until the final volume of gas collected is constant. Step 7 Wait for an additional 2 minutes, then measure and record the final volume of gas collected. (a) Complete Fig. 1.1 to show how the apparatus should be assembled for the collection and measurement of gas. Label your diagram. Fig. 1.1 [2] (b) The surface of the magnesium ribbon has an oxide layer. (i) State how the student should prepare the piece of magnesium ribbon before it is used in this experiment. ....................................................................................................................................... [1] (ii) State what additional information about the magnesium is required before the experiment is performed. ....................................................................................................................................... [1] (c) (i) Show by calculation that a volume of 30 cm3 of 0.50 mol dm–3 HCl (aq) is enough to react with 0.16 g of magnesium ribbon. Show your working. Mg(s) + 2HCl (aq) → MgCl 2(aq) + H2(g) [2] (ii) State why it is not necessary to use a burette to measure 30 cm3 of 0.50 mol dm–3 HCl (aq). ............................................................................................................................................. ....................................................................................................................................... [1] (d) The student waits for 2 minutes before taking a reading of the volume. Suggest why the student waits for 2 minutes before measuring the volume of gas in step 7. .................................................................................................................................................... .............................................................................................................................................. [1] (e) The student collects 146 cm3 of hydrogen gas during the experiment. (i) Calculate the percentage error in collecting the hydrogen gas. Show your working. percentage error = .............................. [1] (ii) Calculate the molar volume of hydrogen gas using the student’s results from this experiment. molar volume = .............................. cm3 [1] (f) The student’s experimental value for the molar volume of hydrogen is lower than the value
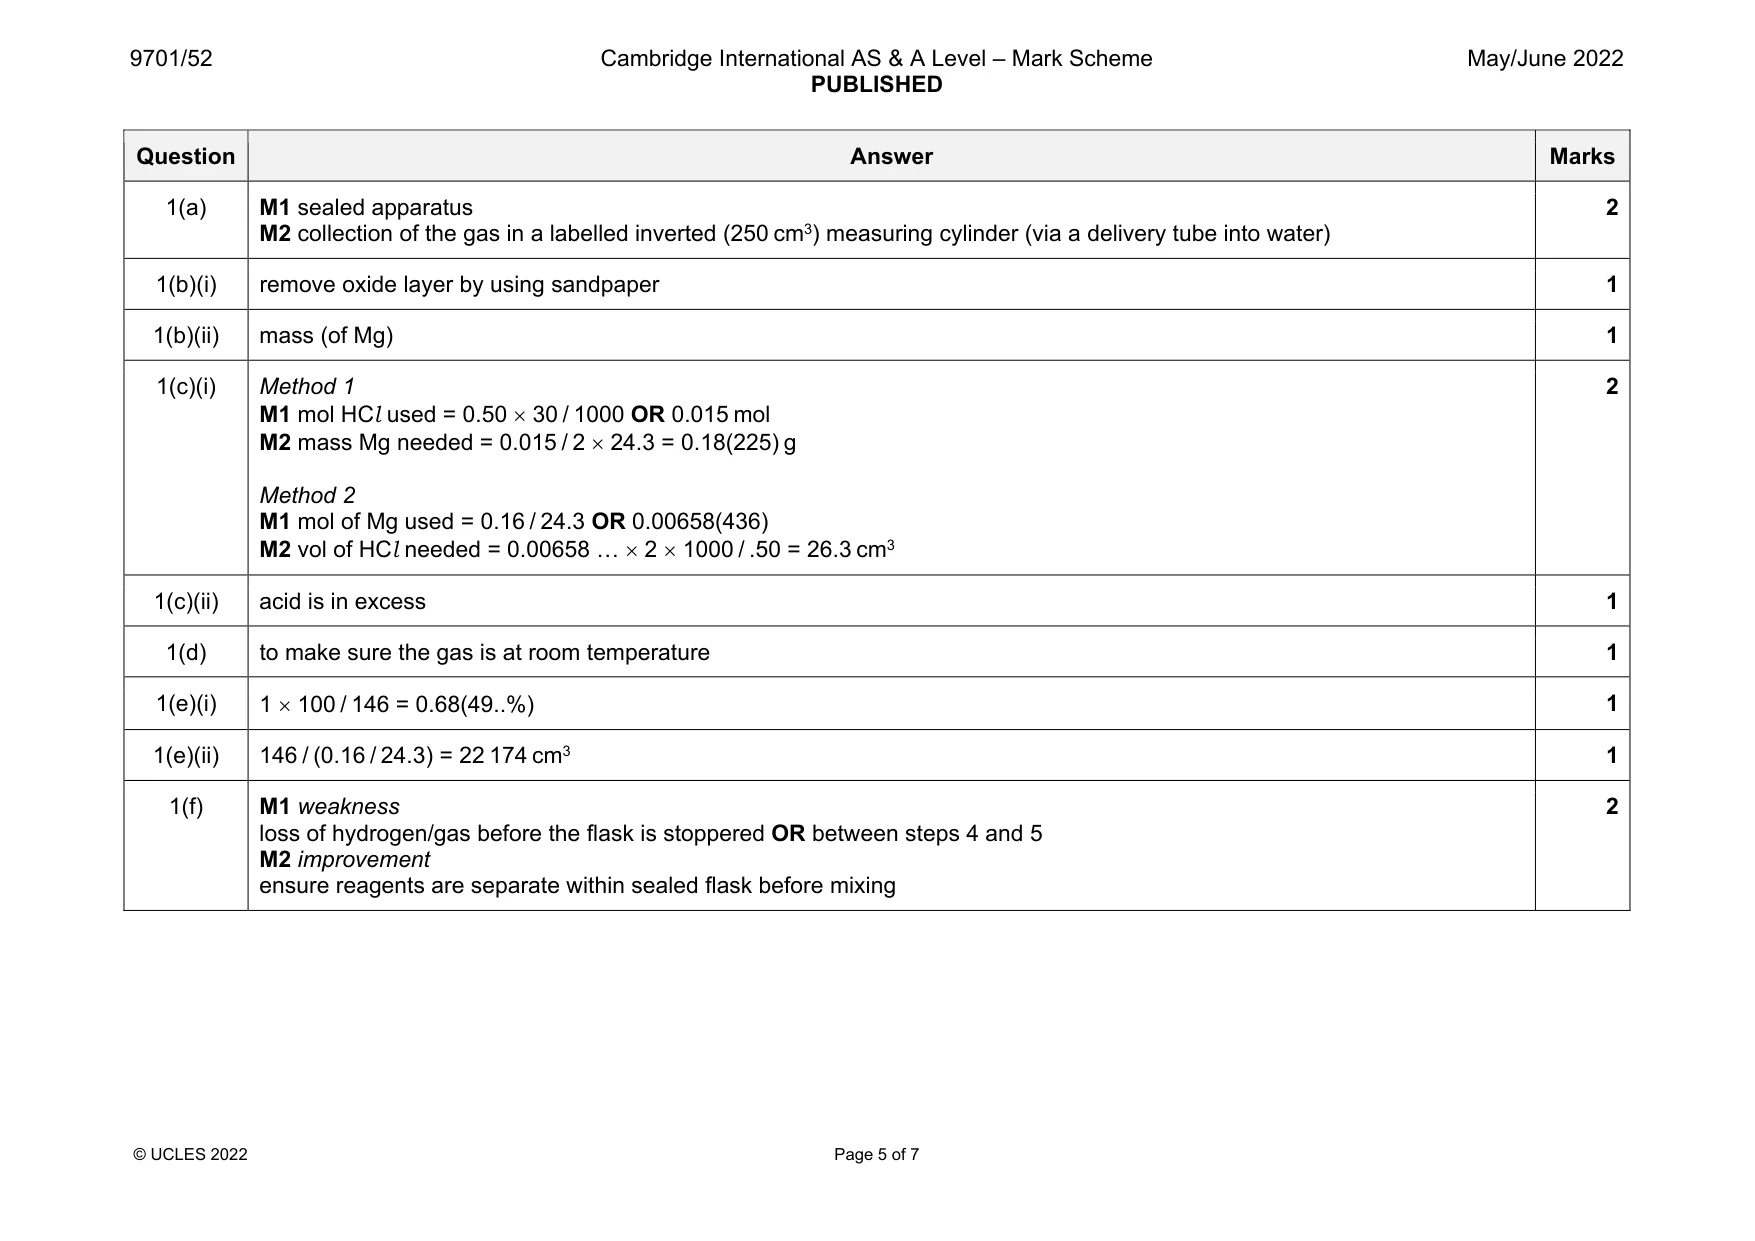
Mark scheme: 1(a) M1 sealed apparatus M2 collection of the gas in a labelled inverted (250 cm3) measuring cylinder (via a delivery tube into water) 2 1(b)(i) remove oxide layer by using sandpaper 1 1(b)(ii) mass (of Mg) 1 1(c)(i) Method 1 M1 mol HCl used = 0.50 30 / 1000 OR 0.015 mol M2 mass Mg needed = 0.015 / 2 24.3 = 0.18(225) g Method 2 M1 mol of Mg used = 0.16 / 24.3 OR 0.00658(436) M2 vol of HCl needed = 0.00658 … 2 1000 / .50 = 26.3 cm3 2 1(c)(ii) acid is in excess 1 1(d) to make sure the gas is at room temperature 1 1(e)(i) 1 100 / 146 = 0.68(49..%) 1 1(e)(ii) 146 / (0.16 / 24.3) = 22 174 cm3 1 1(f) M1 weakness loss of hydrogen/gas before the flask is stoppered OR between steps 4 and 5 M2 improvement ensure reagents are separate within sealed flask before mixing 2
More questions on Reacting masses and volumes (of solutions and gases)
Q2 · In a neutral solution, aqueous potassium iodide acts as a catalyst for the decomposition…
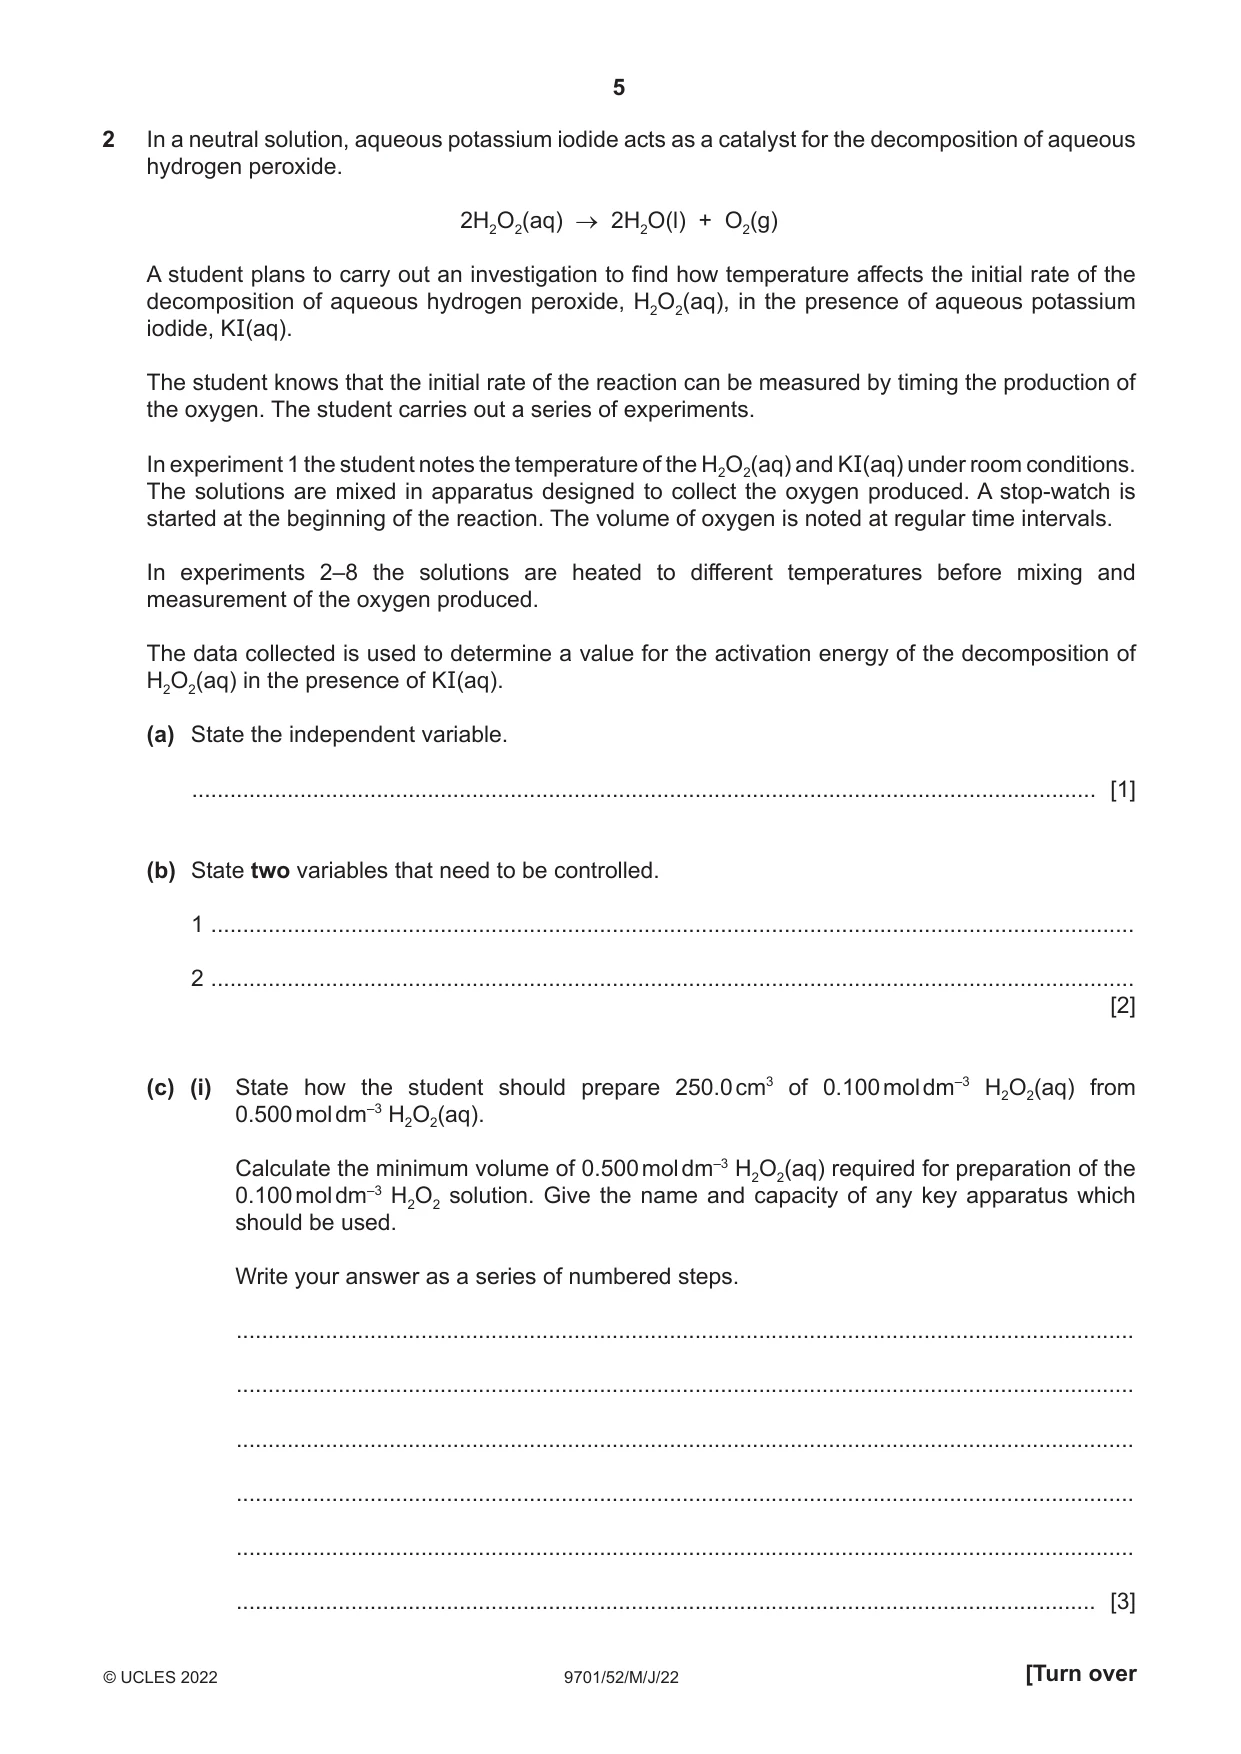
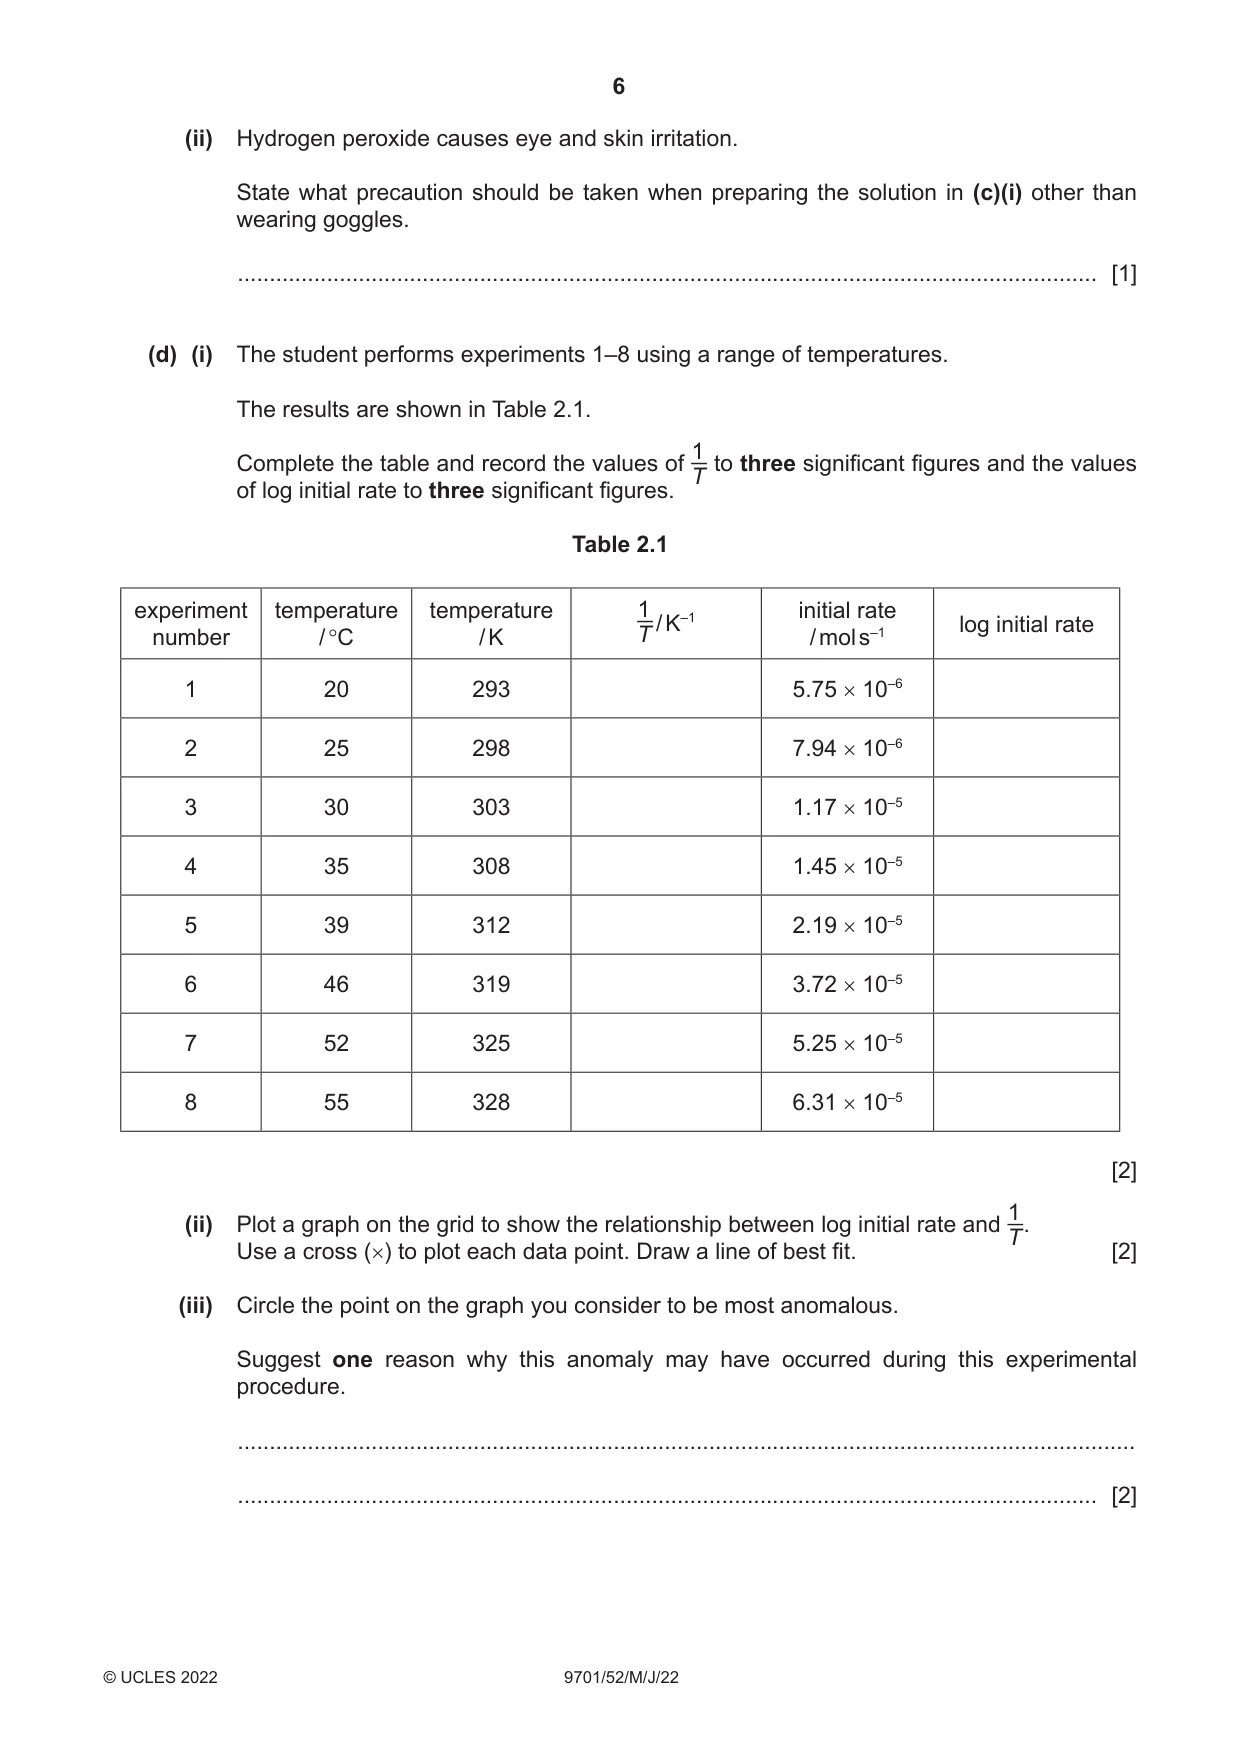
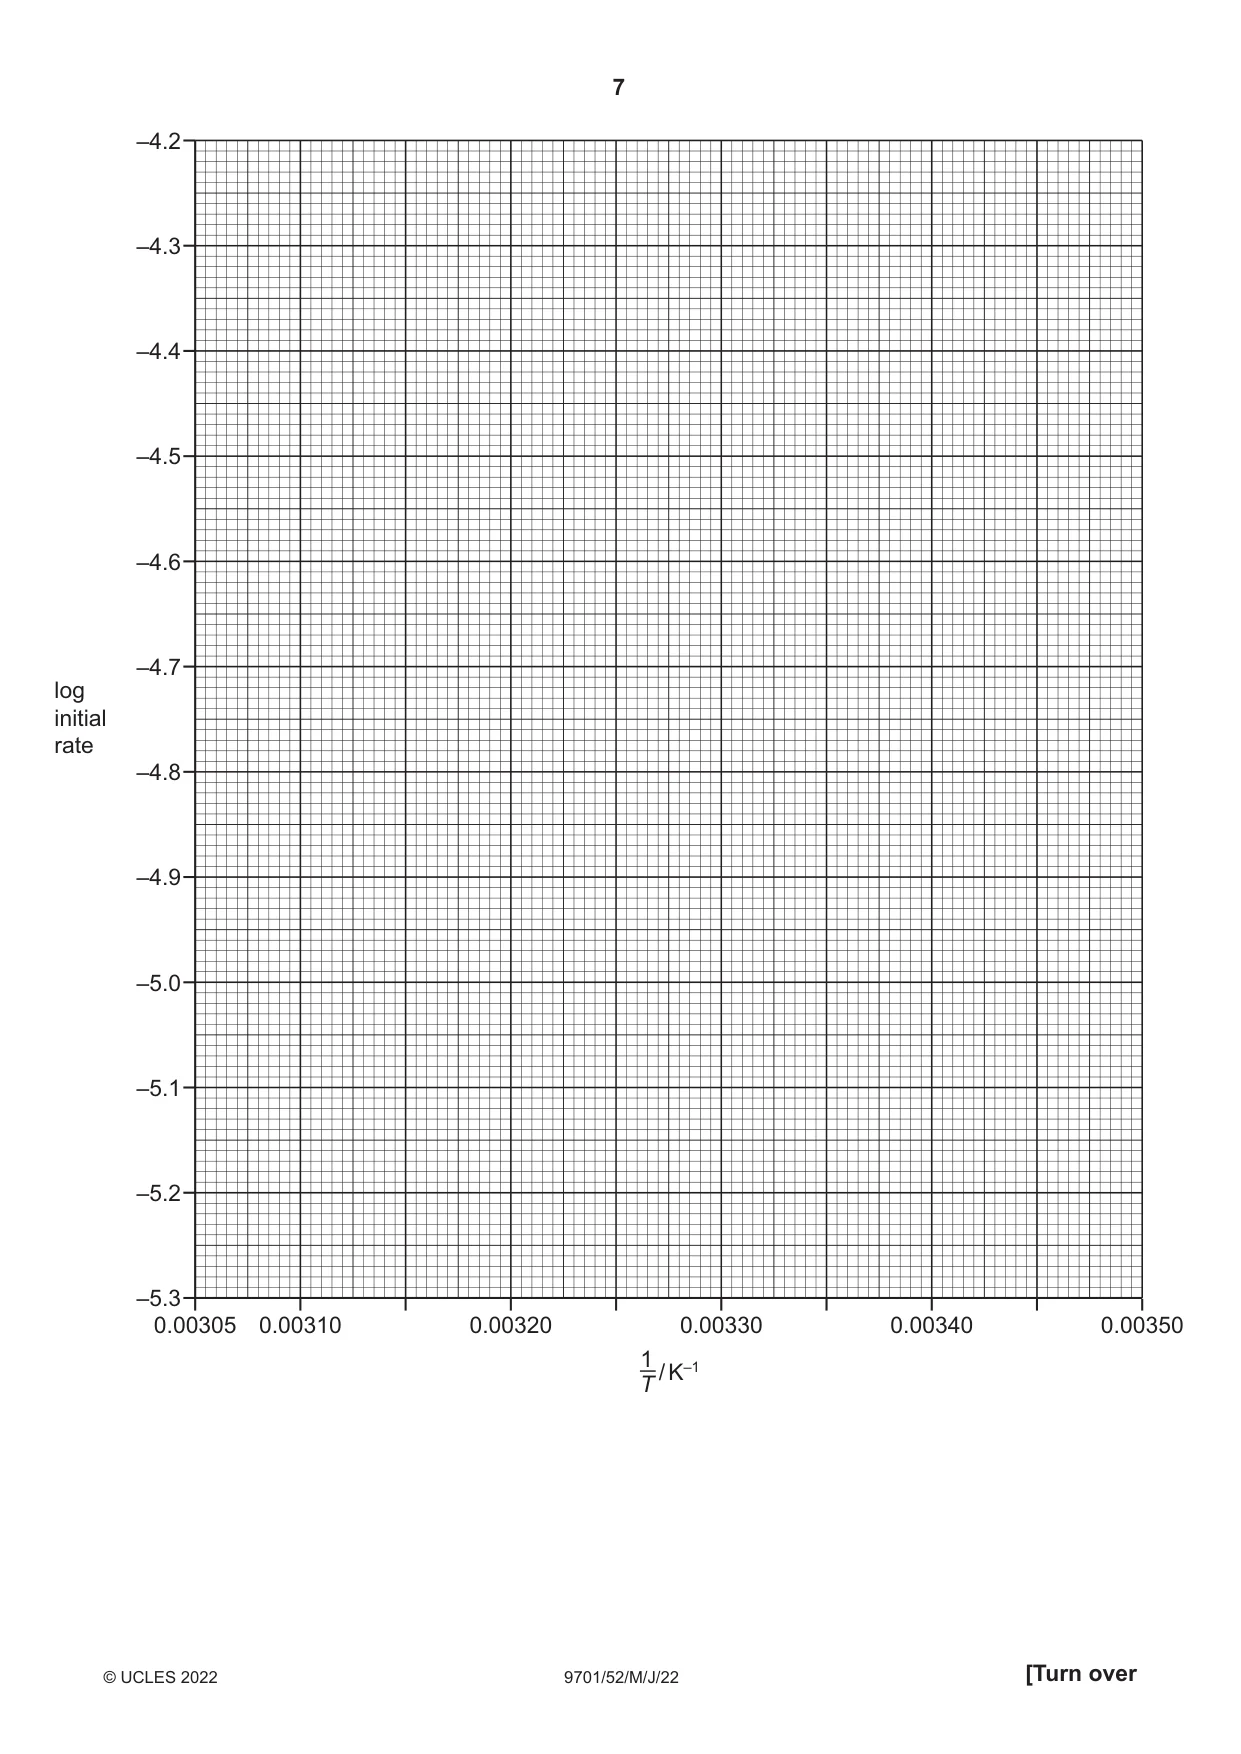
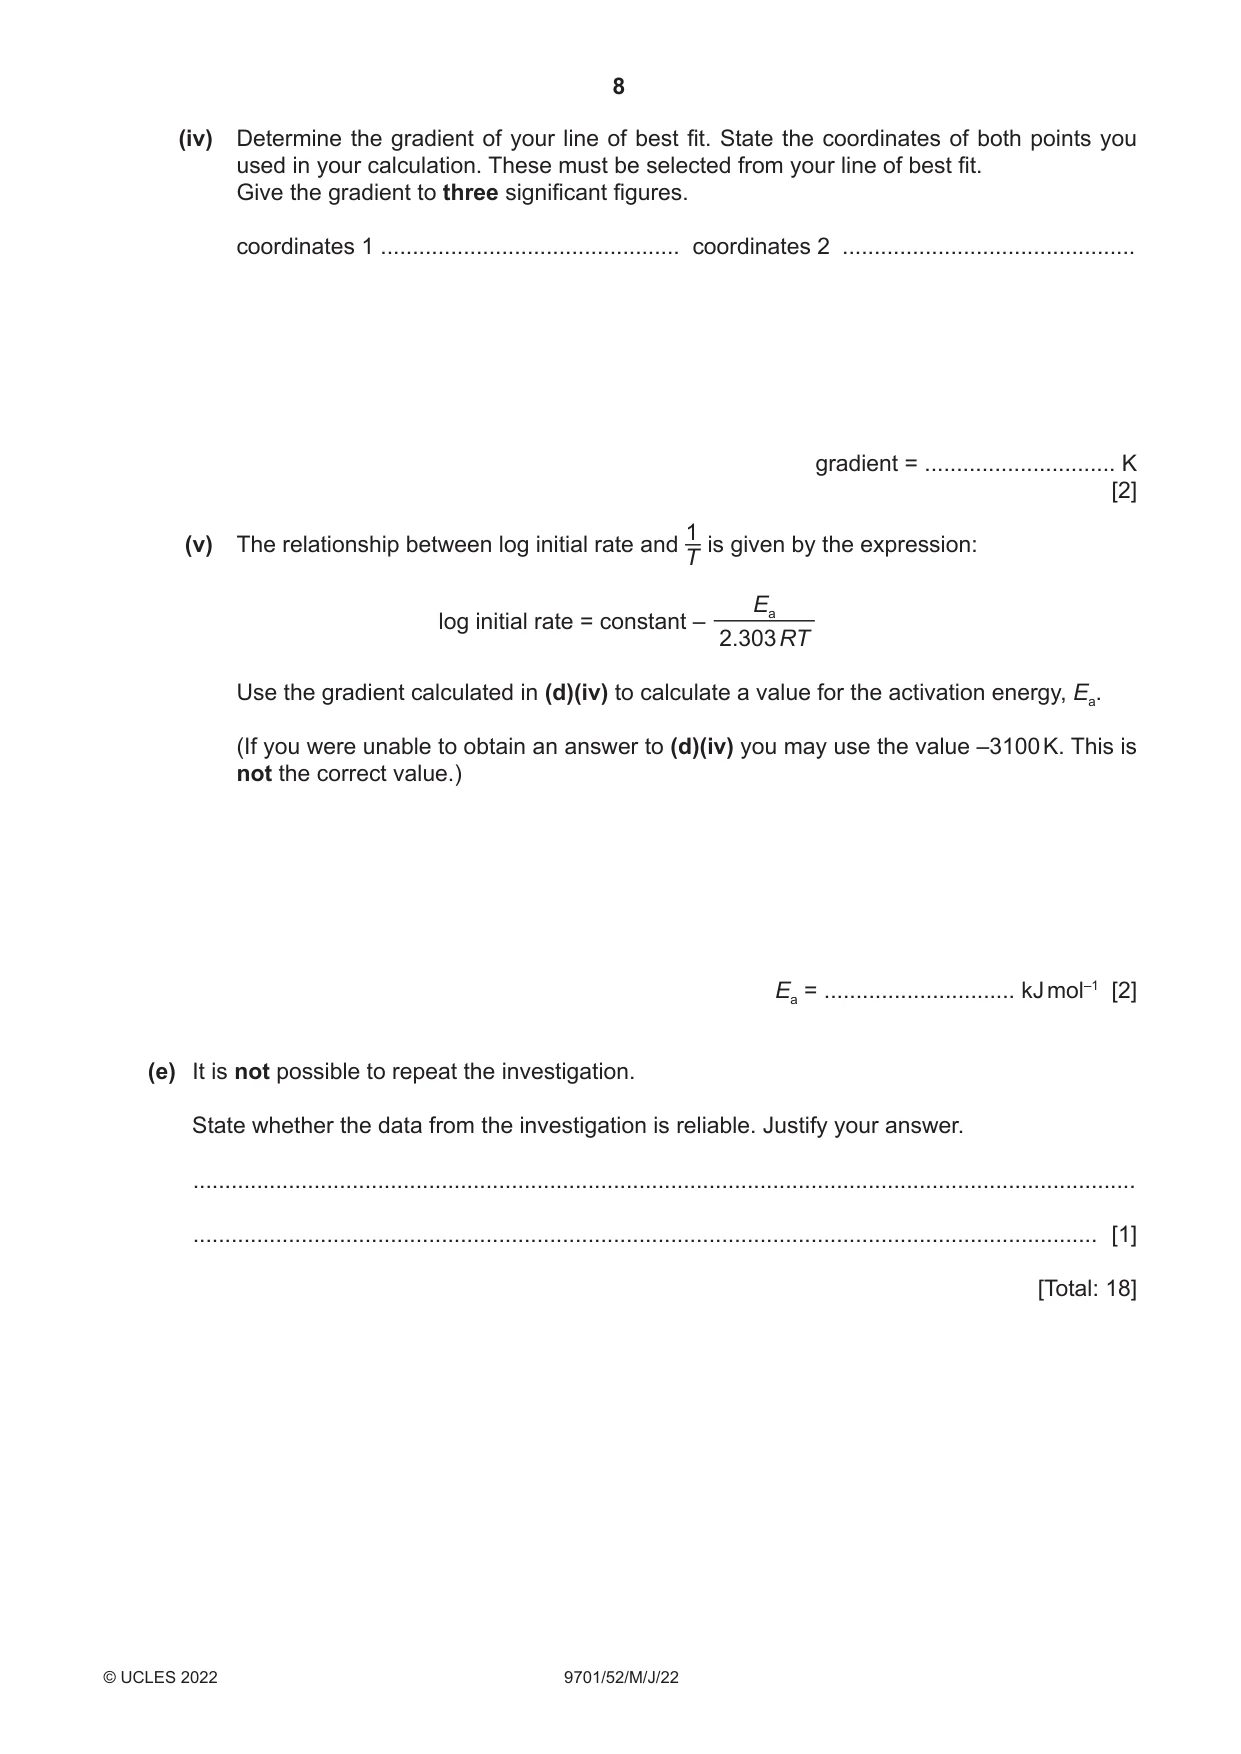
2 In a neutral solution, aqueous potassium iodide acts as a catalyst for the decomposition of aqueous hydrogen peroxide. 2H2O2(aq) → 2H2O(l) + O2(g) A student plans to carry out an investigation to find how temperature affects the initial rate of the decomposition of aqueous hydrogen peroxide, H2O2(aq), in the presence of aqueous potassium iodide, KI(aq). The student knows that the initial rate of the reaction can be measured by timing the production of the oxygen. The student carries out a series of experiments. In experiment 1 the student notes the temperature of the H2O2(aq) and KI(aq) under room conditions. The solutions are mixed in apparatus designed to collect the oxygen produced. A stop-watch is started at the beginning of the reaction. The volume of oxygen is noted at regular time intervals. In experiments 2–8 the solutions are heated to different temperatures before mixing and measurement of the oxygen produced. The data collected is used to determine a value for the activation energy of the decomposition of H2O2(aq) in the presence of KI(aq). (a) State the independent variable. .............................................................................................................................................. [1] (b) State two variables that need to be controlled. 1 ................................................................................................................................................. 2 ................................................................................................................................................. [2] (c) (i) State how the student should prepare 250.0 cm3 of 0.100 mol dm–3 H2O2(aq) from 0.500 mol dm–3 H2O2(aq). Calculate the minimum volume of 0.500 mol dm–3 H2O2(aq) required for preparation of the 0.100 mol dm–3 H2O2 solution. Give the name and capacity of any key apparatus which should be used. Write your answer as a series of numbered steps. ............................................................................................................................................. ............................................................................................................................................. ............................................................................................................................................. ............................................................................................................................................. ............................................................................................................................................. ....................................................................................................................................... [3] (ii) Hydrogen peroxide causes eye and skin irritation. State what precaution should be taken when preparing the solution in (c)(i) other than wearing goggles. ....................................................................................................................................... [1] (d) (i) The student performs experiments 1–8 using a range of temperatures. The results are shown in Table 2.1. 1 Complete the table and record the values of to three significant figures and the values T of log initial rate to three significant figures. Table 2.1 experiment temperature temperature 1 initial rate number / °C / K T / K–1 / mol s–1 log initial rate 1 20 293 5.75 × 10⁻⁶ 2 25 298 7.94 × 10⁻⁶ 3 30 303 1.17 × 10⁻⁵ 4 35 308 1.45 × 10⁻⁵ 5 39 312 2.19 × 10⁻⁵ 6 46 319 3.72 × 10⁻⁵ 7 52 325 5.25 × 10⁻⁵ 8 55 328 6.31 × 10⁻⁵ [2] 1 (ii) Plot a graph on the grid to show the relationship between log initial rate and T. Use a cross (×) to plot each data point. Draw a line of best fit. [2] (iii) Circle the point on the graph you consider to be most anomalous. Suggest one reason why this anomaly may have occurred during this experimental procedure. ............................................................................................................................................. ....................................................................................................................................... [2]
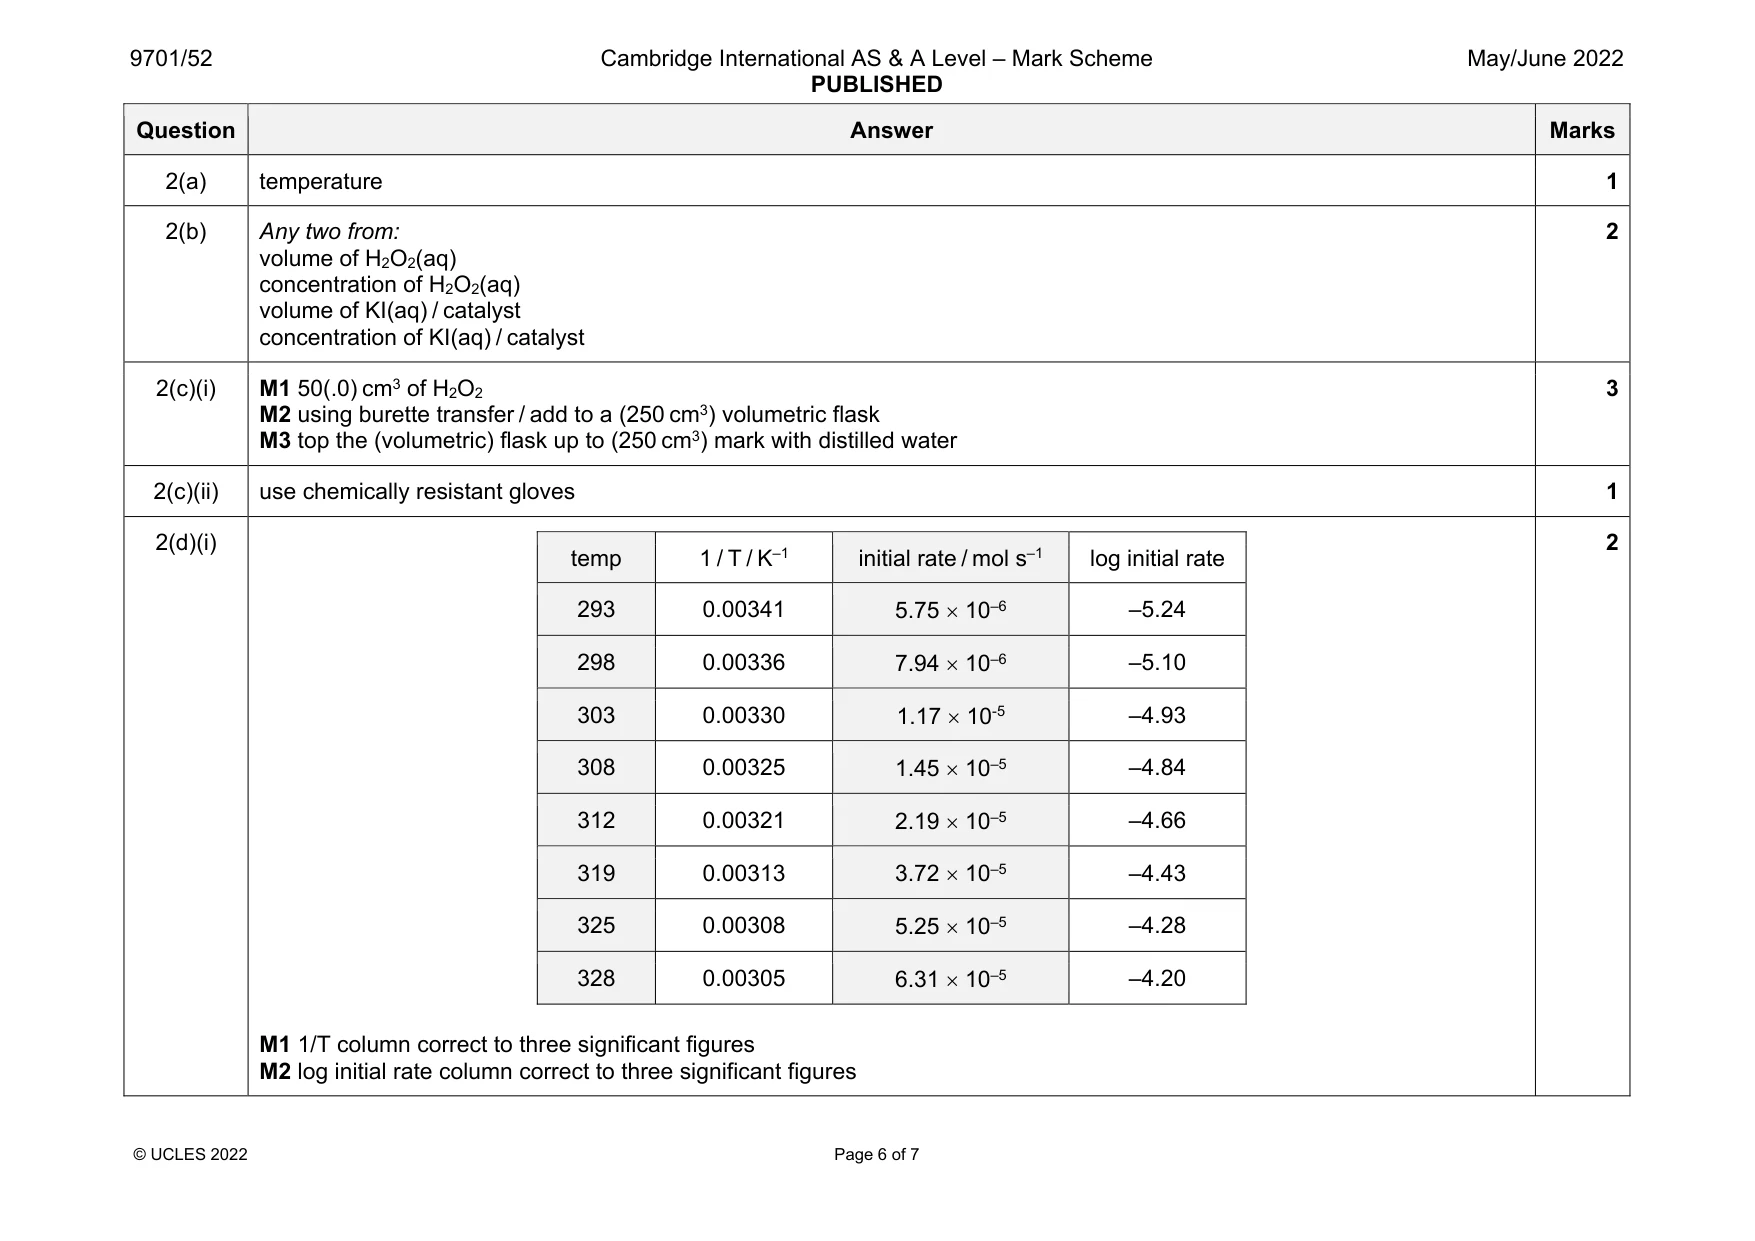
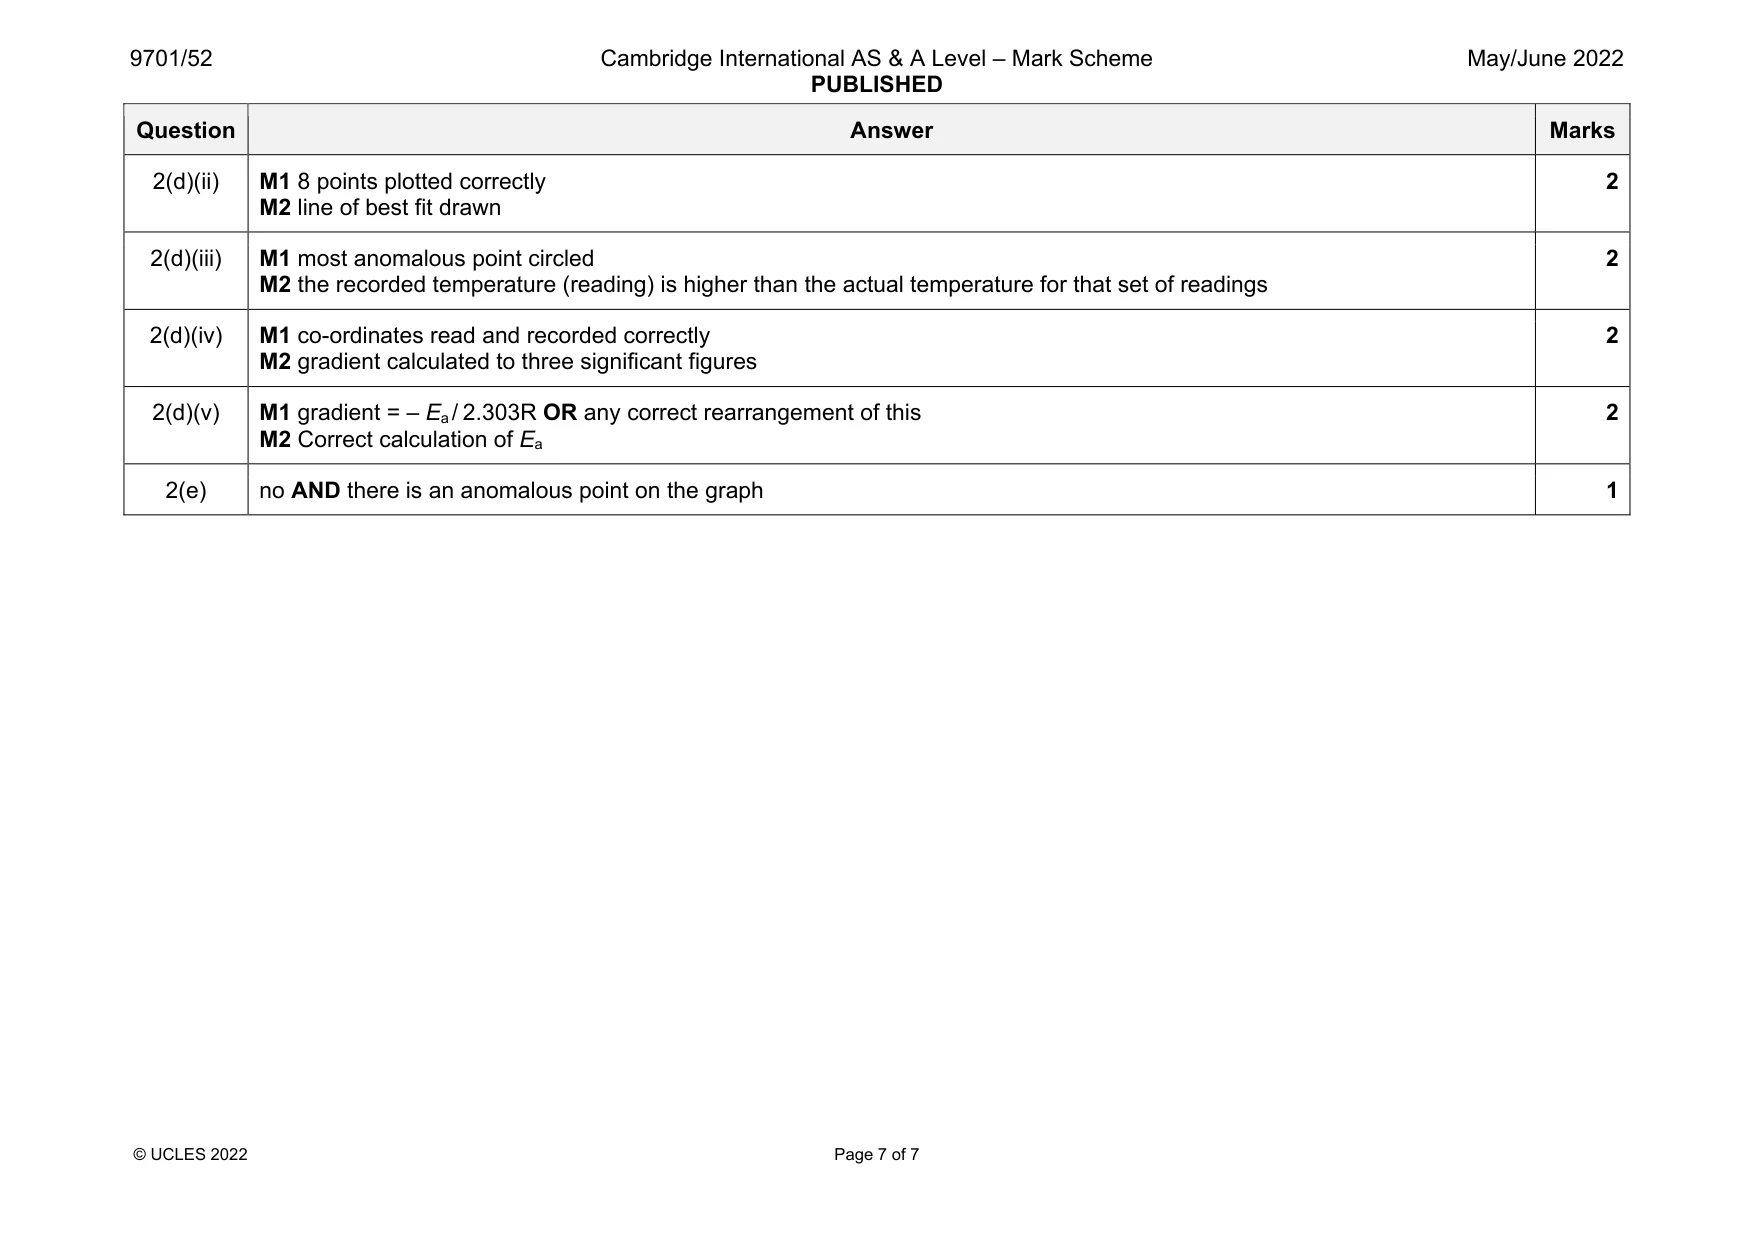
Mark scheme: 2(a) temperature 1 2(b) Any two from: volume of H2O2(aq) concentration of H2O2(aq) volume of KI(aq) / catalyst concentration of KI(aq) / catalyst 2 2(c)(i) M1 50(.0) cm3 of H2O2 M2 using burette transfer / add to a (250 cm3) volumetric flask M3 top the (volumetric) flask up to (250 cm3) mark with distilled water 3 2(c)(ii) use chemically resistant gloves 1 2(d)(i) temp 1 / T / K–1 initial rate / mol s–1 log initial rate 293 0.00341 5.75 10–6 –5.24 298 0.00336 7.94 10–6 –5.10 303 0.00330 1.17 10-5 –4.93 308 0.00325 1.45 10–5 –4.84 312 0.00321 2.19 10–5 –4.66 319 0.00313 3.72 10–5 –4.43 325 0.00308 5.25 10–5 –4.28 328 0.00305 6.31 10–5 –4.20 M1 1/T column correct to three significant figures M2 log initial rate column correct to three significant figures 2 Question Answer Marks 2(d)(ii) M1 8 points plotted correctly M2 line of best fit drawn 2 2(d)(iii) M1 most anomalous point circled M2 the recorded temperature (reading) is higher than the actual temperature for that set of readings 2 2(d)(iv) M1 co-ordinates read and recorded correctly M2 gradient calculated to three significant figures 2 2(d)(v) M1 gradient = – Ea / 2.303R OR any correct rearrangement of this M2 Correct calculation of Ea 2 2(e) no AND there is an anomalous point on the graph 1
More questions on Reacting masses and volumes (of solutions and gases)
What was in this paper
The subtopics covered by these 2 questions, and how many questions each got. Open one in a new tab to see every Cambridge question on it.
What you needed in this session
Cambridge’s own grade thresholds for 2022 May/June, Paper 5 · Variant 2. A higher threshold means an easier paper — the bar moves with how the cohort did.