Cambridge A Level Chemistry 9701 — 2022 May/June Paper 5 · Variant 3
9701/53/M/J/22 · 2 questions · 30 marks · ≈34 min
The question paper and its mark scheme, free to read here and free to download. This is Cambridge’s own paper, exactly as it was sat.
Question paper16 pages



Mark scheme10 pages
Answers below. Sit the paper first if you are practising.
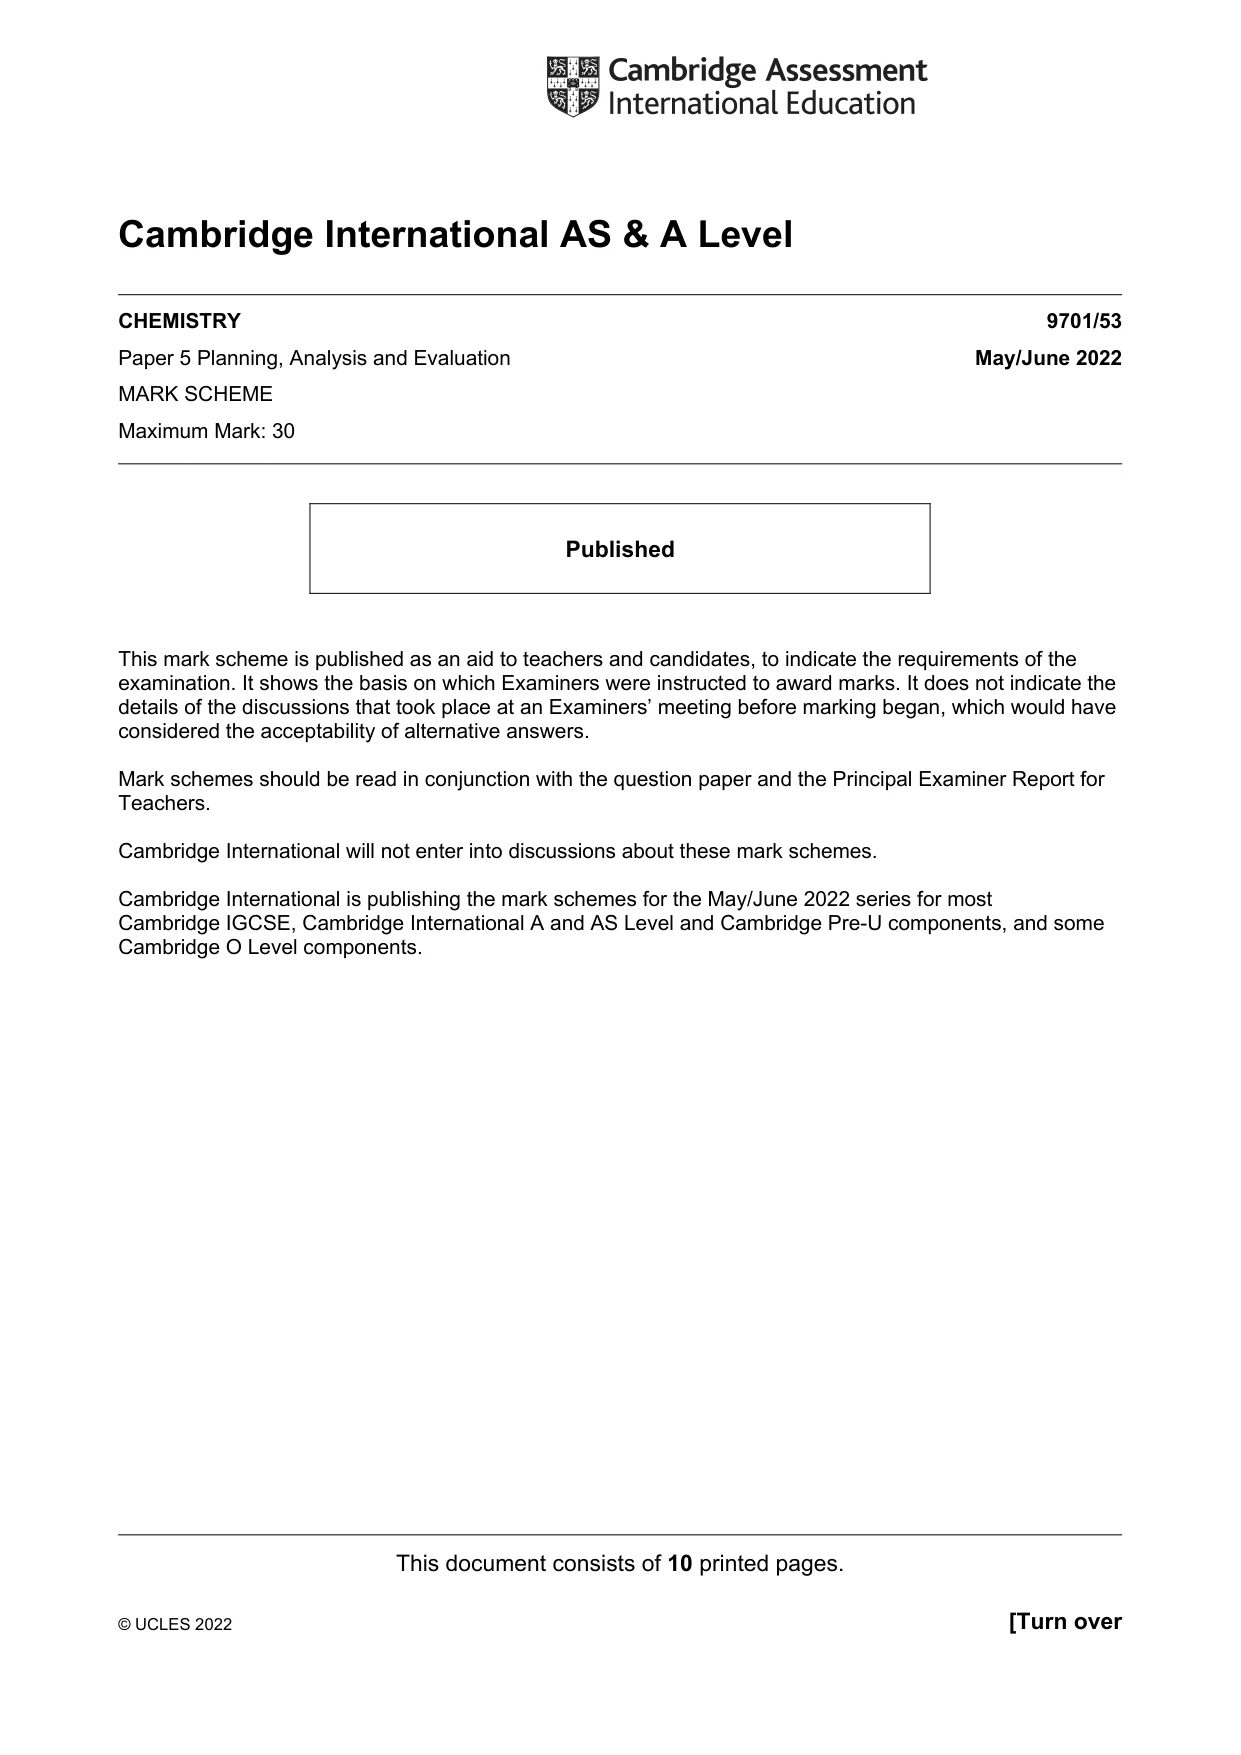
Questions as text
Q1 · A student plans an investigation to find the molar ratio of the reaction between sodium…
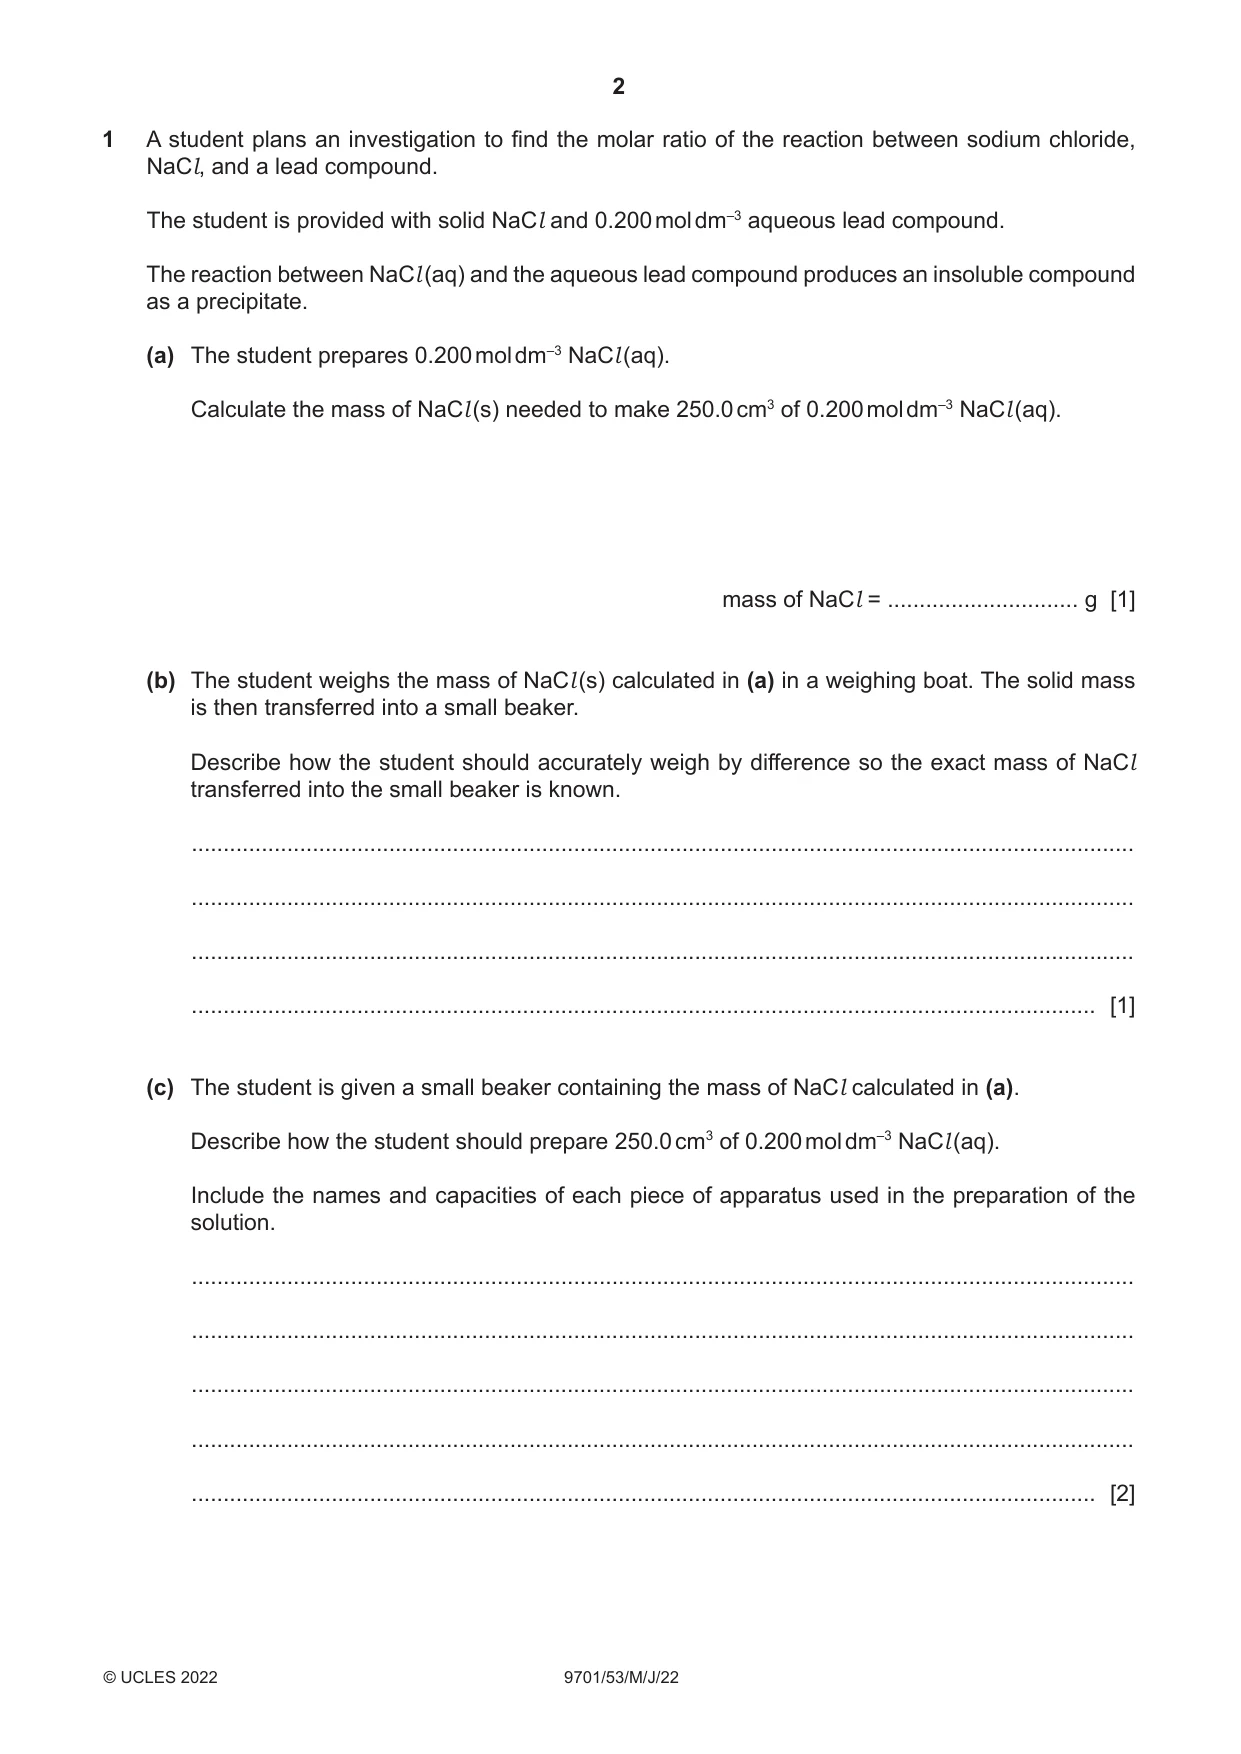
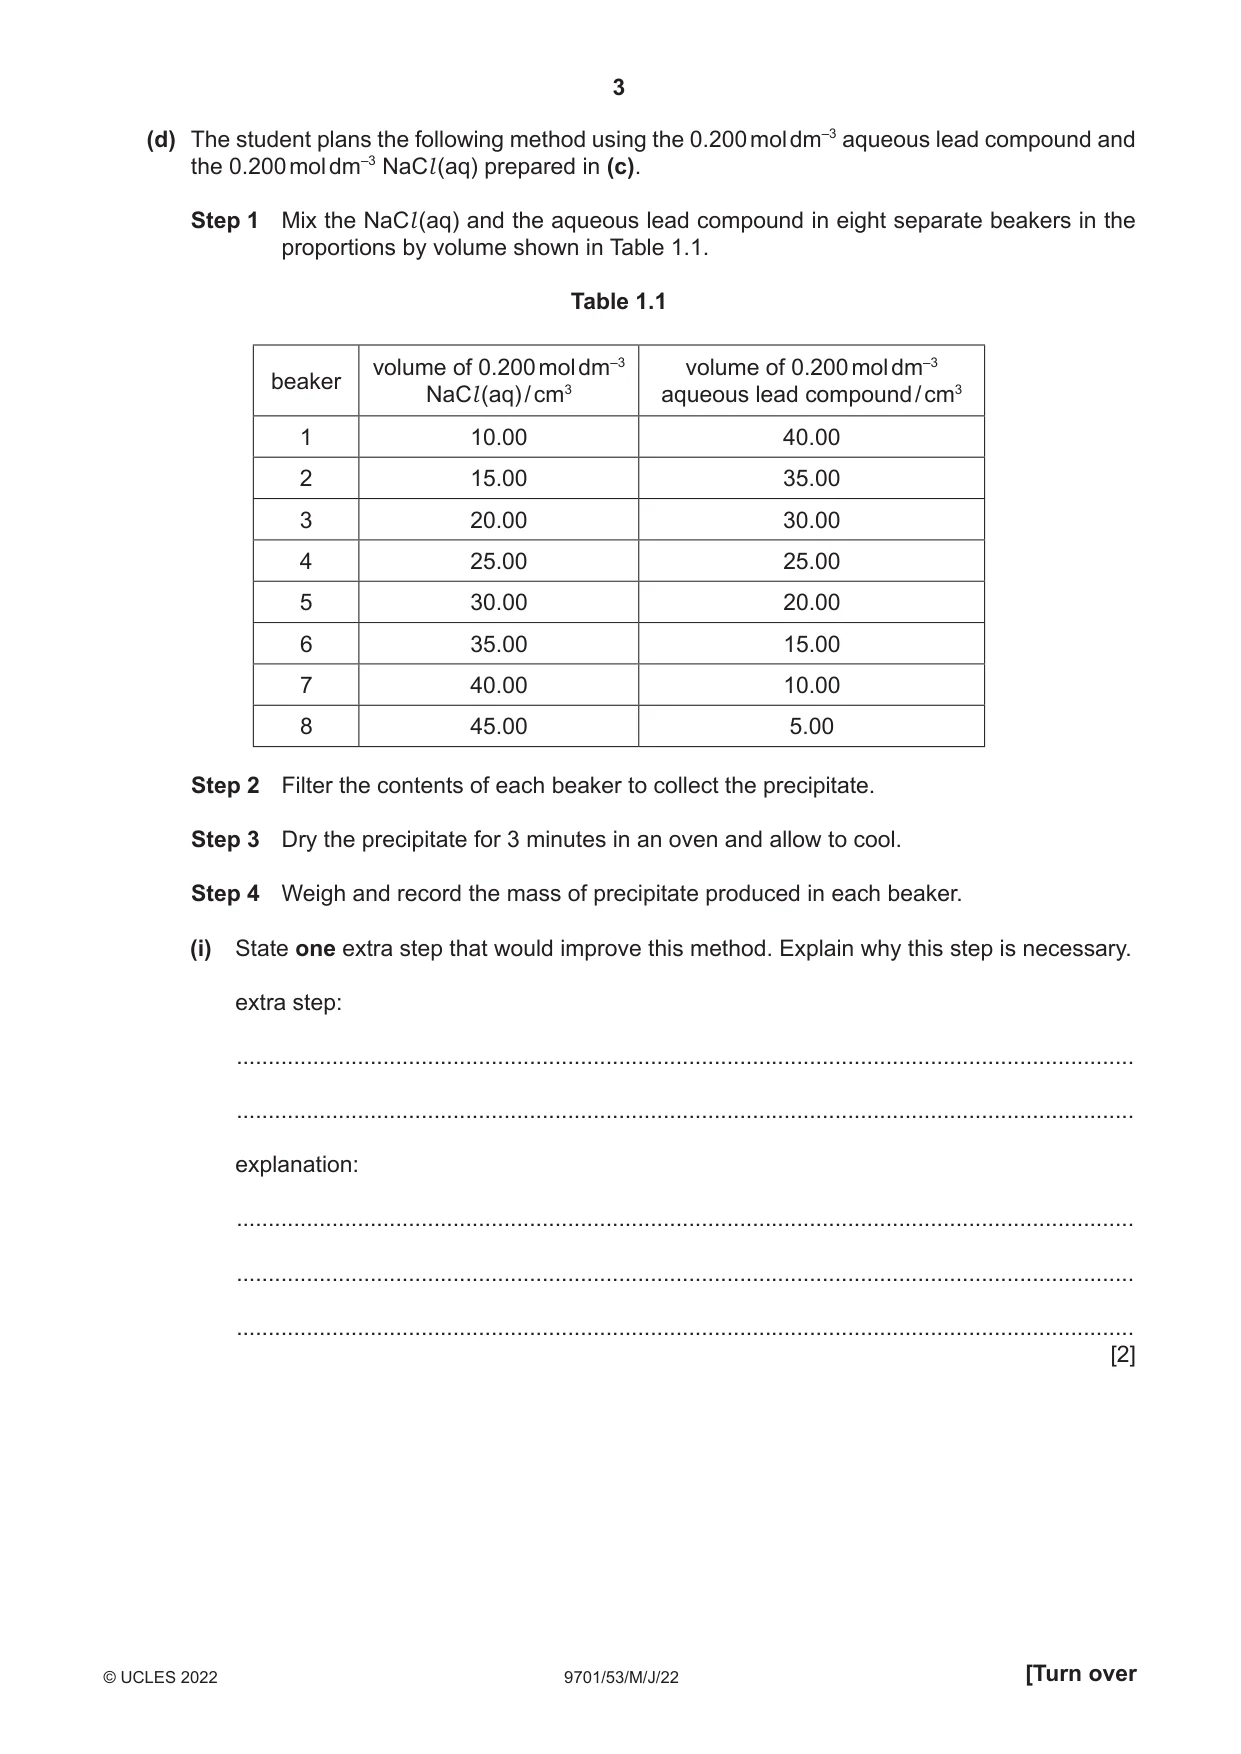
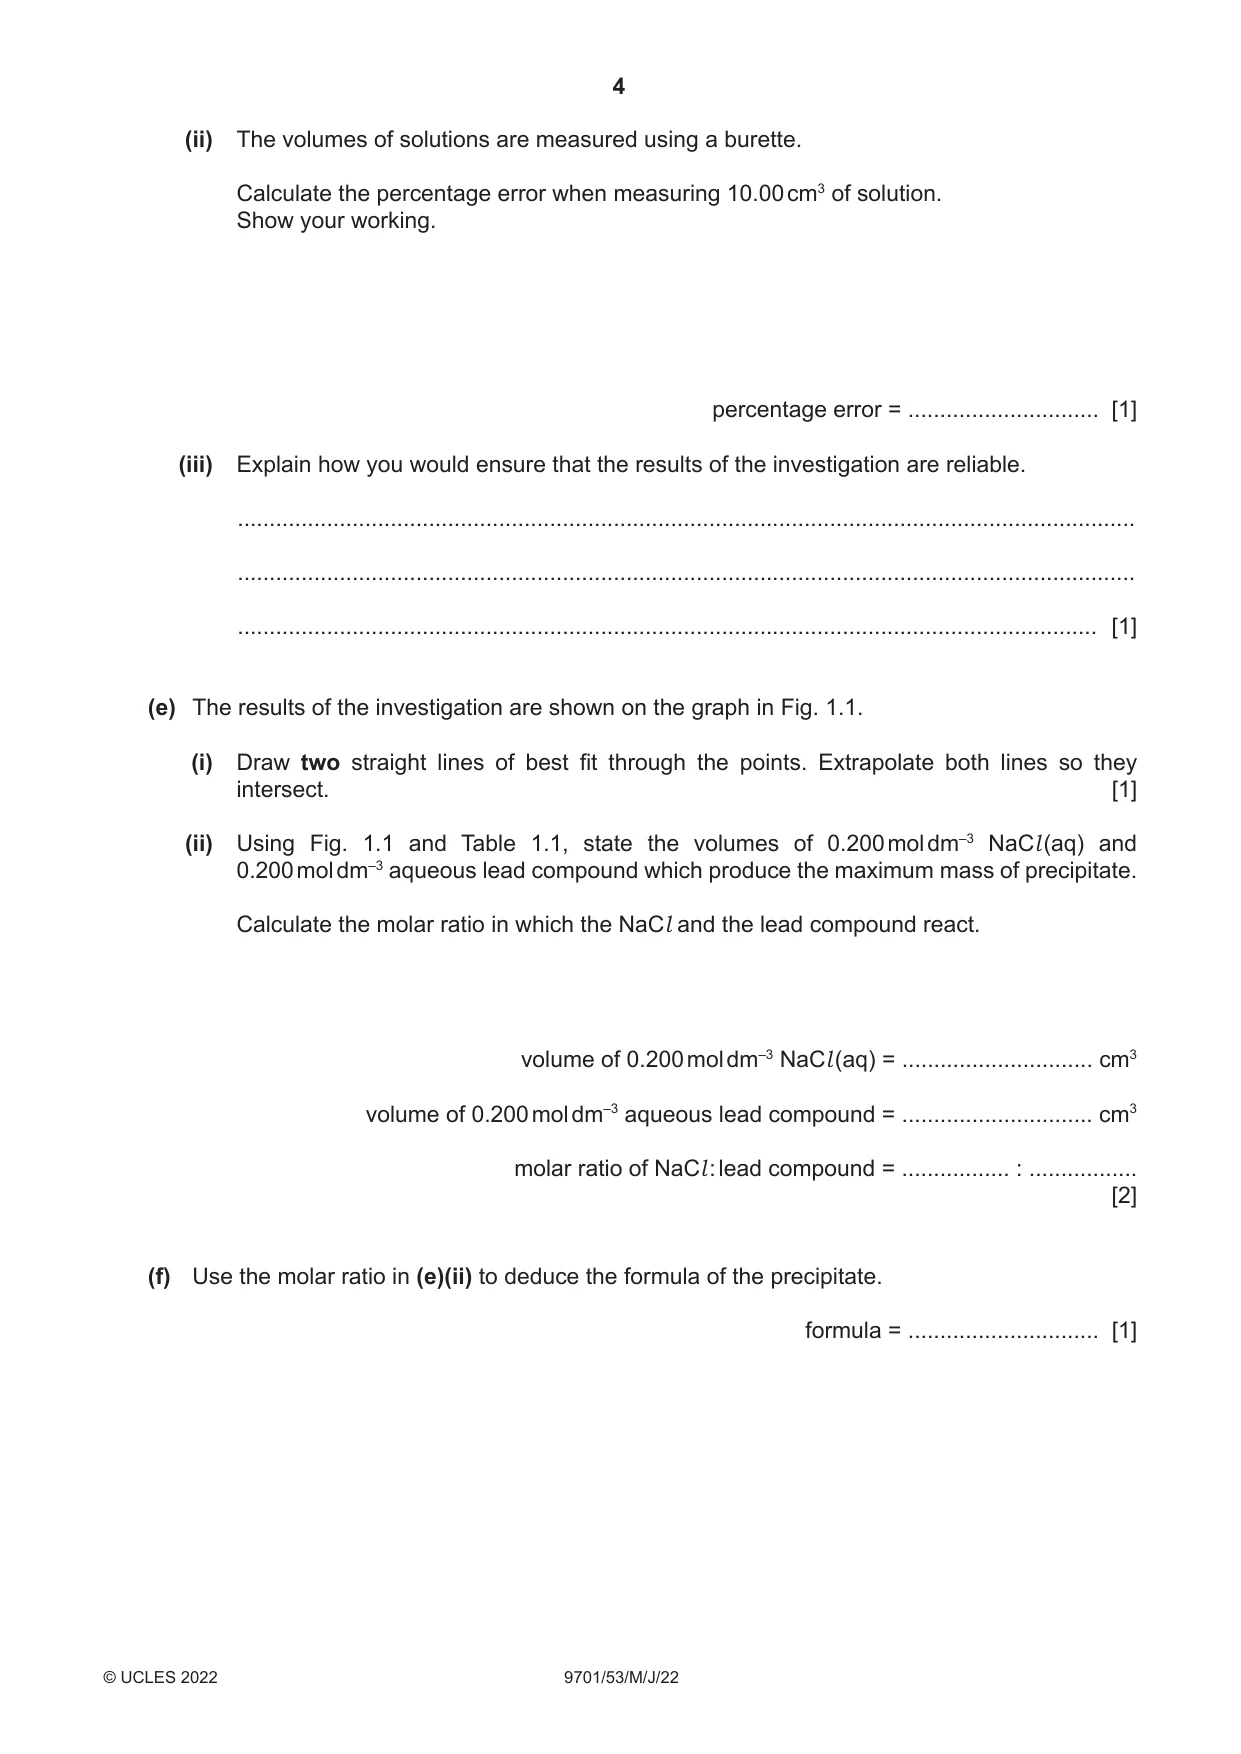
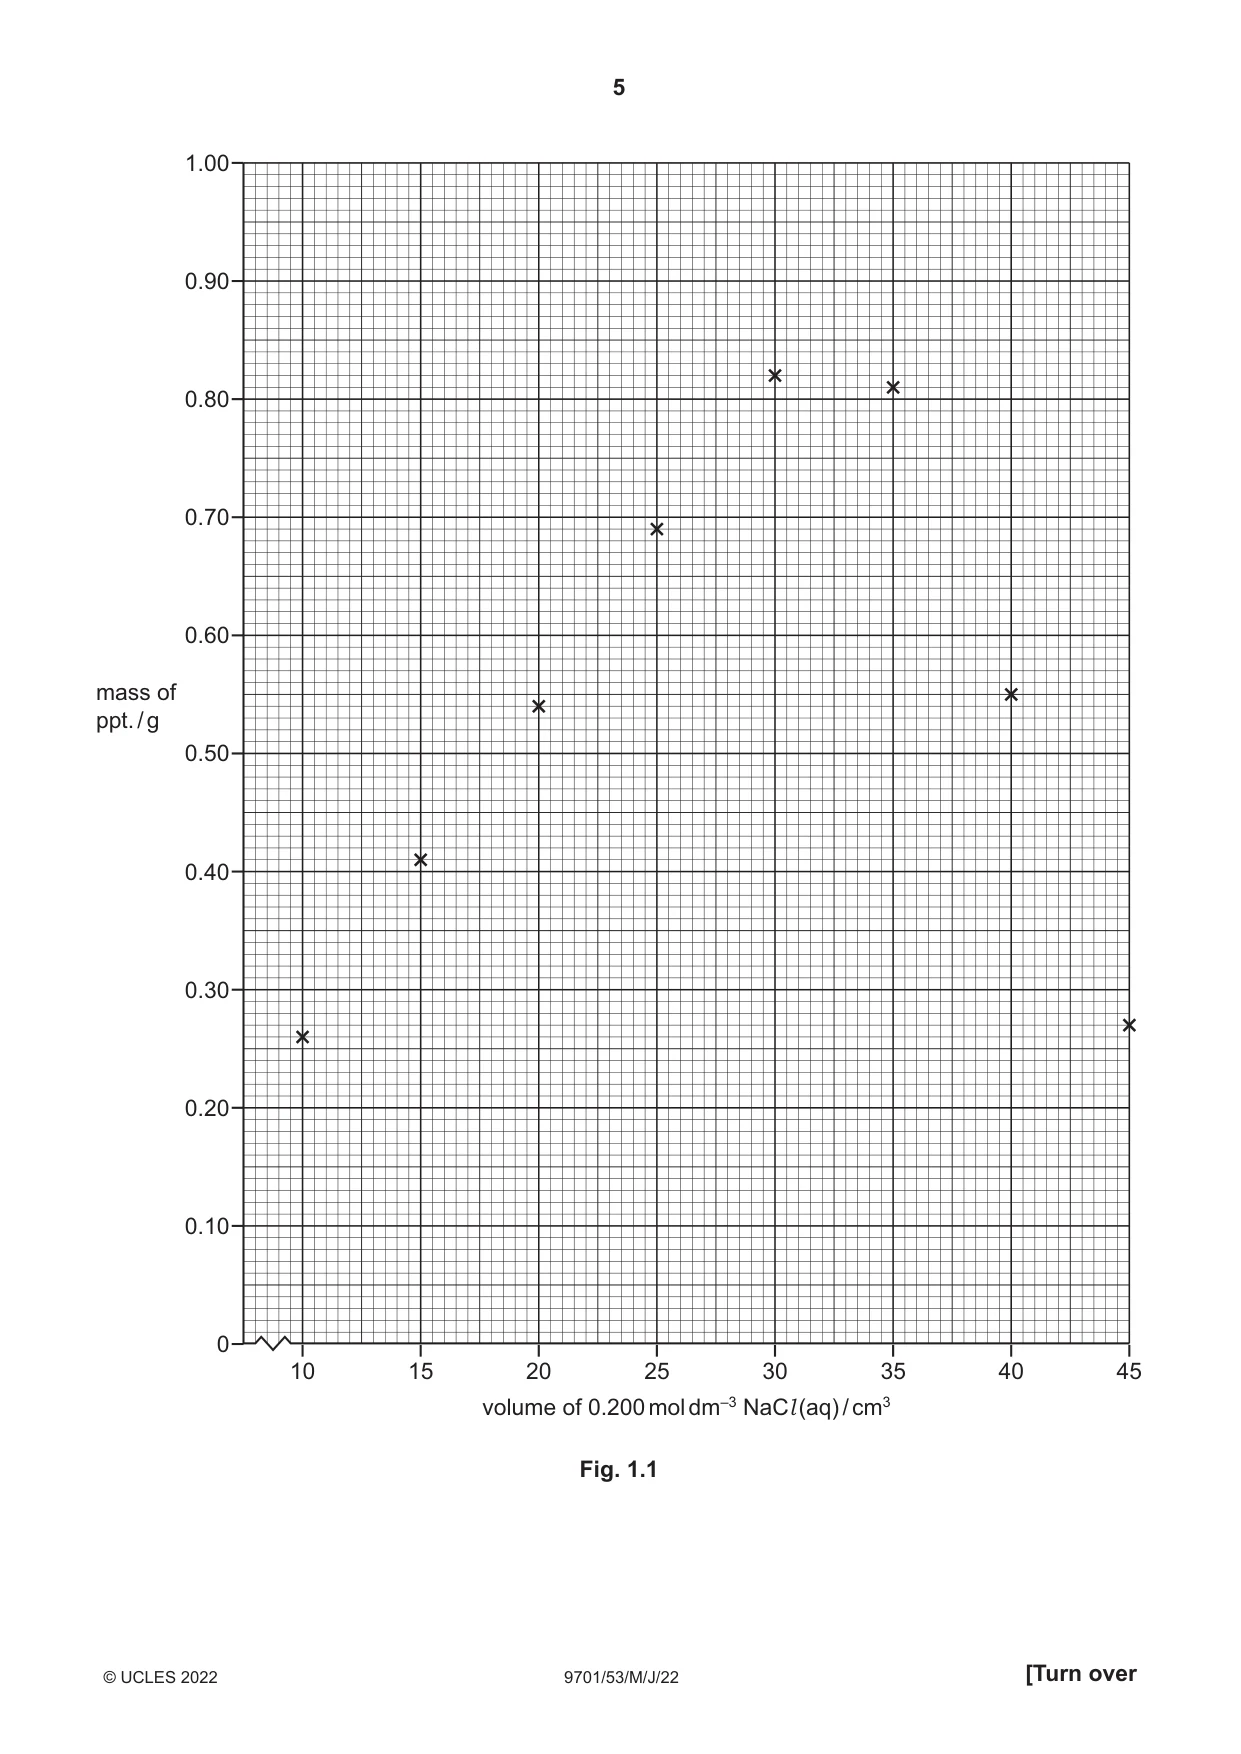
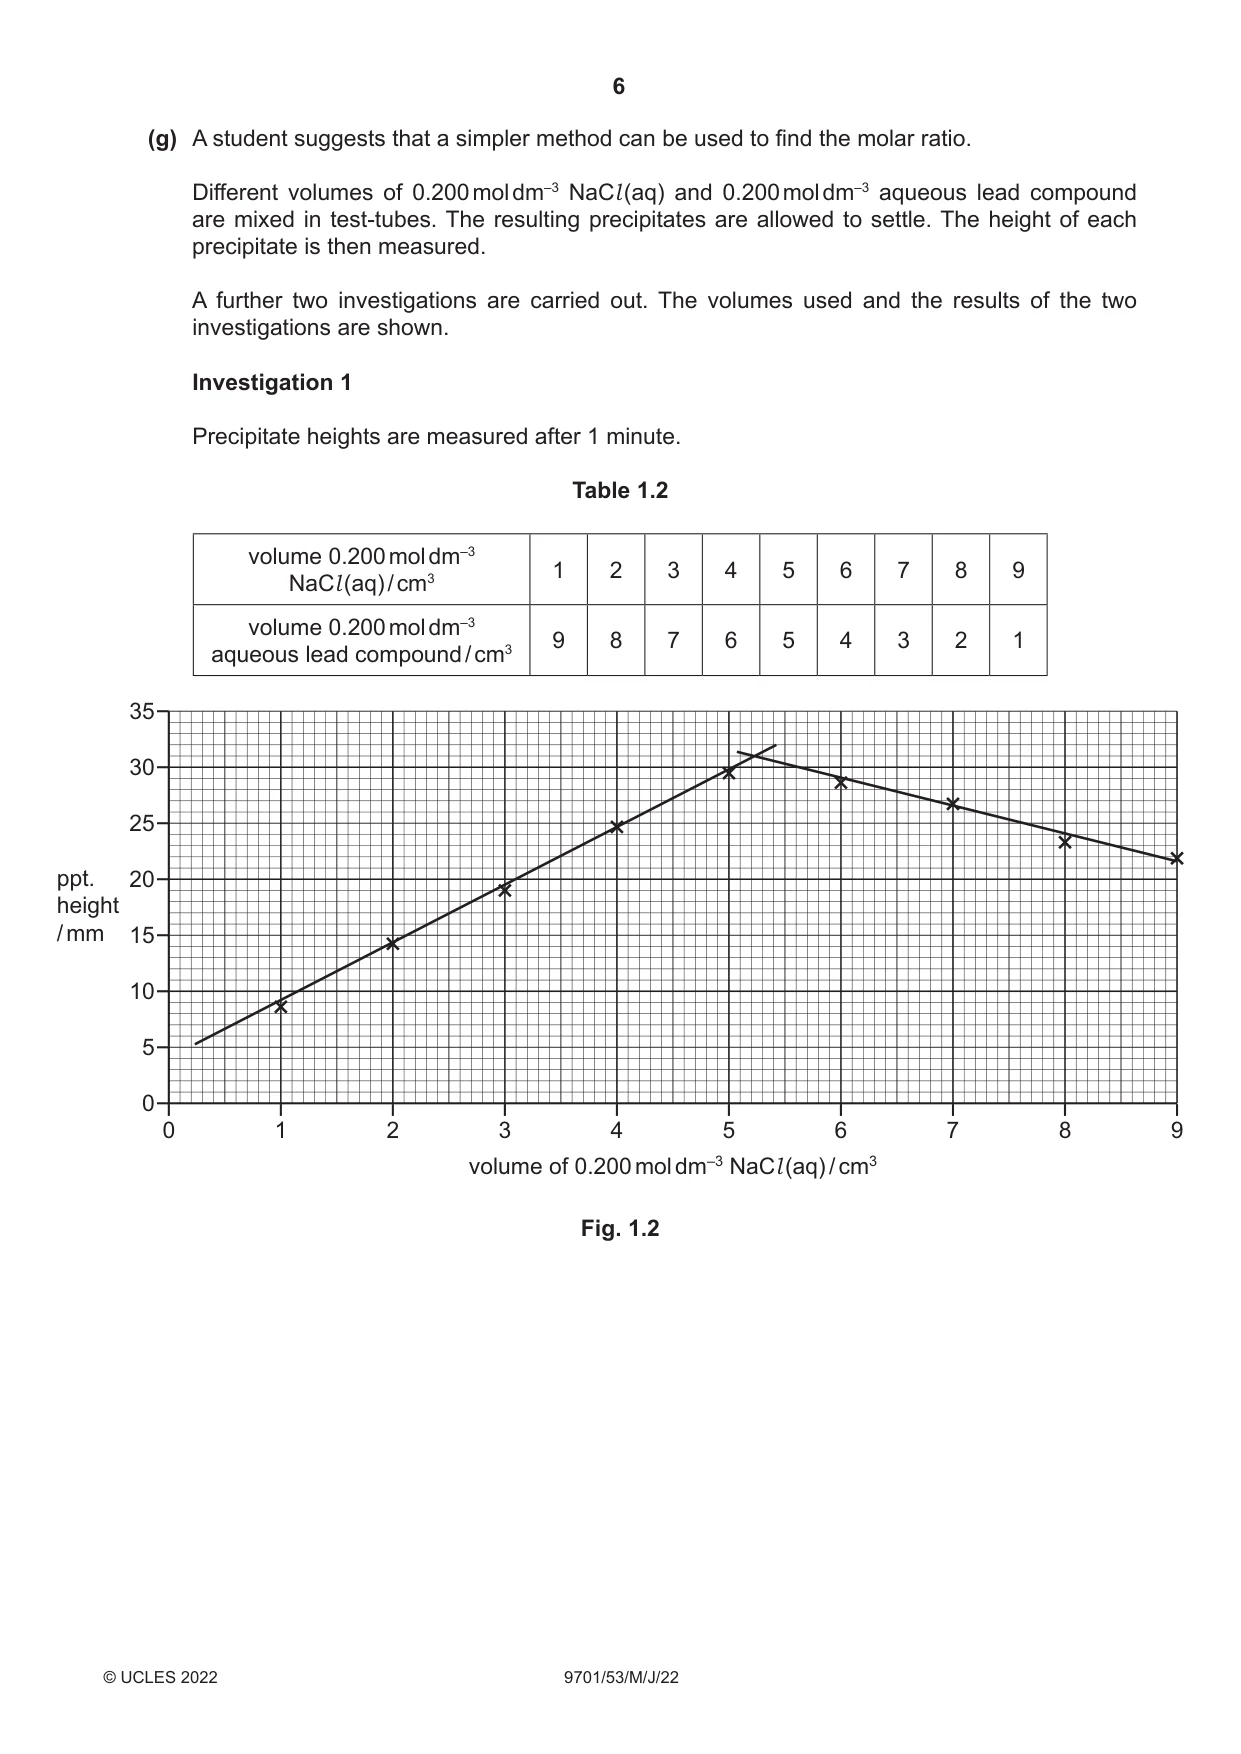
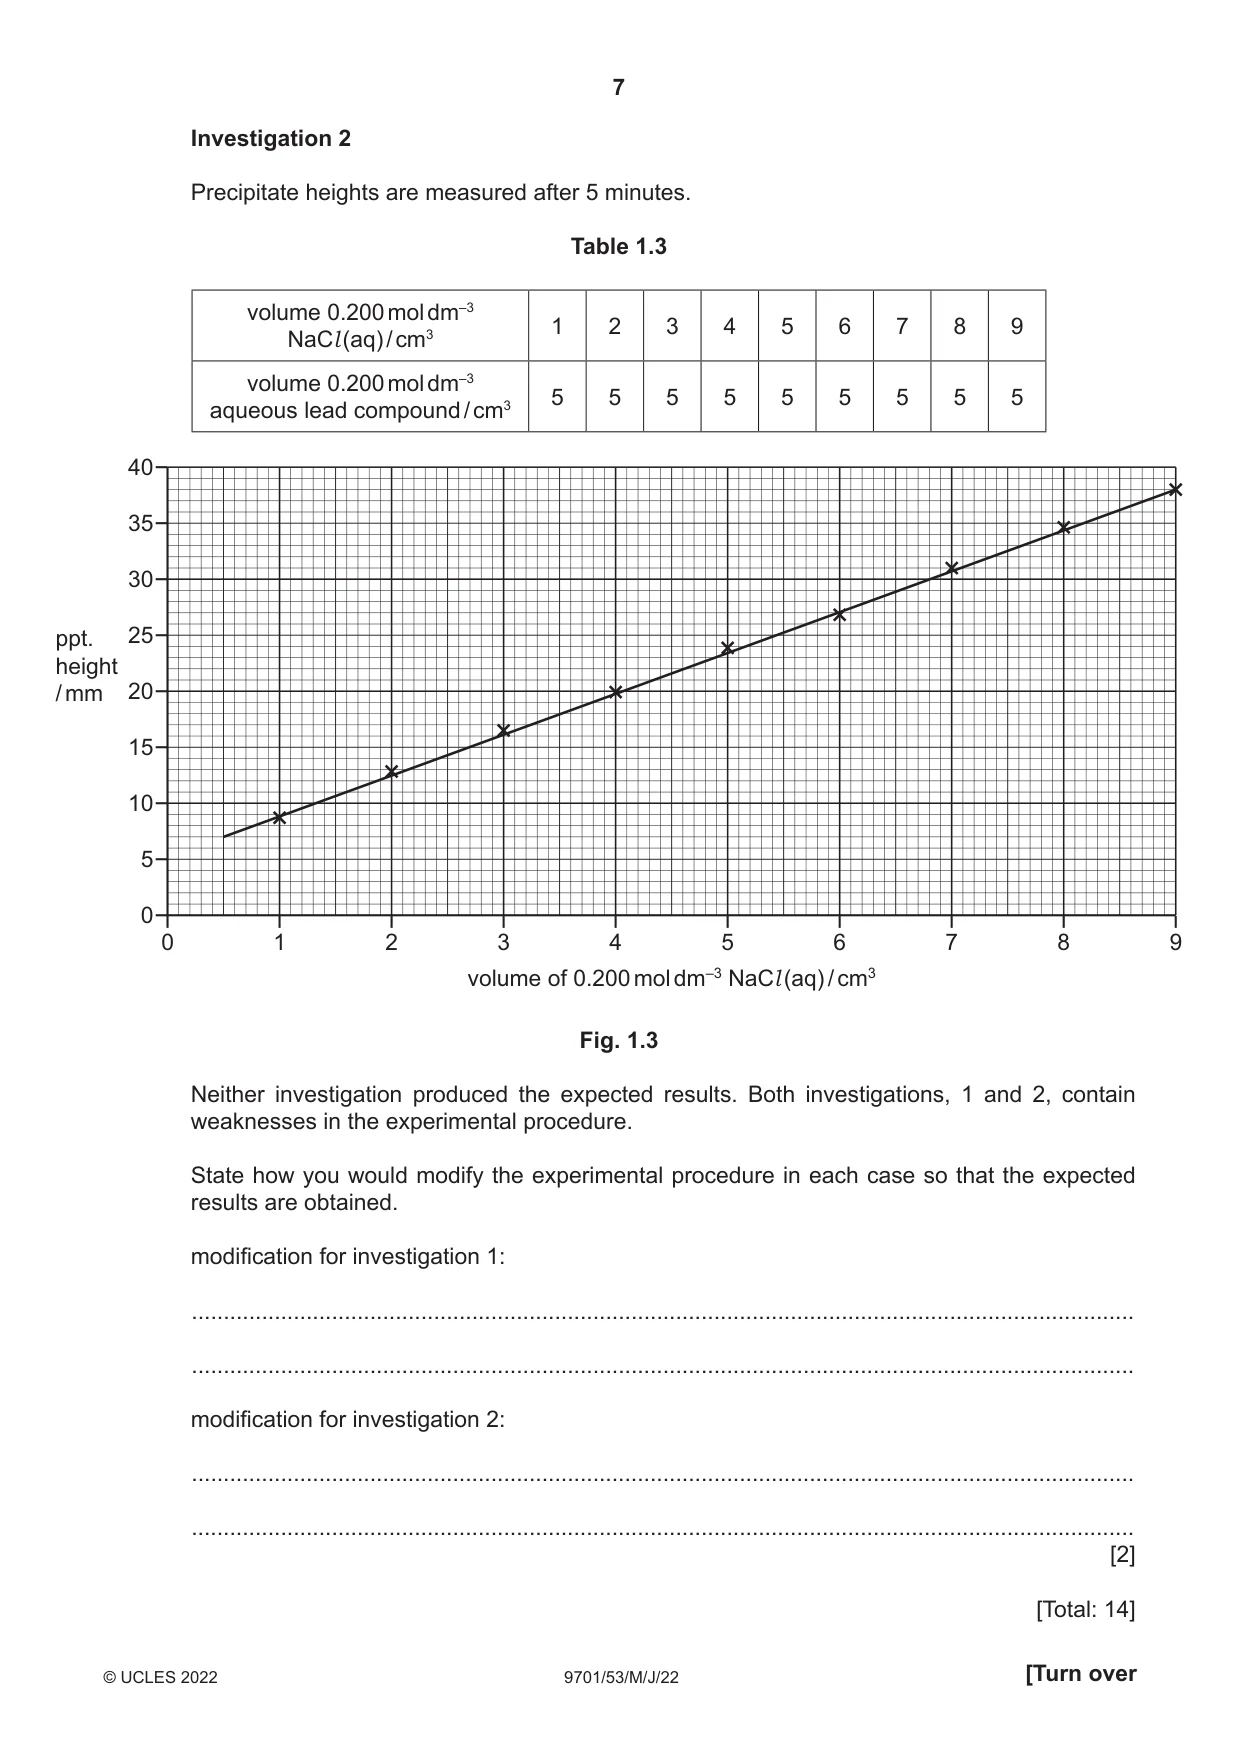
1 A student plans an investigation to find the molar ratio of the reaction between sodium chloride, NaCl, and a lead compound. The student is provided with solid NaCl and 0.200 mol dm–3 aqueous lead compound. The reaction between NaCl (aq) and the aqueous lead compound produces an insoluble compound as a precipitate. (a) The student prepares 0.200 mol dm–3 NaCl (aq). Calculate the mass of NaCl (s) needed to make 250.0 cm3 of 0.200 mol dm–3 NaCl (aq). mass of NaCl = .............................. g [1] (b) The student weighs the mass of NaCl (s) calculated in (a) in a weighing boat. The solid mass is then transferred into a small beaker. Describe how the student should accurately weigh by difference so the exact mass of NaCl transferred into the small beaker is known. .................................................................................................................................................... .................................................................................................................................................... .................................................................................................................................................... .............................................................................................................................................. [1] (c) The student is given a small beaker containing the mass of NaCl calculated in (a). Describe how the student should prepare 250.0 cm3 of 0.200 mol dm–3 NaCl (aq). Include the names and capacities of each piece of apparatus used in the preparation of the solution. .................................................................................................................................................... .................................................................................................................................................... .................................................................................................................................................... .................................................................................................................................................... .............................................................................................................................................. [2] (d) The student plans the following method using the 0.200 mol dm–3 aqueous lead compound and the 0.200 mol dm–3 NaCl (aq) prepared in (c). Step 1 Mix the NaCl (aq) and the aqueous lead compound in eight separate beakers in the proportions by volume shown in Table 1.1. Table 1.1 volume of 0.200 mol dm–3 volume of 0.200 mol dm–3 beaker NaCl (aq) / cm3 aqueous lead compound / cm3 1 10.00 40.00 2 15.00 35.00 3 20.00 30.00 4 25.00 25.00 5 30.00 20.00 6 35.00 15.00 7 40.00 10.00 8 45.00 5.00 Step 2 Filter the contents of each beaker to collect the precipitate. Step 3 Dry the precipitate for 3 minutes in an oven and allow to cool. Step 4 Weigh and record the mass of precipitate produced in each beaker. (i) State one extra step that would improve this method. Explain why this step is necessary. extra step: ............................................................................................................................................. ............................................................................................................................................. explanation: ............................................................................................................................................. ............................................................................................................................................. ............................................................................................................................................. [2] (ii) The volumes of solutions are measured using a burette. Calculate the percentage error when measuring 10.00 cm3 of solution. Show your working. percentage error = .............................. [1] (iii) Explain how you would ensure that the results of the investigation are reliable. ............................................................................................................................................. ............................................................................................................................................. ....................................................................................................................................... [1] (e) The results of the investigation are shown on the graph in Fig. 1.1. (i) Draw two straight lines of best fit through the points. Extrapolate both lines so they intersect. [1] (ii) Using Fig. 1.1 and Table 1.1, state the volumes of 0.200 mol dm–3 NaCl (aq) and 0.200 mol dm–3 aqueous lead compound which produce the maximum mass of precipitate. Calculate the molar ratio in which the NaCl and the lead compound react. volume of 0.200 mol dm–3 NaCl (aq) = .............................. cm3 volume of 0.200 mol dm–3 aqueous lead compound = .............................. cm3 molar ratio of NaCl : lead compound = ................. : ................. [2] (f) Use the molar ratio in (e)(ii) to deduce the formula of the precipitate. formula = .............................. [1] 200 . 1. (g) A student suggests that a simpler method can be used to find the molar ratio. Different volumes of 0.200 mol dm–3 NaCl (aq) and 0.200 mol dm–3 aqueous lead compound are mixed in test-tubes. The resulting precipitates are allowed to settle. The height of each precipitate is then measured. A further two investigations are carried out. The volumes used and the results of the two investigations are shown. Investigation 1 Precipitate heights are measured after 1 minute. Table 1.2 volume 0.200 mol dm–3 1 2 3 4 5 6 7 8 9 NaCl (aq) / cm3 volume 0.200 mol dm–3 9 8 7 6 5 4 3 2 1 aqueous lead compound / cm3 35 30 25 ppt. 20 height / mm 15 10 5 0 0 1 2 3 4 5 6 7 8 9 volume of 0.200 mol dm–3 NaCl (aq) / cm3 Fig. 1.2 Investigation 2 Precipitate heights are measured after 5 minutes. Table 1.3 volume 0.200 mol dm–3 1 2 3 4 5 6 7 8 9 NaCl (aq) / cm3 volume 0.200 mol dm–3 5 5 5 5 5 5 5 5 5 aqueous lead compound / cm3 40 35 30 ppt. 25 height / mm 20 15 10 5 0 0 1 2 3 4 5 6 7 8 9 volume of 0.200 mol dm–3 NaCl (aq) / cm3 Fig. 1.3 Neither investigation produced the expected results. Both investigations, 1 and 2, contain weaknesses in the experimental procedure. State how you would modify the experimental procedure in each case so that the expected results are obtained. modification for investigation 1: .................................................................................................................................................... .................................................................................................................................................... modification for investigation 2: .................................................................................................................................................... .................................................................................................................................................... [2] [Total: 14]
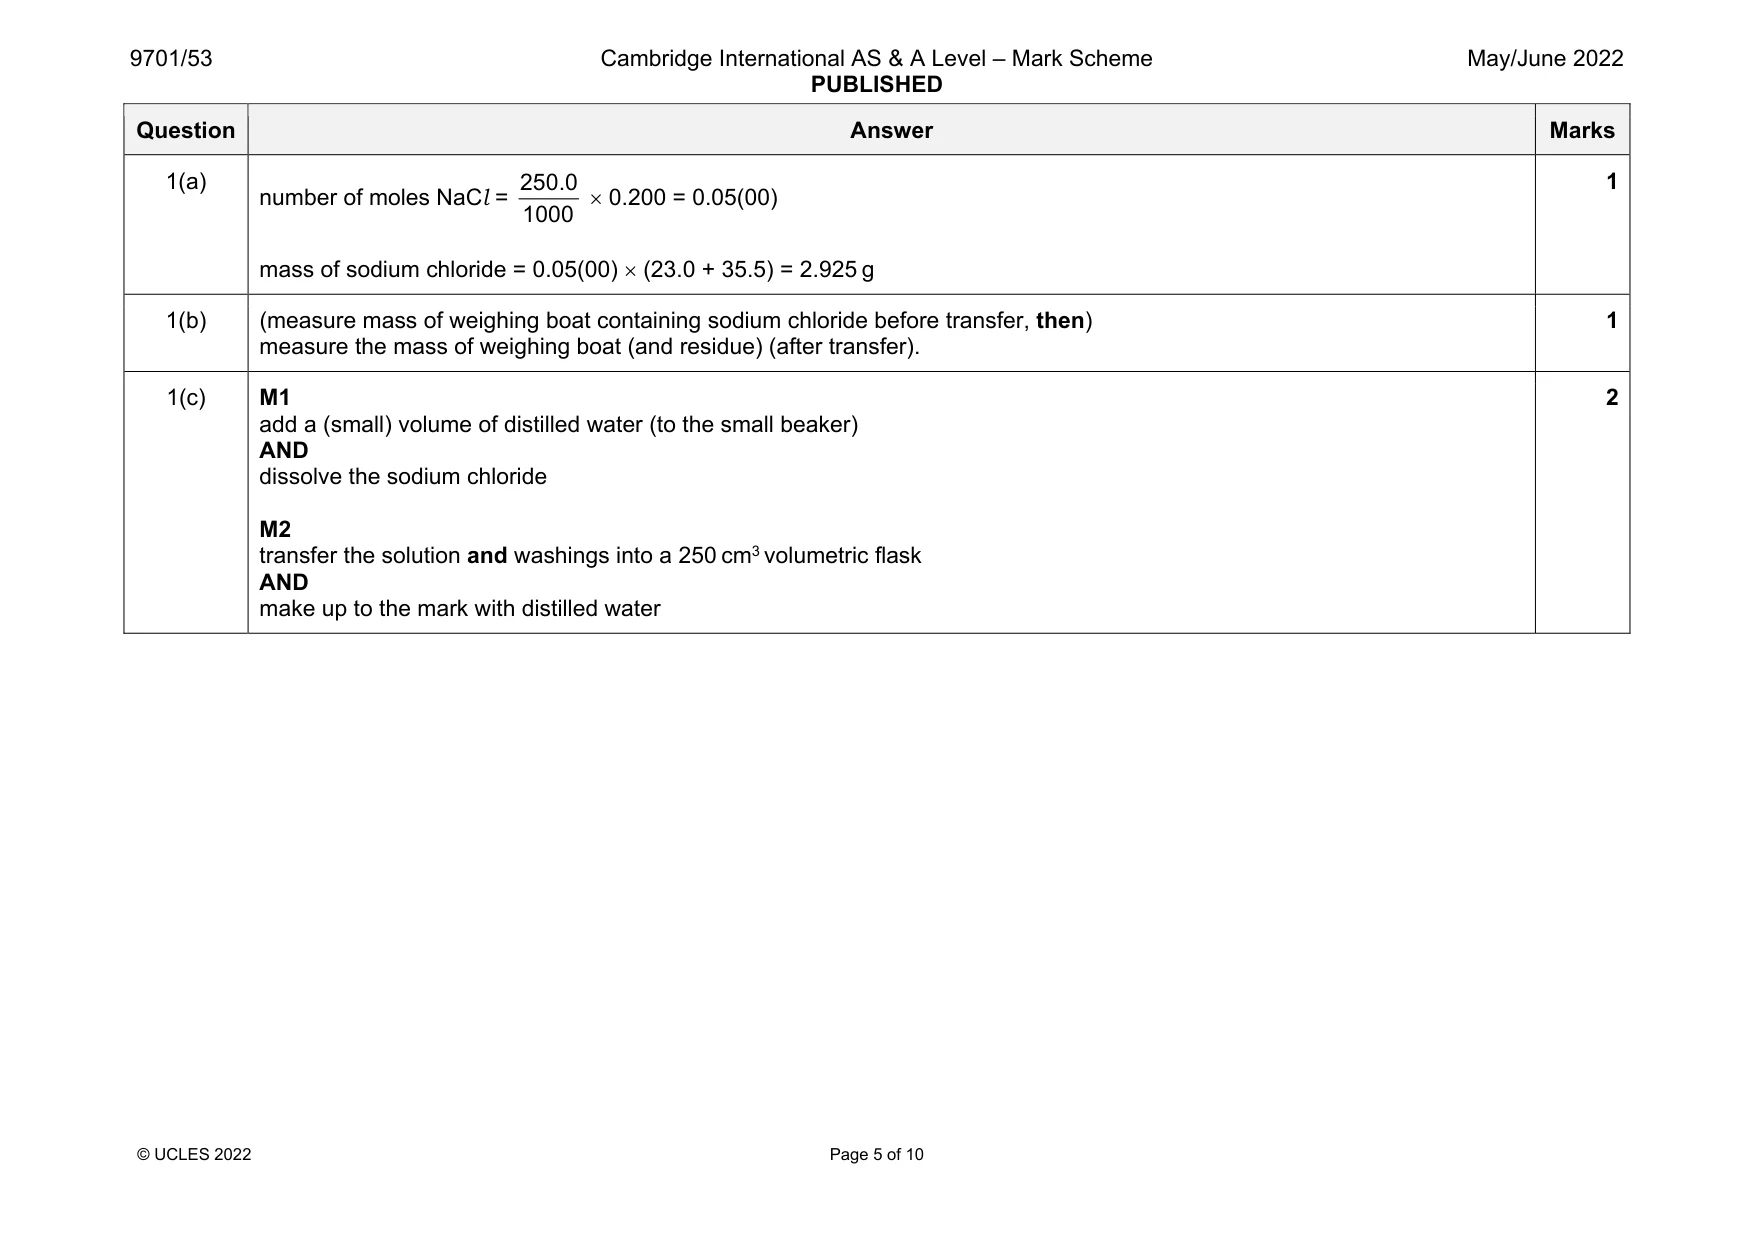
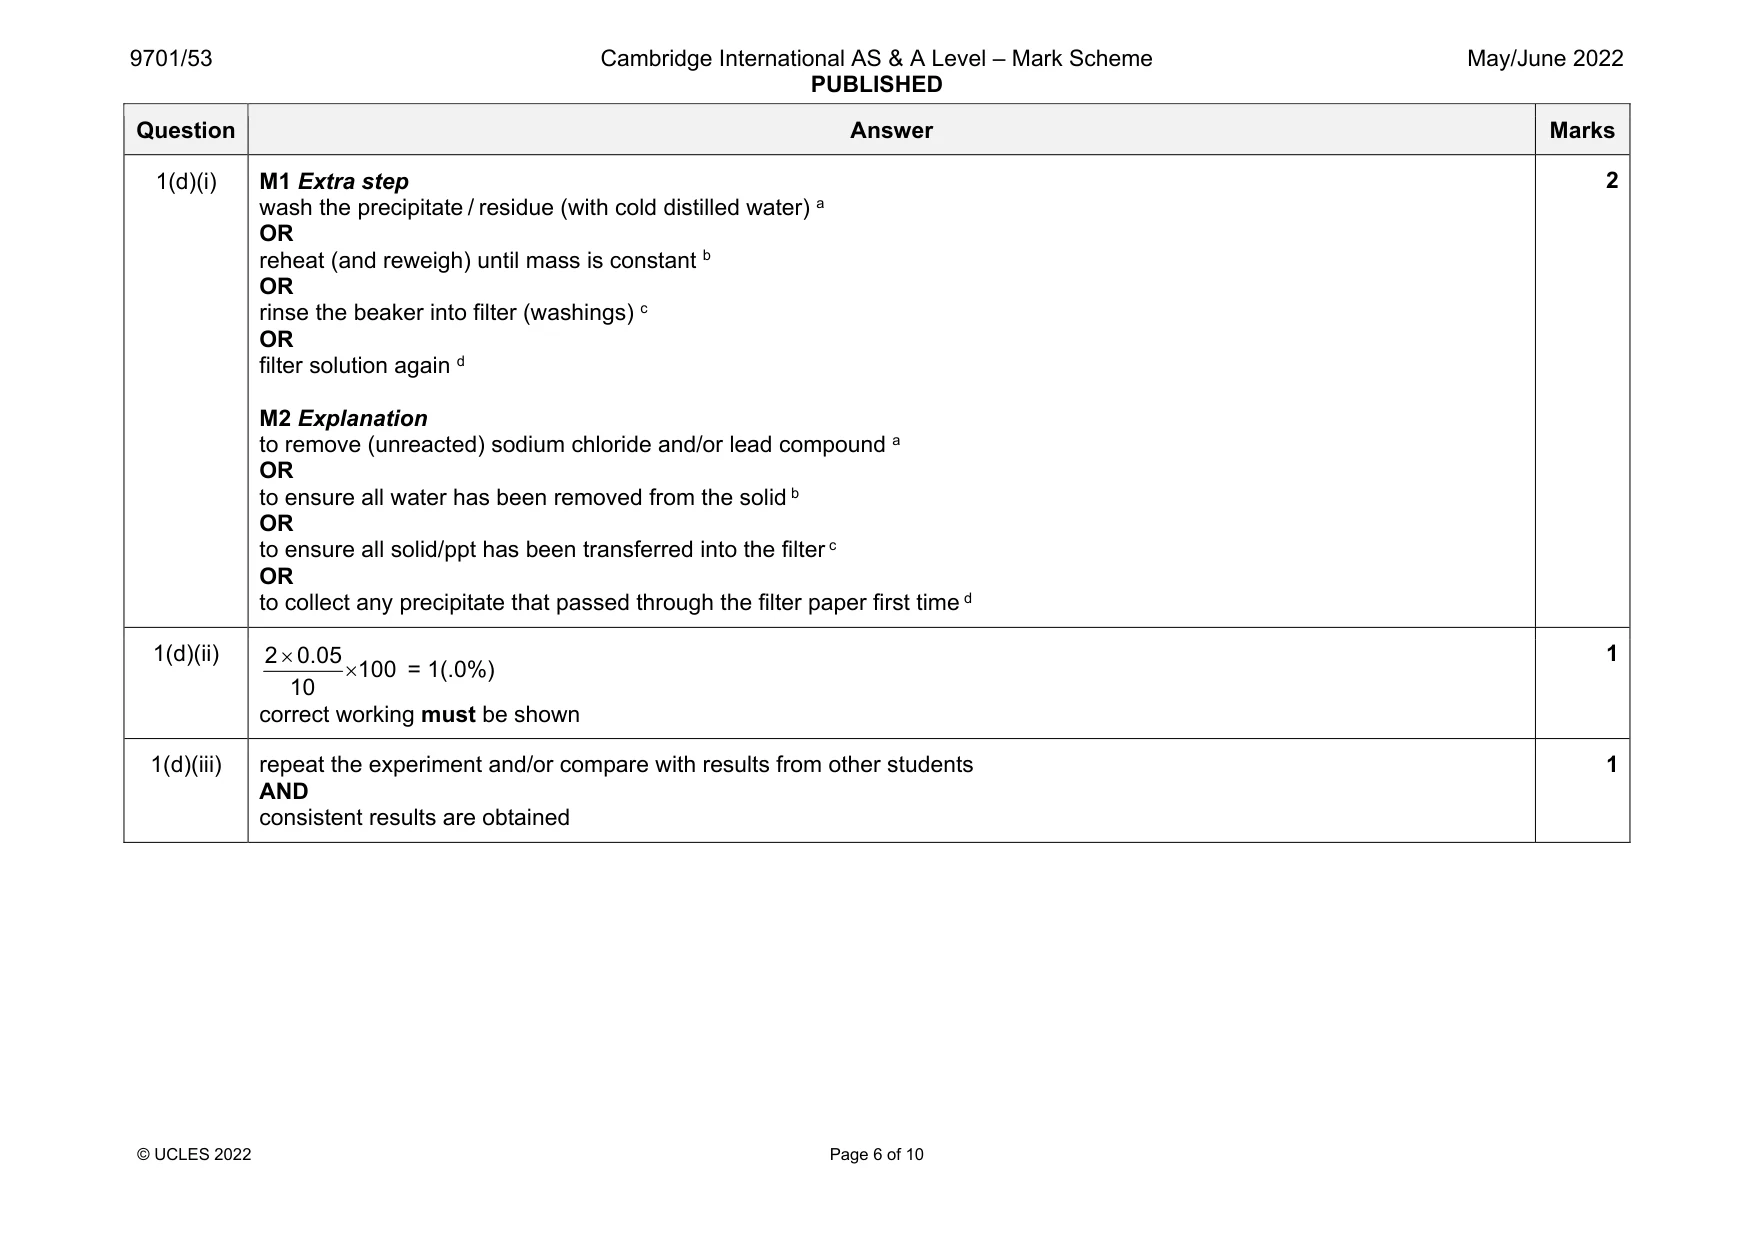
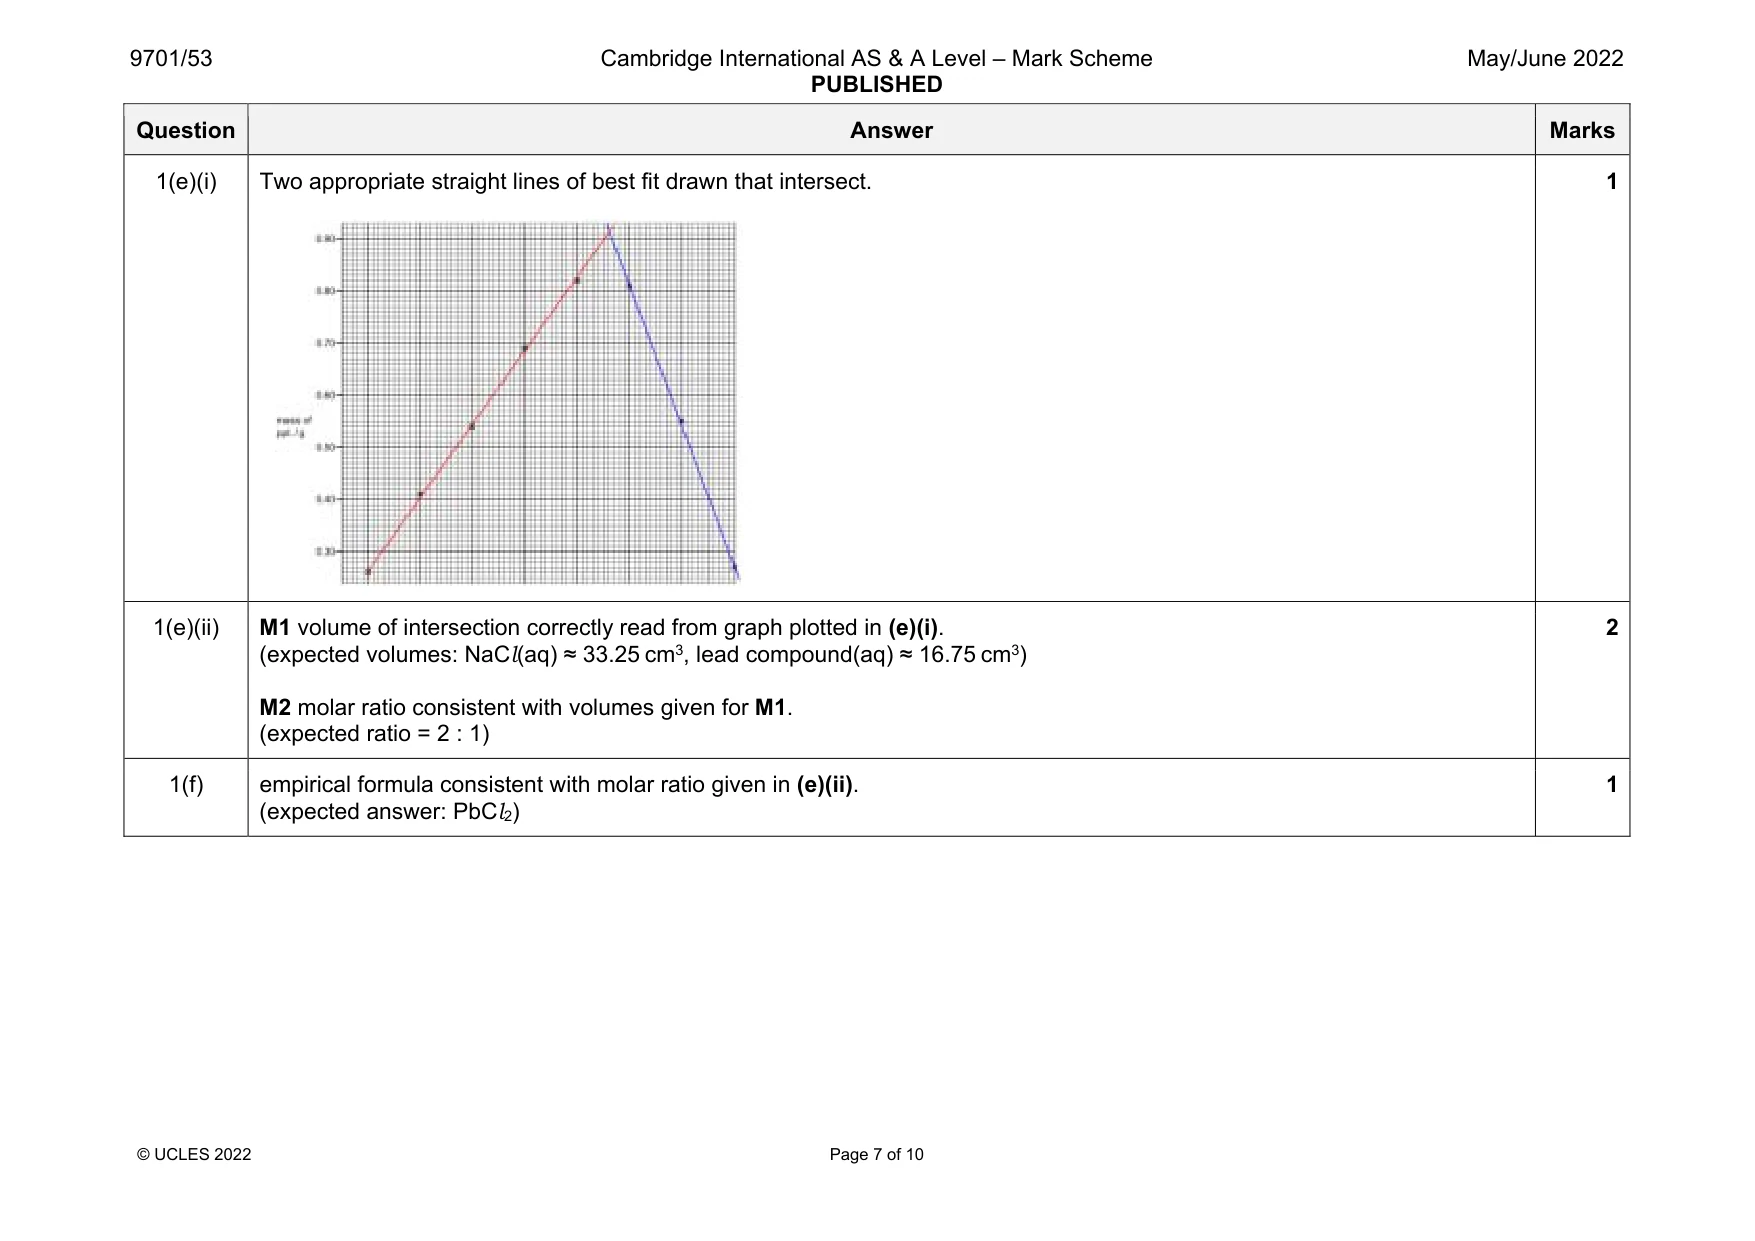
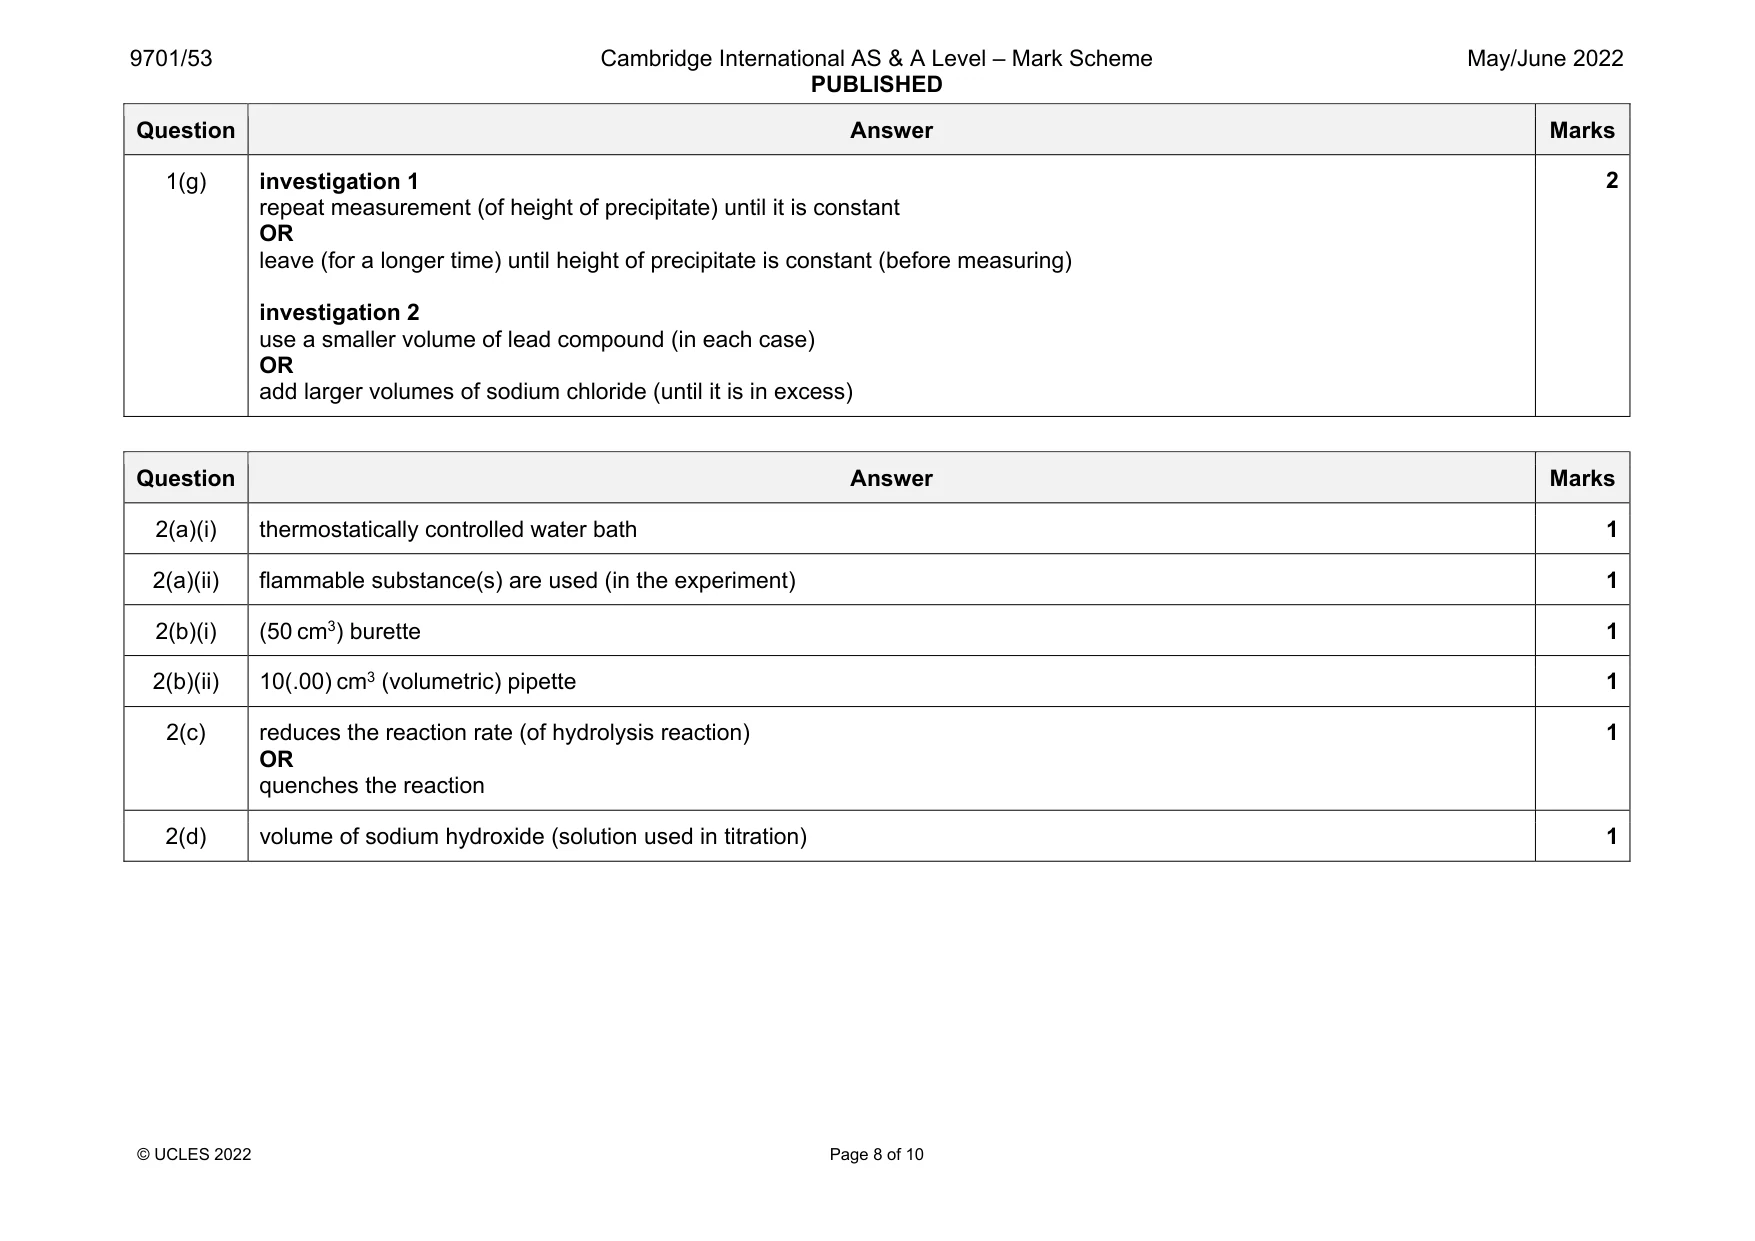
Mark scheme: 1(a) number of moles NaCl = 250.0 1000 0.200 = 0.05(00) mass of sodium chloride = 0.05(00) (23.0 + 35.5) = 2.925 g 1 1(b) (measure mass of weighing boat containing sodium chloride before transfer, then) measure the mass of weighing boat (and residue) (after transfer). 1 1(c) M1 add a (small) volume of distilled water (to the small beaker) AND dissolve the sodium chloride M2 transfer the solution and washings into a 250 cm3 volumetric flask AND make up to the mark with distilled water 2 Question Answer Marks 1(d)(i) M1 Extra step wash the precipitate / residue (with cold distilled water) a OR reheat (and reweigh) until mass is constant b OR rinse the beaker into filter (washings) c OR filter solution again d M2 Explanation to remove (unreacted) sodium chloride and/or lead compound a OR to ensure all water has been removed from the solid b OR to ensure all solid/ppt has been transferred into the filter c OR to collect any precipitate that passed through the filter paper first time d 2 1(d)(ii) 2 0.05 100 10 = 1(.0%) correct working must be shown 1 1(d)(iii) repeat the experiment and/or compare with results from other students AND consistent results are obtained 1 Question Answer Marks 1(e)(i) Two appropriate straight lines of best fit drawn that intersect. 1 1(e)(ii) M1 volume of intersection correctly read from graph plotted in (e)(i). (expected volumes: NaCl(aq) ≈ 33.25 cm3, lead compound(aq) ≈ 16.75 cm3) M2 molar ratio consistent with volumes given for M1. (expected ratio = 2 : 1) 2 1(f) empirical formula consistent with molar ratio given in (e)(ii). (expected answer: PbCl2) 1 Question Answer Marks 1(g) investigation 1 repeat measurement (of height of precipitate) until it is constant OR leave (for a longer time) until height of precipitate is constant (before measuring) investigation 2 use a smaller volume of lead compound (in each case) OR add larger volumes of sodium chloride (until it is in excess) 2
More questions on Reacting masses and volumes (of solutions and gases)
Q2 · A student plans to study the rate of hydrolysis of 2-bromo-2-methylpropane
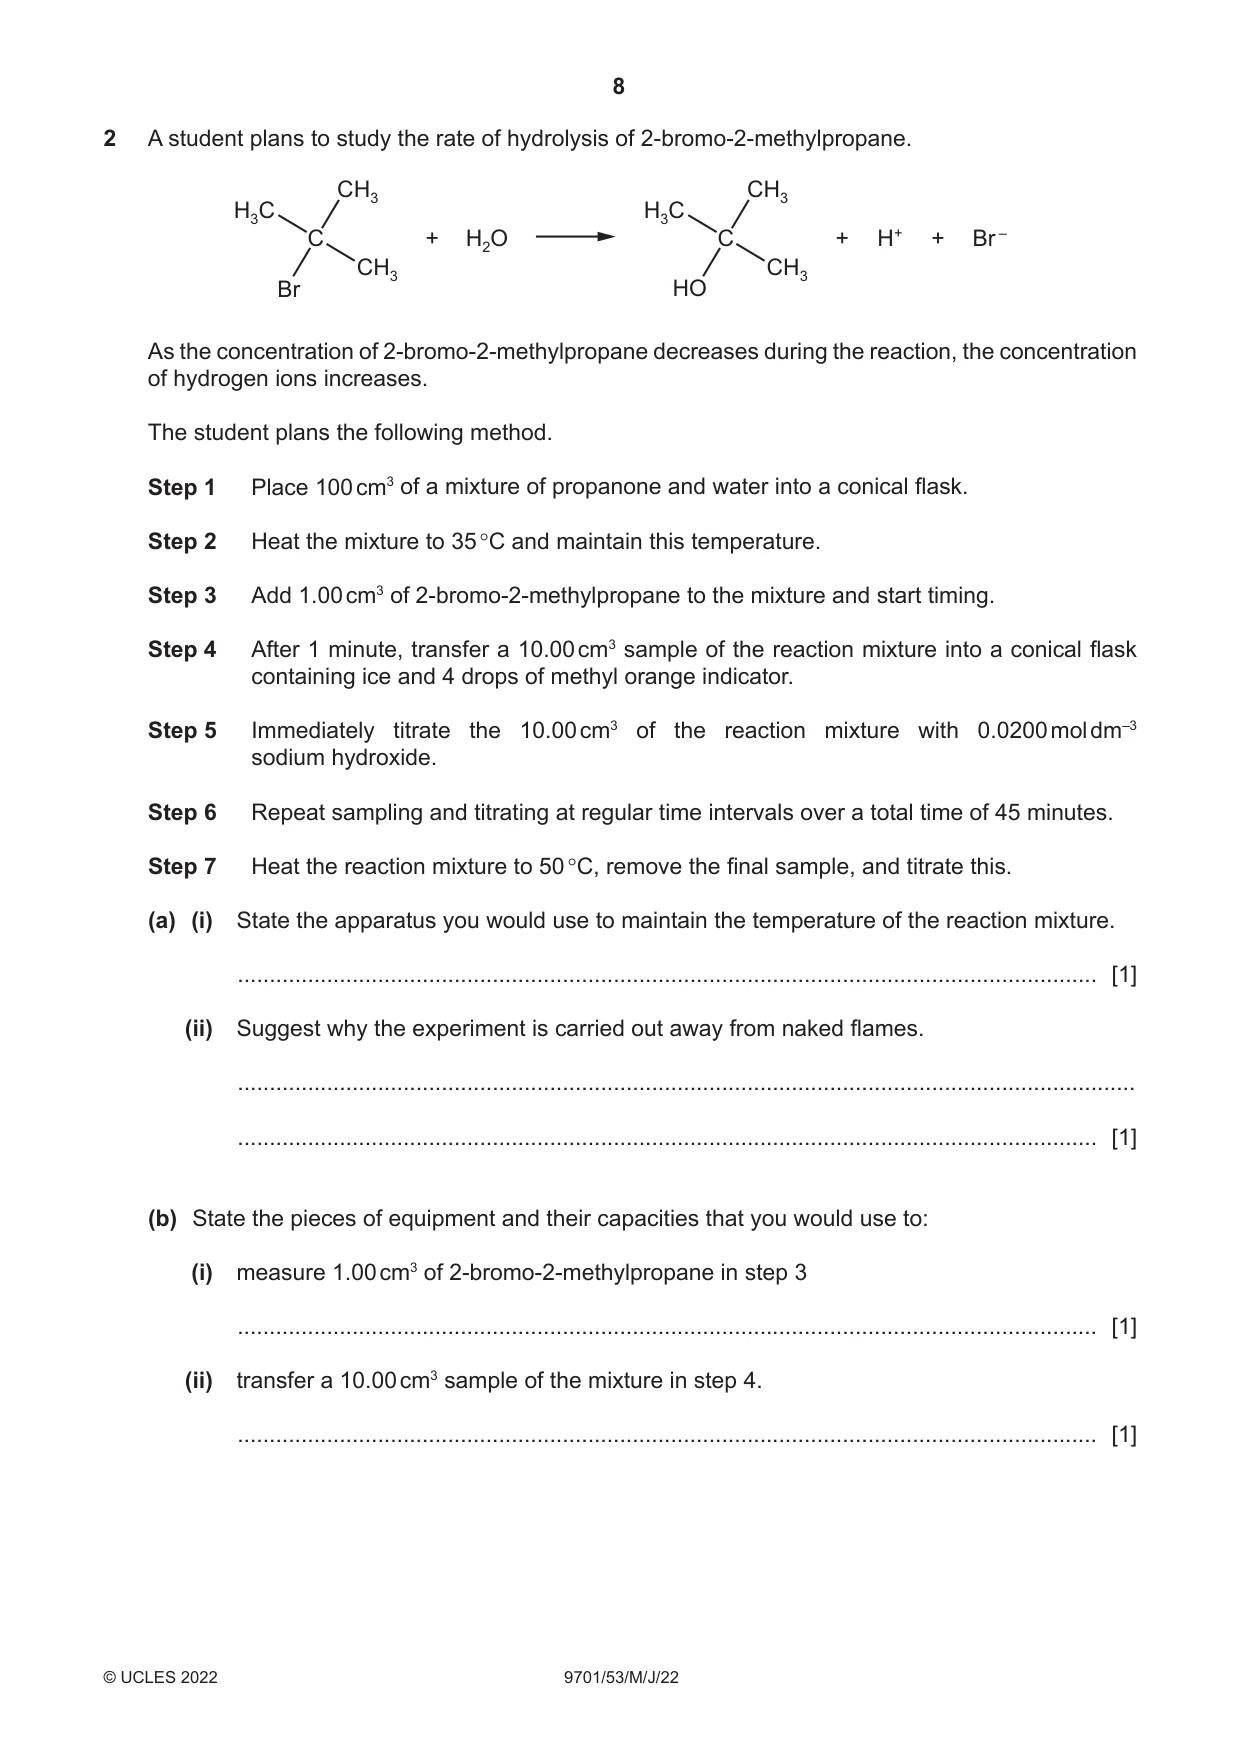
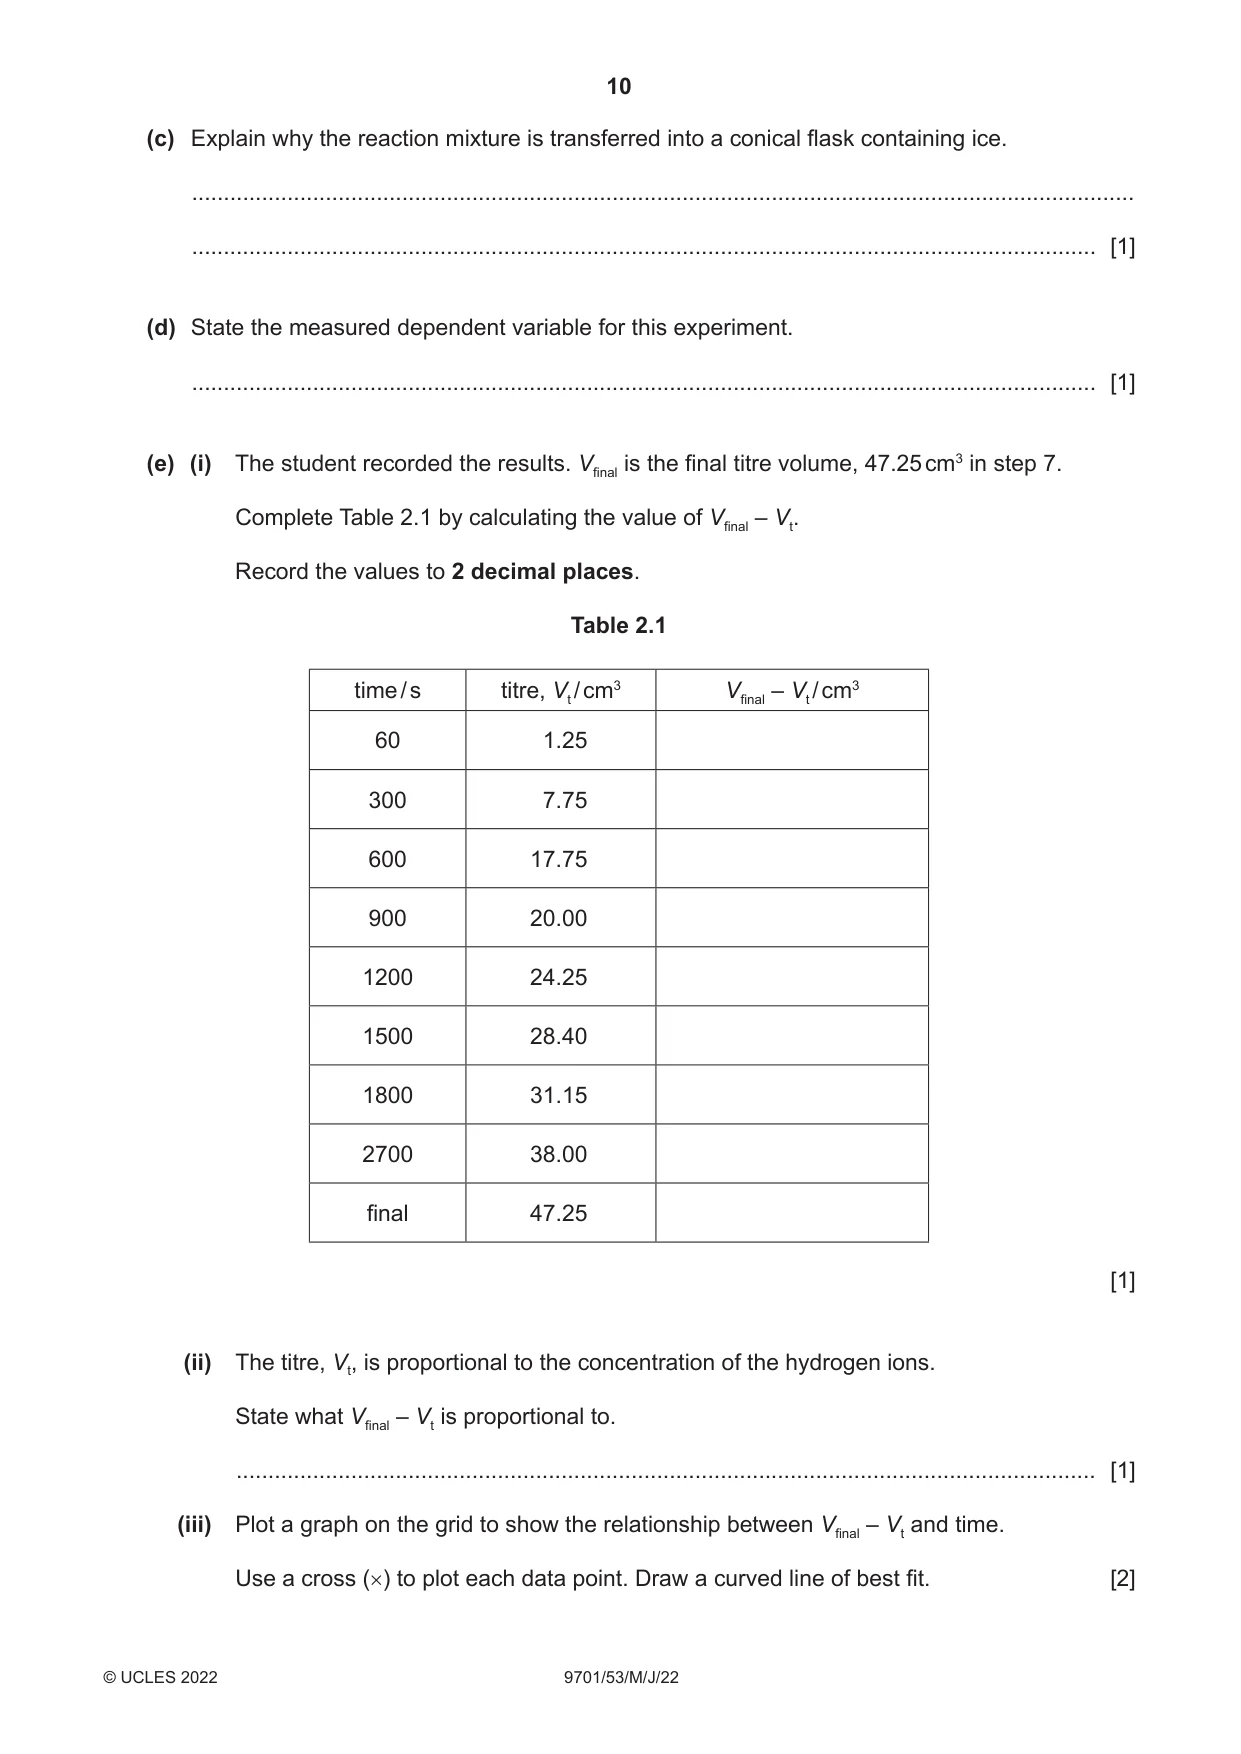
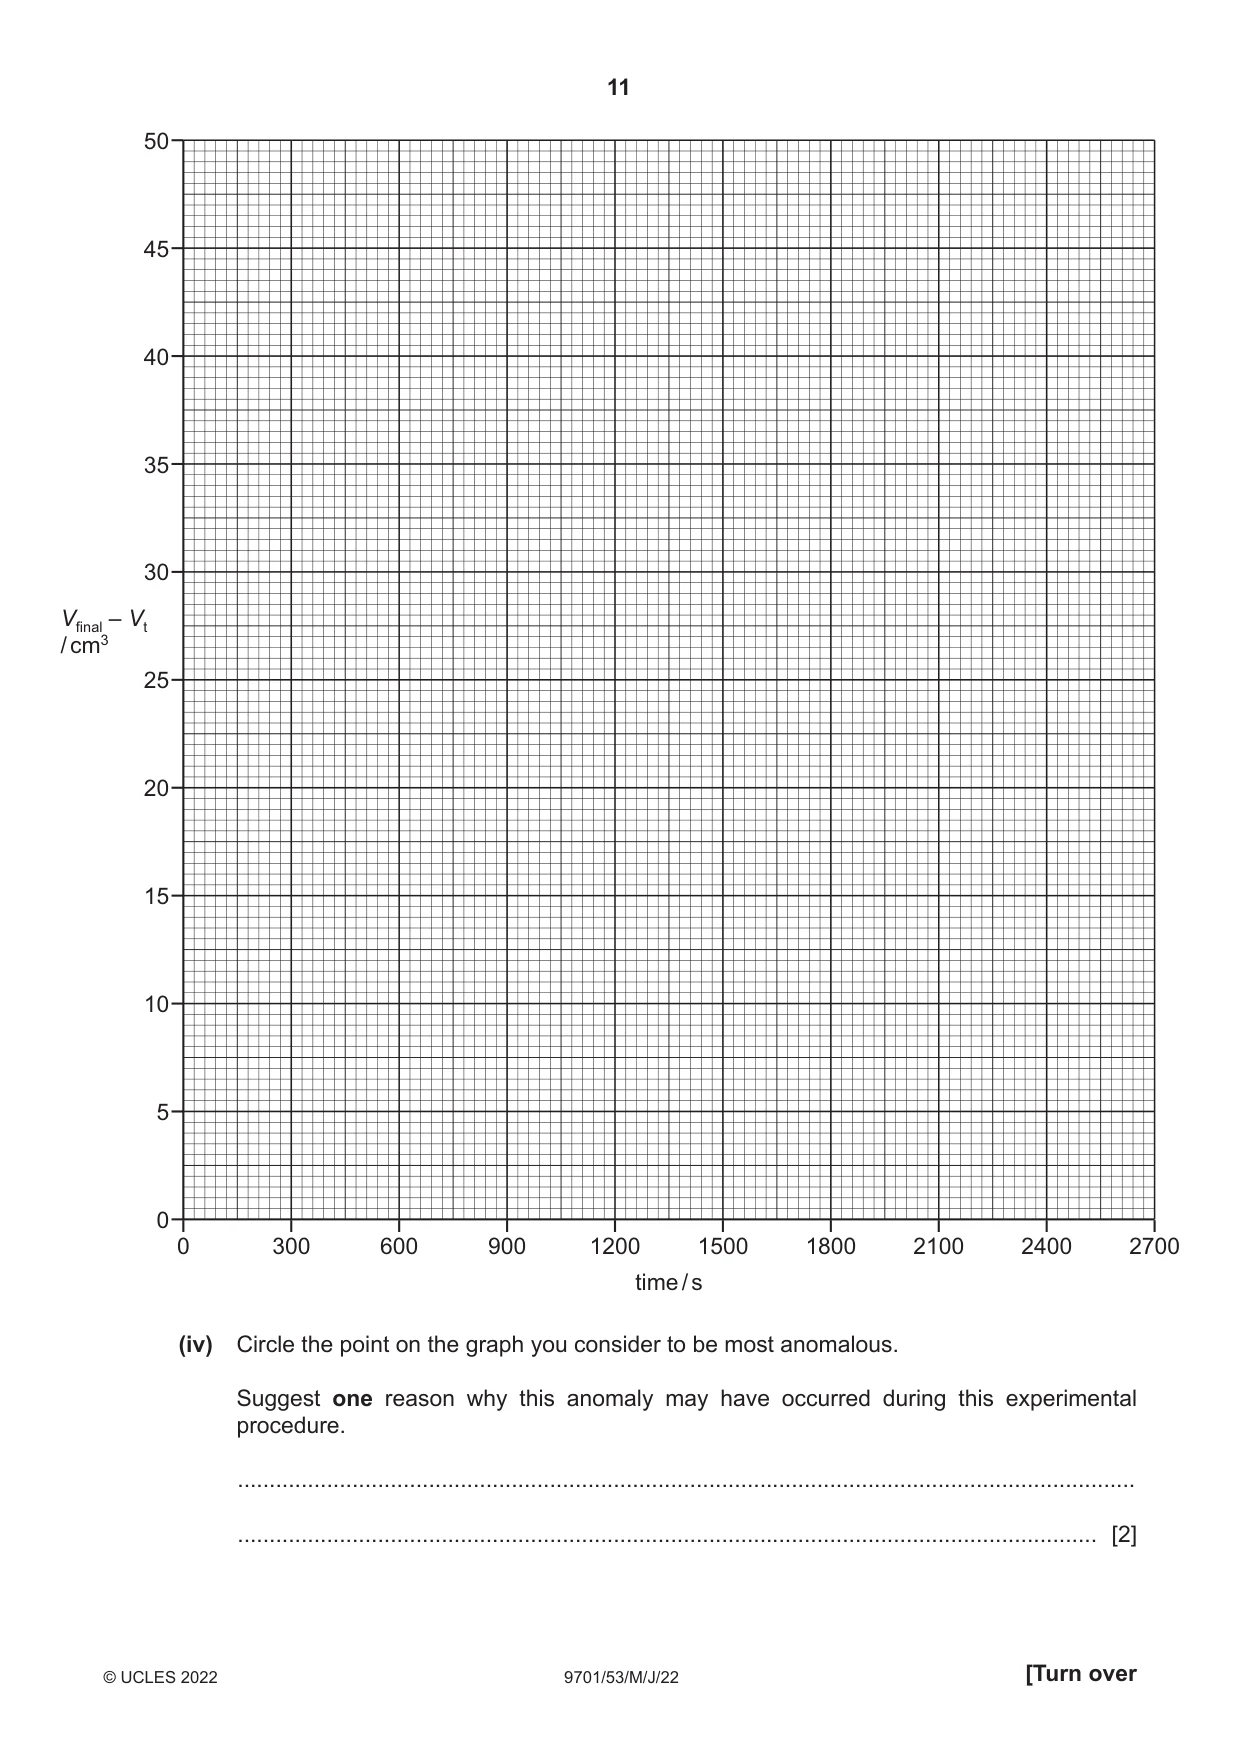
2 A student plans to study the rate of hydrolysis of 2-bromo-2-methylpropane. CH3 CH3 H3C H3C C + H2O C + H+ + Br – CH3 CH3 Br HO As the concentration of 2‑bromo‑2‑methylpropane decreases during the reaction, the concentration of hydrogen ions increases. The student plans the following method. Step 1 Place 100 cm3 of a mixture of propanone and water into a conical flask. Step 2 Heat the mixture to 35 °C and maintain this temperature. Step 3 Add 1.00 cm3 of 2‑bromo‑2‑methylpropane to the mixture and start timing. Step 4 After 1 minute, transfer a 10.00 cm3 sample of the reaction mixture into a conical flask containing ice and 4 drops of methyl orange indicator. Step 5 Immediately titrate the 10.00 cm3 of the reaction mixture with 0.0200 mol dm–3 sodium hydroxide. Step 6 Repeat sampling and titrating at regular time intervals over a total time of 45 minutes. Step 7 Heat the reaction mixture to 50 °C, remove the final sample, and titrate this. (a) (i) State the apparatus you would use to maintain the temperature of the reaction mixture. ....................................................................................................................................... [1] (ii) Suggest why the experiment is carried out away from naked flames. ............................................................................................................................................. ....................................................................................................................................... [1] (b) State the pieces of equipment and their capacities that you would use to: (i) measure 1.00 cm3 of 2‑bromo‑2‑methylpropane in step 3 ....................................................................................................................................... [1] (ii) transfer a 10.00 cm3 sample of the mixture in step 4. ....................................................................................................................................... [1] Question 2 continues on the next page. (c) Explain why the reaction mixture is transferred into a conical flask containing ice. .................................................................................................................................................... .............................................................................................................................................. [1] (d) State the measured dependent variable for this experiment. .............................................................................................................................................. [1] (e) (i) The student recorded the results. Vfinal is the final titre volume, 47.25 cm3 in step 7. Complete Table 2.1 by calculating the value of Vfinal – Vt. Record the values to 2 decimal places. Table 2.1 time / s titre, Vt / cm3 Vfinal – Vt / cm3 60 1.25 300 7.75 600 17.75 900 20.00 1200 24.25 1500 28.40 1800 31.15 2700 38.00 final 47.25 [1] (ii) The titre, Vt, is proportional to the concentration of the hydrogen ions. State what Vfinal – Vt is proportional to. ....................................................................................................................................... [1] (iii) Plot a graph on the grid to show the relationship between Vfinal – Vt and time. Use a cross (×) to plot each data point. Draw a curved line of best fit. [2]
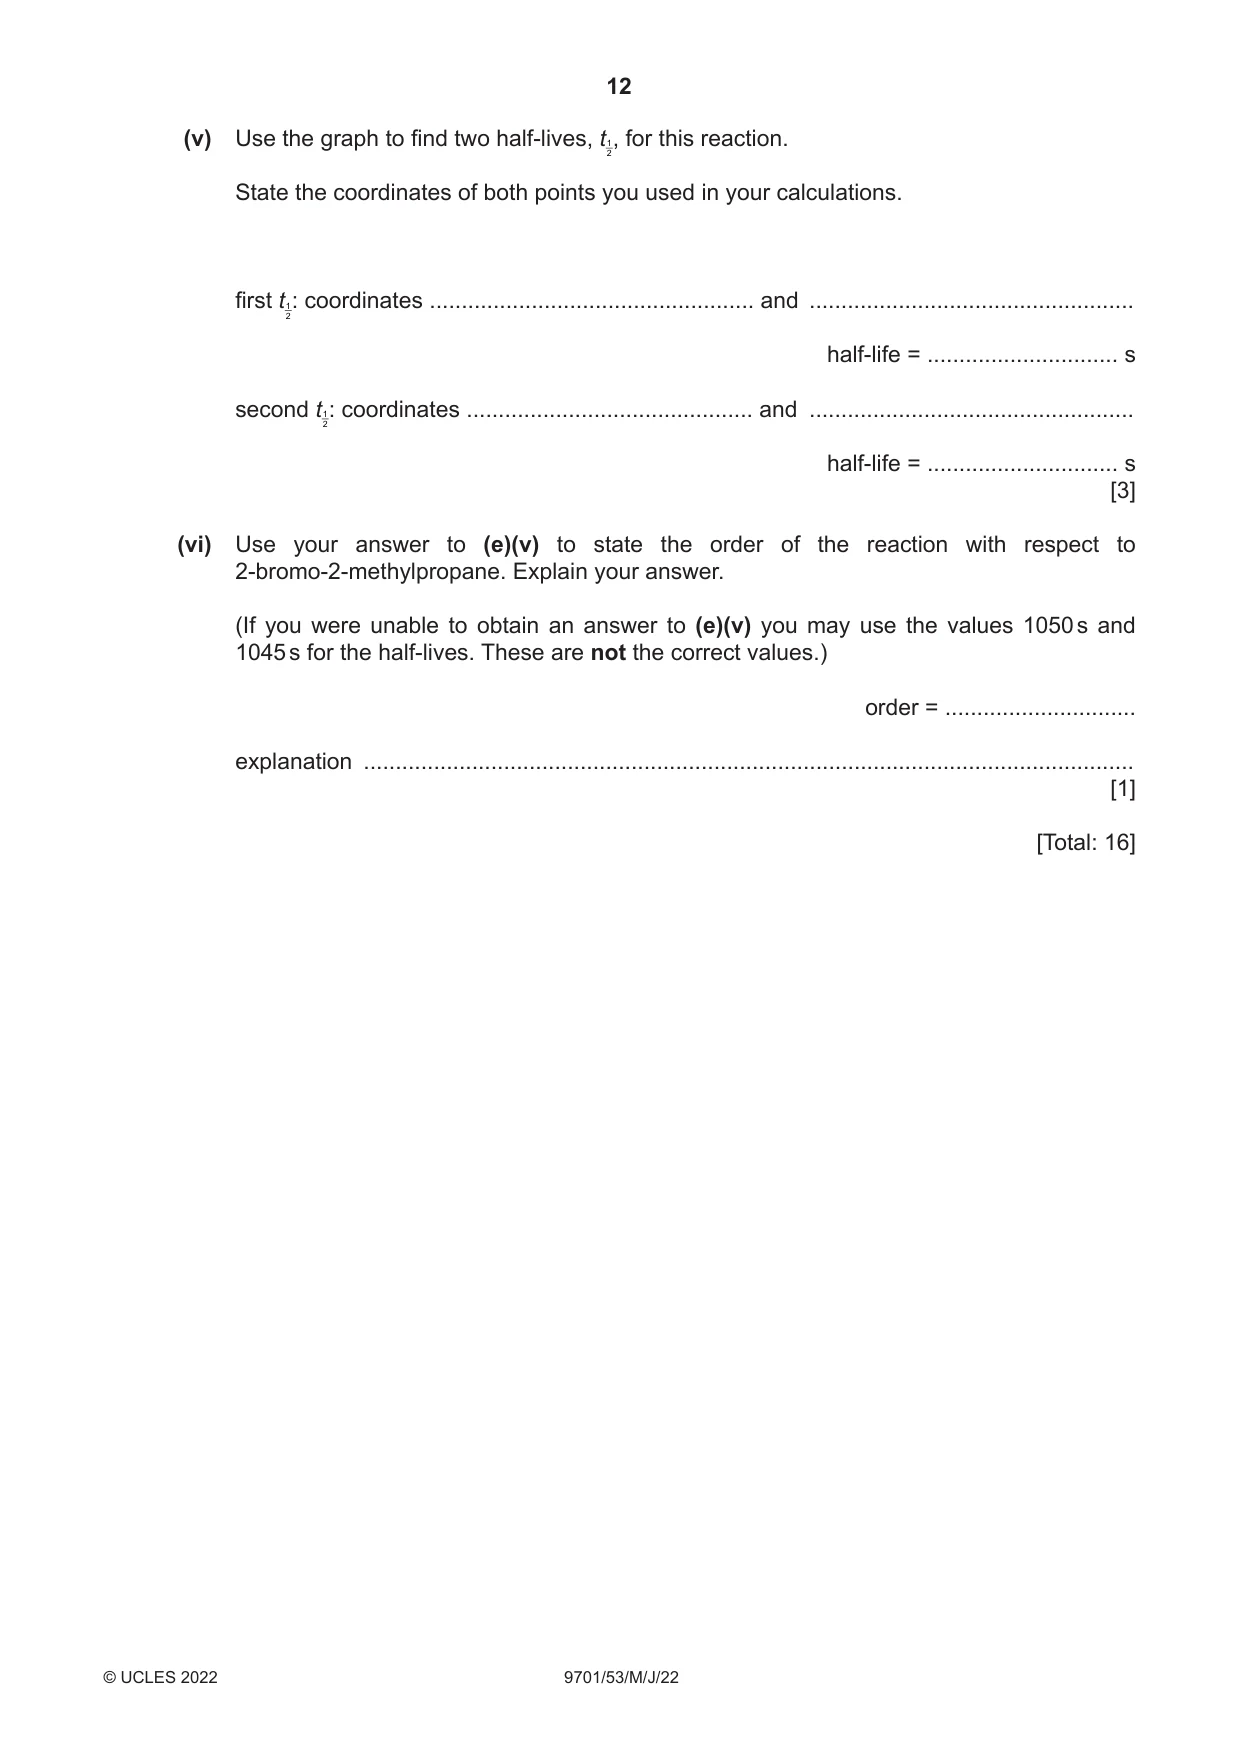
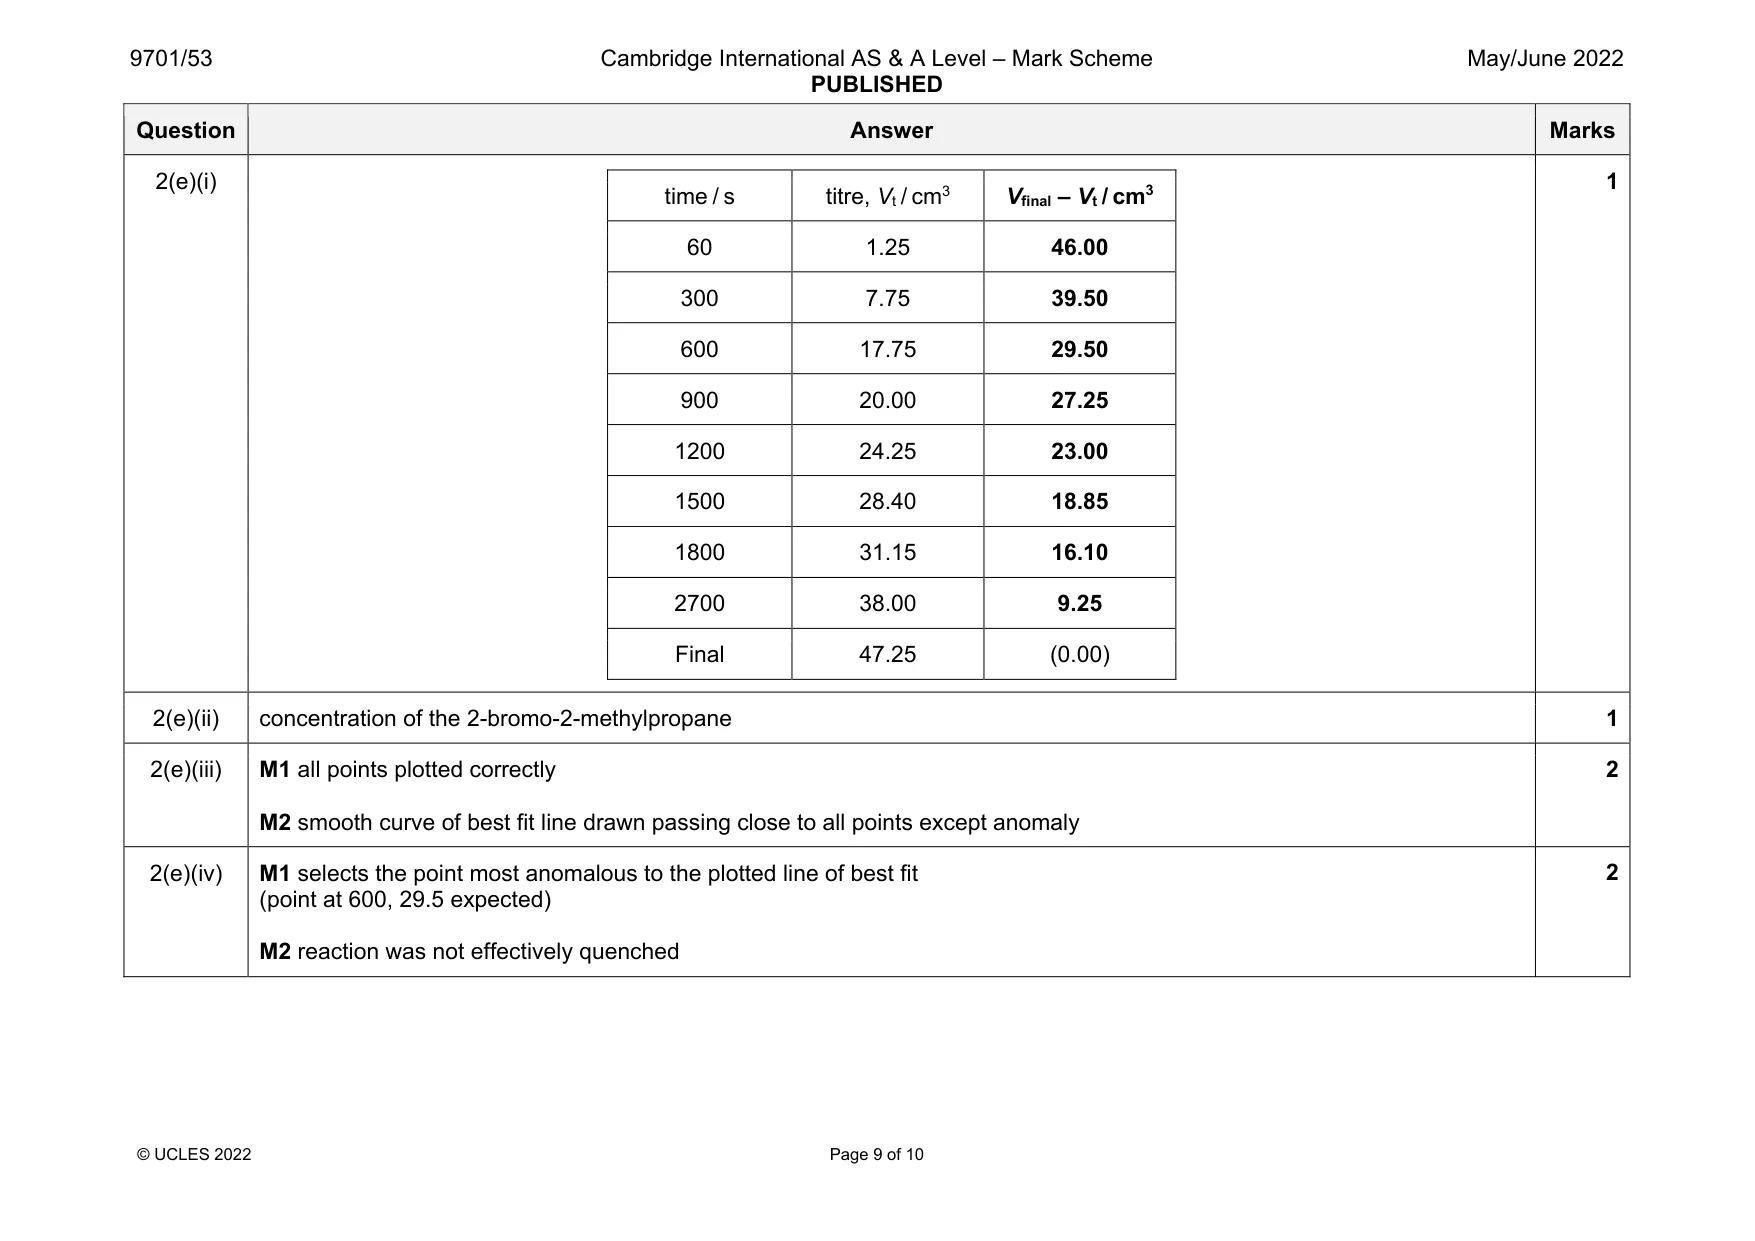
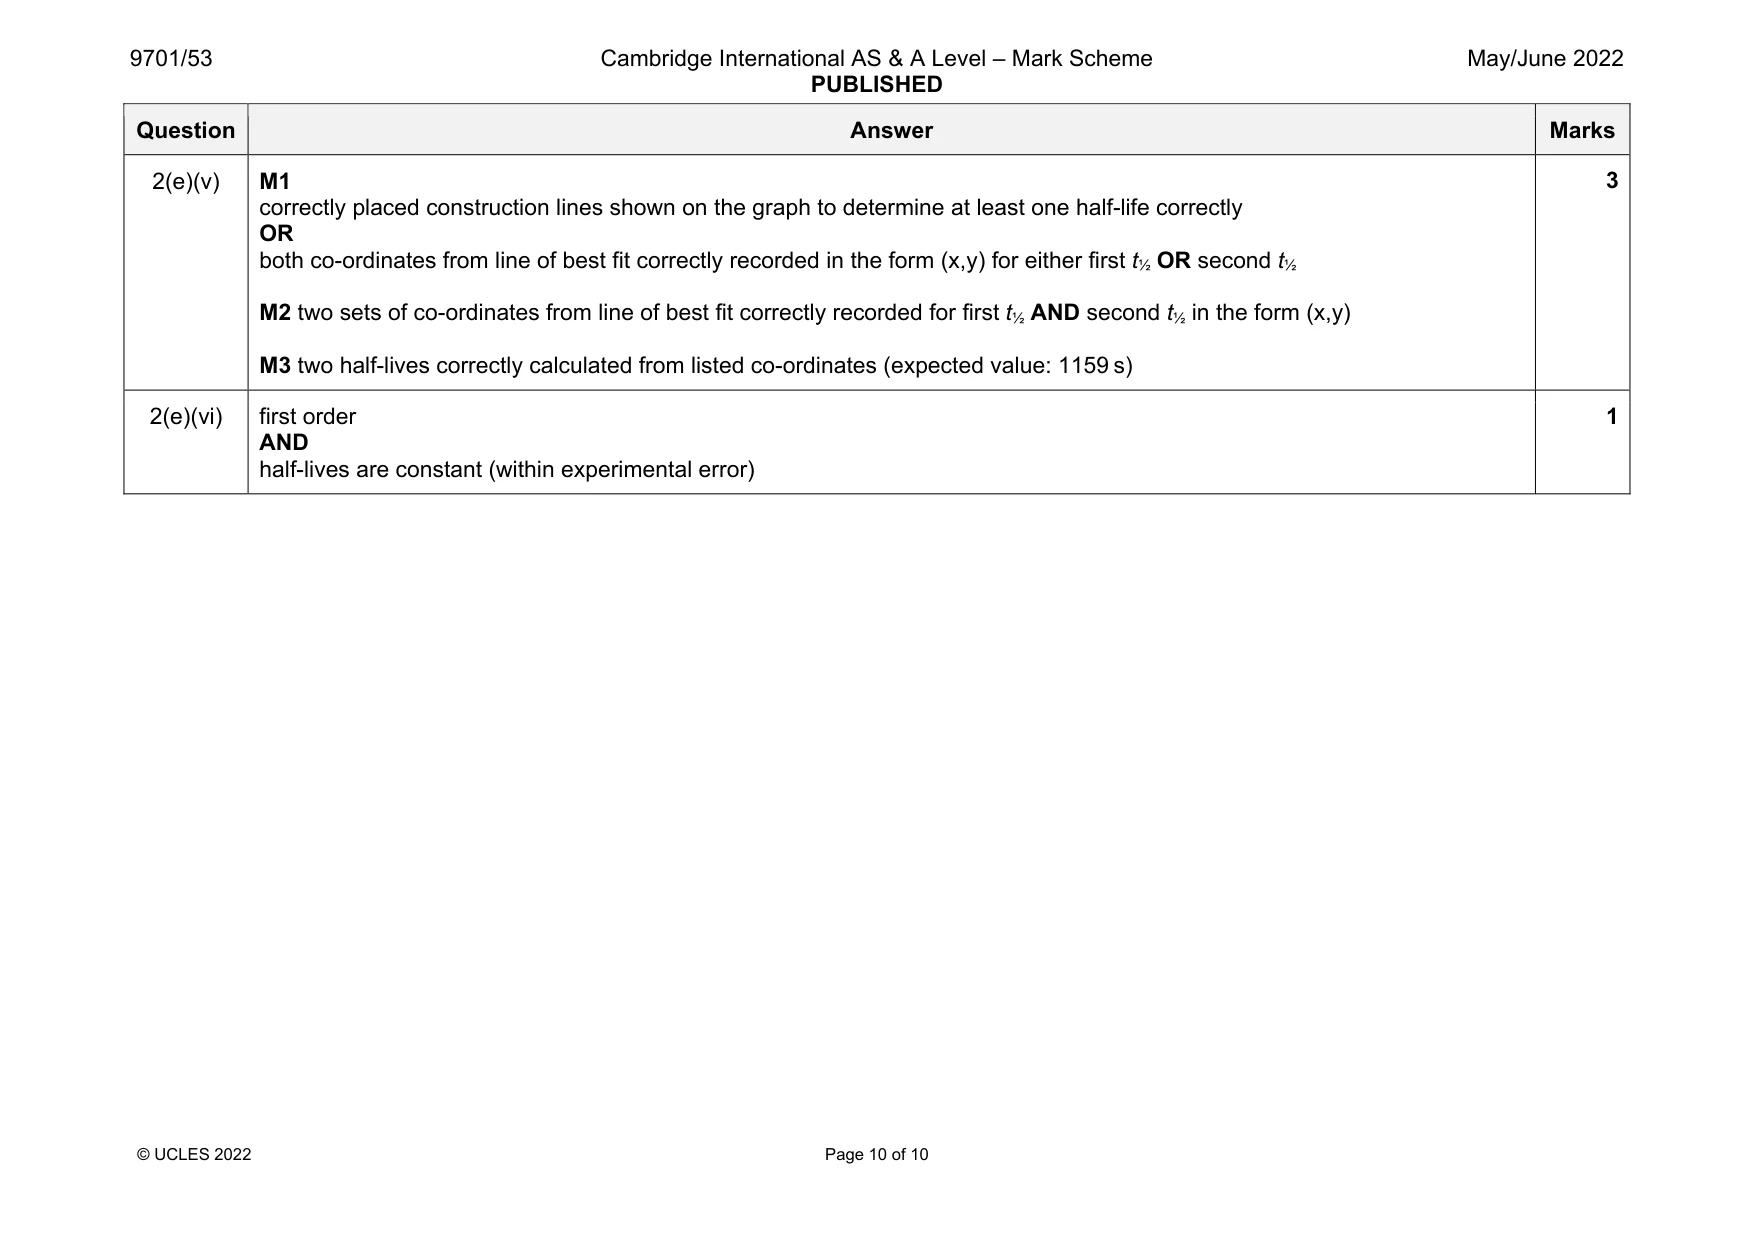
Mark scheme: 2(a)(i) thermostatically controlled water bath 1 2(a)(ii) flammable substance(s) are used (in the experiment) 1 2(b)(i) (50 cm3) burette 1 2(b)(ii) 10(.00) cm3 (volumetric) pipette 1 2(c) reduces the reaction rate (of hydrolysis reaction) OR quenches the reaction 1 2(d) volume of sodium hydroxide (solution used in titration) 1 Question Answer Marks 2(e)(i) time / s titre, Vt / cm3 Vfinal – Vt / cm3 60 1.25 46.00 300 7.75 39.50 600 17.75 29.50 900 20.00 27.25 1200 24.25 23.00 1500 28.40 18.85 1800 31.15 16.10 2700 38.00 9.25 Final 47.25 (0.00) 1 2(e)(ii) concentration of the 2-bromo-2-methylpropane 1 2(e)(iii) M1 all points plotted correctly M2 smooth curve of best fit line drawn passing close to all points except anomaly 2 2(e)(iv) M1 selects the point most anomalous to the plotted line of best fit (point at 600, 29.5 expected) M2 reaction was not effectively quenched 2 Question Answer Marks 2(e)(v) M1 correctly placed construction lines shown on the graph to determine at least one half-life correctly OR both co-ordinates from line of best fit correctly recorded in the form (x,y) for either first t½ OR second t½ M2 two sets of co-ordinates from line of best fit correctly recorded for first t½ AND second t½ in the form (x,y) M3 two half-lives correctly calculated from listed co-ordinates (expected value: 1159 s) 3 2(e)(vi) first order AND half-lives are constant (within experimental error) 1
What was in this paper
The subtopics covered by these 2 questions, and how many questions each got. Open one in a new tab to see every Cambridge question on it.
What you needed in this session
Cambridge’s own grade thresholds for 2022 May/June, Paper 5 · Variant 3. A higher threshold means an easier paper — the bar moves with how the cohort did.