Cambridge A Level Chemistry 9701 — 2025 Oct/Nov Paper 5 · Variant 2
9701/52/O/N/25 · 2 questions · 30 marks · 75 min
The question paper and its mark scheme, free to read here and free to download. This is Cambridge’s own paper, exactly as it was sat.
Question paper16 pages


Mark scheme11 pages
Answers below. Sit the paper first if you are practising.
Questions as text
Q1 · Aqueous silver ions, Ag+(aq), react slowly with aqueous iron(II) ions, Fe2+(aq)
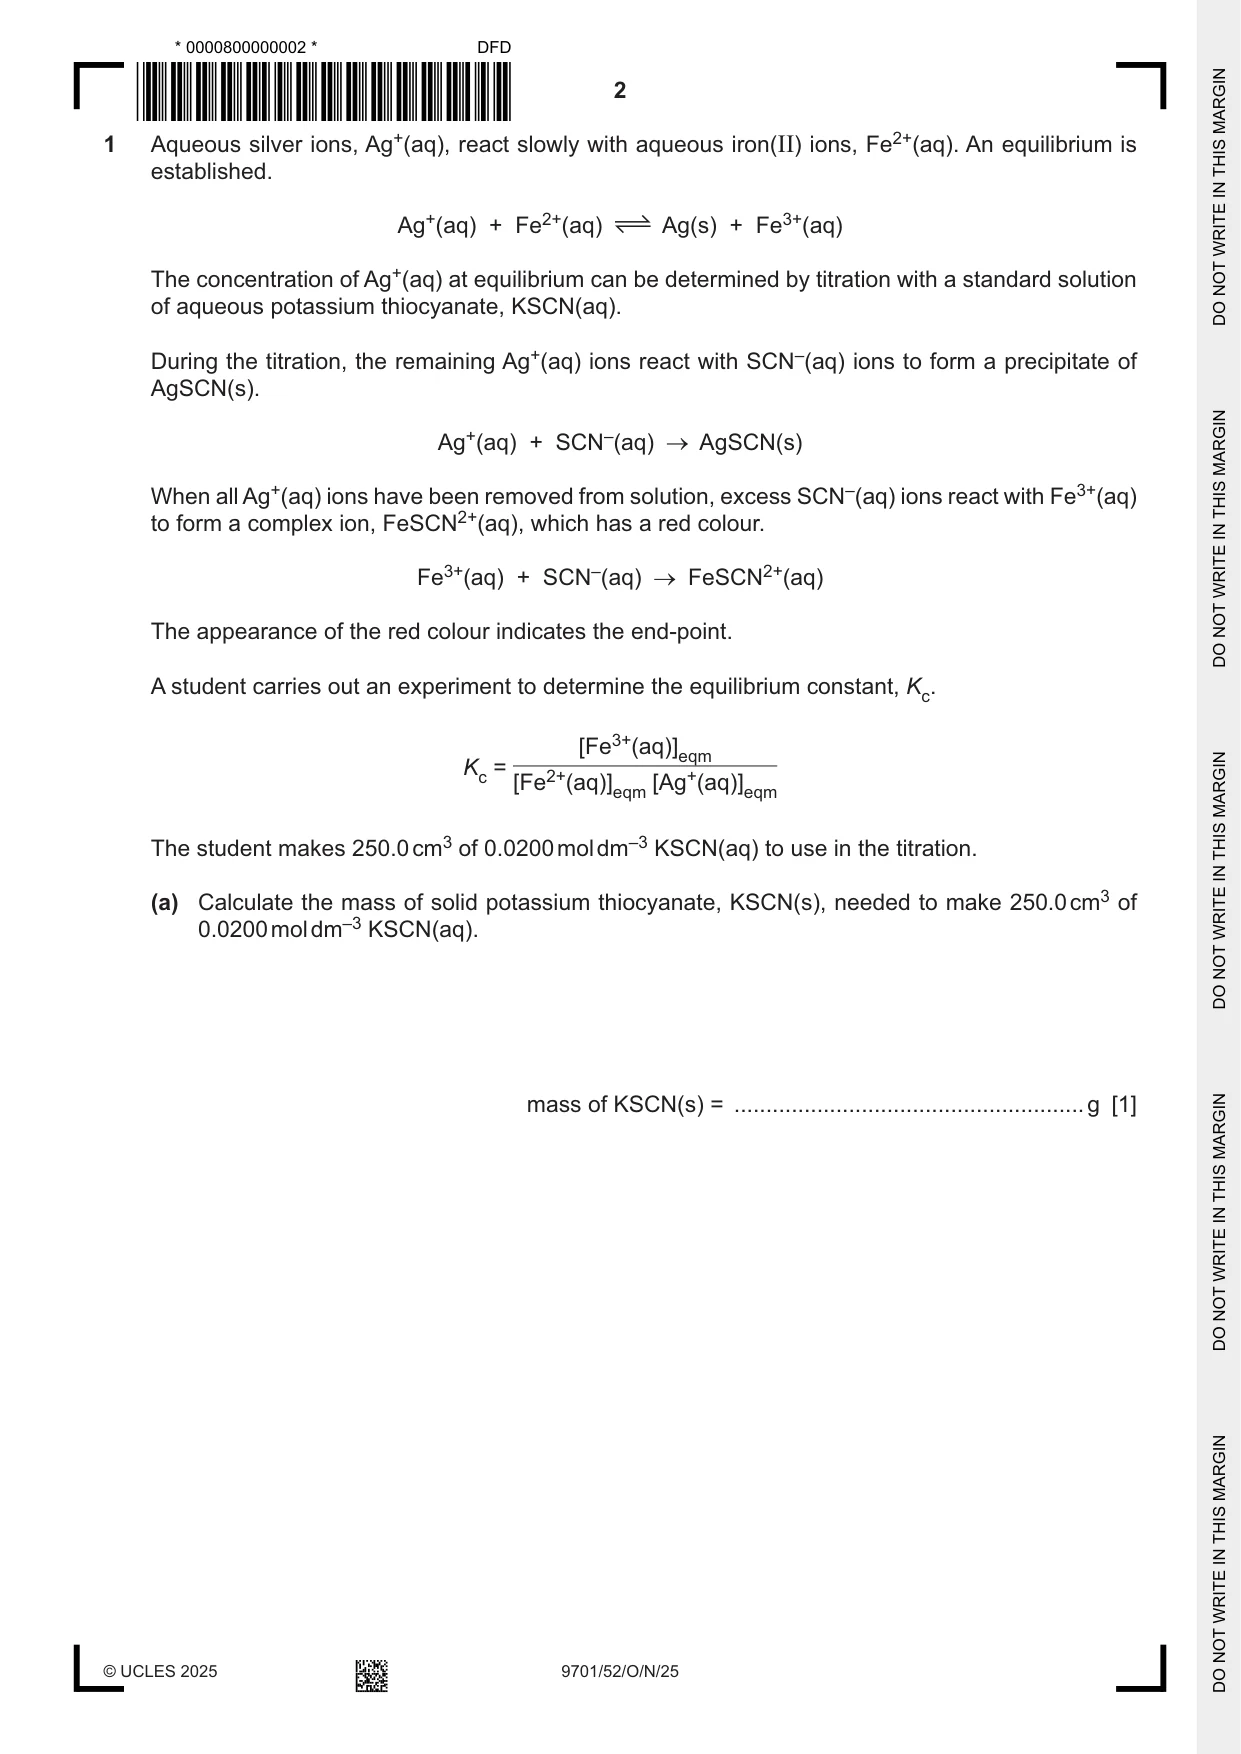
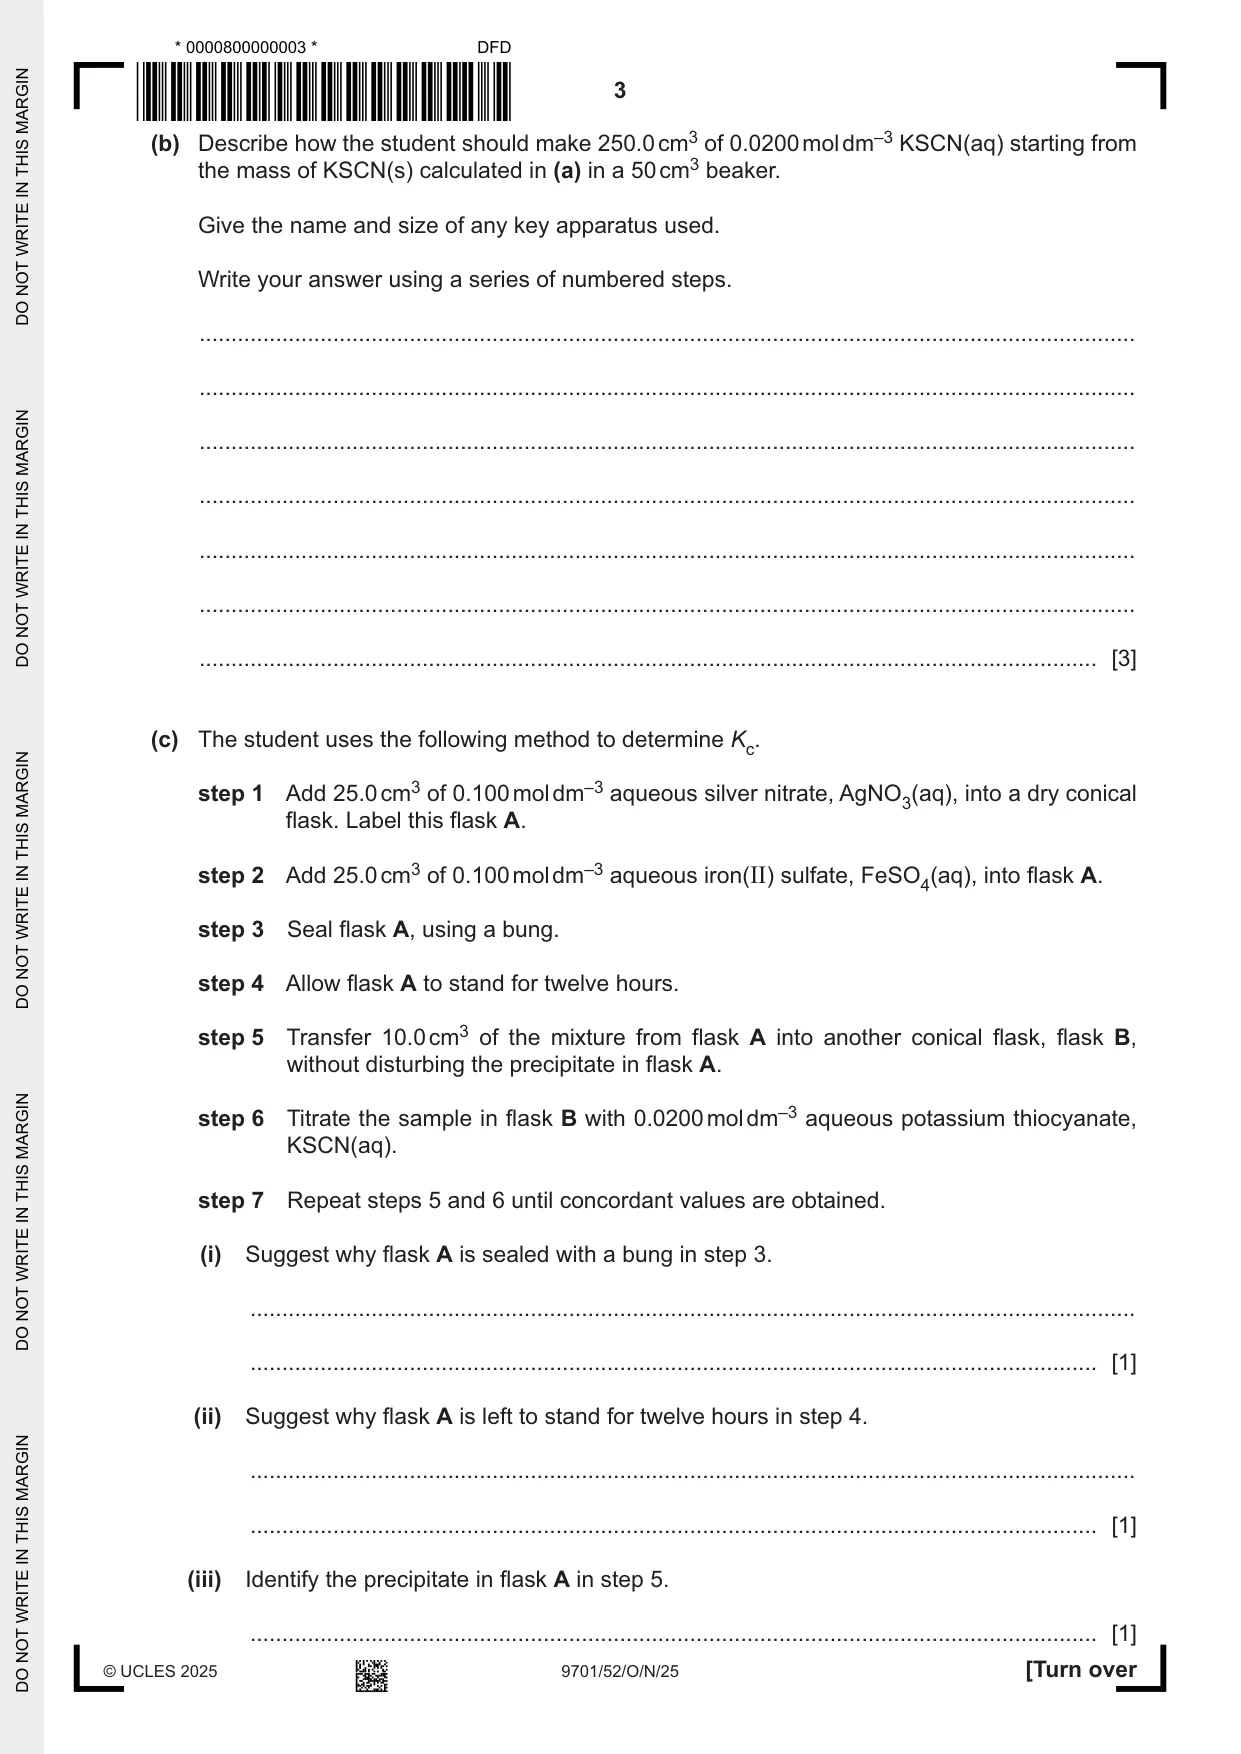
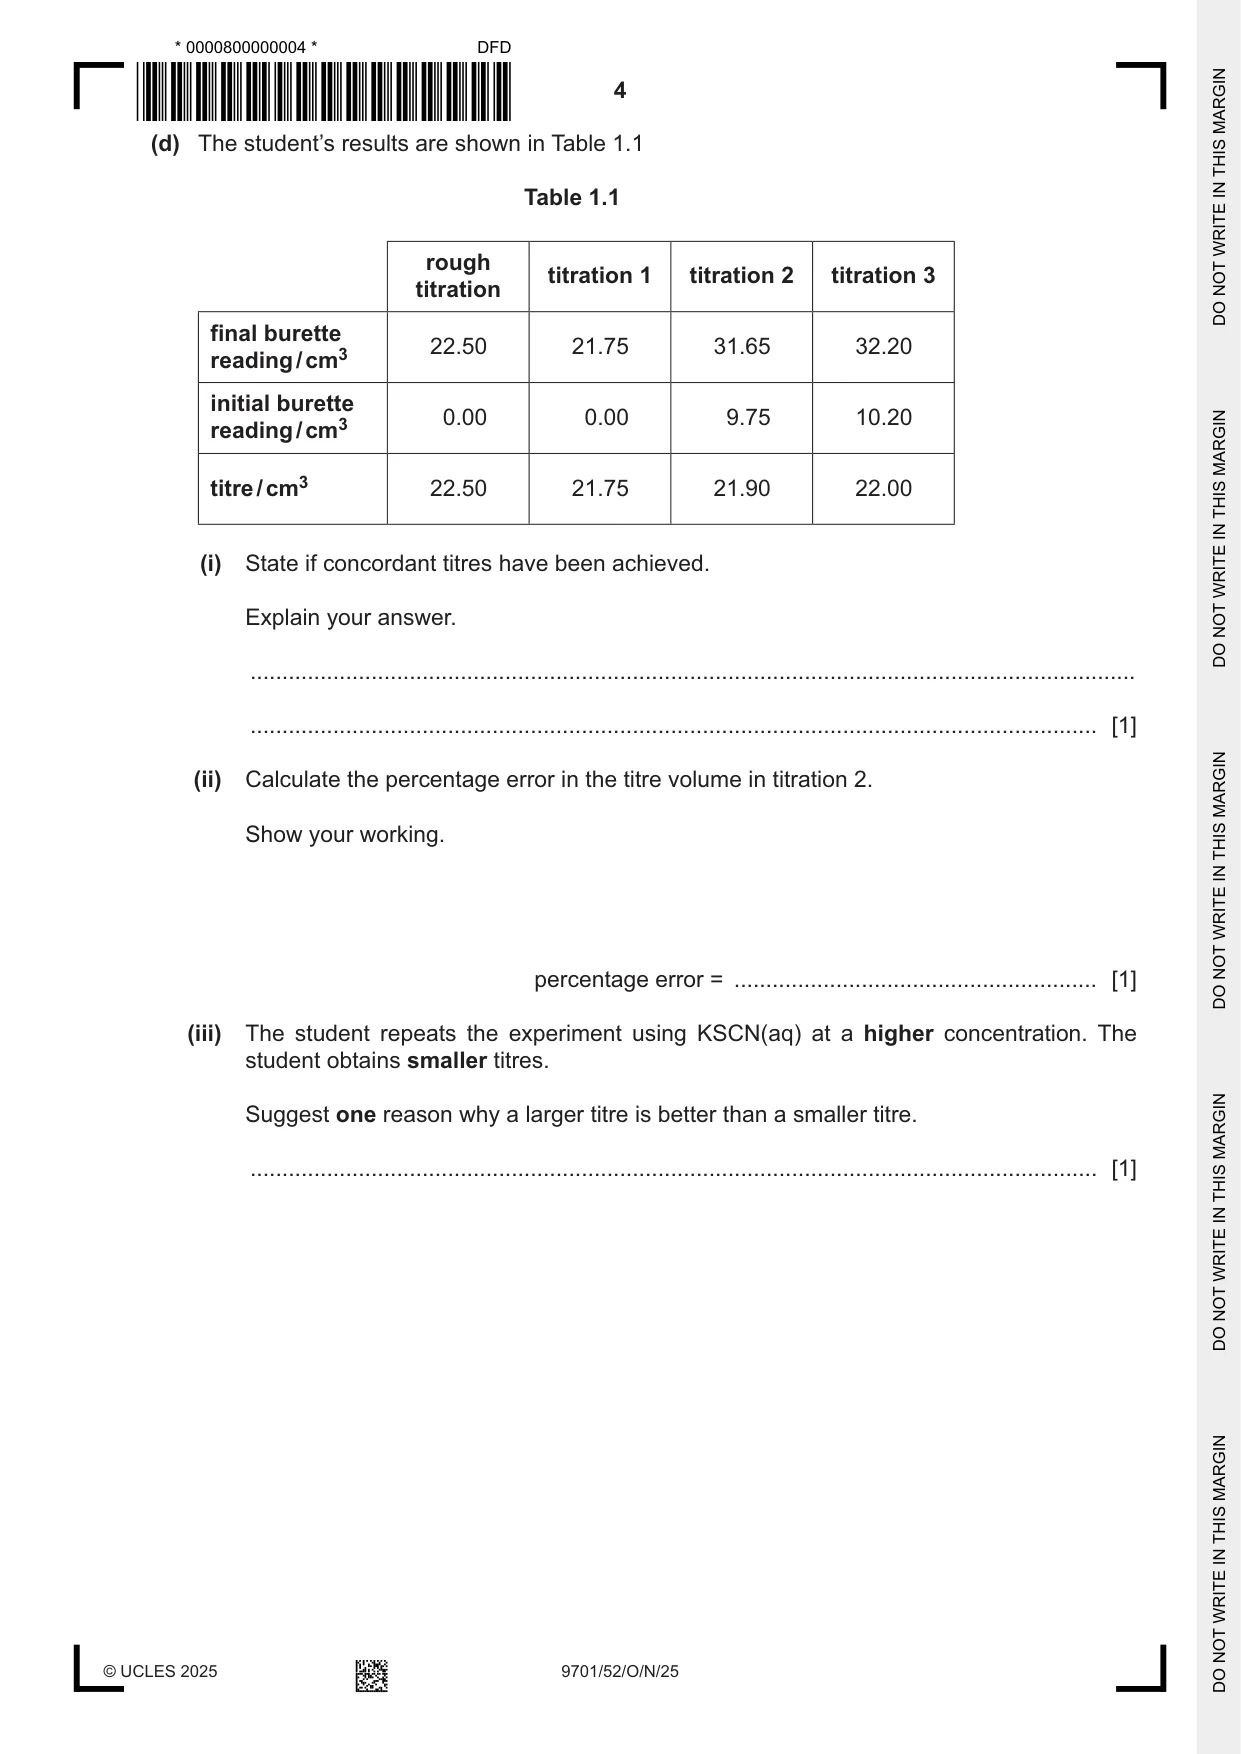
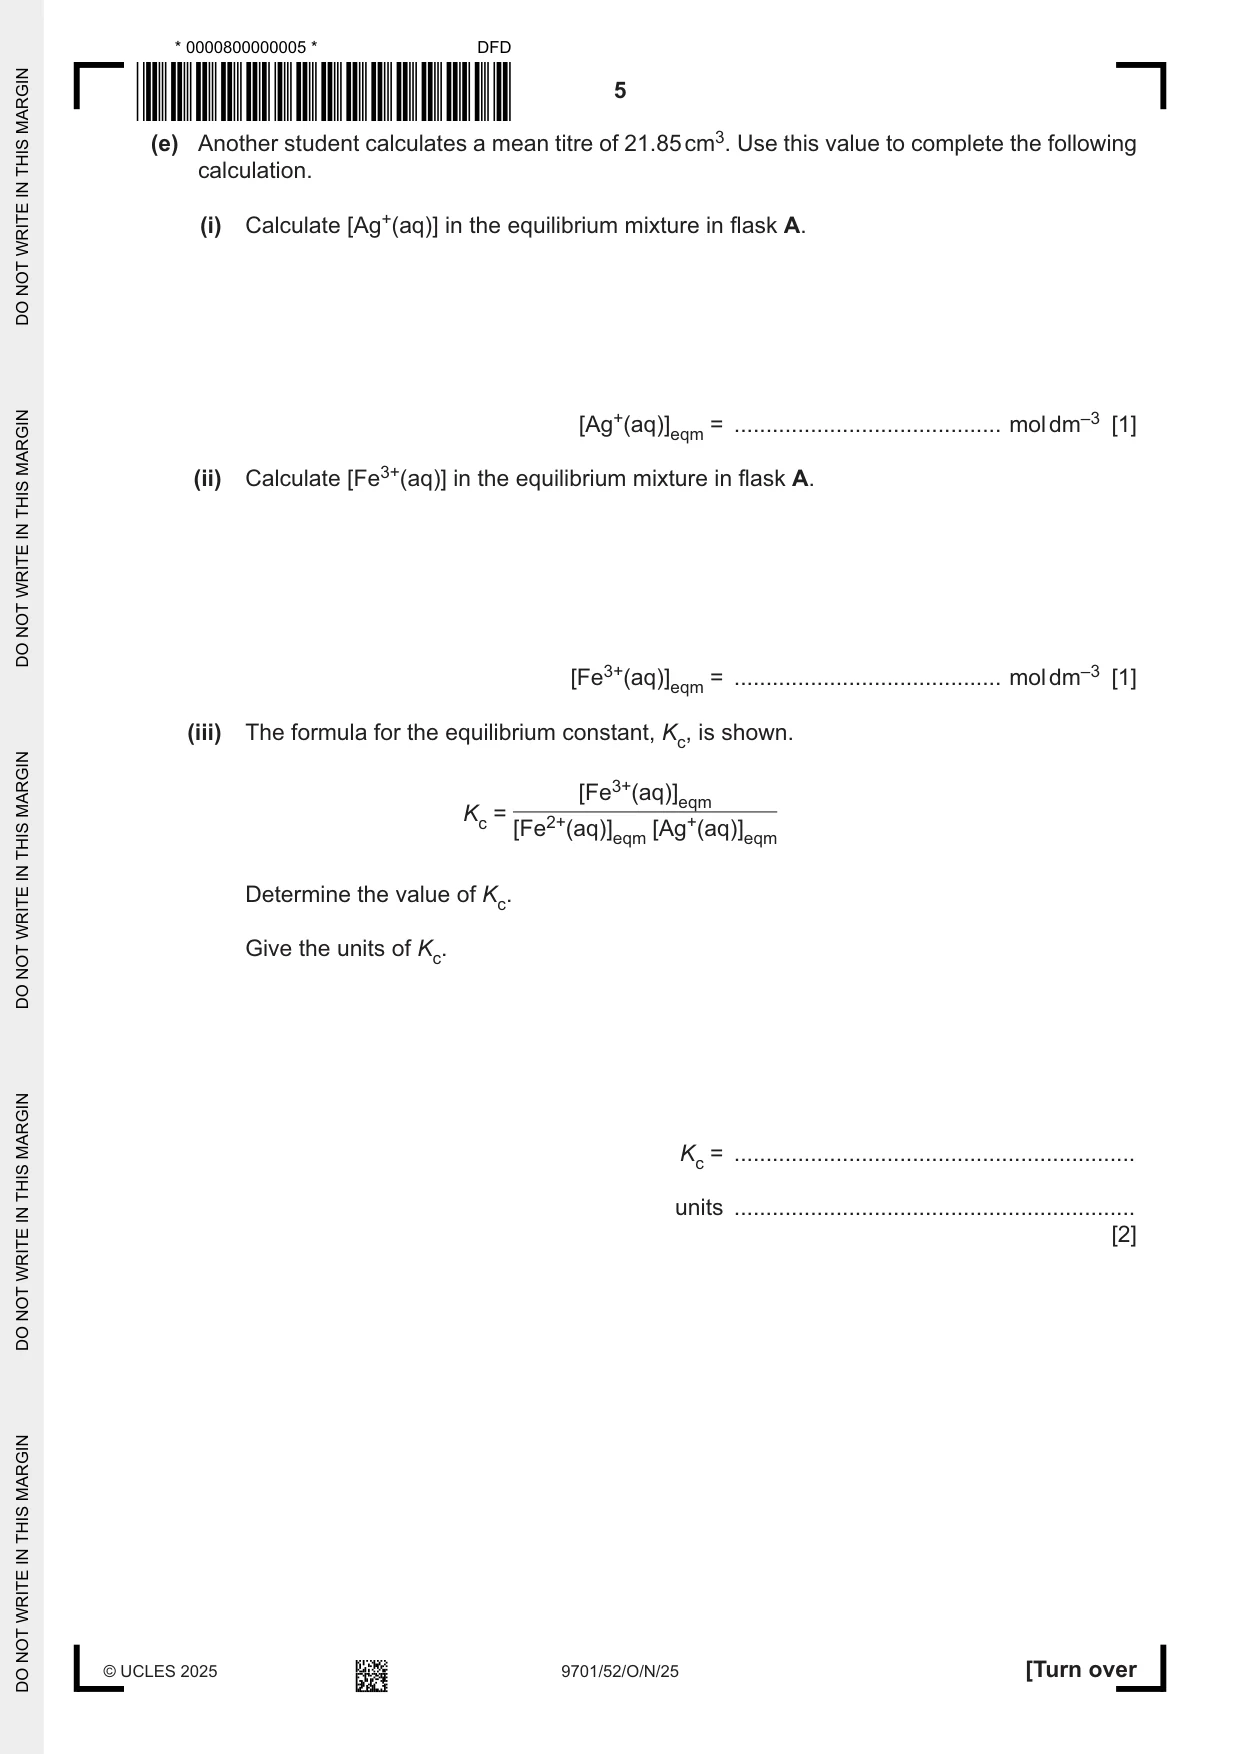
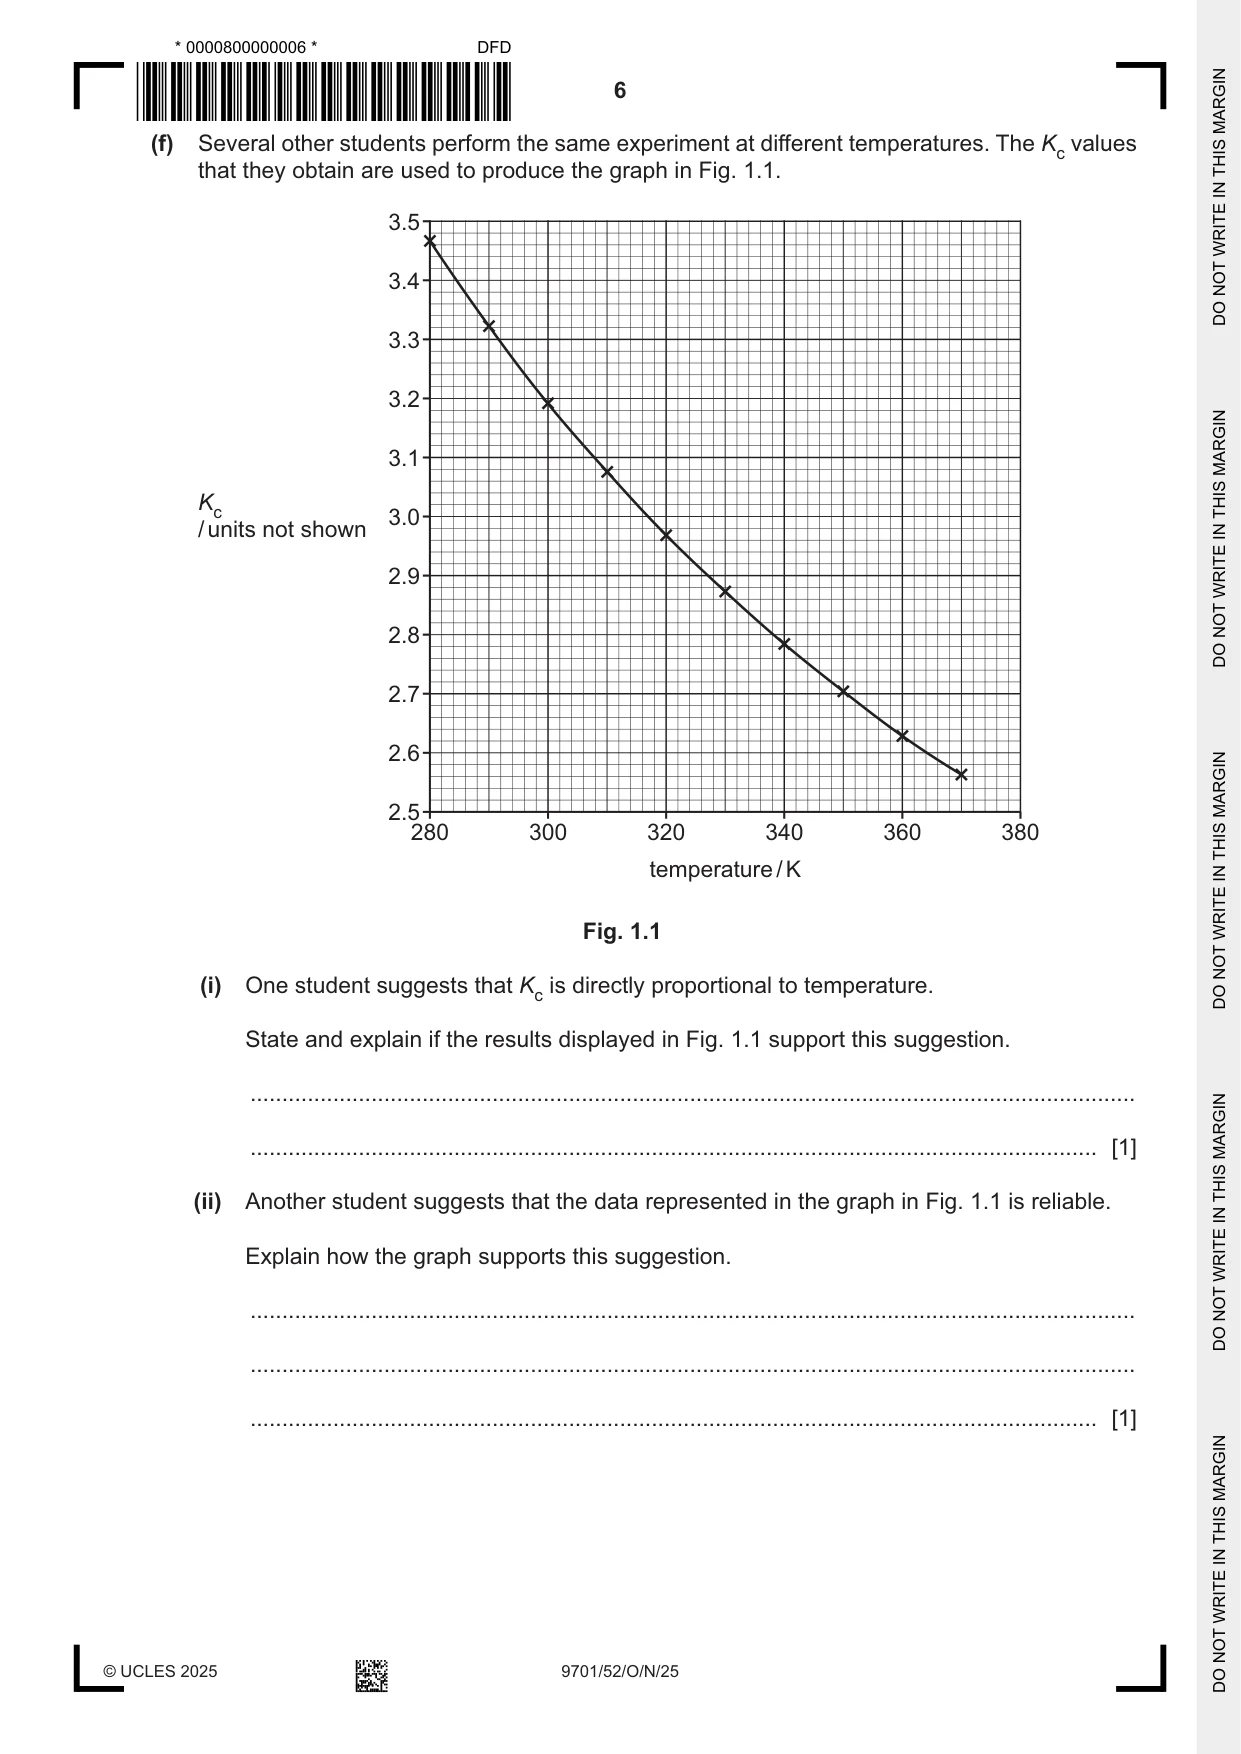
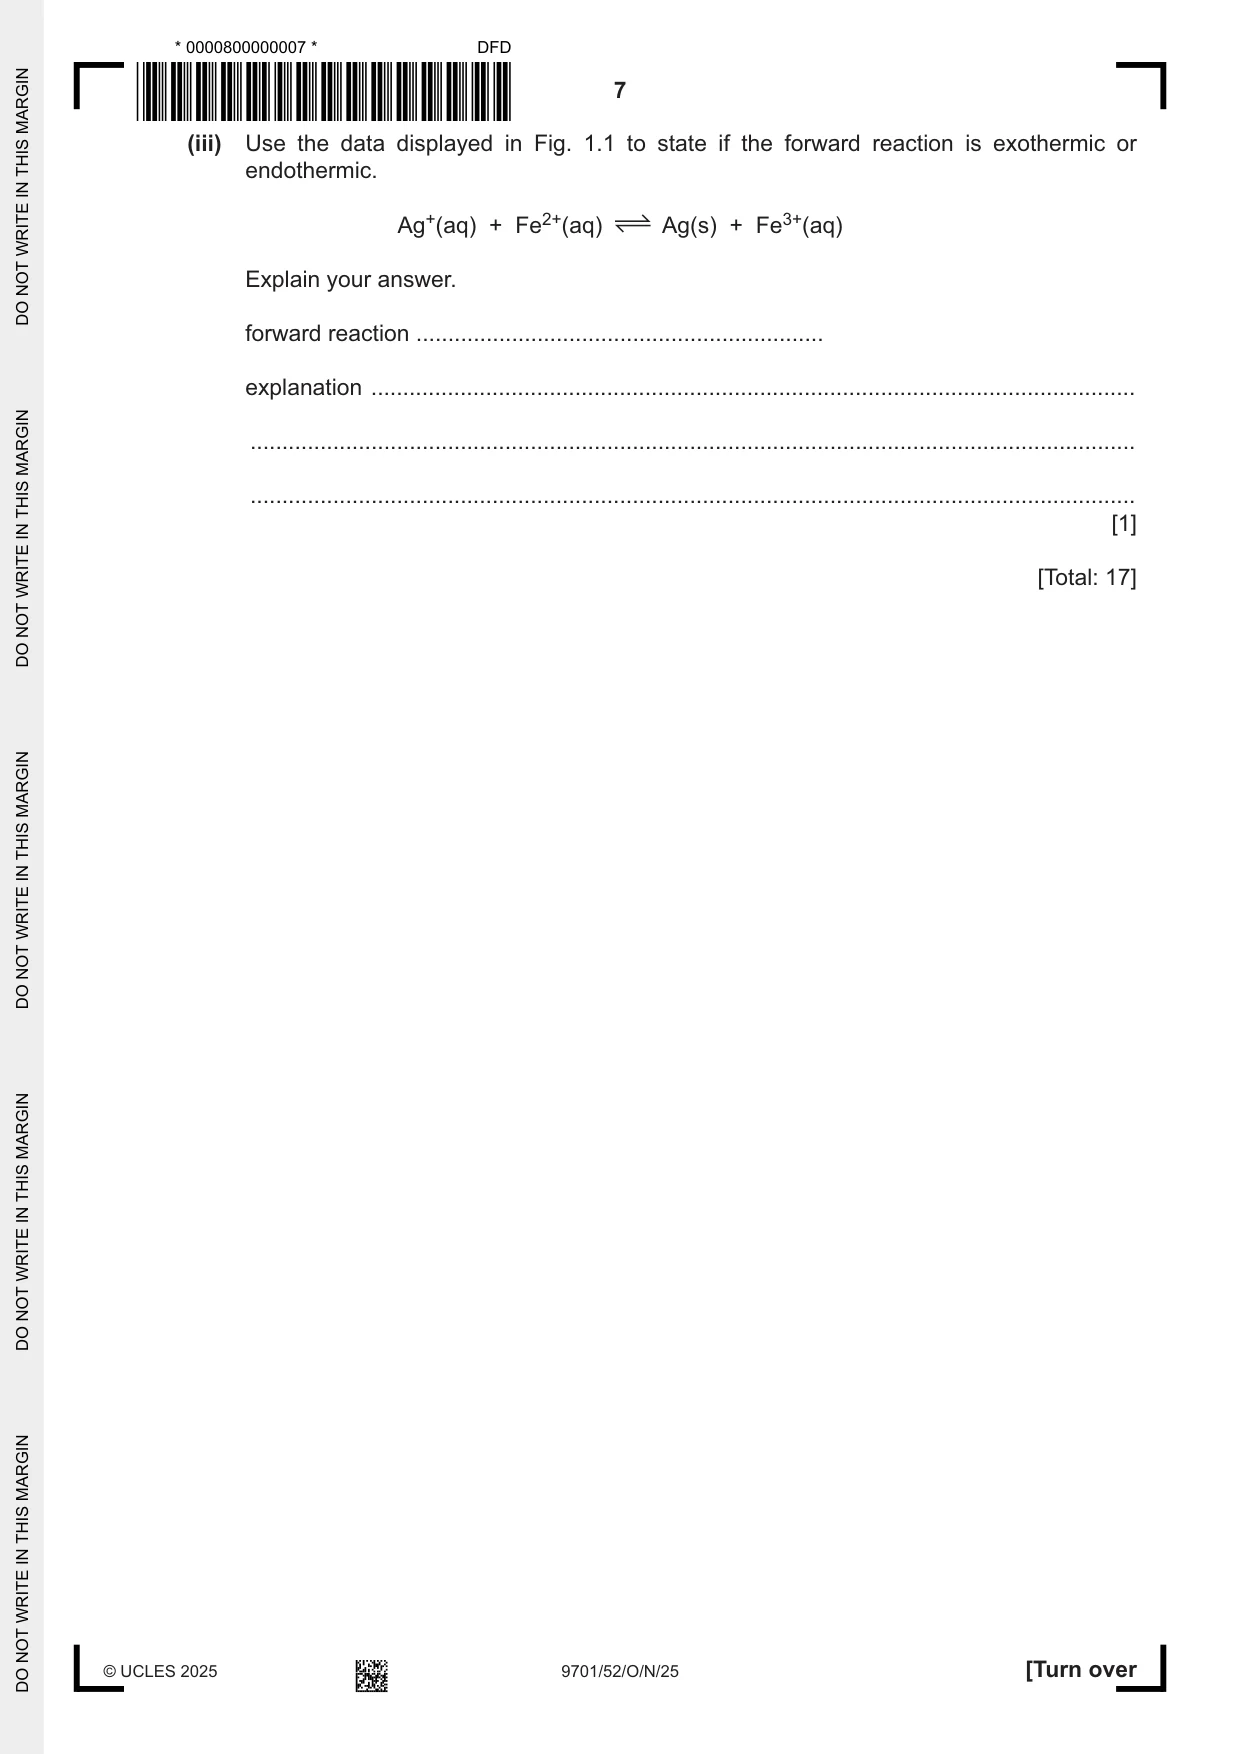
1 Aqueous silver ions, Ag+(aq), react slowly with aqueous iron(II) ions, Fe2+(aq). An equilibrium is established. Ag+(aq) + Fe2+(aq) Ag(s) + Fe3+(aq) The concentration of Ag+(aq) at equilibrium can be determined by titration with a standard solution of aqueous potassium thiocyanate, KSCN(aq). During the titration, the remaining Ag+(aq) ions react with SCN–(aq) ions to form a precipitate of AgSCN(s). Ag+(aq) + SCN–(aq) AgSCN(s) When all Ag+(aq) ions have been removed from solution, excess SCN–(aq) ions react with Fe3+(aq) to form a complex ion, FeSCN2+(aq), which has a red colour. Fe3+(aq) + SCN–(aq) FeSCN2+(aq) The appearance of the red colour indicates the end-point. A student carries out an experiment to determine the equilibrium constant, Kc. [Fe3+(aq)]eqm Kc = [Fe2+(aq)]eqm [Ag+(aq)]eqm The student makes 250.0 cm3 of 0.0200 mol dm–3 KSCN(aq) to use in the titration. (a) Calculate the mass of solid potassium thiocyanate, KSCN(s), needed to make 250.0 cm3 of 0.0200 mol dm–3 KSCN(aq). mass of KSCN(s) = ....................................................... g [1] (b) Describe how the student should make 250.0 cm3 of 0.0200 mol dm–3 KSCN(aq) starting from the mass of KSCN(s) calculated in (a) in a 50 cm3 beaker. Give the name and size of any key apparatus used. Write your answer using a series of numbered steps. ................................................................................................................................................... ................................................................................................................................................... ................................................................................................................................................... ................................................................................................................................................... ................................................................................................................................................... ................................................................................................................................................... ............................................................................................................................................. [3] (c) The student uses the following method to determine Kc. step 1 Add 25.0 cm3 of 0.100 mol dm–3 aqueous silver nitrate, AgNO3(aq), into a dry conical flask. Label this flask A. step 2 Add 25.0 cm3 of 0.100 mol dm–3 aqueous iron(II) sulfate, FeSO4(aq), into flask A. step 3 Seal flask A, using a bung. step 4 Allow flask A to stand for twelve hours. step 5 Transfer 10.0 cm3 of the mixture from flask A into another conical flask, flask B, without disturbing the precipitate in flask A. step 6 Titrate the sample in flask B with 0.0200 mol dm–3 aqueous potassium thiocyanate, KSCN(aq). step 7 Repeat steps 5 and 6 until concordant values are obtained. (i) Suggest why flask A is sealed with a bung in step 3. ........................................................................................................................................... ..................................................................................................................................... [1] (ii) Suggest why flask A is left to stand for twelve hours in step 4. ........................................................................................................................................... ..................................................................................................................................... [1] (iii) Identify the precipitate in flask A in step 5. ..................................................................................................................................... [1] (d) The student’s results are shown in Table 1.1 Table 1.1 rough titration 1 titration 2 titration 3 titration final burette 22.50 21.75 31.65 32.20 reading / cm3 initial burette 0.00 0.00 9.75 10.20 reading / cm3 titre / cm3 22.50 21.75 21.90 22.00 (i) State if concordant titres have been achieved. Explain your answer. ........................................................................................................................................... ..................................................................................................................................... [1] (ii) Calculate the percentage error in the titre volume in titration 2. Show your working. percentage error = ......................................................... [1] (iii) The student repeats the experiment using KSCN(aq) at a higher concentration. The student obtains smaller titres. Suggest one reason why a larger titre is better than a smaller titre. ..................................................................................................................................... [1] (e) Another student calculates a mean titre of 21.85 cm3. Use this value to complete the following calculation. (i) Calculate [Ag+(aq)] in the equilibrium mixture in flask A. [Ag+(aq)]eqm = .......................................... mol dm–3 [1] (ii) Calculate [Fe3+(aq)] in the equilibrium mixture in flask A. [Fe3+(aq)]eqm = .......................................... mol dm–3 [1] (iii) The formula for the equilibrium constant, Kc, is shown. [Fe3+(aq)]eqm Kc = [Fe2+(aq)]eqm [Ag+(aq)]eqm Determine the value of Kc. Give the units of Kc. Kc = ............................................................... units ............................................................... [2] (f) Several other students perform the same experiment at different temperatures. The Kc values that they obtain are used to produce the graph in Fig. 1.1. 3.5 3.4 3.3 3.2 3.1 Kc 3.0 / units not shown 2.9 2.8 2.7 2.6 2.5 280 300 320 340 360 380 temperature / K Fig. 1.1 (i) One student suggests that Kc is directly proportional to temperature. State and explain if the results displayed in Fig. 1.1 support this suggestion. ........................................................................................................................................... ..................................................................................................................................... [1] (ii) Another student suggests that the data represented in the graph in Fig. 1.1 is reliable. Explain how the graph supports this suggestion. ........................................................................................................................................... ........................................................................................................................................... ..................................................................................................................................... [1] (iii) Use the data displayed in Fig. 1.1 to state if the forward reaction is exothermic or endothermic. Ag+(aq) + Fe2+(aq) Ag(s) + Fe3+(aq) Explain your answer. forward reaction ................................................................ explanation ........................................................................................................................ ........................................................................................................................................... ........................................................................................................................................... [1] [Total: 17]
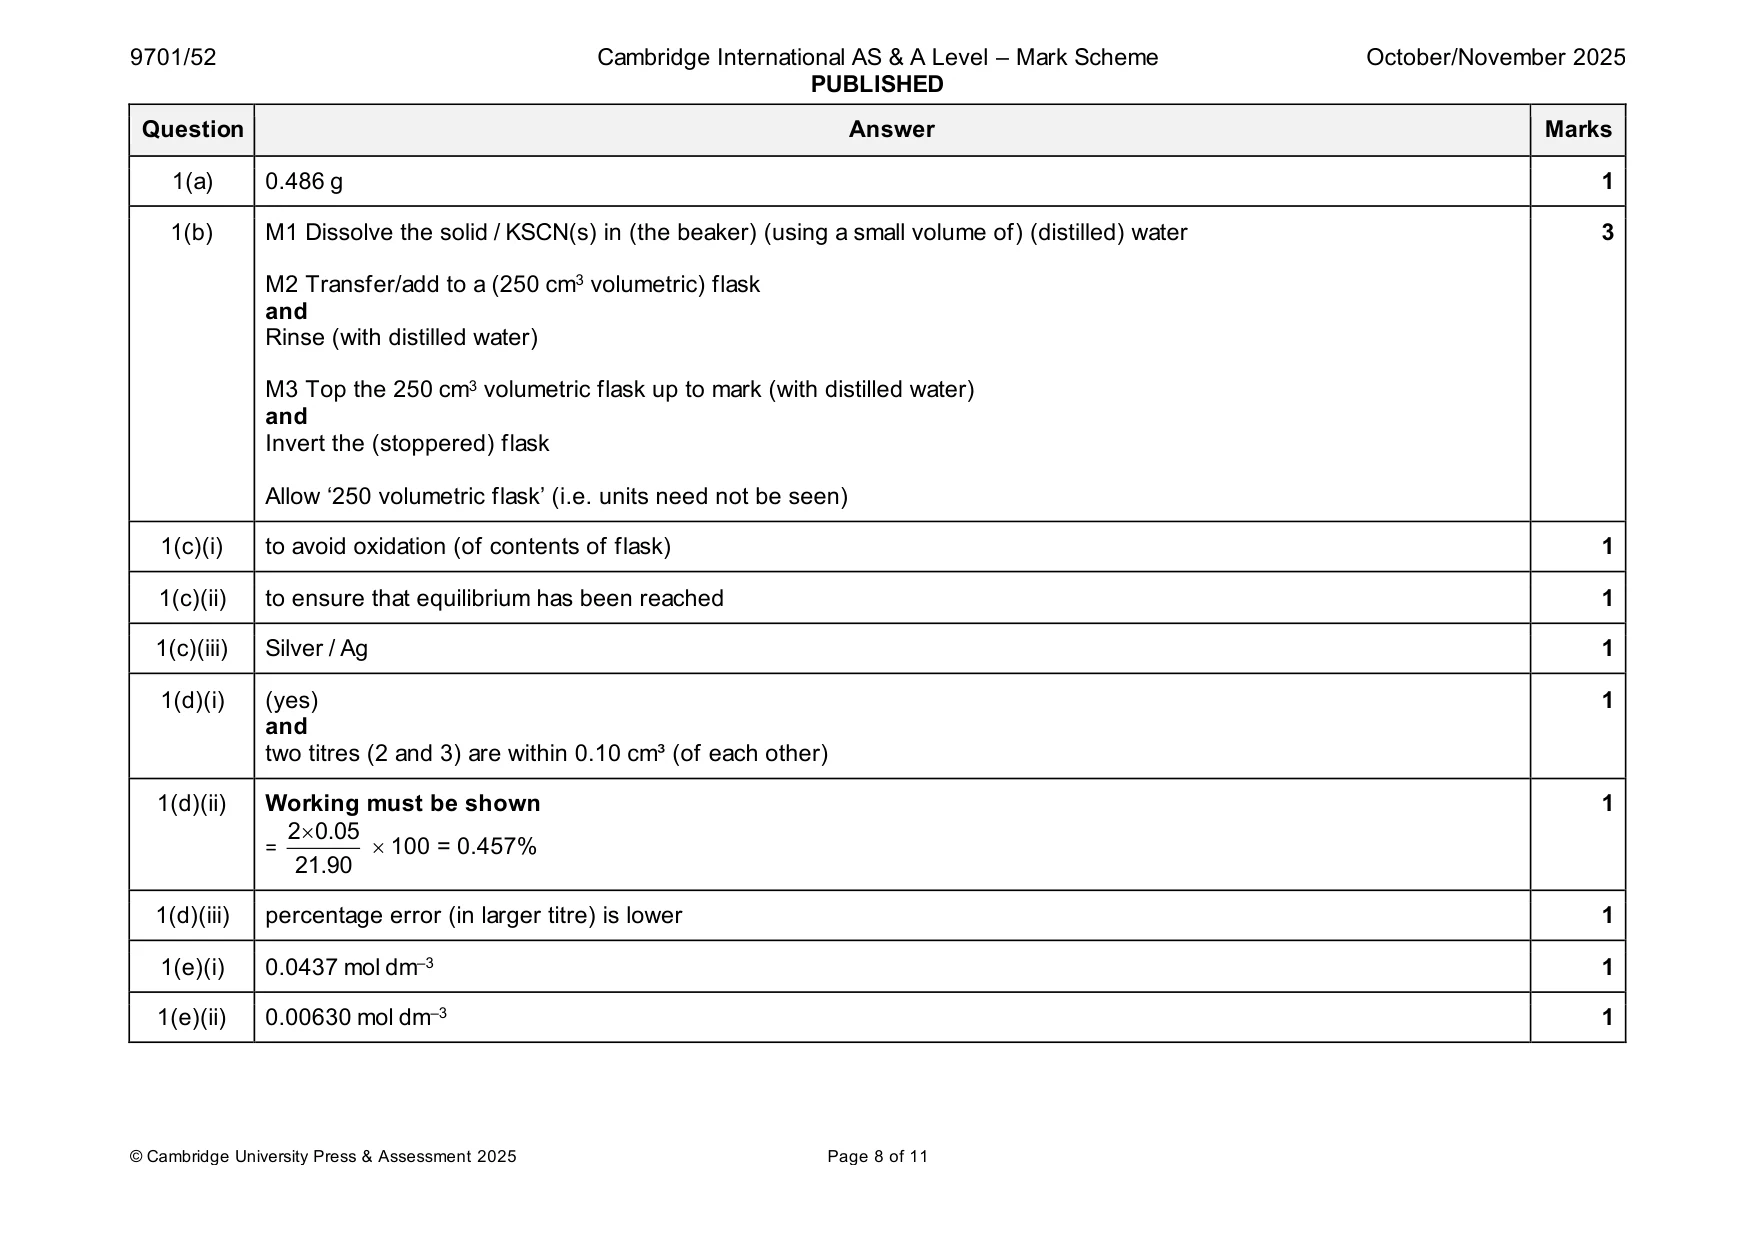
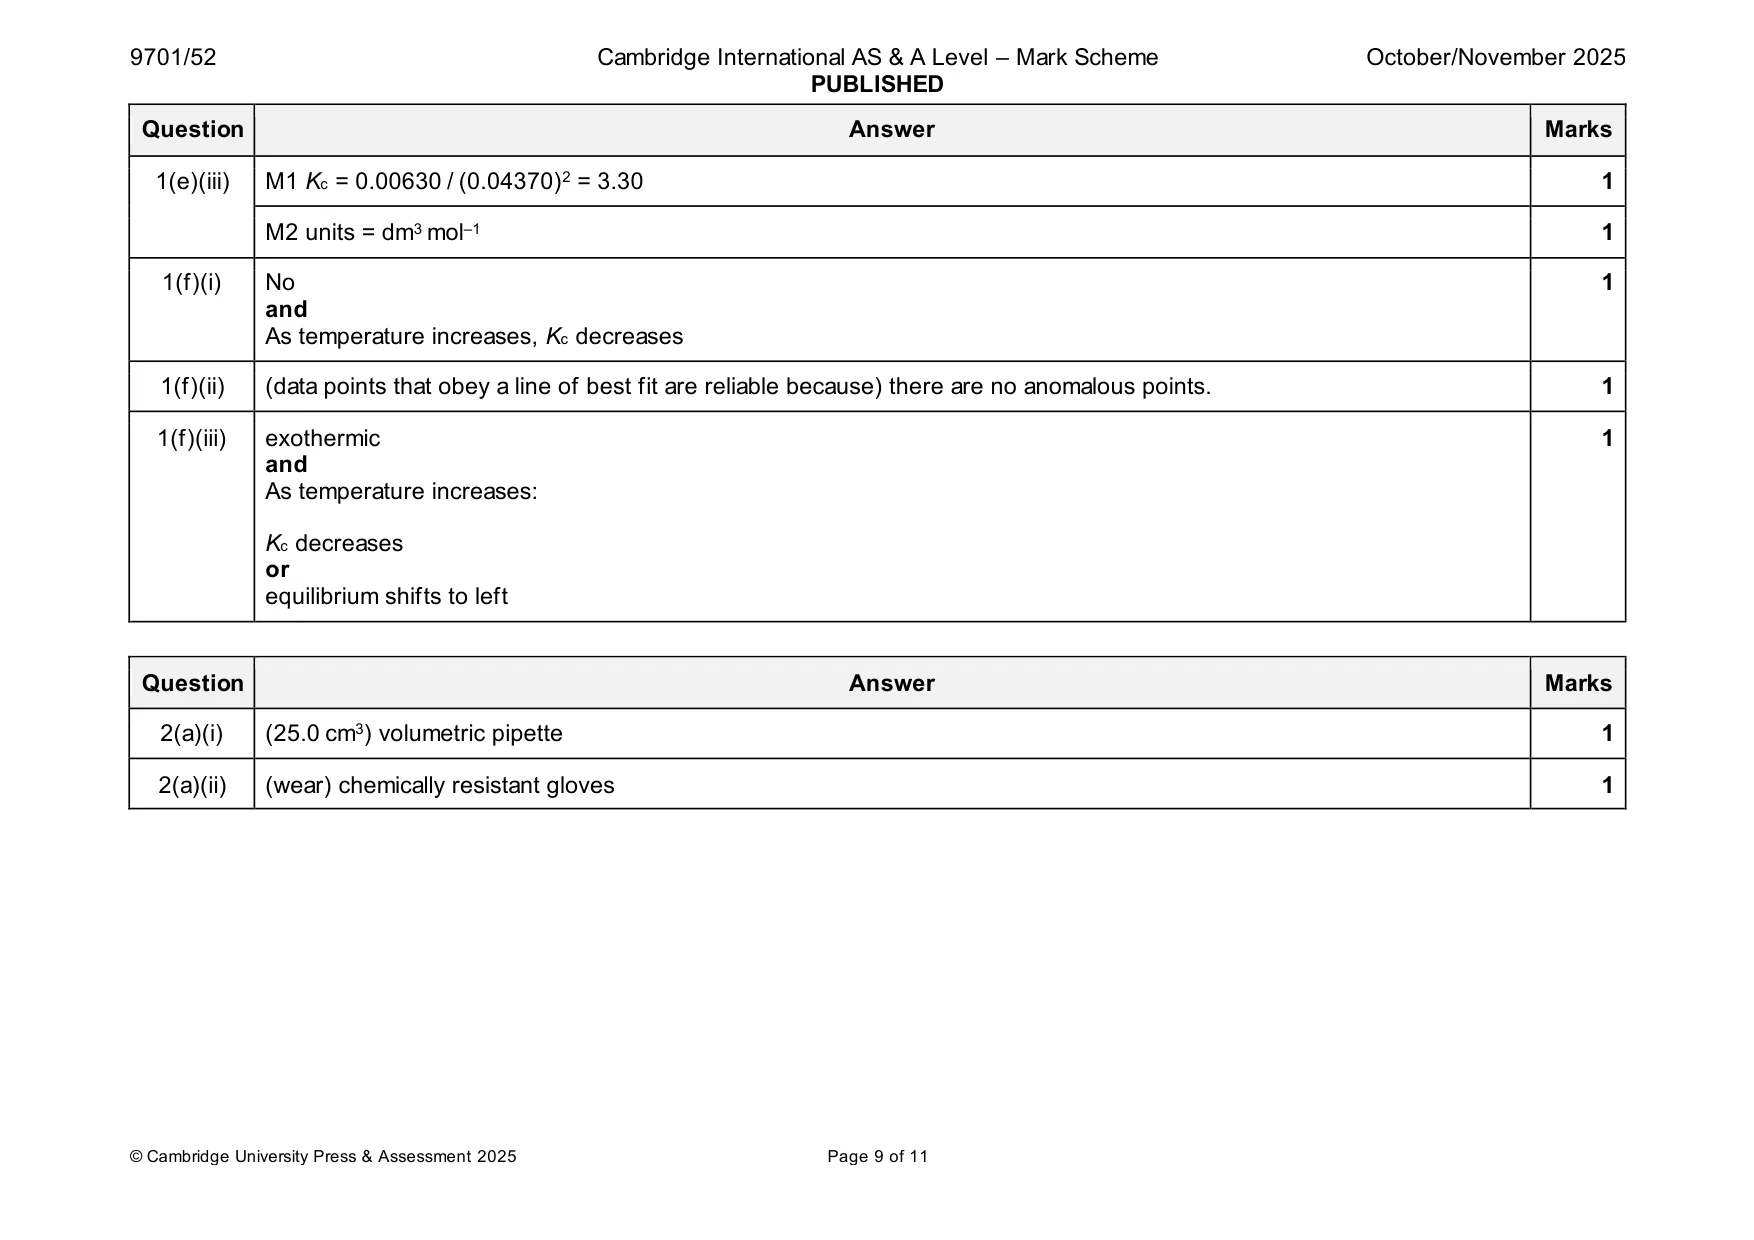
Mark scheme: Question Answer Marks 1(a) 0.486 g 1 1(b) M1 Dissolve the solid / KSCN(s) in (the beaker) (using a small volume of) (distilled) water 3 M2 Transfer/add to a (250 cm3 volumetric) flask and Rinse (with distilled water) M3 Top the 250 cm3 volumetric flask up to mark (with distilled water) and Invert the (stoppered) flask Allow ‘250 volumetric flask’ (i.e. units need not be seen) 1(c)(i) to avoid oxidation (of contents of flask) 1 1(c)(ii) to ensure that equilibrium has been reached 1 1(c)(iii) Silver / Ag 1 1(d)(i) (yes) 1 and two titres (2 and 3) are within 0.10 cm³ (of each other) 1(d)(ii) Working must be shown 1 2 0.05 = 100 = 0.457% 21.90 1(d)(iii) percentage error (in larger titre) is lower 1 1(e)(i) 0.0437 mol dm–3 1 1(e)(ii) 0.00630 mol dm–3 1 1(e)(iii) M1 Kc = 0.00630 / (0.04370)2 = 3.30 1 M2 units = dm3 mol–1 1 1(f)(i) No 1 and As temperature increases, Kc decreases 1(f)(ii) (data points that obey a line of best fit are reliable because) there are no anomalous points. 1 1(f)(iii) exothermic 1 and As temperature increases: Kc decreases or equilibrium shifts to left
More questions on Chemical equilibria: reversible reactions, dynamic equilibrium
Q2 · A student carries out an experiment to determine the concentration of aqueous sulfate…
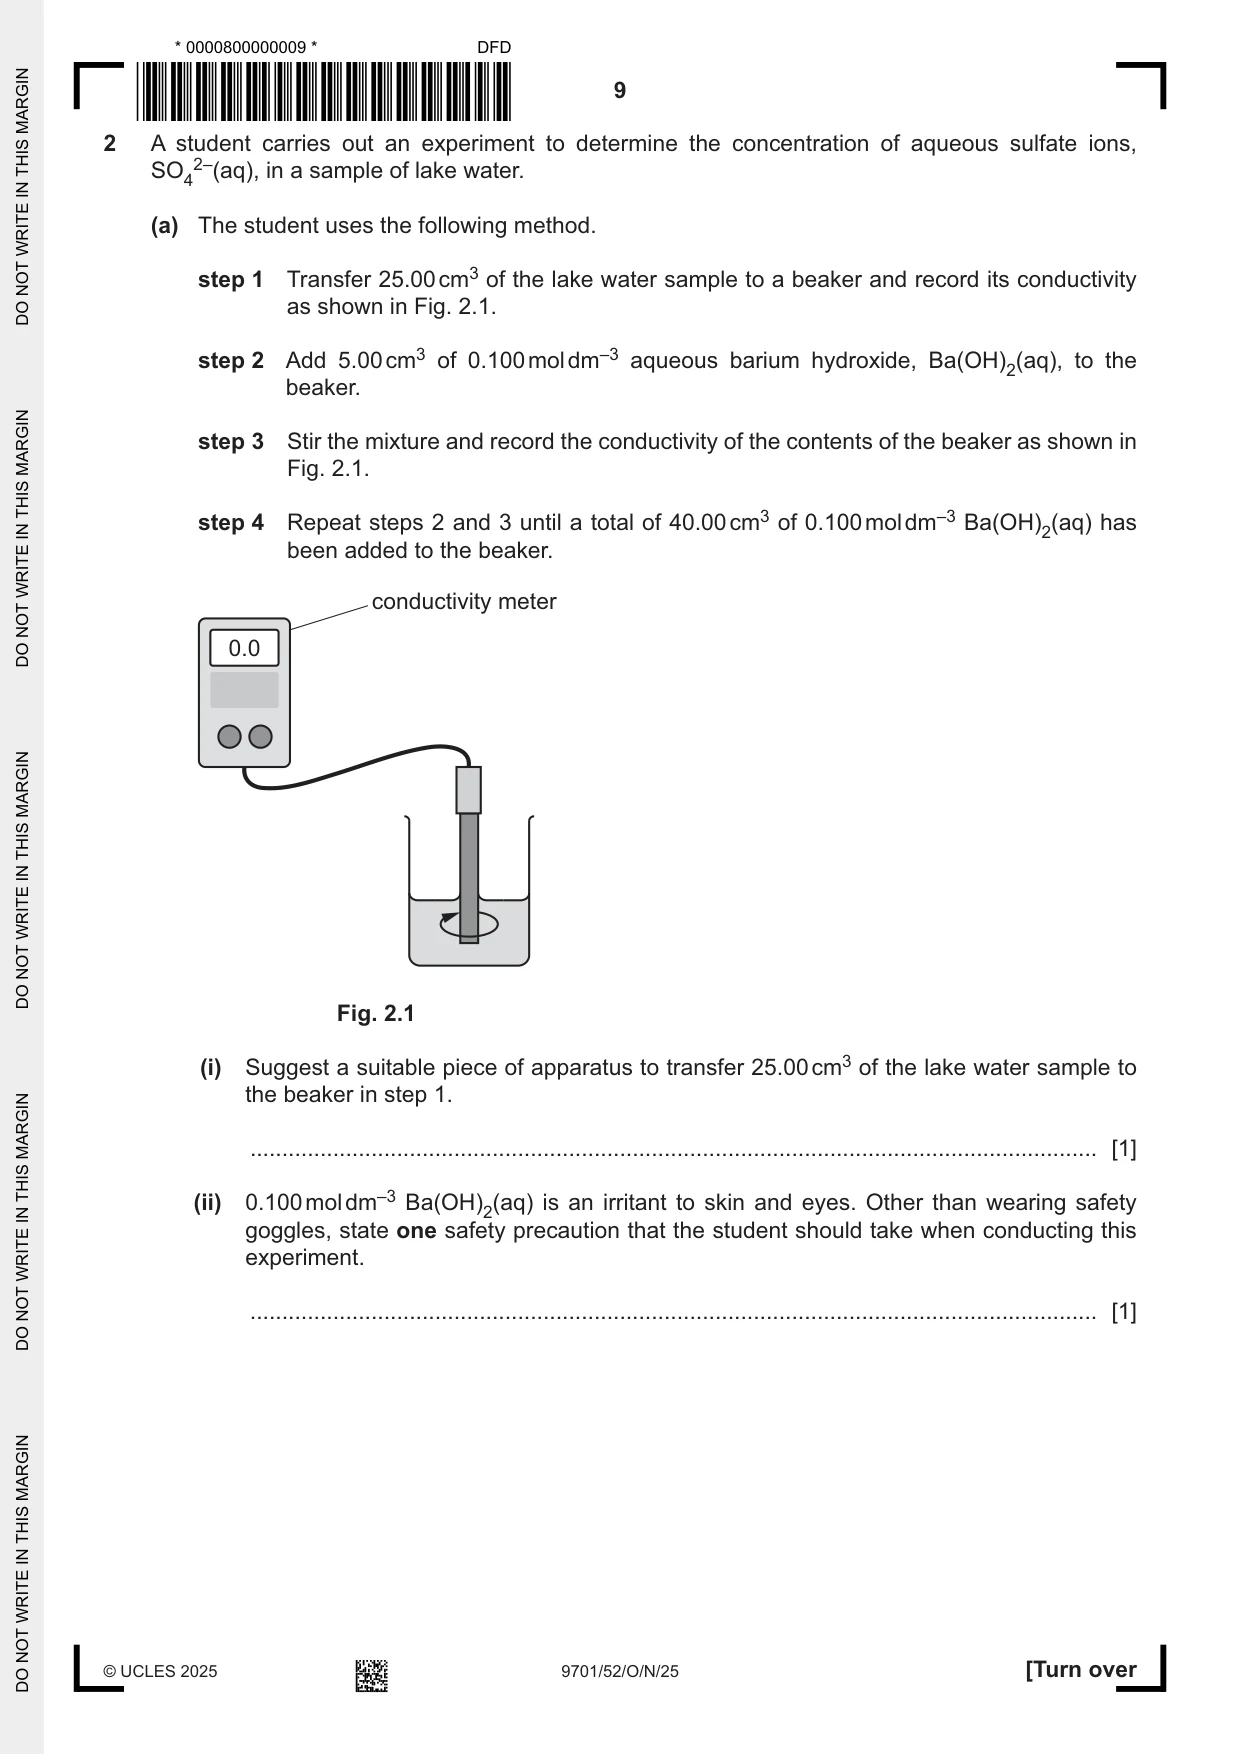
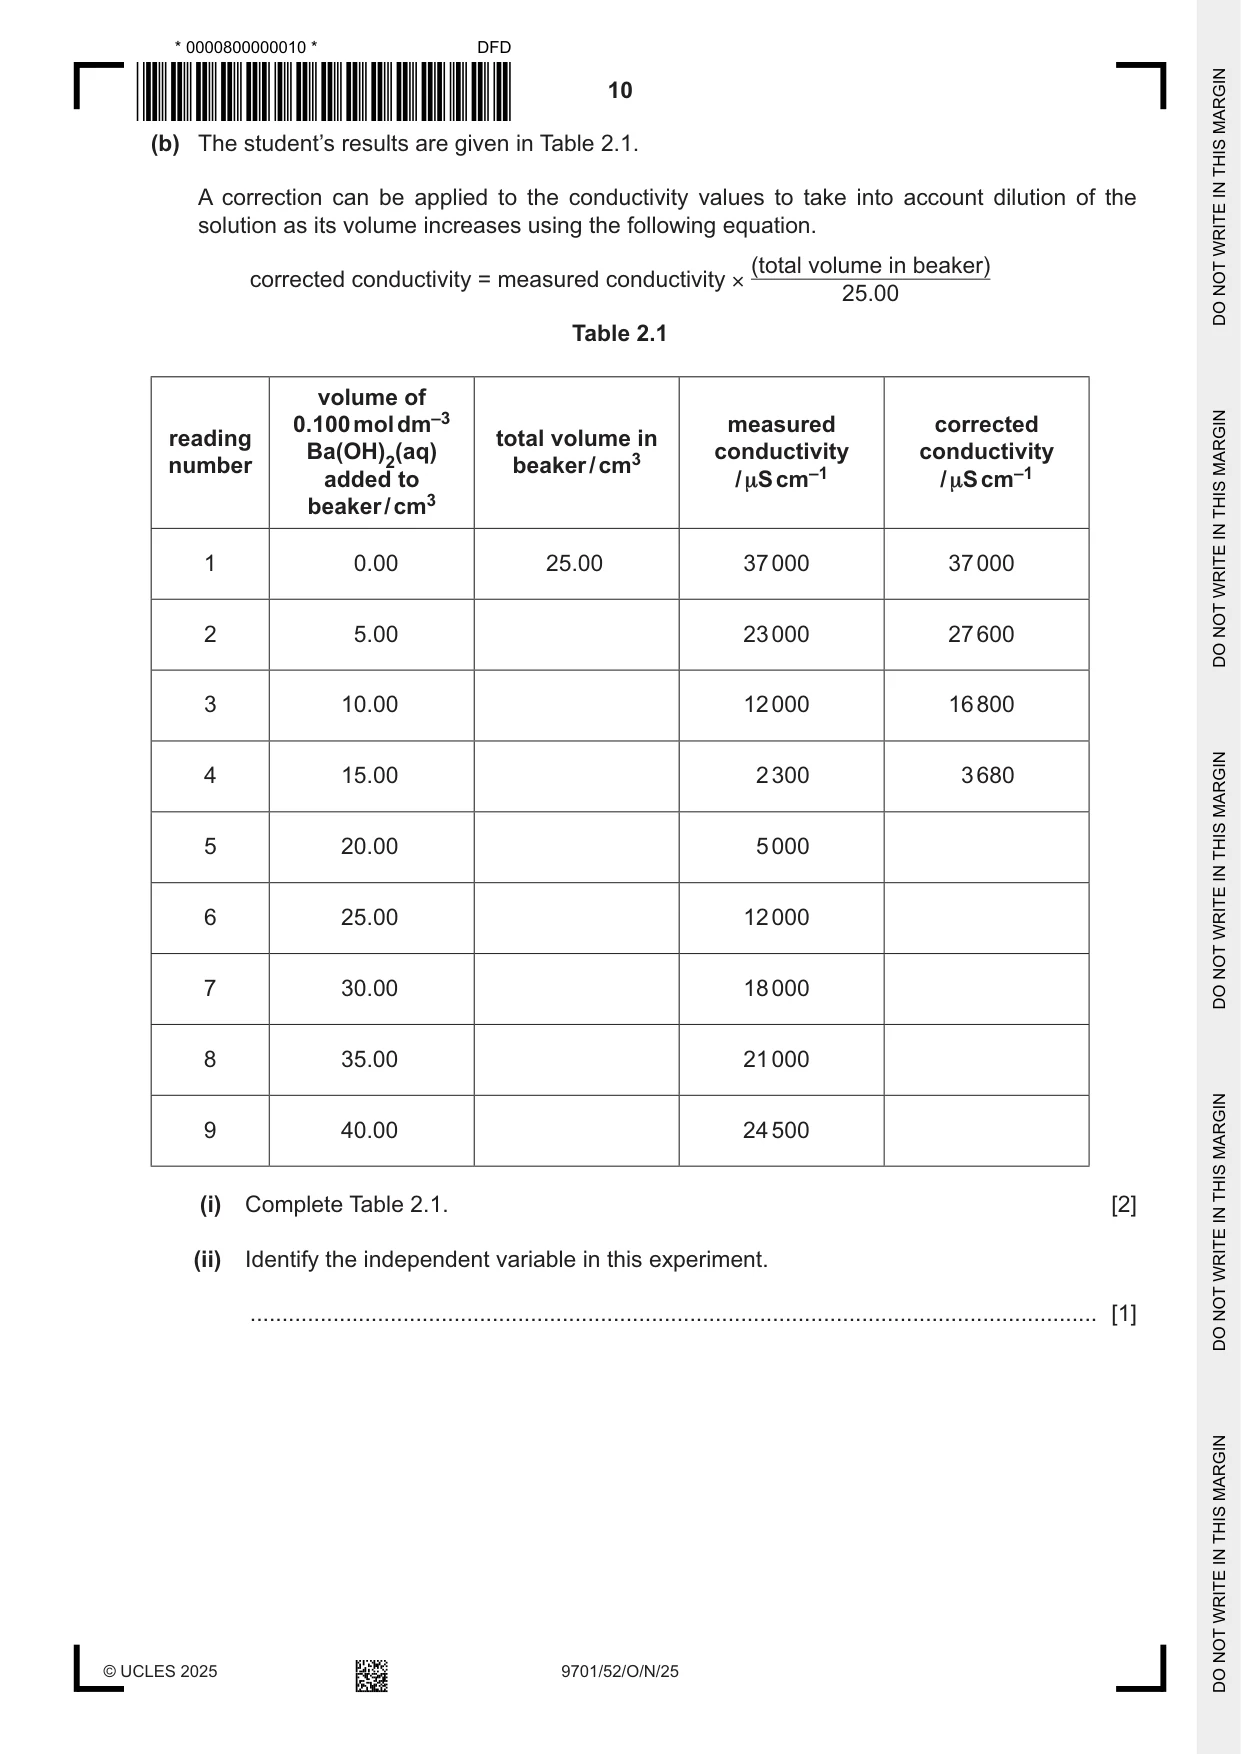
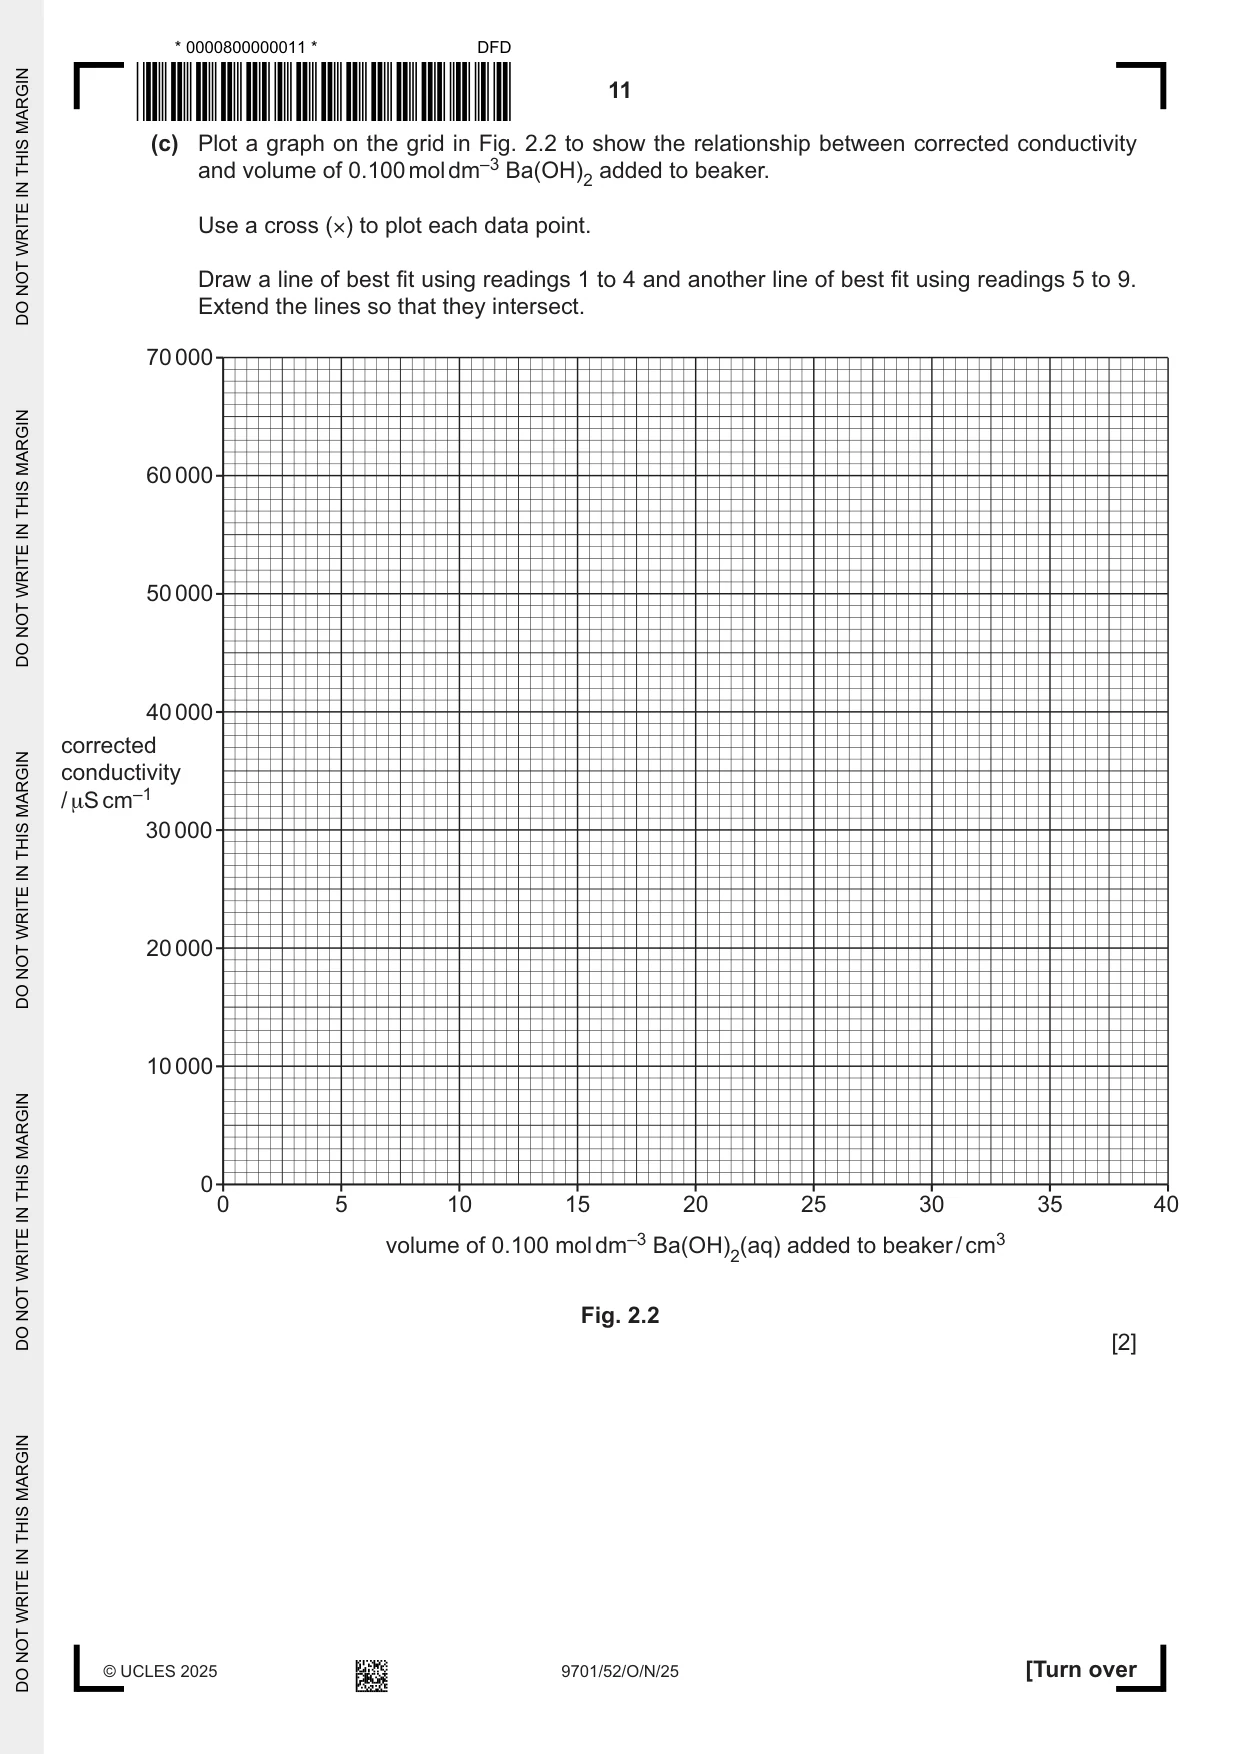
2 A student carries out an experiment to determine the concentration of aqueous sulfate ions, SO42–(aq), in a sample of lake water. (a) The student uses the following method. step 1 Transfer 25.00 cm3 of the lake water sample to a beaker and record its conductivity as shown in Fig. 2.1. step 2 Add 5.00 cm3 of 0.100 mol dm–3 aqueous barium hydroxide, Ba(OH)2(aq), to the beaker. step 3 Stir the mixture and record the conductivity of the contents of the beaker as shown in Fig. 2.1. step 4 Repeat steps 2 and 3 until a total of 40.00 cm3 of 0.100 mol dm–3 Ba(OH)2(aq) has been added to the beaker. conductivity meter 0.0 Fig. 2.1 (i) Suggest a suitable piece of apparatus to transfer 25.00 cm3 of the lake water sample to the beaker in step 1. ..................................................................................................................................... [1] (ii) 0.100 mol dm–3 Ba(OH)2(aq) is an irritant to skin and eyes. Other than wearing safety goggles, state one safety precaution that the student should take when conducting this experiment. ..................................................................................................................................... [1] (b) The student’s results are given in Table 2.1. A correction can be applied to the conductivity values to take into account dilution of the solution as its volume increases using the following equation. (total volume in beaker) corrected conductivity = measured conductivity × 25.00 Table 2.1 volume of 0.100 mol dm–3 measured corrected reading total volume in Ba(OH)2(aq) conductivity conductivity number beaker / cm3 added to / µS cm–1 / µS cm–1 beaker / cm3 1 0.00 25.00 37 000 37 000 2 5.00 23 000 27 600 3 10.00 12 000 16 800 4 15.00 2 300 3 680 5 20.00 5 000 6 25.00 12 000 7 30.00 18 000 8 35.00 21 000 9 40.00 24 500 (i) Complete Table 2.1. [2] (ii) Identify the independent variable in this experiment. ..................................................................................................................................... [1] (c) Plot a graph on the grid in Fig. 2.2 to show the relationship between corrected conductivity and volume of 0.100 mol dm–3 Ba(OH)2 added to beaker. Use a cross (×) to plot each data point. Draw a line of best fit using readings 1 to 4 and another line of best fit using readings 5 to 9. Extend the lines so that they intersect. 70 000 60 000 50 000 40 000 corrected conductivity / μS cm–1 30 000 20 000 10 000 0 0 5 10 15 20 25 30 35 40 volume of 0.100 mol dm–3 Ba(OH)2(aq) added to beaker / cm3 Fig. 2.2 [2]
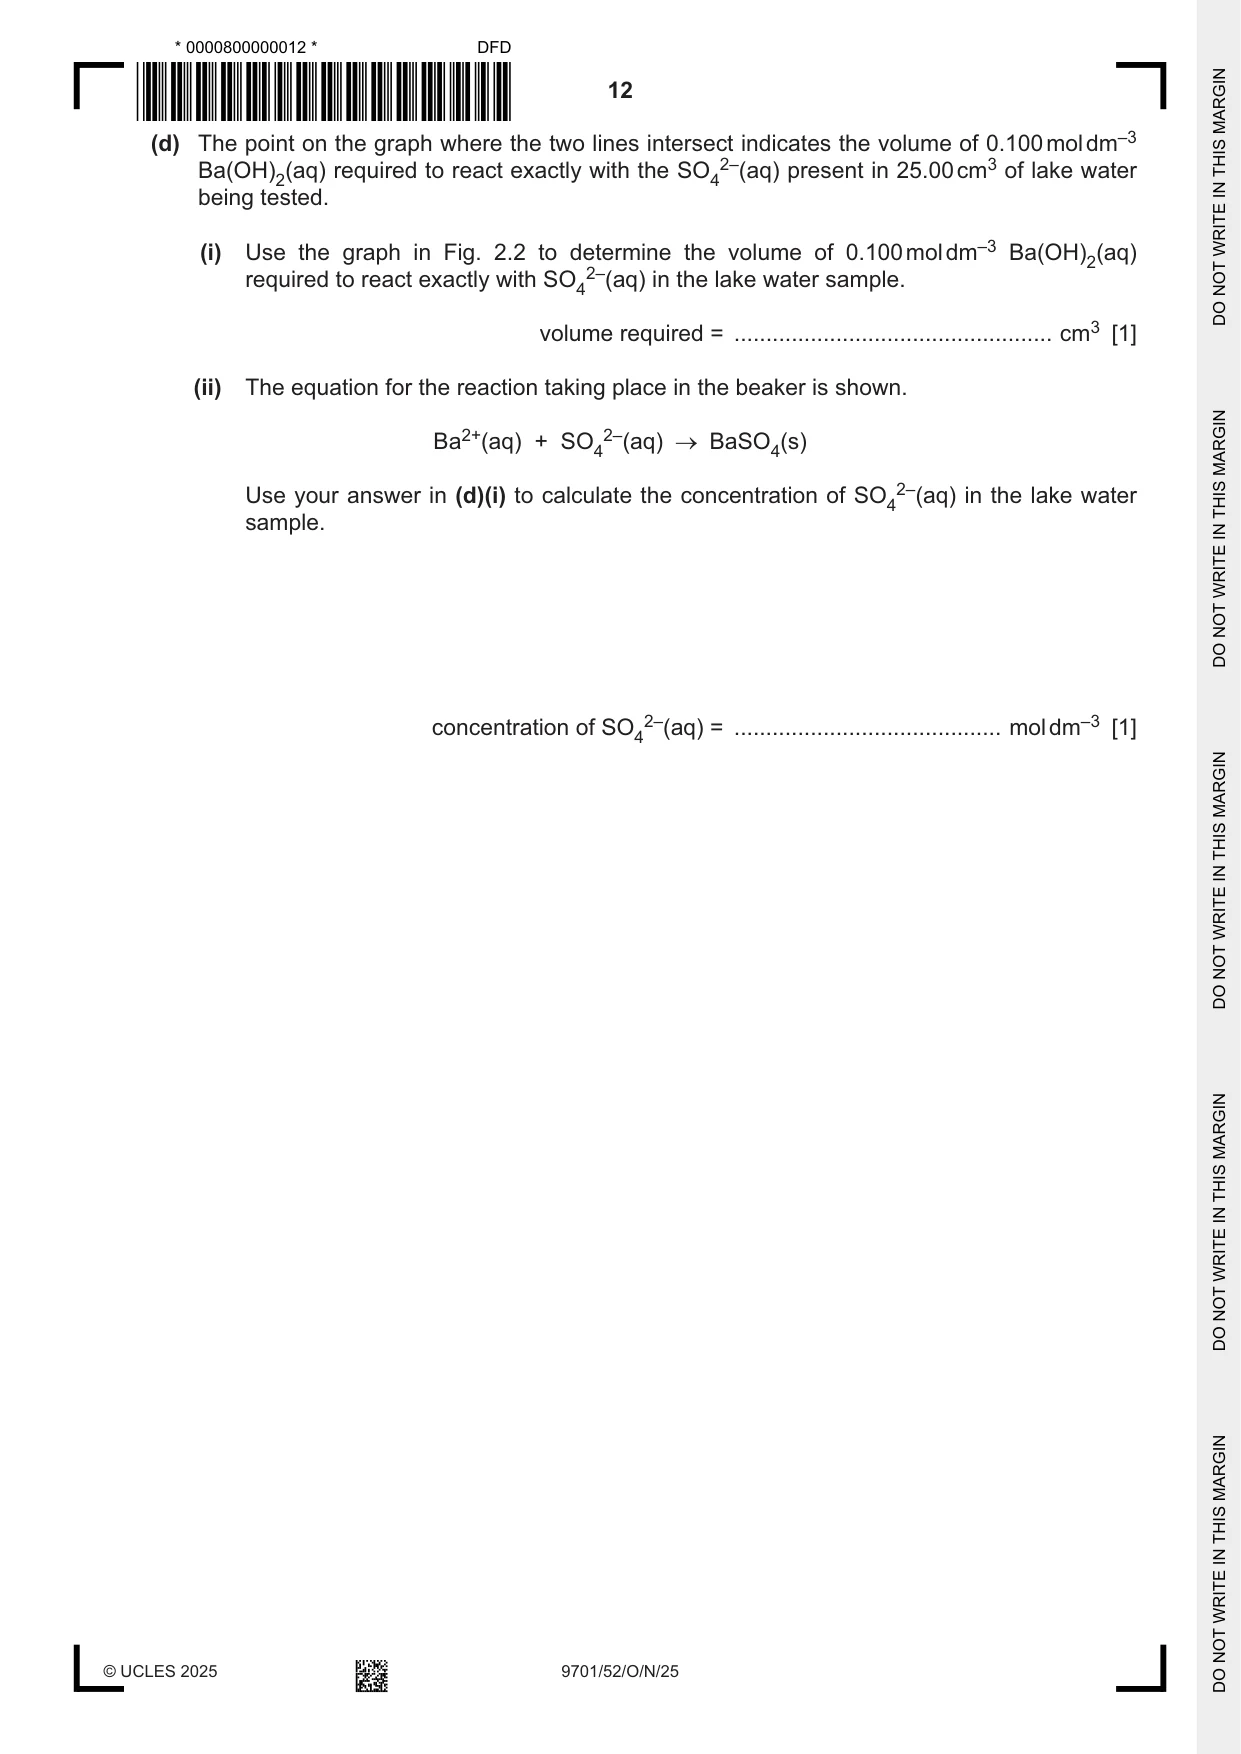
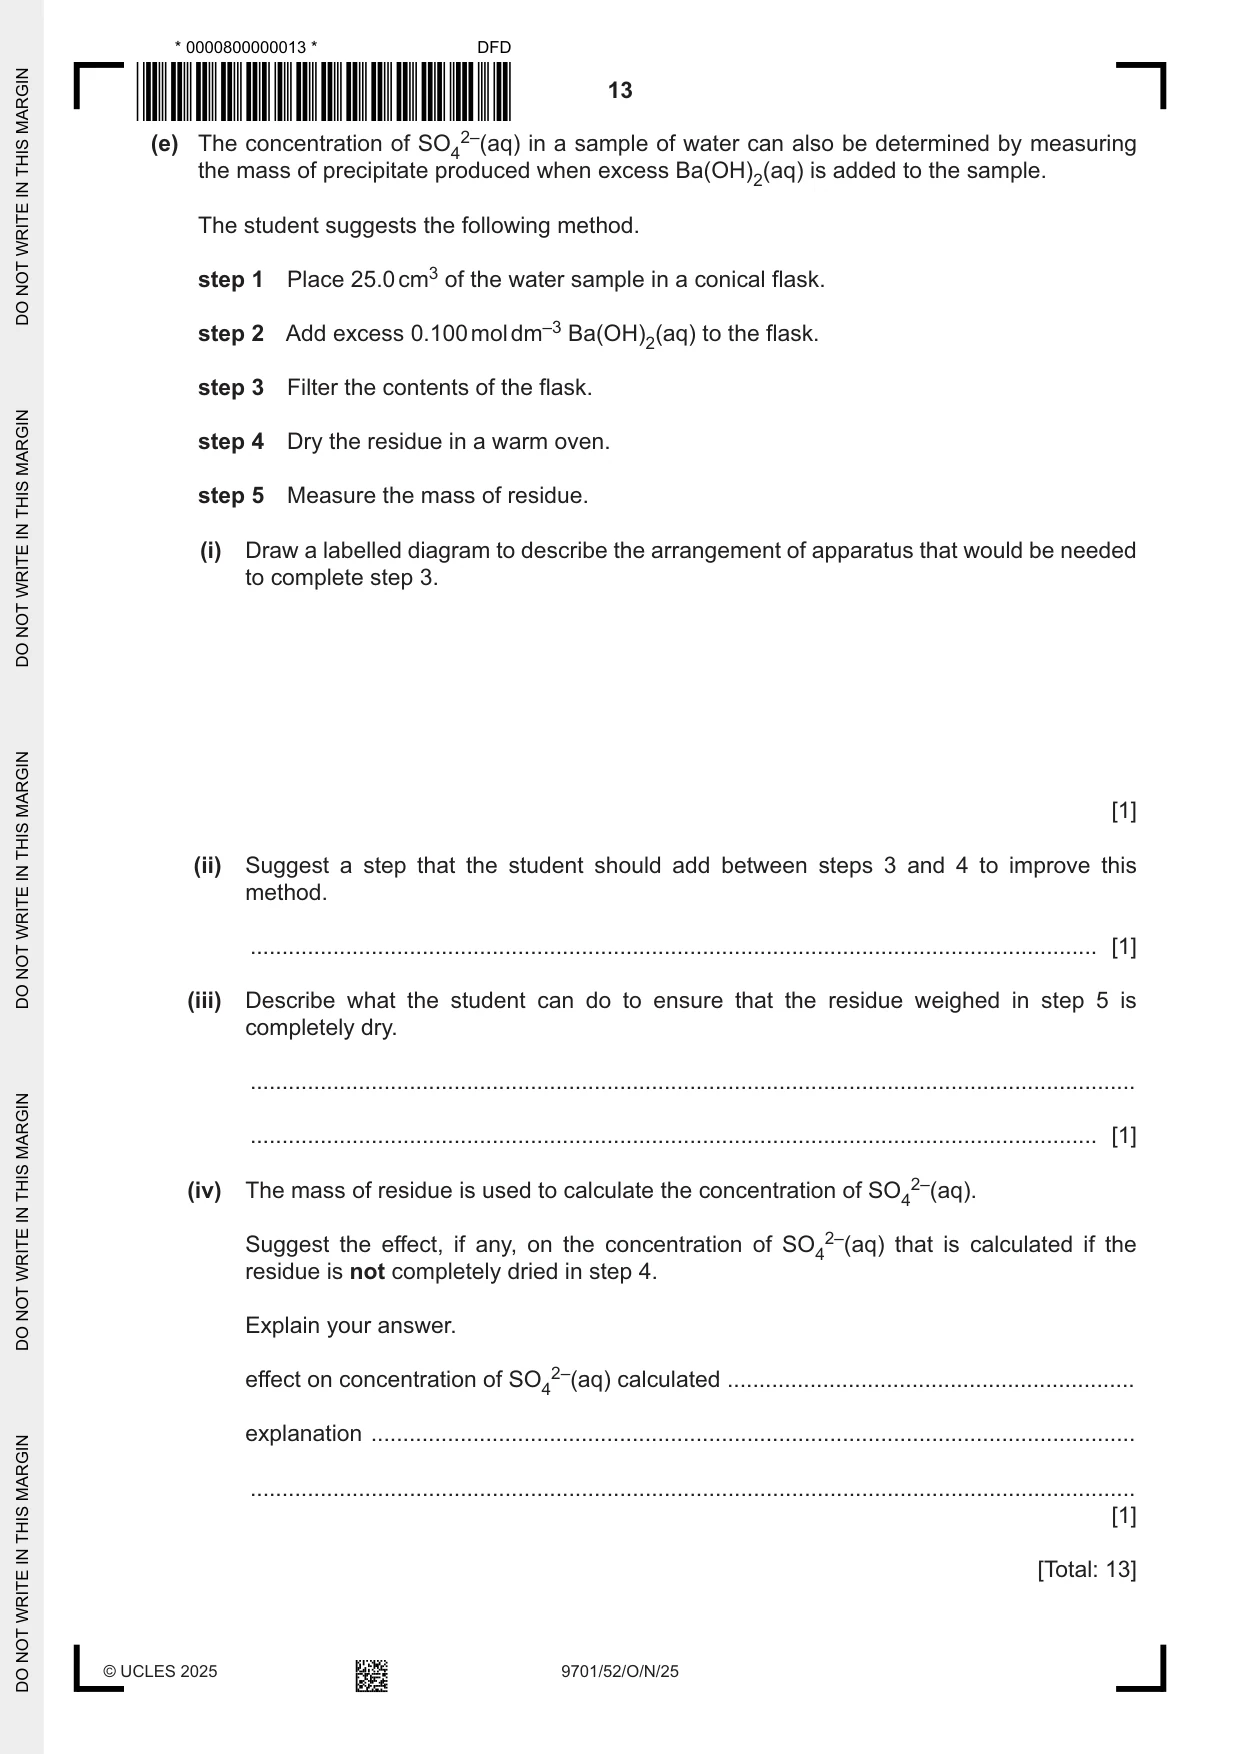
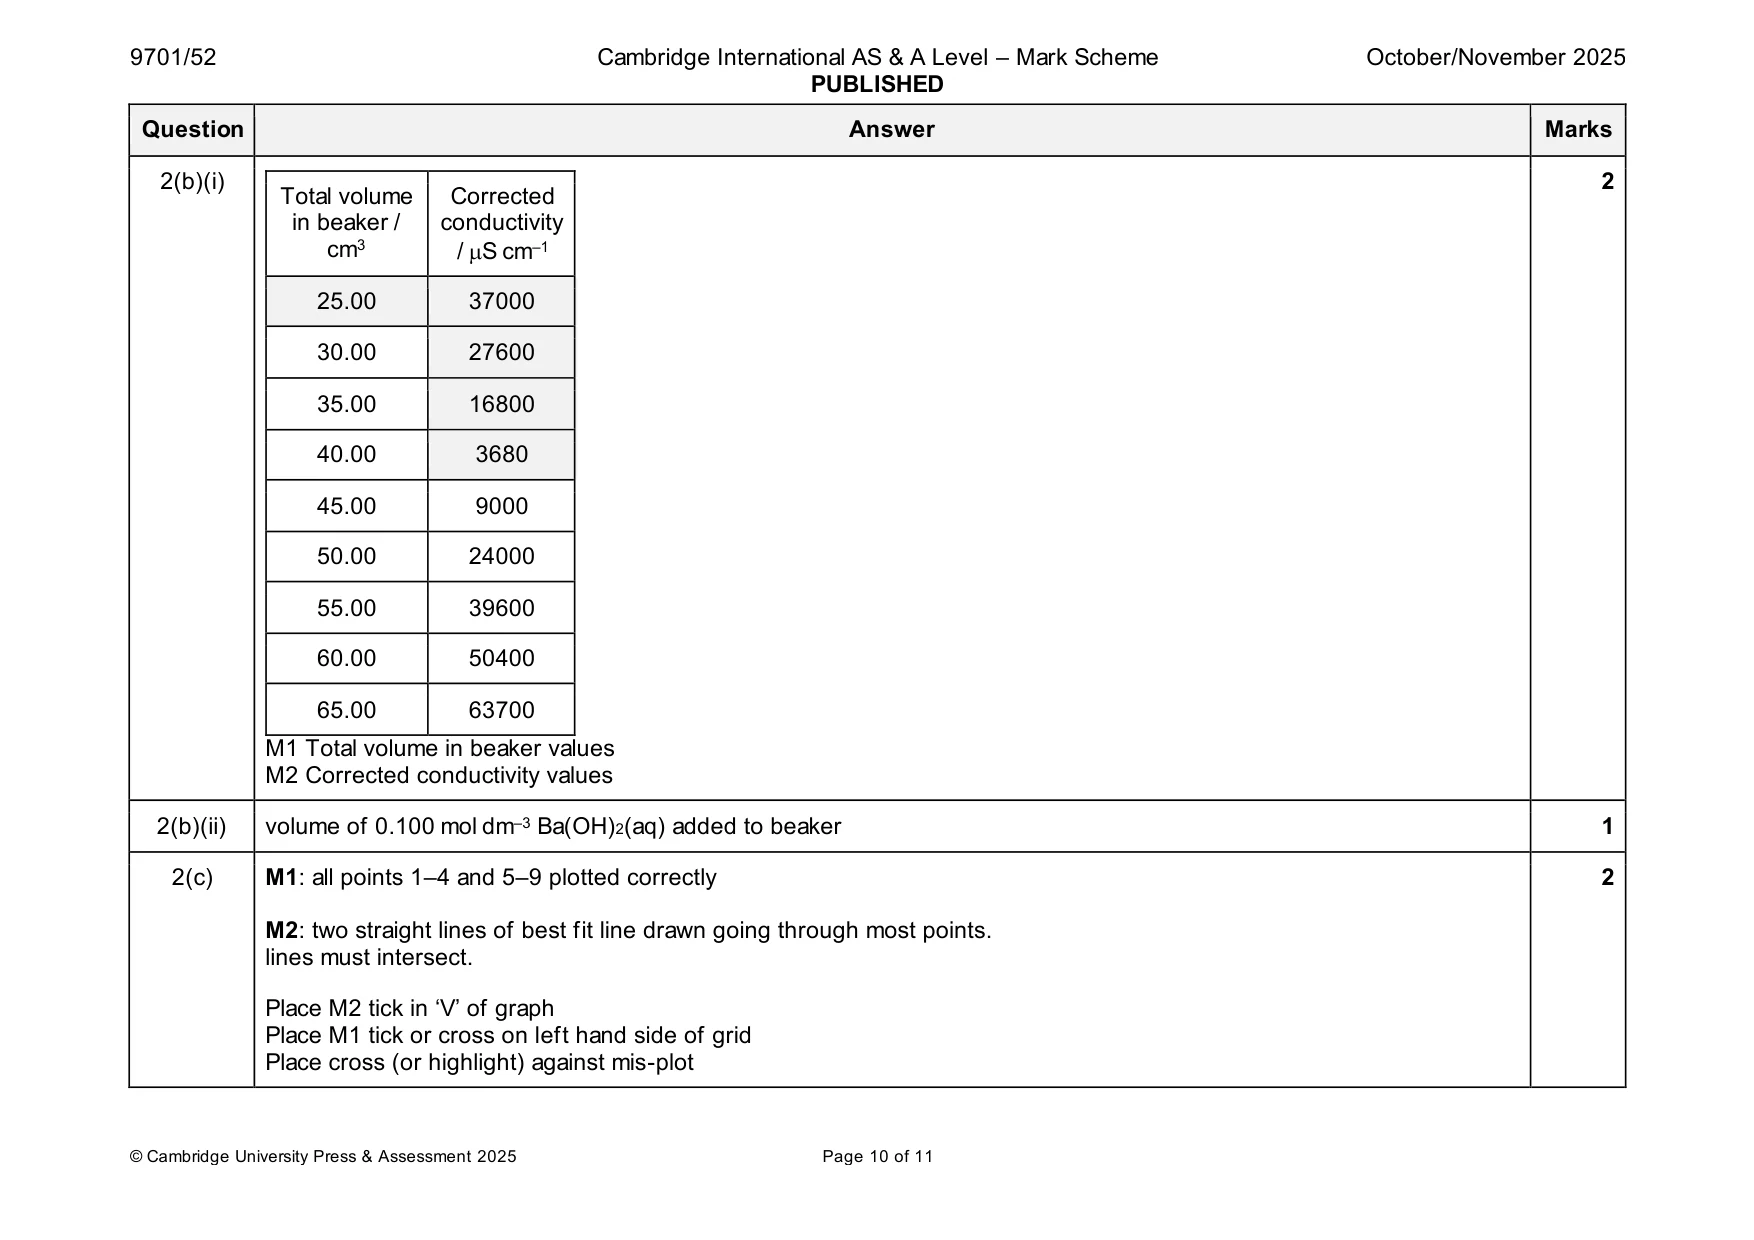
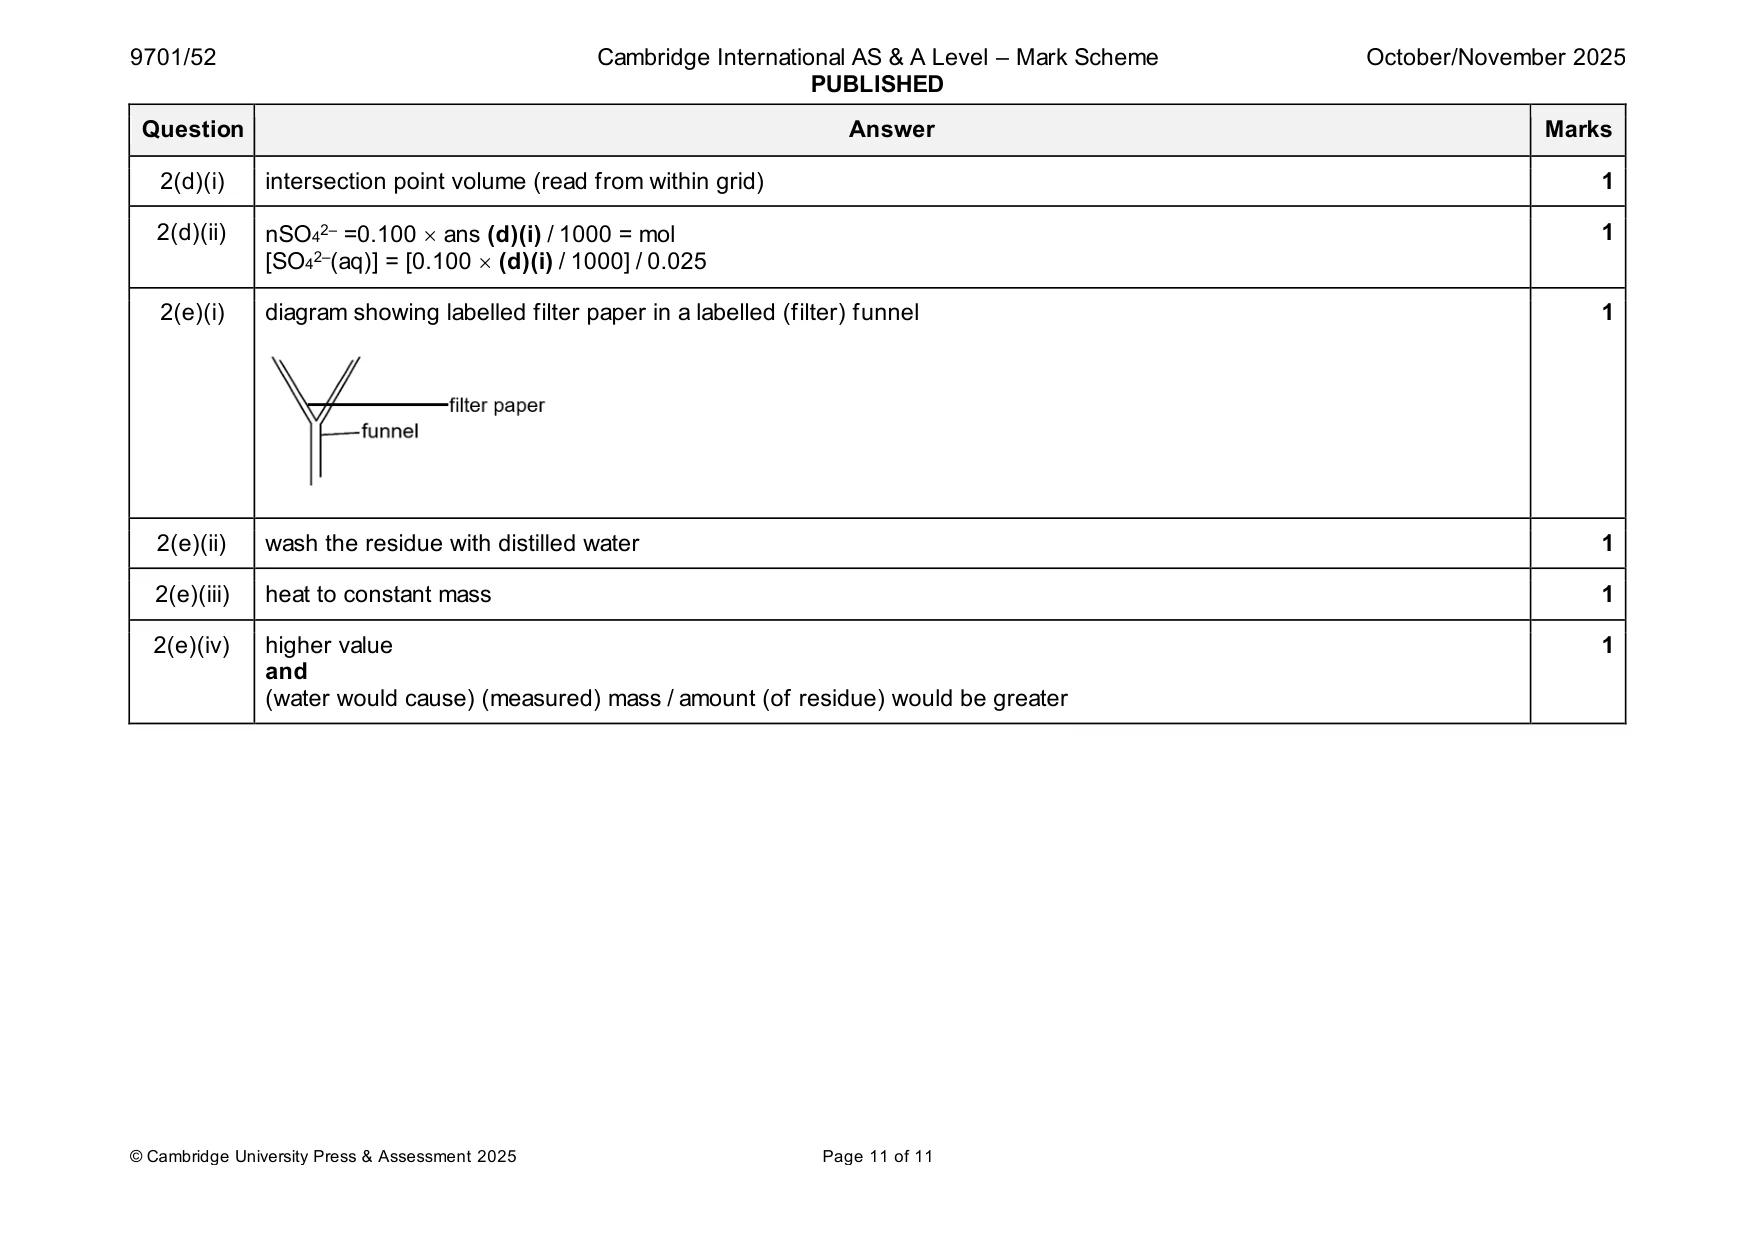
Mark scheme: 2(a)(i) (25.0 cm3) volumetric pipette 1 2(a)(ii) (wear) chemically resistant gloves 1 2(b)(i) 2 Total volume Corrected in beaker / conductivity cm3 / S cm–1 25.00 37000 30.00 27600 35.00 16800 40.00 3680 45.00 9000 50.00 24000 55.00 39600 60.00 50400 65.00 63700 M1 Total volume in beaker values M2 Corrected conductivity values 2(b)(ii) volume of 0.100 mol dm–3 Ba(OH)2(aq) added to beaker 1 2(c) M1: all points 1–4 and 5–9 plotted correctly 2 M2: two straight lines of best fit line drawn going through most points. lines must intersect. Place M2 tick in ‘V’ of graph Place M1 tick or cross on left hand side of grid Place cross (or highlight) against mis-plot 2(d)(i) intersection point volume (read from within grid) 1 2(d)(ii) nSO42– =0.100 ans (d)(i) / 1000 = mol 1 [SO42–(aq)] = [0.100 (d)(i) / 1000] / 0.025 2(e)(i) diagram showing labelled filter paper in a labelled (filter) funnel 1 2(e)(ii) wash the residue with distilled water 1 2(e)(iii) heat to constant mass 1 2(e)(iv) higher value 1 and (water would cause) (measured) mass / amount (of residue) would be greater
More questions on Reacting masses and volumes (of solutions and gases)
What was in this paper
The subtopics covered by these 2 questions, and how many questions each got. Open one in a new tab to see every Cambridge question on it.
What you needed in this session
Cambridge’s own grade thresholds for 2025 Oct/Nov, Paper 5 · Variant 2. A higher threshold means an easier paper — the bar moves with how the cohort did.