Cambridge A Level Chemistry 9701 — 2011 Oct/Nov Paper 5 · Variant 2
9701/52/O/N/11 · 30 marks · ≈34 min
The question paper and its mark scheme, free to read here and free to download. This is Cambridge’s own paper, exactly as it was sat.
Question paper12 pages




Mark scheme5 pages
Answers below. Sit the paper first if you are practising.
Paper as text
Question paper, page 1
This document consists of 8 printed pages and 4 blank pages. DC (NF/JG) 50869 © UCLES 2011 [Turn over UNIVERSITY OF CAMBRIDGE INTERNATIONAL EXAMINATIONS General Certificate of Education Advanced Subsidiary Level and Advanced Level * 2 1 4 9 9 3 5 5 1 8 * CHEMISTRY 9701/52 Paper 5 Planning, Analysis and Evaluation October/November 2011 1 hour 15 minutes Candidates answer on the Question Paper. No Additional Materials are required. READ THESE INSTRUCTIONS FIRST Write your Centre number, candidate number and name on all the work you hand in. Write in dark blue or black pen. You may use a soft pencil for any diagrams, graphs, or rough working. Do not use staples, paper clips, highlighters, glue or correction fluid. DO NOT WRITE IN ANY BARCODES. Answer all questions. You are advised to show all working in calculations. Use of Data Booklet is unnecessary. At the end of the examination, fasten all your work securely together. The number of marks is given in brackets [ ] at the end of each question or part question. For Examiner’s Use 1 2 Total
Question paper, page 2
2 9701/52/O/N/11 © UCLES 2011 BLANK PAGE
Question paper, page 3
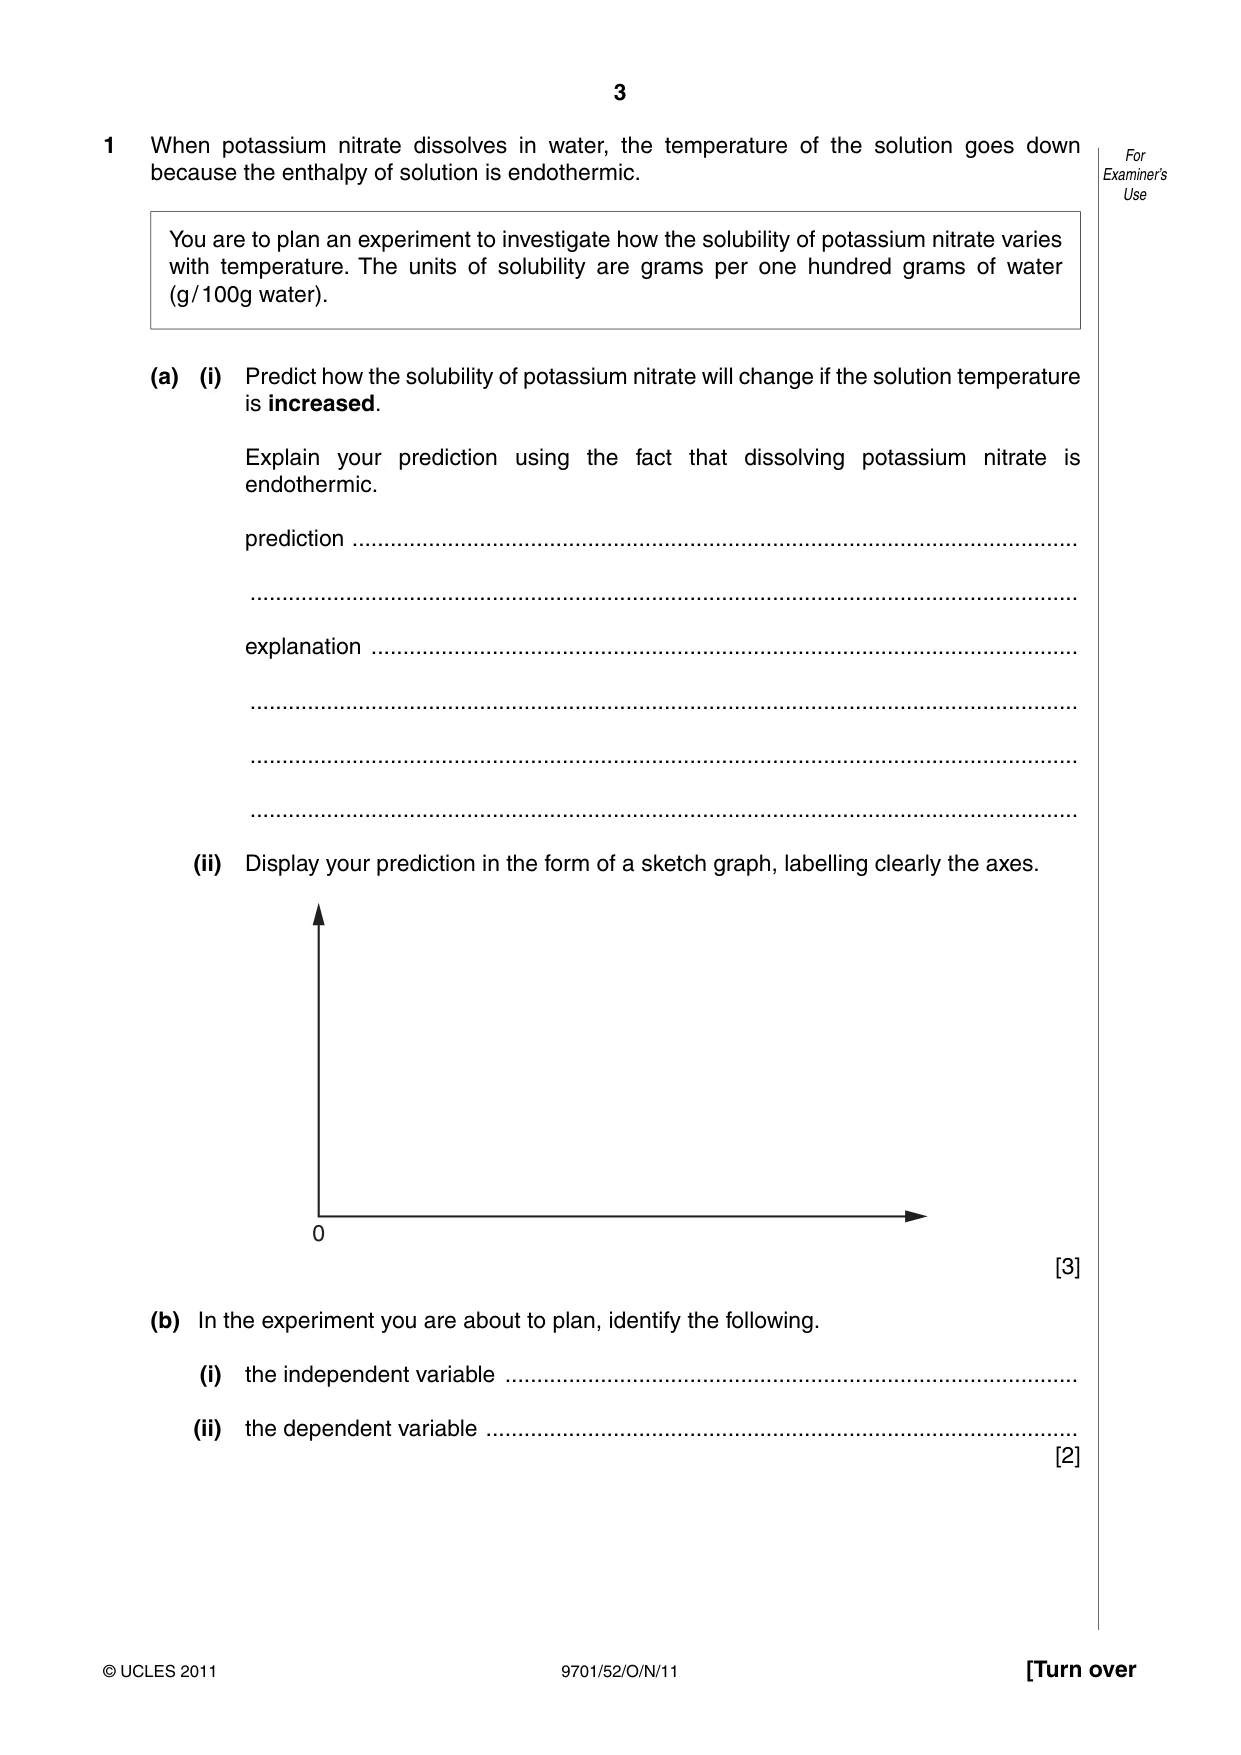
3 9701/52/O/N/11 © UCLES 2011 [Turn over For Examiner’s Use 1 When potassium nitrate dissolves in water, the temperature of the solution goes down because the enthalpy of solution is endothermic. You are to plan an experiment to investigate how the solubility of potassium nitrate varies with temperature. The units of solubility are grams per one hundred grams of water (g / 100g water). (a) (i) Predict how the solubility of potassium nitrate will change if the solution temperature is increased. Explain your prediction using the fact that dissolving potassium nitrate is endothermic. prediction … … explanation … … … … (ii) Display your prediction in the form of a sketch graph, labelling clearly the axes. 0 [3] (b) In the experiment you are about to plan, identify the following. (i) the independent variable … (ii) the dependent variable … [2]
Question paper, page 4
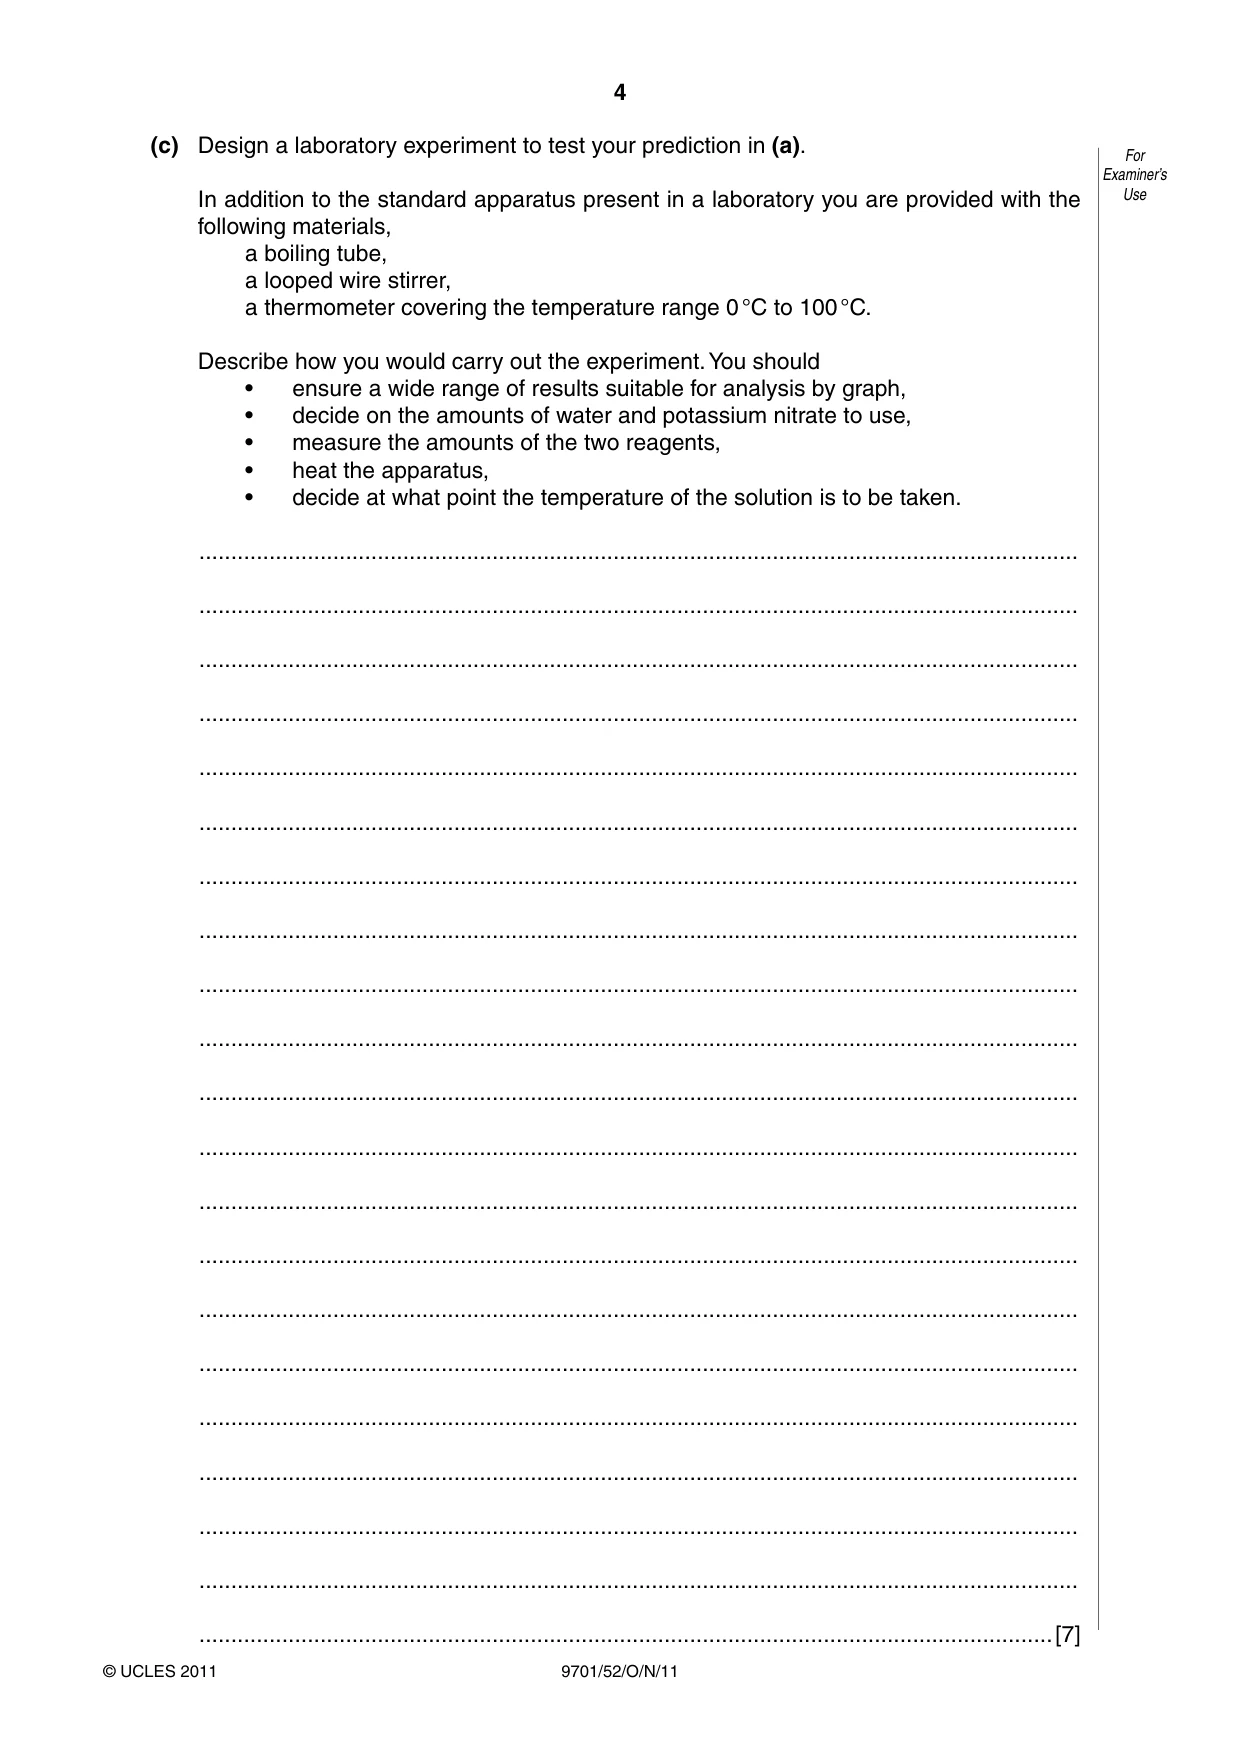
4 9701/52/O/N/11 © UCLES 2011 For Examiner’s Use (c) Design a laboratory experiment to test your prediction in (a). In addition to the standard apparatus present in a laboratory you are provided with the following materials, a boiling tube, a looped wire stirrer, a thermometer covering the temperature range 0 °C to 100 °C. Describe how you would carry out the experiment. You should • ensure a wide range of results suitable for analysis by graph, • decide on the amounts of water and potassium nitrate to use, • measure the amounts of the two reagents, • heat the apparatus, • decide at what point the temperature of the solution is to be taken. … … … … … … … … … … … … … … … … … … … … …[7]
Question paper, page 5
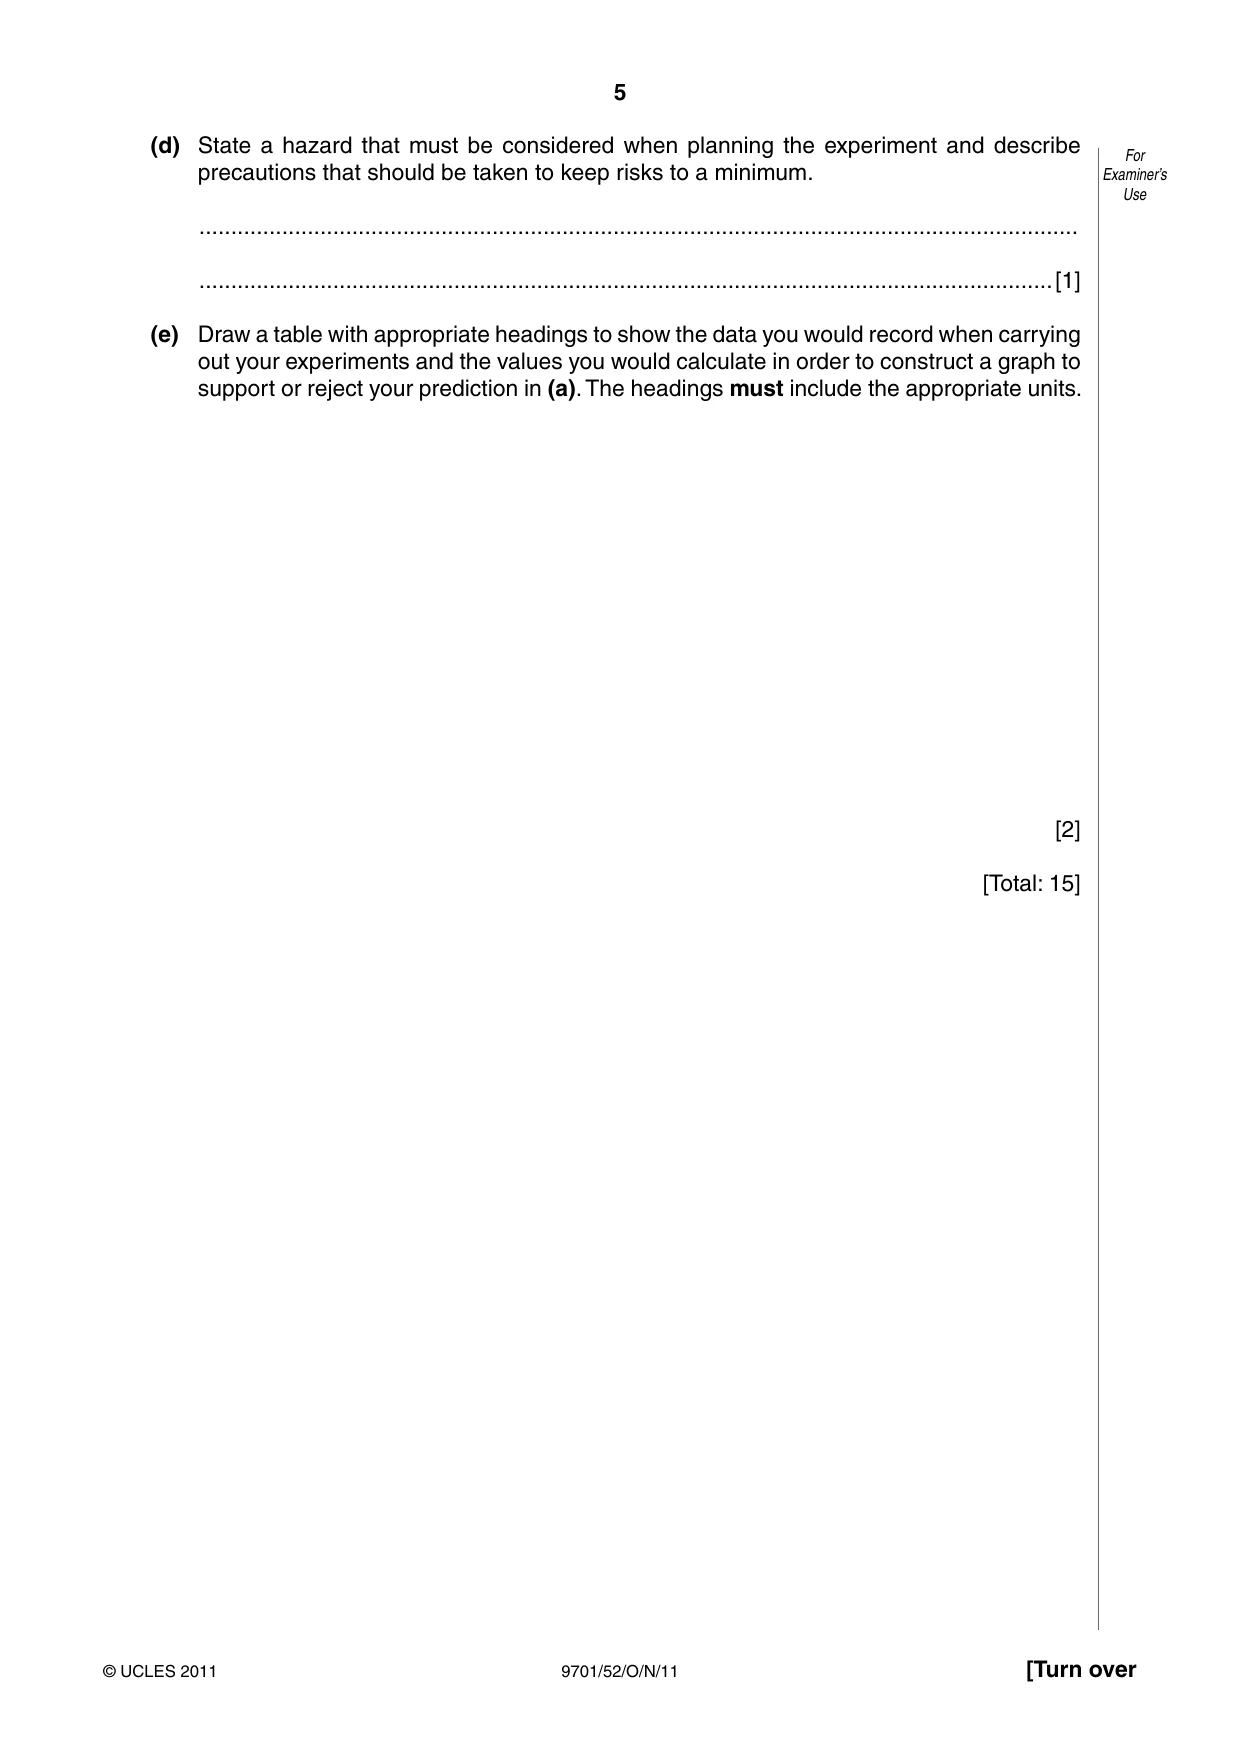
5 9701/52/O/N/11 © UCLES 2011 [Turn over For Examiner’s Use (d) State a hazard that must be considered when planning the experiment and describe precautions that should be taken to keep risks to a minimum. … …[1] (e) Draw a table with appropriate headings to show the data you would record when carrying out your experiments and the values you would calculate in order to construct a graph to support or reject your prediction in (a). The headings must include the appropriate units. [2] [Total: 15]
Question paper, page 6
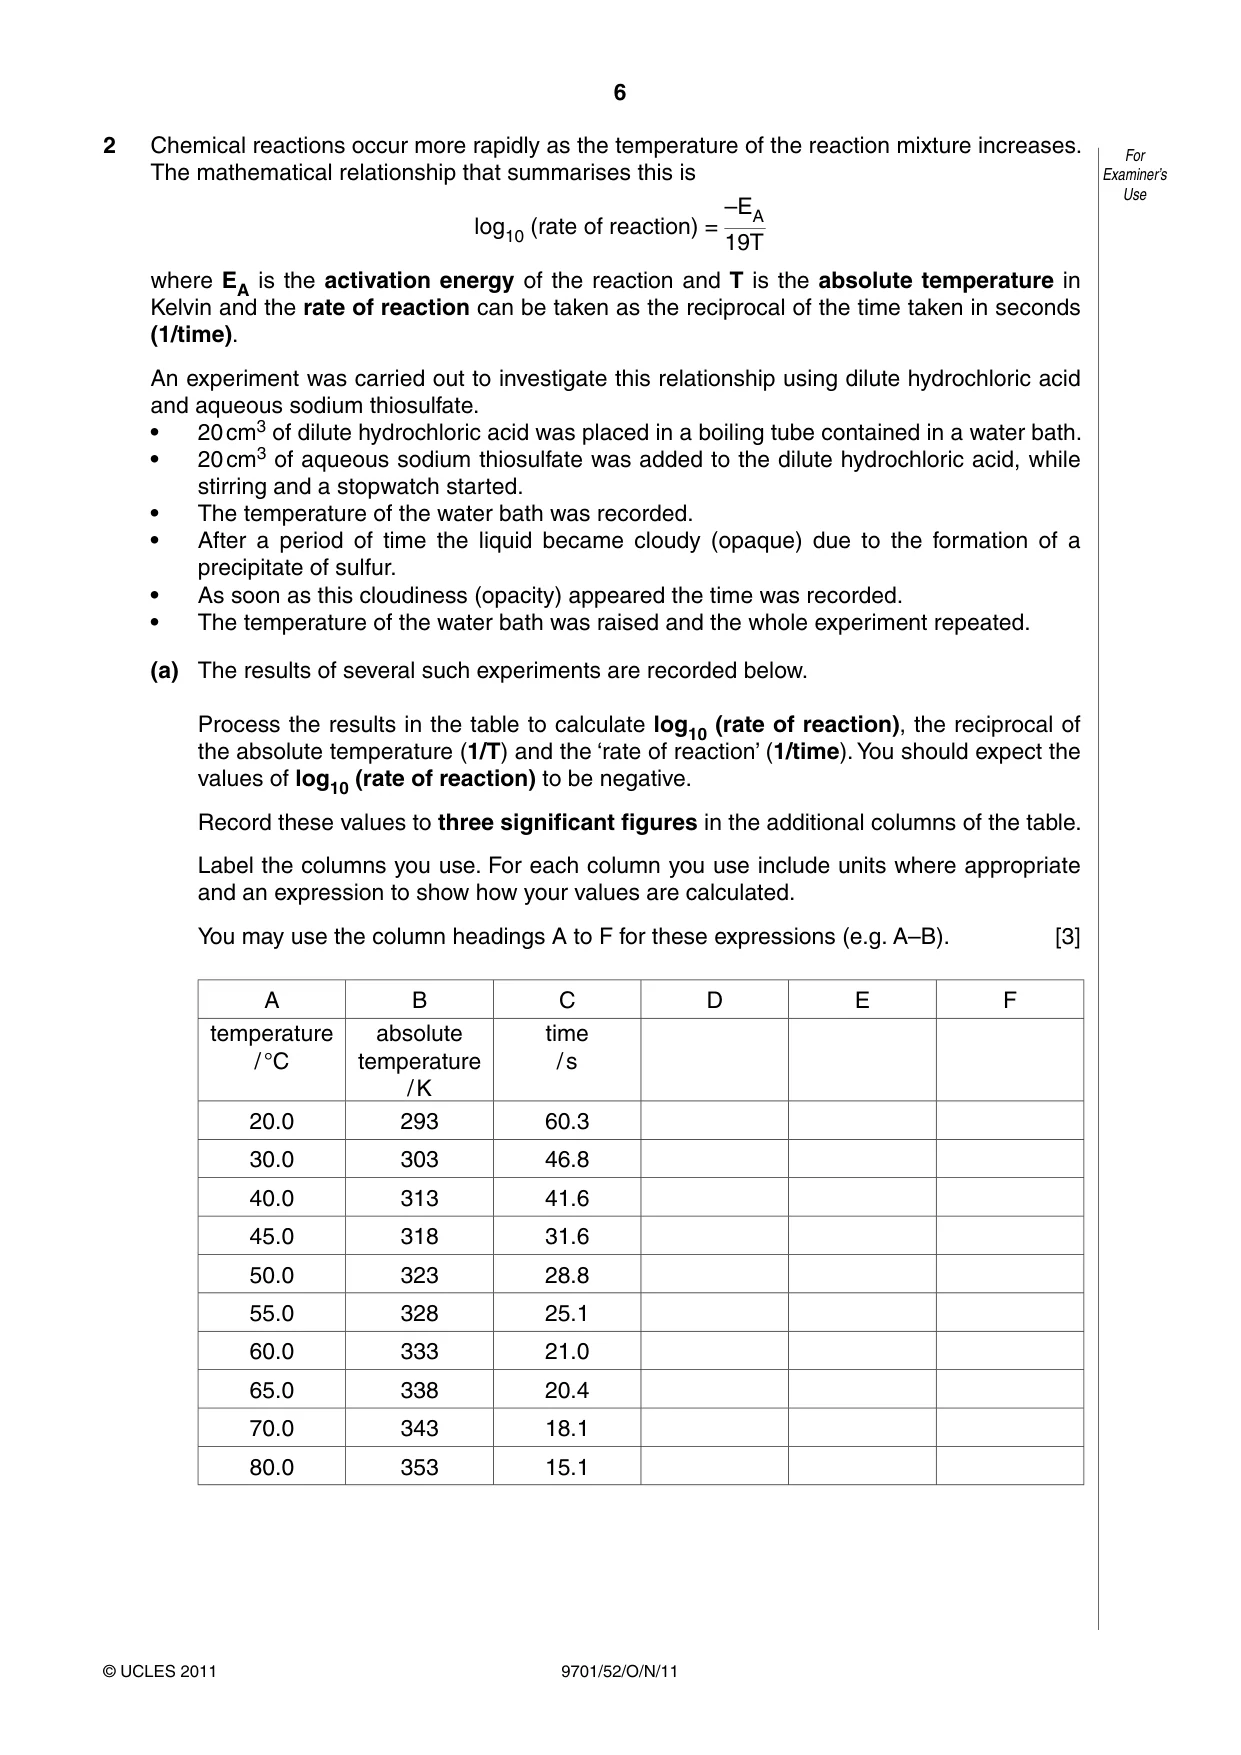
6 9701/52/O/N/11 © UCLES 2011 For Examiner’s Use 2 Chemical reactions occur more rapidly as the temperature of the reaction mixture increases. The mathematical relationship that summarises this is log10 (rate of reaction) = –EA 19T where EA is the activation energy of the reaction and T is the absolute temperature in Kelvin and the rate of reaction can be taken as the reciprocal of the time taken in seconds (1/time). An experiment was carried out to investigate this relationship using dilute hydrochloric acid and aqueous sodium thiosulfate. • 20 cm3 of dilute hydrochloric acid was placed in a boiling tube contained in a water bath. • 20 cm3 of aqueous sodium thiosulfate was added to the dilute hydrochloric acid, while stirring and a stopwatch started. • The temperature of the water bath was recorded. • After a period of time the liquid became cloudy (opaque) due to the formation of a precipitate of sulfur. • As soon as this cloudiness (opacity) appeared the time was recorded. • The temperature of the water bath was raised and the whole experiment repeated. (a) The results of several such experiments are recorded below. Process the results in the table to calculate log10 (rate of reaction), the reciprocal of the absolute temperature (1/T) and the ‘rate of reaction’ (1/time). You should expect the values of log10 (rate of reaction) to be negative. Record these values to three significant figures in the additional columns of the table. Label the columns you use. For each column you use include units where appropriate and an expression to show how your values are calculated. You may use the column headings A to F for these expressions (e.g. A–B). [3] A B C D E F temperature / °C absolute temperature / K time / s 20.0 293 60.3 30.0 303 46.8 40.0 313 41.6 45.0 318 31.6 50.0 323 28.8 55.0 328 25.1 60.0 333 21.0 65.0 338 20.4 70.0 343 18.1 80.0 353 15.1
Question paper, page 7
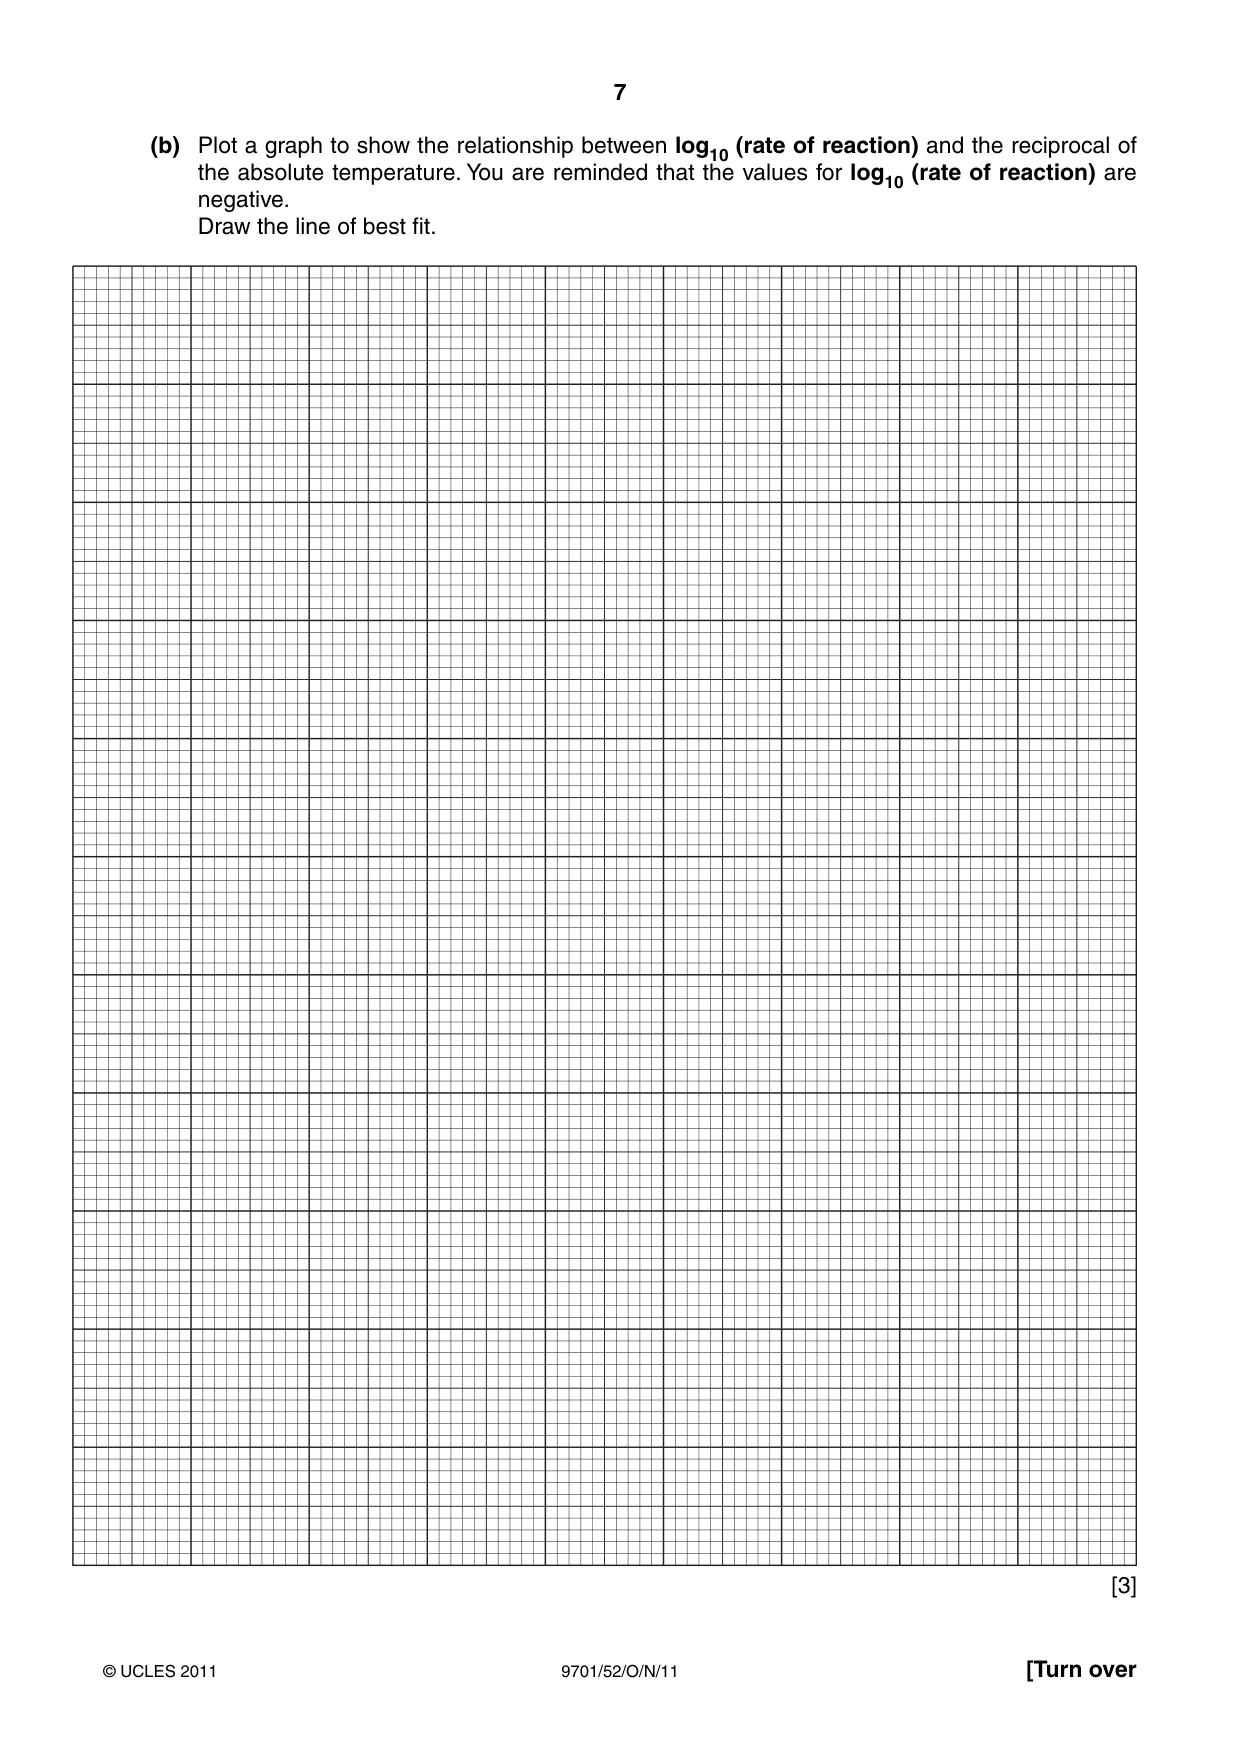
7 9701/52/O/N/11 © UCLES 2011 [Turn over (b) Plot a graph to show the relationship between log10 (rate of reaction) and the reciprocal of the absolute temperature. You are reminded that the values for log10 (rate of reaction) are negative. Draw the line of best fit. [3]
Question paper, page 8
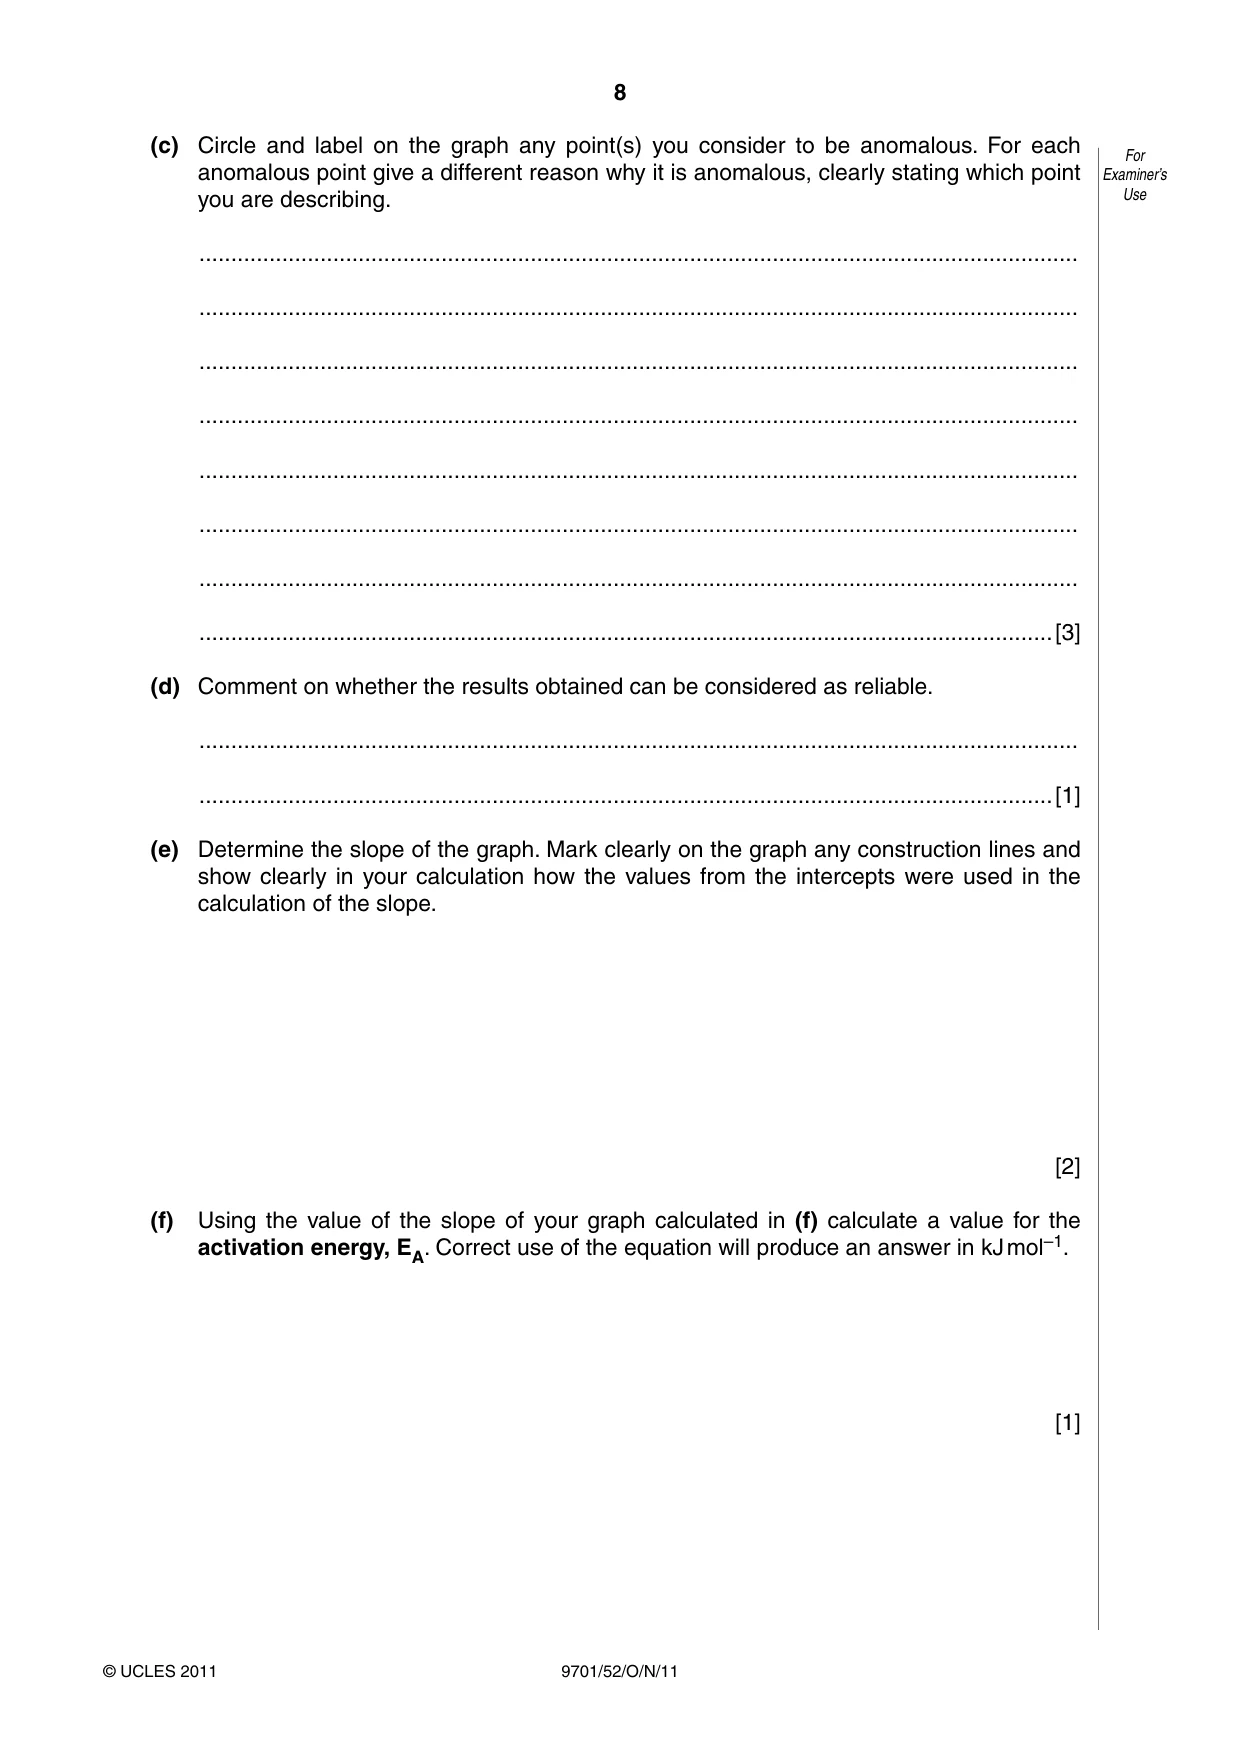
8 9701/52/O/N/11 © UCLES 2011 For Examiner’s Use (c) Circle and label on the graph any point(s) you consider to be anomalous. For each anomalous point give a different reason why it is anomalous, clearly stating which point you are describing. … … … … … … … …[3] (d) Comment on whether the results obtained can be considered as reliable. … …[1] (e) Determine the slope of the graph. Mark clearly on the graph any construction lines and show clearly in your calculation how the values from the intercepts were used in the calculation of the slope. [2] (f) Using the value of the slope of your graph calculated in (f) calculate a value for the activation energy, EA. Correct use of the equation will produce an answer in kJ mol–1. [1]
Question paper, page 9
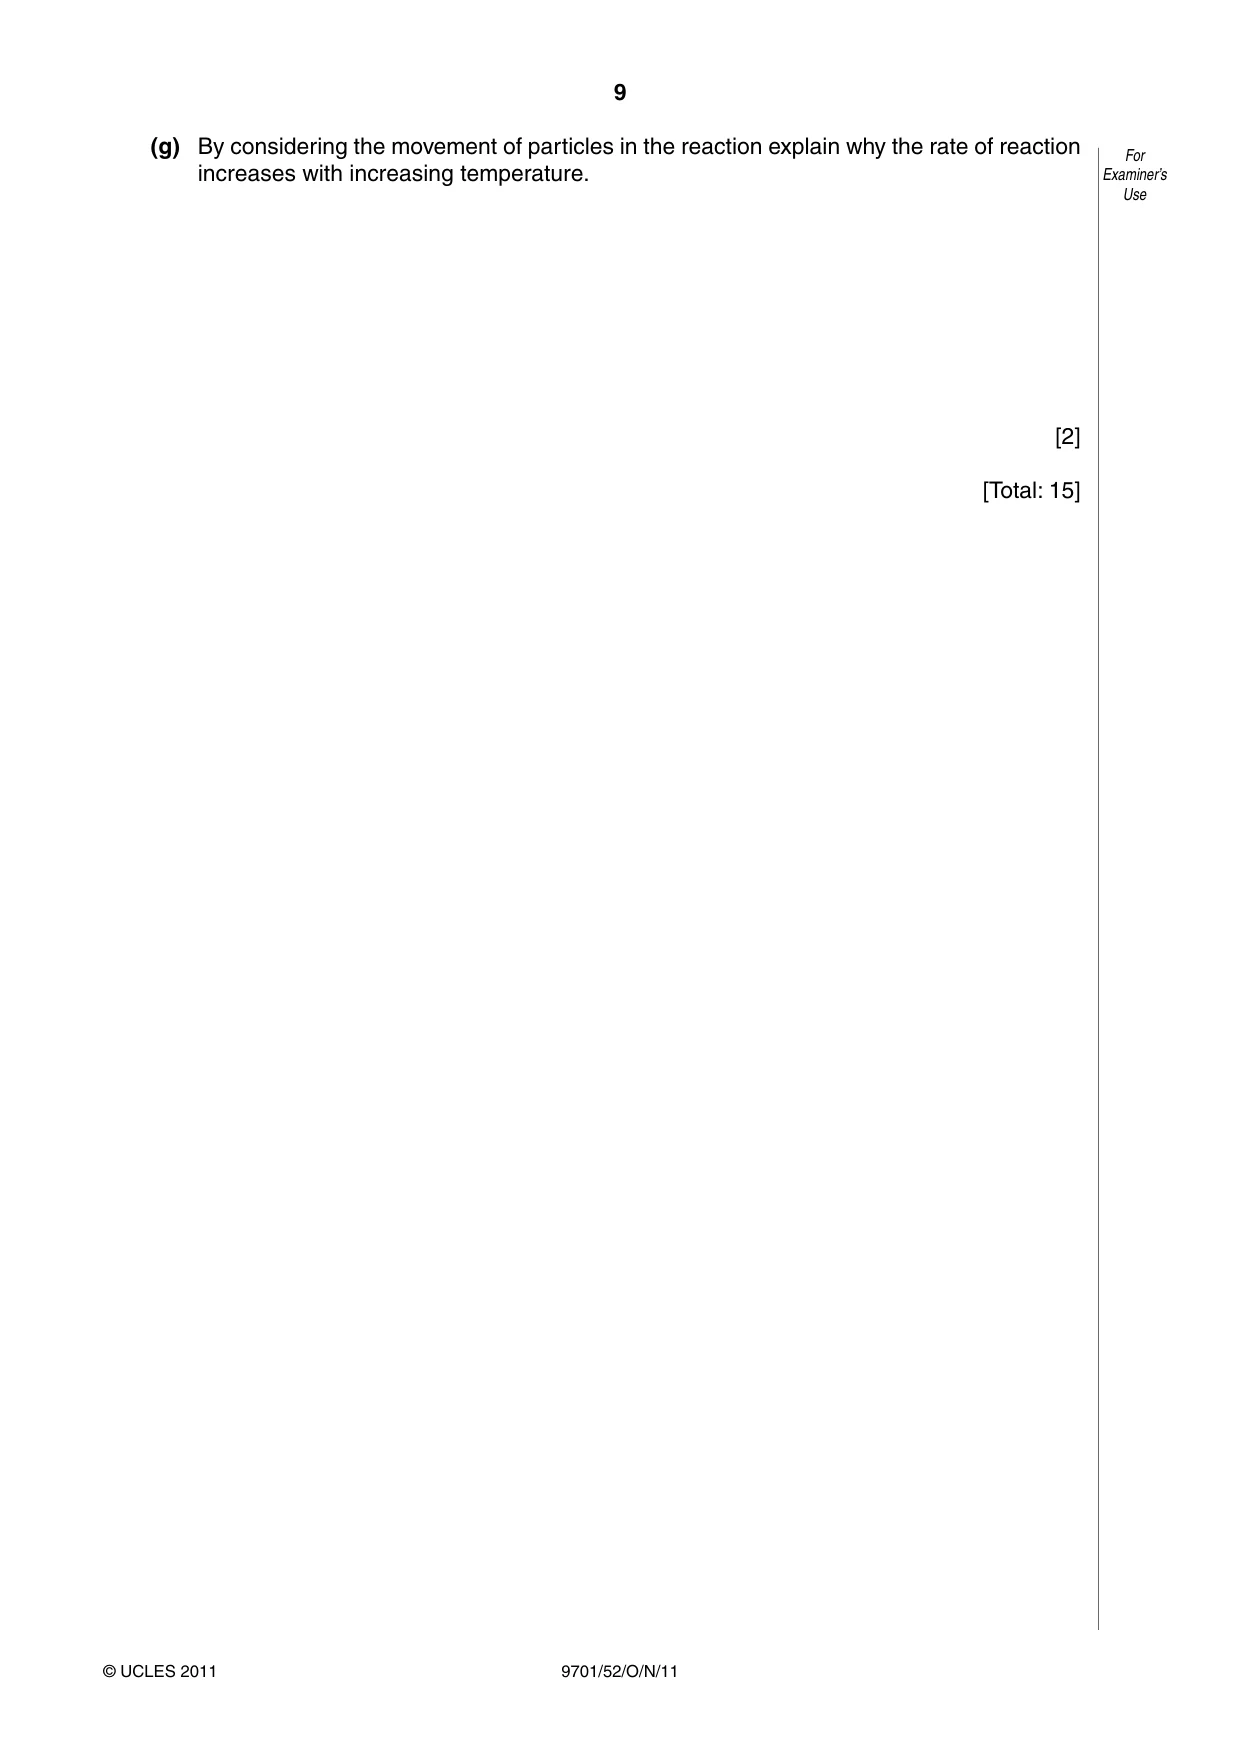
9 9701/52/O/N/11 © UCLES 2011 For Examiner’s Use (g) By considering the movement of particles in the reaction explain why the rate of reaction increases with increasing temperature. [2] [Total: 15]
Question paper, page 10
10 9701/52/O/N/11 © UCLES 2011 BLANK PAGE
Question paper, page 11
11 9701/52/O/N/11 © UCLES 2011 BLANK PAGE
Question paper, page 12
12 9701/52/O/N/11 © UCLES 2011 BLANK PAGE Permission to reproduce items where third-party owned material protected by copyright is included has been sought and cleared where possible. Every reasonable effort has been made by the publisher (UCLES) to trace copyright holders, but if any items requiring clearance have unwittingly been included, the publisher will be pleased to make amends at the earliest possible opportunity. University of Cambridge International Examinations is part of the Cambridge Assessment Group. Cambridge Assessment is the brand name of University of Cambridge Local Examinations Syndicate (UCLES), which is itself a department of the University of Cambridge.
Mark scheme, page 1
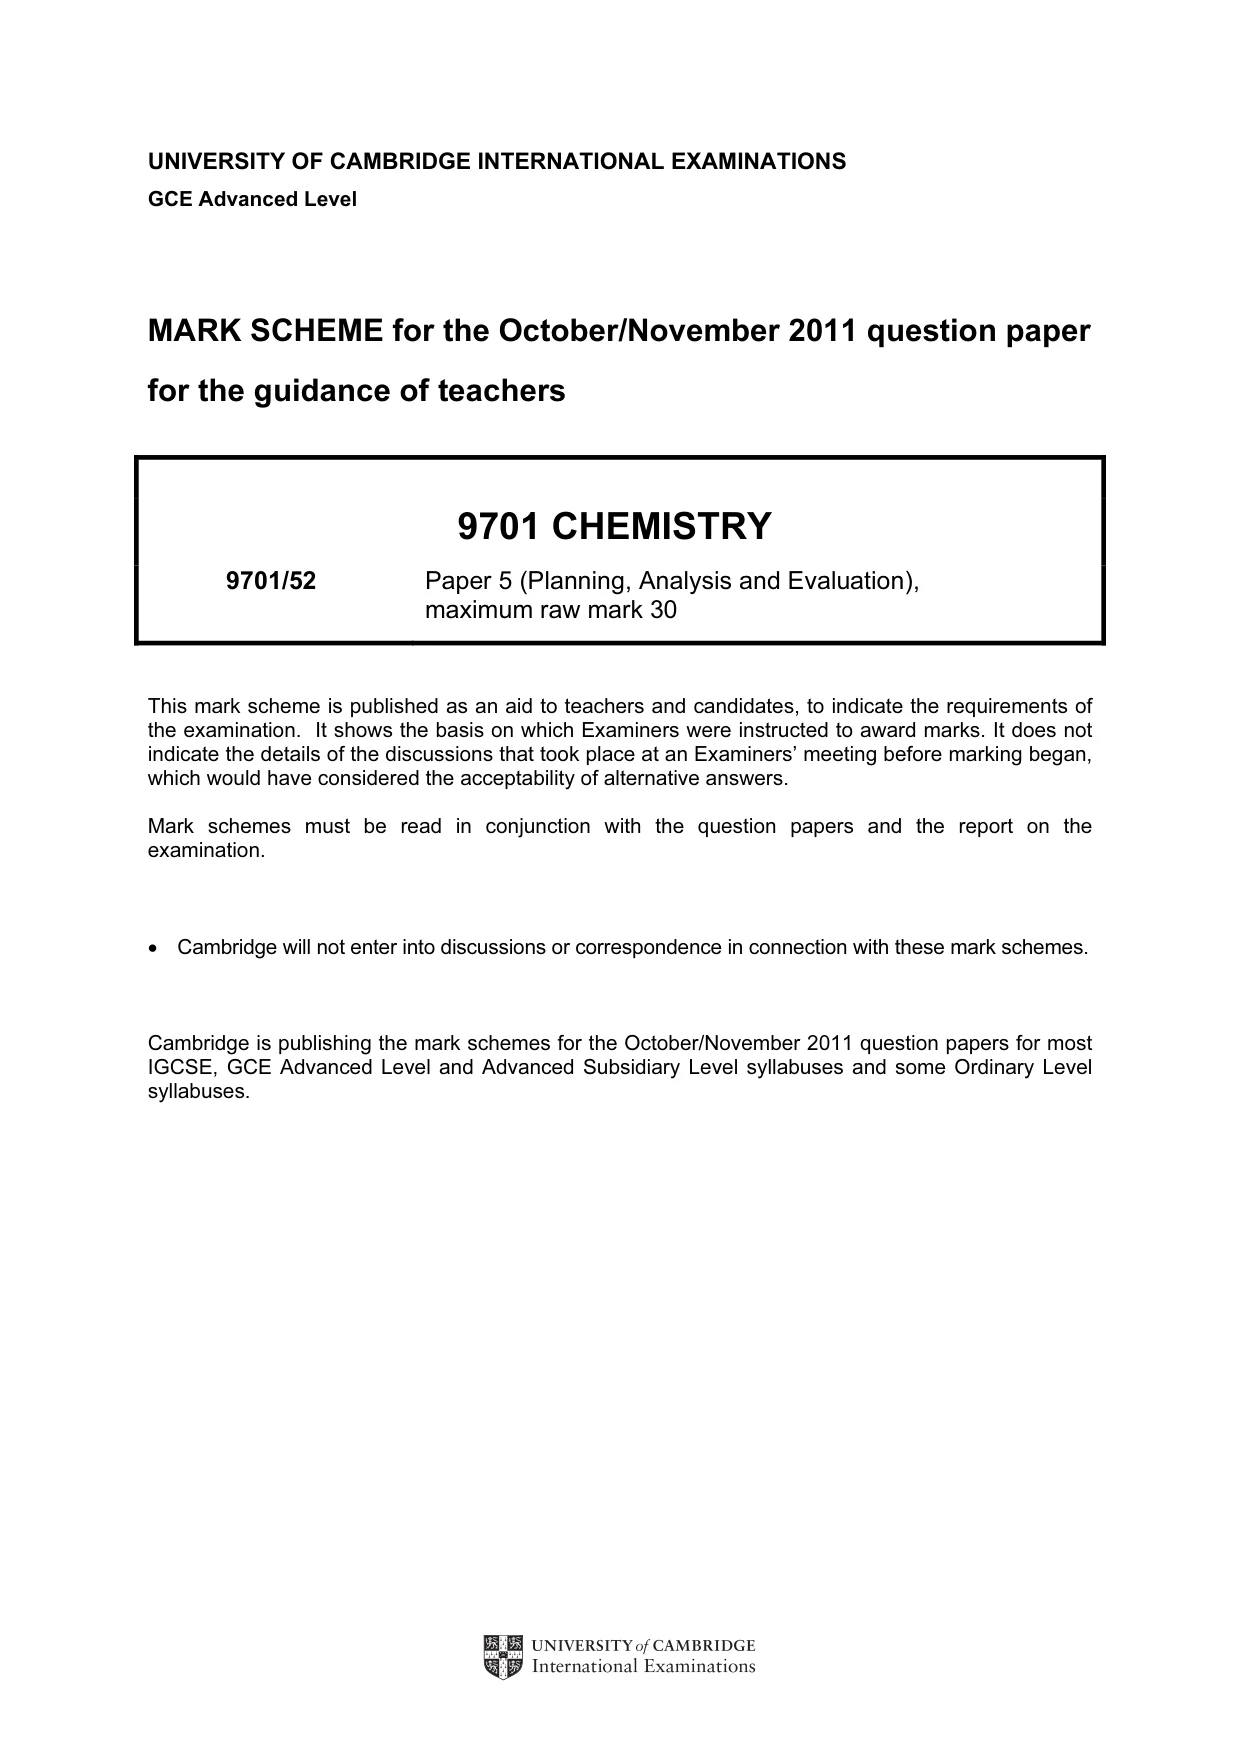
UNIVERSITY OF CAMBRIDGE INTERNATIONAL EXAMINATIONS GCE Advanced Level MARK SCHEME for the October/November 2011 question paper for the guidance of teachers 9701 CHEMISTRY 9701/52 Paper 5 (Planning, Analysis and Evaluation), maximum raw mark 30 This mark scheme is published as an aid to teachers and candidates, to indicate the requirements of the examination. It shows the basis on which Examiners were instructed to award marks. It does not indicate the details of the discussions that took place at an Examiners’ meeting before marking began, which would have considered the acceptability of alternative answers. Mark schemes must be read in conjunction with the question papers and the report on the examination. • Cambridge will not enter into discussions or correspondence in connection with these mark schemes. Cambridge is publishing the mark schemes for the October/November 2011 question papers for most IGCSE, GCE Advanced Level and Advanced Subsidiary Level syllabuses and some Ordinary Level syllabuses.
Mark scheme, page 2
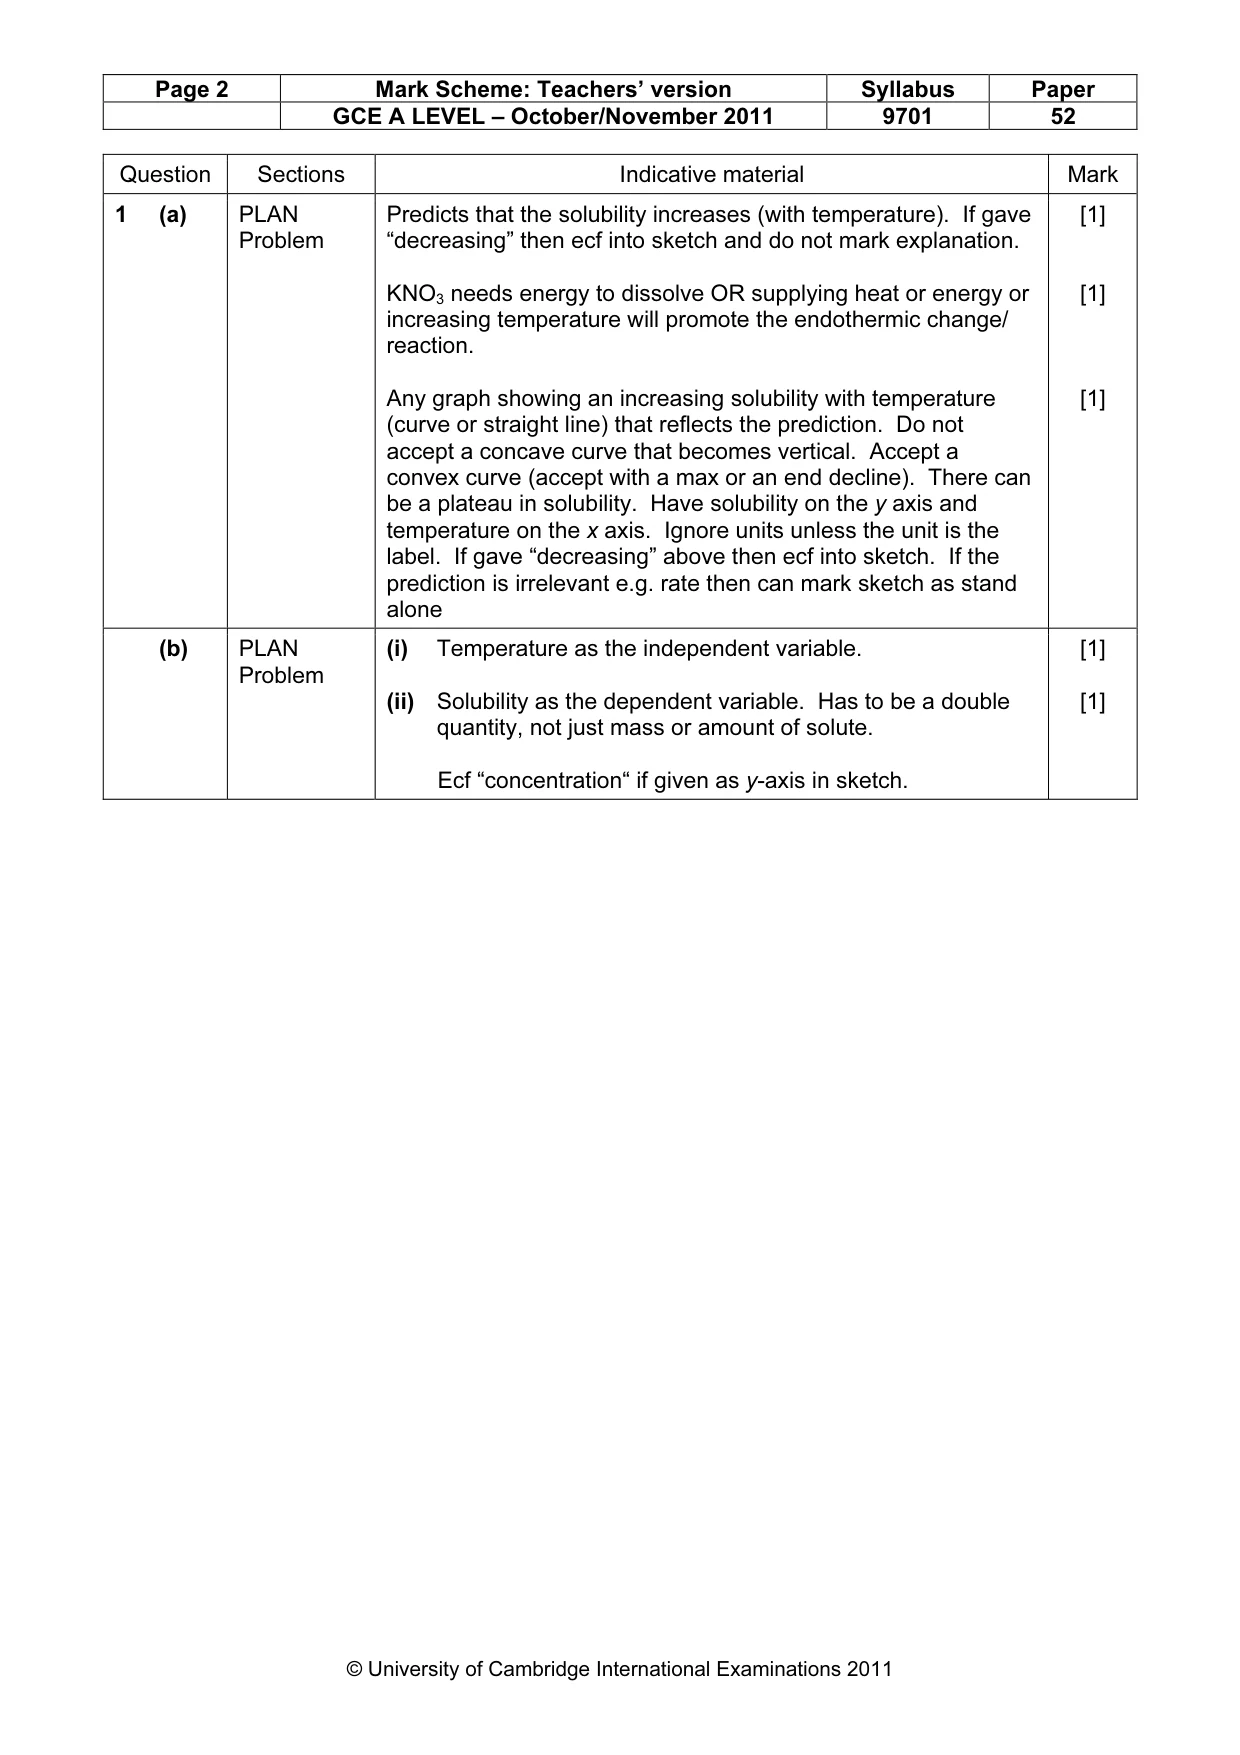
Page 2 Mark Scheme: Teachers’ version Syllabus Paper GCE A LEVEL – October/November 2011 9701 52 © University of Cambridge International Examinations 2011 Question Sections Indicative material Mark 1 (a) PLAN Problem Predicts that the solubility increases (with temperature). If gave “decreasing” then ecf into sketch and do not mark explanation. KNO3 needs energy to dissolve OR supplying heat or energy or increasing temperature will promote the endothermic change/ reaction. Any graph showing an increasing solubility with temperature (curve or straight line) that reflects the prediction. Do not accept a concave curve that becomes vertical. Accept a convex curve (accept with a max or an end decline). There can be a plateau in solubility. Have solubility on the y axis and temperature on the x axis. Ignore units unless the unit is the label. If gave “decreasing” above then ecf into sketch. If the prediction is irrelevant e.g. rate then can mark sketch as stand alone [1] [1] [1] (b) PLAN Problem (i) Temperature as the independent variable. (ii) Solubility as the dependent variable. Has to be a double quantity, not just mass or amount of solute. Ecf “concentration“ if given as y-axis in sketch. [1] [1]
Mark scheme, page 3
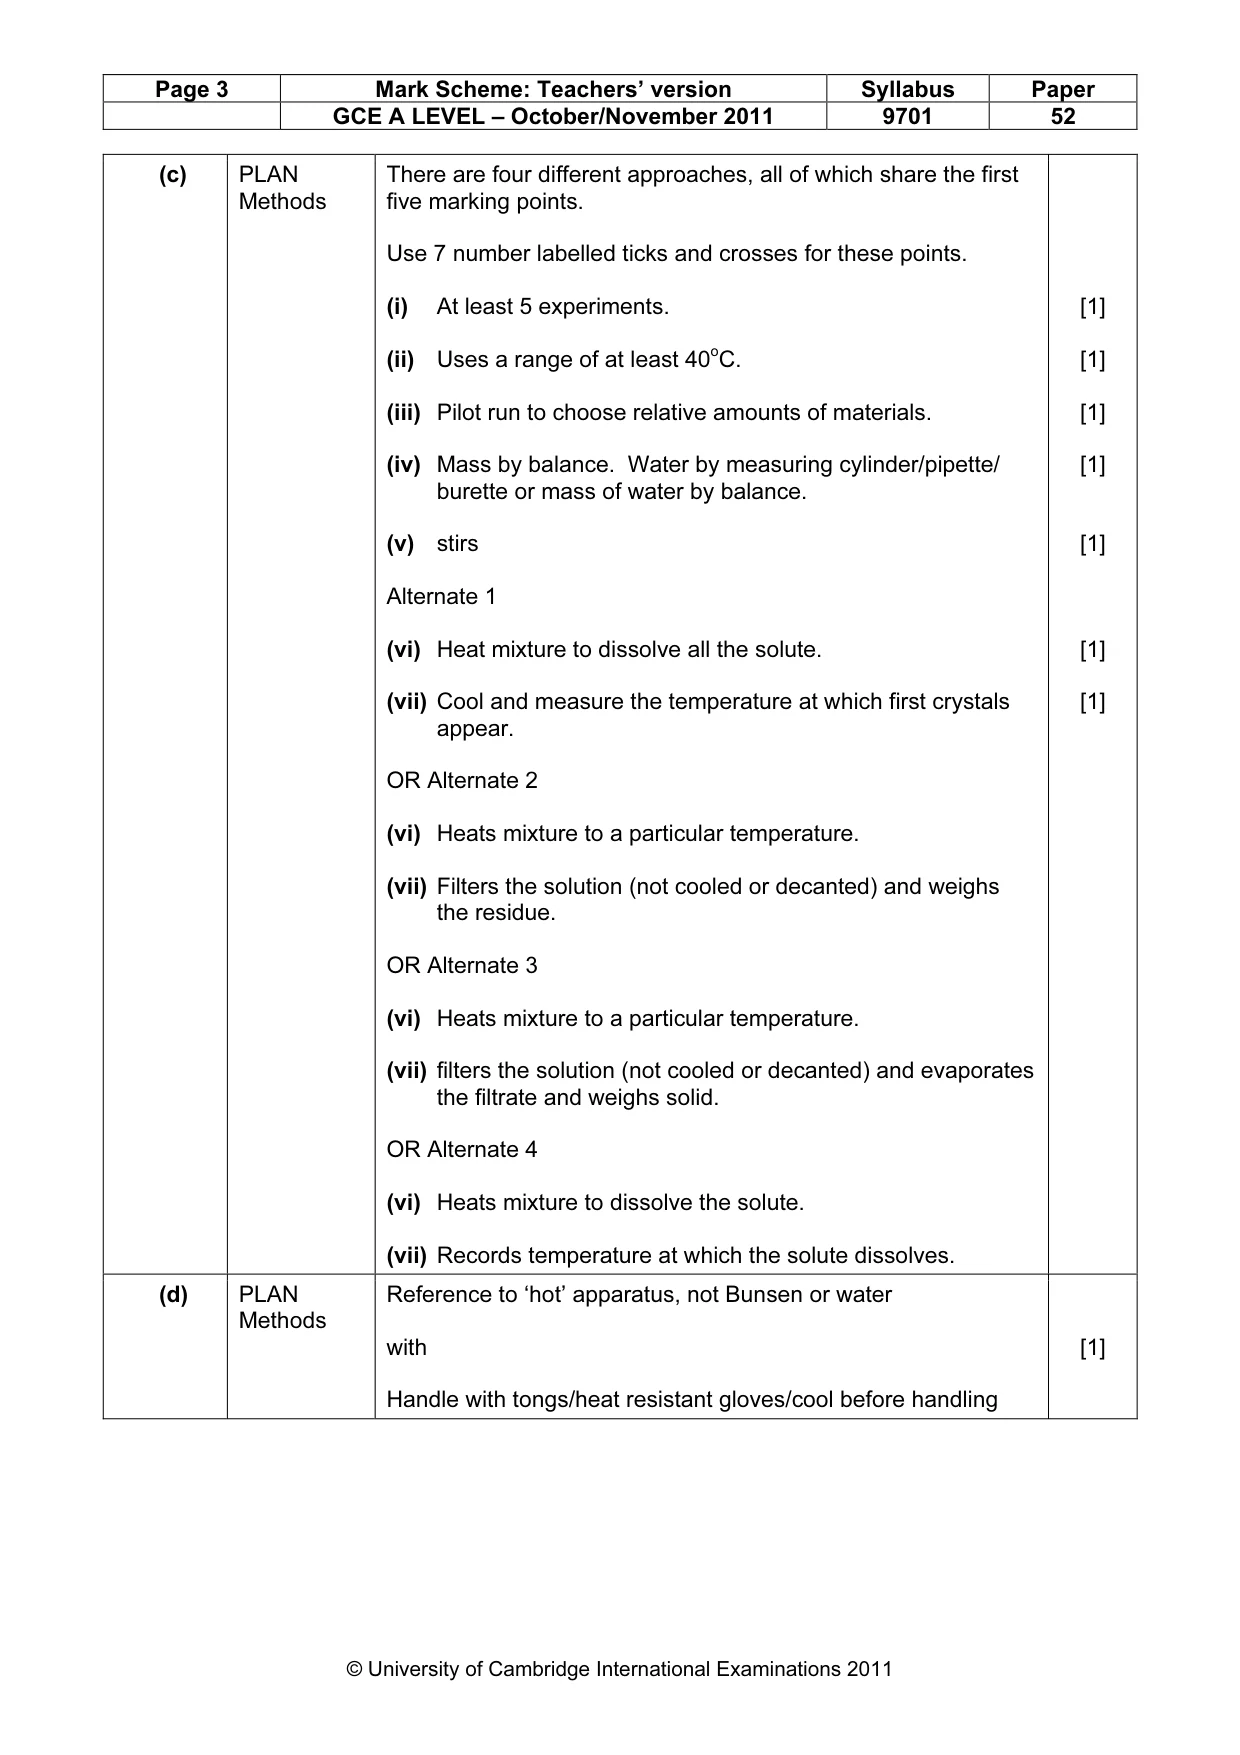
Page 3 Mark Scheme: Teachers’ version Syllabus Paper GCE A LEVEL – October/November 2011 9701 52 © University of Cambridge International Examinations 2011 (c) PLAN Methods There are four different approaches, all of which share the first five marking points. Use 7 number labelled ticks and crosses for these points. (i) At least 5 experiments. (ii) Uses a range of at least 40oC. (iii) Pilot run to choose relative amounts of materials. (iv) Mass by balance. Water by measuring cylinder/pipette/ burette or mass of water by balance. (v) stirs Alternate 1 (vi) Heat mixture to dissolve all the solute. (vii) Cool and measure the temperature at which first crystals appear. OR Alternate 2 (vi) Heats mixture to a particular temperature. (vii) Filters the solution (not cooled or decanted) and weighs the residue. OR Alternate 3 (vi) Heats mixture to a particular temperature. (vii) filters the solution (not cooled or decanted) and evaporates the filtrate and weighs solid. OR Alternate 4 (vi) Heats mixture to dissolve the solute. (vii) Records temperature at which the solute dissolves. [1] [1] [1] [1] [1] [1] [1] (d) PLAN Methods Reference to ‘hot’ apparatus, not Bunsen or water with Handle with tongs/heat resistant gloves/cool before handling [1]
Mark scheme, page 4
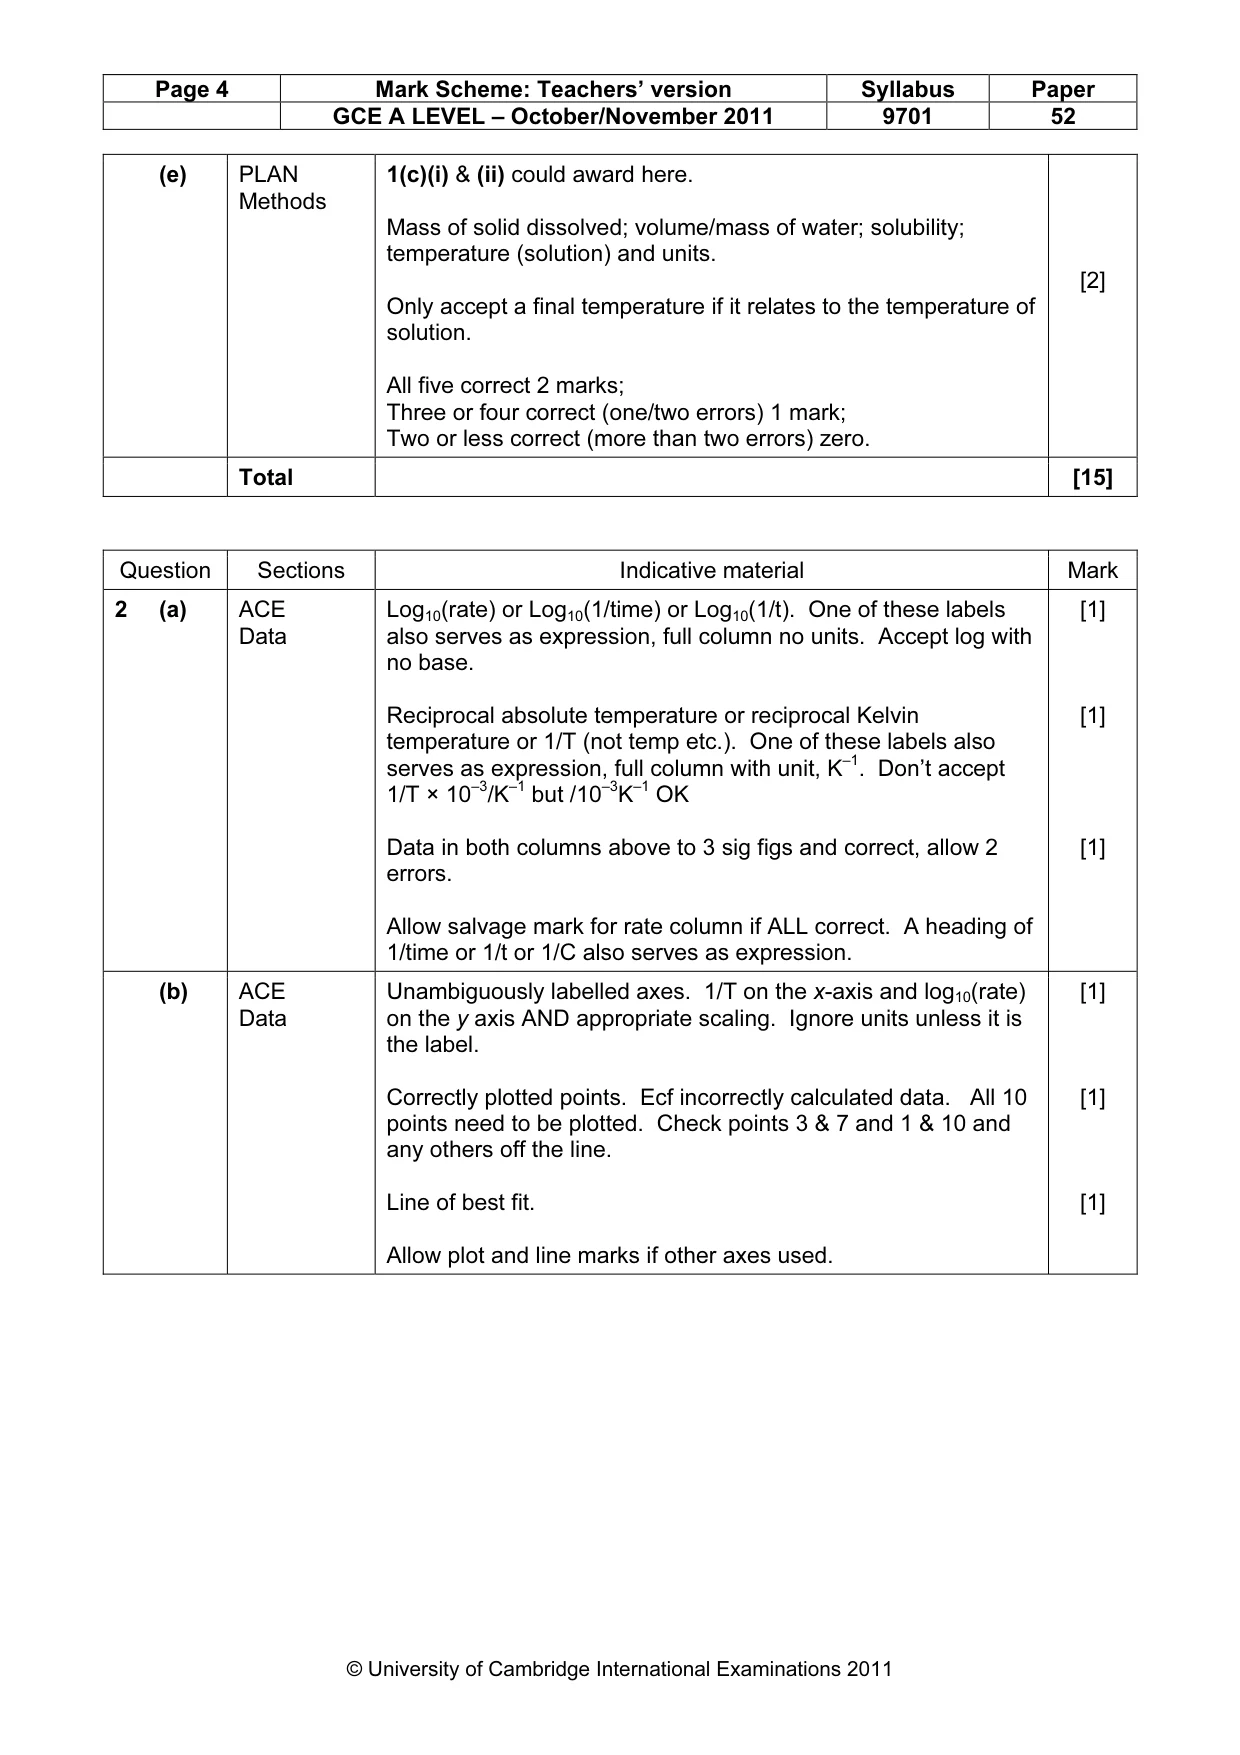
Page 4 Mark Scheme: Teachers’ version Syllabus Paper GCE A LEVEL – October/November 2011 9701 52 © University of Cambridge International Examinations 2011 (e) PLAN Methods 1(c)(i) & (ii) could award here. Mass of solid dissolved; volume/mass of water; solubility; temperature (solution) and units. Only accept a final temperature if it relates to the temperature of solution. All five correct 2 marks; Three or four correct (one/two errors) 1 mark; Two or less correct (more than two errors) zero. [2] Total [15] Question Sections Indicative material Mark 2 (a) ACE Data Log10(rate) or Log10(1/time) or Log10(1/t). One of these labels also serves as expression, full column no units. Accept log with no base. Reciprocal absolute temperature or reciprocal Kelvin temperature or 1/T (not temp etc.). One of these labels also serves as expression, full column with unit, K–1. Don’t accept 1/T × 10–3/K–1 but /10–3K–1 OK Data in both columns above to 3 sig figs and correct, allow 2 errors. Allow salvage mark for rate column if ALL correct. A heading of 1/time or 1/t or 1/C also serves as expression. [1] [1] [1] (b) ACE Data Unambiguously labelled axes. 1/T on the x-axis and log10(rate) on the y axis AND appropriate scaling. Ignore units unless it is the label. Correctly plotted points. Ecf incorrectly calculated data. All 10 points need to be plotted. Check points 3 & 7 and 1 & 10 and any others off the line. Line of best fit. Allow plot and line marks if other axes used. [1] [1] [1]
Mark scheme, page 5
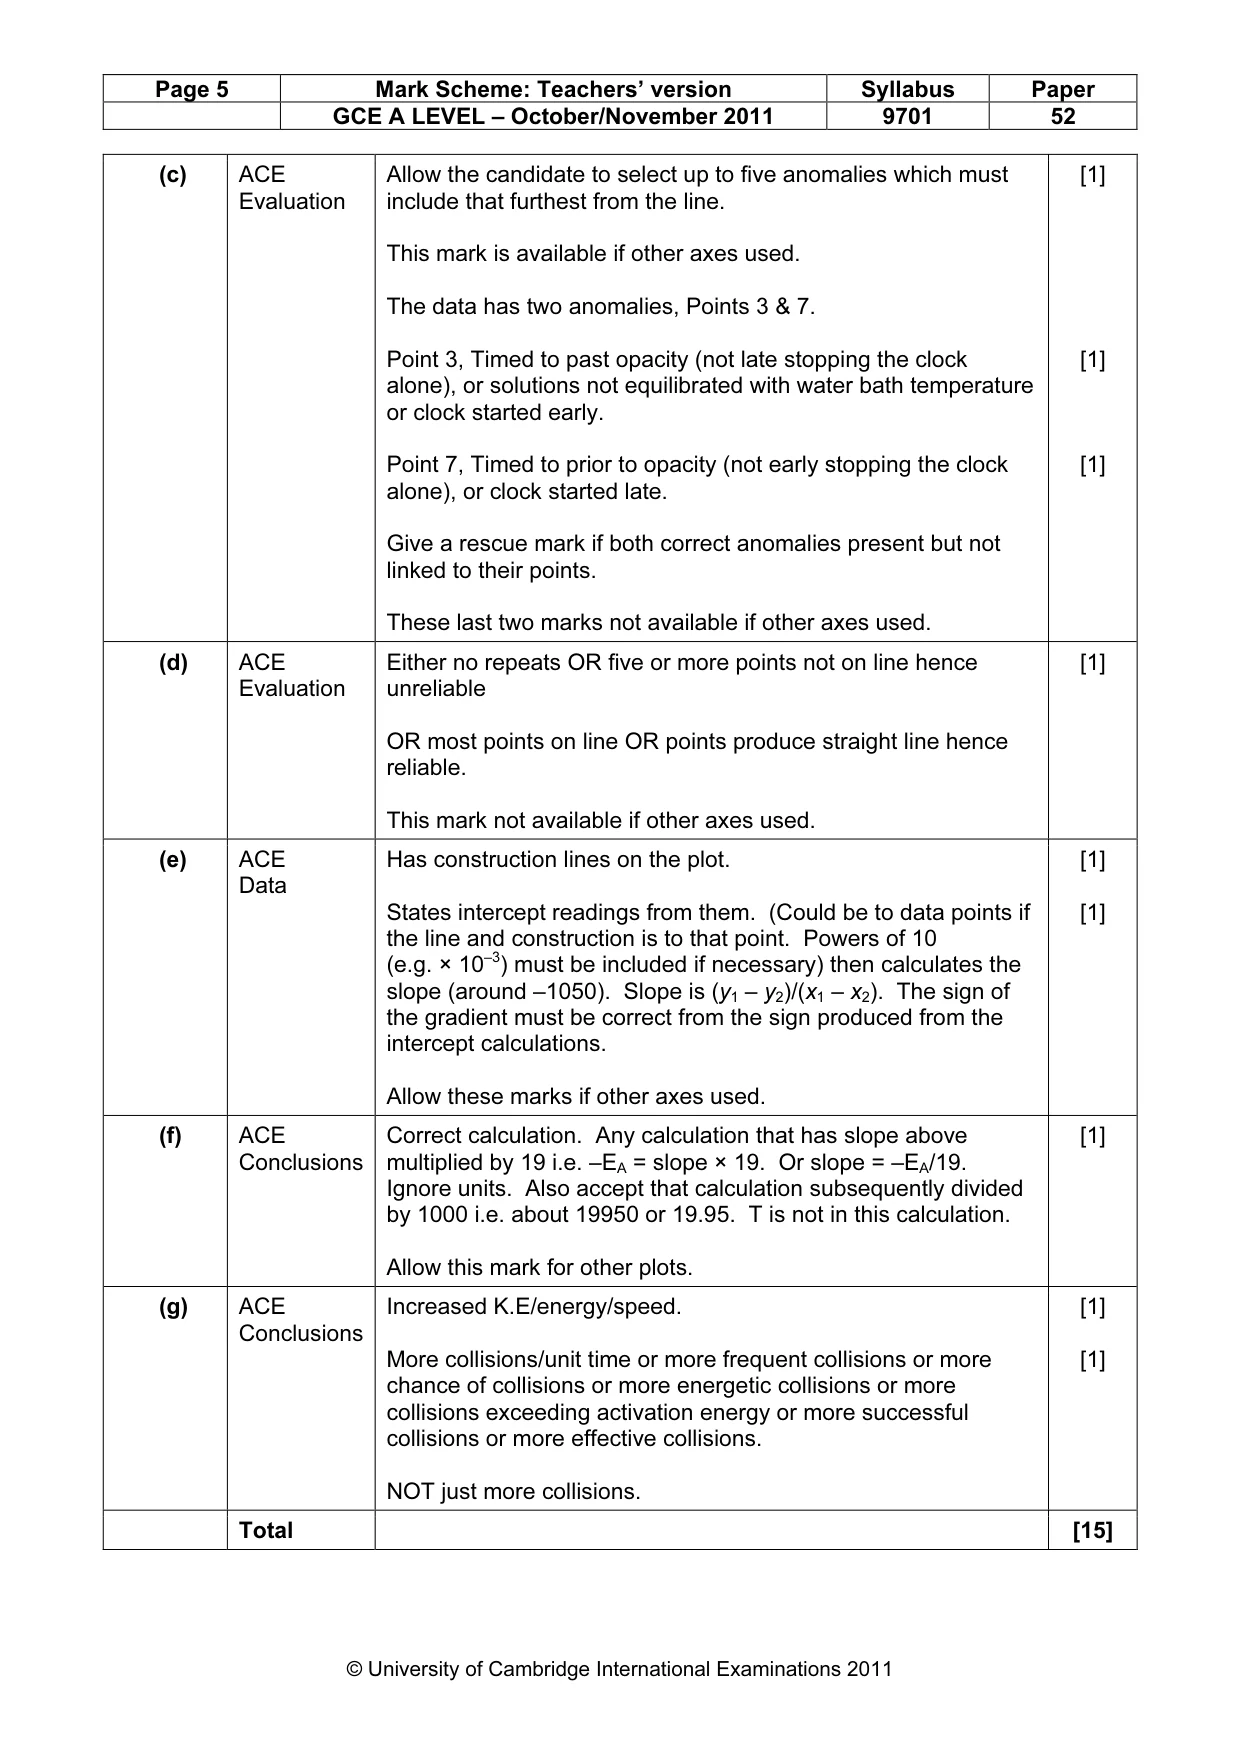
Page 5 Mark Scheme: Teachers’ version Syllabus Paper GCE A LEVEL – October/November 2011 9701 52 © University of Cambridge International Examinations 2011 (c) ACE Evaluation Allow the candidate to select up to five anomalies which must include that furthest from the line. This mark is available if other axes used. The data has two anomalies, Points 3 & 7. Point 3, Timed to past opacity (not late stopping the clock alone), or solutions not equilibrated with water bath temperature or clock started early. Point 7, Timed to prior to opacity (not early stopping the clock alone), or clock started late. Give a rescue mark if both correct anomalies present but not linked to their points. These last two marks not available if other axes used. [1] [1] [1] (d) ACE Evaluation Either no repeats OR five or more points not on line hence unreliable OR most points on line OR points produce straight line hence reliable. This mark not available if other axes used. [1] (e) ACE Data Has construction lines on the plot. States intercept readings from them. (Could be to data points if the line and construction is to that point. Powers of 10 (e.g. × 10–3) must be included if necessary) then calculates the slope (around –1050). Slope is (y1 – y2)/(x1 – x2). The sign of the gradient must be correct from the sign produced from the intercept calculations. Allow these marks if other axes used. [1] [1] (f) ACE Conclusions Correct calculation. Any calculation that has slope above multiplied by 19 i.e. –EA = slope × 19. Or slope = –EA/19. Ignore units. Also accept that calculation subsequently divided by 1000 i.e. about 19950 or 19.95. T is not in this calculation. Allow this mark for other plots. [1] (g) ACE Conclusions Increased K.E/energy/speed. More collisions/unit time or more frequent collisions or more chance of collisions or more energetic collisions or more collisions exceeding activation energy or more successful collisions or more effective collisions. NOT just more collisions. [1] [1] Total [15]
What you needed in this session
Cambridge’s own grade thresholds for 2011 Oct/Nov, Paper 5 · Variant 2. A higher threshold means an easier paper — the bar moves with how the cohort did.