Cambridge A Level Biology 9700 — 2025 Oct/Nov Paper 5 · Variant 4
9700/54/O/N/25 · 3 questions · 30 marks · 75 min
The question paper and its mark scheme, free to read here and free to download. This is Cambridge’s own paper, exactly as it was sat.
Question paper16 pages
Mark scheme12 pages
Answers below. Sit the paper first if you are practising.
Questions as text
Q1 · Beta vulgaris vulgaris, as shown in Fig
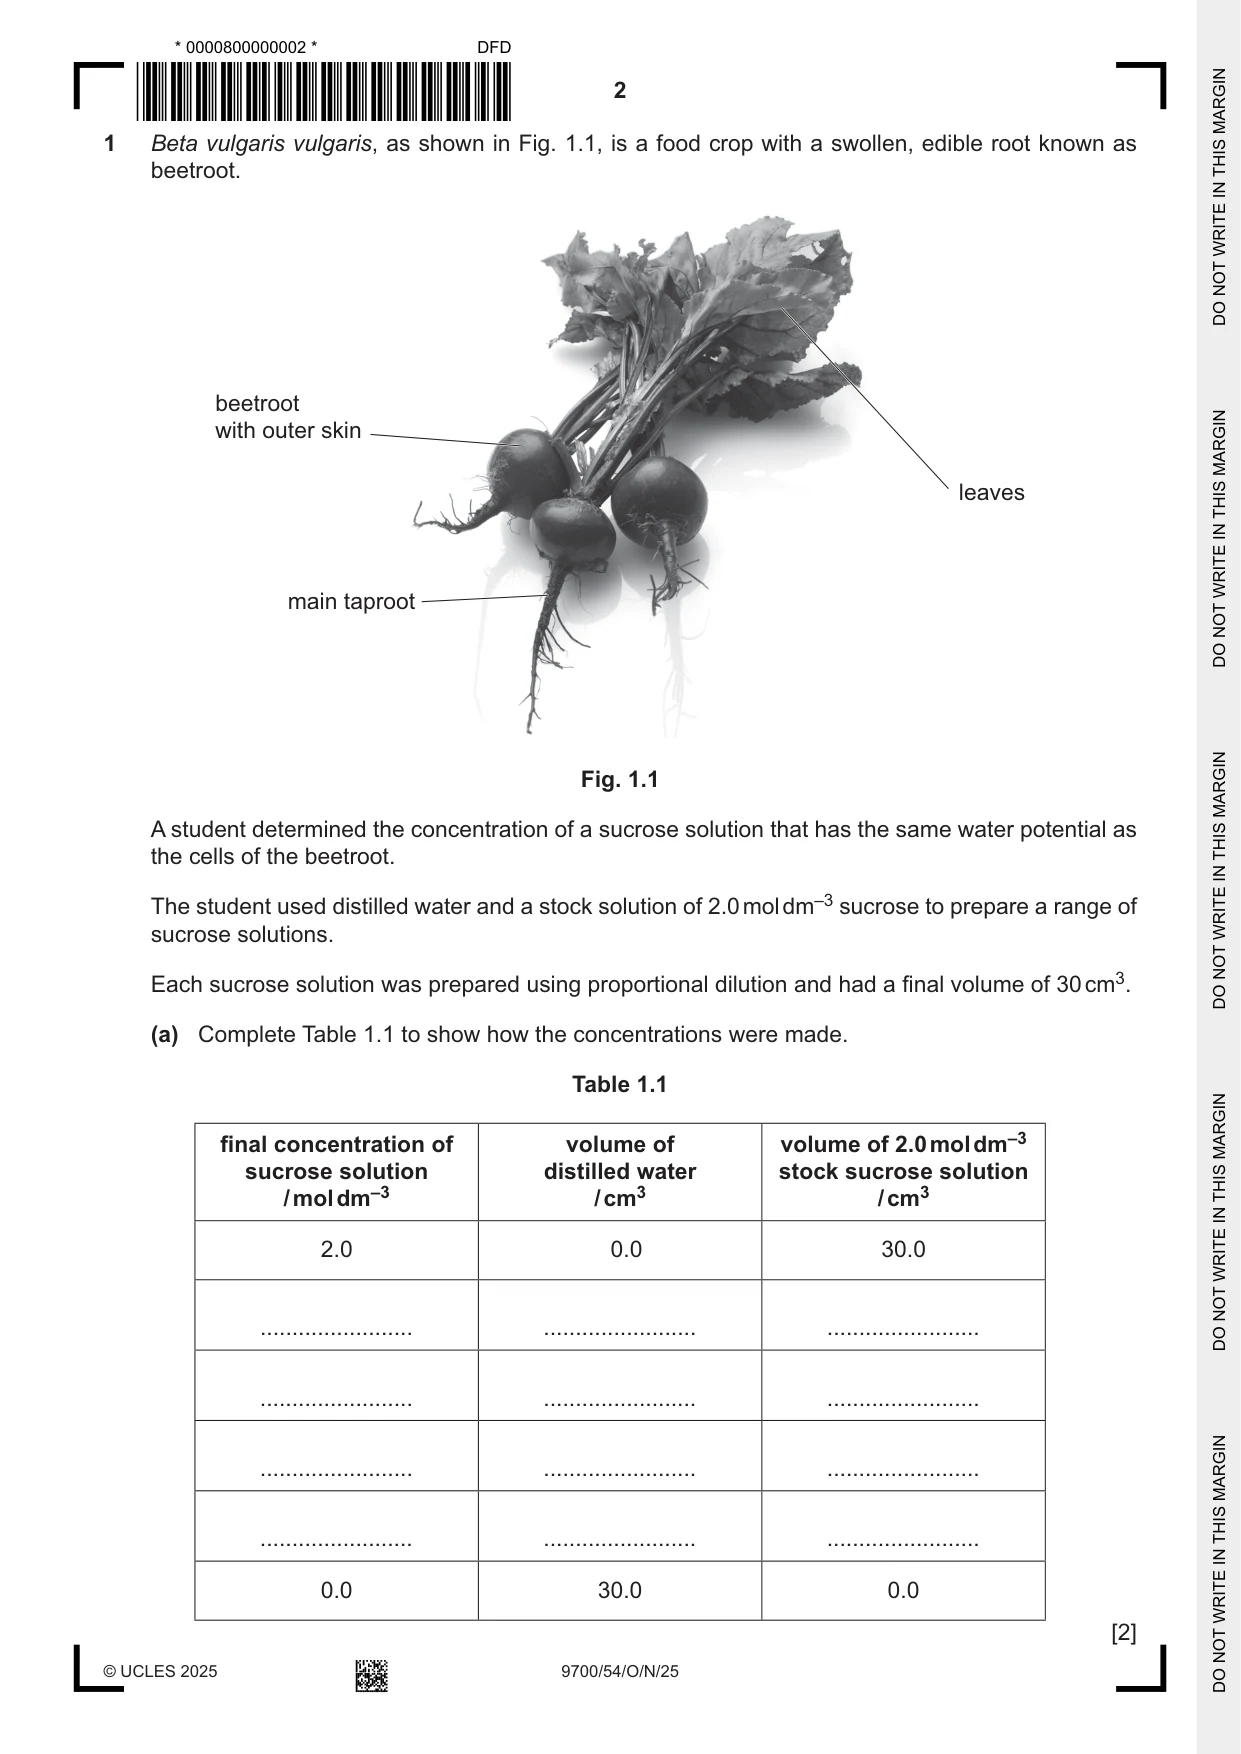
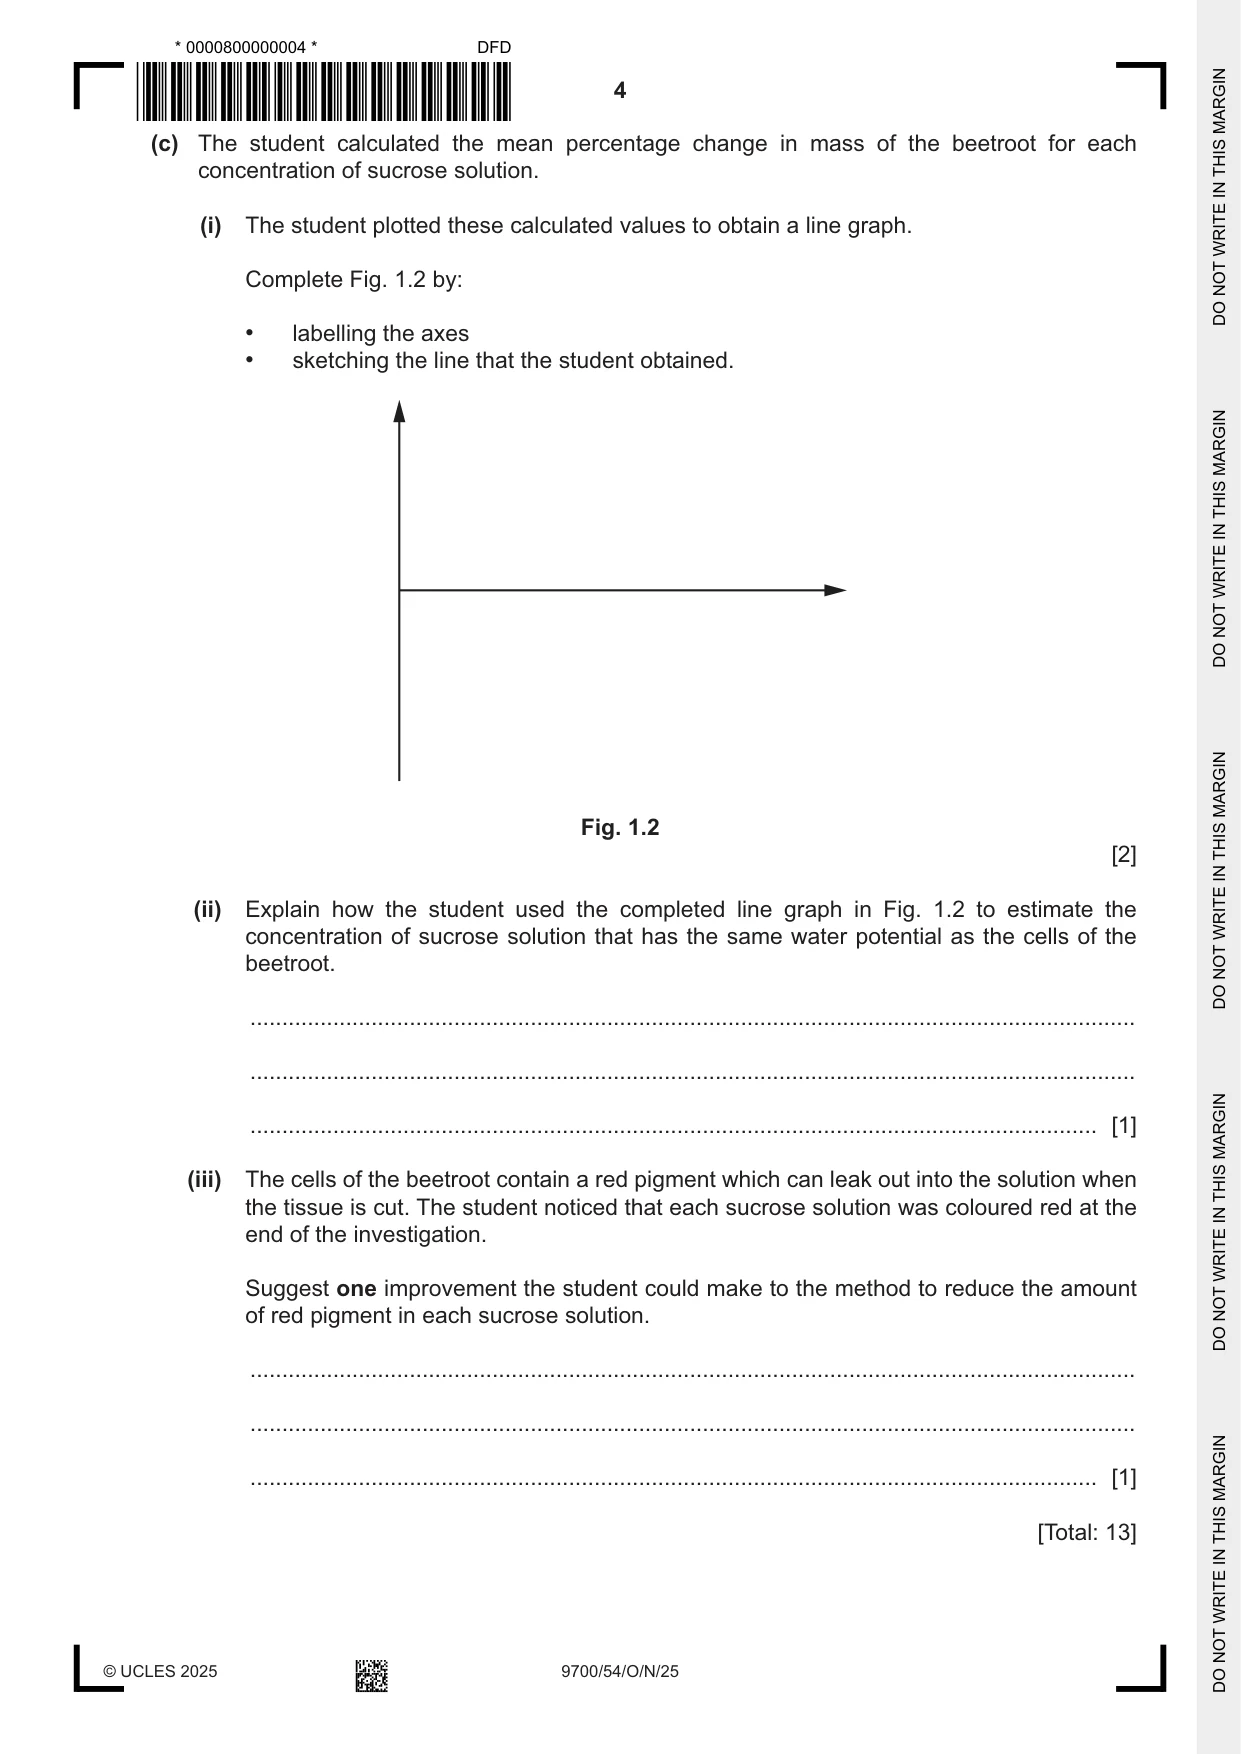
1 Beta vulgaris vulgaris, as shown in Fig. 1.1, is a food crop with a swollen, edible root known as beetroot. beetroot with outer skin leaves main taproot Fig. 1.1 A student determined the concentration of a sucrose solution that has the same water potential as the cells of the beetroot. The student used distilled water and a stock solution of 2.0 mol dm–3 sucrose to prepare a range of sucrose solutions. Each sucrose solution was prepared using proportional dilution and had a final volume of 30 cm3. (a) Complete Table 1.1 to show how the concentrations were made. Table 1.1 final concentration of volume of volume of 2.0 mol dm–3 sucrose solution distilled water stock sucrose solution / mol dm–3 / cm3 / cm3 2.0 0.0 30.0 ........................ ........................ ........................ ........................ ........................ ........................ ........................ ........................ ........................ ........................ ........................ ........................ 0.0 30.0 0.0 [2] (b) Describe a method the student could use to collect the data needed to determine the concentration of a sucrose solution that has the same water potential as the cells of the beetroot. The student was supplied with the sucrose solutions prepared in 1(a) and standard laboratory equipment. Do not include details of how the student: • prepared the sucrose solutions in 1(a) • would use the data collected to determine the concentration of a sucrose solution that has the same water potential as the cells of the beetroot. Your method should be set out in a logical order and be detailed enough to allow another person to follow it. ................................................................................................................................................... ................................................................................................................................................... ................................................................................................................................................... ................................................................................................................................................... ................................................................................................................................................... ................................................................................................................................................... ................................................................................................................................................... ................................................................................................................................................... ................................................................................................................................................... ................................................................................................................................................... ................................................................................................................................................... ................................................................................................................................................... ................................................................................................................................................... ................................................................................................................................................... ................................................................................................................................................... ................................................................................................................................................... ................................................................................................................................................... ................................................................................................................................................... ................................................................................................................................................... ............................................................................................................................................. [7] (c) The student calculated the mean percentage change in mass of the beetroot for each concentration of sucrose solution. (i) The student plotted these calculated values to obtain a line graph. Complete Fig. 1.2 by: • labelling the axes • sketching the line that the student obtained. Fig. 1.2 [2] (ii) Explain how the student used the completed line graph in Fig. 1.2 to estimate the concentration of sucrose solution that has the same water potential as the cells of the beetroot. ........................................................................................................................................... ........................................................................................................................................... ..................................................................................................................................... [1] (iii) The cells of the beetroot contain a red pigment which can leak out into the solution when the tissue is cut. The student noticed that each sucrose solution was coloured red at the end of the investigation. Suggest one improvement the student could make to the method to reduce the amount of red pigment in each sucrose solution. ........................................................................................................................................... ........................................................................................................................................... ..................................................................................................................................... [1] [Total: 13] Question 2 starts on page 6.
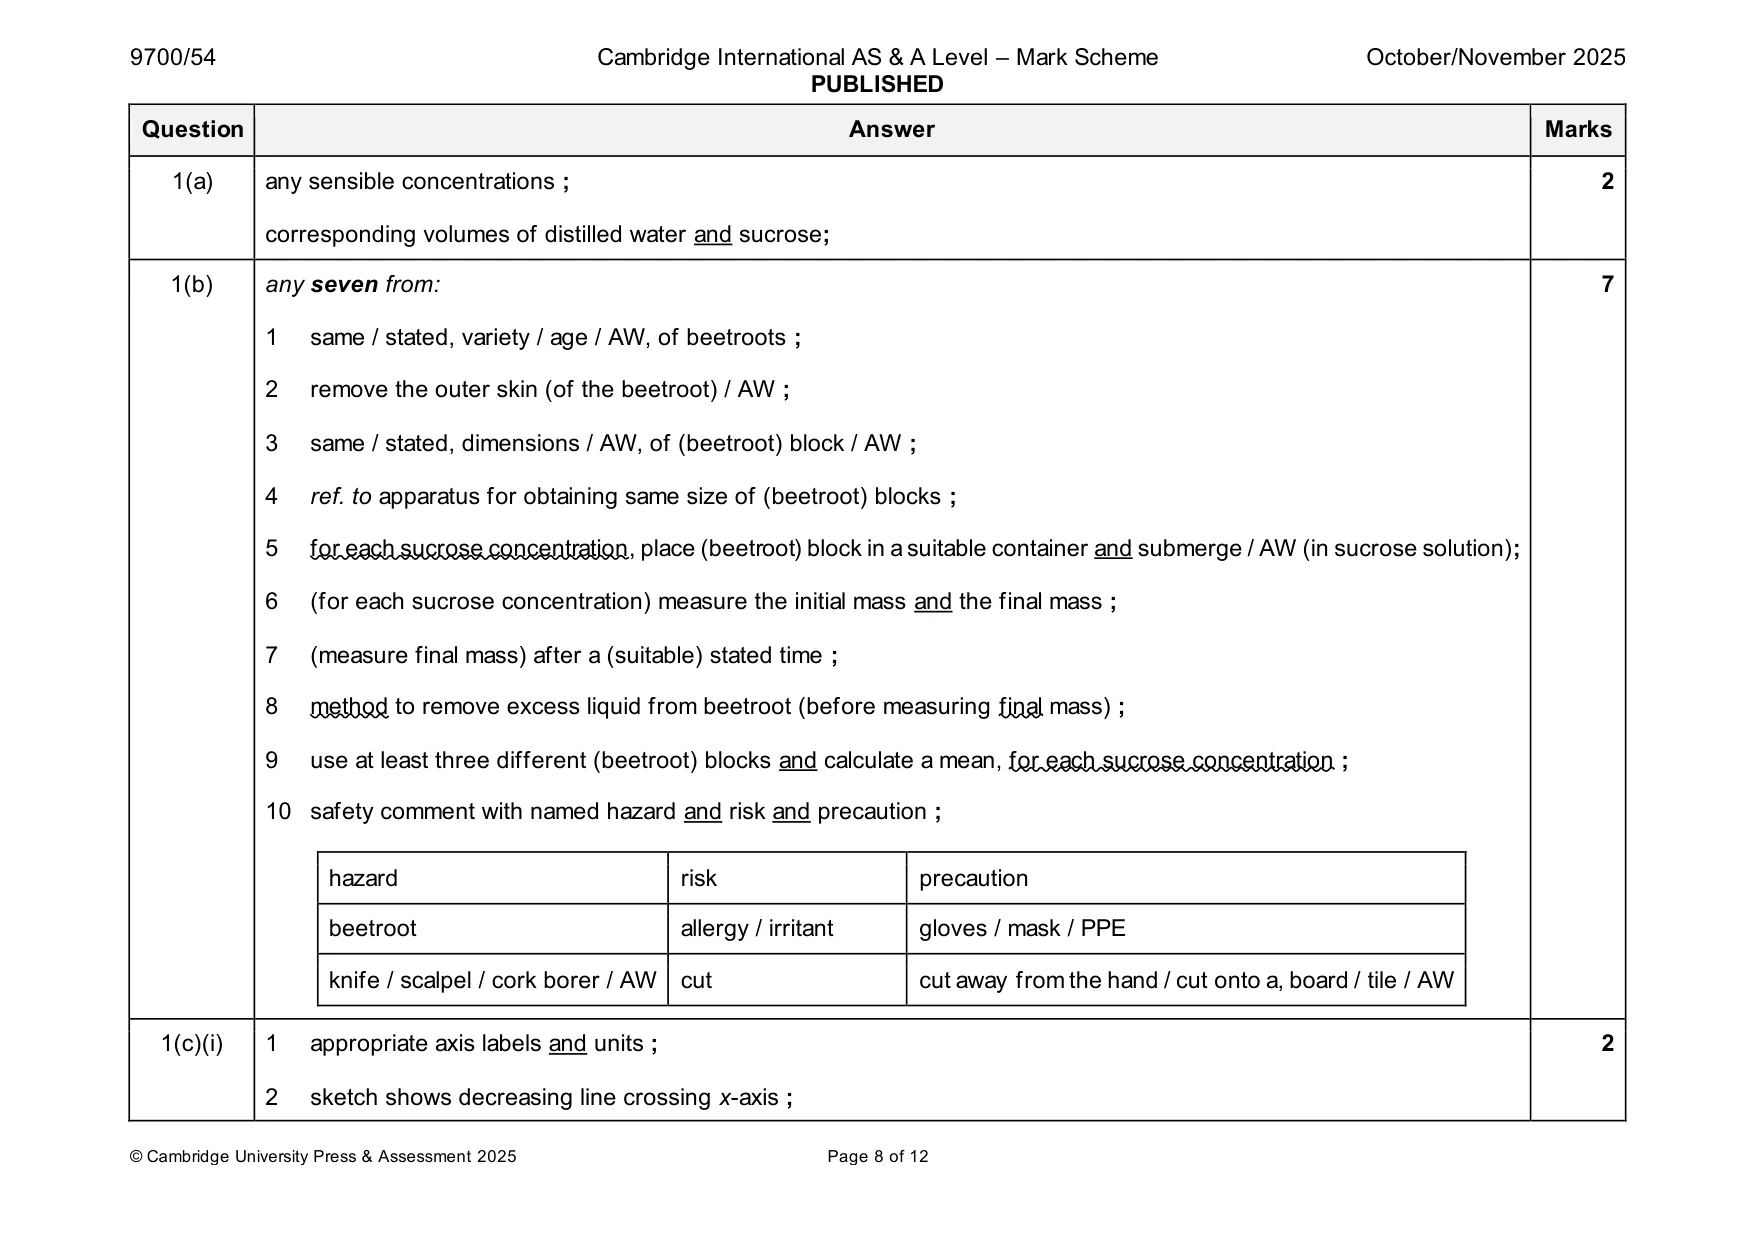
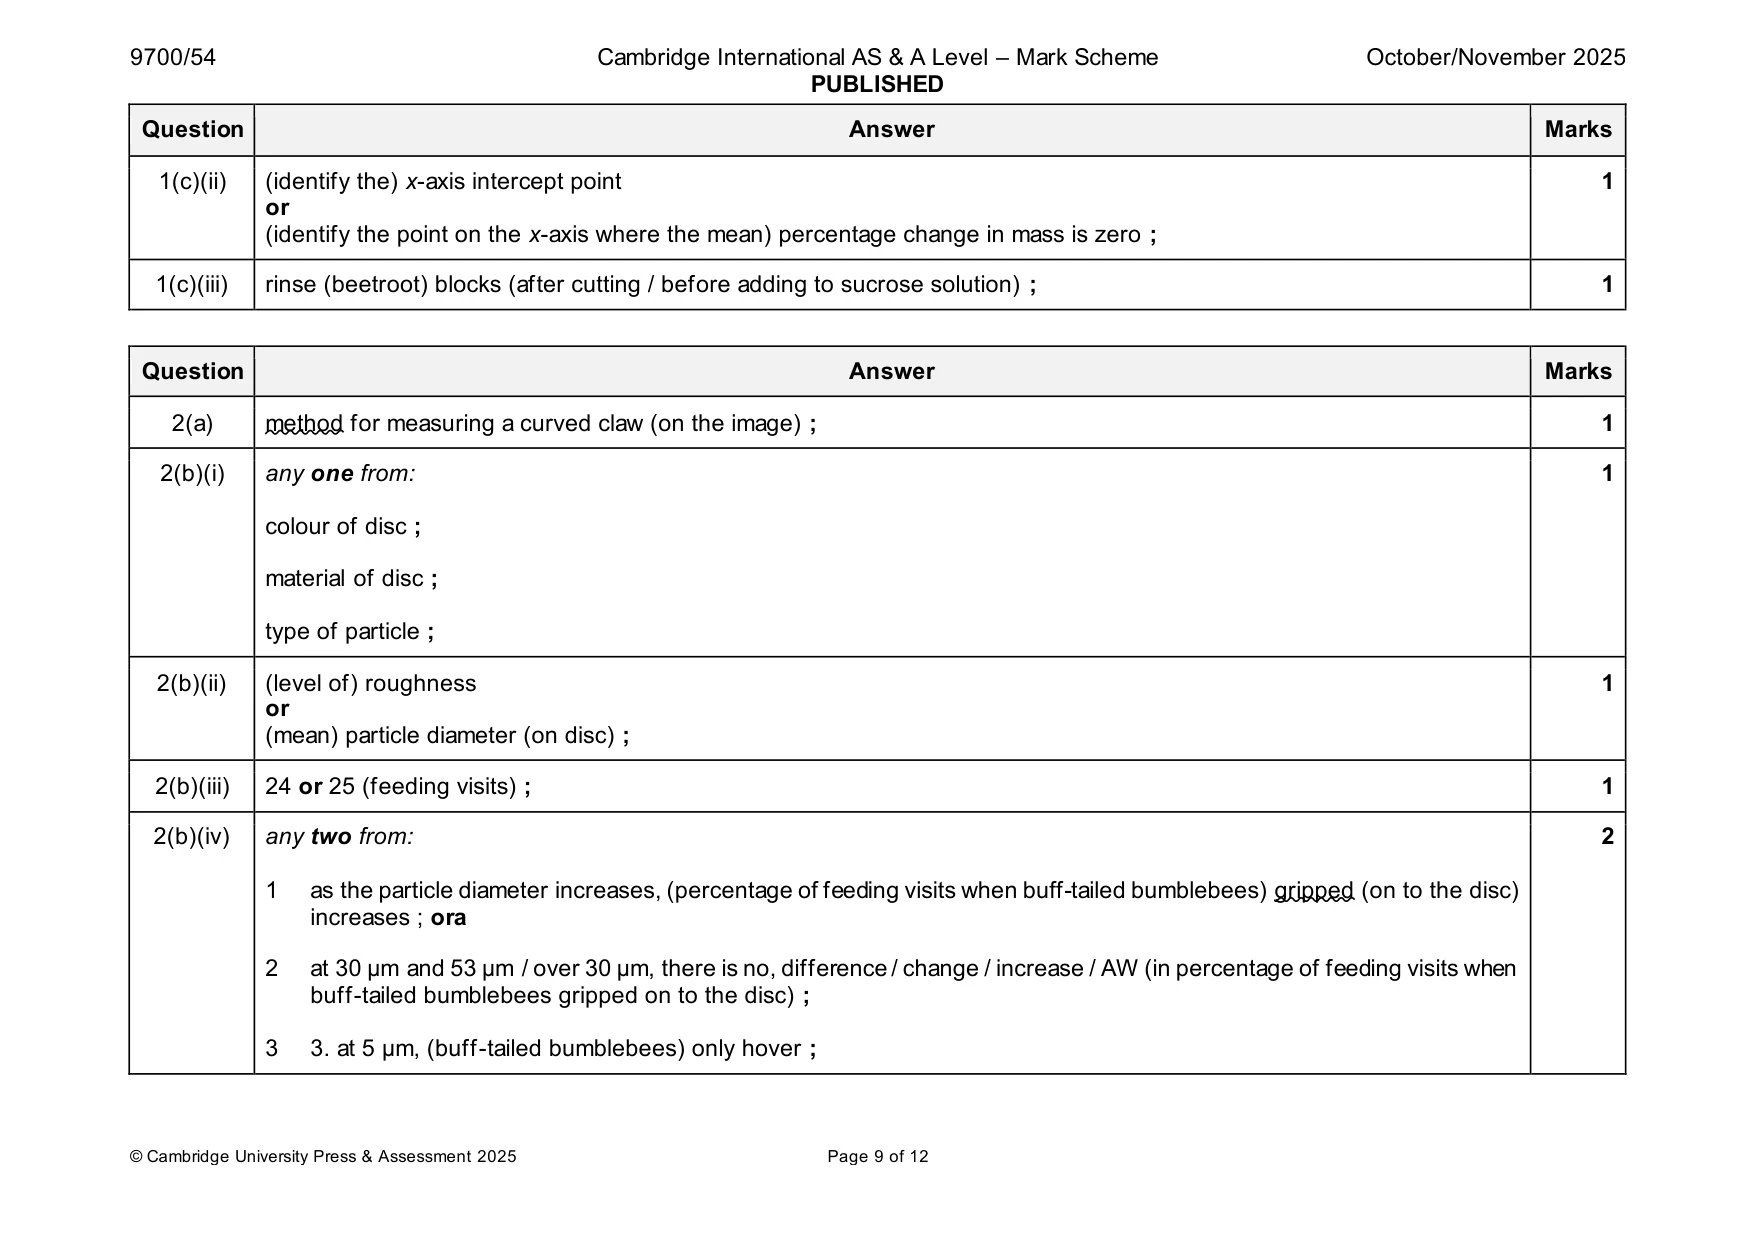
Mark scheme: Question Answer Marks 1(a) any sensible concentrations ; 2 corresponding volumes of distilled water and sucrose; 1(b) any seven from: 7 1 same / stated, variety / age / AW, of beetroots ; 2 remove the outer skin (of the beetroot) / AW ; 3 same / stated, dimensions / AW, of (beetroot) block / AW ; 4 ref. to apparatus for obtaining same size of (beetroot) blocks ; 5 for each sucrose concentration, place (beetroot) block in a suitable container and submerge / AW (in sucrose solution); 6 (for each sucrose concentration) measure the initial mass and the final mass ; 7 (measure final mass) after a (suitable) stated time ; 8 method to remove excess liquid from beetroot (before measuring final mass) ; 9 use at least three different (beetroot) blocks and calculate a mean, for each sucrose concentration ; 10 safety comment with named hazard and risk and precaution ; hazard risk precaution beetroot allergy / irritant gloves / mask / PPE knife / scalpel / cork borer / AW cut cut away from the hand / cut onto a, board / tile / AW 1(c)(i) 1 appropriate axis labels and units ; 2 2 sketch shows decreasing line crossing x-axis ; 1(c)(ii) (identify the) x-axis intercept point 1 or (identify the point on the x-axis where the mean) percentage change in mass is zero ; 1(c)(iii) rinse (beetroot) blocks (after cutting / before adding to sucrose solution) ; 1
Q2 · The buff‑tailed bumblebee, Bombus terrestris, is an insect that uses its tongue to feed…
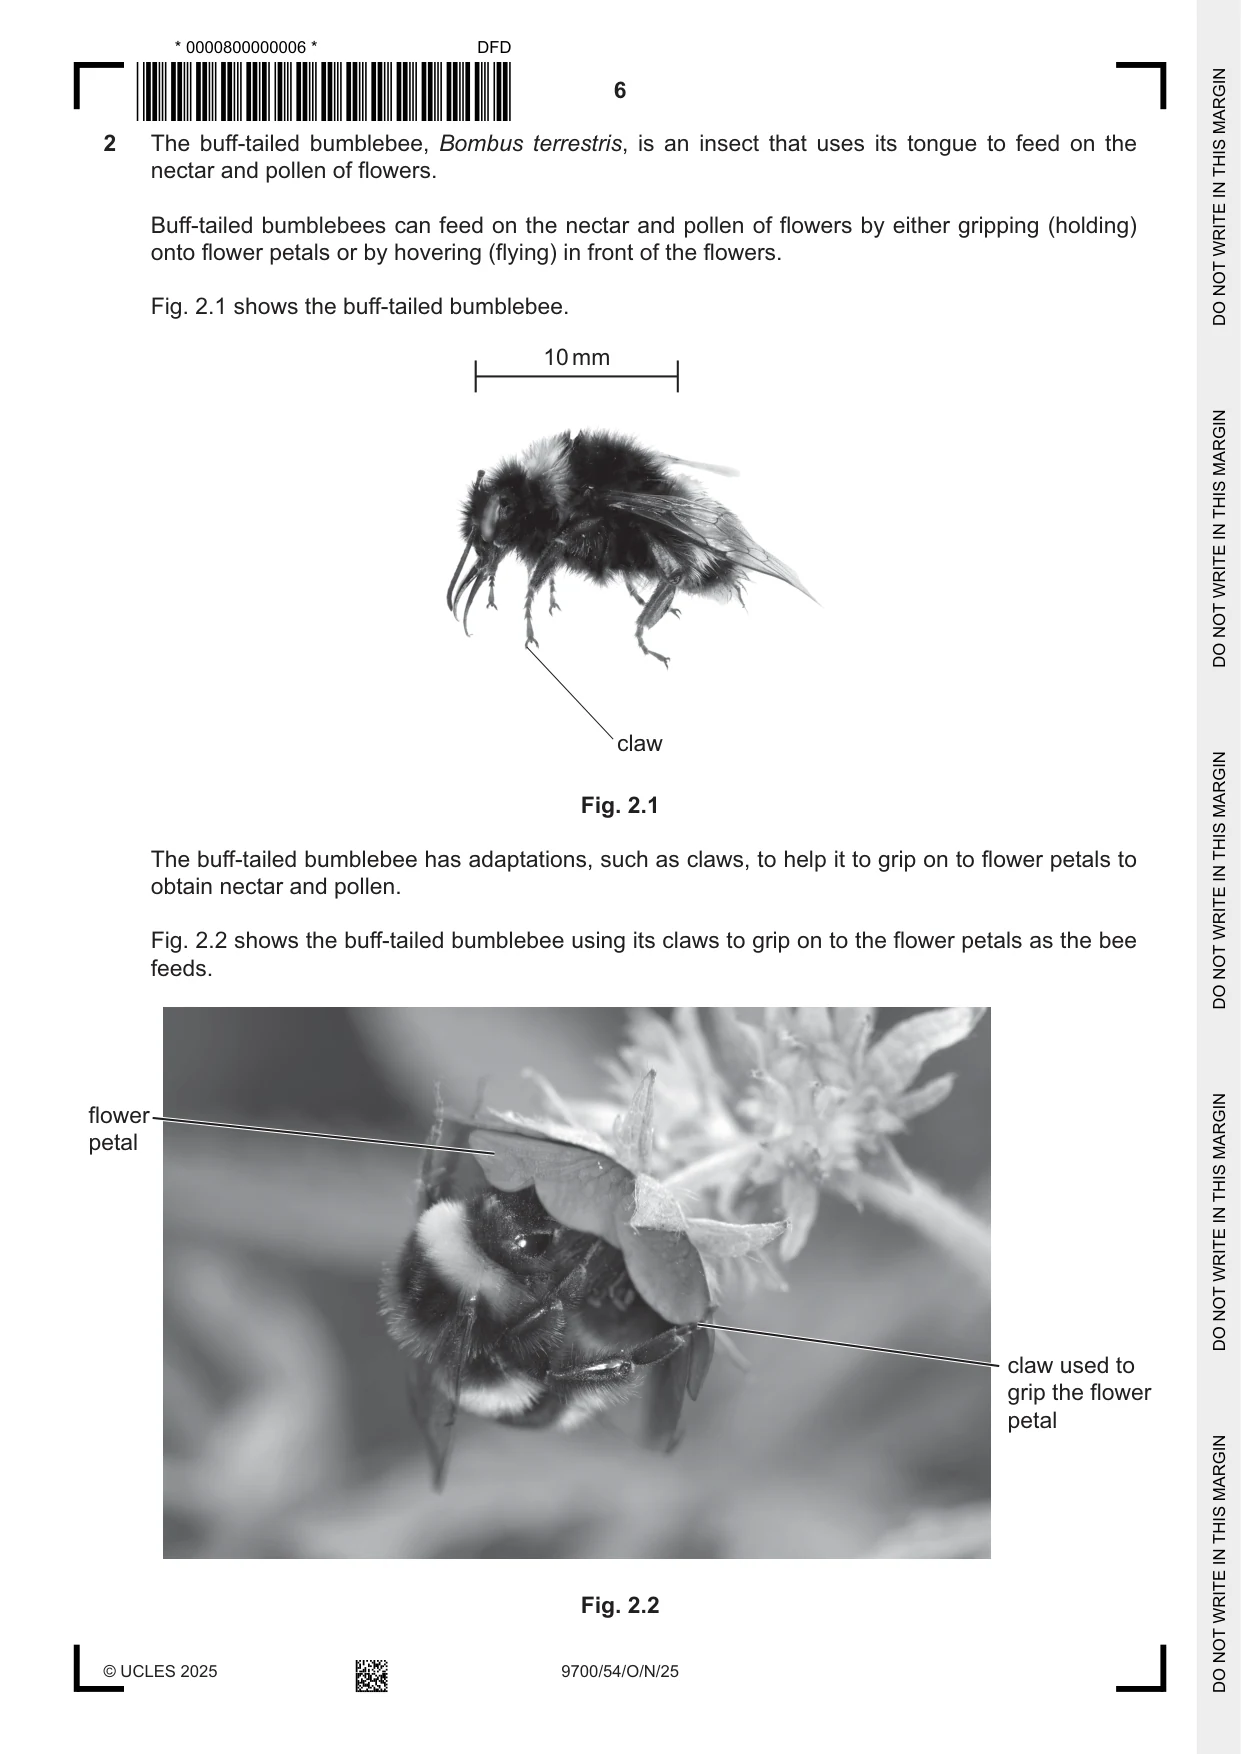
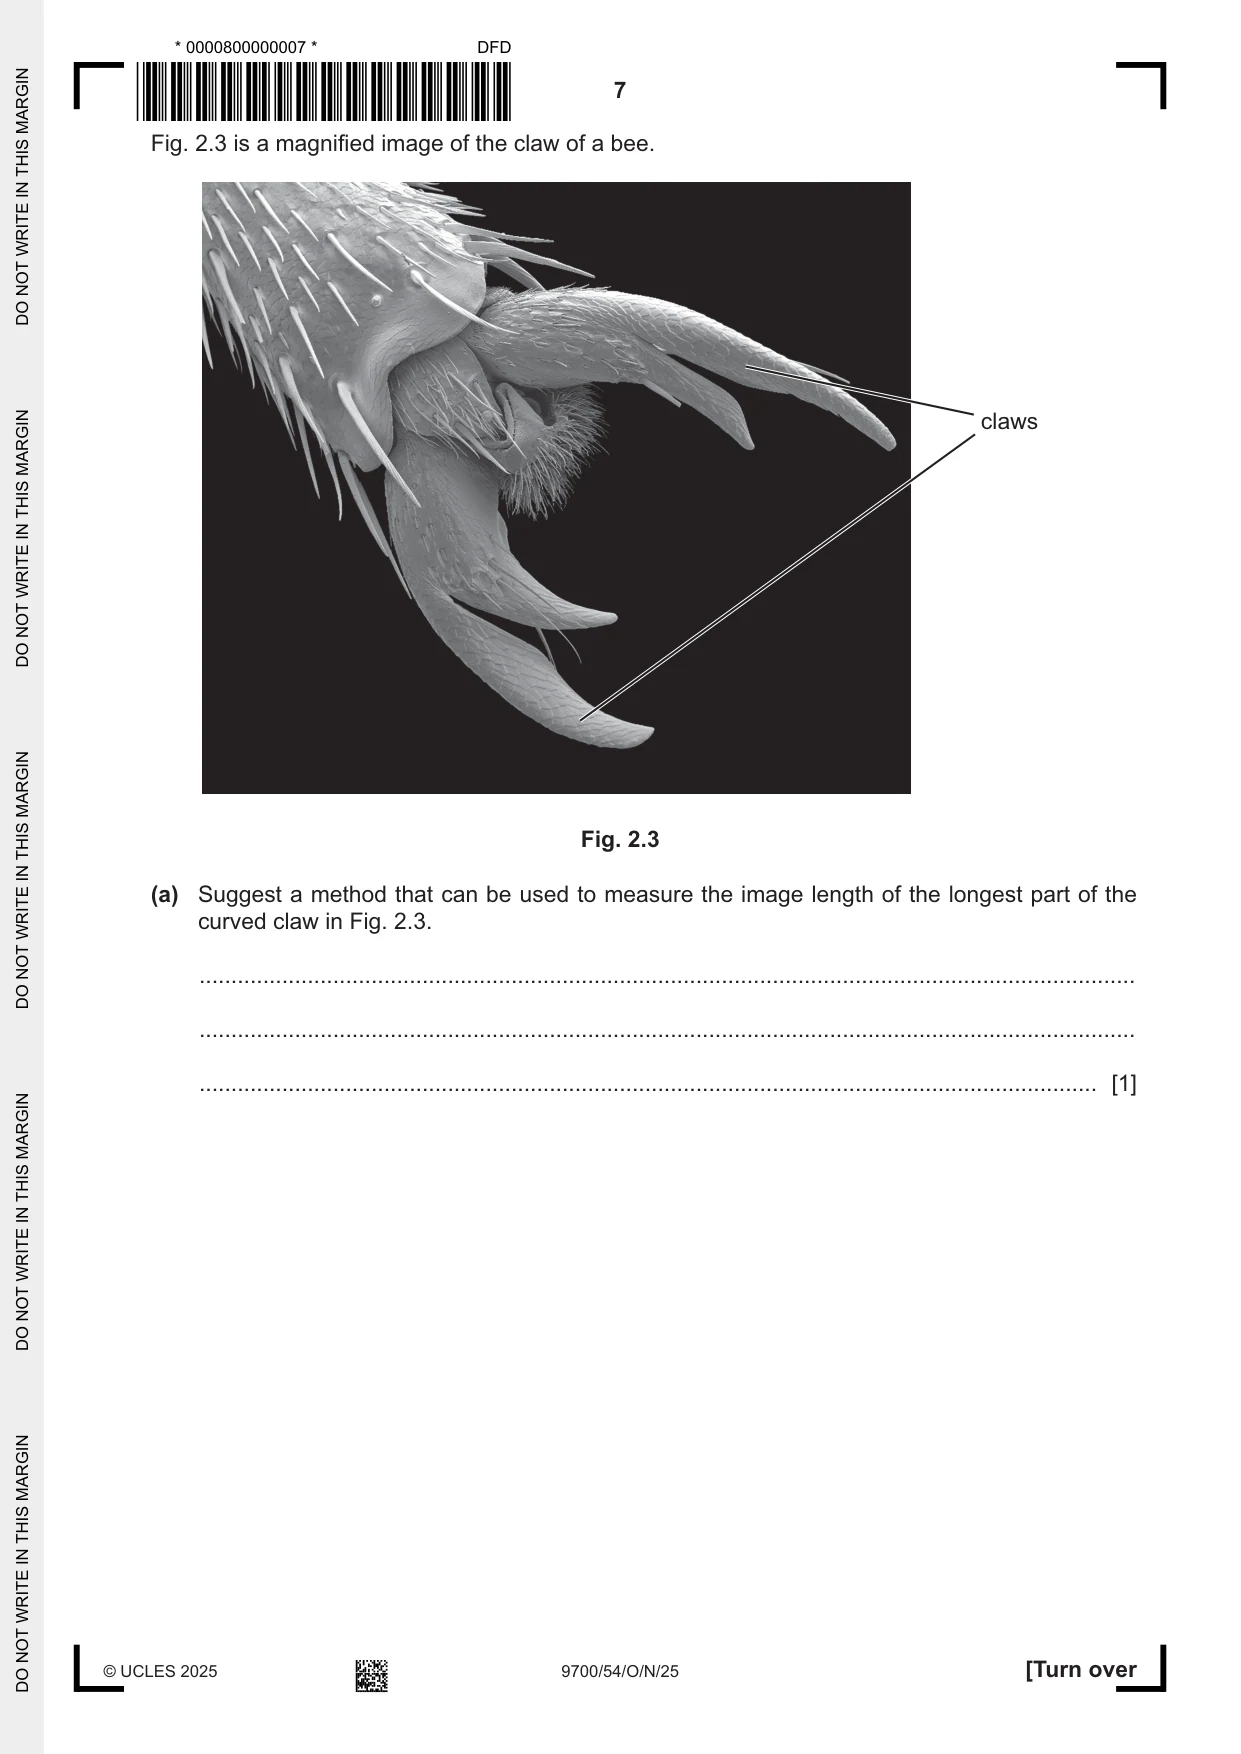
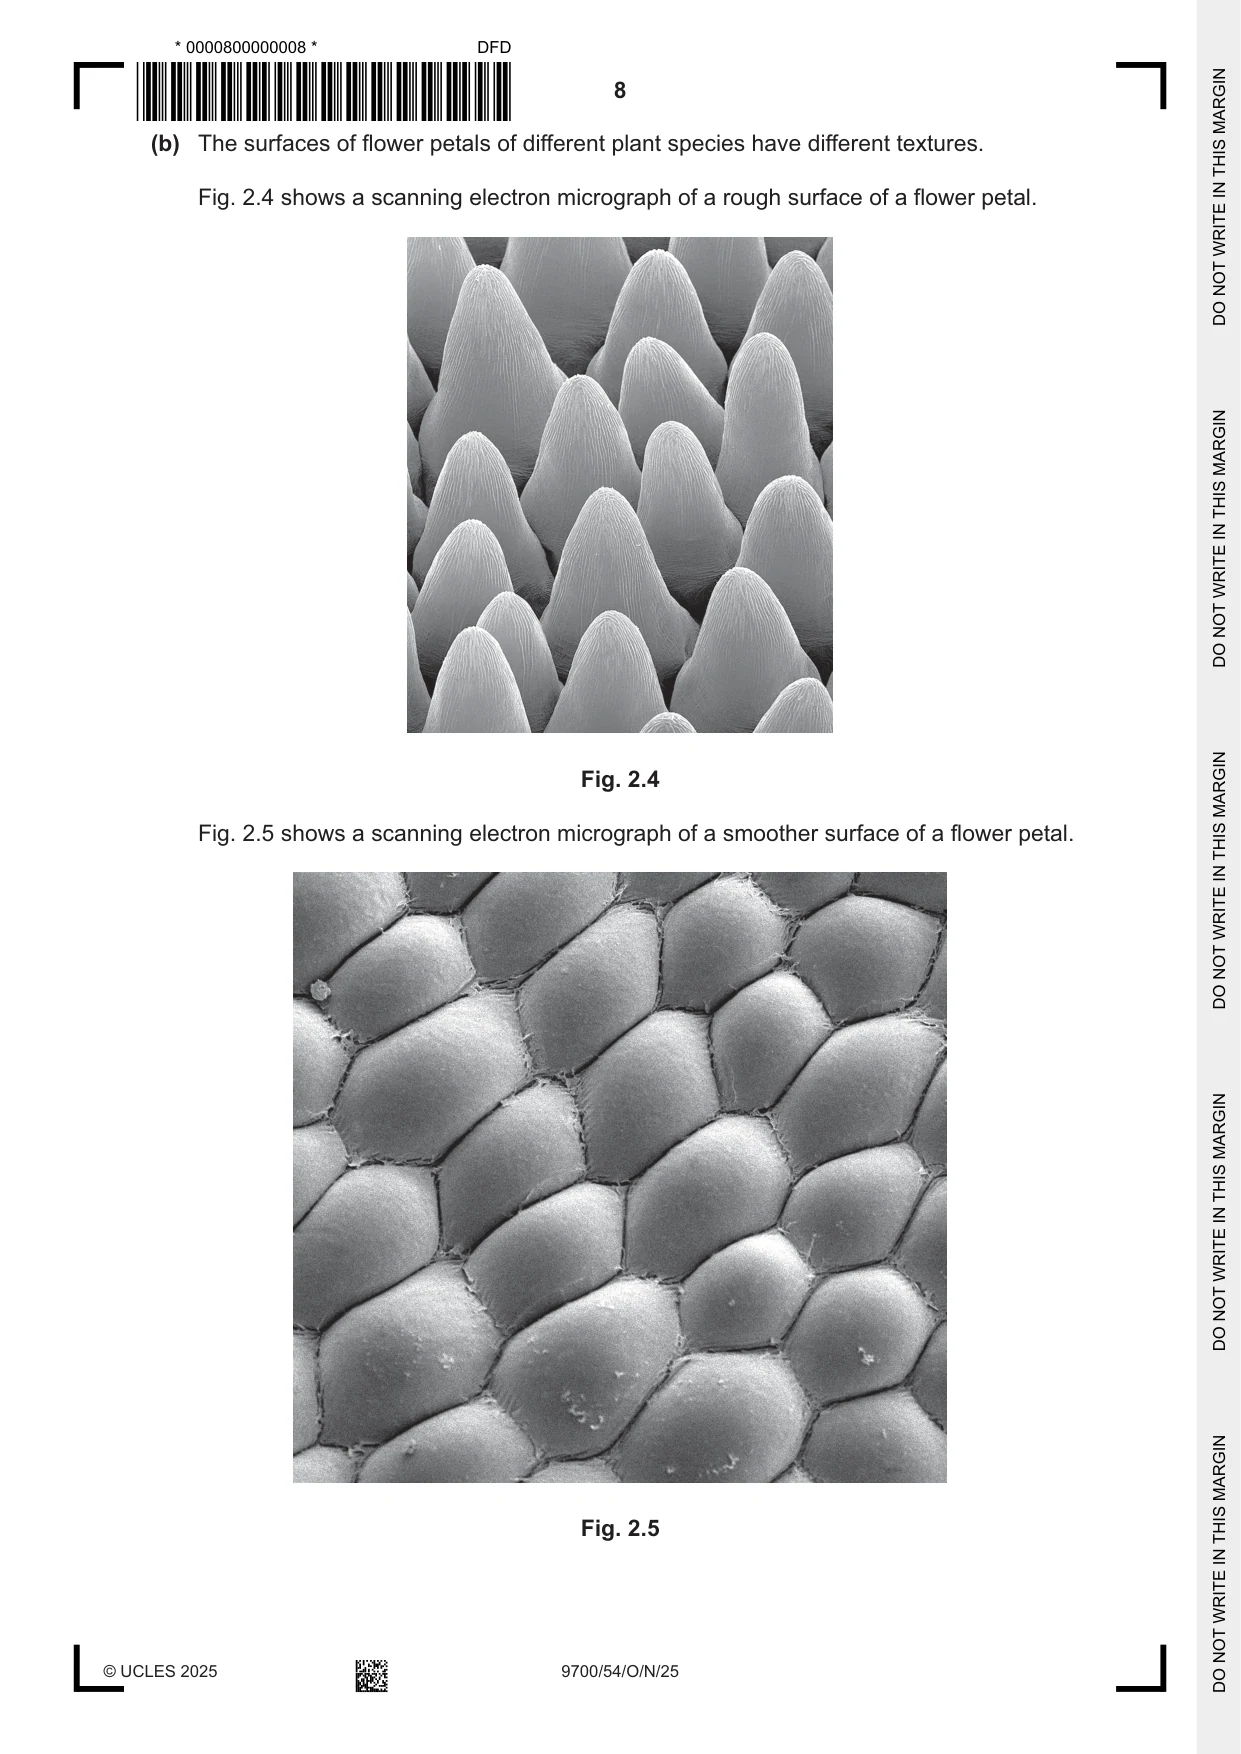
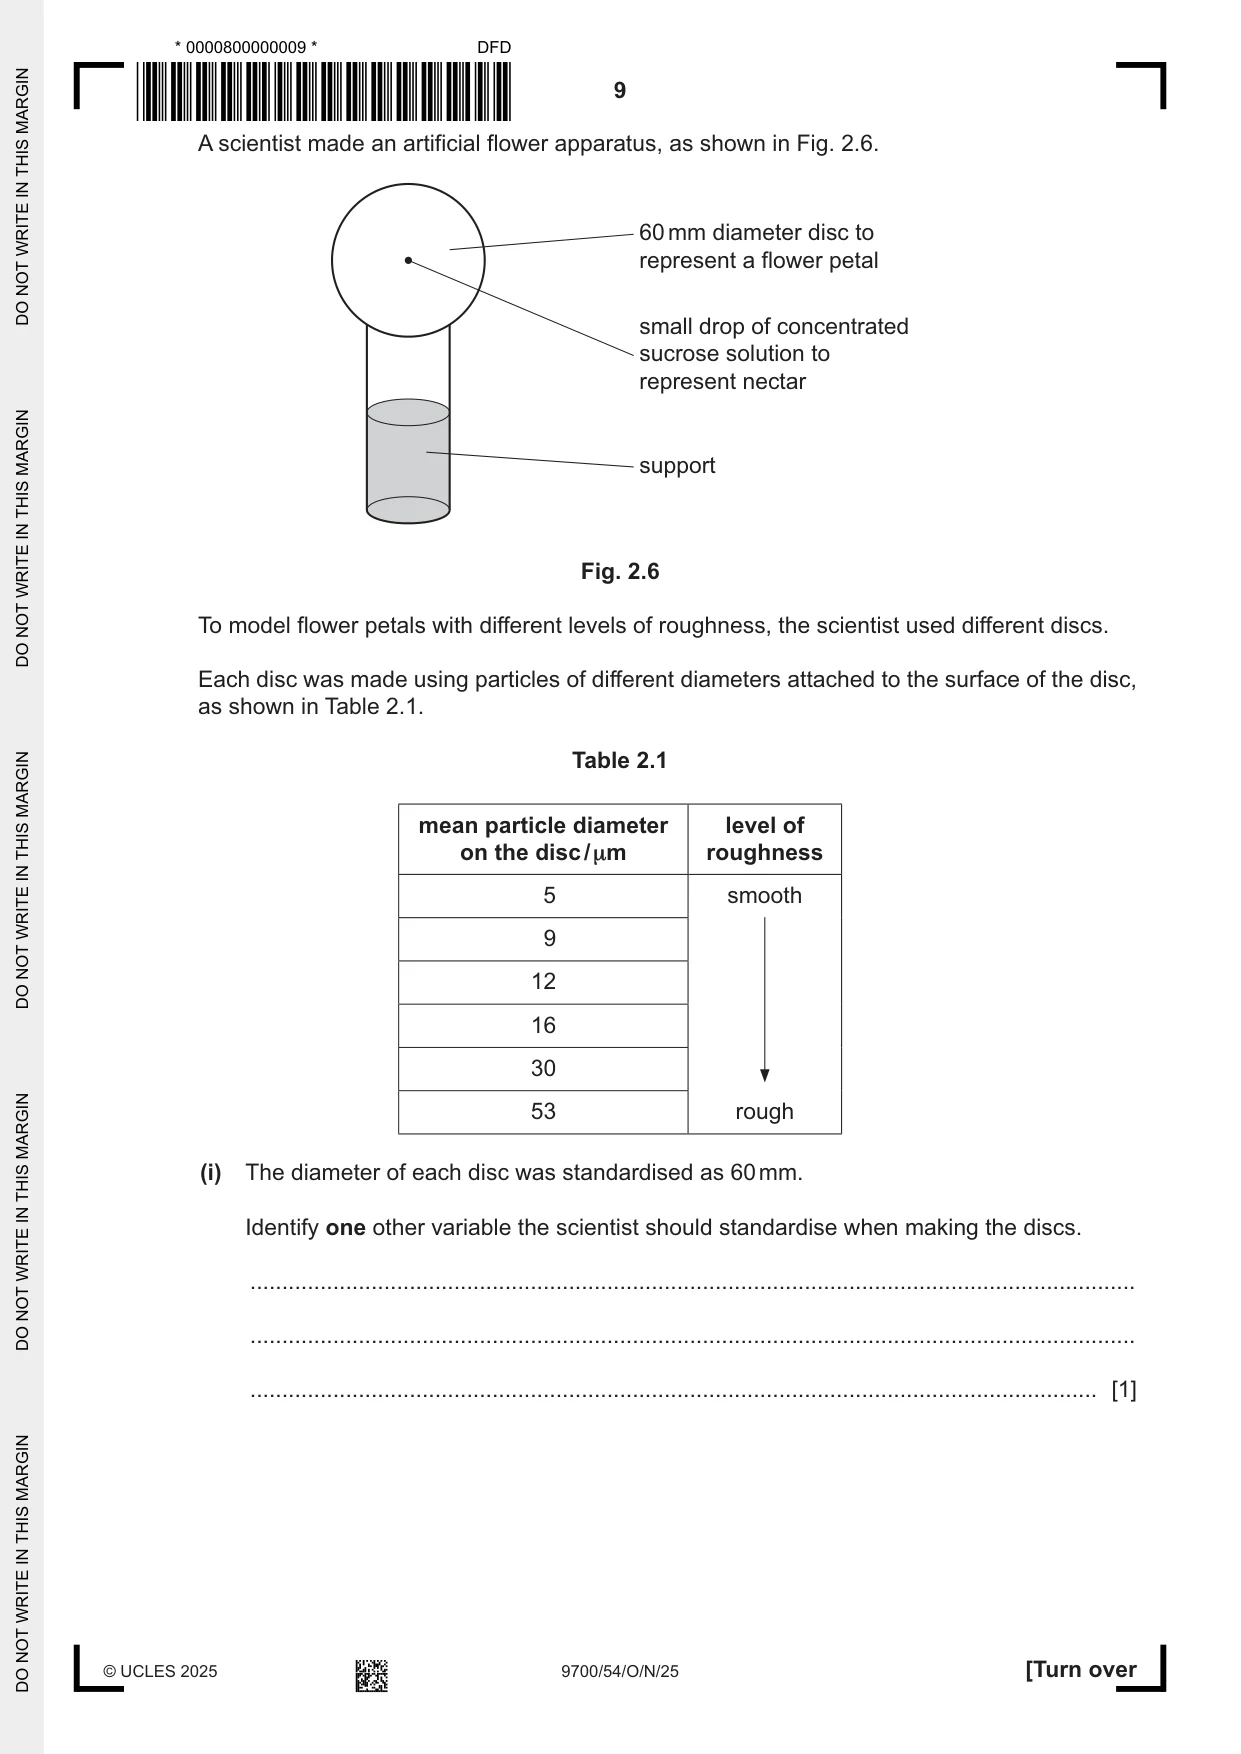
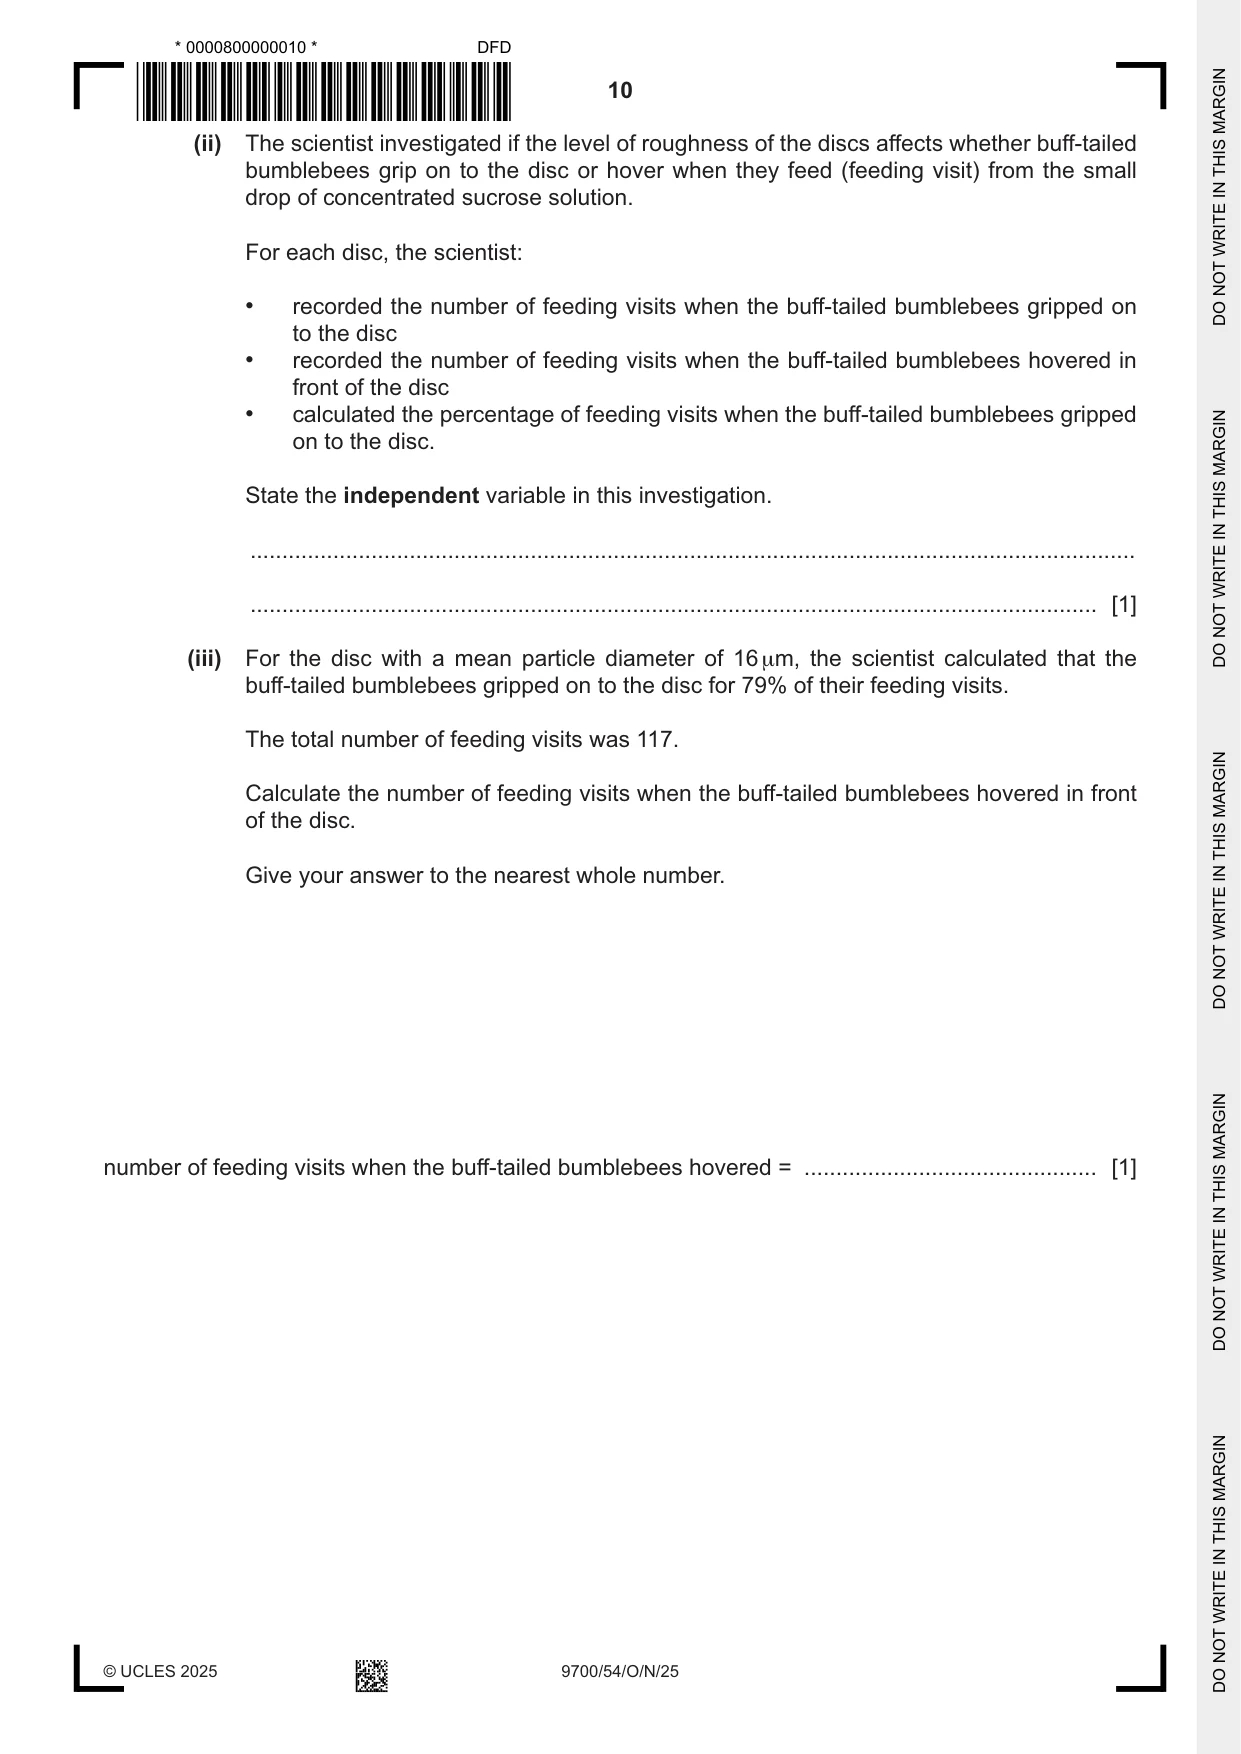
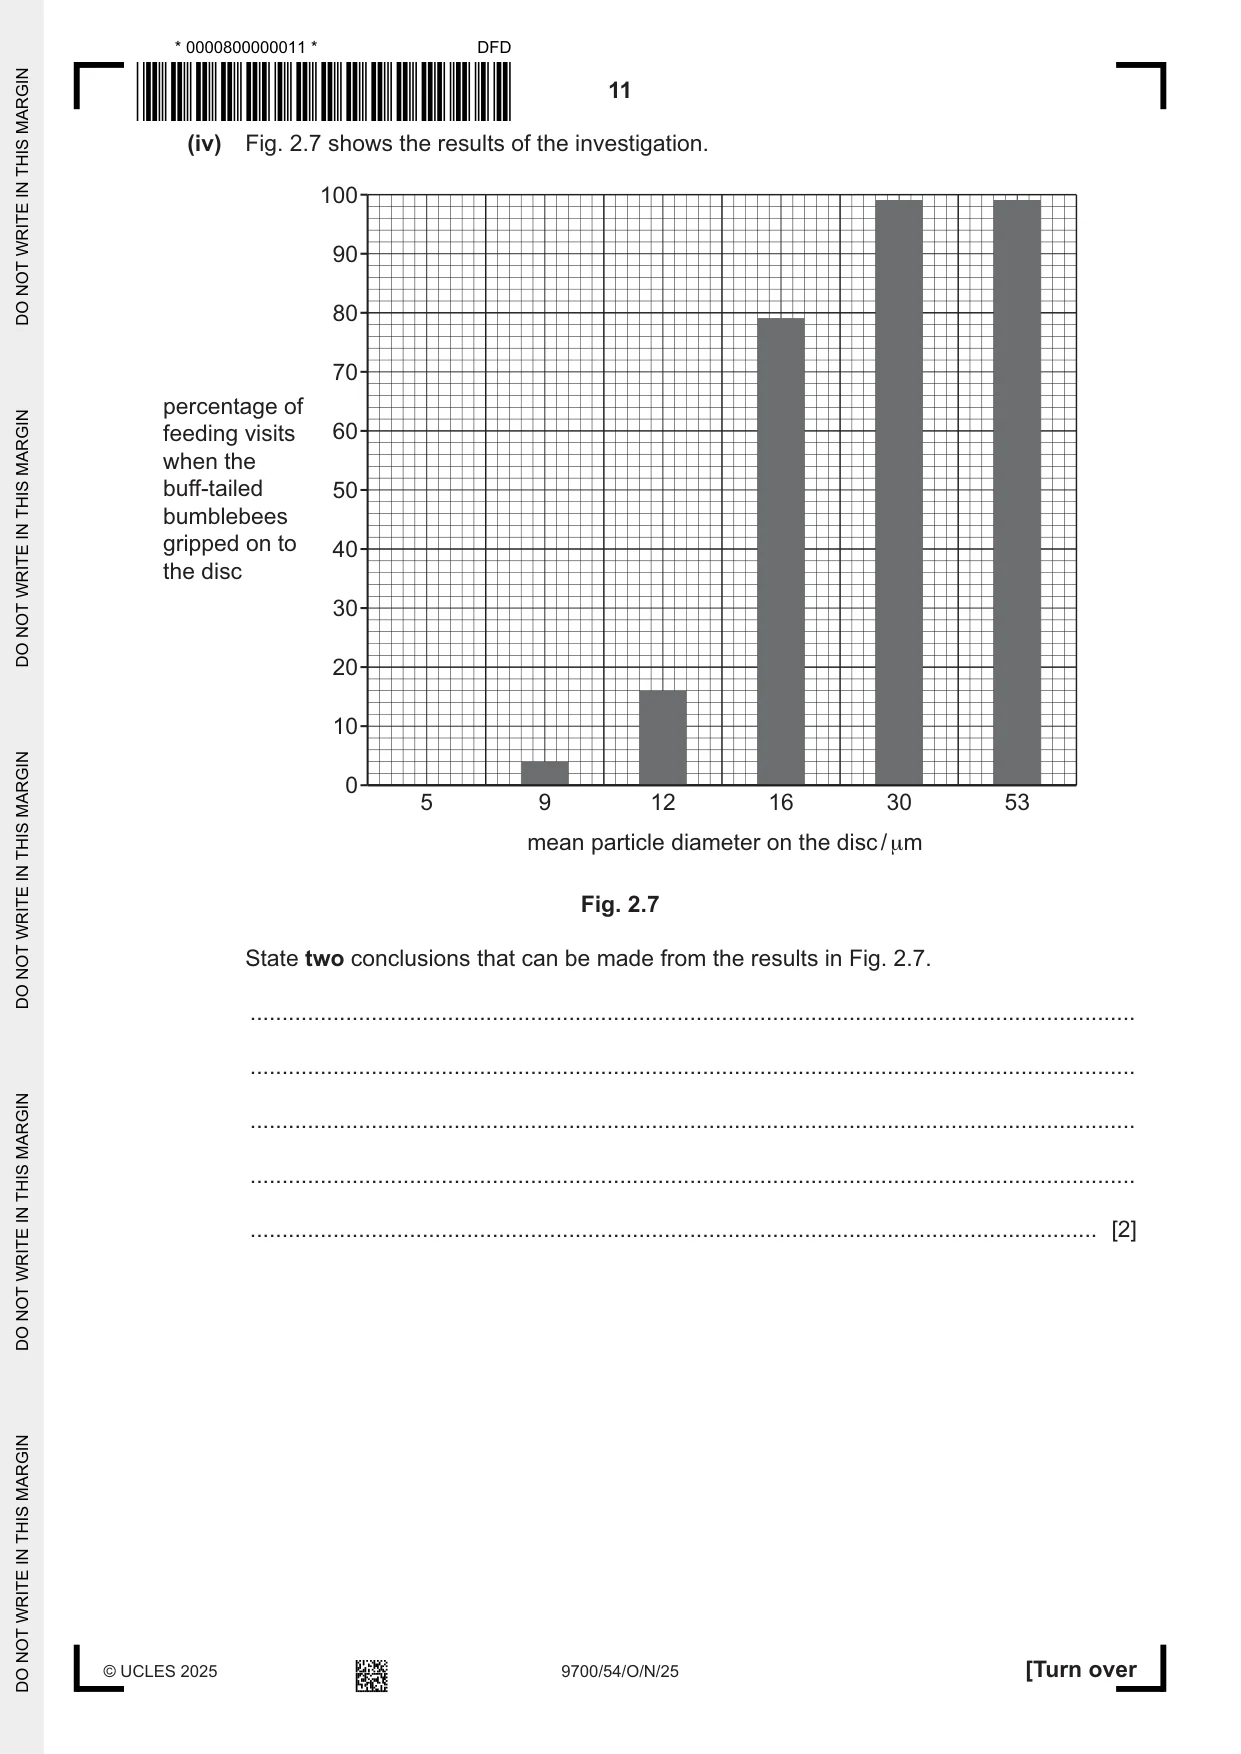
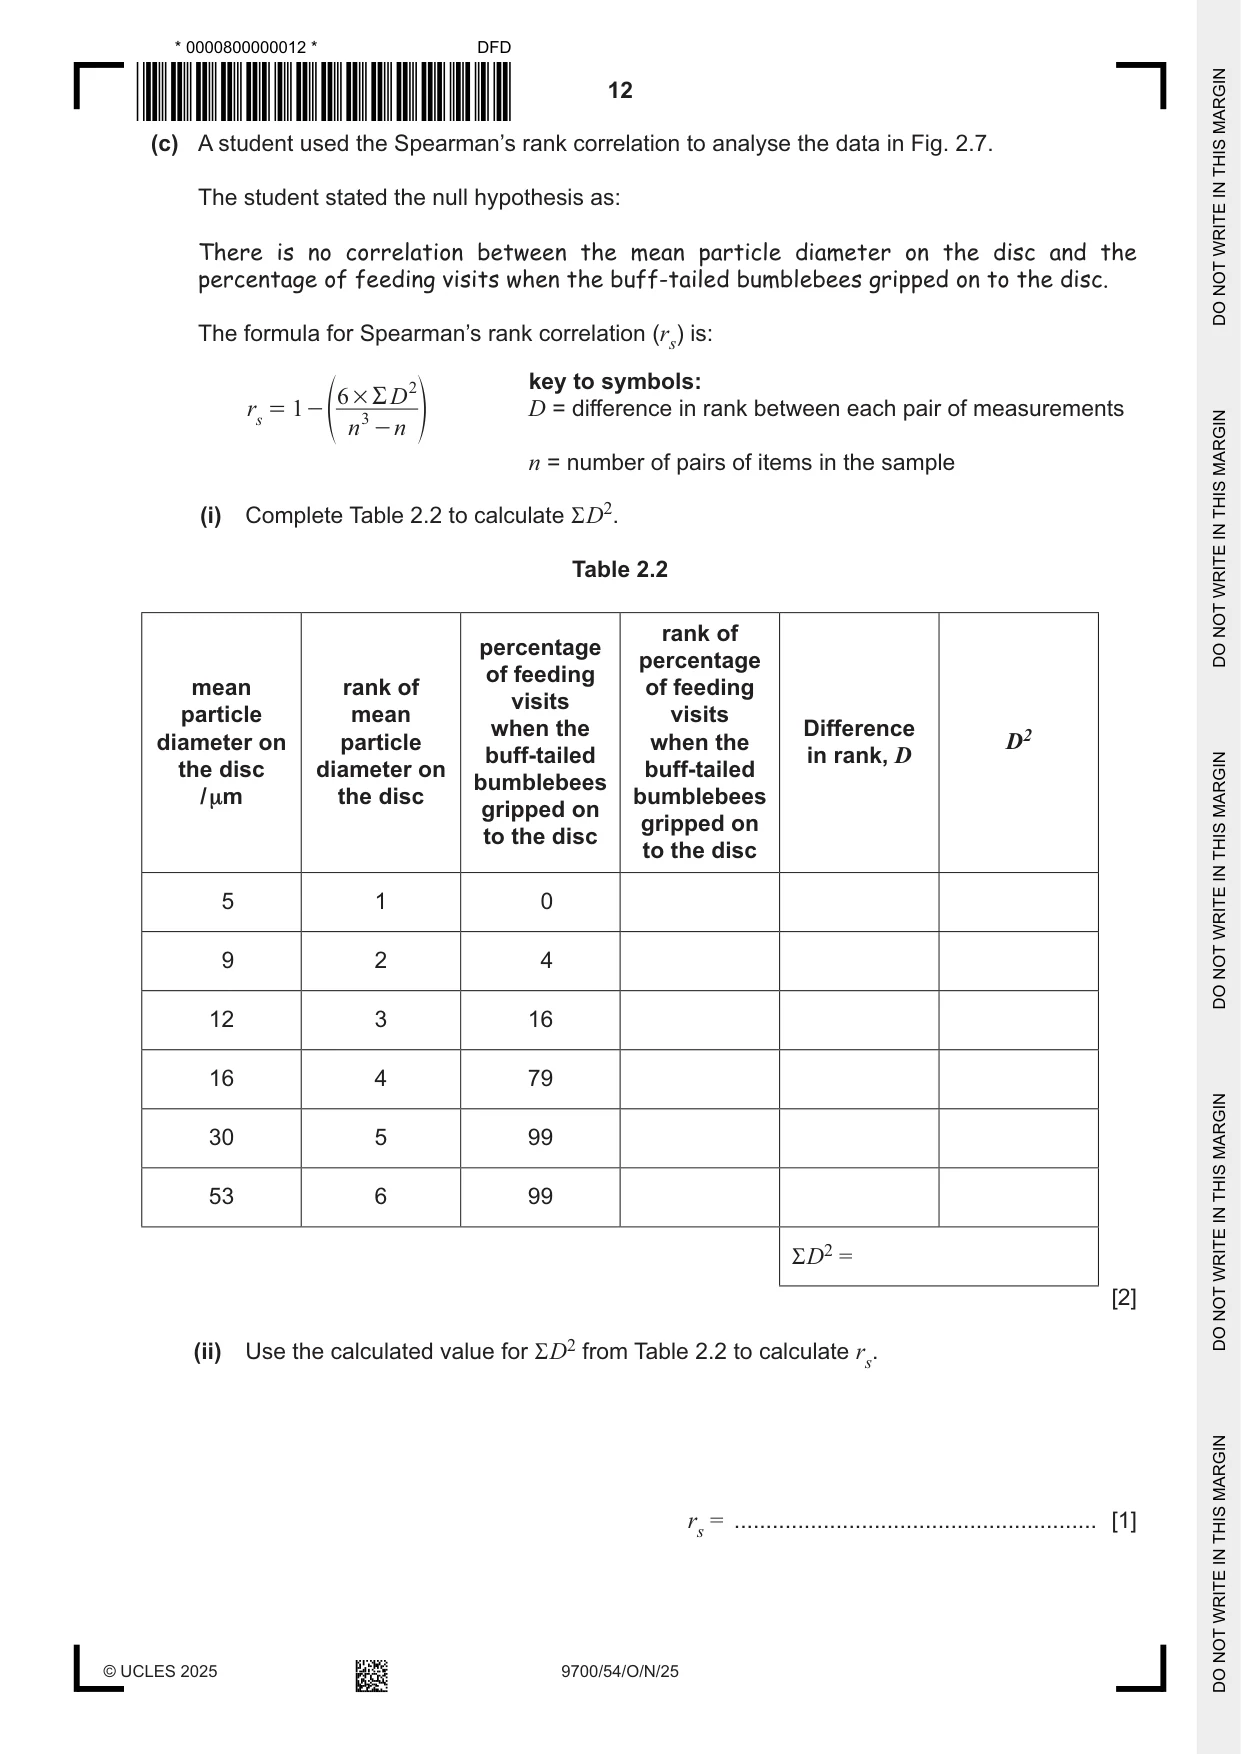
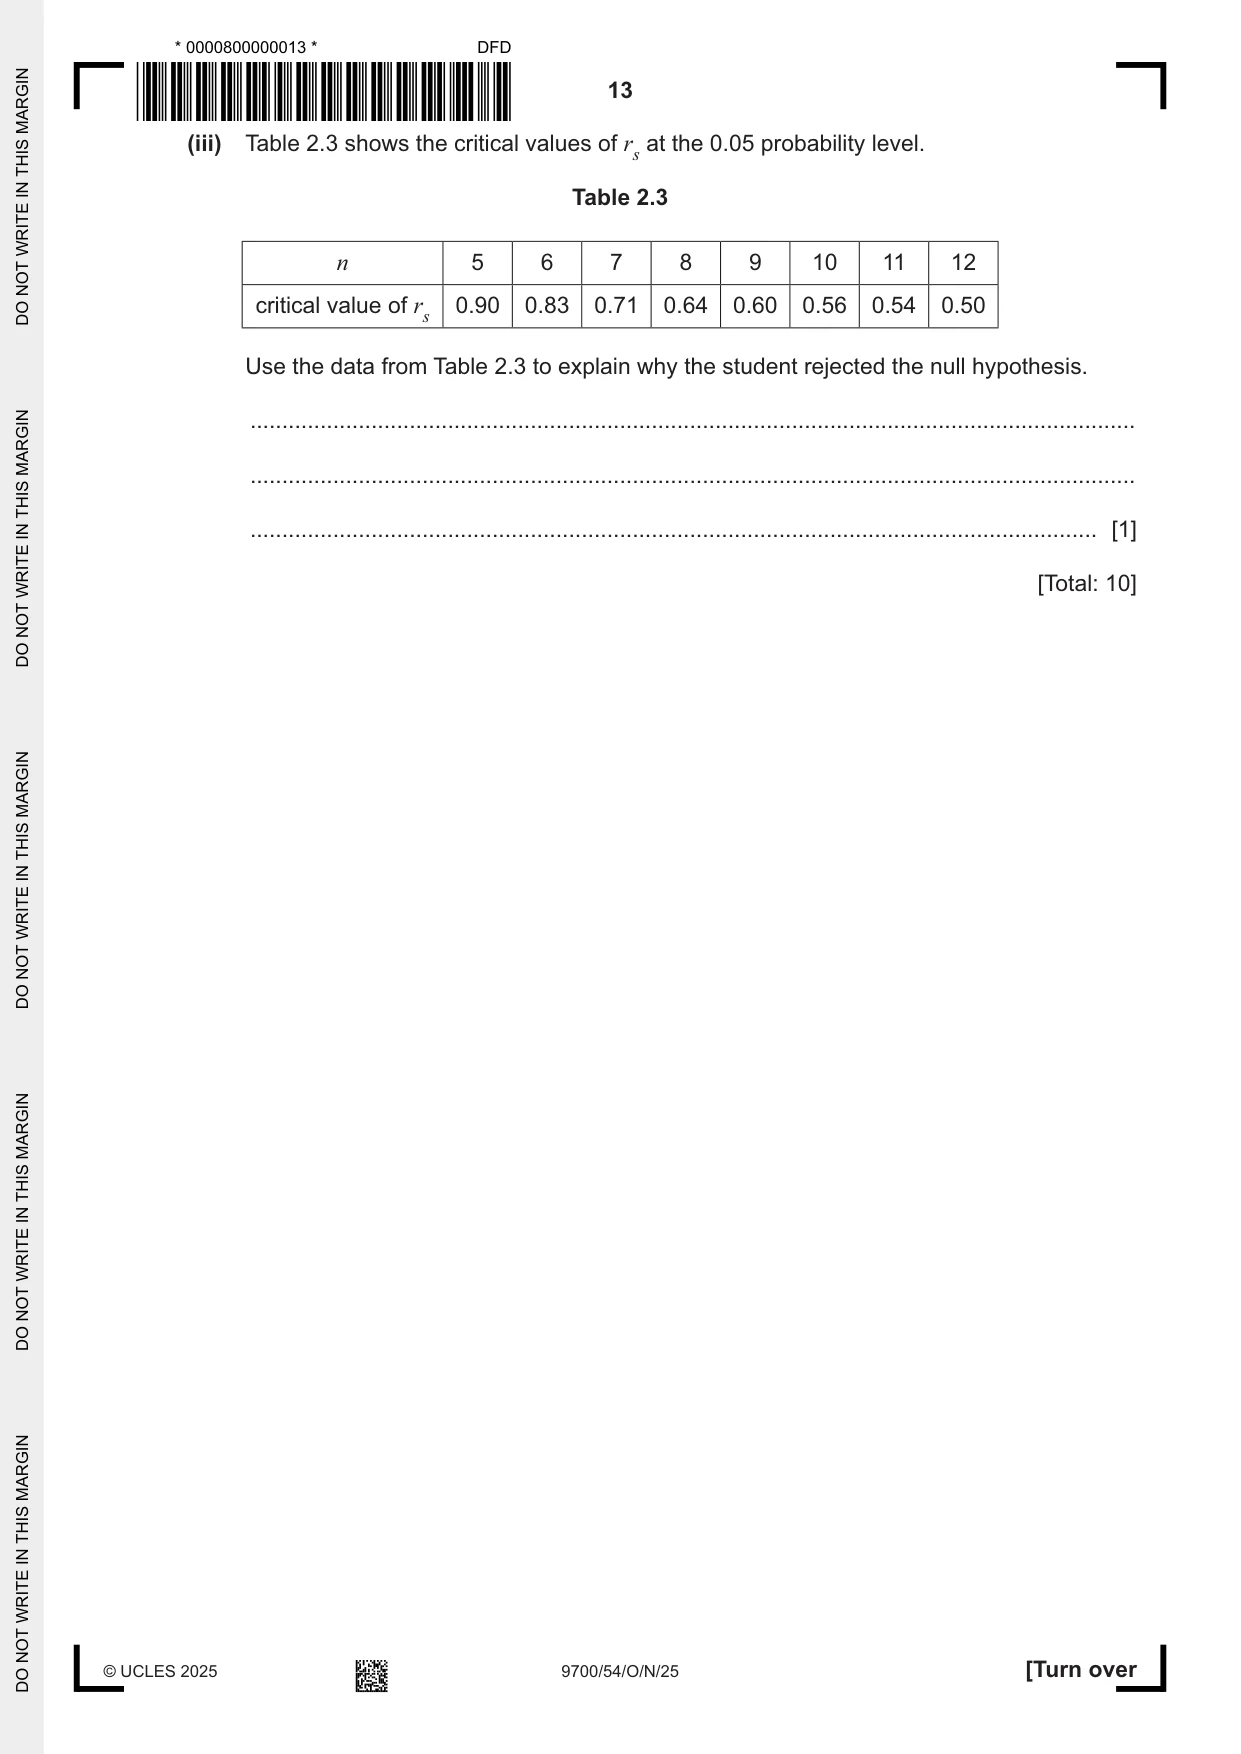
2 The buff‑tailed bumblebee, Bombus terrestris, is an insect that uses its tongue to feed on the nectar and pollen of flowers. Buff‑tailed bumblebees can feed on the nectar and pollen of flowers by either gripping (holding) onto flower petals or by hovering (flying) in front of the flowers. Fig. 2.1 shows the buff‑tailed bumblebee. 10 mm claw Fig. 2.1 The buff‑tailed bumblebee has adaptations, such as claws, to help it to grip on to flower petals to obtain nectar and pollen. Fig. 2.2 shows the buff‑tailed bumblebee using its claws to grip on to the flower petals as the bee feeds. flower petal claw used to grip the flower petal Fig. 2.2 Fig. 2.3 is a magnified image of the claw of a bee. claws Fig. 2.3 (a) Suggest a method that can be used to measure the image length of the longest part of the curved claw in Fig. 2.3. ................................................................................................................................................... ................................................................................................................................................... ............................................................................................................................................. [1] (b) The surfaces of flower petals of different plant species have different textures. Fig. 2.4 shows a scanning electron micrograph of a rough surface of a flower petal. Fig. 2.4 Fig. 2.5 shows a scanning electron micrograph of a smoother surface of a flower petal. Fig. 2.5 A scientist made an artificial flower apparatus, as shown in Fig. 2.6. 60 mm diameter disc to represent a flower petal small drop of concentrated sucrose solution to represent nectar support Fig. 2.6 To model flower petals with different levels of roughness, the scientist used different discs. Each disc was made using particles of different diameters attached to the surface of the disc, as shown in Table 2.1. Table 2.1 mean particle diameter level of on the disc / µm roughness 5 smooth 9 12 16 30 53 rough (i) The diameter of each disc was standardised as 60 mm. Identify one other variable the scientist should standardise when making the discs. ........................................................................................................................................... ........................................................................................................................................... ..................................................................................................................................... [1] (ii) The scientist investigated if the level of roughness of the discs affects whether buff‑tailed bumblebees grip on to the disc or hover when they feed (feeding visit) from the small drop of concentrated sucrose solution. For each disc, the scientist: • recorded the number of feeding visits when the buff‑tailed bumblebees gripped on to the disc • recorded the number of feeding visits when the buff‑tailed bumblebees hovered in front of the disc • calculated the percentage of feeding visits when the buff‑tailed bumblebees gripped on to the disc. State the independent variable in this investigation. ........................................................................................................................................... ..................................................................................................................................... [1] (iii) For the disc with a mean particle diameter of 16 µm, the scientist calculated that the buff‑tailed bumblebees gripped on to the disc for 79% of their feeding visits. The total number of feeding visits was 117. Calculate the number of feeding visits when the buff‑tailed bumblebees hovered in front of the disc. Give your answer to the nearest whole number. number of feeding visits when the buff‑tailed bumblebees hovered = .............................................. [1] (iv) Fig. 2.7 shows the results of the investigation. 100 90 80 70 percentage of feeding visits 60 when the buff-tailed 50 bumblebees gripped on to 40 the disc 30 20 10 0 5 9 12 16 30 53 mean particle diameter on the disc / μm Fig. 2.7 State two conclusions that can be made from the results in Fig. 2.7. ........................................................................................................................................... ........................................................................................................................................... ........................................................................................................................................... ........................................................................................................................................... ..................................................................................................................................... [2] (c) A student used the Spearman’s rank correlation to analyse the data in Fig. 2.7. The student stated the null hypothesis as: There is no correlation between the mean particle diameter on the disc and the percentage of feeding visits when the buff‑tailed bumblebees gripped on to the disc. The formula for Spearman’s rank correlation (rs) is: 2 key to symbols: 6 # R D r = 1 - f 3 p D = difference in rank between each pair of measurements s n - n n = number of pairs of items in the sample (i) Complete Table 2.2 to calculate R D2. Table 2.2 rank of percentage percentage of feeding mean rank of of feeding visits particle mean visits when the Differencediameter on particle when the D2 buff‑tailed in rank, D the disc diameter on buff‑tailed bumblebees / µm the disc bumblebees gripped on gripped on to the disc to the disc 5 1 0 9 2 4 12 3 16 16 4 79 30 5 99 53 6 99 R D2 = [2] (ii) Use the calculated value for R D2 from Table 2.2 to calculate rs. rs = ......................................................... [1] (iii) Table 2.3 shows the critical values of rs at the 0.05 probability level. Table 2.3 n 5 6 7 8 9 10 11 12 critical value of rs 0.90 0.83 0.71 0.64 0.60 0.56 0.54 0.50 Use the data from Table 2.3 to explain why the student rejected the null hypothesis. ........................................................................................................................................... ........................................................................................................................................... ..................................................................................................................................... [1] [Total: 10]
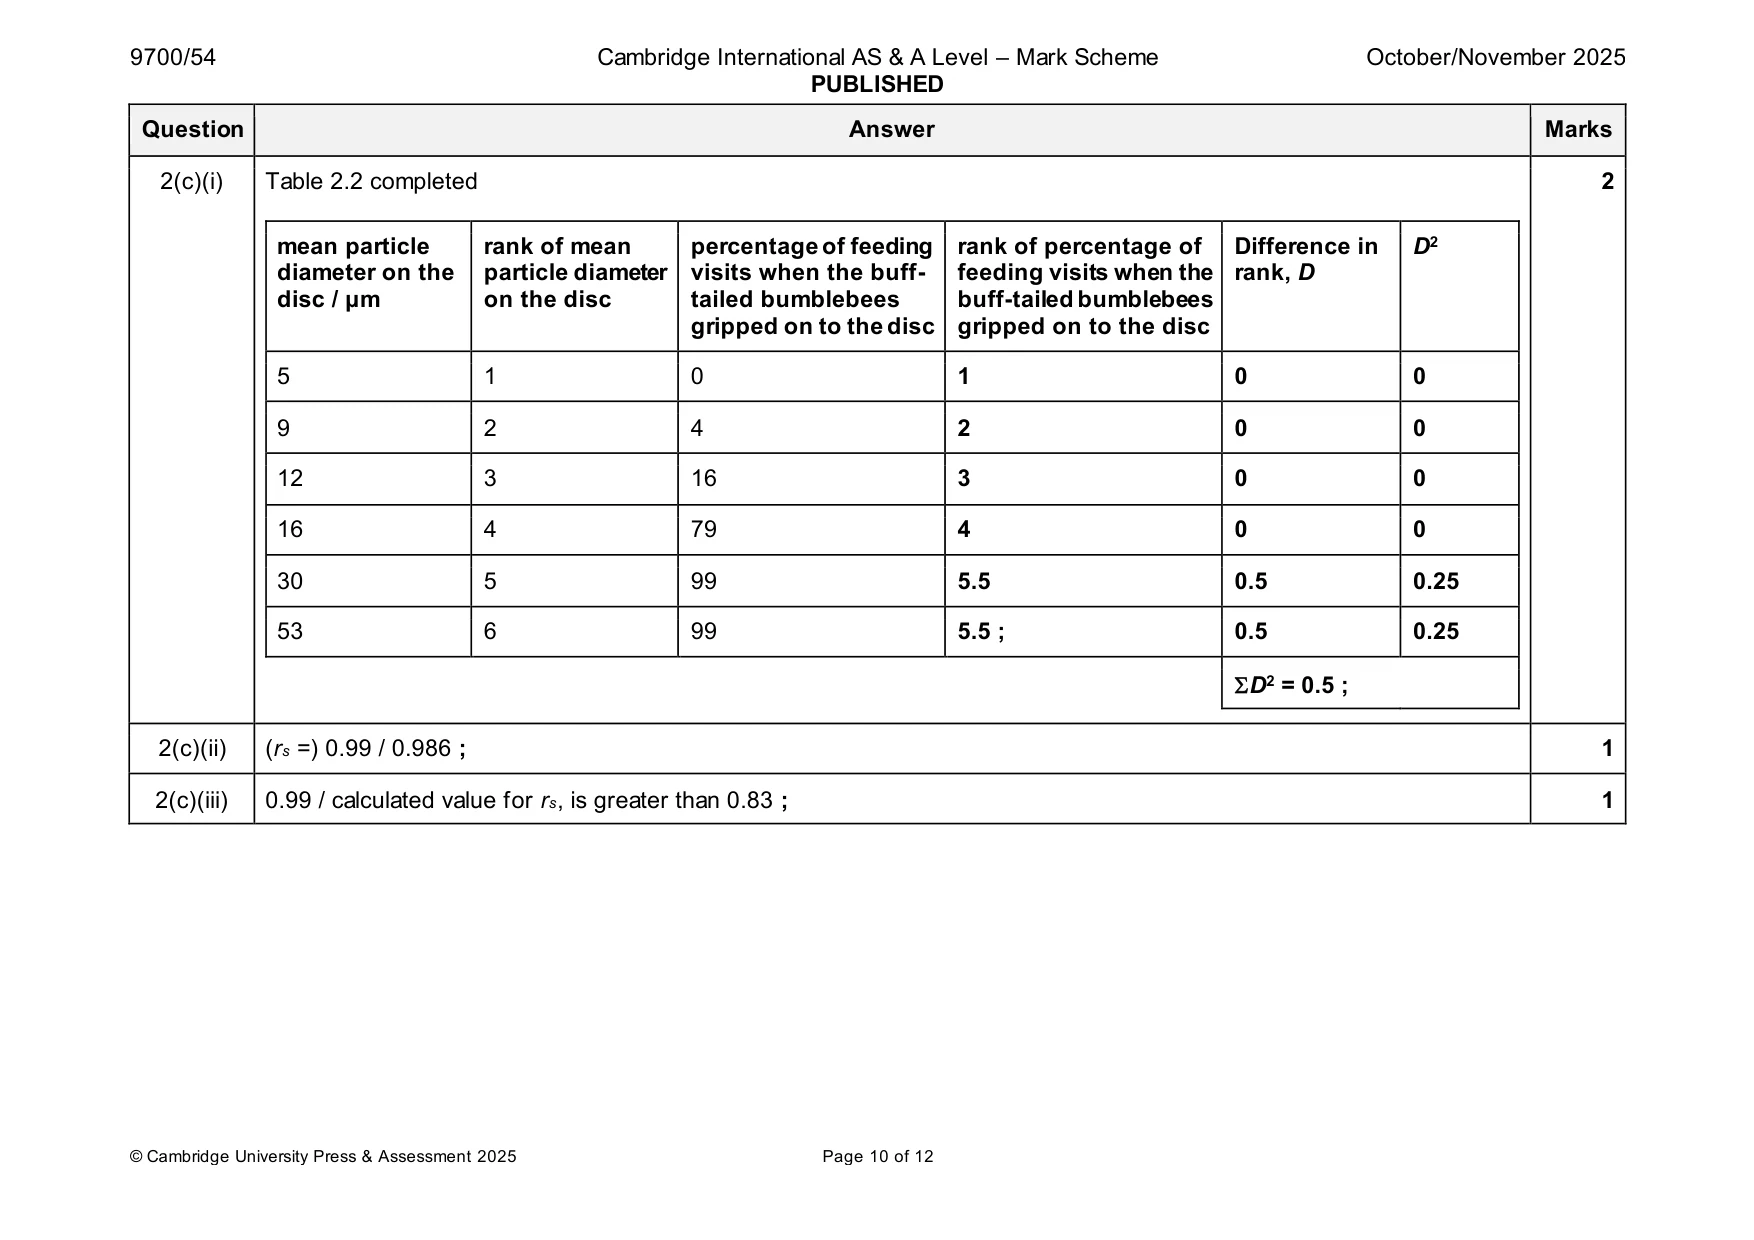
Mark scheme: 2(a) method for measuring a curved claw (on the image) ; 1 2(b)(i) any one from: 1 colour of disc ; material of disc ; type of particle ; 2(b)(ii) (level of) roughness 1 or (mean) particle diameter (on disc) ; 2(b)(iii) 24 or 25 (feeding visits) ; 1 2(b)(iv) any two from: 2 1 as the particle diameter increases, (percentage of feeding visits when buff-tailed bumblebees) gripped (on to the disc) increases ; ora 2 at 30 µm and 53 µm / over 30 µm, there is no, difference / change / increase / AW (in percentage of feeding visits when buff-tailed bumblebees gripped on to the disc) ; 3 3. at 5 µm, (buff-tailed bumblebees) only hover ; 2(c)(i) Table 2.2 completed 2 mean particle rank of mean percentage of feeding rank of percentage of Difference in D2 diameter on the particle diameter visits when the buff- feeding visits when the rank, D disc / μm on the disc tailed bumblebees buff-tailed bumblebees gripped on to the disc gripped on to the disc 5 1 0 1 0 0 9 2 4 2 0 0 12 3 16 3 0 0 16 4 79 4 0 0 30 5 99 5.5 0.5 0.25 53 6 99 5.5 ; 0.5 0.25 D2 = 0.5 ; 2(c)(ii) (rs =) 0.99 / 0.986 ; 1 2(c)(iii) 0.99 / calculated value for rs, is greater than 0.83 ; 1
Q3 · Pectin is a polysaccharide found in plant cell walls
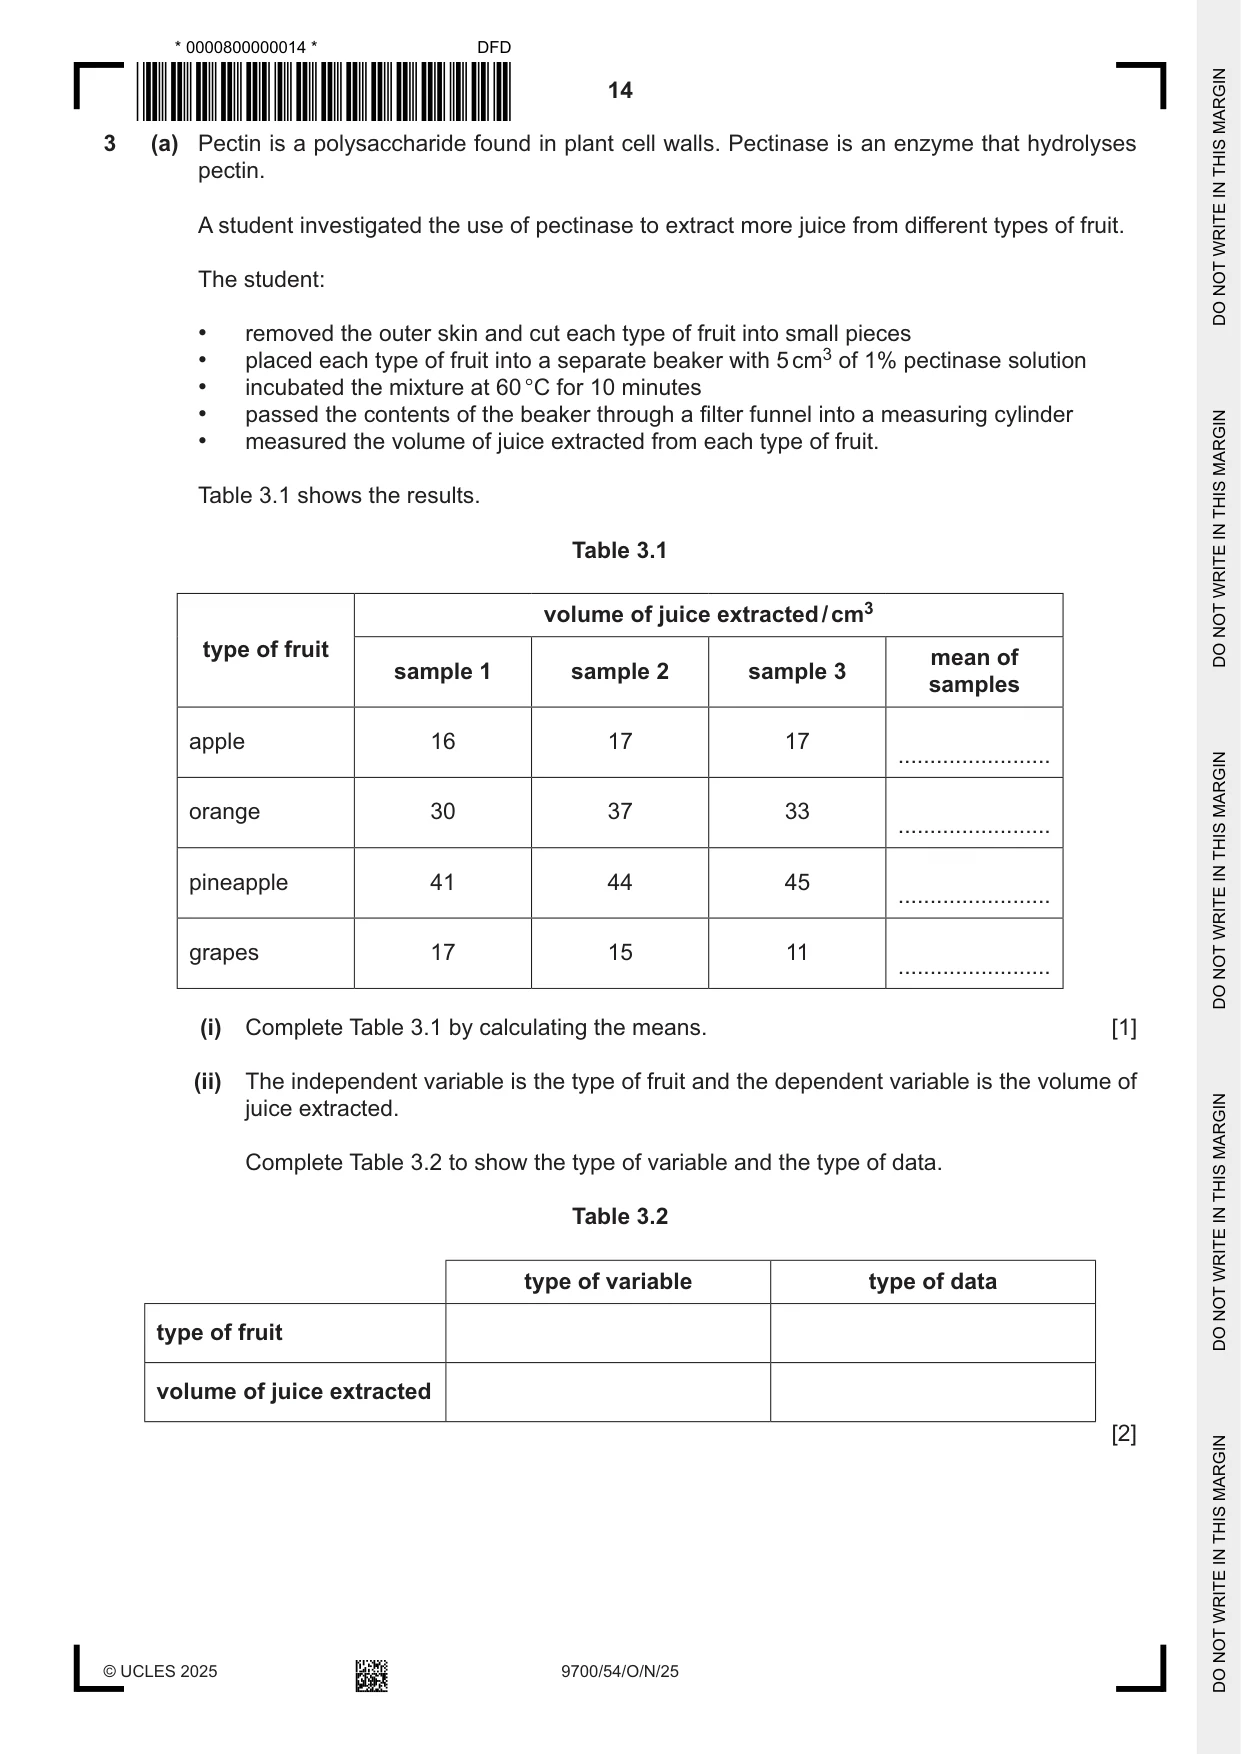
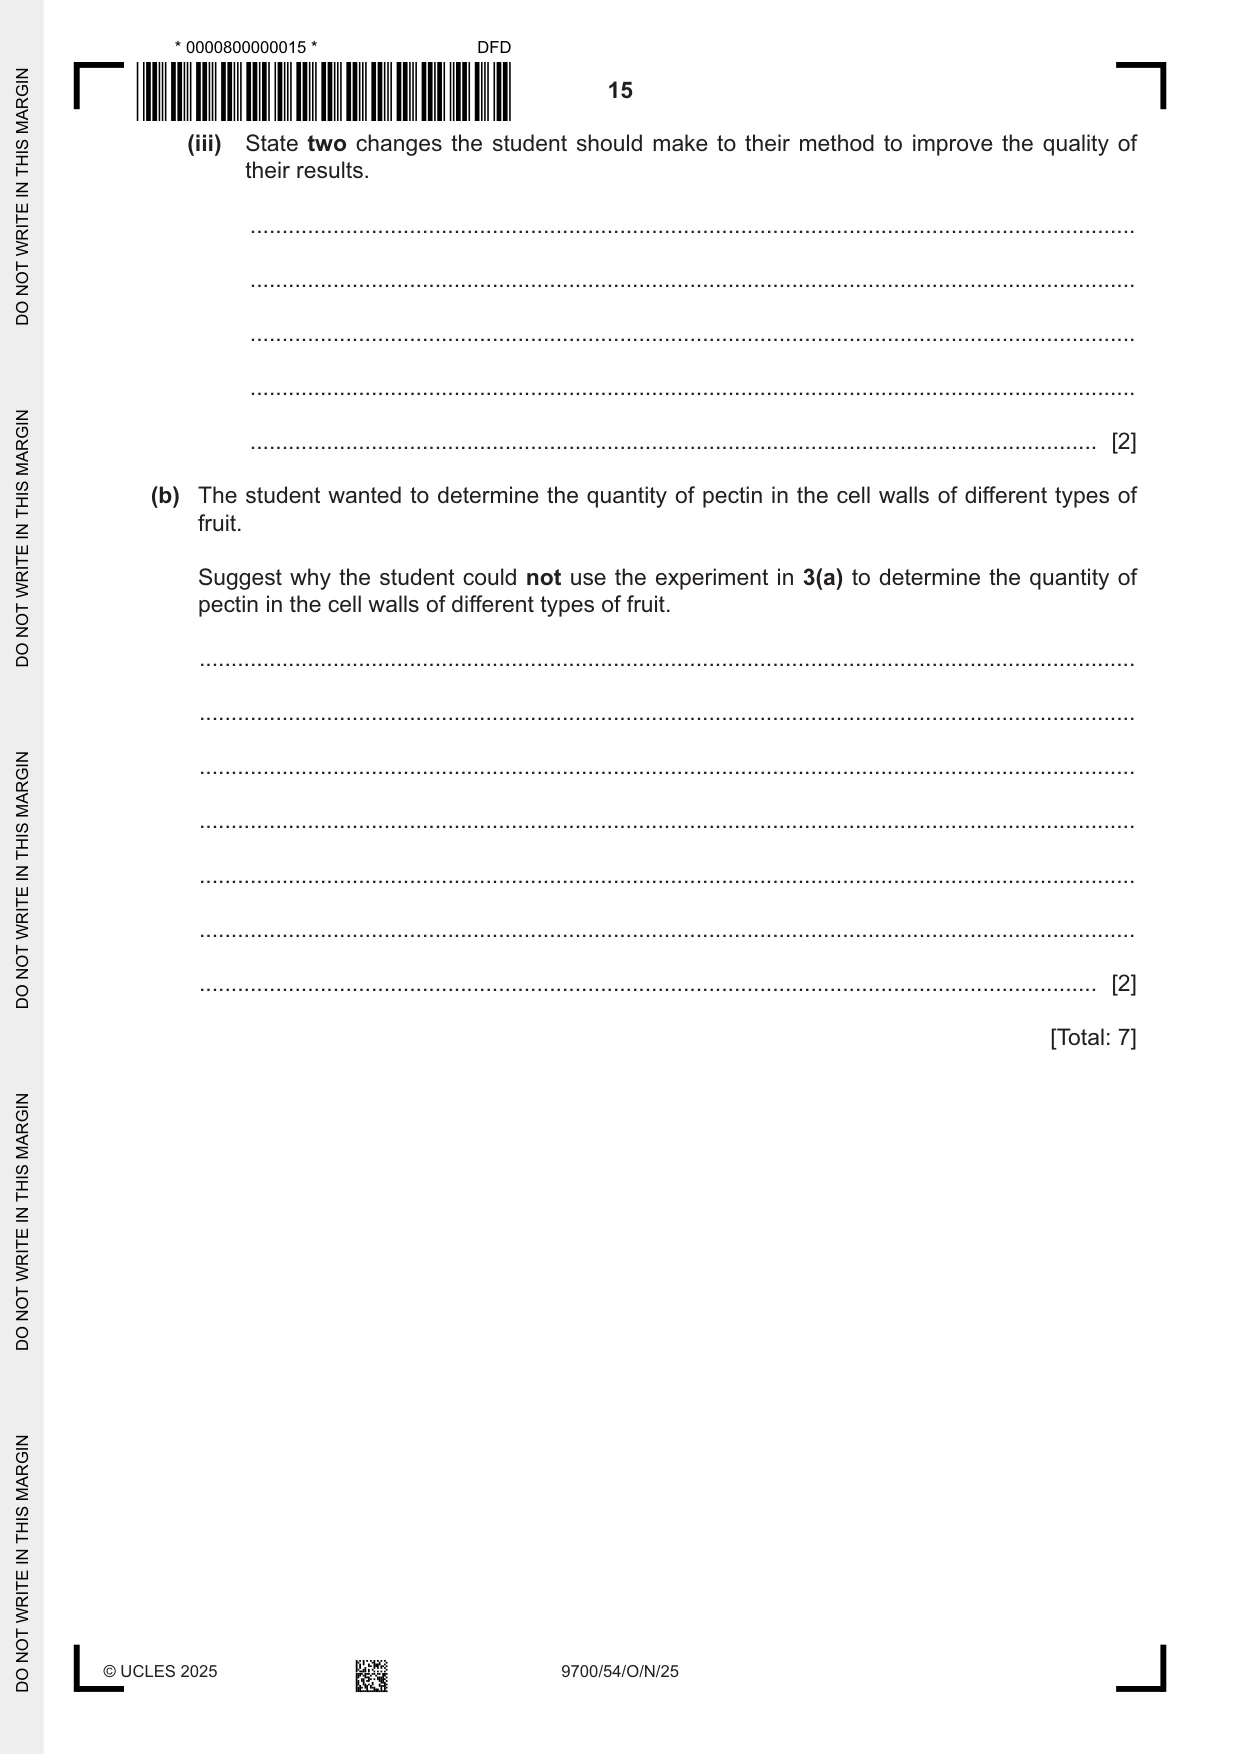
3 (a) Pectin is a polysaccharide found in plant cell walls. Pectinase is an enzyme that hydrolyses pectin. A student investigated the use of pectinase to extract more juice from different types of fruit. The student: • removed the outer skin and cut each type of fruit into small pieces • placed each type of fruit into a separate beaker with 5 cm3 of 1% pectinase solution • incubated the mixture at 60 °C for 10 minutes • passed the contents of the beaker through a filter funnel into a measuring cylinder • measured the volume of juice extracted from each type of fruit. Table 3.1 shows the results. Table 3.1 volume of juice extracted / cm3 type of fruit mean of sample 1 sample 2 sample 3 samples apple 16 17 17 ........................ orange 30 37 33 ........................ pineapple 41 44 45 ........................ grapes 17 15 11 ........................ (i) Complete Table 3.1 by calculating the means. [1] (ii) The independent variable is the type of fruit and the dependent variable is the volume of juice extracted. Complete Table 3.2 to show the type of variable and the type of data. Table 3.2 type of variable type of data type of fruit volume of juice extracted [2] (iii) State two changes the student should make to their method to improve the quality of their results. ........................................................................................................................................... ........................................................................................................................................... ........................................................................................................................................... ........................................................................................................................................... ..................................................................................................................................... [2] (b) The student wanted to determine the quantity of pectin in the cell walls of different types of fruit. Suggest why the student could not use the experiment in 3(a) to determine the quantity of pectin in the cell walls of different types of fruit. ................................................................................................................................................... ................................................................................................................................................... ................................................................................................................................................... ................................................................................................................................................... ................................................................................................................................................... ................................................................................................................................................... ............................................................................................................................................. [2] [Total: 7]
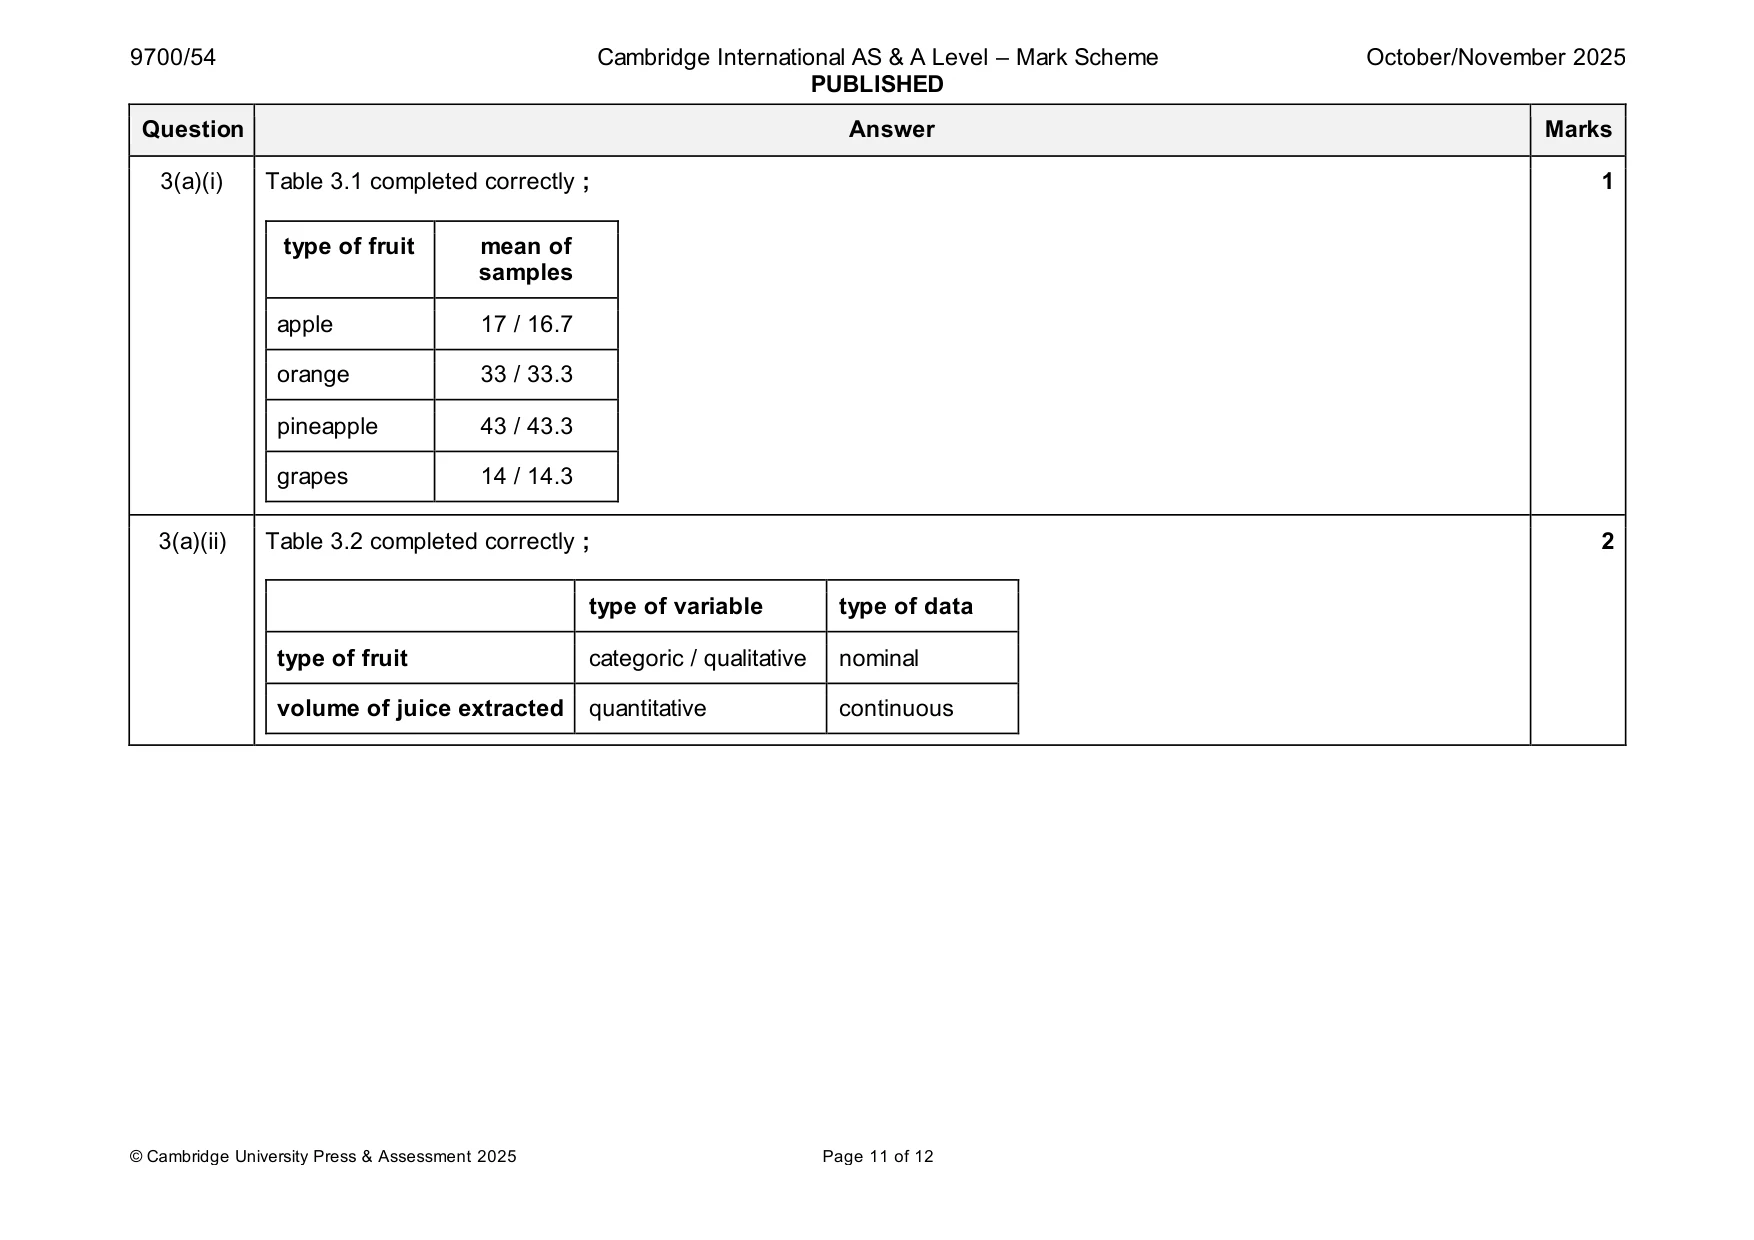
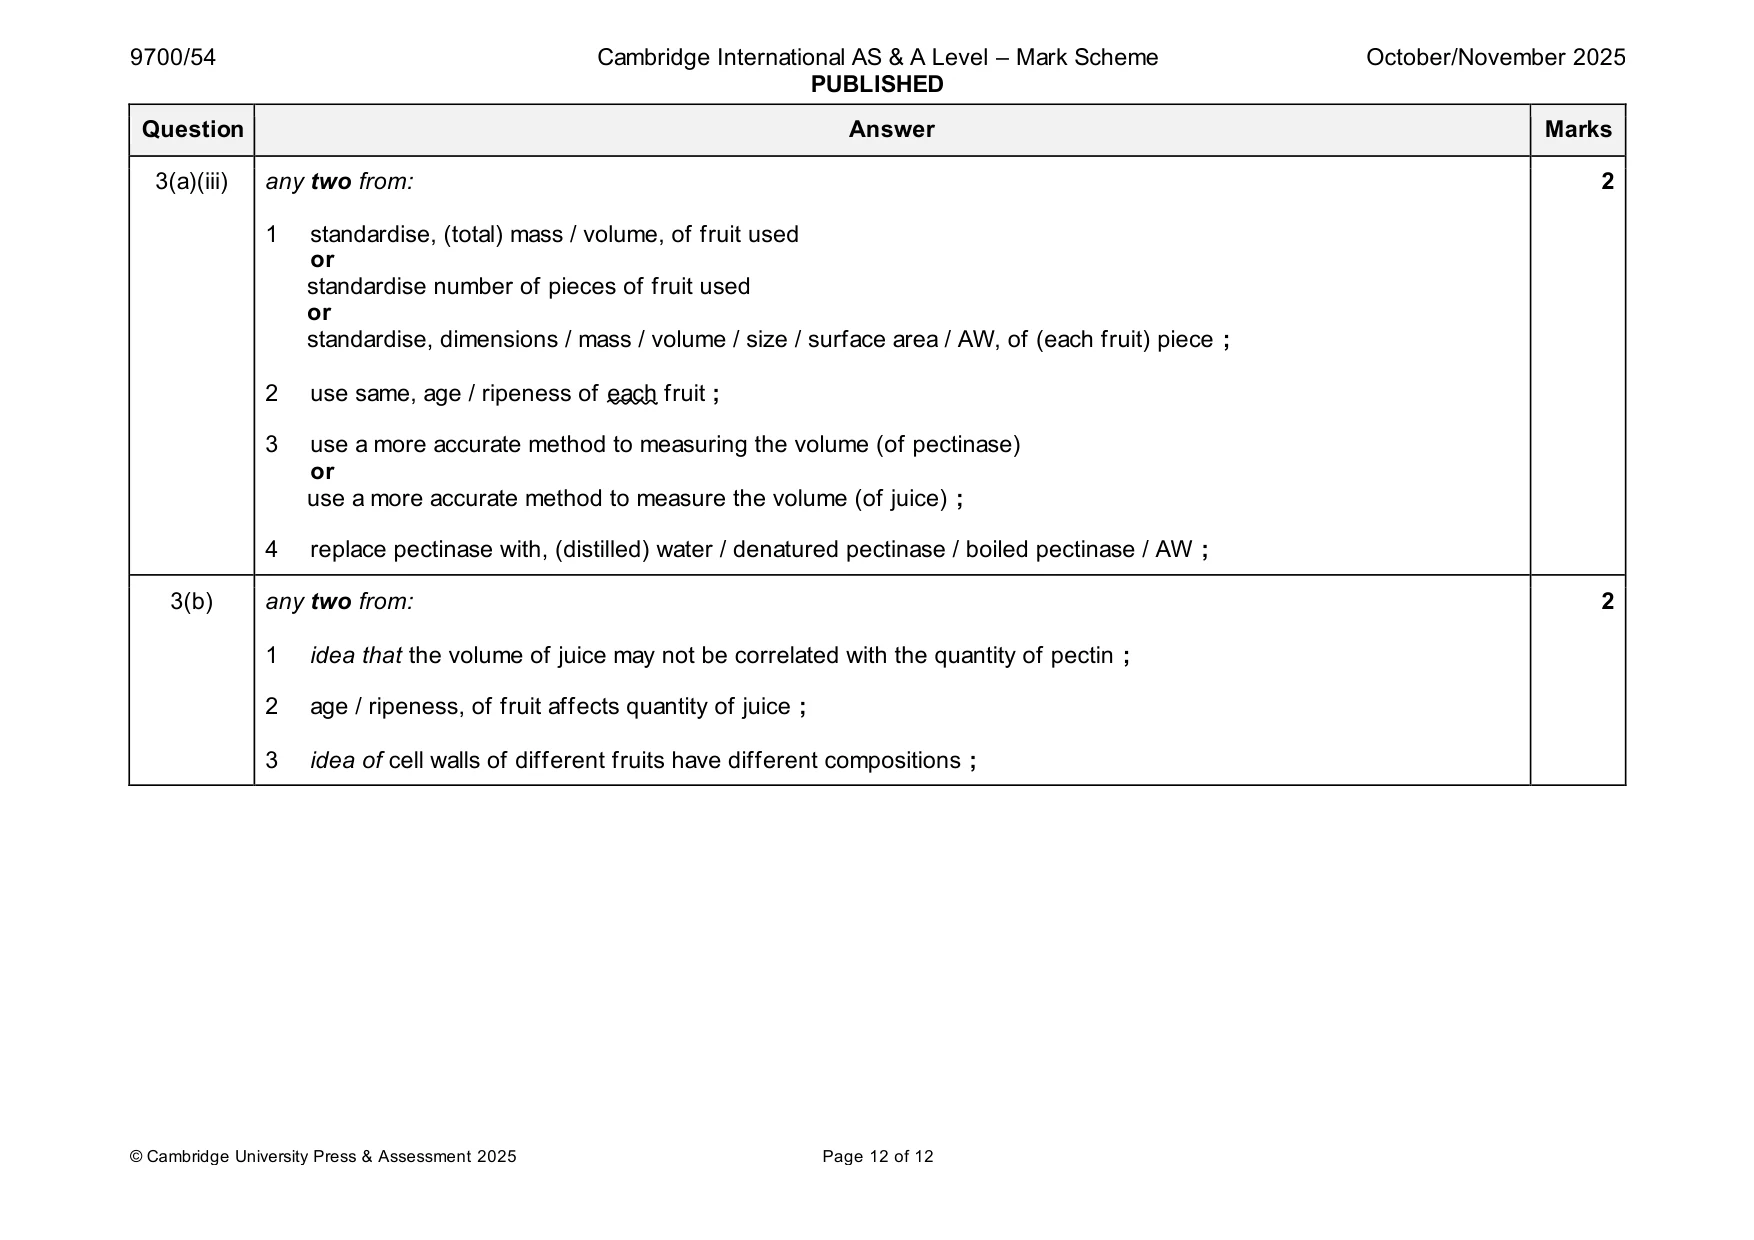
Mark scheme: 3(a)(i) Table 3.1 completed correctly ; 1 type of fruit mean of samples apple 17 / 16.7 orange 33 / 33.3 pineapple 43 / 43.3 grapes 14 / 14.3 3(a)(ii) Table 3.2 completed correctly ; 2 type of variable type of data type of fruit categoric / qualitative nominal volume of juice extracted quantitative continuous 3(a)(iii) any two from: 2 1 standardise, (total) mass / volume, of fruit used or standardise number of pieces of fruit used or standardise, dimensions / mass / volume / size / surface area / AW, of (each fruit) piece ; 2 use same, age / ripeness of each fruit ; 3 use a more accurate method to measuring the volume (of pectinase) or use a more accurate method to measure the volume (of juice) ; 4 replace pectinase with, (distilled) water / denatured pectinase / boiled pectinase / AW ; 3(b) any two from: 2 1 idea that the volume of juice may not be correlated with the quantity of pectin ; 2 age / ripeness, of fruit affects quantity of juice ; 3 idea of cell walls of different fruits have different compositions ;
What was in this paper
The subtopics covered by these 3 questions, and how many questions each got. Open one in a new tab to see every Cambridge question on it.
What you needed in this session
Cambridge’s own grade thresholds for 2025 Oct/Nov, Paper 5 · Variant 4. A higher threshold means an easier paper — the bar moves with how the cohort did.