Cambridge A Level Biology 9700 — 2023 Oct/Nov Paper 3 · Variant 5
9700/35/O/N/23 · 2 questions · 40 marks · ≈45 min
The question paper and its mark scheme, free to read here and free to download. This is Cambridge’s own paper, exactly as it was sat.
Question paper16 pages
Mark scheme7 pages
Answers below. Sit the paper first if you are practising.
Questions as text
Q1 · When potato cells are placed into different concentrations of sodium chloride solution…
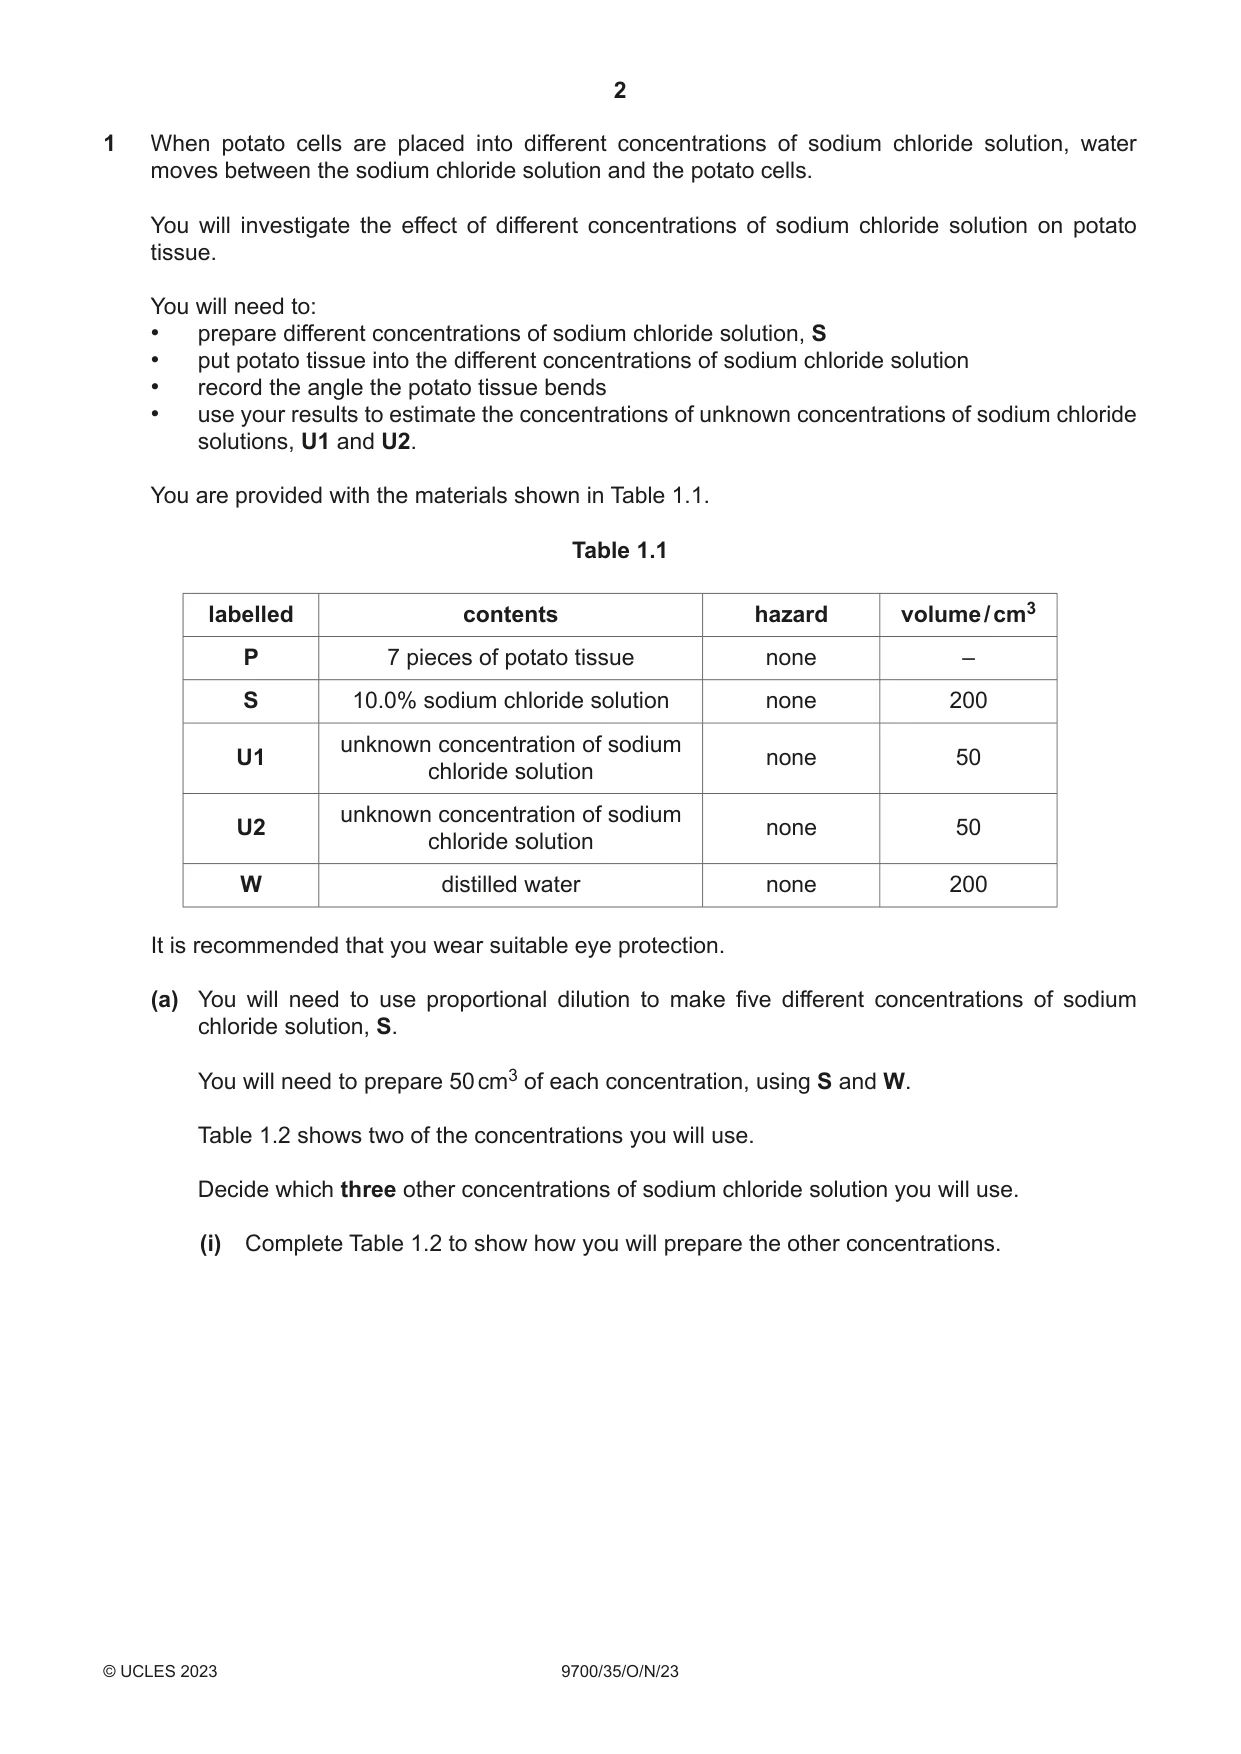
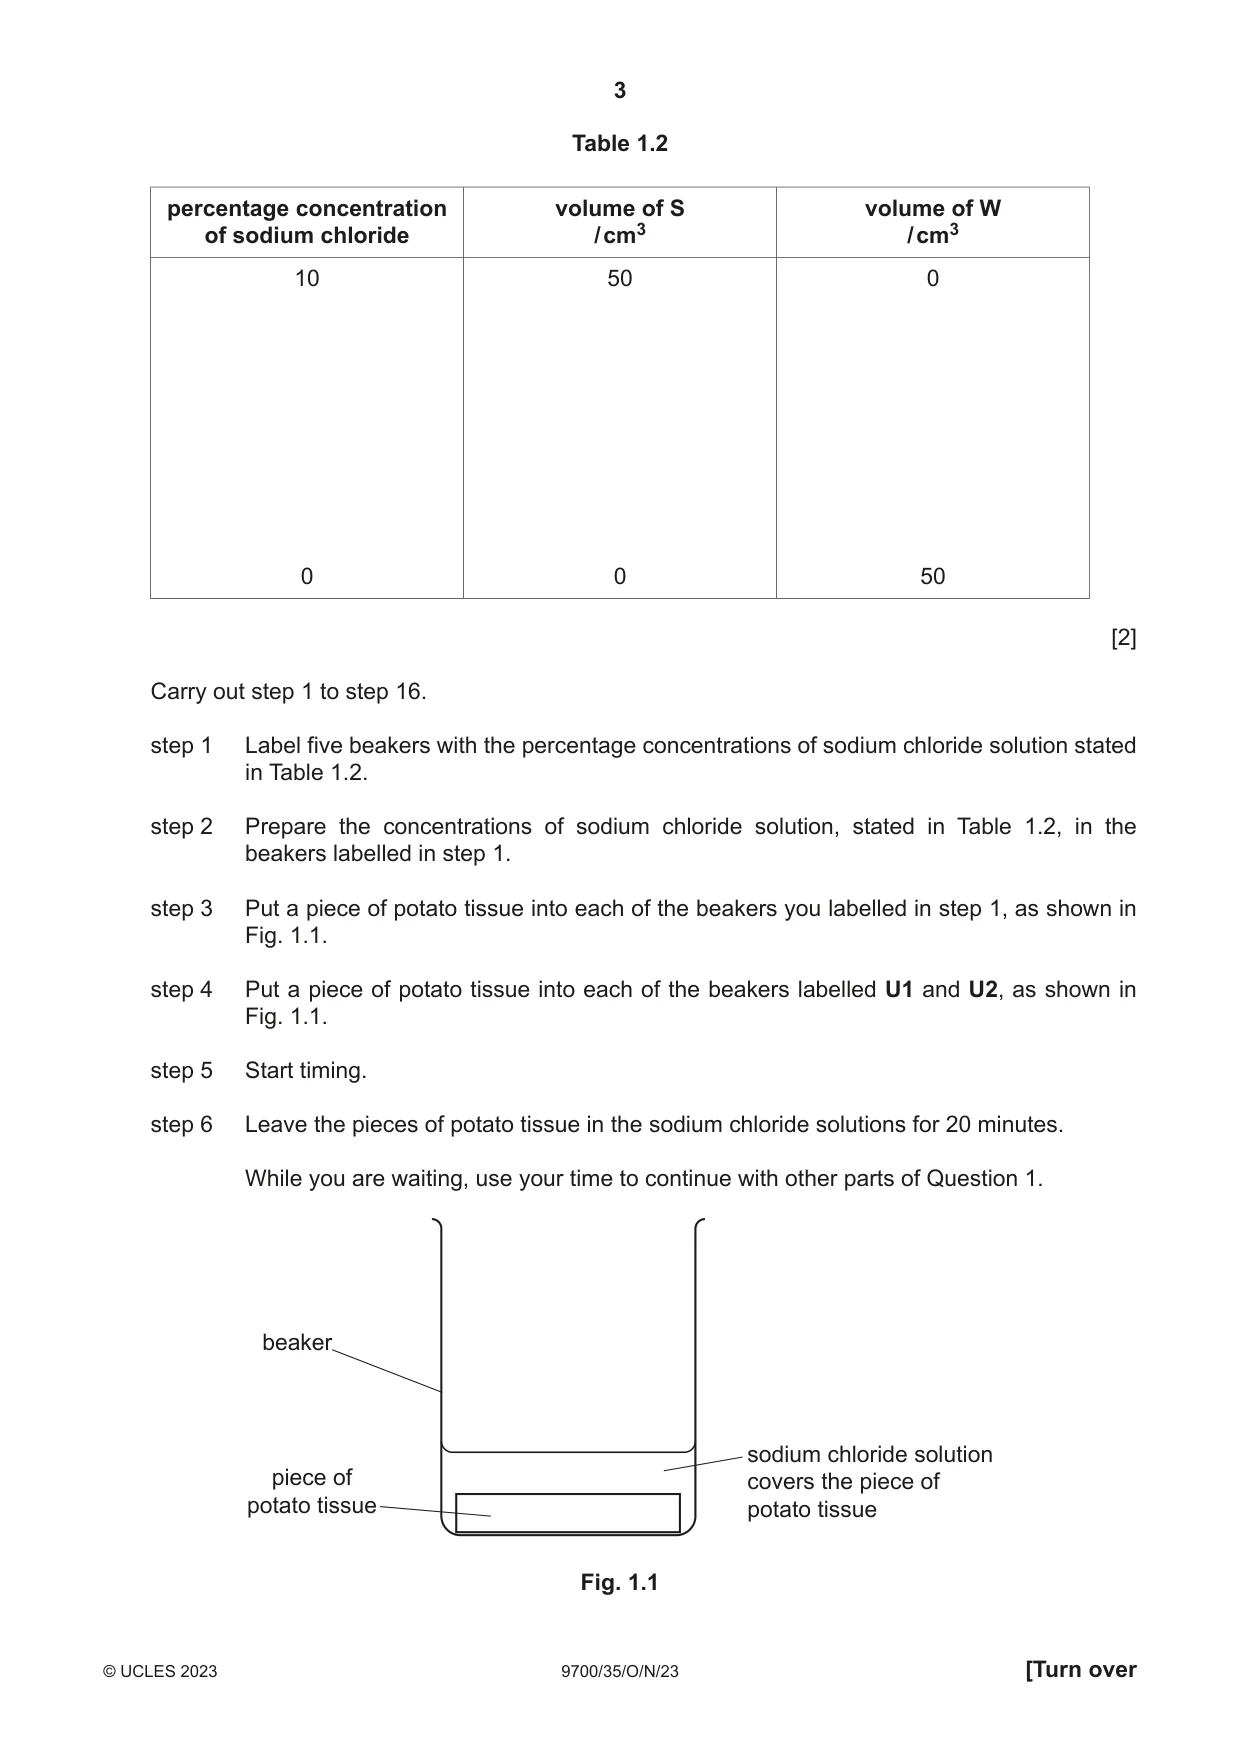
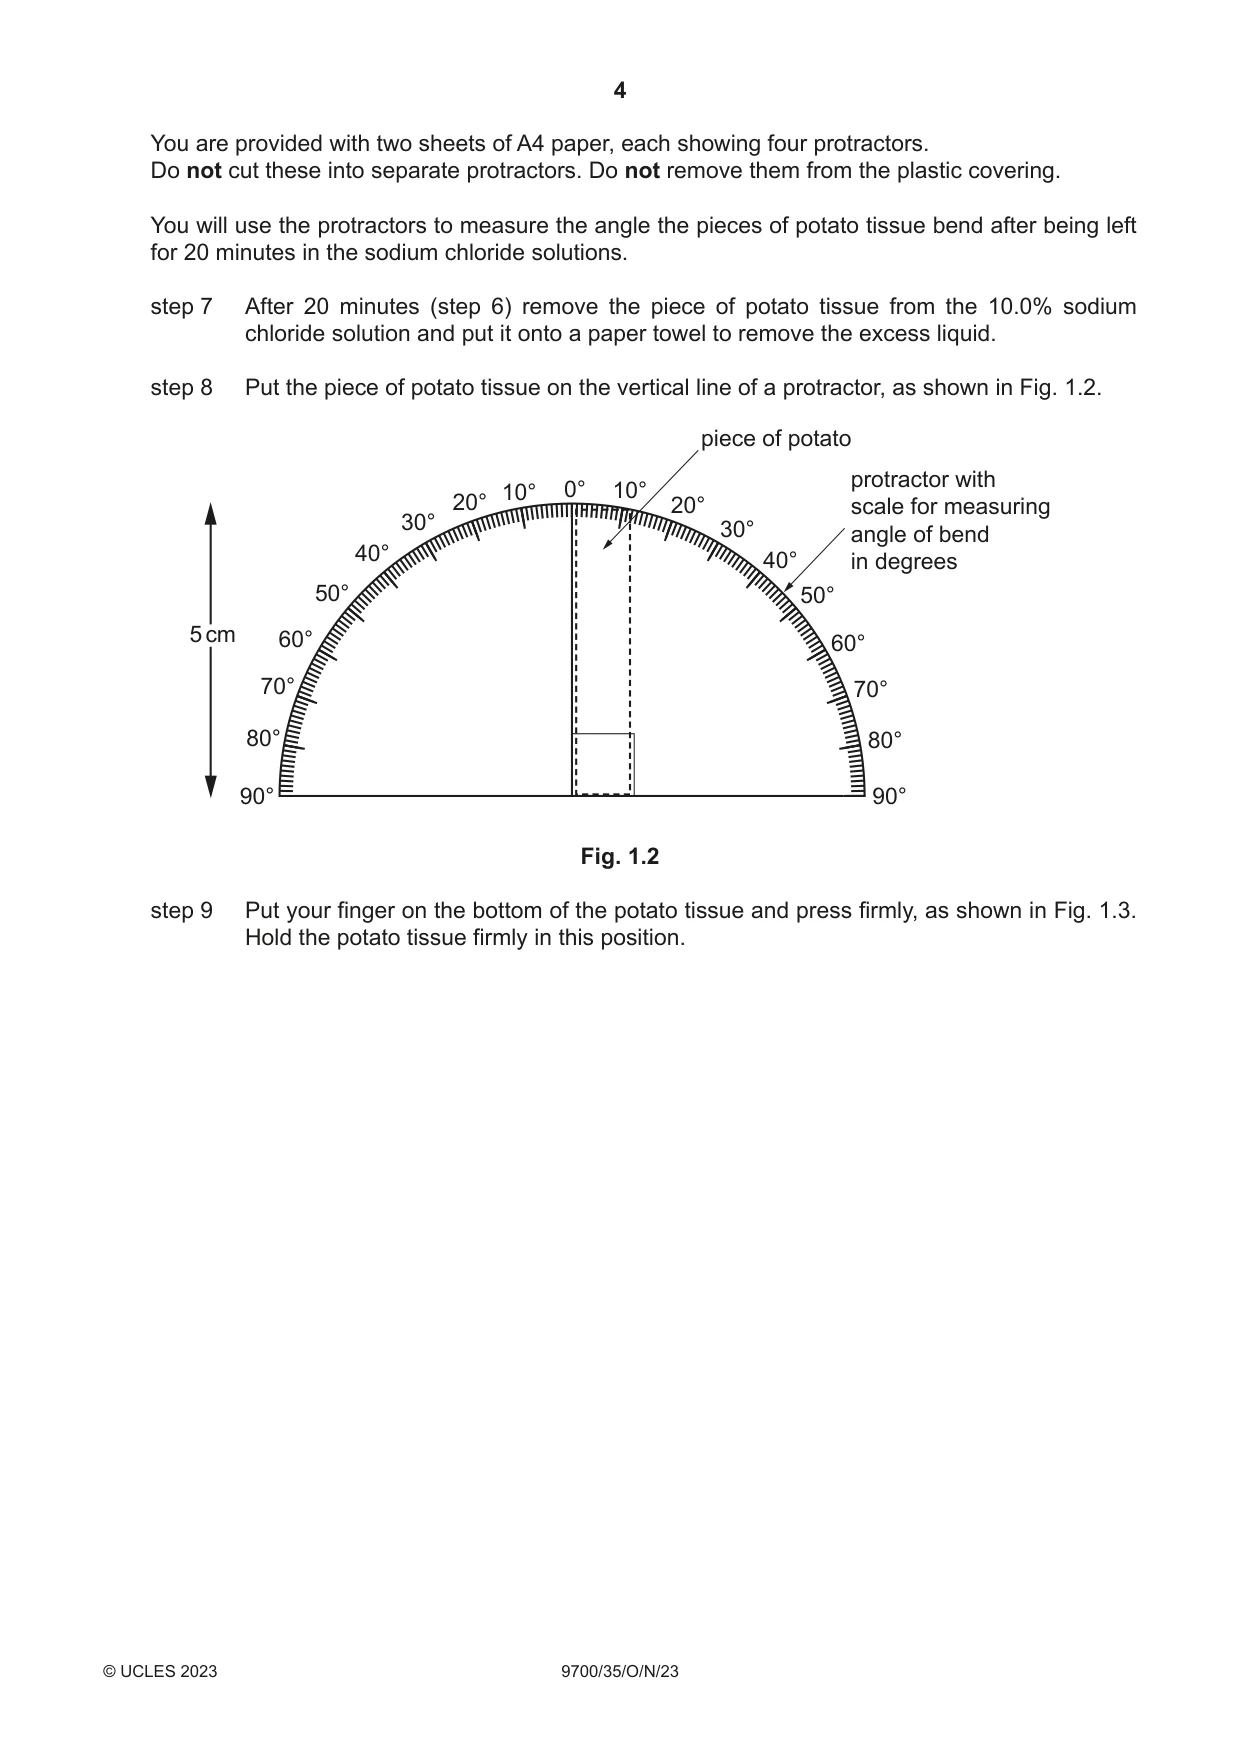
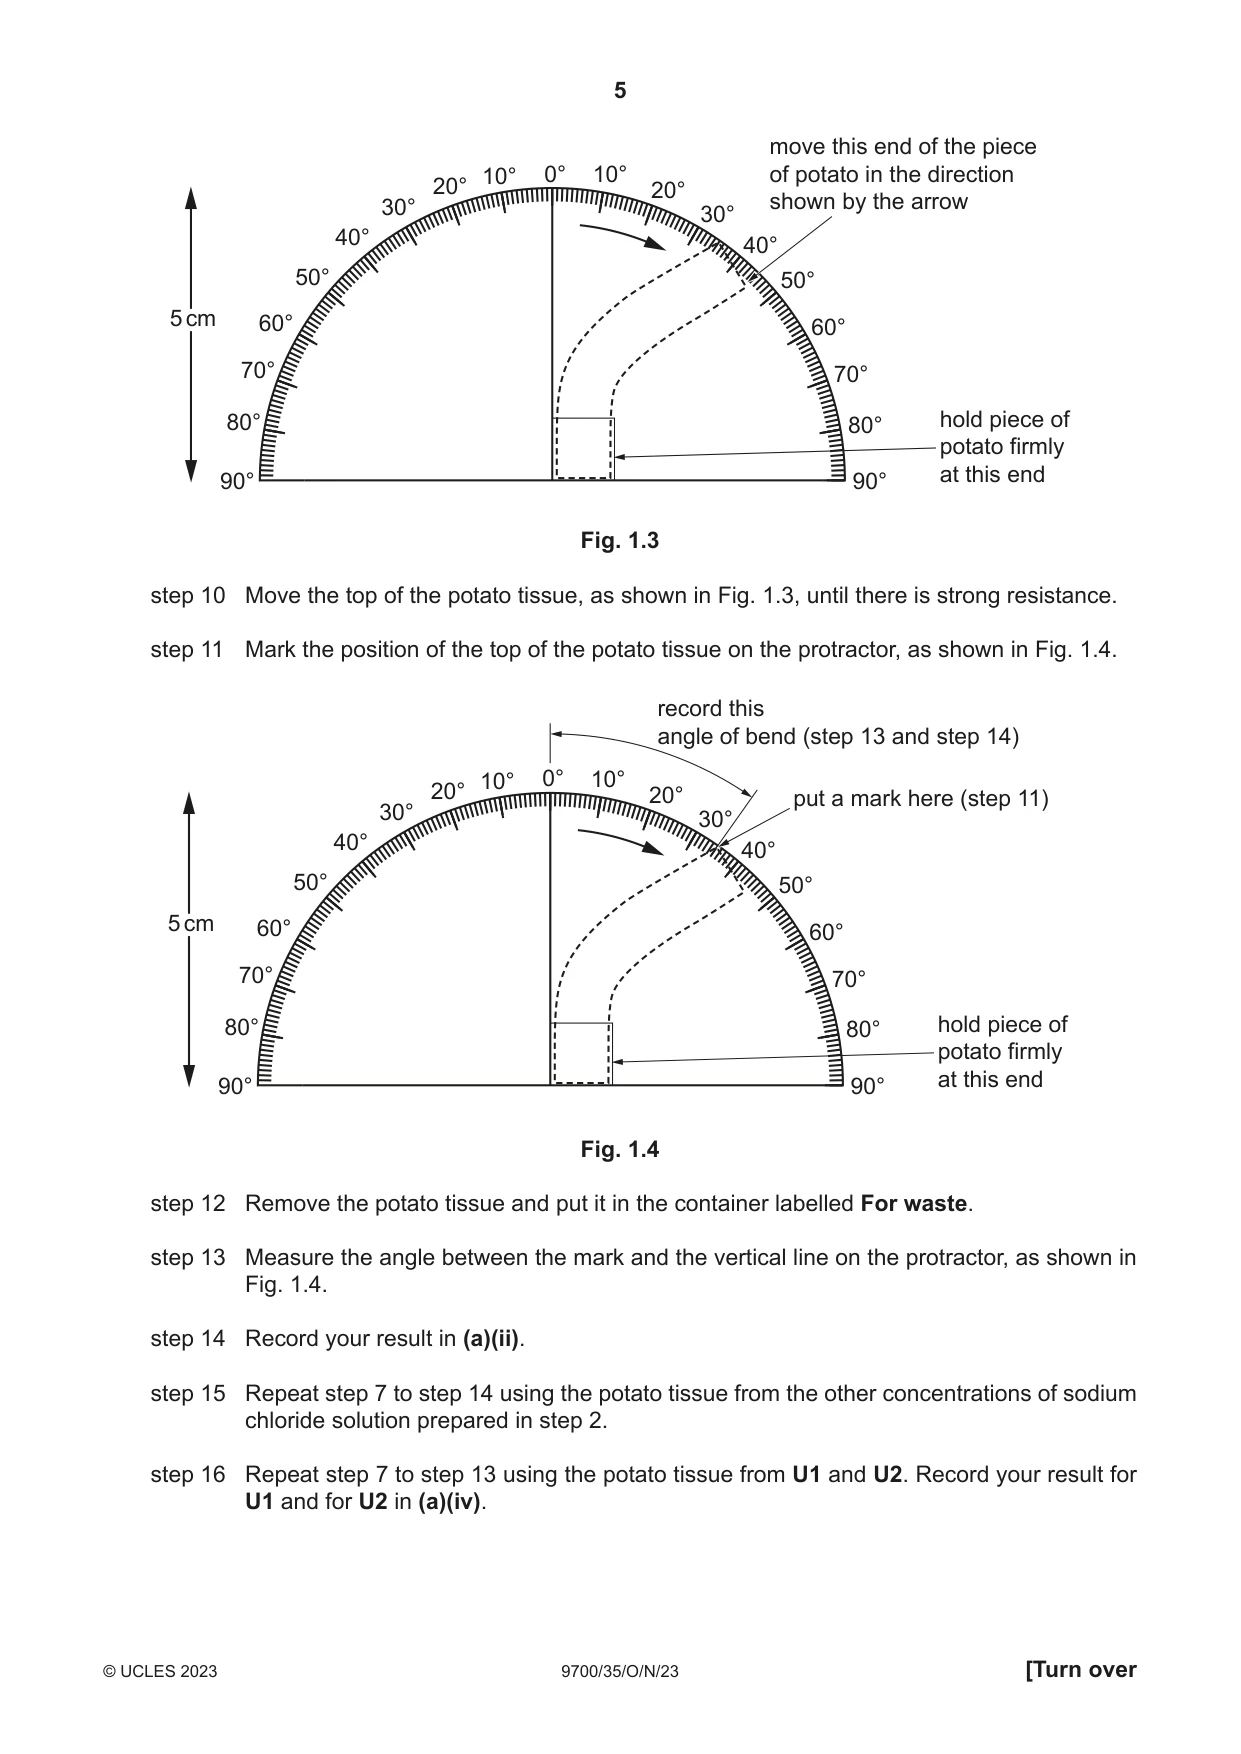
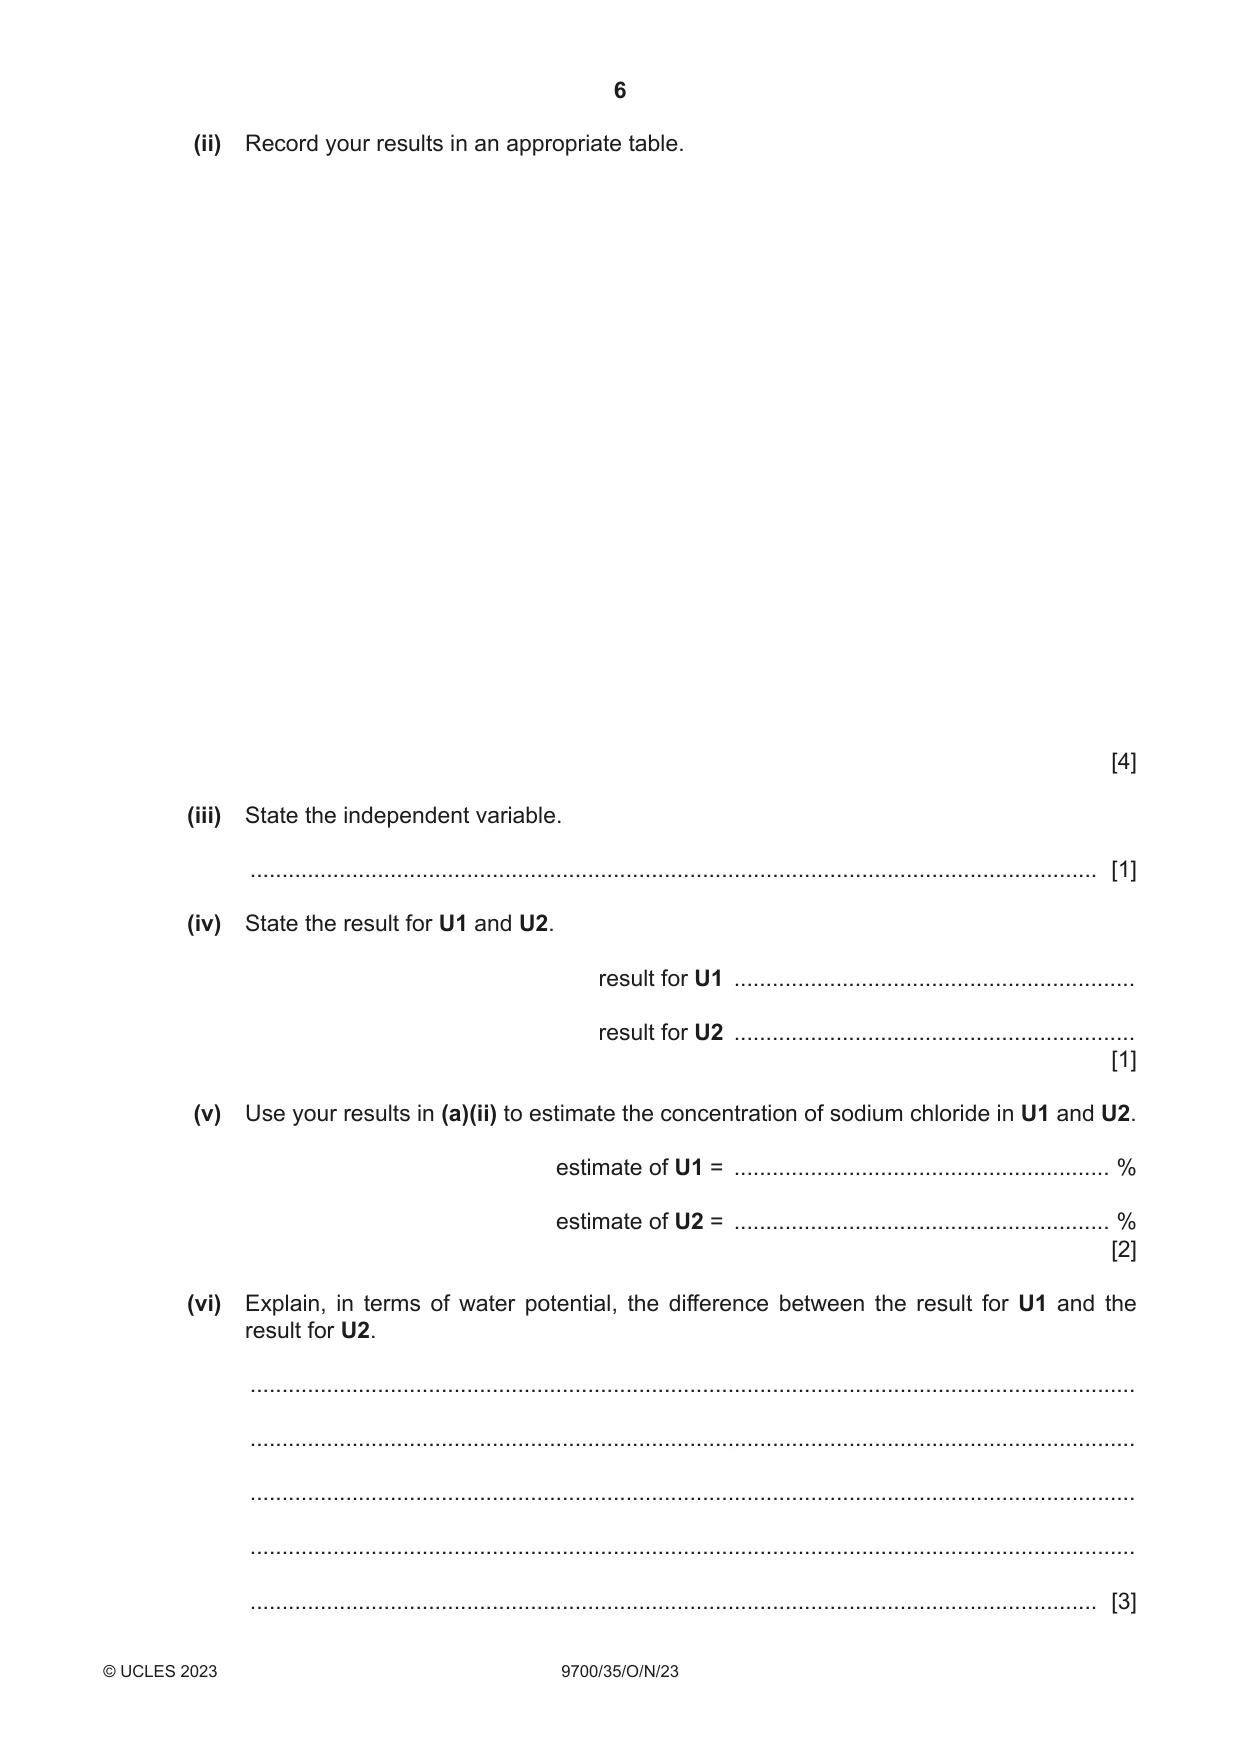
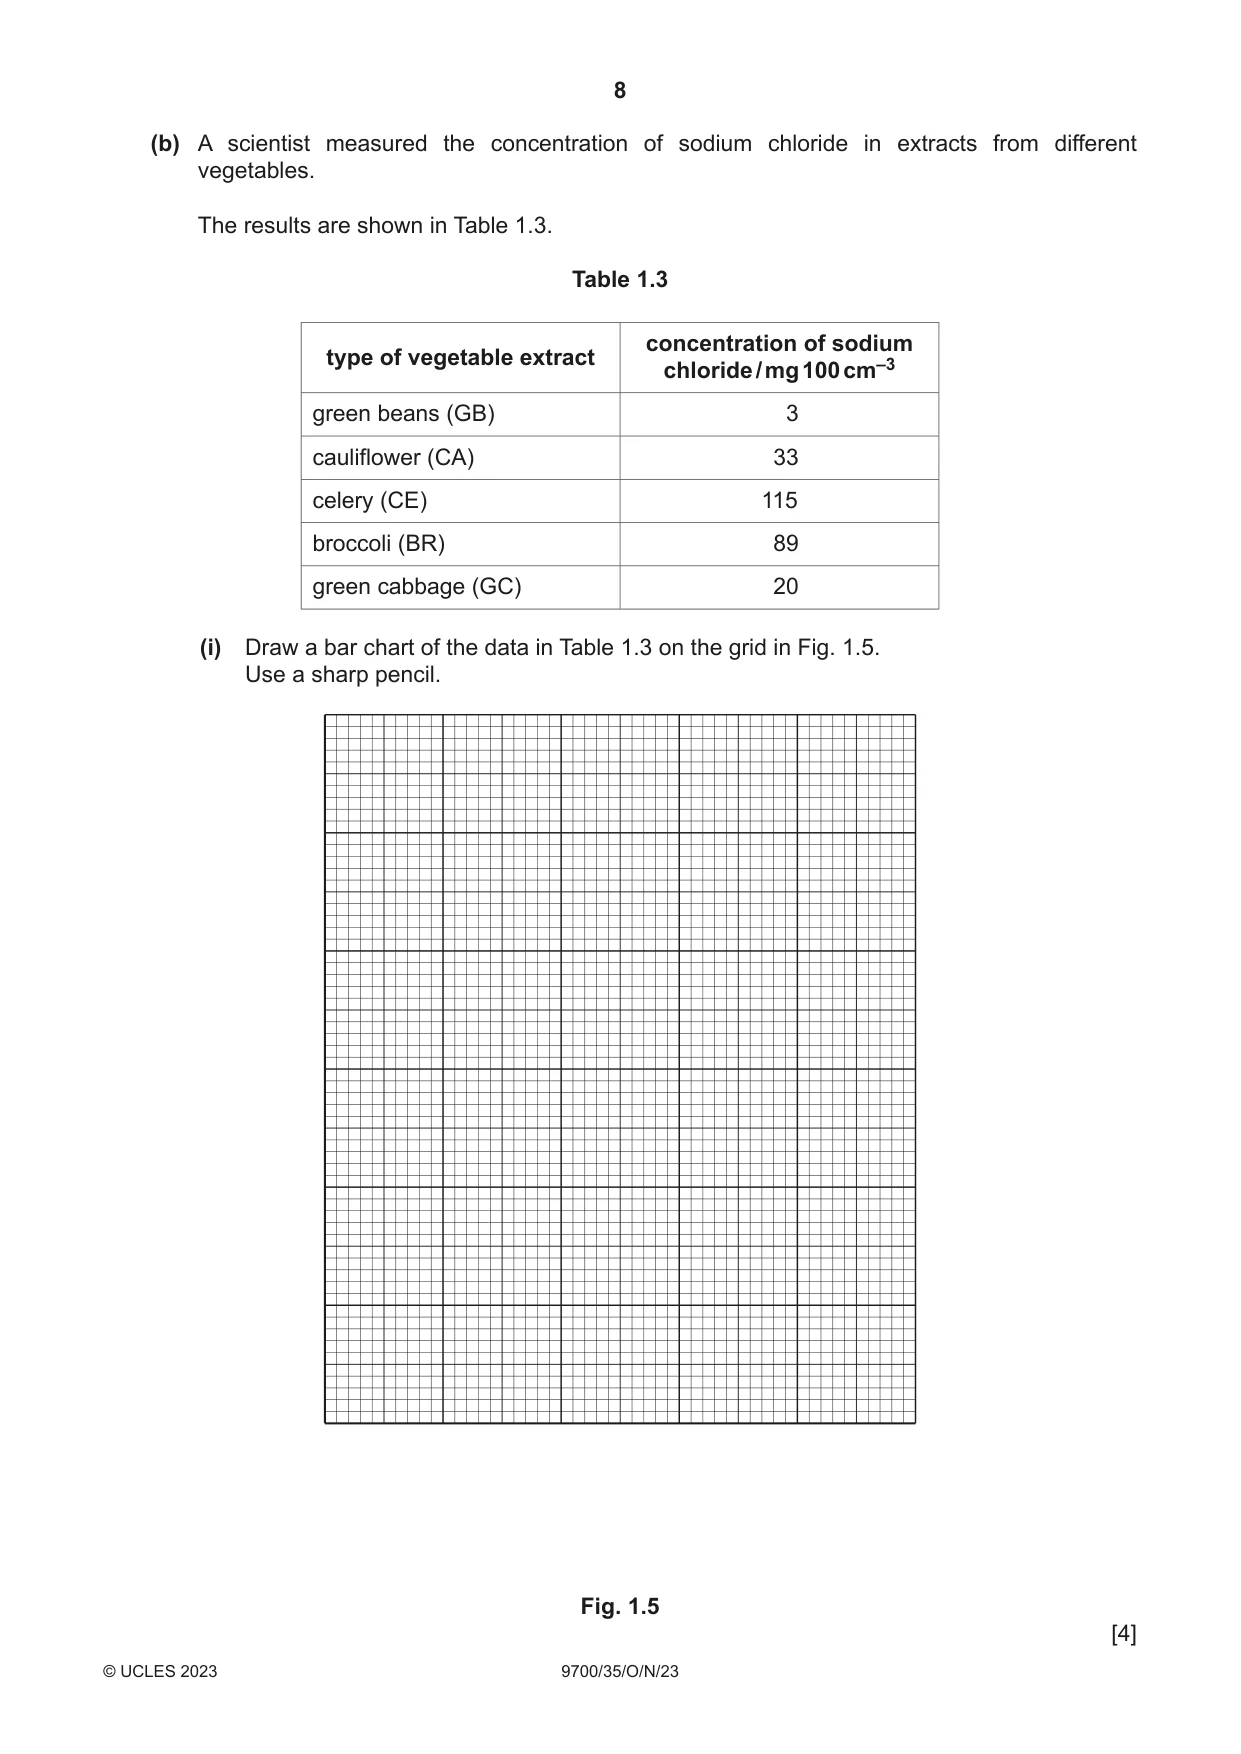
1 When potato cells are placed into different concentrations of sodium chloride solution, water moves between the sodium chloride solution and the potato cells. You will investigate the effect of different concentrations of sodium chloride solution on potato tissue. You will need to: • prepare different concentrations of sodium chloride solution, S • put potato tissue into the different concentrations of sodium chloride solution • record the angle the potato tissue bends • use your results to estimate the concentrations of unknown concentrations of sodium chloride solutions, U1 and U2. You are provided with the materials shown in Table 1.1. Table 1.1 labelled contents hazard volume / cm3 P 7 pieces of potato tissue none – S 10.0% sodium chloride solution none 200 unknown concentration of sodium U1 none 50 chloride solution unknown concentration of sodium U2 none 50 chloride solution W distilled water none 200 It is recommended that you wear suitable eye protection. (a) You will need to use proportional dilution to make five different concentrations of sodium chloride solution, S. You will need to prepare 50 cm3 of each concentration, using S and W. Table 1.2 shows two of the concentrations you will use. Decide which three other concentrations of sodium chloride solution you will use. (i) Complete Table 1.2 to show how you will prepare the other concentrations. Table 1.2 percentage concentration volume of S volume of W of sodium chloride / cm3 / cm3 10 50 0 0 0 50 [2] Carry out step 1 to step 16. step 1 Label five beakers with the percentage concentrations of sodium chloride solution stated in Table 1.2. step 2 Prepare the concentrations of sodium chloride solution, stated in Table 1.2, in the beakers labelled in step 1. step 3 Put a piece of potato tissue into each of the beakers you labelled in step 1, as shown in Fig. 1.1. step 4 Put a piece of potato tissue into each of the beakers labelled U1 and U2, as shown in Fig. 1.1. step 5 Start timing. step 6 Leave the pieces of potato tissue in the sodium chloride solutions for 20 minutes. While you are waiting, use your time to continue with other parts of Question 1. beaker sodium chloride solution piece of covers the piece of potato tissue potato tissue Fig. 1.1 You are provided with two sheets of A4 paper, each showing four protractors. Do not cut these into separate protractors. Do not remove them from the plastic covering. You will use the protractors to measure the angle the pieces of potato tissue bend after being left for 20 minutes in the sodium chloride solutions. step 7 After 20 minutes (step 6) remove the piece of potato tissue from the 10.0% sodium chloride solution and put it onto a paper towel to remove the excess liquid. step 8 Put the piece of potato tissue on the vertical line of a protractor, as shown in Fig. 1.2. piece of potato protractor with 10° 0° 10° 20° 20° scale for measuring 30° 30° angle of bend 40° 40° in degrees 50° 50° 5 cm 60° 60° 70° 70° 80° 80° 90° 90° Fig. 1.2 step 9 Put your finger on the bottom of the potato tissue and press firmly, as shown in Fig. 1.3. Hold the potato tissue firmly in this position. move this end of the piece 10° 0° 10° of potato in the direction 20° 20° 30° shown by the arrow 30° 40° 40° 50° 50° 5 cm 60° 60° 70° 70° 80° 80° hold piece of potato firmly at this end 90° 90° Fig. 1.3 step 10 Move the top of the potato tissue, as shown in Fig. 1.3, until there is strong resistance. step 11 Mark the position of the top of the potato tissue on the protractor, as shown in Fig. 1.4. record this angle of bend (step 13 and step 14) 10° 0° 10° 20° 20° put a mark here (step 11) 30° 30° 40° 40° 50° 50° 5 cm 60° 60° 70° 70° 80° 80° hold piece of potato firmly at this end 90° 90° Fig. 1.4 step 12 Remove the potato tissue and put it in the container labelled For waste. step 13 Measure the angle between the mark and the vertical line on the protractor, as shown in Fig. 1.4. step 14 Record your result in (a)(ii). step 15 Repeat step 7 to step 14 using the potato tissue from the other concentrations of sodium chloride solution prepared in step 2. step 16 Repeat step 7 to step 13 using the potato tissue from U1 and U2. Record your result for U1 and for U2 in (a)(iv). (ii) Record your results in an appropriate table. [4] (iii) State the independent variable. ..................................................................................................................................... [1] (iv) State the result for U1 and U2. result for U1 ............................................................... result for U2 ............................................................... [1] (v) Use your results in (a)(ii) to estimate the concentration of sodium chloride in U1 and U2. estimate of U1 = ........................................................... % estimate of U2 = ........................................................... % [2] (vi) Explain, in terms of water potential, the difference between the result for U1 and the result for U2. ........................................................................................................................................... ........................................................................................................................................... ........................................................................................................................................... ........................................................................................................................................... ..................................................................................................................................... [3] (vii) Suggest how you could make improvements to the procedure so that a more accurate estimate of the concentration of sodium chloride in U1 and U2 could be obtained. ........................................................................................................................................... ........................................................................................................................................... ........................................................................................................................................... ........................................................................................................................................... ........................................................................................................................................... ........................................................................................................................................... ........................................................................................................................................... ........................................................................................................................................... ..................................................................................................................................... [3] (b) A scientist measured the concentration of sodium chloride in extracts from different vegetables. The results are shown in Table 1.3. Table 1.3 concentration of sodium type of vegetable extract chloride / mg 100 cm–3 green beans (GB) 3 cauliflower (CA) 33 celery (CE) 115 broccoli (BR) 89 green cabbage (GC) 20 (i) Draw a bar chart of the data in Table 1.3 on the grid in Fig. 1.5. Use a sharp pencil. Fig. 1.5 [4] (ii) The scientist then placed pieces of plant tissue from each of the vegetables in Table 1.3 into 100 mg 100 cm–3 sodium chloride solution. The dimensions of the pieces of plant tissue were standardised. The plant tissues were left in the solution for 1 hour. The scientist then observed the cells in these tissues using a microscope. The scientist noted that, in many of the plant tissues, there were many plasmolysed cells. For one tissue there were no plasmolysed cells on the slide. Using this information and Table 1.3, suggest which vegetable resulted in no plasmolysed cells. .......................................................... [1] [Total: 21]
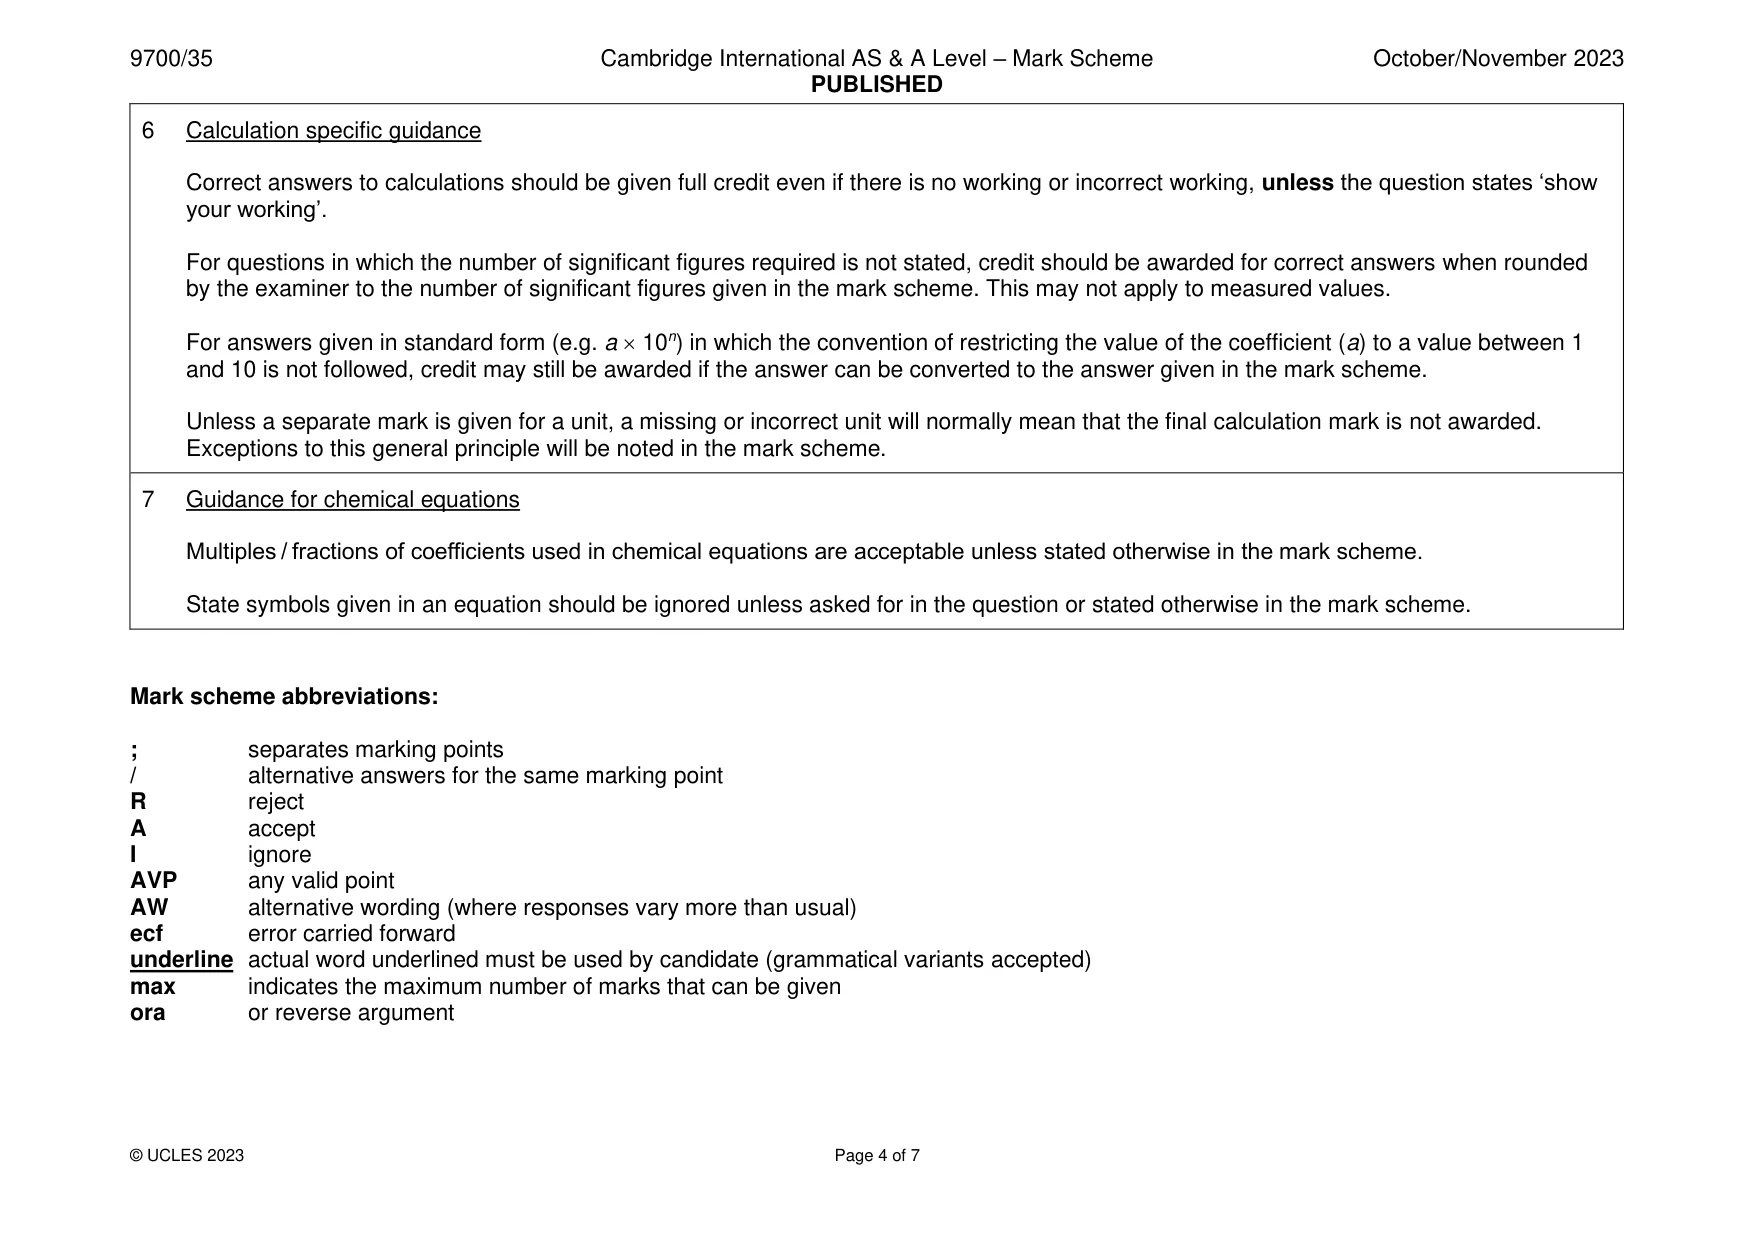
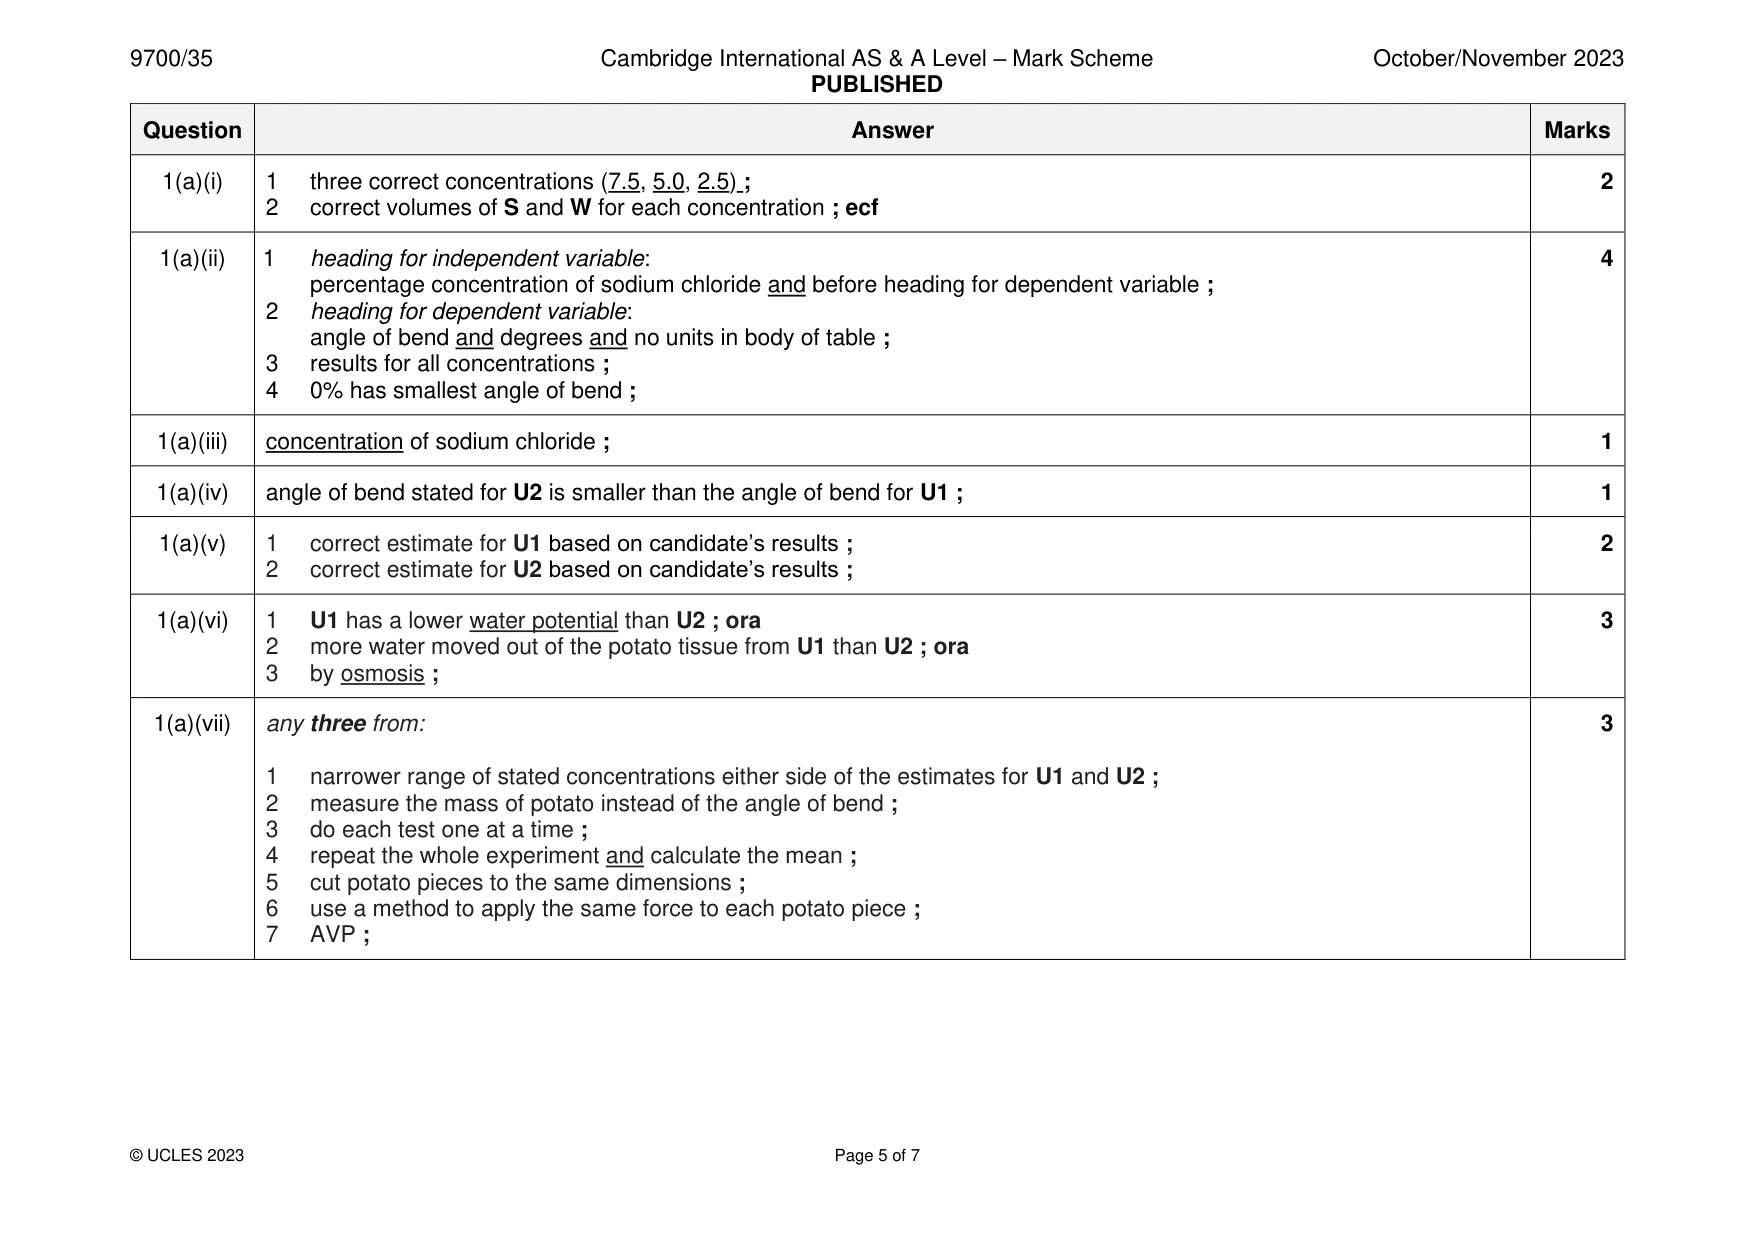
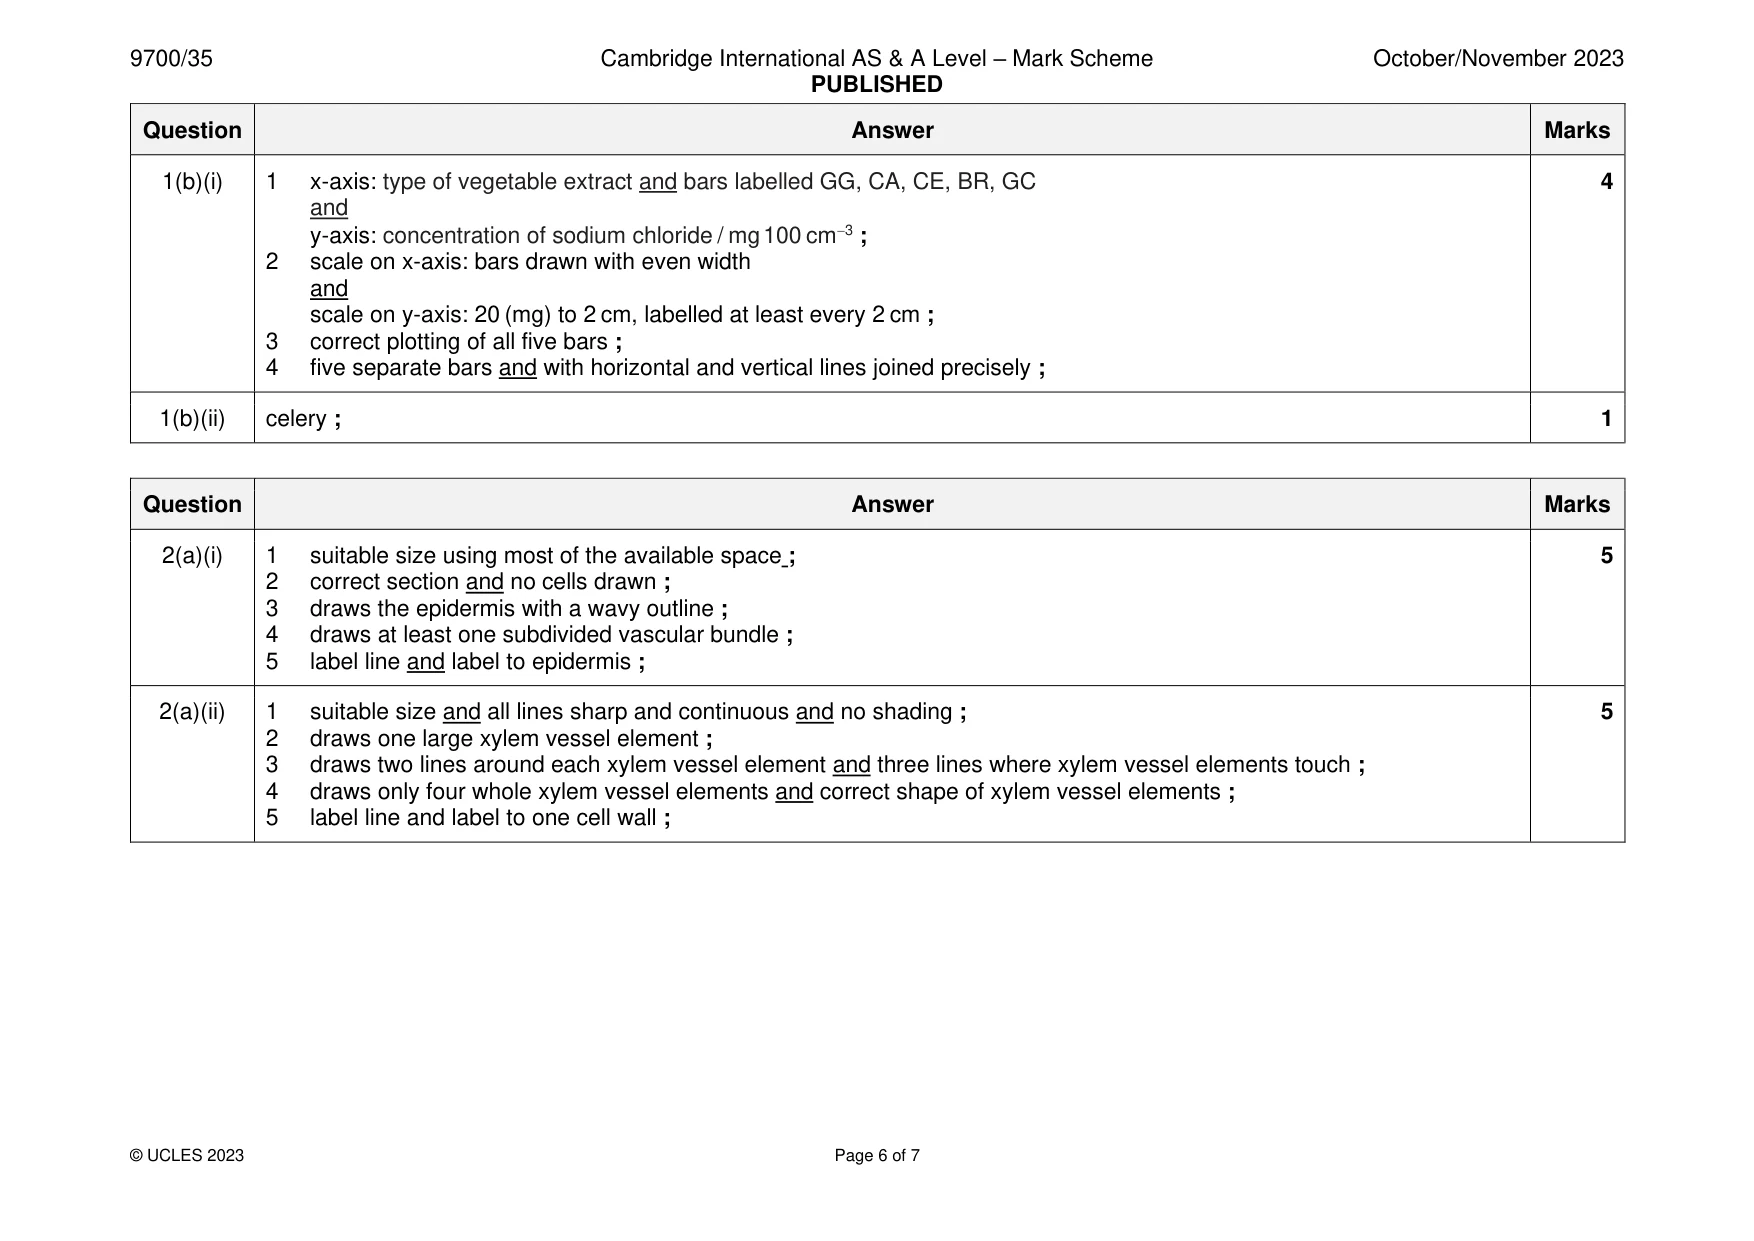
Mark scheme: Question Answer Marks 1(a)(i) 1 three correct concentrations (7.5, 5.0, 2.5) ; 2 2 correct volumes of S and W for each concentration ; ecf 1(a)(ii) 1 heading for independent variable: 4 percentage concentration of sodium chloride and before heading for dependent variable ; 2 heading for dependent variable: angle of bend and degrees and no units in body of table ; 3 results for all concentrations ; 4 0% has smallest angle of bend ; 1(a)(iii) concentration of sodium chloride ; 1 1(a)(iv) angle of bend stated for U2 is smaller than the angle of bend for U1 ; 1 1(a)(v) 1 correct estimate for U1 based on candidate’s results ; 2 2 correct estimate for U2 based on candidate’s results ; 1(a)(vi) 1 U1 has a lower water potential than U2 ; ora 3 2 more water moved out of the potato tissue from U1 than U2 ; ora 3 by osmosis ; 1(a)(vii) any three from: 3 1 narrower range of stated concentrations either side of the estimates for U1 and U2 ; 2 measure the mass of potato instead of the angle of bend ; 3 do each test one at a time ; 4 repeat the whole experiment and calculate the mean ; 5 cut potato pieces to the same dimensions ; 6 use a method to apply the same force to each potato piece ; 7 AVP ; 1(b)(i) 1 x-axis: type of vegetable extract and bars labelled GG, CA, CE, BR, GC 4 and y-axis: concentration of sodium chloride / mg 100 cm−3 ; 2 scale on x-axis: bars drawn with even width and scale on y-axis: 20 (mg) to 2 cm, labelled at least every 2 cm ; 3 correct plotting of all five bars ; 4 five separate bars and with horizontal and vertical lines joined precisely ; 1(b)(ii) celery ; 1
Q2 · L1 is a slide of a stained transverse section through a plant stem
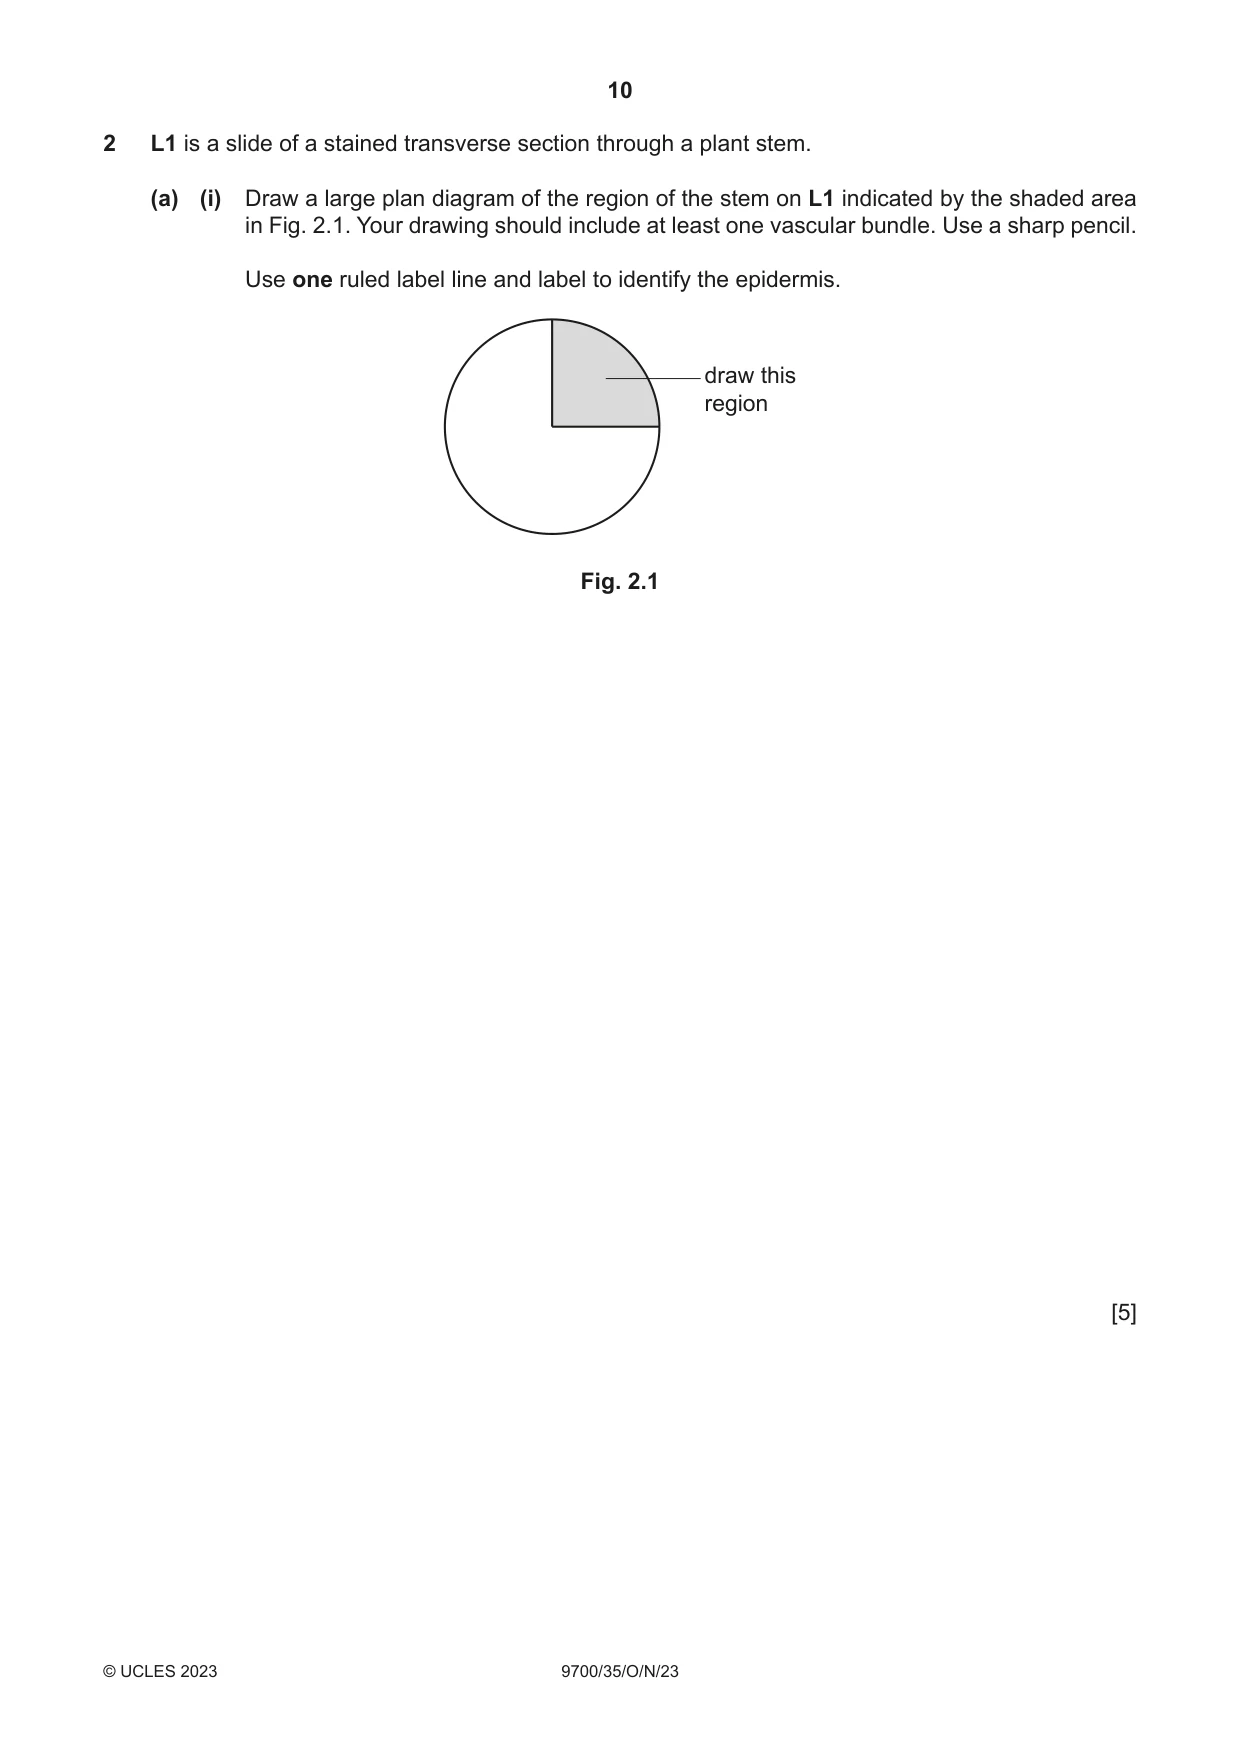
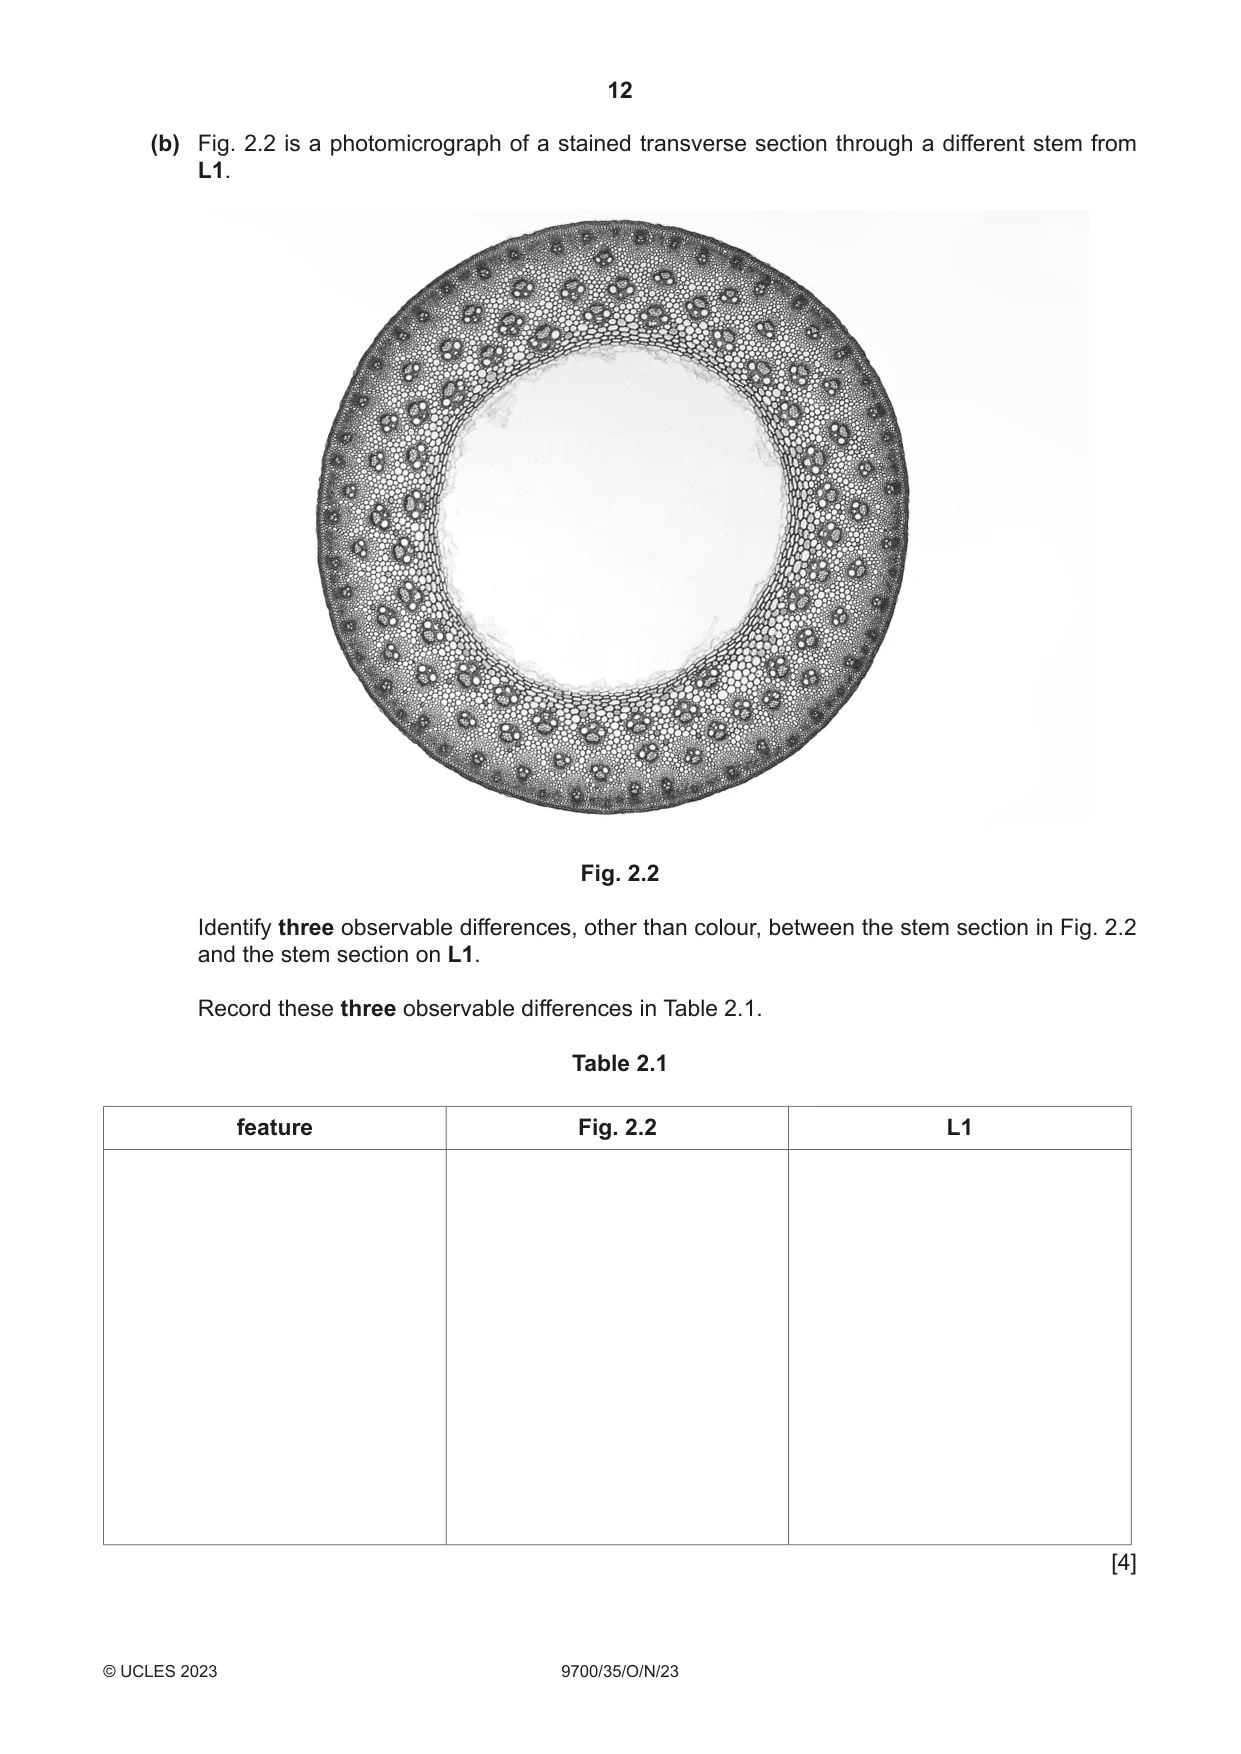
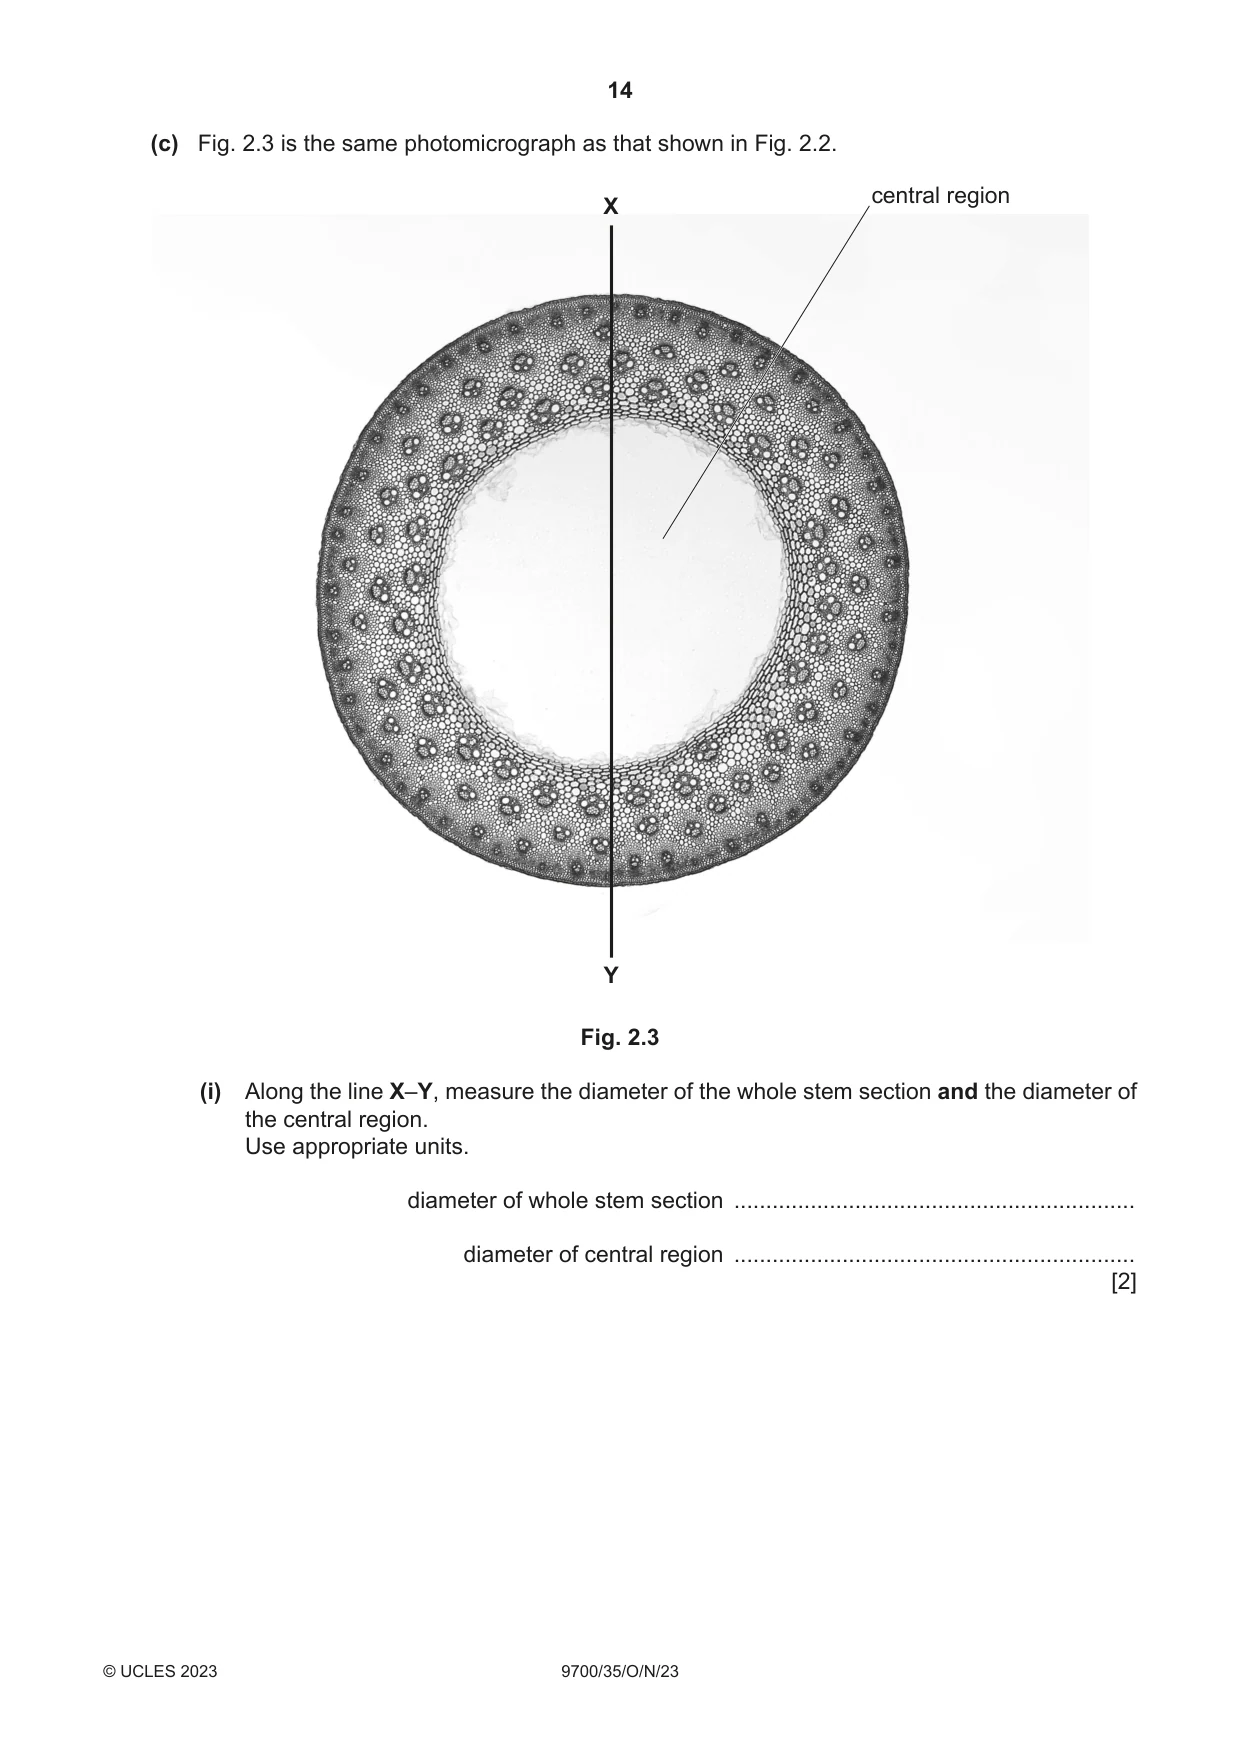
2 L1 is a slide of a stained transverse section through a plant stem. (a) (i) Draw a large plan diagram of the region of the stem on L1 indicated by the shaded area in Fig. 2.1. Your drawing should include at least one vascular bundle. Use a sharp pencil. Use one ruled label line and label to identify the epidermis. draw this region Fig. 2.1 [5] (ii) Observe the vascular tissue on the section of the stem on L1. Select one large xylem vessel element and a group of three adjacent, smaller xylem vessel elements. • Make a large drawing of this group of four xylem vessel elements. • Use one ruled label line and label to identify the cell wall. [5] (b) Fig. 2.2 is a photomicrograph of a stained transverse section through a different stem from L1. Fig. 2.2 Identify three observable differences, other than colour, between the stem section in Fig. 2.2 and the stem section on L1. Record these three observable differences in Table 2.1. Table 2.1 feature Fig. 2.2 L1 [4]
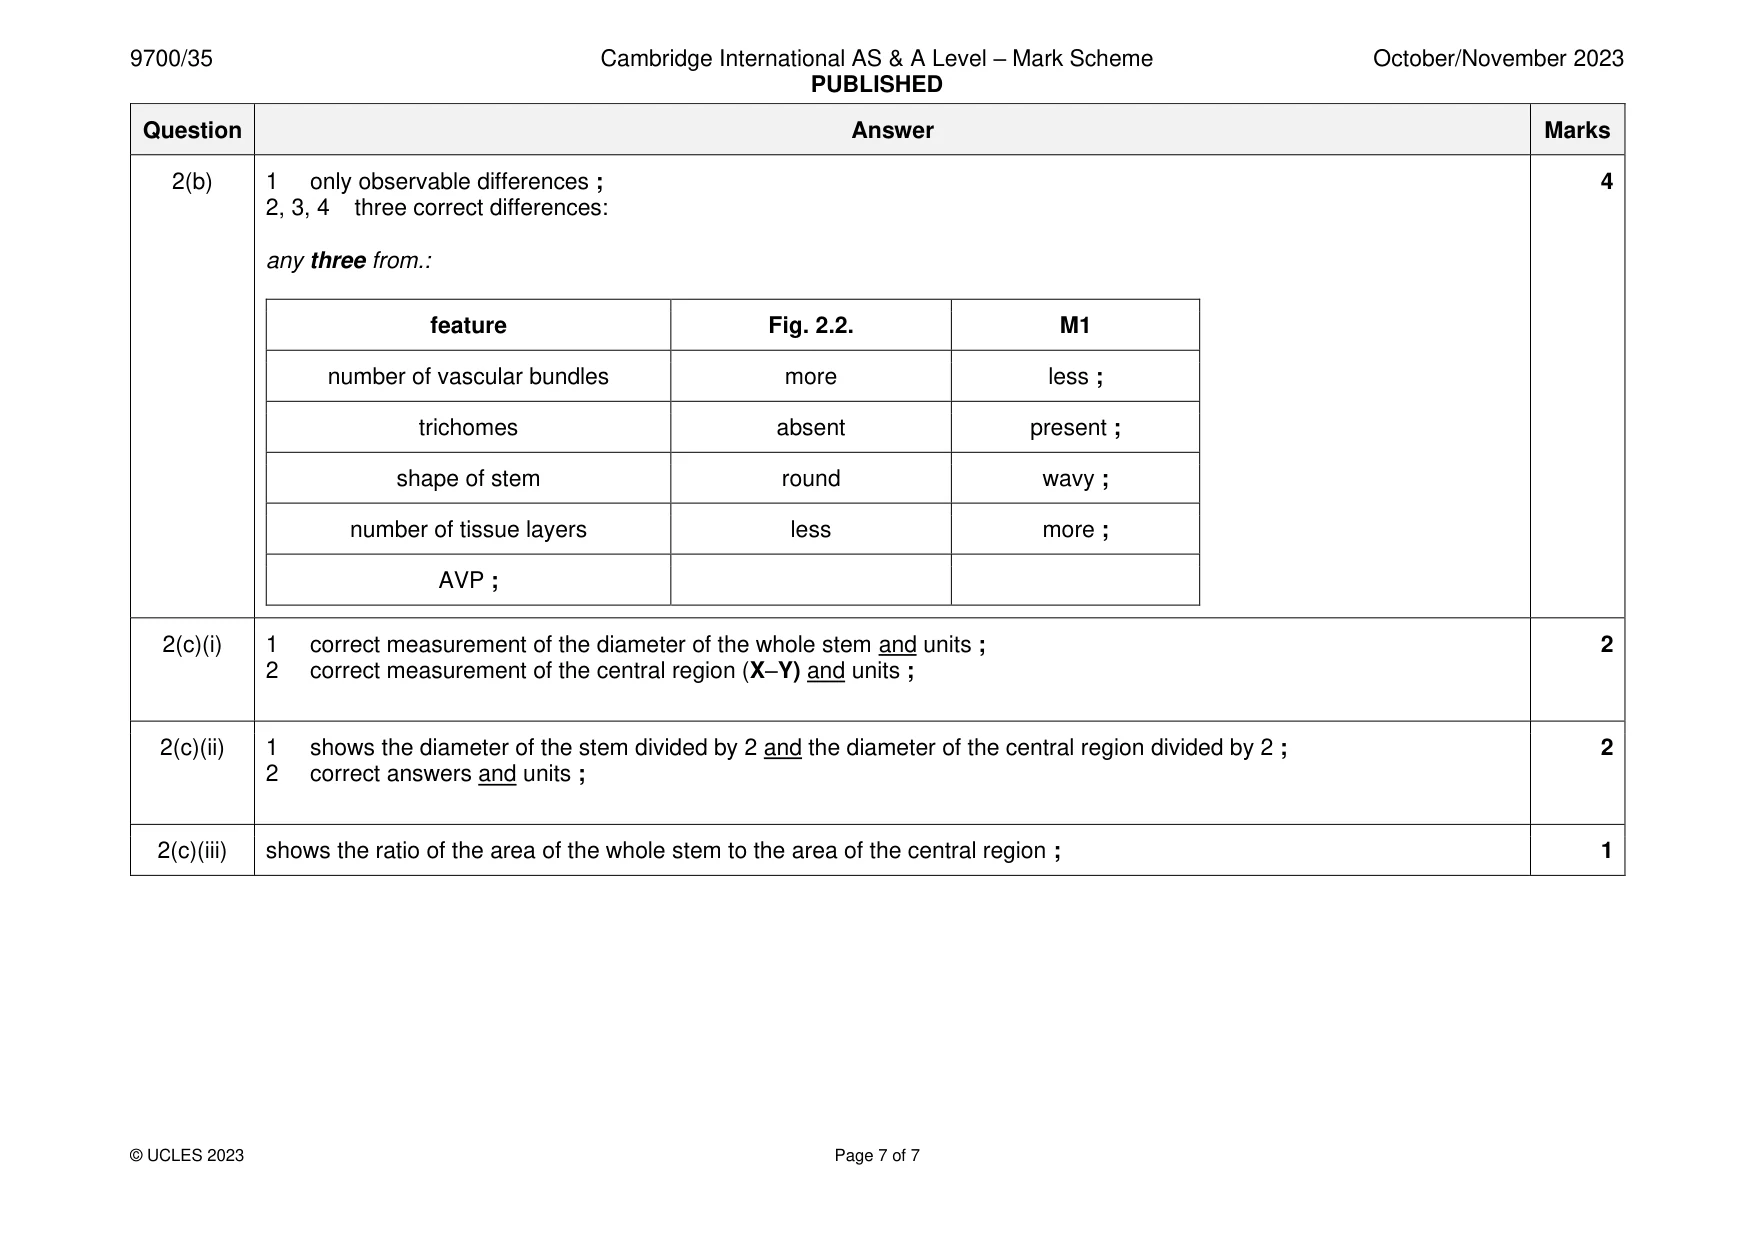
Mark scheme: 2(a)(i) 1 suitable size using most of the available space ; 5 2 correct section and no cells drawn ; 3 draws the epidermis with a wavy outline ; 4 draws at least one subdivided vascular bundle ; 5 label line and label to epidermis ; 2(a)(ii) 1 suitable size and all lines sharp and continuous and no shading ; 5 2 draws one large xylem vessel element ; 3 draws two lines around each xylem vessel element and three lines where xylem vessel elements touch ; 4 draws only four whole xylem vessel elements and correct shape of xylem vessel elements ; 5 label line and label to one cell wall ; 2(b) 1 only observable differences ; 4 2, 3, 4 three correct differences: any three from.: feature Fig. 2.2. M1 number of vascular bundles more less ; trichomes absent present ; shape of stem round wavy ; number of tissue layers less more ; AVP ; 2(c)(i) 1 correct measurement of the diameter of the whole stem and units ; 2 2 correct measurement of the central region (X–Y) and units ; 2(c)(ii) 1 shows the diameter of the stem divided by 2 and the diameter of the central region divided by 2 ; 2 2 correct answers and units ; 2(c)(iii) shows the ratio of the area of the whole stem to the area of the central region ; 1
What was in this paper
The subtopics covered by these 2 questions, and how many questions each got. Open one in a new tab to see every Cambridge question on it.
What you needed in this session
Cambridge’s own grade thresholds for 2023 Oct/Nov, Paper 3 · Variant 5. A higher threshold means an easier paper — the bar moves with how the cohort did.