Cambridge A Level Biology 9700 — 2023 Oct/Nov Paper 3 · Variant 3
9700/33/O/N/23 · 2 questions · 40 marks · ≈45 min
The question paper and its mark scheme, free to read here and free to download. This is Cambridge’s own paper, exactly as it was sat.
Question paper16 pages



Mark scheme7 pages
Answers below. Sit the paper first if you are practising.
Questions as text
Q1 · Yeast cells contain enzymes that hydrolyse sucrose into reducing sugars, as shown in Fig
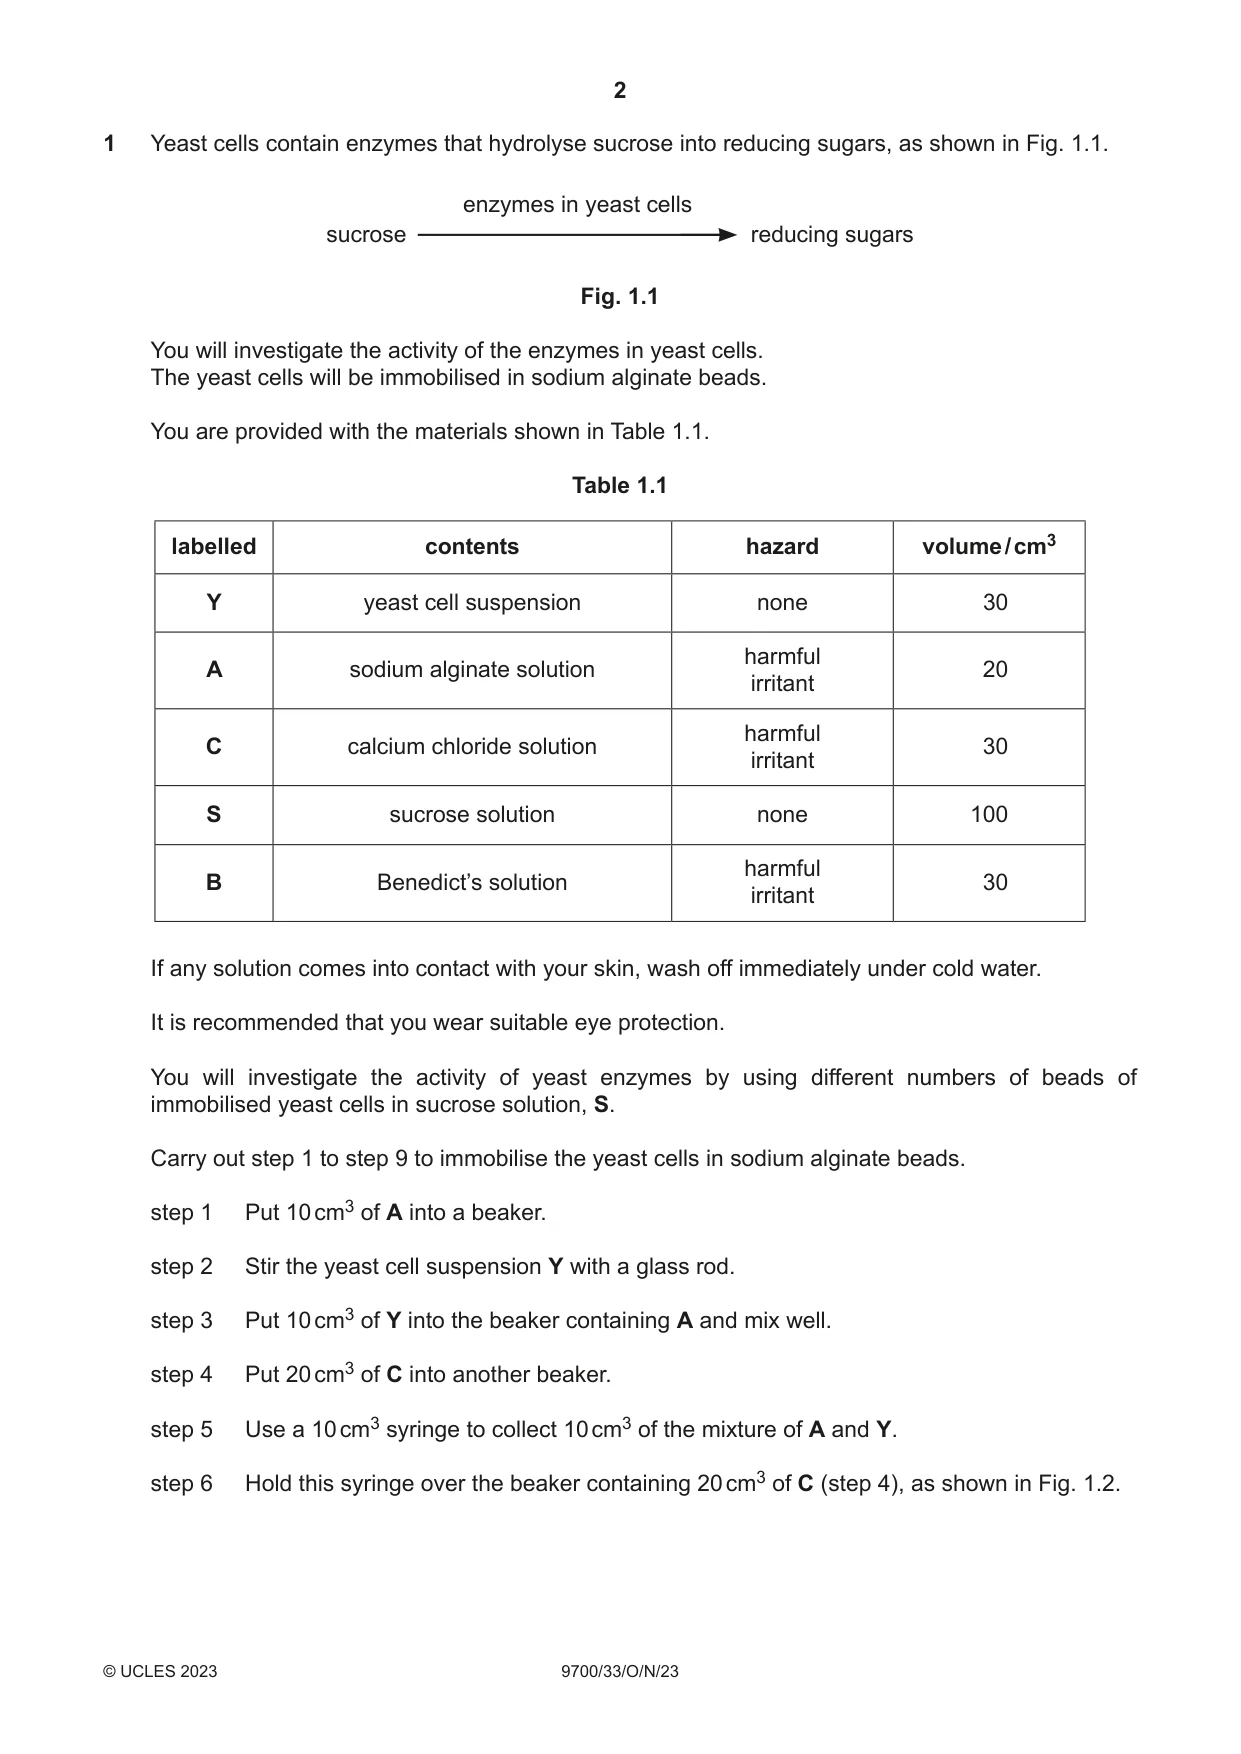
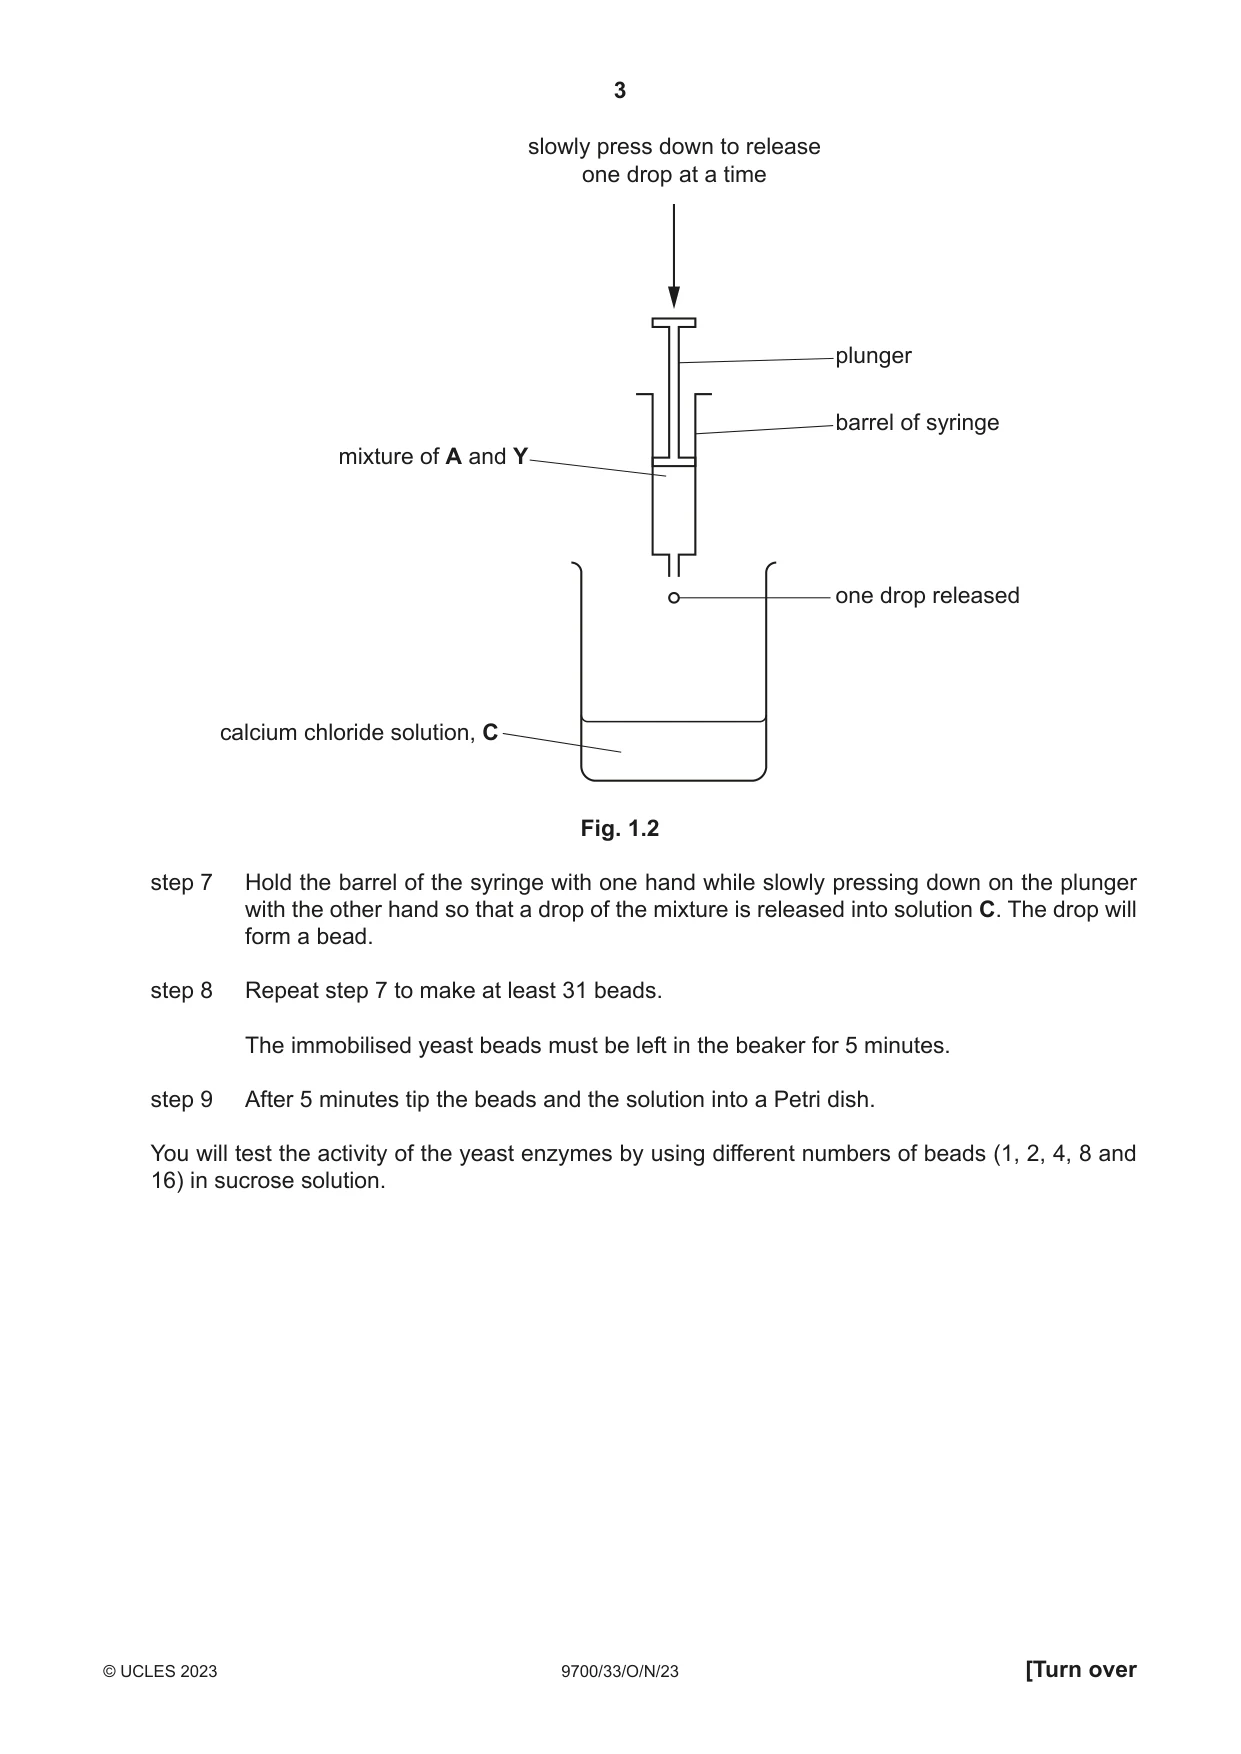
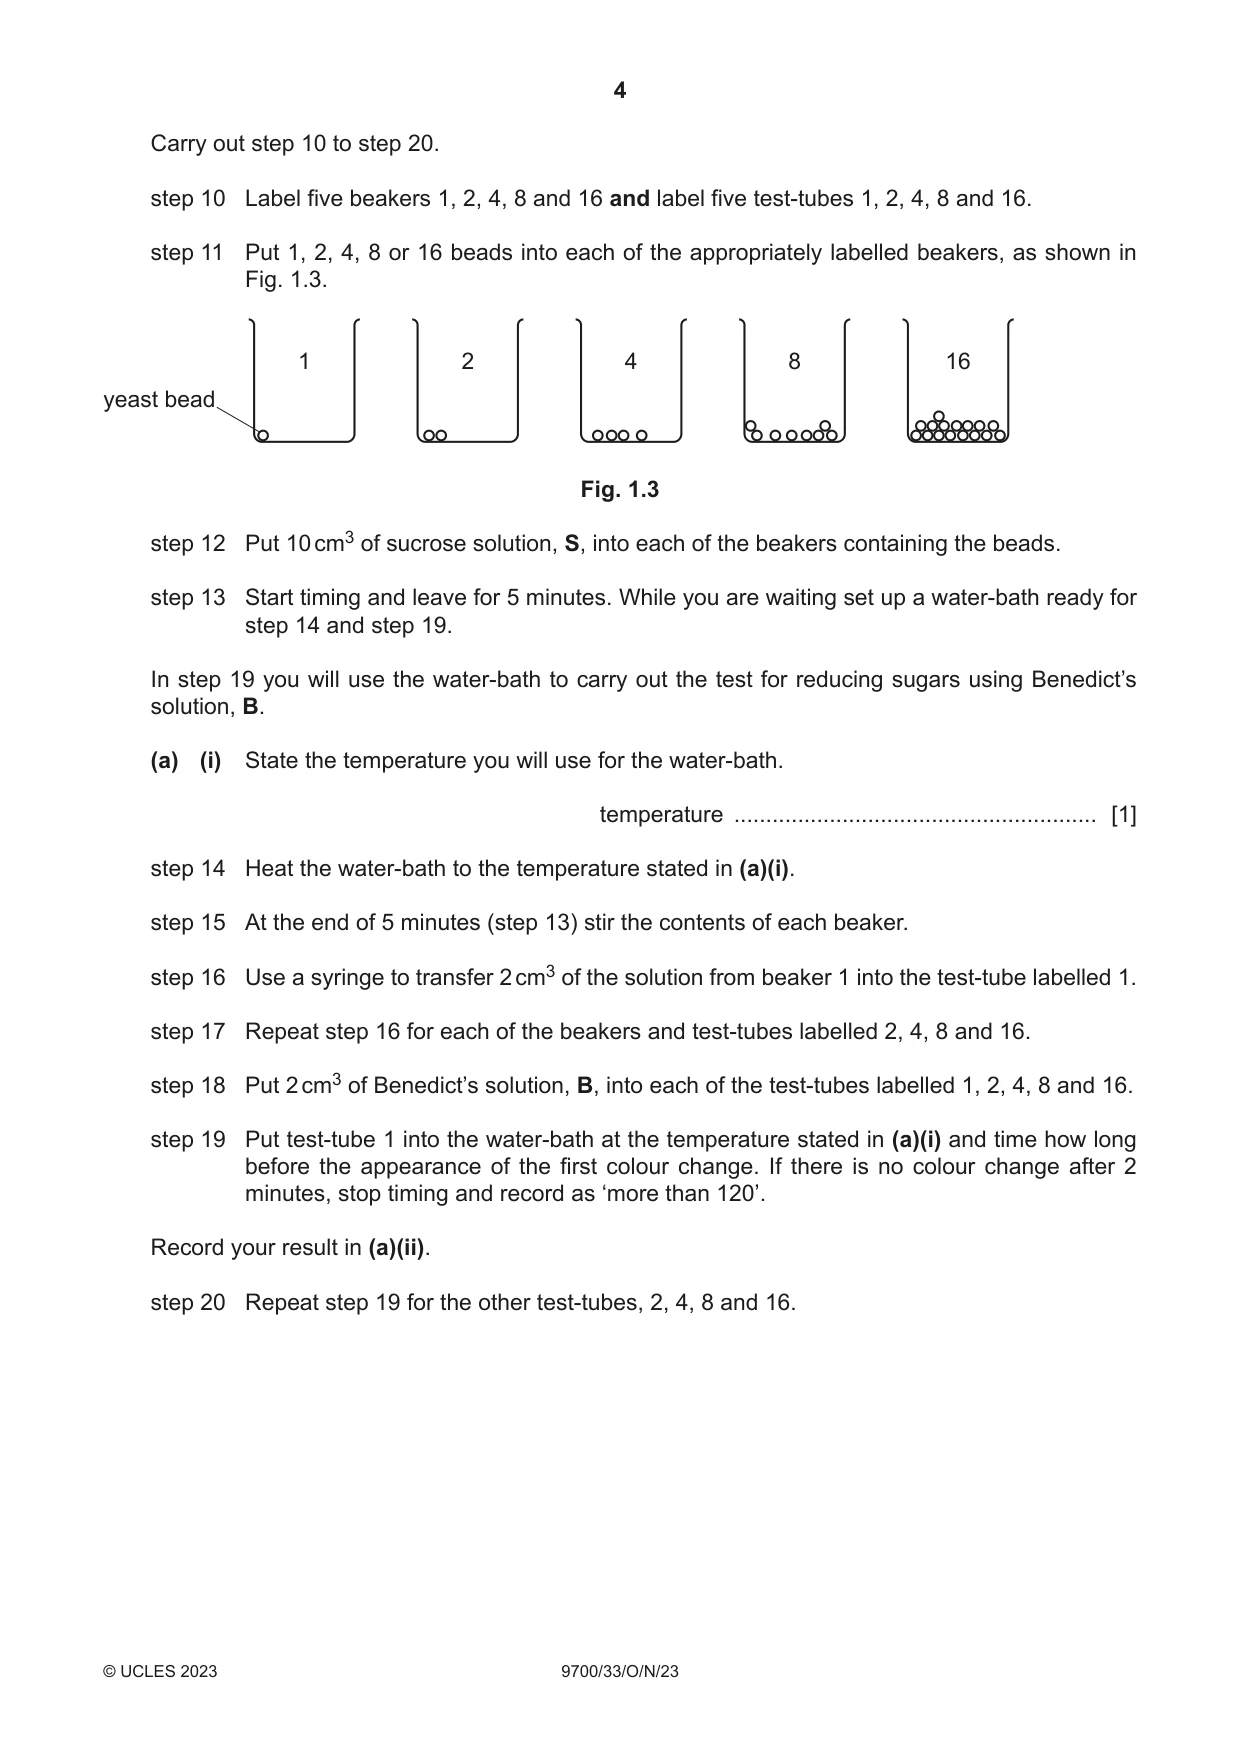
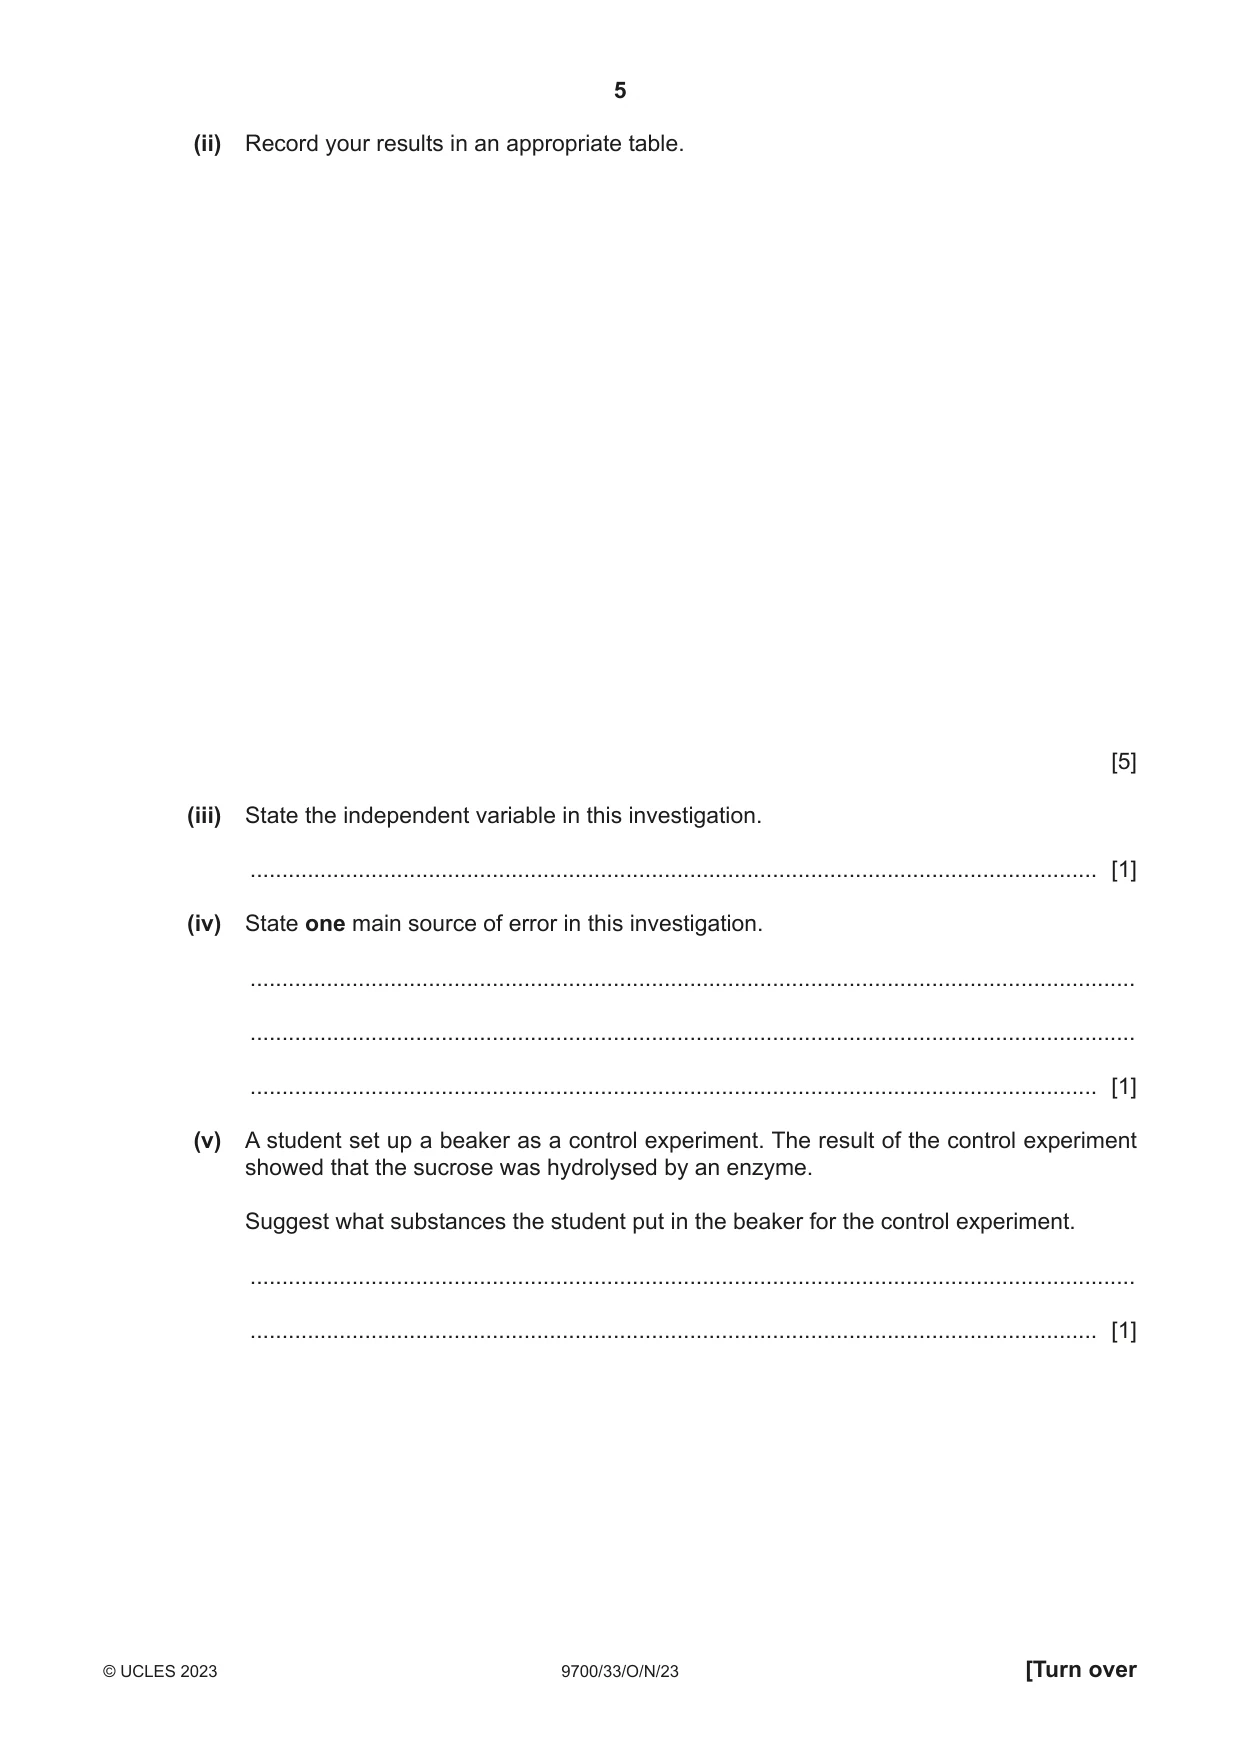
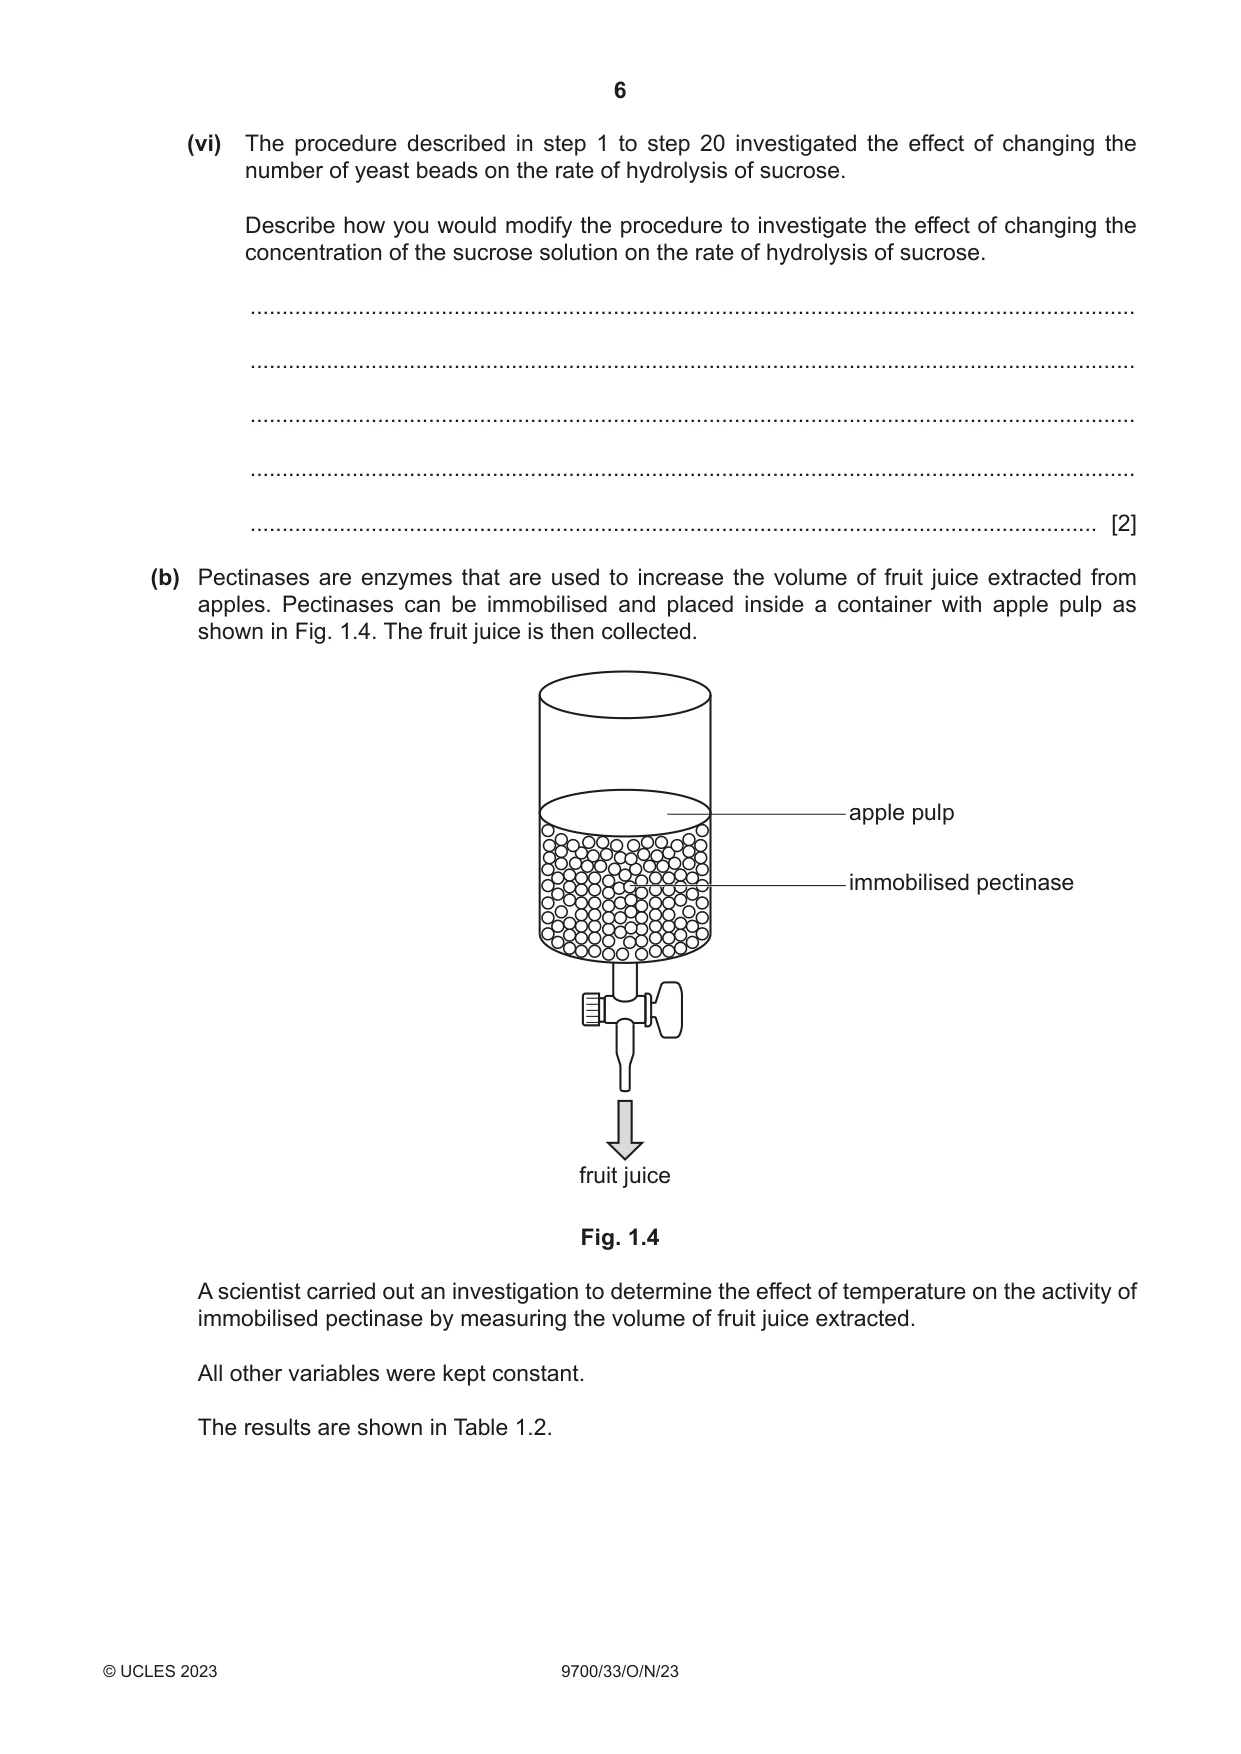
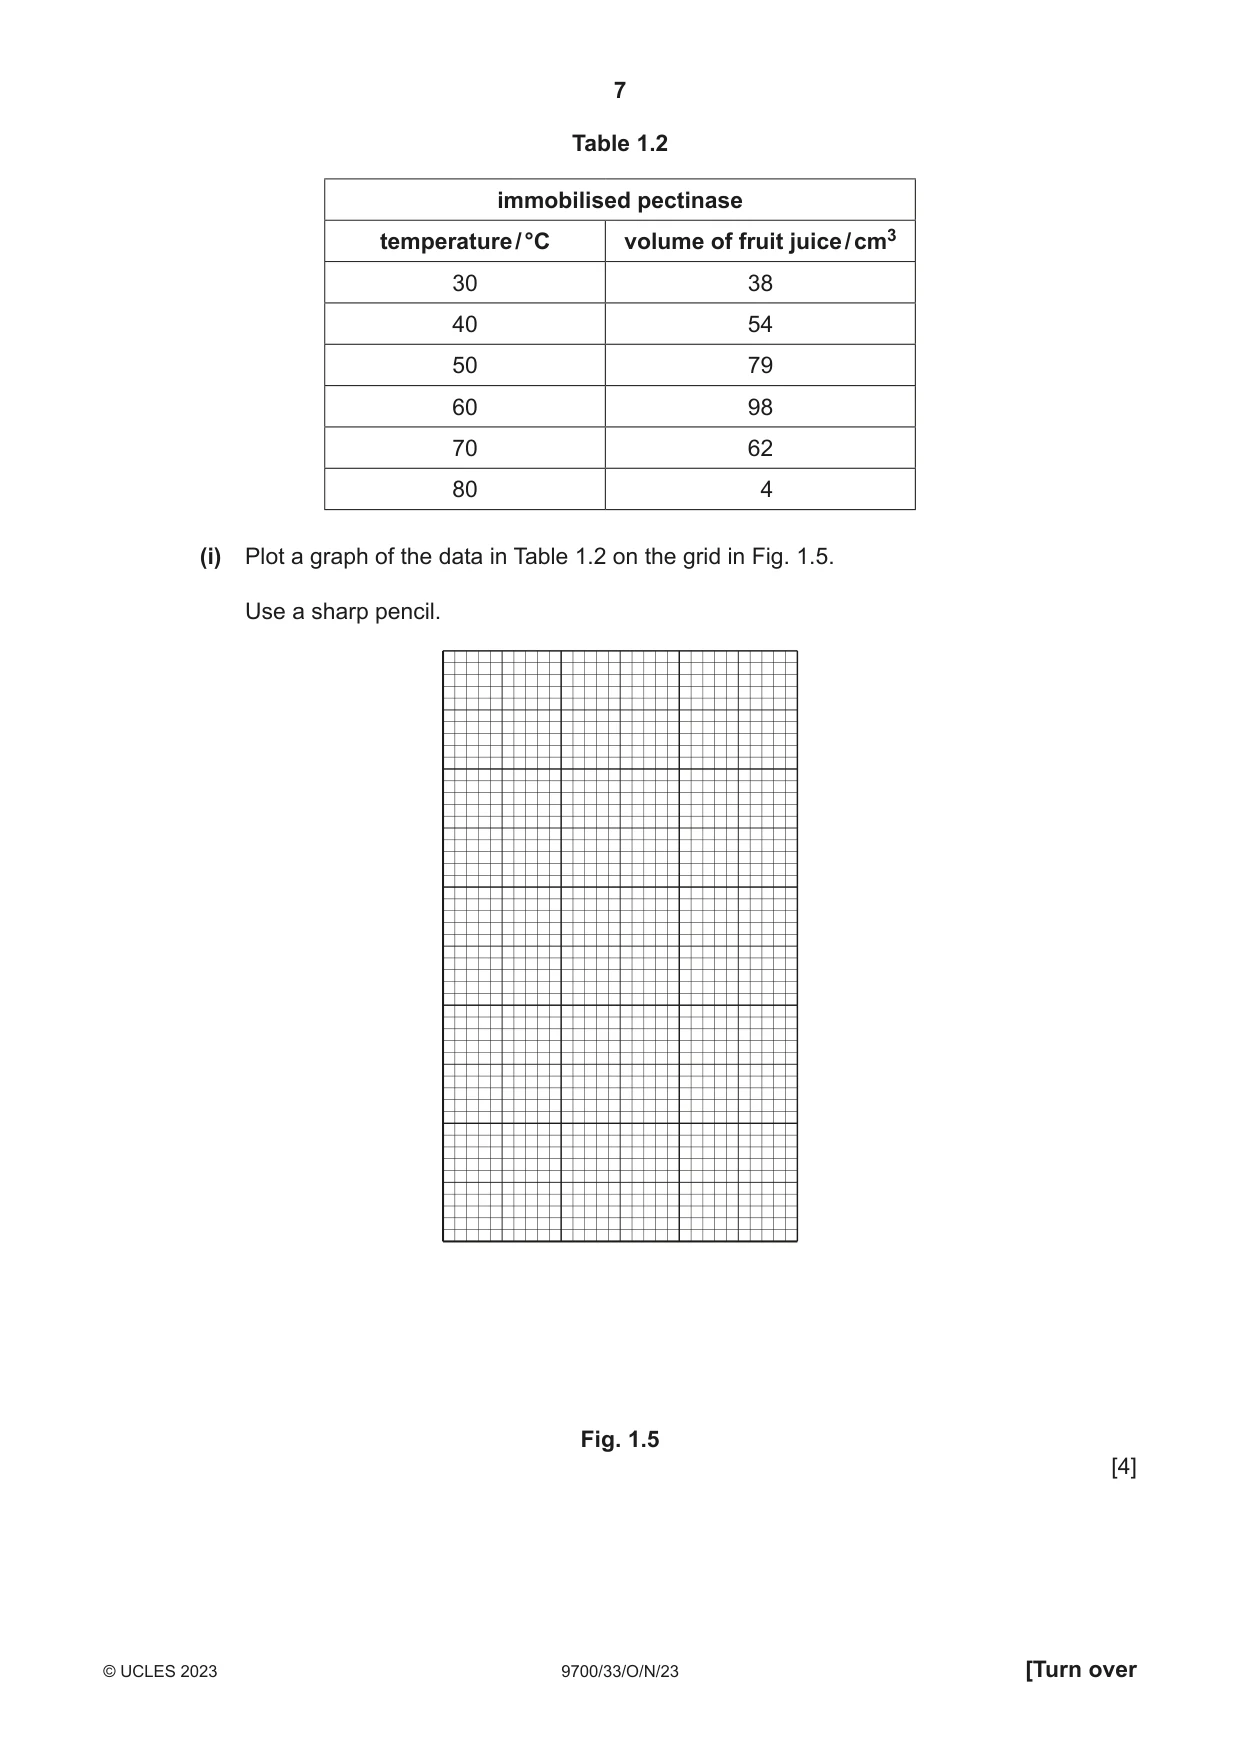
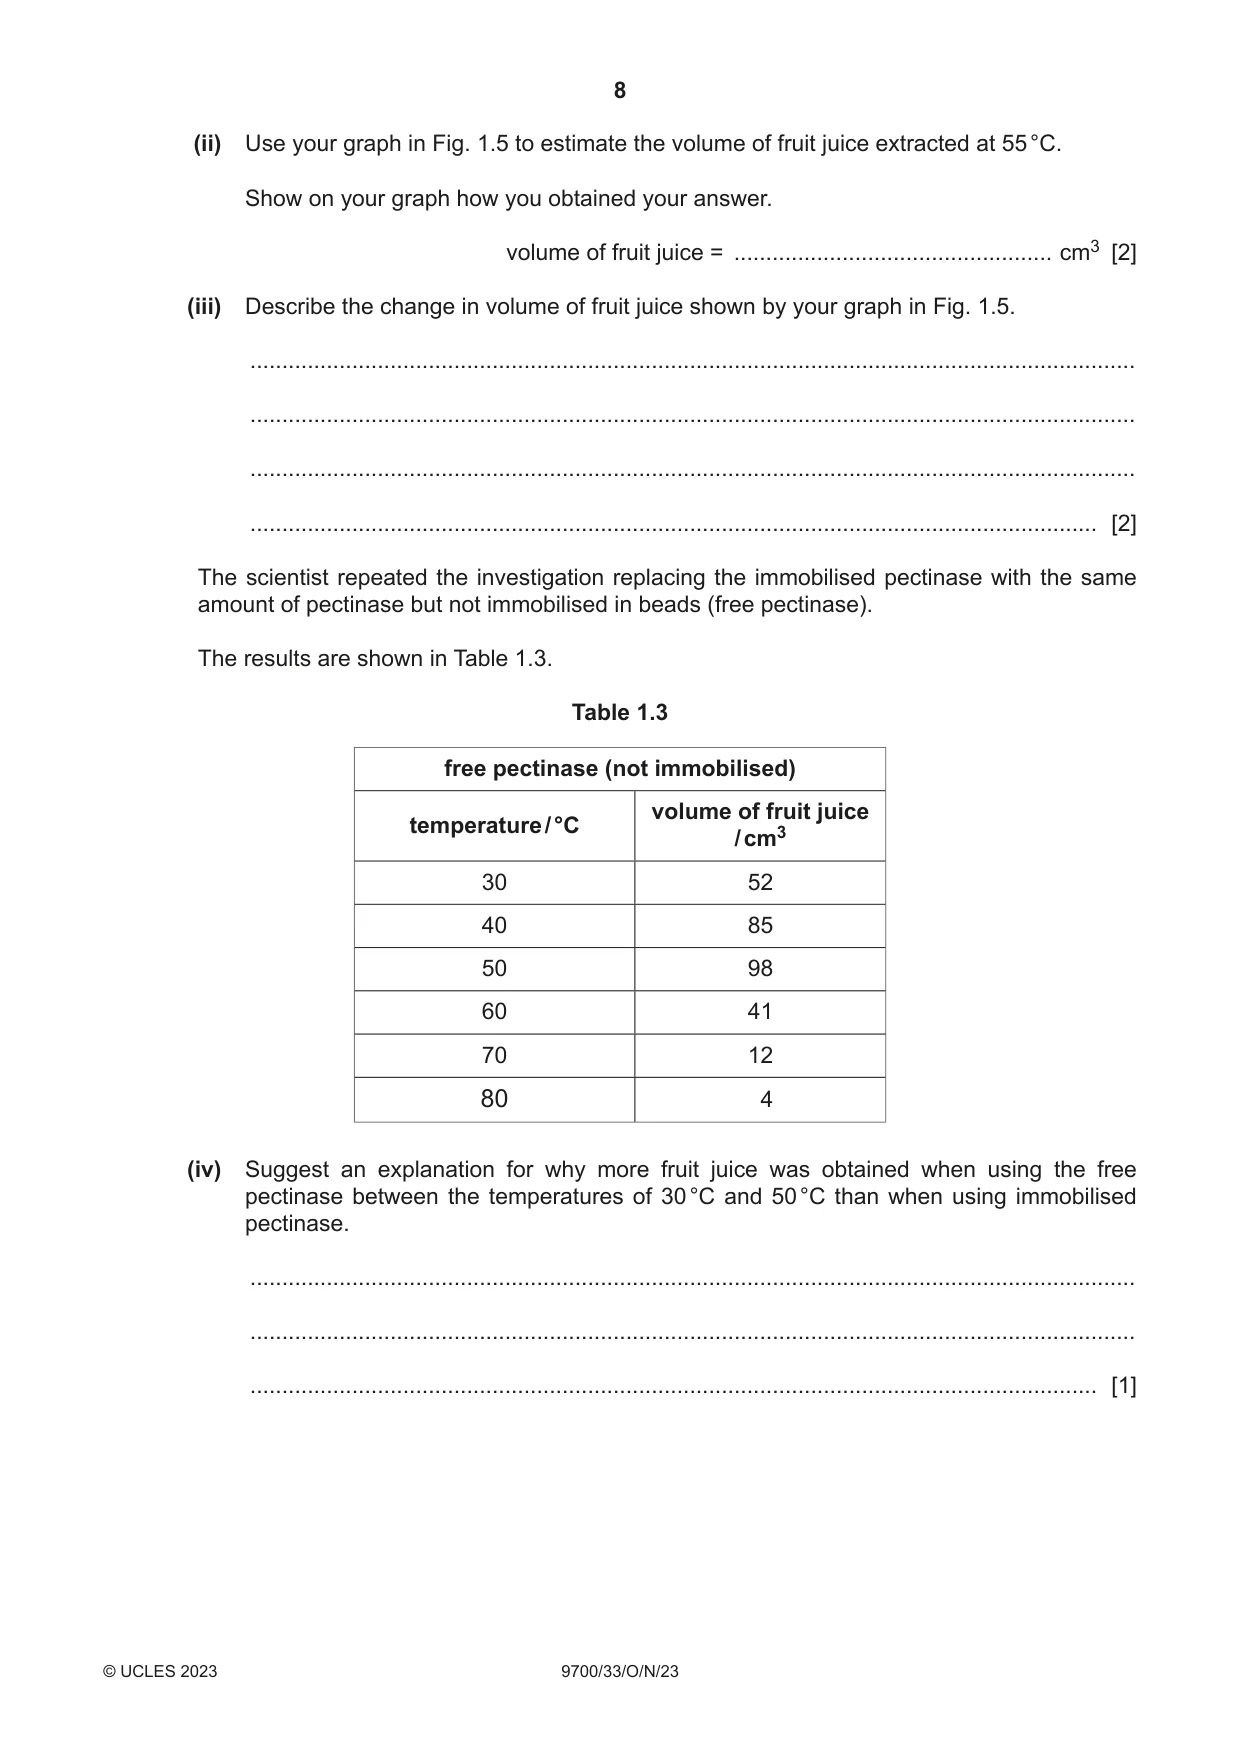
1 Yeast cells contain enzymes that hydrolyse sucrose into reducing sugars, as shown in Fig. 1.1. enzymes in yeast cells sucrose reducing sugars Fig. 1.1 You will investigate the activity of the enzymes in yeast cells. The yeast cells will be immobilised in sodium alginate beads. You are provided with the materials shown in Table 1.1. Table 1.1 labelled contents hazard volume / cm3 Y yeast cell suspension none 30 harmful A sodium alginate solution 20 irritant harmful C calcium chloride solution 30 irritant S sucrose solution none 100 harmful B Benedict’s solution 30 irritant If any solution comes into contact with your skin, wash off immediately under cold water. It is recommended that you wear suitable eye protection. You will investigate the activity of yeast enzymes by using different numbers of beads of immobilised yeast cells in sucrose solution, S. Carry out step 1 to step 9 to immobilise the yeast cells in sodium alginate beads. step 1 Put 10 cm3 of A into a beaker. step 2 Stir the yeast cell suspension Y with a glass rod. step 3 Put 10 cm3 of Y into the beaker containing A and mix well. step 4 Put 20 cm3 of C into another beaker. step 5 Use a 10 cm3 syringe to collect 10 cm3 of the mixture of A and Y. step 6 Hold this syringe over the beaker containing 20 cm3 of C (step 4), as shown in Fig. 1.2. slowly press down to release one drop at a time plunger barrel of syringe mixture of A and Y one drop released calcium chloride solution, C Fig. 1.2 step 7 Hold the barrel of the syringe with one hand while slowly pressing down on the plunger with the other hand so that a drop of the mixture is released into solution C. The drop will form a bead. step 8 Repeat step 7 to make at least 31 beads. The immobilised yeast beads must be left in the beaker for 5 minutes. step 9 After 5 minutes tip the beads and the solution into a Petri dish. You will test the activity of the yeast enzymes by using different numbers of beads (1, 2, 4, 8 and 16) in sucrose solution. Carry out step 10 to step 20. step 10 Label five beakers 1, 2, 4, 8 and 16 and label five test-tubes 1, 2, 4, 8 and 16. step 11 Put 1, 2, 4, 8 or 16 beads into each of the appropriately labelled beakers, as shown in Fig. 1.3. 1 2 4 8 16 yeast bead Fig. 1.3 step 12 Put 10 cm3 of sucrose solution, S, into each of the beakers containing the beads. step 13 Start timing and leave for 5 minutes. While you are waiting set up a water-bath ready for step 14 and step 19. In step 19 you will use the water-bath to carry out the test for reducing sugars using Benedict’s solution, B. (a) (i) State the temperature you will use for the water-bath. temperature ......................................................... [1] step 14 Heat the water-bath to the temperature stated in (a)(i). step 15 At the end of 5 minutes (step 13) stir the contents of each beaker. step 16 Use a syringe to transfer 2 cm3 of the solution from beaker 1 into the test-tube labelled 1. step 17 Repeat step 16 for each of the beakers and test-tubes labelled 2, 4, 8 and 16. step 18 Put 2 cm3 of Benedict’s solution, B, into each of the test-tubes labelled 1, 2, 4, 8 and 16. step 19 Put test-tube 1 into the water-bath at the temperature stated in (a)(i) and time how long before the appearance of the first colour change. If there is no colour change after 2 minutes, stop timing and record as ‘more than 120’. Record your result in (a)(ii). step 20 Repeat step 19 for the other test-tubes, 2, 4, 8 and 16. (ii) Record your results in an appropriate table. [5] (iii) State the independent variable in this investigation. ..................................................................................................................................... [1] (iv) State one main source of error in this investigation. ........................................................................................................................................... ........................................................................................................................................... ..................................................................................................................................... [1] (v) A student set up a beaker as a control experiment. The result of the control experiment showed that the sucrose was hydrolysed by an enzyme. Suggest what substances the student put in the beaker for the control experiment. ........................................................................................................................................... ..................................................................................................................................... [1] (vi) The procedure described in step 1 to step 20 investigated the effect of changing the number of yeast beads on the rate of hydrolysis of sucrose. Describe how you would modify the procedure to investigate the effect of changing the concentration of the sucrose solution on the rate of hydrolysis of sucrose. ........................................................................................................................................... ........................................................................................................................................... ........................................................................................................................................... ........................................................................................................................................... ..................................................................................................................................... [2] (b) Pectinases are enzymes that are used to increase the volume of fruit juice extracted from apples. Pectinases can be immobilised and placed inside a container with apple pulp as shown in Fig. 1.4. The fruit juice is then collected. apple pulp immobilised pectinase fruit juice Fig. 1.4 A scientist carried out an investigation to determine the effect of temperature on the activity of immobilised pectinase by measuring the volume of fruit juice extracted. All other variables were kept constant. The results are shown in Table 1.2. Table 1.2 immobilised pectinase temperature / °C volume of fruit juice / cm3 30 38 40 54 50 79 60 98 70 62 80 4 (i) Plot a graph of the data in Table 1.2 on the grid in Fig. 1.5. Use a sharp pencil. Fig. 1.5 [4] (ii) Use your graph in Fig. 1.5 to estimate the volume of fruit juice extracted at 55 °C. Show on your graph how you obtained your answer. volume of fruit juice = .................................................. cm3 [2] (iii) Describe the change in volume of fruit juice shown by your graph in Fig. 1.5. ........................................................................................................................................... ........................................................................................................................................... ........................................................................................................................................... ..................................................................................................................................... [2] The scientist repeated the investigation replacing the immobilised pectinase with the same amount of pectinase but not immobilised in beads (free pectinase). The results are shown in Table 1.3. Table 1.3 free pectinase (not immobilised) volume of fruit juice temperature / °C / cm3 30 52 40 85 50 98 60 41 70 12 80 4 (iv) Suggest an explanation for why more fruit juice was obtained when using the free pectinase between the temperatures of 30 °C and 50 °C than when using immobilised pectinase. ........................................................................................................................................... ........................................................................................................................................... ..................................................................................................................................... [1] (v) Suggest an explanation for why more fruit juice was obtained when using immobilised pectinase between the temperatures of 60 °C and 70 °C than when using the free pectinase. ........................................................................................................................................... ........................................................................................................................................... ..................................................................................................................................... [2] [Total: 22]
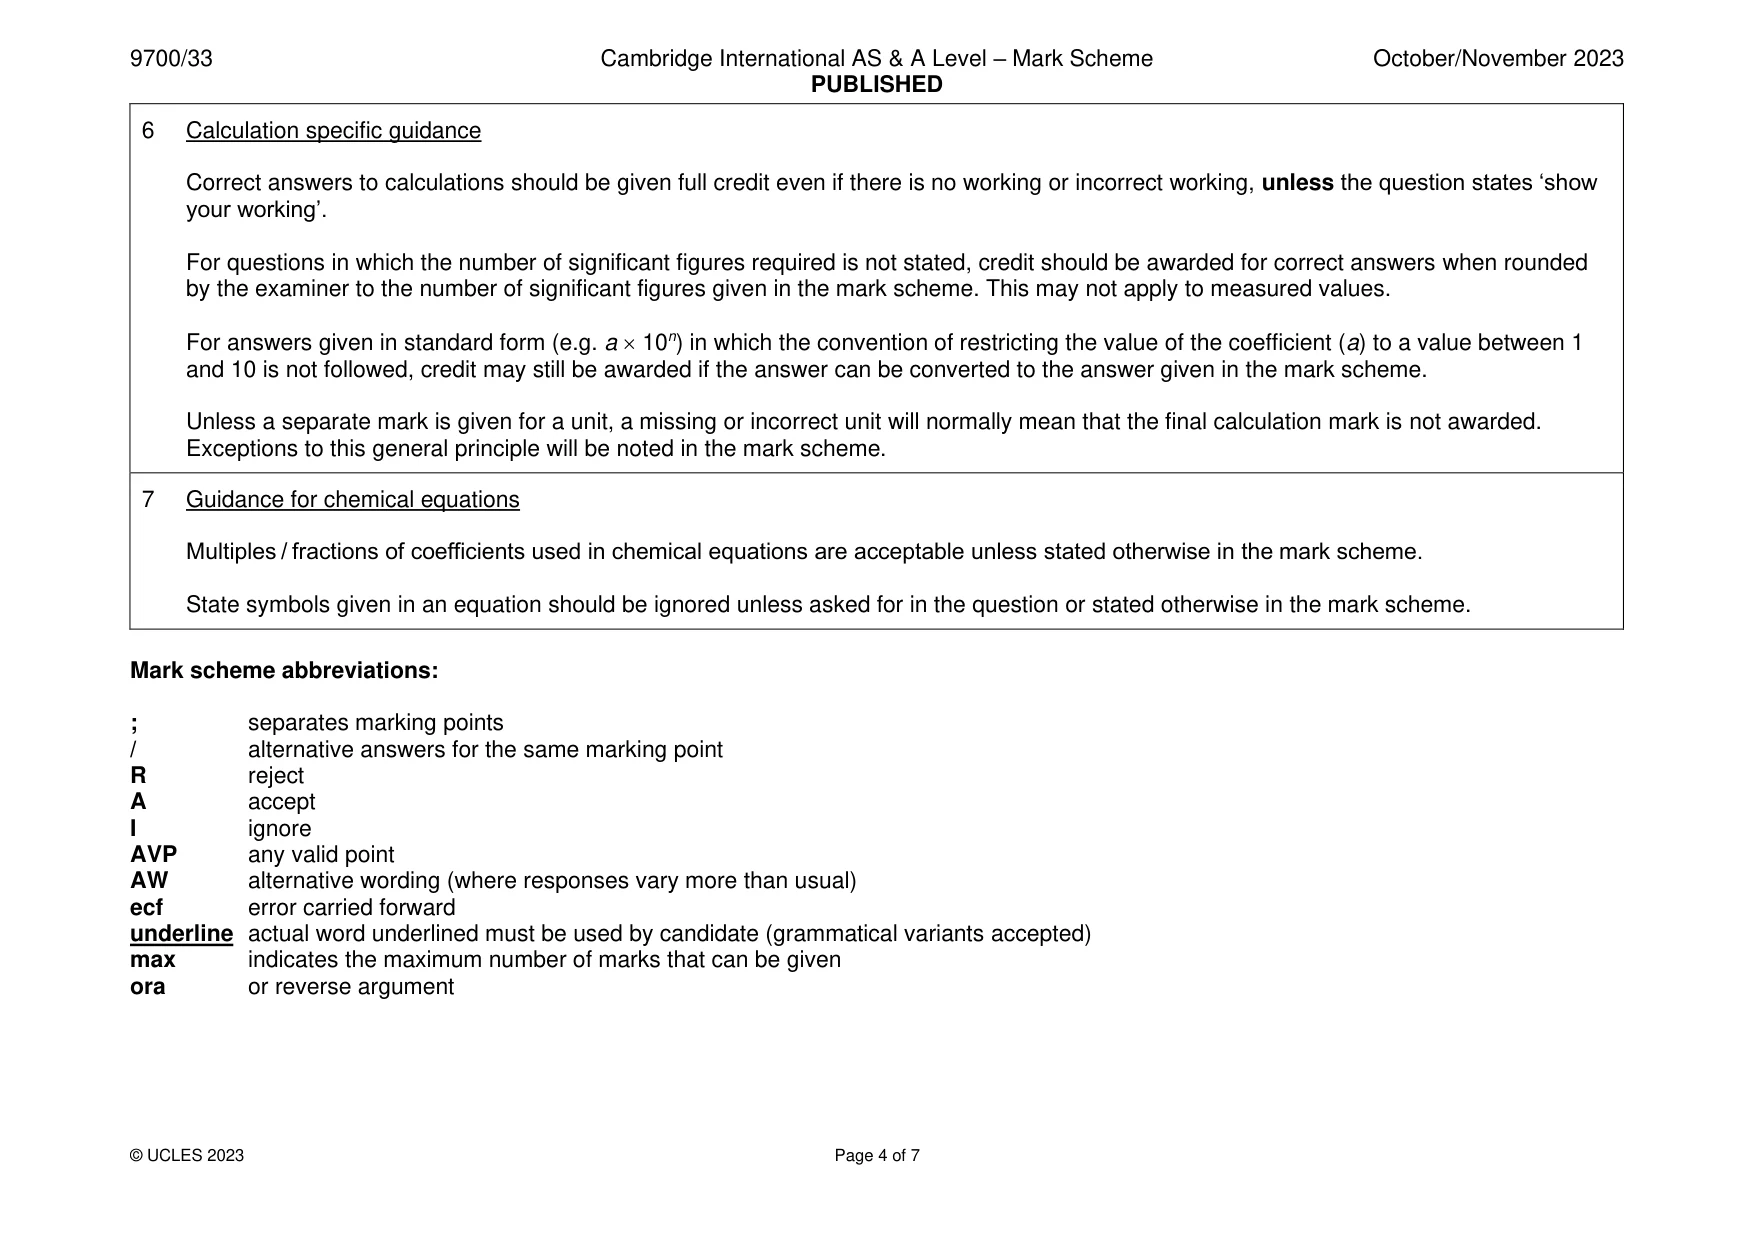
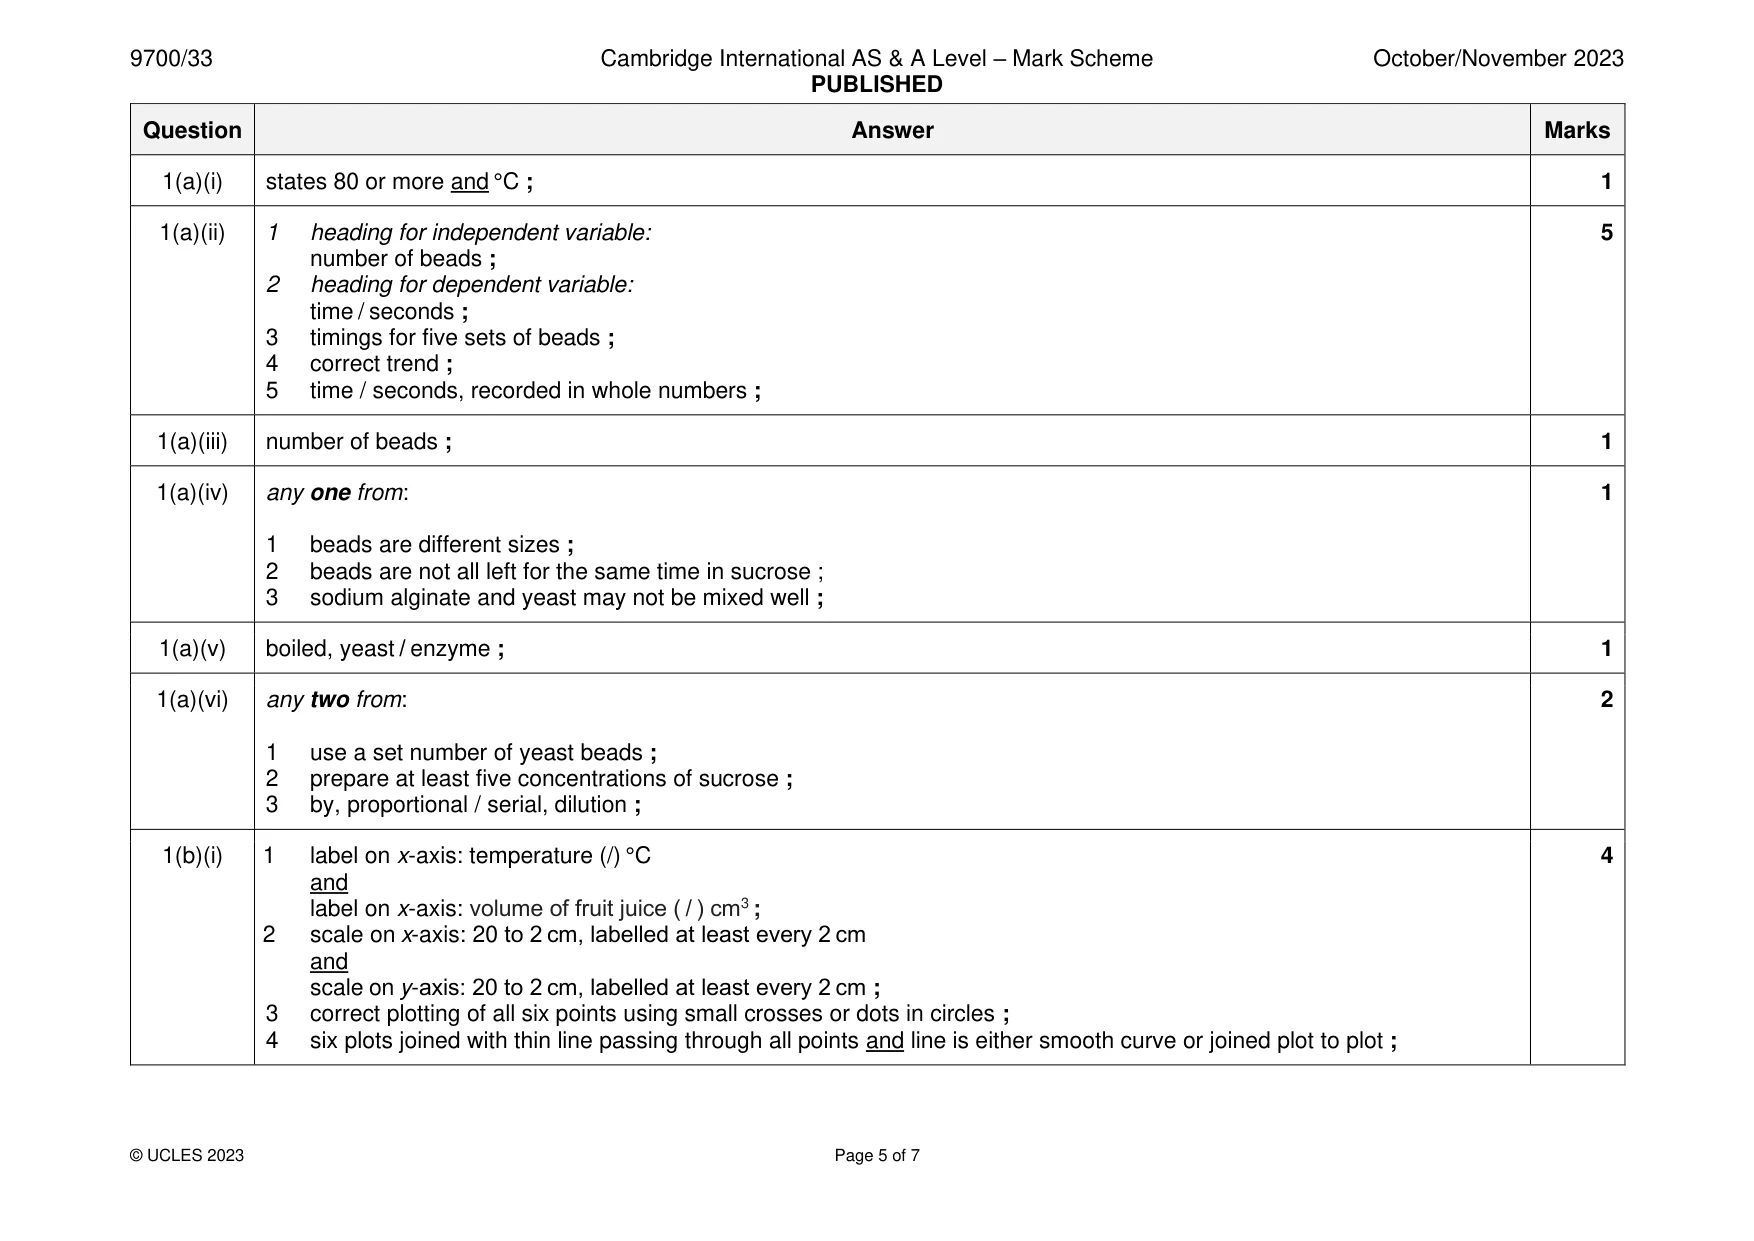
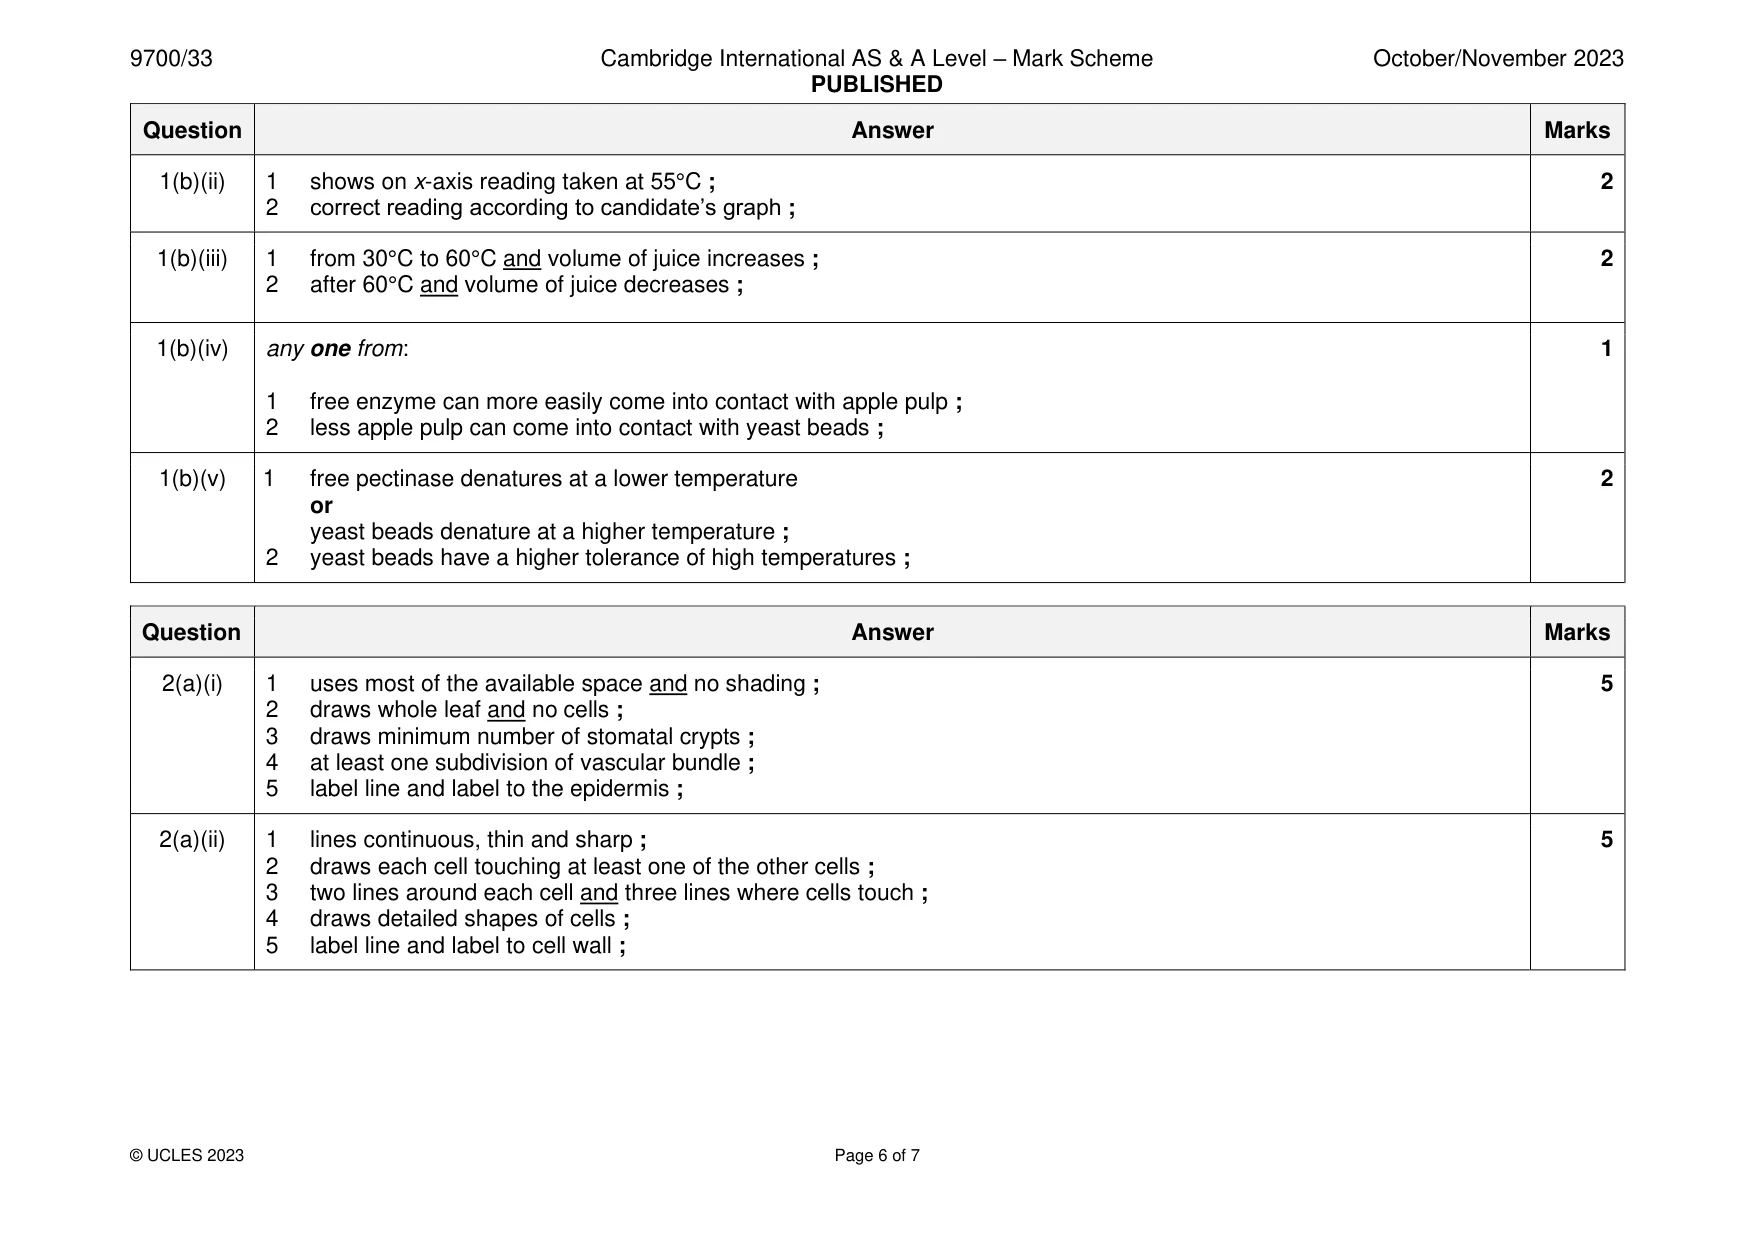
Mark scheme: Question Answer Marks 1(a)(i) states 80 or more and °C ; 1 1(a)(ii) 1 heading for independent variable: 5 number of beads ; 2 heading for dependent variable: time / seconds ; 3 timings for five sets of beads ; 4 correct trend ; 5 time / seconds, recorded in whole numbers ; 1(a)(iii) number of beads ; 1 1(a)(iv) any one from: 1 1 beads are different sizes ; 2 beads are not all left for the same time in sucrose ; 3 sodium alginate and yeast may not be mixed well ; 1(a)(v) boiled, yeast / enzyme ; 1 1(a)(vi) any two from: 2 1 use a set number of yeast beads ; 2 prepare at least five concentrations of sucrose ; 3 by, proportional / serial, dilution ; 1(b)(i) 1 label on x-axis: temperature (/) °C 4 and label on x-axis: volume of fruit juice ( / ) cm3 ; 2 scale on x-axis: 20 to 2 cm, labelled at least every 2 cm and scale on y-axis: 20 to 2 cm, labelled at least every 2 cm ; 3 correct plotting of all six points using small crosses or dots in circles ; 4 six plots joined with thin line passing through all points and line is either smooth curve or joined plot to plot ; 1(b)(ii) 1 shows on x-axis reading taken at 55°C ; 2 2 correct reading according to candidate’s graph ; 1(b)(iii) 1 from 30°C to 60°C and volume of juice increases ; 2 2 after 60°C and volume of juice decreases ; 1(b)(iv) any one from: 1 1 free enzyme can more easily come into contact with apple pulp ; 2 less apple pulp can come into contact with yeast beads ; 1(b)(v) 1 free pectinase denatures at a lower temperature 2 or yeast beads denature at a higher temperature ; 2 yeast beads have a higher tolerance of high temperatures ;
Q2 · K1 is a slide of a stained transverse section through a plant leaf
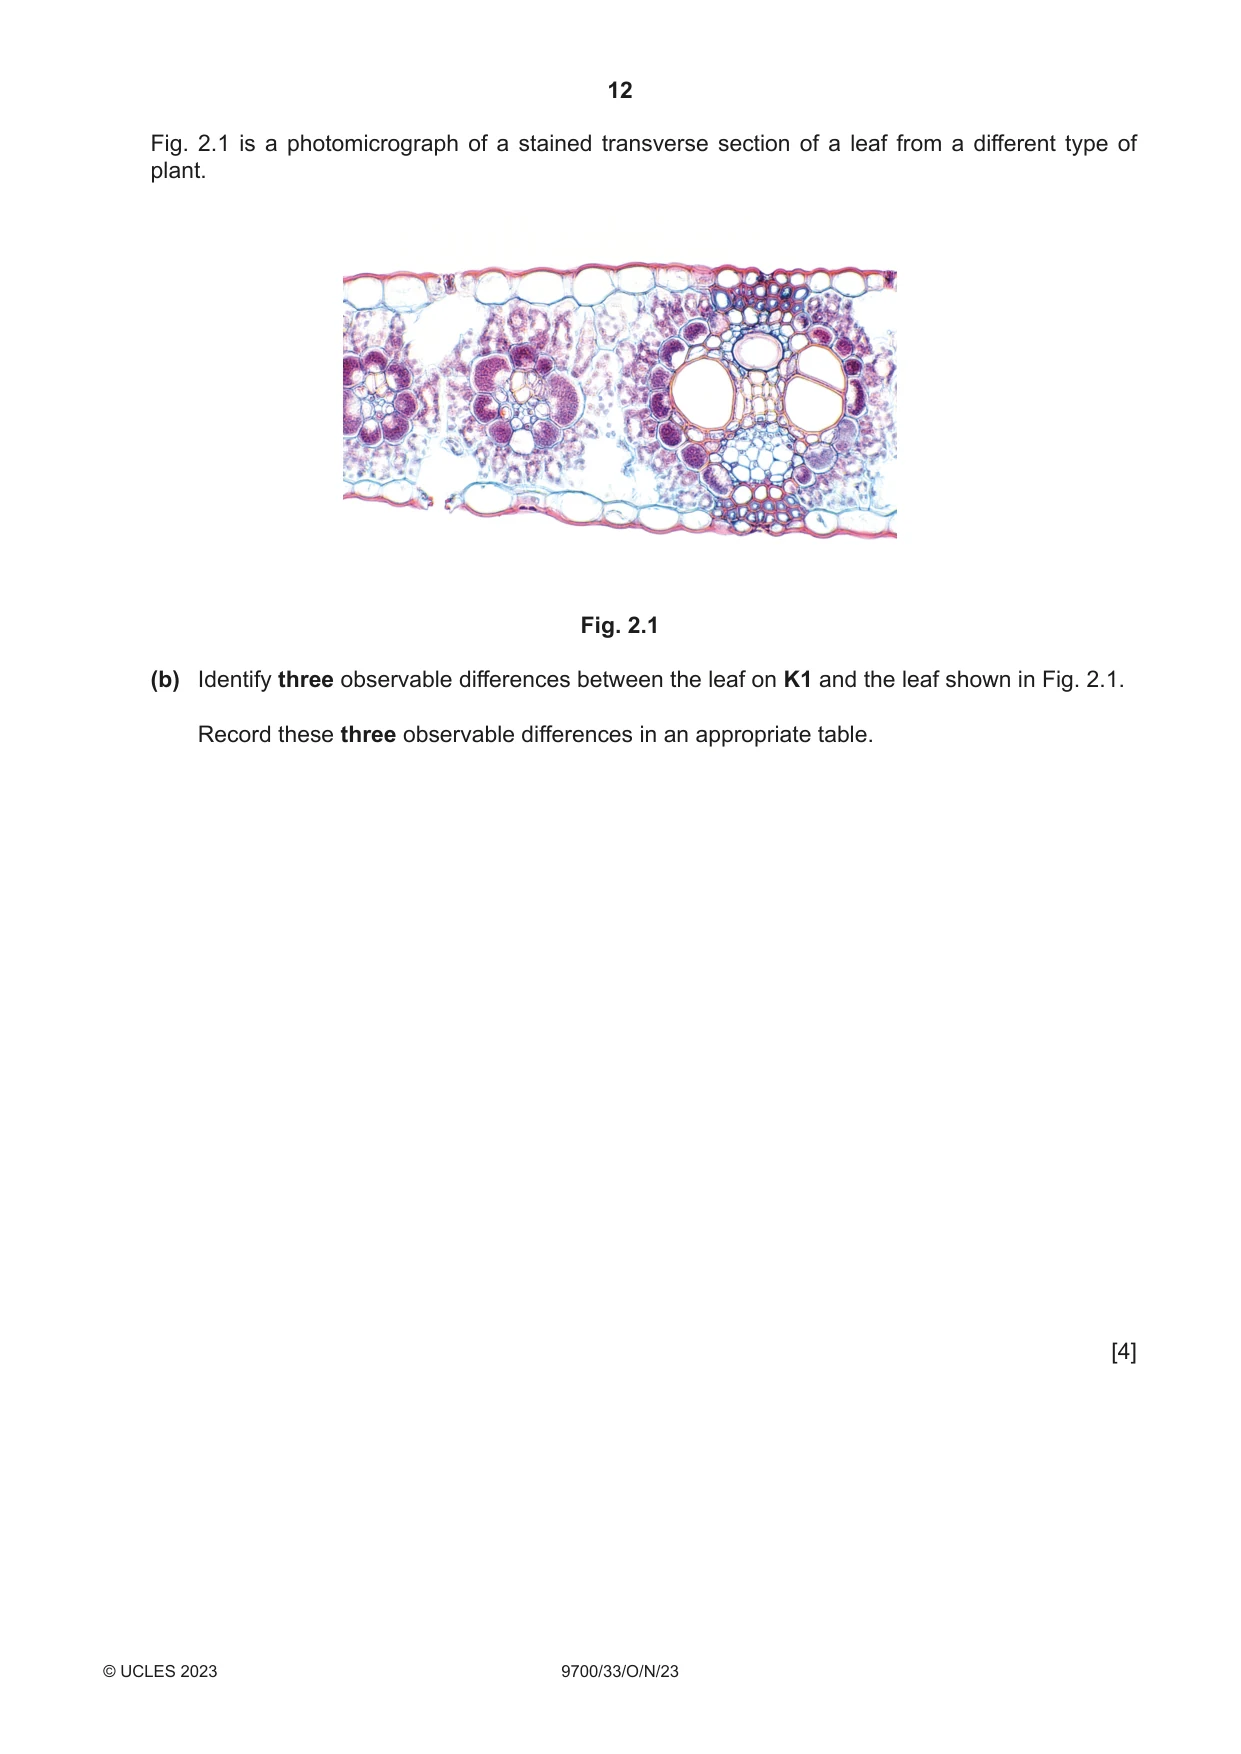
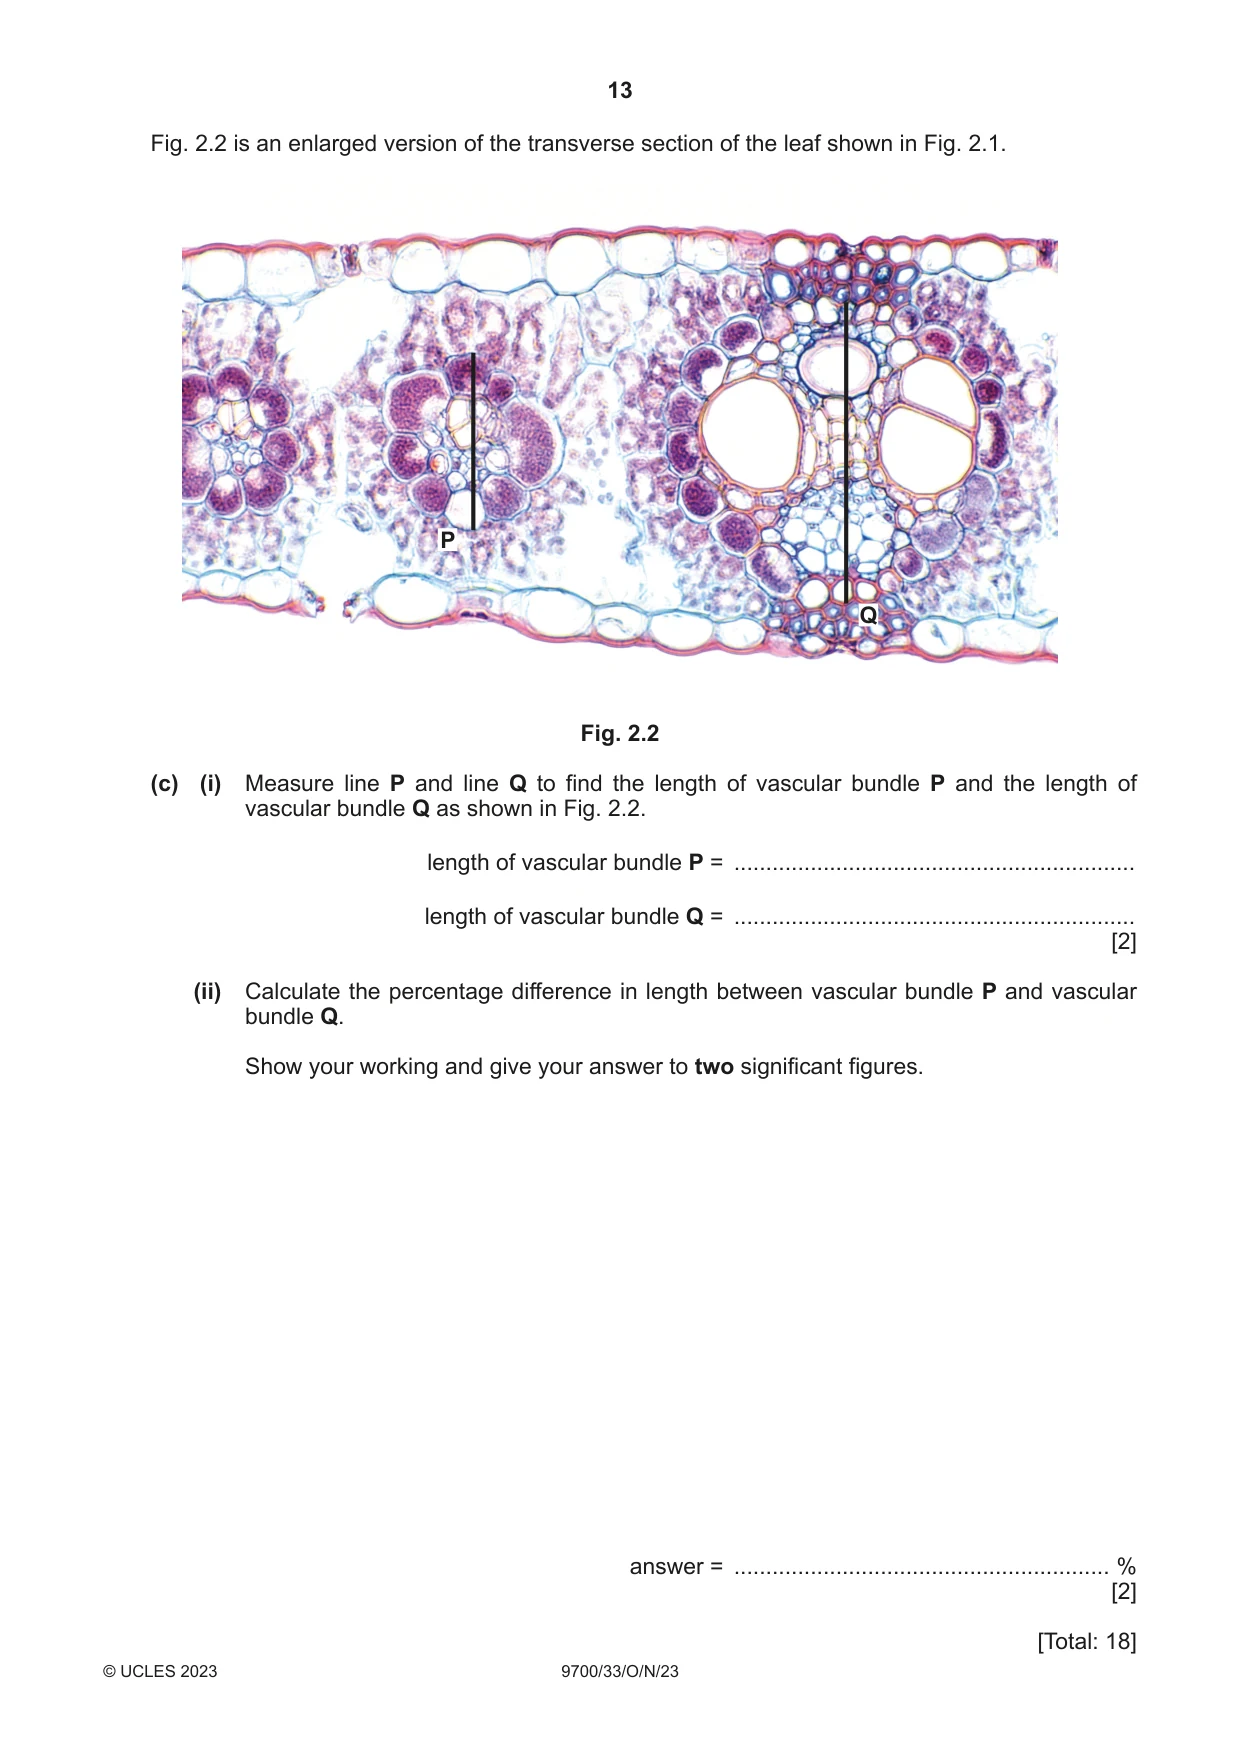
2 K1 is a slide of a stained transverse section through a plant leaf. (a) (i) Draw a large plan diagram of the whole leaf on K1. Use a sharp pencil. Use one ruled label line and label to identify the epidermis. [5] (ii) Observe the cells in the epidermis of the leaf on K1. Select a line of four adjacent epidermal cells. Each cell must touch at least one of the other epidermal cells. • Make a large drawing of this line of four cells. • Use one ruled label line and label to identify the cell wall. [5] Fig. 2.1 is a photomicrograph of a stained transverse section of a leaf from a different type of plant. Fig. 2.1 (b) Identify three observable differences between the leaf on K1 and the leaf shown in Fig. 2.1. Record these three observable differences in an appropriate table. [4]
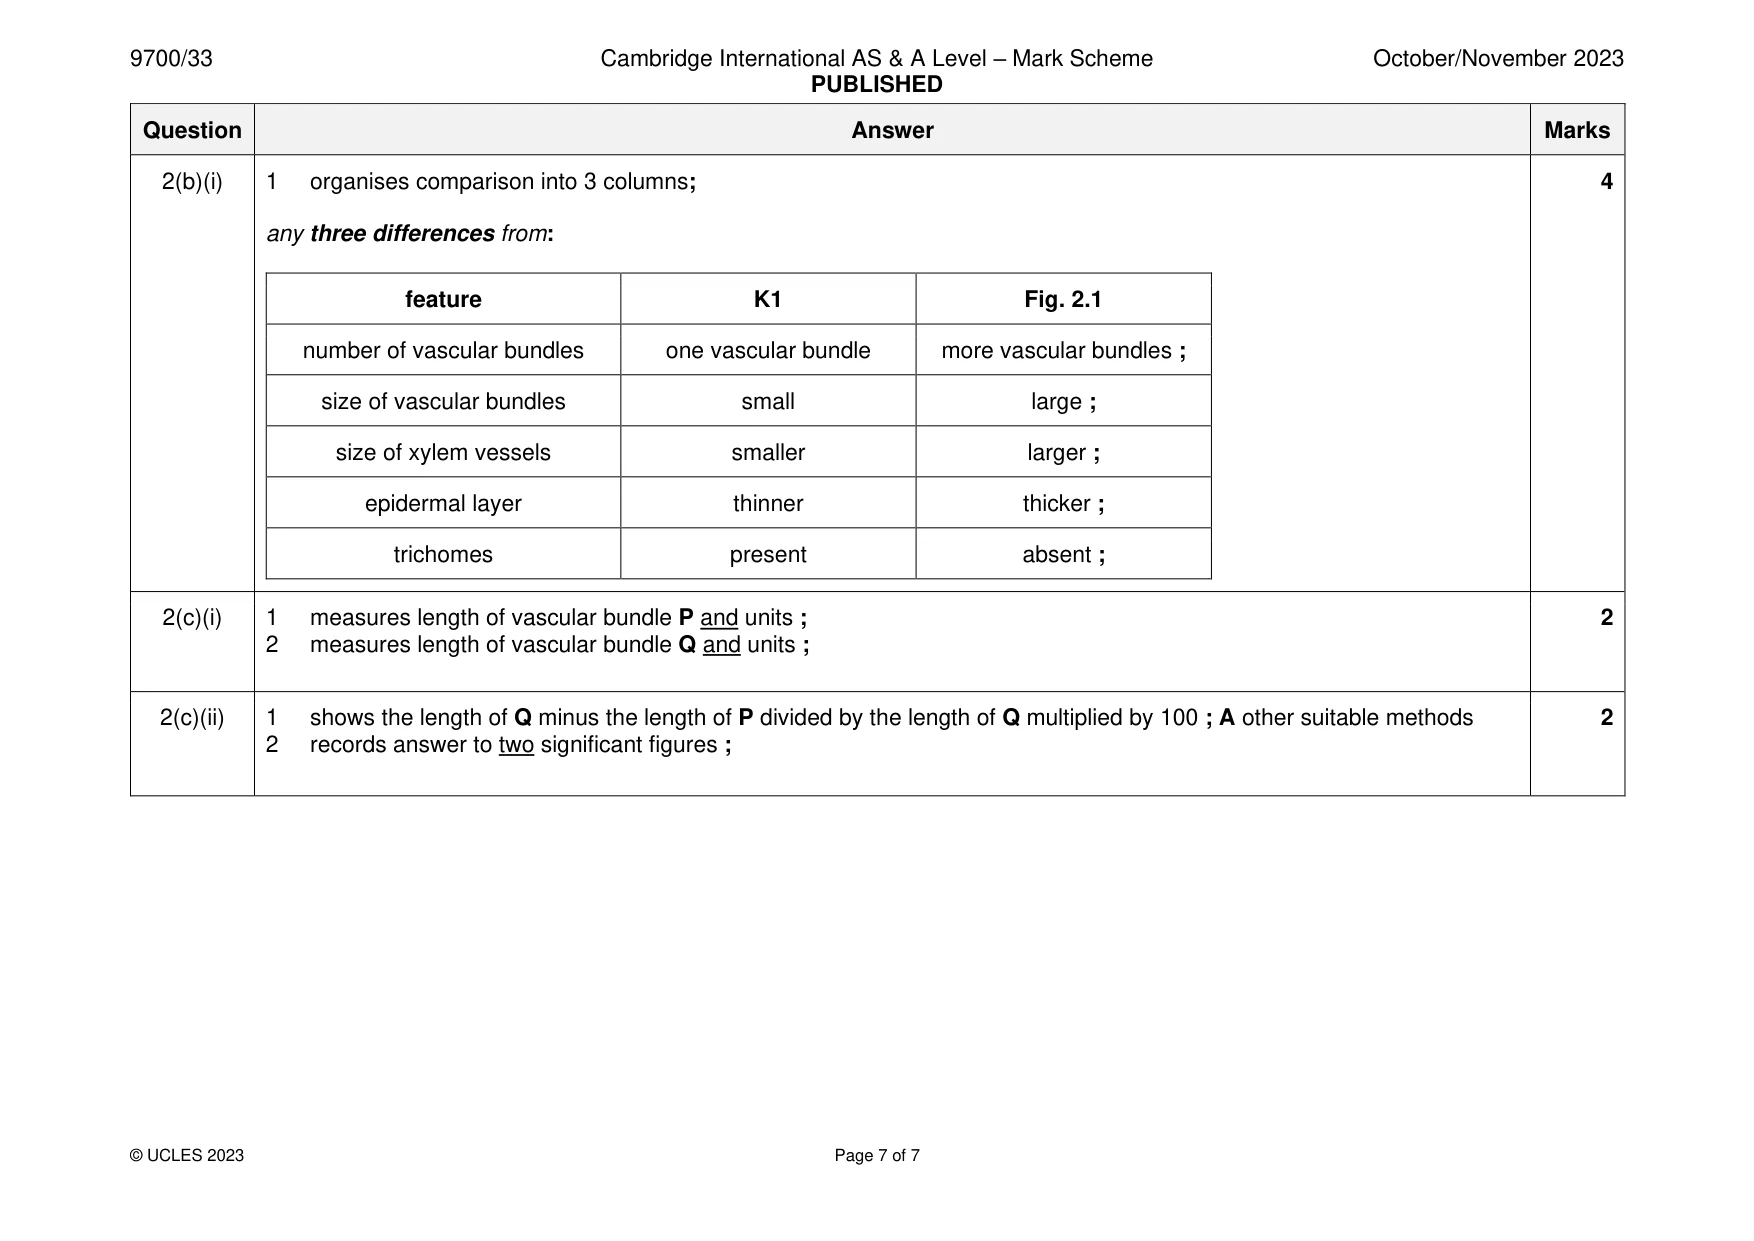
Mark scheme: 2(a)(i) 1 uses most of the available space and no shading ; 5 2 draws whole leaf and no cells ; 3 draws minimum number of stomatal crypts ; 4 at least one subdivision of vascular bundle ; 5 label line and label to the epidermis ; 2(a)(ii) 1 lines continuous, thin and sharp ; 5 2 draws each cell touching at least one of the other cells ; 3 two lines around each cell and three lines where cells touch ; 4 draws detailed shapes of cells ; 5 label line and label to cell wall ; 2(b)(i) 1 organises comparison into 3 columns; 4 any three differences from: feature K1 Fig. 2.1 number of vascular bundles one vascular bundle more vascular bundles ; size of vascular bundles small large ; size of xylem vessels smaller larger ; epidermal layer thinner thicker ; trichomes present absent ; 2(c)(i) 1 measures length of vascular bundle P and units ; 2 2 measures length of vascular bundle Q and units ; 2(c)(ii) 1 shows the length of Q minus the length of P divided by the length of Q multiplied by 100 ; A other suitable methods 2 2 records answer to two significant figures ;
More questions on Cells as the basic units of living organisms
What was in this paper
The subtopics covered by these 2 questions, and how many questions each got. Open one in a new tab to see every Cambridge question on it.
What you needed in this session
Cambridge’s own grade thresholds for 2023 Oct/Nov, Paper 3 · Variant 3. A higher threshold means an easier paper — the bar moves with how the cohort did.