Cambridge A Level Biology 9700 — 2023 Oct/Nov Paper 3 · Variant 1
9700/31/O/N/23 · 2 questions · 40 marks · ≈45 min
The question paper and its mark scheme, free to read here and free to download. This is Cambridge’s own paper, exactly as it was sat.
Question paper12 pages


Mark scheme7 pages
Answers below. Sit the paper first if you are practising.
Questions as text
Q1 · You will investigate the effect of temperature on the production of carbon dioxide gas by…
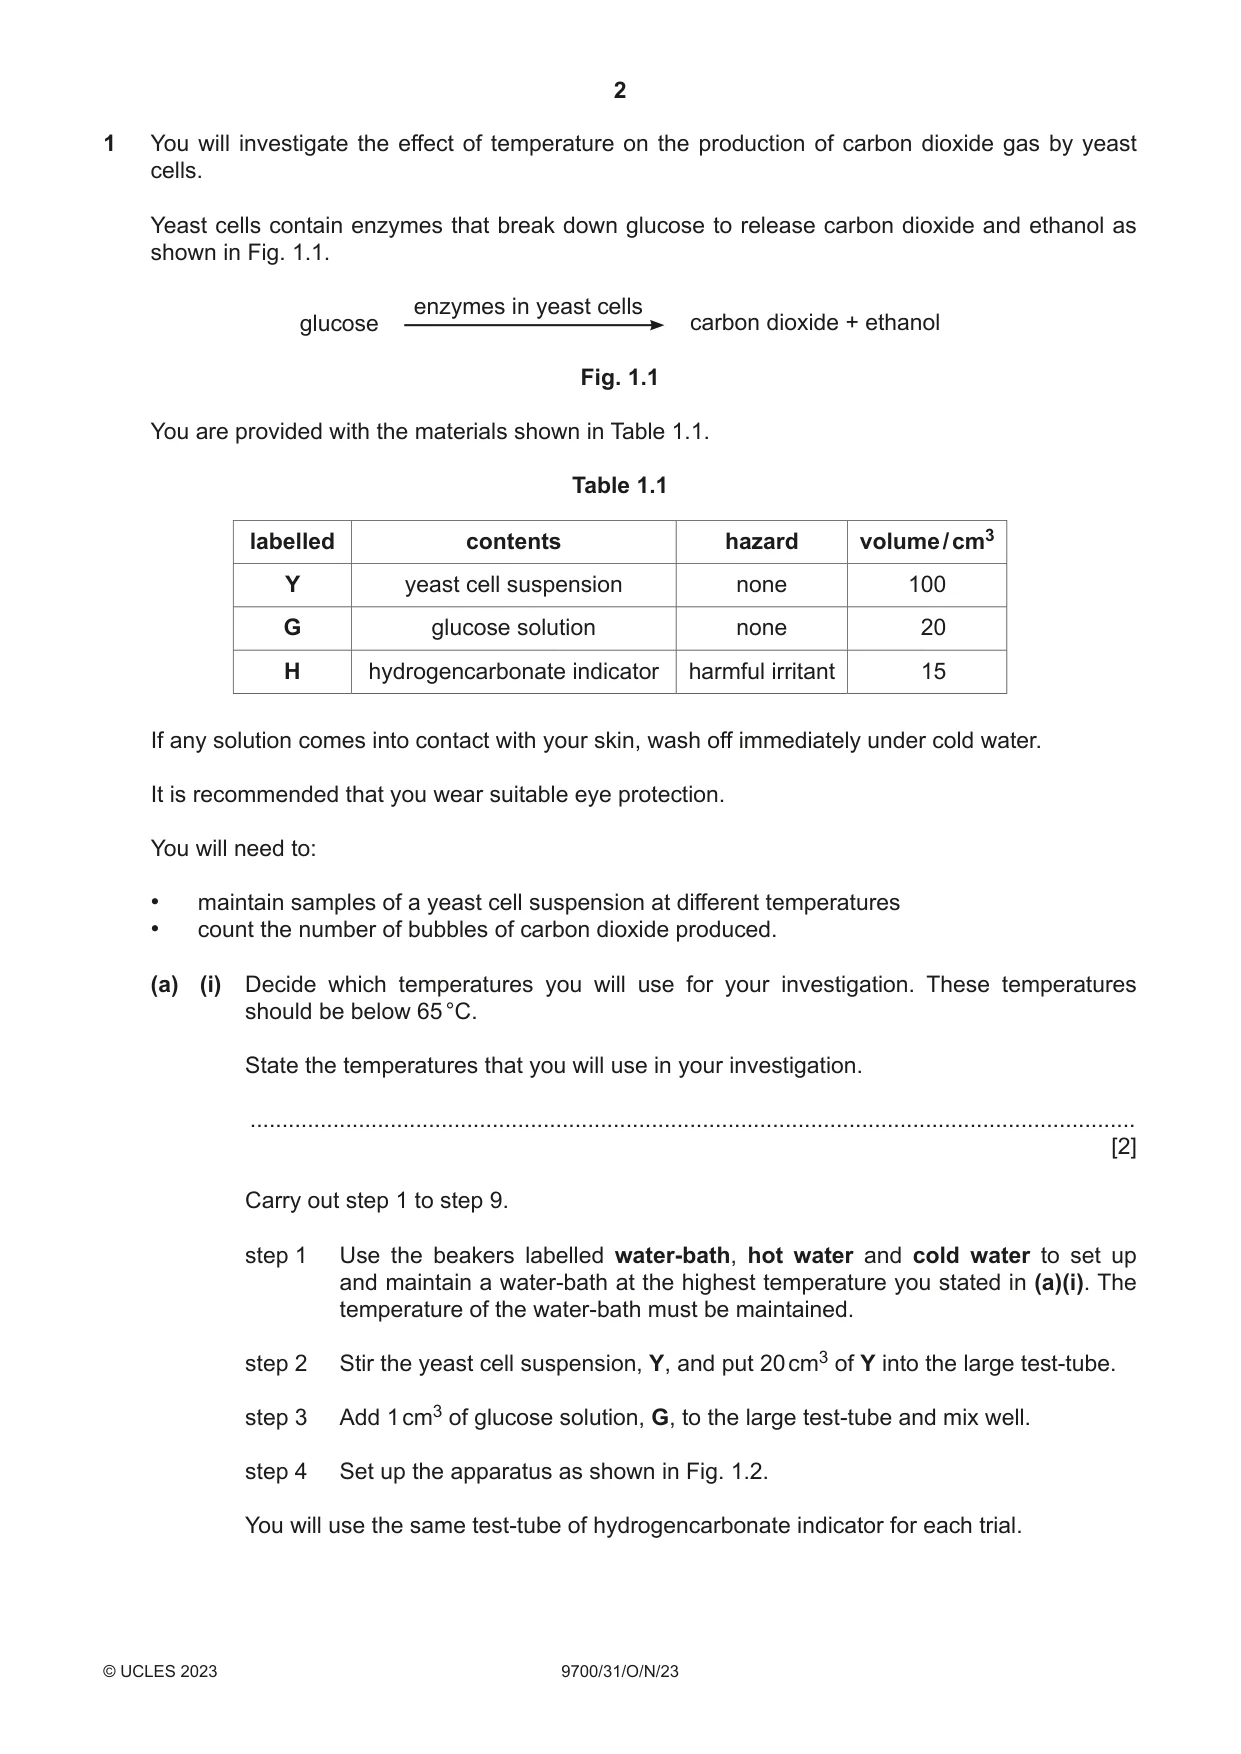
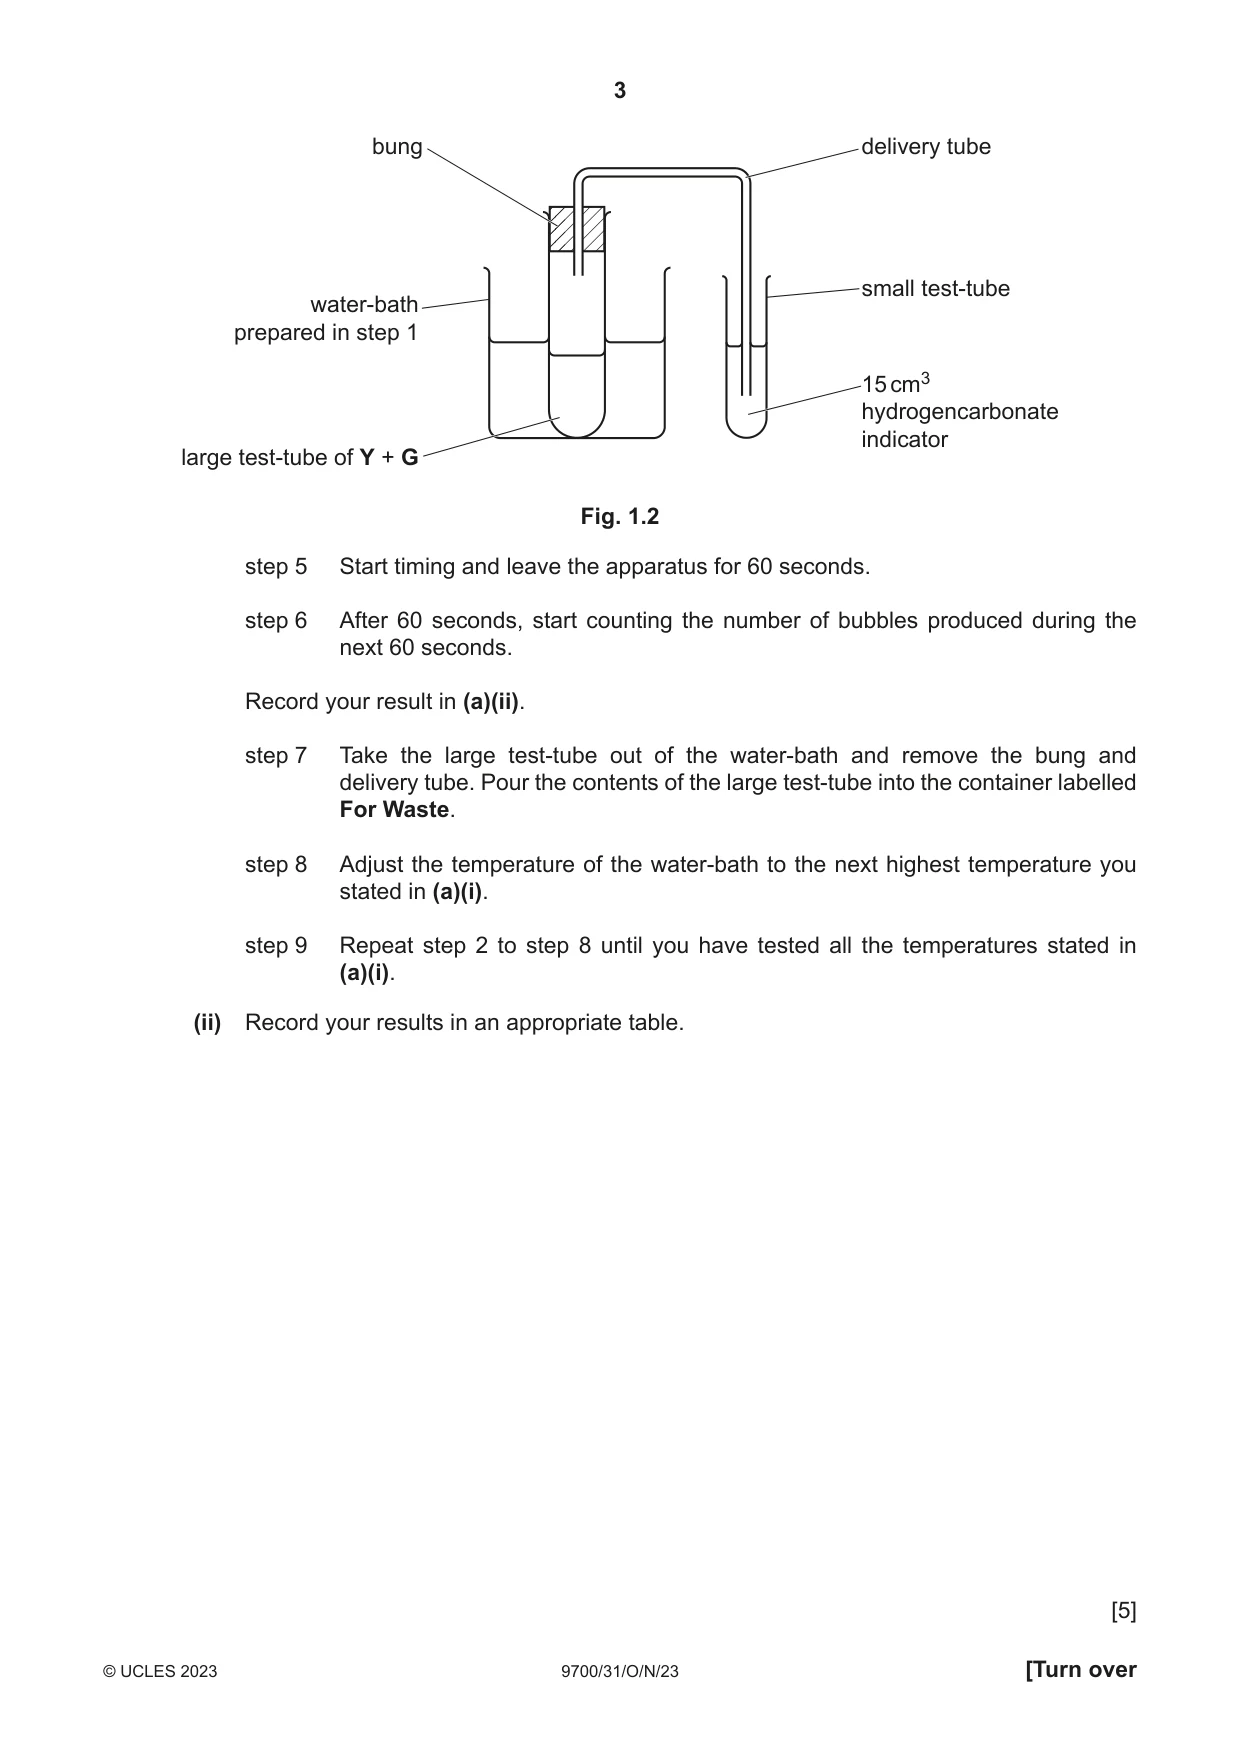
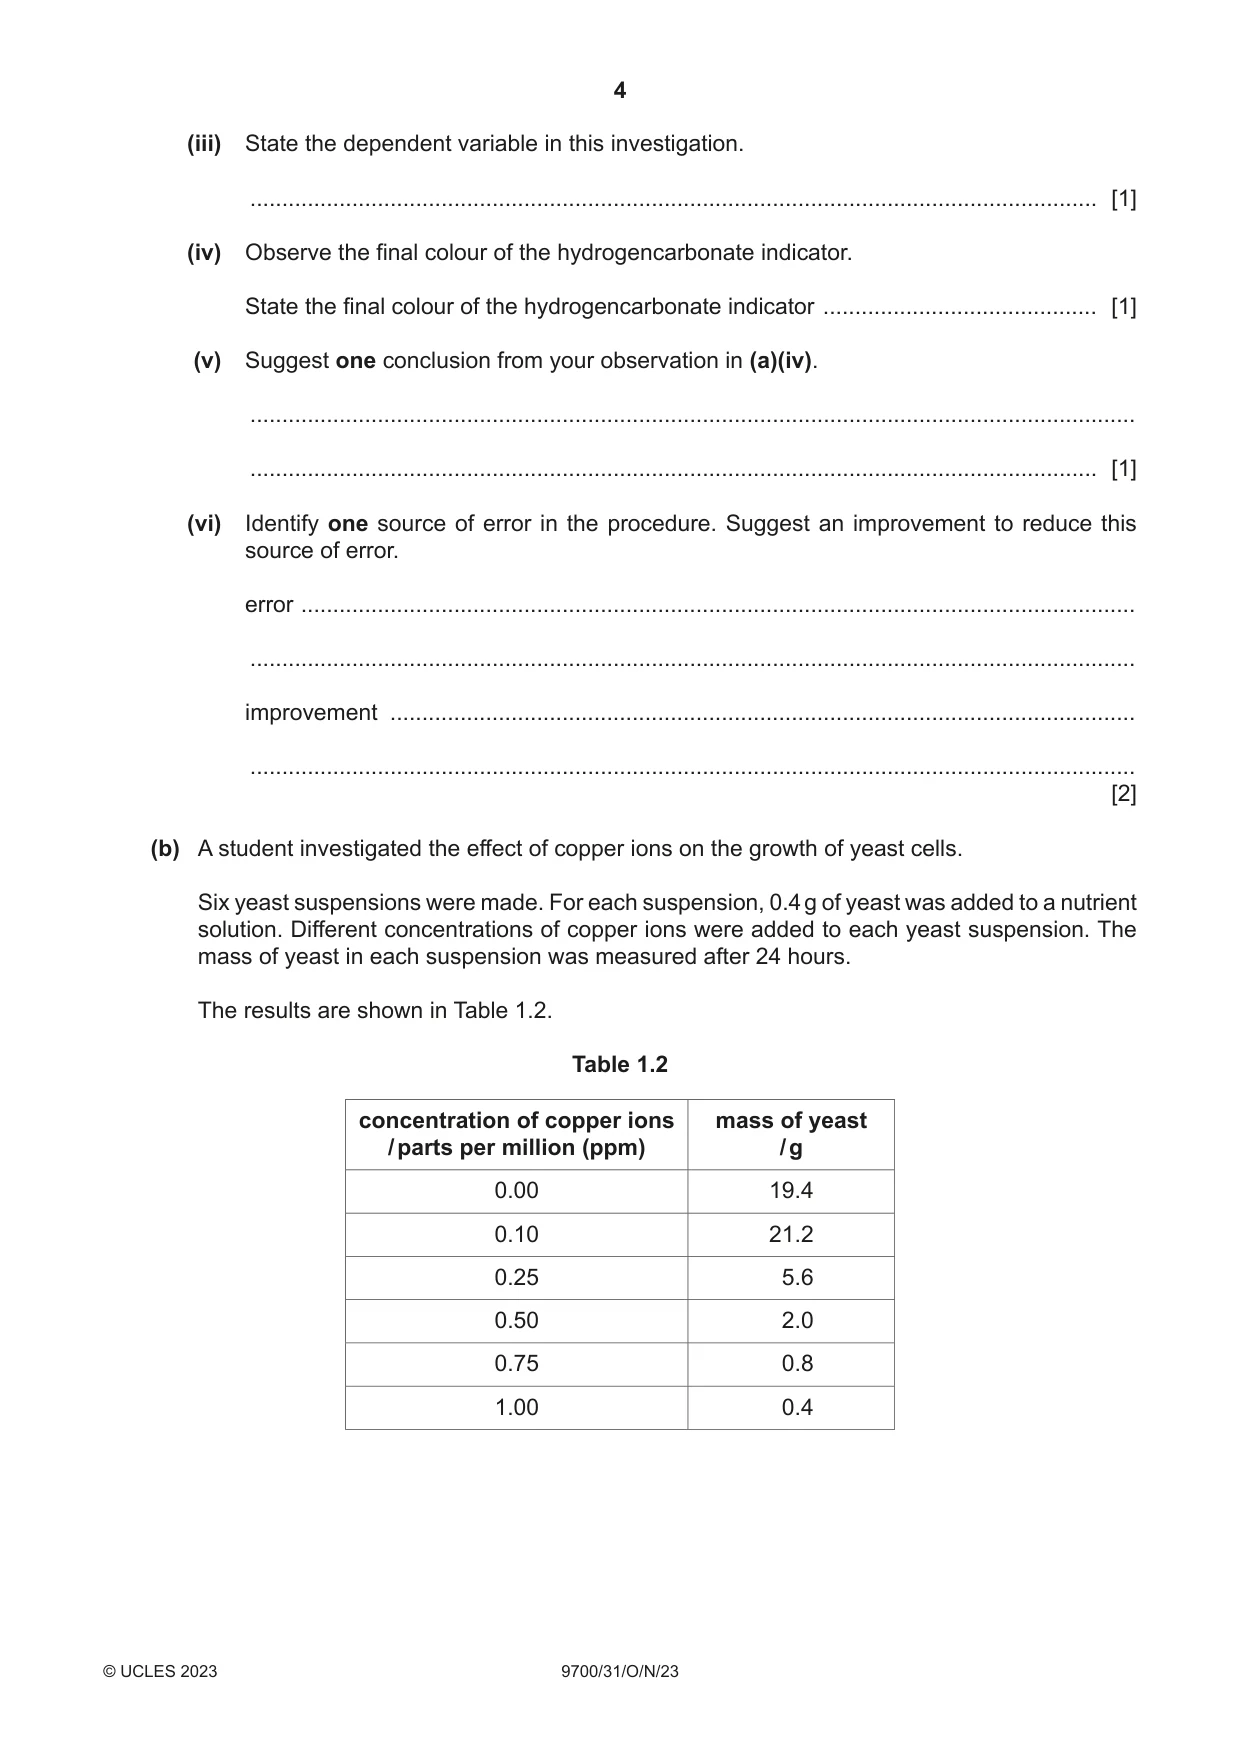
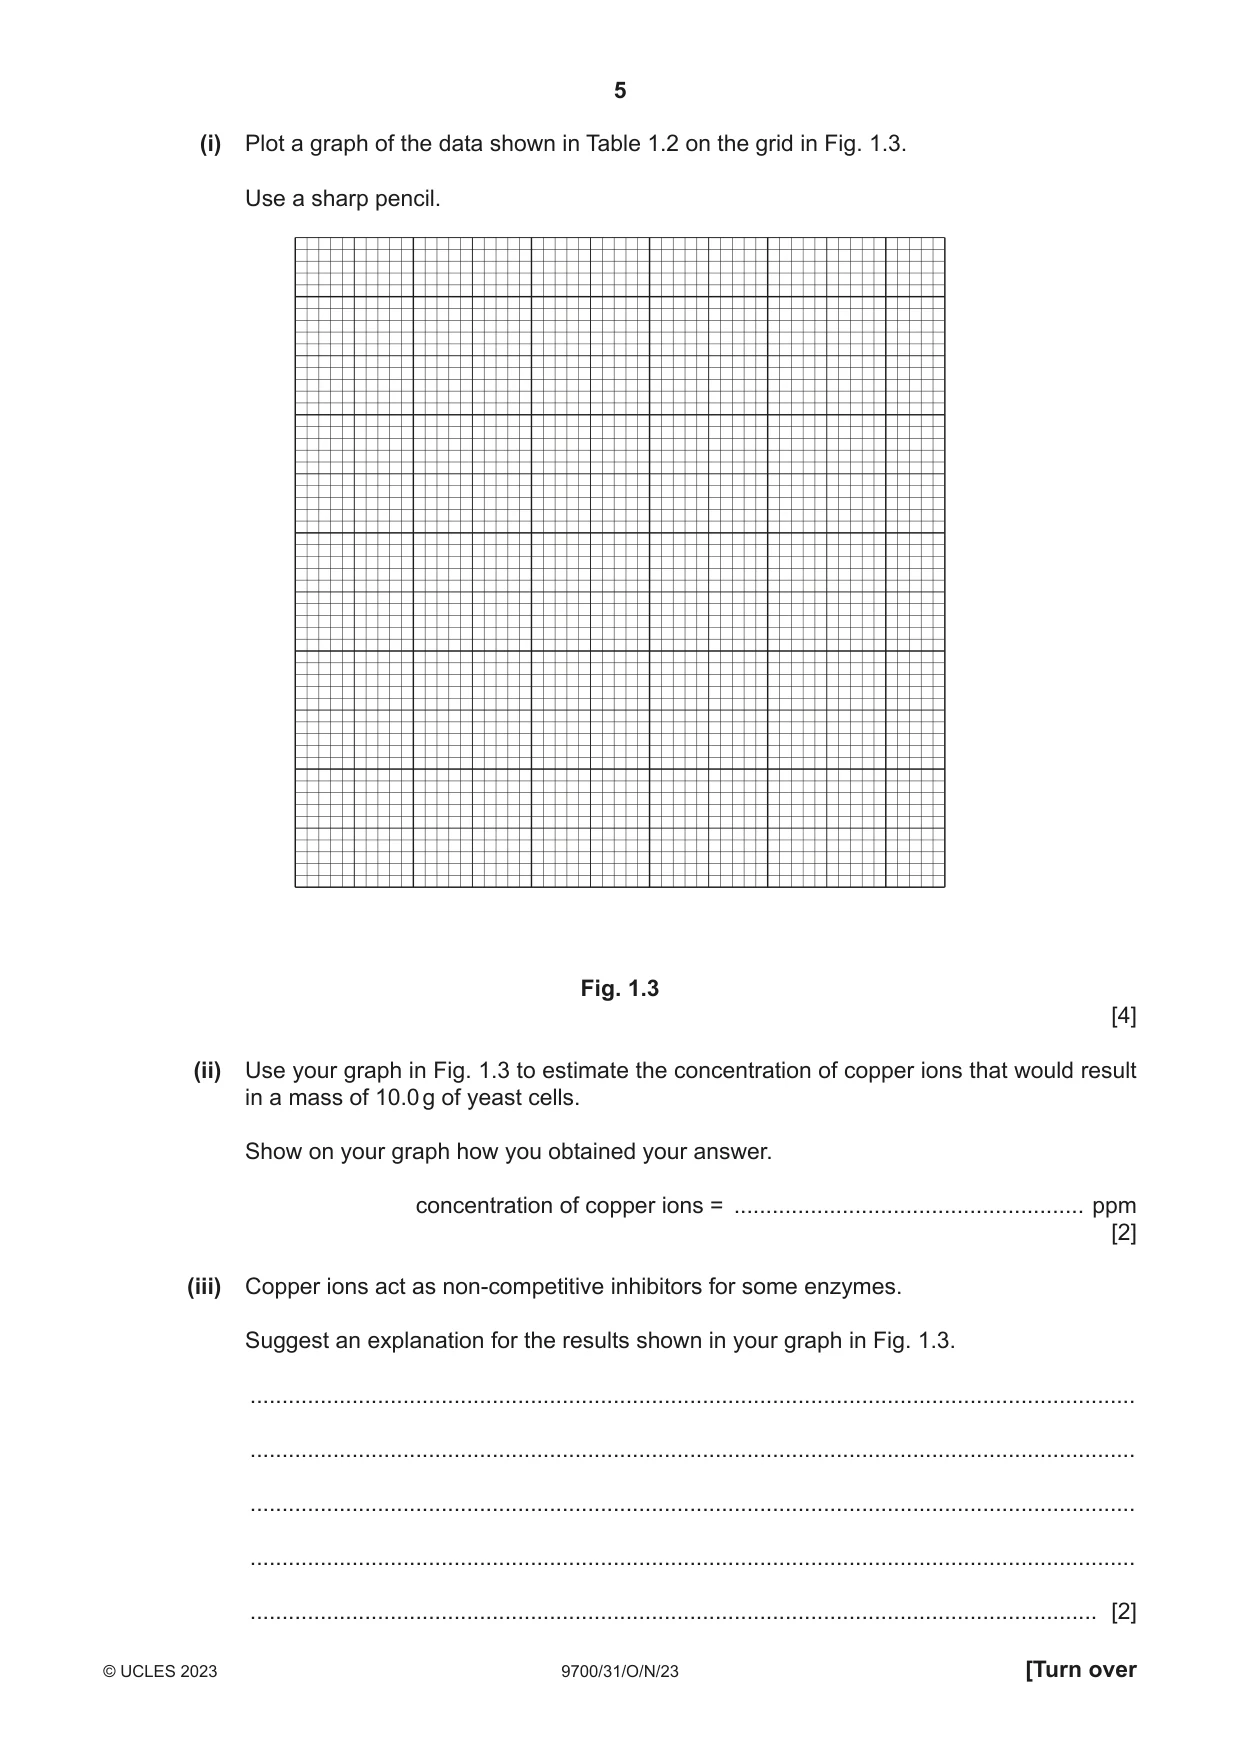
1 You will investigate the effect of temperature on the production of carbon dioxide gas by yeast cells. Yeast cells contain enzymes that break down glucose to release carbon dioxide and ethanol as shown in Fig. 1.1. enzymes in yeast cells glucose carbon dioxide + ethanol Fig. 1.1 You are provided with the materials shown in Table 1.1. Table 1.1 labelled contents hazard volume / cm3 Y yeast cell suspension none 100 G glucose solution none 20 H hydrogencarbonate indicator harmful irritant 15 If any solution comes into contact with your skin, wash off immediately under cold water. It is recommended that you wear suitable eye protection. You will need to: • maintain samples of a yeast cell suspension at different temperatures • count the number of bubbles of carbon dioxide produced. (a) (i) Decide which temperatures you will use for your investigation. These temperatures should be below 65 °C. State the temperatures that you will use in your investigation. ........................................................................................................................................... [2] Carry out step 1 to step 9. step 1 Use the beakers labelled water-bath, hot water and cold water to set up and maintain a water-bath at the highest temperature you stated in (a)(i). The temperature of the water-bath must be maintained. step 2 Stir the yeast cell suspension, Y, and put 20 cm3 of Y into the large test-tube. step 3 Add 1 cm3 of glucose solution, G, to the large test-tube and mix well. step 4 Set up the apparatus as shown in Fig. 1.2. You will use the same test-tube of hydrogencarbonate indicator for each trial. bung delivery tube small test-tube water-bath prepared in step 1 15 cm3 hydrogencarbonate indicator large test-tube of Y + G Fig. 1.2 step 5 Start timing and leave the apparatus for 60 seconds. step 6 After 60 seconds, start counting the number of bubbles produced during the next 60 seconds. Record your result in (a)(ii). step 7 Take the large test-tube out of the water-bath and remove the bung and delivery tube. Pour the contents of the large test-tube into the container labelled For Waste. step 8 Adjust the temperature of the water-bath to the next highest temperature you stated in (a)(i). step 9 Repeat step 2 to step 8 until you have tested all the temperatures stated in (a)(i). (ii) Record your results in an appropriate table. [5] (iii) State the dependent variable in this investigation. ..................................................................................................................................... [1] (iv) Observe the final colour of the hydrogencarbonate indicator. State the final colour of the hydrogencarbonate indicator ........................................... [1] (v) Suggest one conclusion from your observation in (a)(iv). ........................................................................................................................................... ..................................................................................................................................... [1] (vi) Identify one source of error in the procedure. Suggest an improvement to reduce this source of error. error ................................................................................................................................... ........................................................................................................................................... improvement ..................................................................................................................... ........................................................................................................................................... [2] (b) A student investigated the effect of copper ions on the growth of yeast cells. Six yeast suspensions were made. For each suspension, 0.4 g of yeast was added to a nutrient solution. Different concentrations of copper ions were added to each yeast suspension. The mass of yeast in each suspension was measured after 24 hours. The results are shown in Table 1.2. Table 1.2 concentration of copper ions mass of yeast / parts per million (ppm) / g 0.00 19.4 0.10 21.2 0.25 5.6 0.50 2.0 0.75 0.8 1.00 0.4 (i) Plot a graph of the data shown in Table 1.2 on the grid in Fig. 1.3. Use a sharp pencil. Fig. 1.3 [4] (ii) Use your graph in Fig. 1.3 to estimate the concentration of copper ions that would result in a mass of 10.0 g of yeast cells. Show on your graph how you obtained your answer. concentration of copper ions = ....................................................... ppm [2] (iii) Copper ions act as non-competitive inhibitors for some enzymes. Suggest an explanation for the results shown in your graph in Fig. 1.3. ........................................................................................................................................... ........................................................................................................................................... ........................................................................................................................................... ........................................................................................................................................... ..................................................................................................................................... [2] (iv) Until the 1930s, most commercial fermenting equipment for growing yeast cells was made of copper. After this time, fermenting equipment was made using stainless steel instead of copper. Use your graph in Fig. 1.3 to suggest why stainless steel was used instead of copper. ........................................................................................................................................... ........................................................................................................................................... ..................................................................................................................................... [1] [Total: 21]
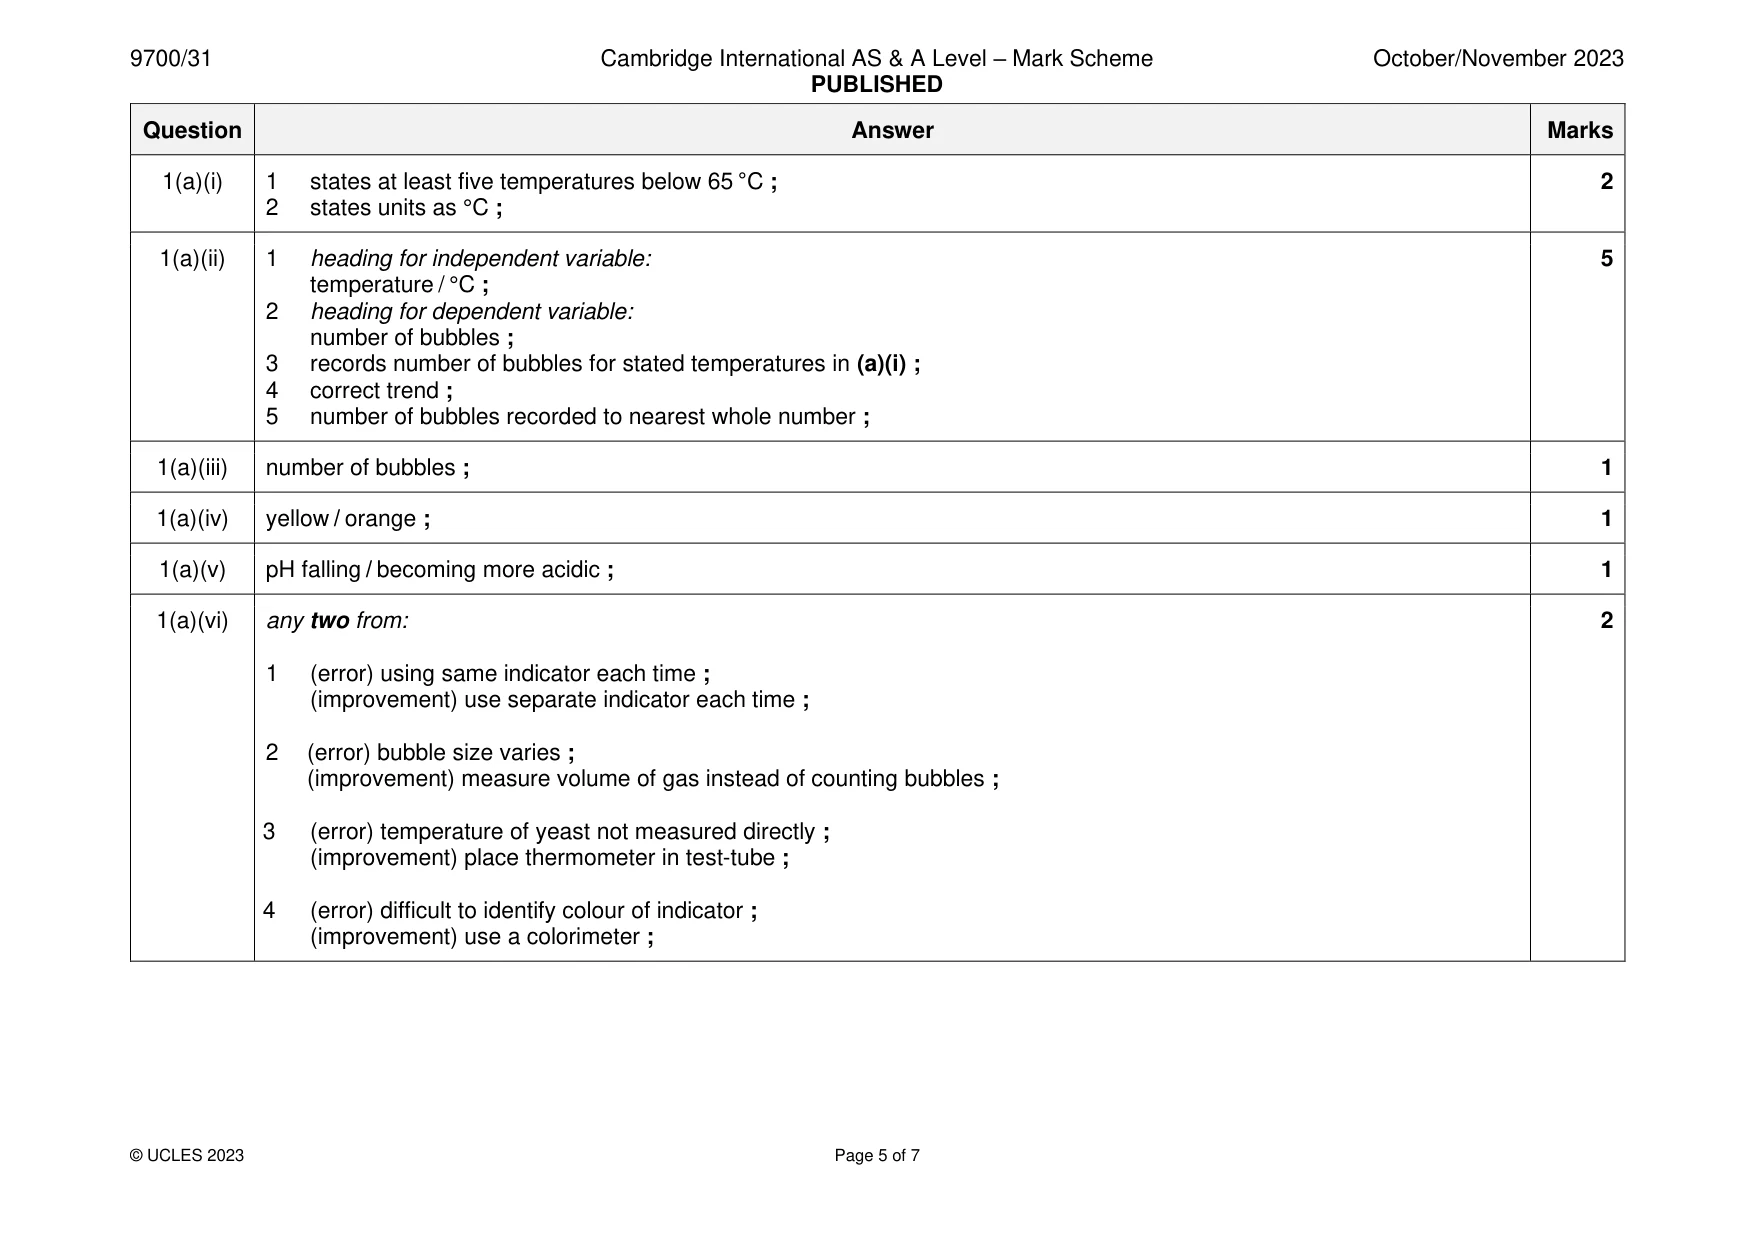
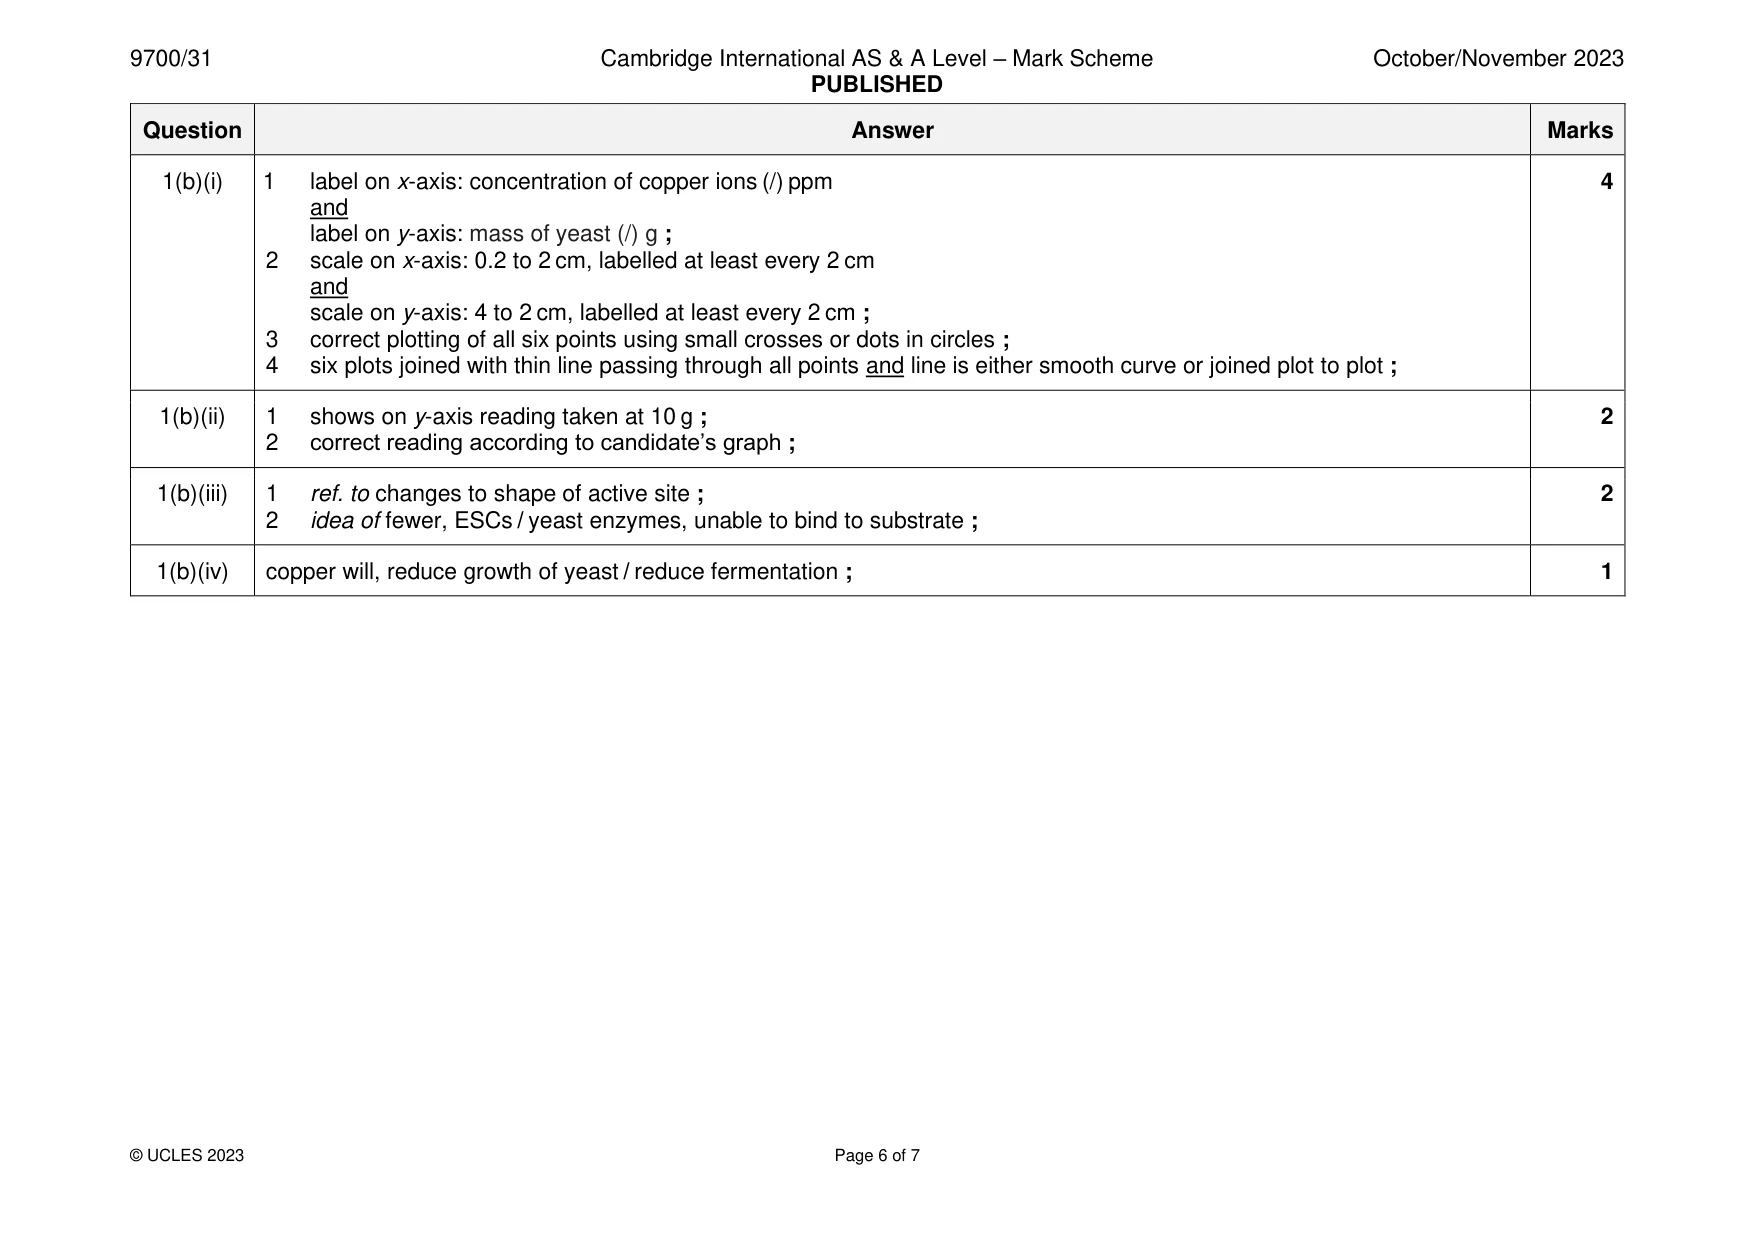
Mark scheme: Question Answer Marks 1(a)(i) 1 states at least five temperatures below 65 °C ; 2 2 states units as °C ; 1(a)(ii) 1 heading for independent variable: 5 temperature / °C ; 2 heading for dependent variable: number of bubbles ; 3 records number of bubbles for stated temperatures in (a)(i) ; 4 correct trend ; 5 number of bubbles recorded to nearest whole number ; 1(a)(iii) number of bubbles ; 1 1(a)(iv) yellow / orange ; 1 1(a)(v) pH falling / becoming more acidic ; 1 1(a)(vi) any two from: 2 1 (error) using same indicator each time ; (improvement) use separate indicator each time ; 2 (error) bubble size varies ; (improvement) measure volume of gas instead of counting bubbles ; 3 (error) temperature of yeast not measured directly ; (improvement) place thermometer in test-tube ; 4 (error) difficult to identify colour of indicator ; (improvement) use a colorimeter ; 1(b)(i) 1 label on x-axis: concentration of copper ions (/) ppm 4 and label on y-axis: mass of yeast (/) g ; 2 scale on x-axis: 0.2 to 2 cm, labelled at least every 2 cm and scale on y-axis: 4 to 2 cm, labelled at least every 2 cm ; 3 correct plotting of all six points using small crosses or dots in circles ; 4 six plots joined with thin line passing through all points and line is either smooth curve or joined plot to plot ; 1(b)(ii) 1 shows on y-axis reading taken at 10 g ; 2 2 correct reading according to candidate’s graph ; 1(b)(iii) 1 ref. to changes to shape of active site ; 2 2 idea of fewer, ESCs / yeast enzymes, unable to bind to substrate ; 1(b)(iv) copper will, reduce growth of yeast / reduce fermentation ; 1
Q2 · J1 is a slide of a stained transverse section through a plant stem
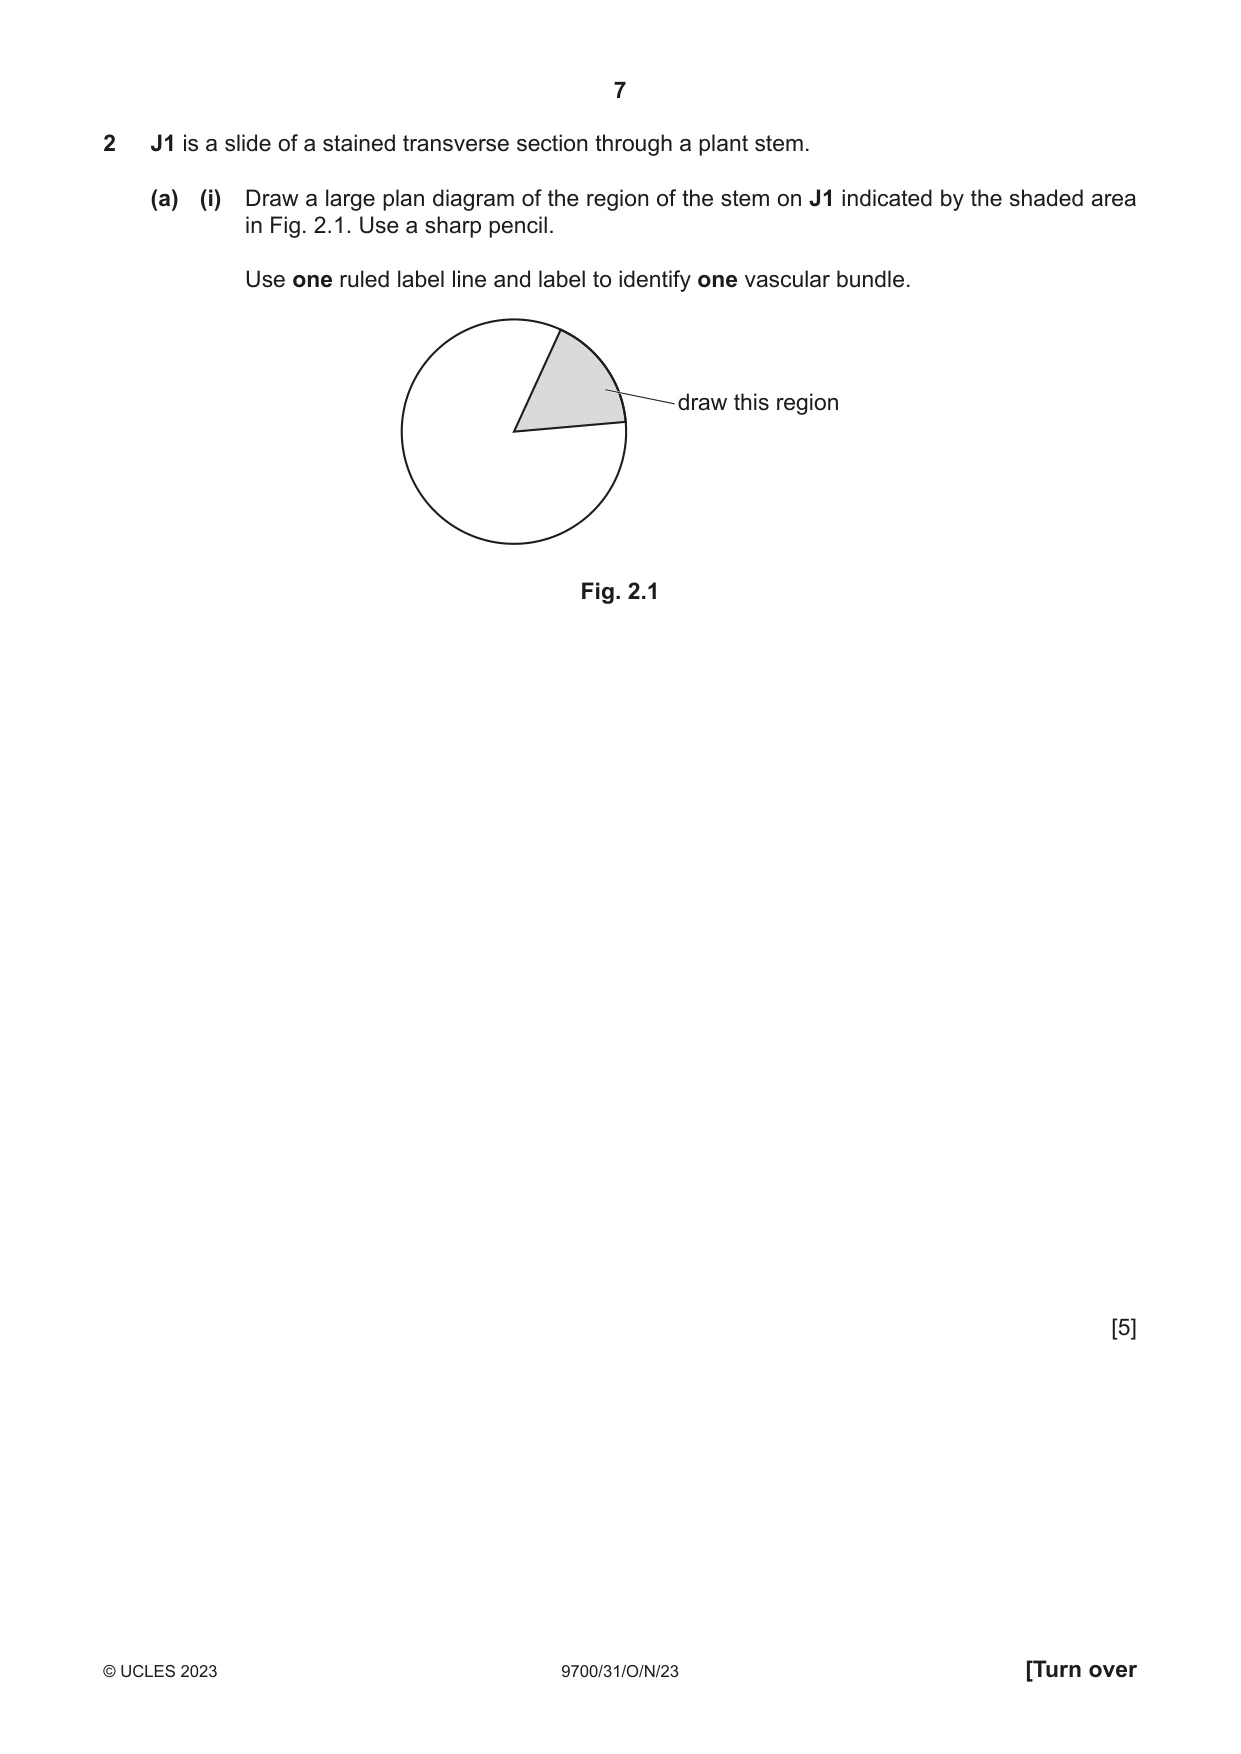
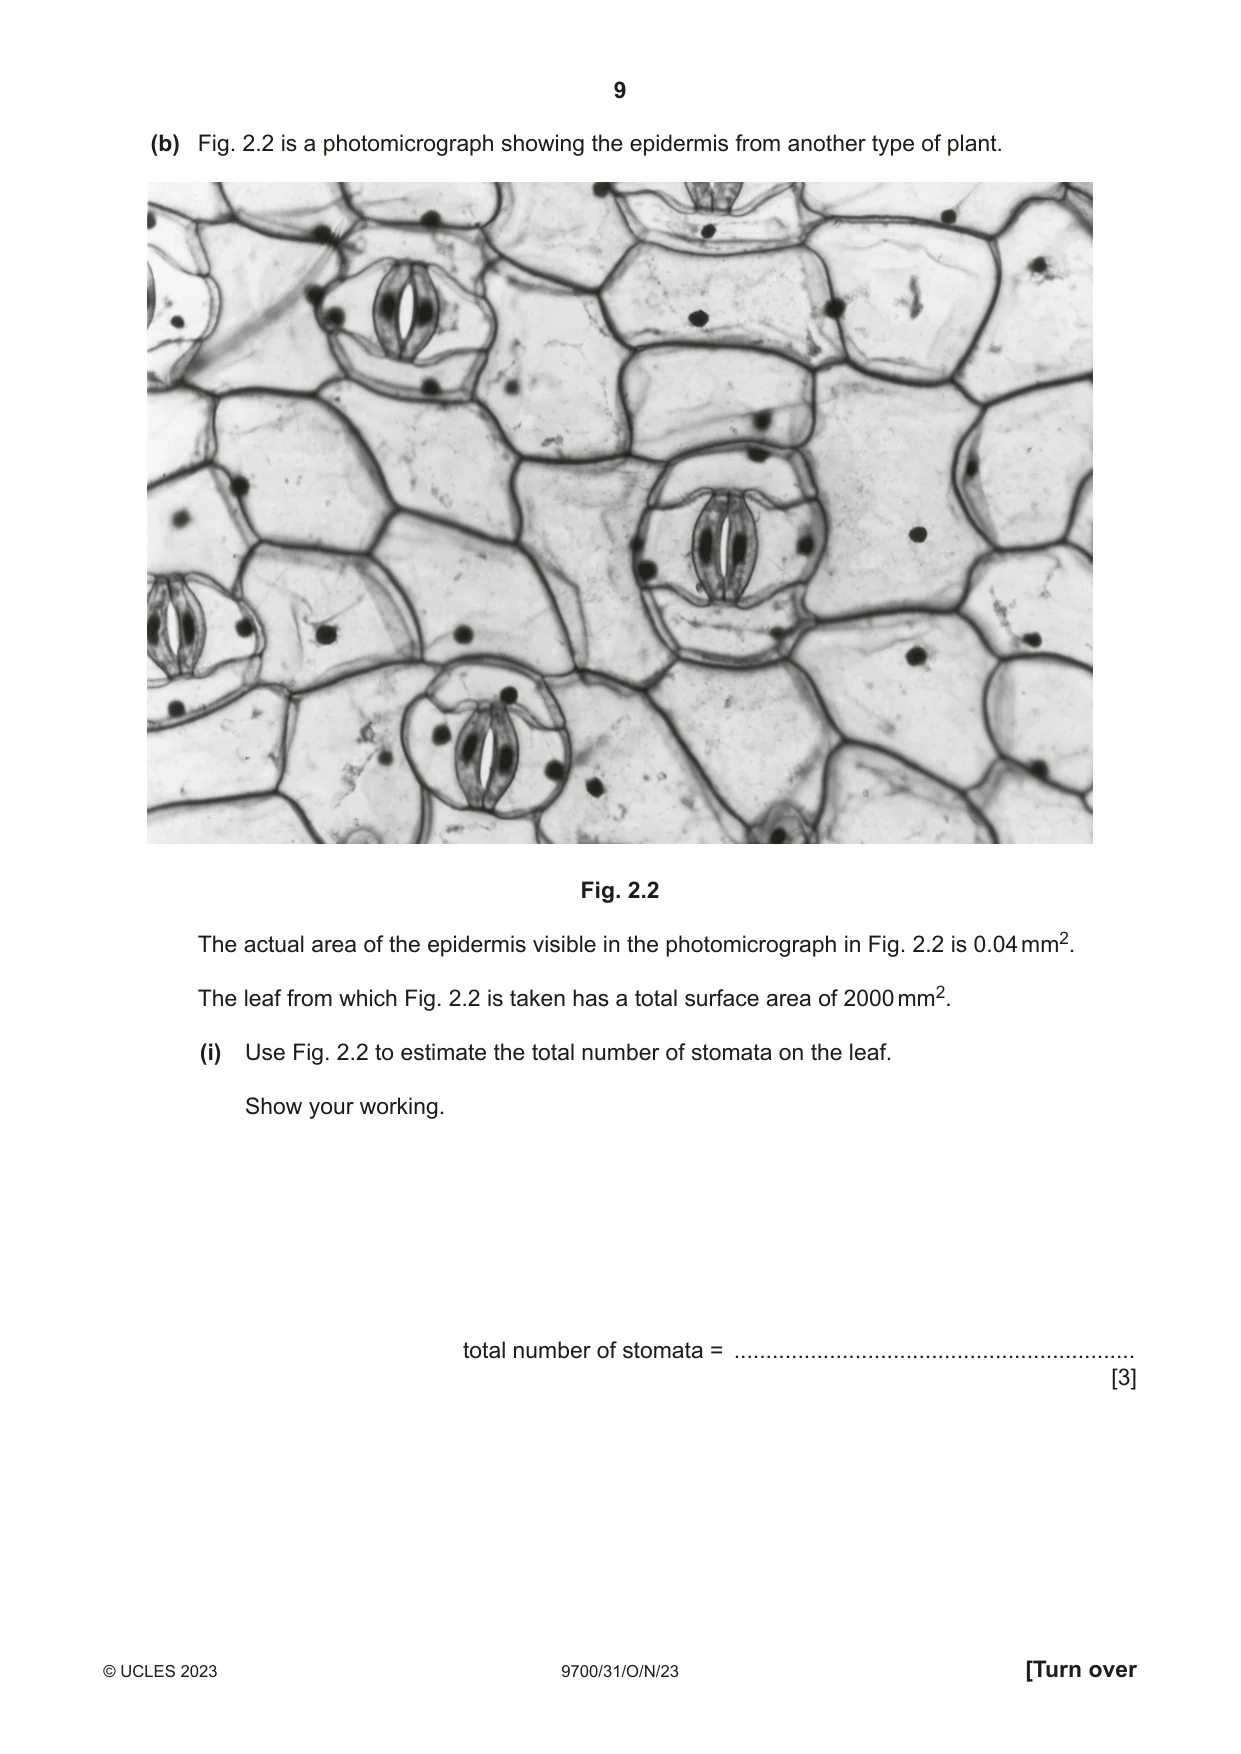
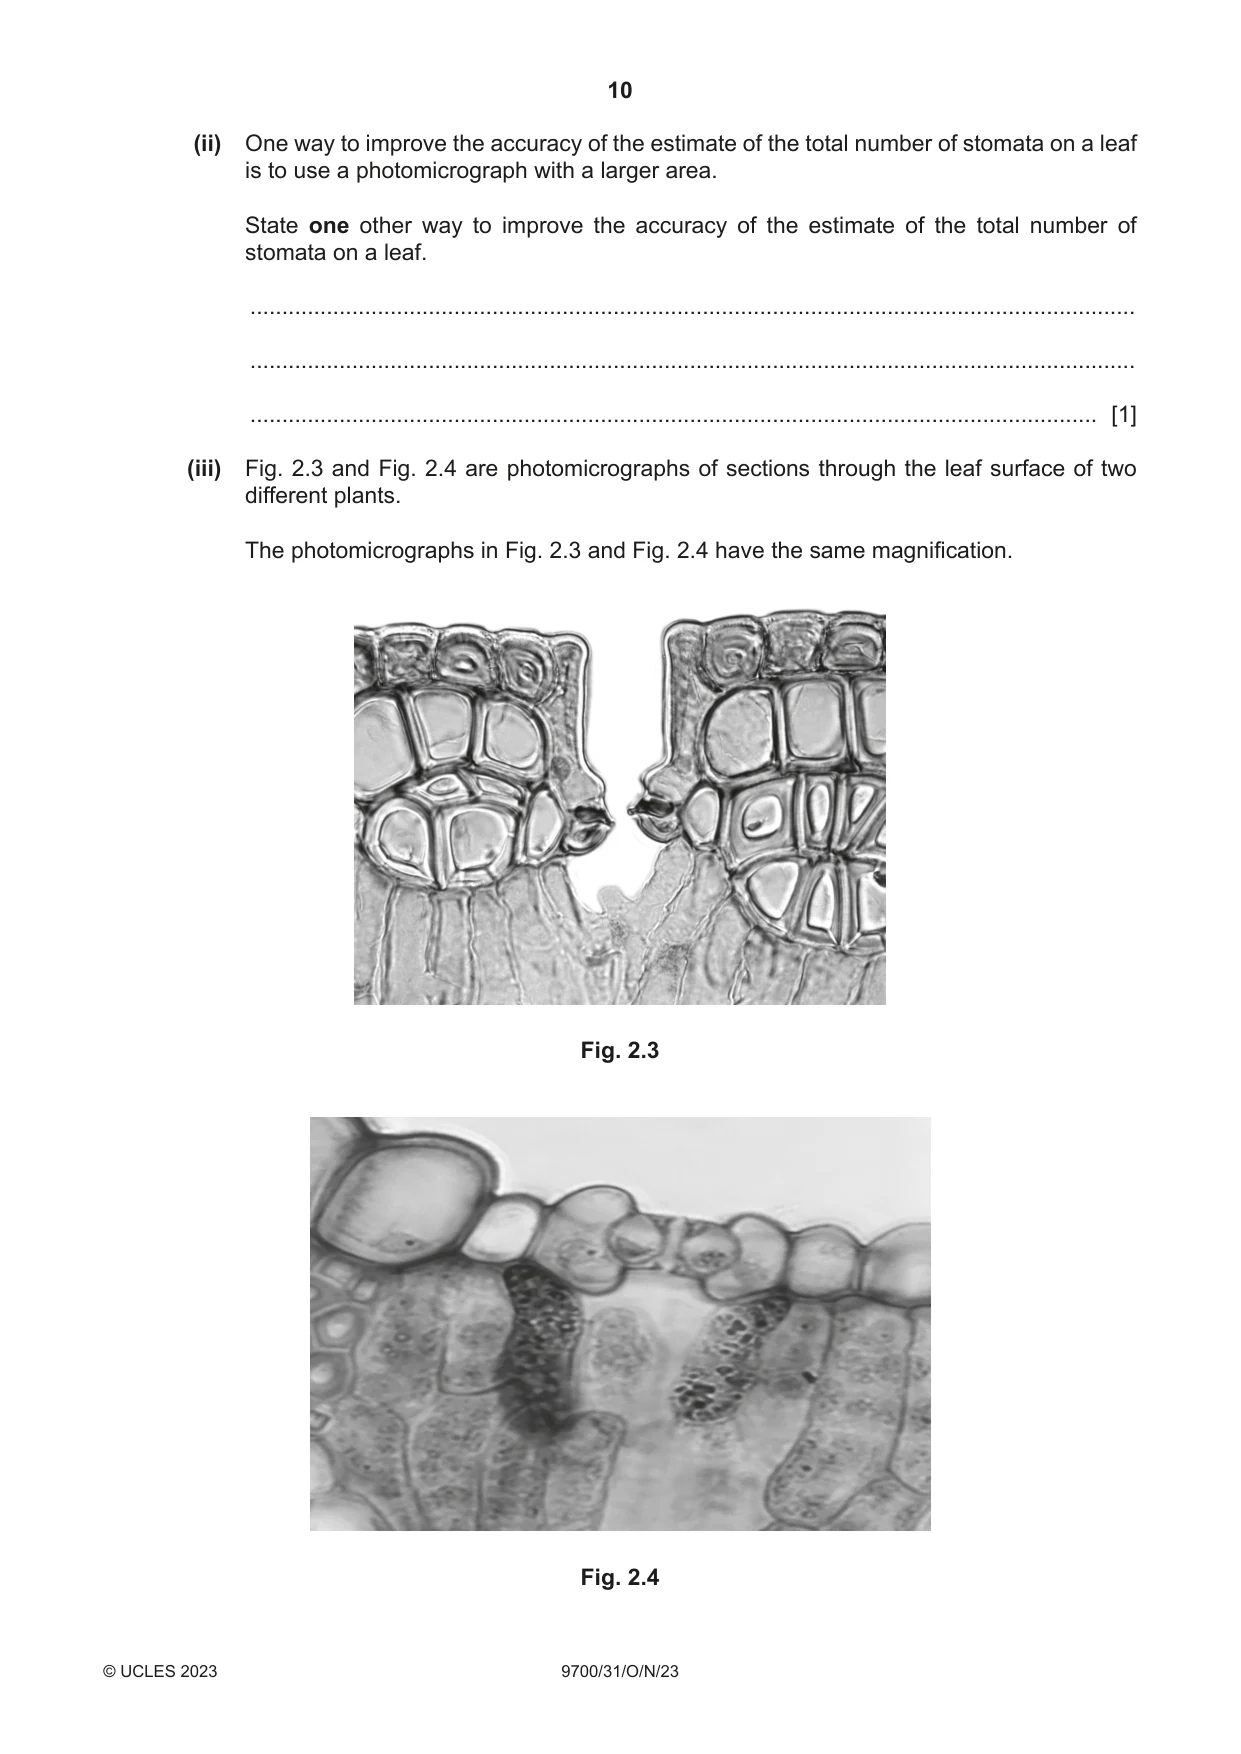
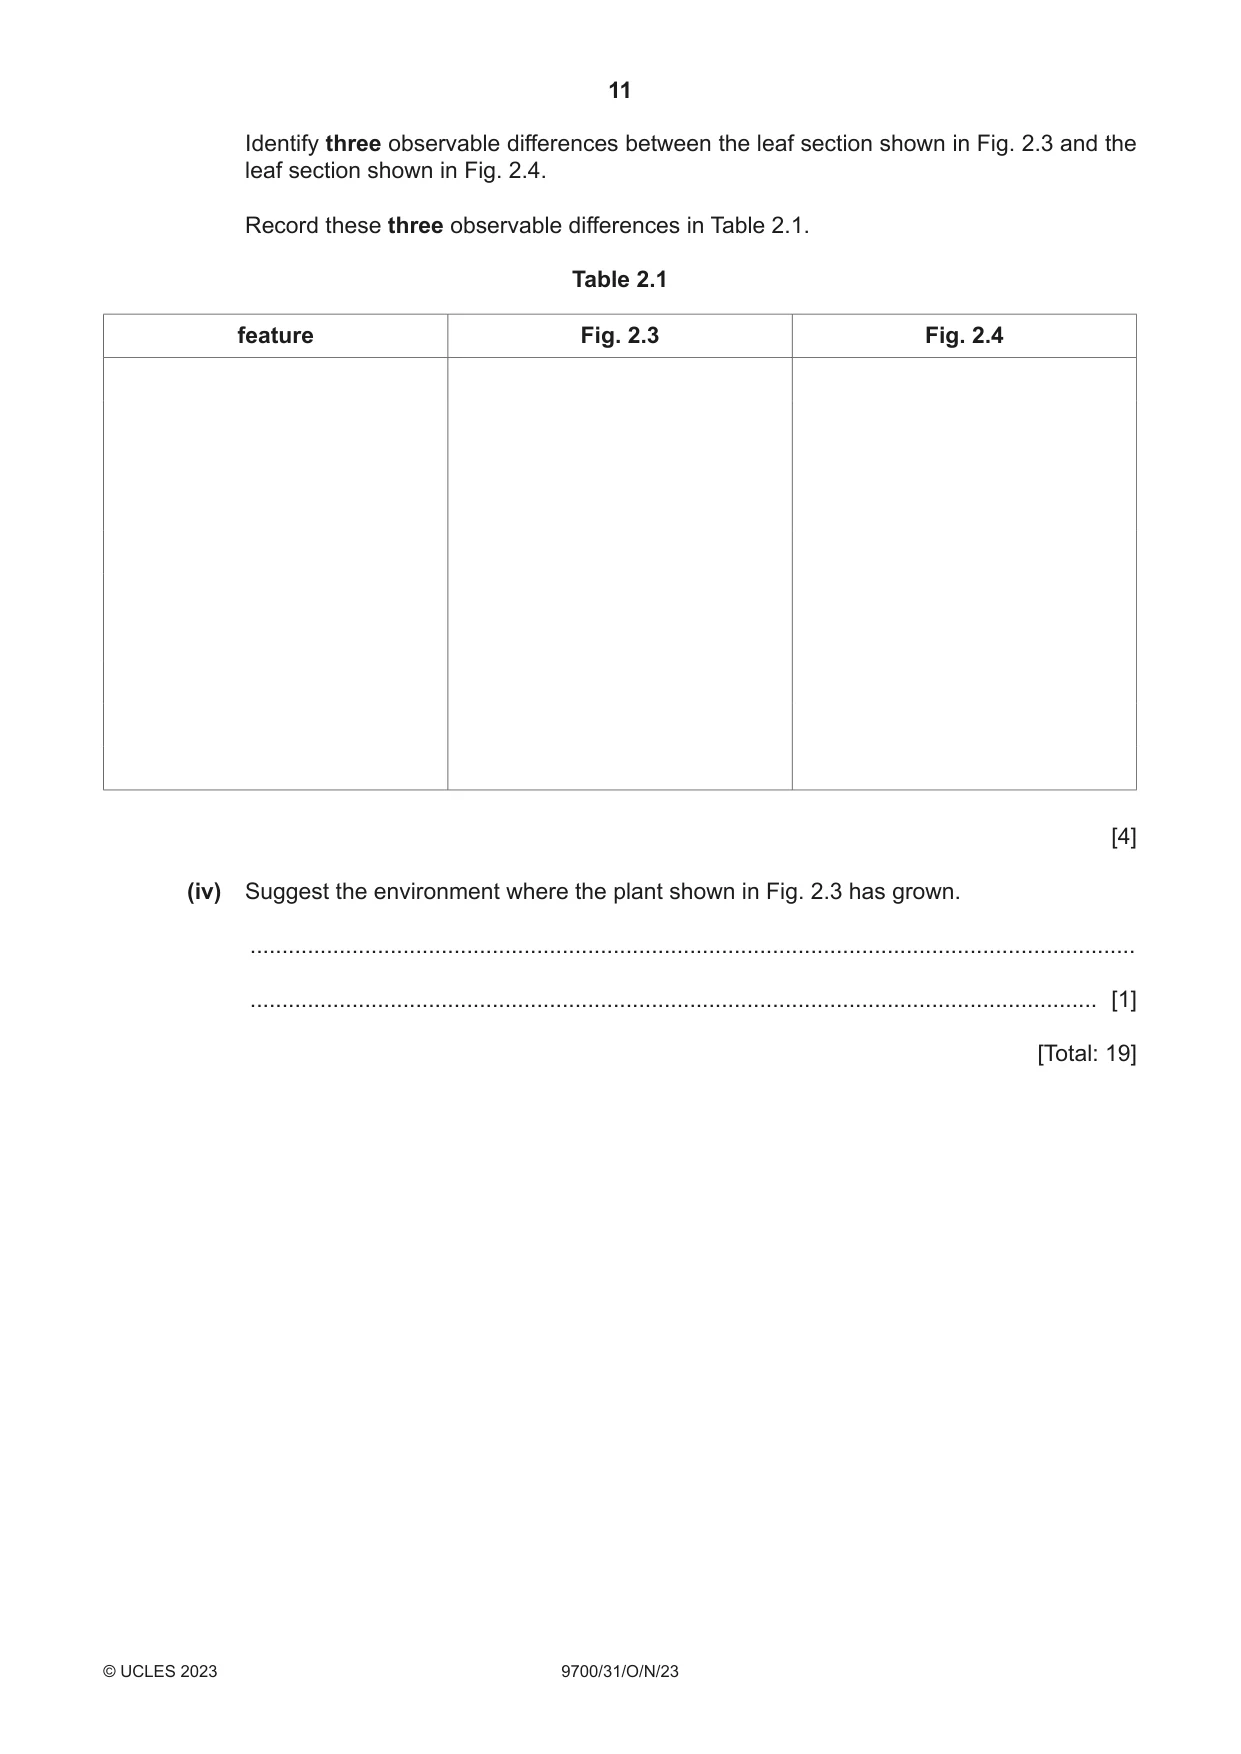
2 J1 is a slide of a stained transverse section through a plant stem. (a) (i) Draw a large plan diagram of the region of the stem on J1 indicated by the shaded area in Fig. 2.1. Use a sharp pencil. Use one ruled label line and label to identify one vascular bundle. draw this region Fig. 2.1 [5] (ii) Observe one vascular bundle of the section on J1. Select one large xylem vessel element and a group of three adjacent, smaller xylem vessel elements. • Make a large drawing of this group of four xylem vessel elements. • Use one ruled label line and label to identify the cell wall. [5] (b) Fig. 2.2 is a photomicrograph showing the epidermis from another type of plant. Fig. 2.2 The actual area of the epidermis visible in the photomicrograph in Fig. 2.2 is 0.04 mm2. The leaf from which Fig. 2.2 is taken has a total surface area of 2000 mm2. (i) Use Fig. 2.2 to estimate the total number of stomata on the leaf. Show your working. total number of stomata = ............................................................... [3]
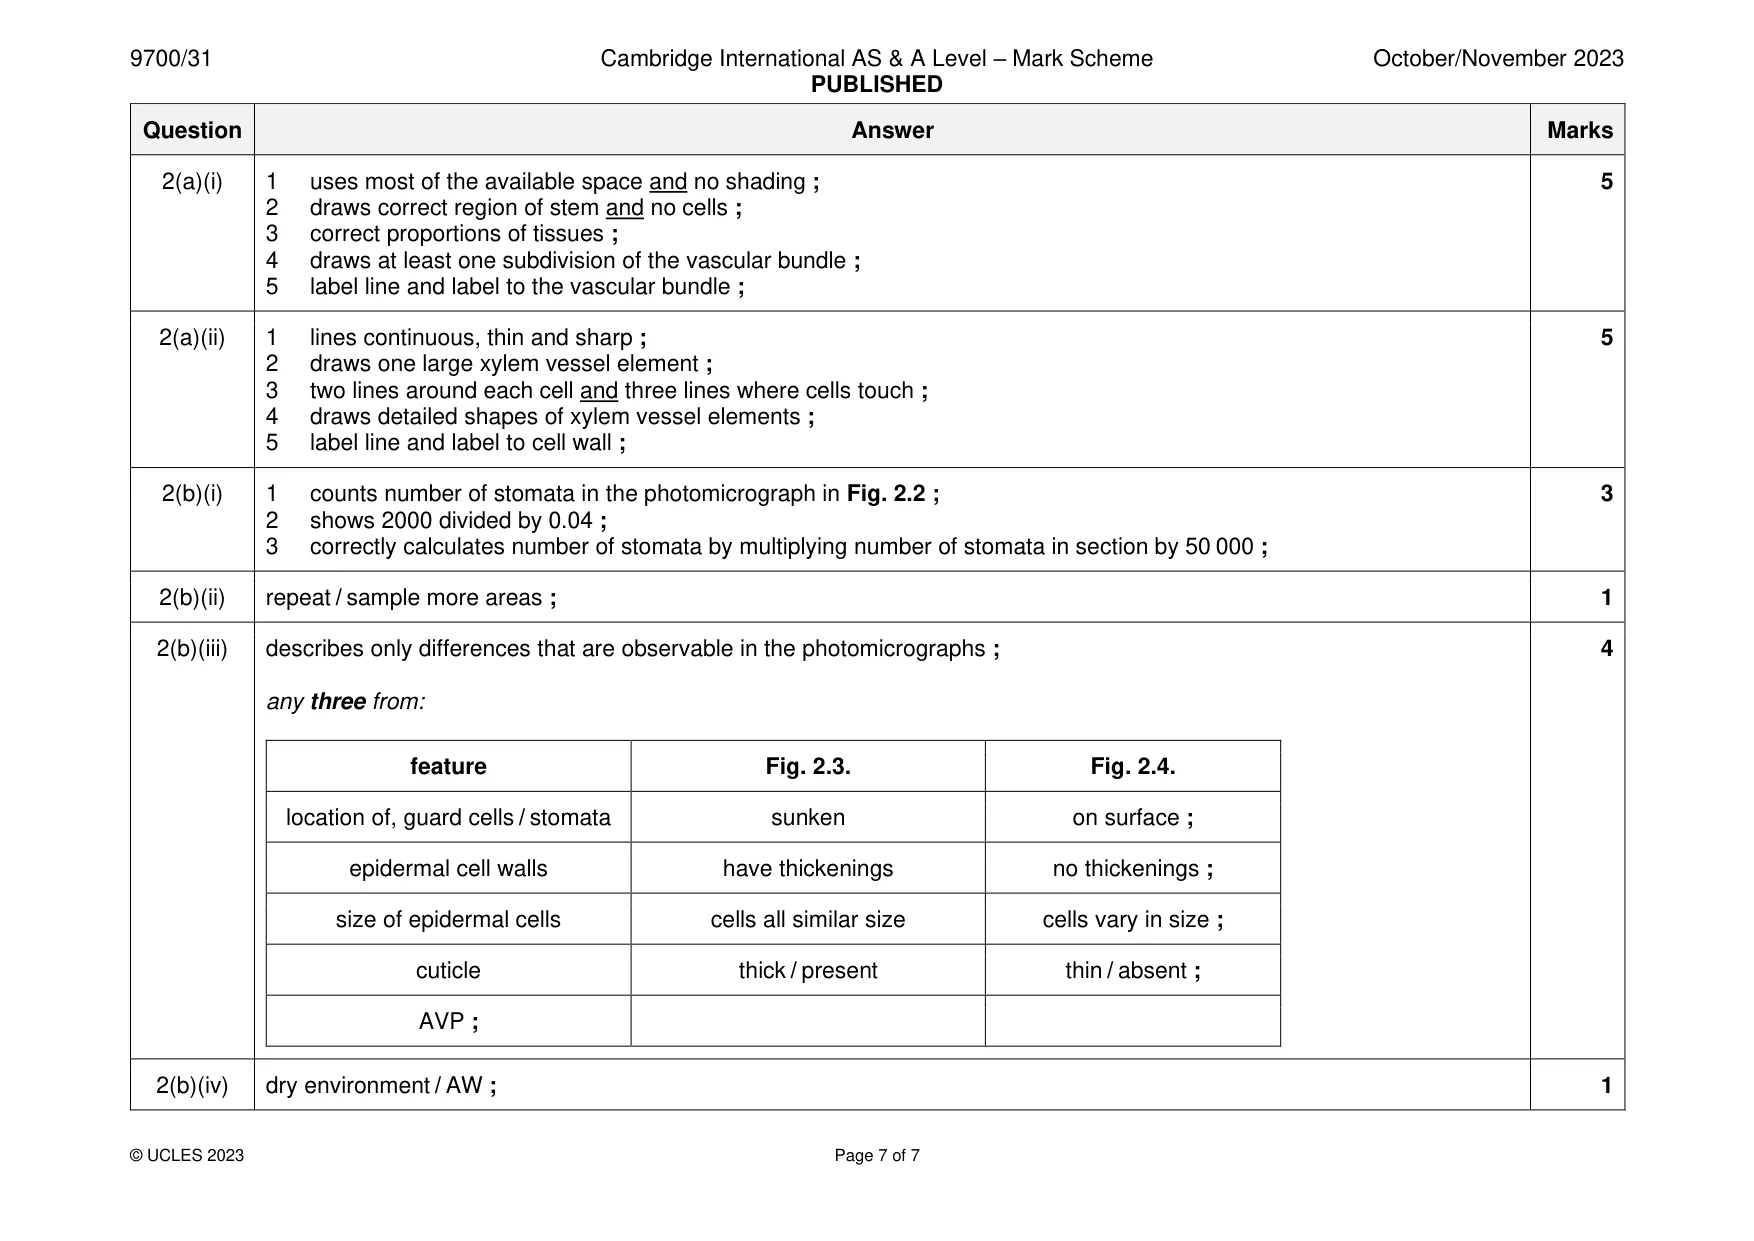
Mark scheme: 2(a)(i) 1 uses most of the available space and no shading ; 5 2 draws correct region of stem and no cells ; 3 correct proportions of tissues ; 4 draws at least one subdivision of the vascular bundle ; 5 label line and label to the vascular bundle ; 2(a)(ii) 1 lines continuous, thin and sharp ; 5 2 draws one large xylem vessel element ; 3 two lines around each cell and three lines where cells touch ; 4 draws detailed shapes of xylem vessel elements ; 5 label line and label to cell wall ; 2(b)(i) 1 counts number of stomata in the photomicrograph in Fig. 2.2 ; 3 2 shows 2000 divided by 0.04 ; 3 correctly calculates number of stomata by multiplying number of stomata in section by 50 000 ; 2(b)(ii) repeat / sample more areas ; 1 2(b)(iii) describes only differences that are observable in the photomicrographs ; 4 any three from: feature Fig. 2.3. Fig. 2.4. location of, guard cells / stomata sunken on surface ; epidermal cell walls have thickenings no thickenings ; size of epidermal cells cells all similar size cells vary in size ; cuticle thick / present thin / absent ; AVP ; 2(b)(iv) dry environment / AW ; 1
What was in this paper
The subtopics covered by these 2 questions, and how many questions each got. Open one in a new tab to see every Cambridge question on it.
What you needed in this session
Cambridge’s own grade thresholds for 2023 Oct/Nov, Paper 3 · Variant 1. A higher threshold means an easier paper — the bar moves with how the cohort did.