Cambridge A Level Biology 9700 — 2022 May/June Paper 5 · Variant 2
9700/52/M/J/22 · 2 questions · 30 marks · ≈34 min
The question paper and its mark scheme, free to read here and free to download. This is Cambridge’s own paper, exactly as it was sat.
Question paper16 pages



Mark scheme10 pages
Answers below. Sit the paper first if you are practising.
Questions as text
Question 1
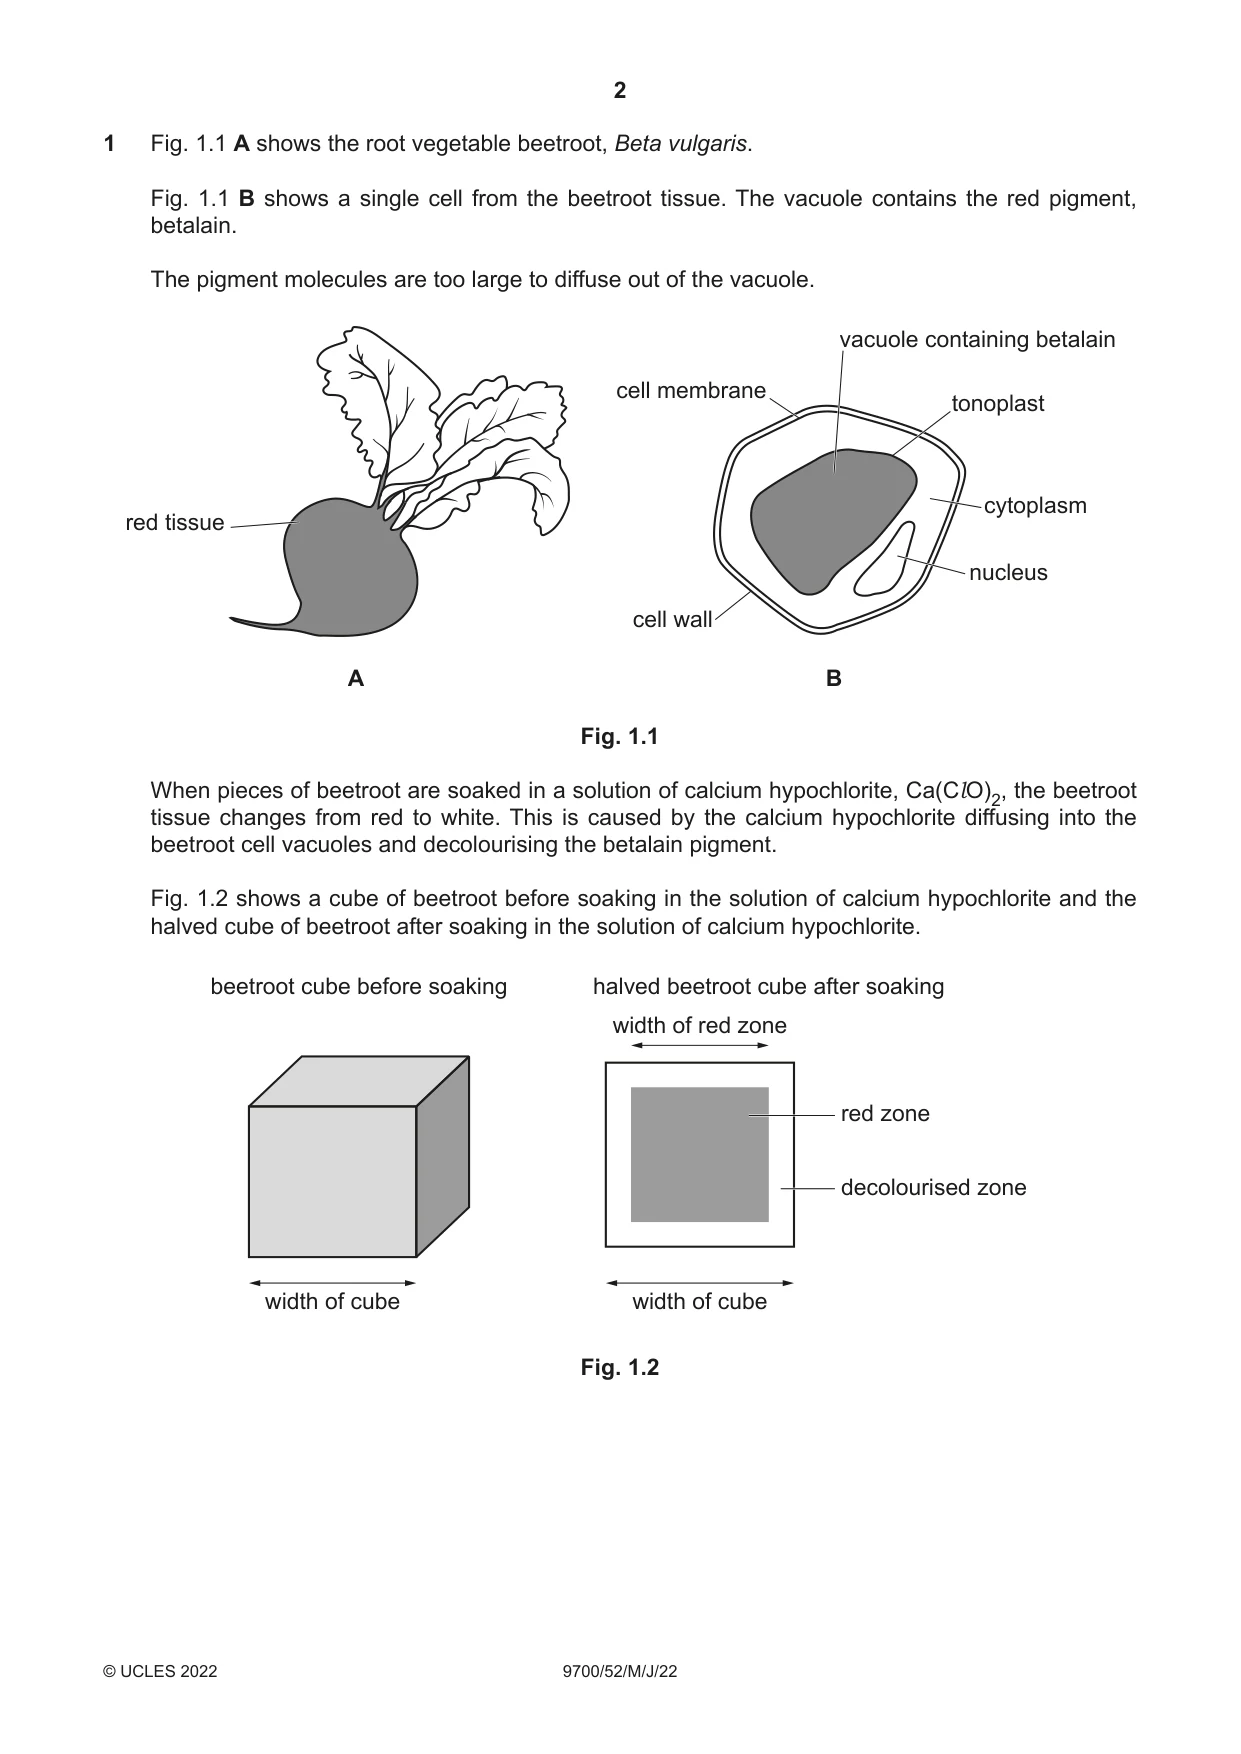
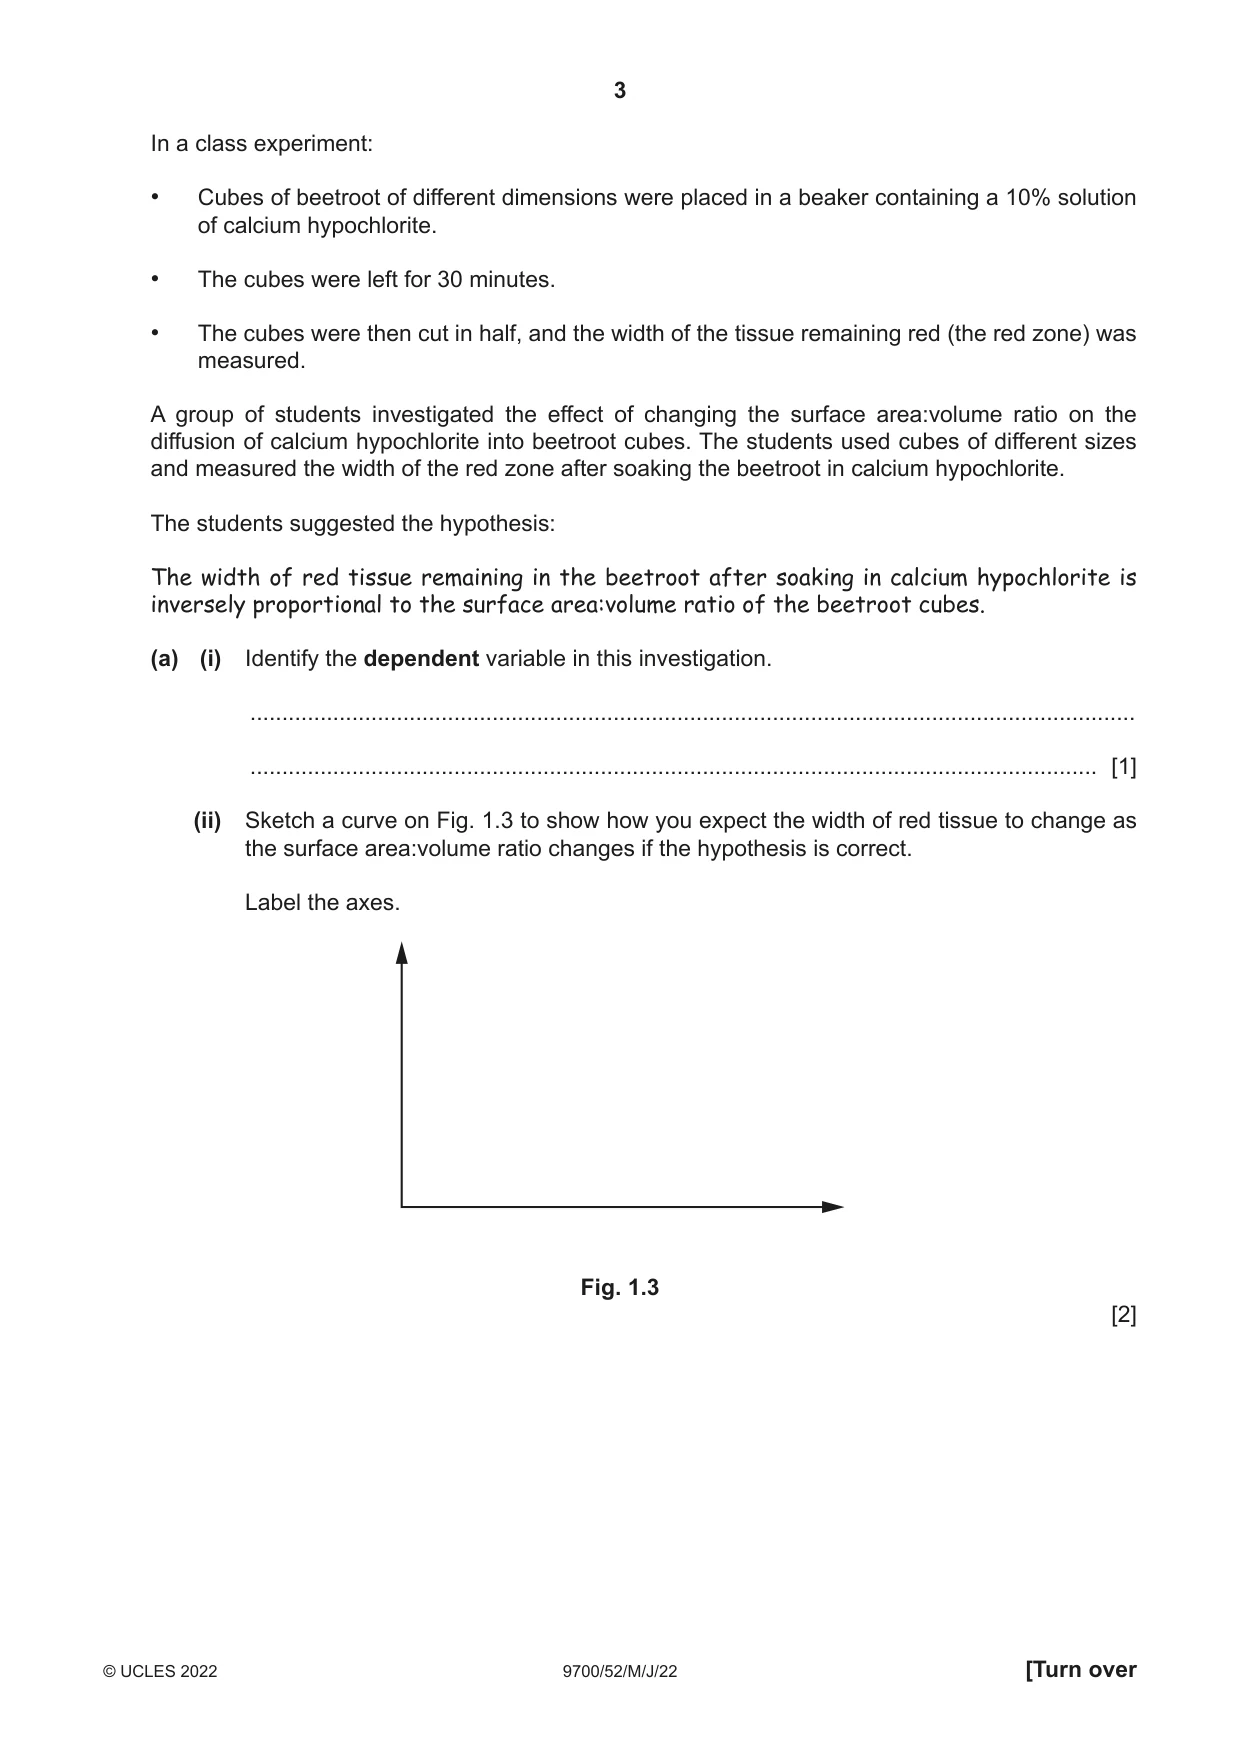
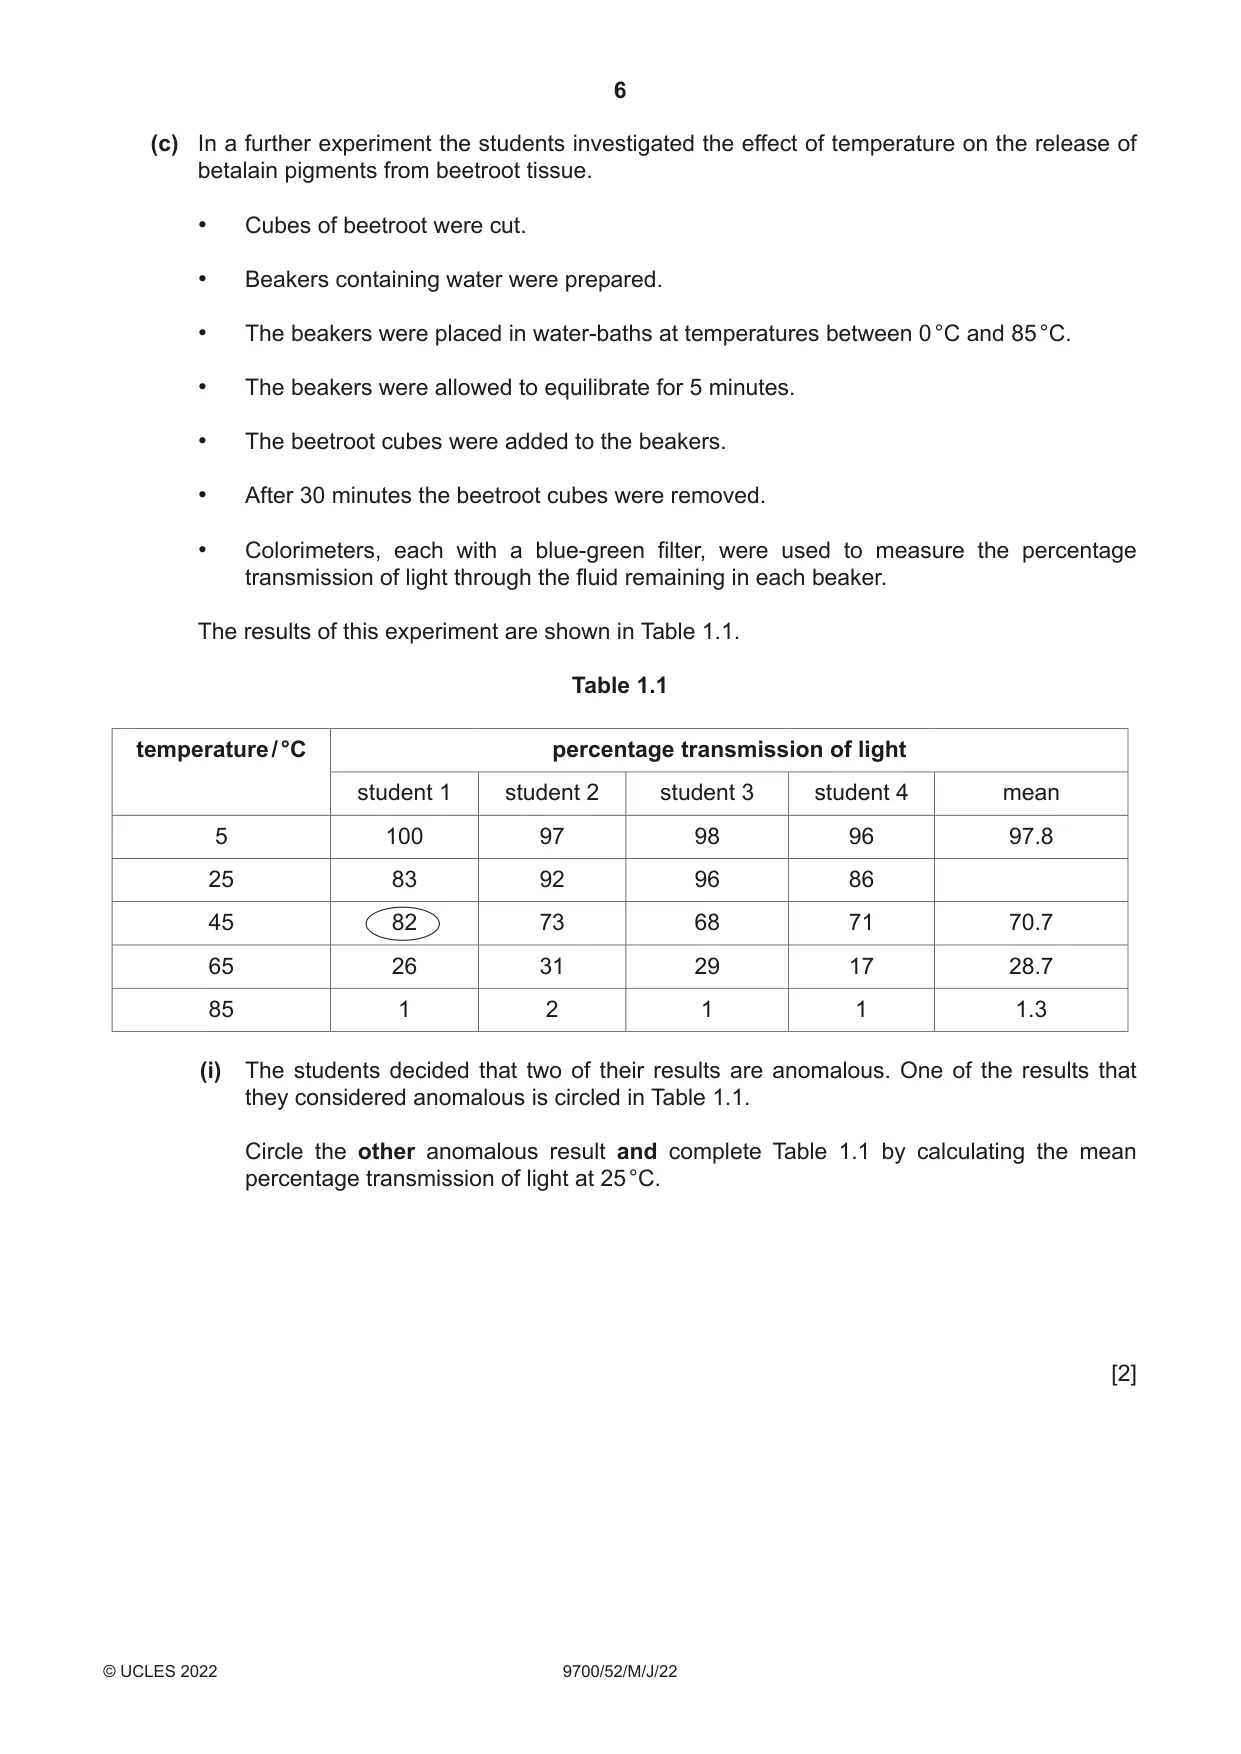
1 Fig. 1.1 A shows the root vegetable beetroot, Beta vulgaris. Fig. 1.1 B shows a single cell from the beetroot tissue. The vacuole contains the red pigment, betalain. The pigment molecules are too large to diffuse out of the vacuole. vacuole containing betalain cell membrane tonoplast cytoplasm red tissue nucleus cell wall A B Fig. 1.1 When pieces of beetroot are soaked in a solution of calcium hypochlorite, Ca(ClO)2, the beetroot tissue changes from red to white. This is caused by the calcium hypochlorite diffusing into the beetroot cell vacuoles and decolourising the betalain pigment. Fig. 1.2 shows a cube of beetroot before soaking in the solution of calcium hypochlorite and the halved cube of beetroot after soaking in the solution of calcium hypochlorite. beetroot cube before soaking halved beetroot cube after soaking width of red zone red zone decolourised zone width of cube width of cube Fig. 1.2 In a class experiment: • Cubes of beetroot of different dimensions were placed in a beaker containing a 10% solution of calcium hypochlorite. • The cubes were left for 30 minutes. • The cubes were then cut in half, and the width of the tissue remaining red (the red zone) was measured. A group of students investigated the effect of changing the surface area:volume ratio on the diffusion of calcium hypochlorite into beetroot cubes. The students used cubes of different sizes and measured the width of the red zone after soaking the beetroot in calcium hypochlorite. The students suggested the hypothesis: The width of red tissue remaining in the beetroot after soaking in calcium hypochlorite is inversely proportional to the surface area:volume ratio of the beetroot cubes. (a) (i) Identify the dependent variable in this investigation. ........................................................................................................................................... ..................................................................................................................................... [1] (ii) Sketch a curve on Fig. 1.3 to show how you expect the width of red tissue to change as the surface area:volume ratio changes if the hypothesis is correct. Label the axes. Fig. 1.3 [2] (b) (i) Describe a method the students could use to collect the data needed to test their hypothesis. The students were provided with beetroot tissue, a 10% calcium hypochlorite solution and standard laboratory equipment. Your method should be set out in a logical order and be detailed enough to let another person follow it. ........................................................................................................................................... ........................................................................................................................................... ........................................................................................................................................... ........................................................................................................................................... ........................................................................................................................................... ........................................................................................................................................... ........................................................................................................................................... ........................................................................................................................................... ........................................................................................................................................... ........................................................................................................................................... ........................................................................................................................................... ........................................................................................................................................... ........................................................................................................................................... ........................................................................................................................................... ........................................................................................................................................... ........................................................................................................................................... ........................................................................................................................................... ........................................................................................................................................... ........................................................................................................................................... ........................................................................................................................................... ........................................................................................................................................... ........................................................................................................................................... ..................................................................................................................................... [7] (ii) The students decided to calculate the percentage change in volume of the red tissue in each cube. State how the students could calculate the percentage change in volume of the red tissue in each cube. ........................................................................................................................................... ........................................................................................................................................... ........................................................................................................................................... ........................................................................................................................................... ..................................................................................................................................... [2] (c) In a further experiment the students investigated the effect of temperature on the release of betalain pigments from beetroot tissue. • Cubes of beetroot were cut. • Beakers containing water were prepared. • The beakers were placed in water-baths at temperatures between 0 °C and 85 °C. • The beakers were allowed to equilibrate for 5 minutes. • The beetroot cubes were added to the beakers. • After 30 minutes the beetroot cubes were removed. • Colorimeters, each with a blue-green filter, were used to measure the percentage transmission of light through the fluid remaining in each beaker. The results of this experiment are shown in Table 1.1. Table 1.1 temperature / °C percentage transmission of light student 1 student 2 student 3 student 4 mean 5 100 97 98 96 97.8 25 83 92 96 86 45 82 73 68 71 70.7 65 26 31 29 17 28.7 85 1 2 1 1 1.3 (i) The students decided that two of their results are anomalous. One of the results that they considered anomalous is circled in Table 1.1. Circle the other anomalous result and complete Table 1.1 by calculating the mean percentage transmission of light at 25 °C. [2] (ii) Describe two ways in which the method described in (c) could have been improved to give better repeatability between the results of the different students. ........................................................................................................................................... ........................................................................................................................................... ........................................................................................................................................... ........................................................................................................................................... ........................................................................................................................................... ........................................................................................................................................... ..................................................................................................................................... [2] (iii) With reference to the data in Table 1.1, state and explain the effect that increasing temperature has on the release of betalain from beetroot tissue. ........................................................................................................................................... ........................................................................................................................................... ........................................................................................................................................... ........................................................................................................................................... ..................................................................................................................................... [2] [Total: 18]
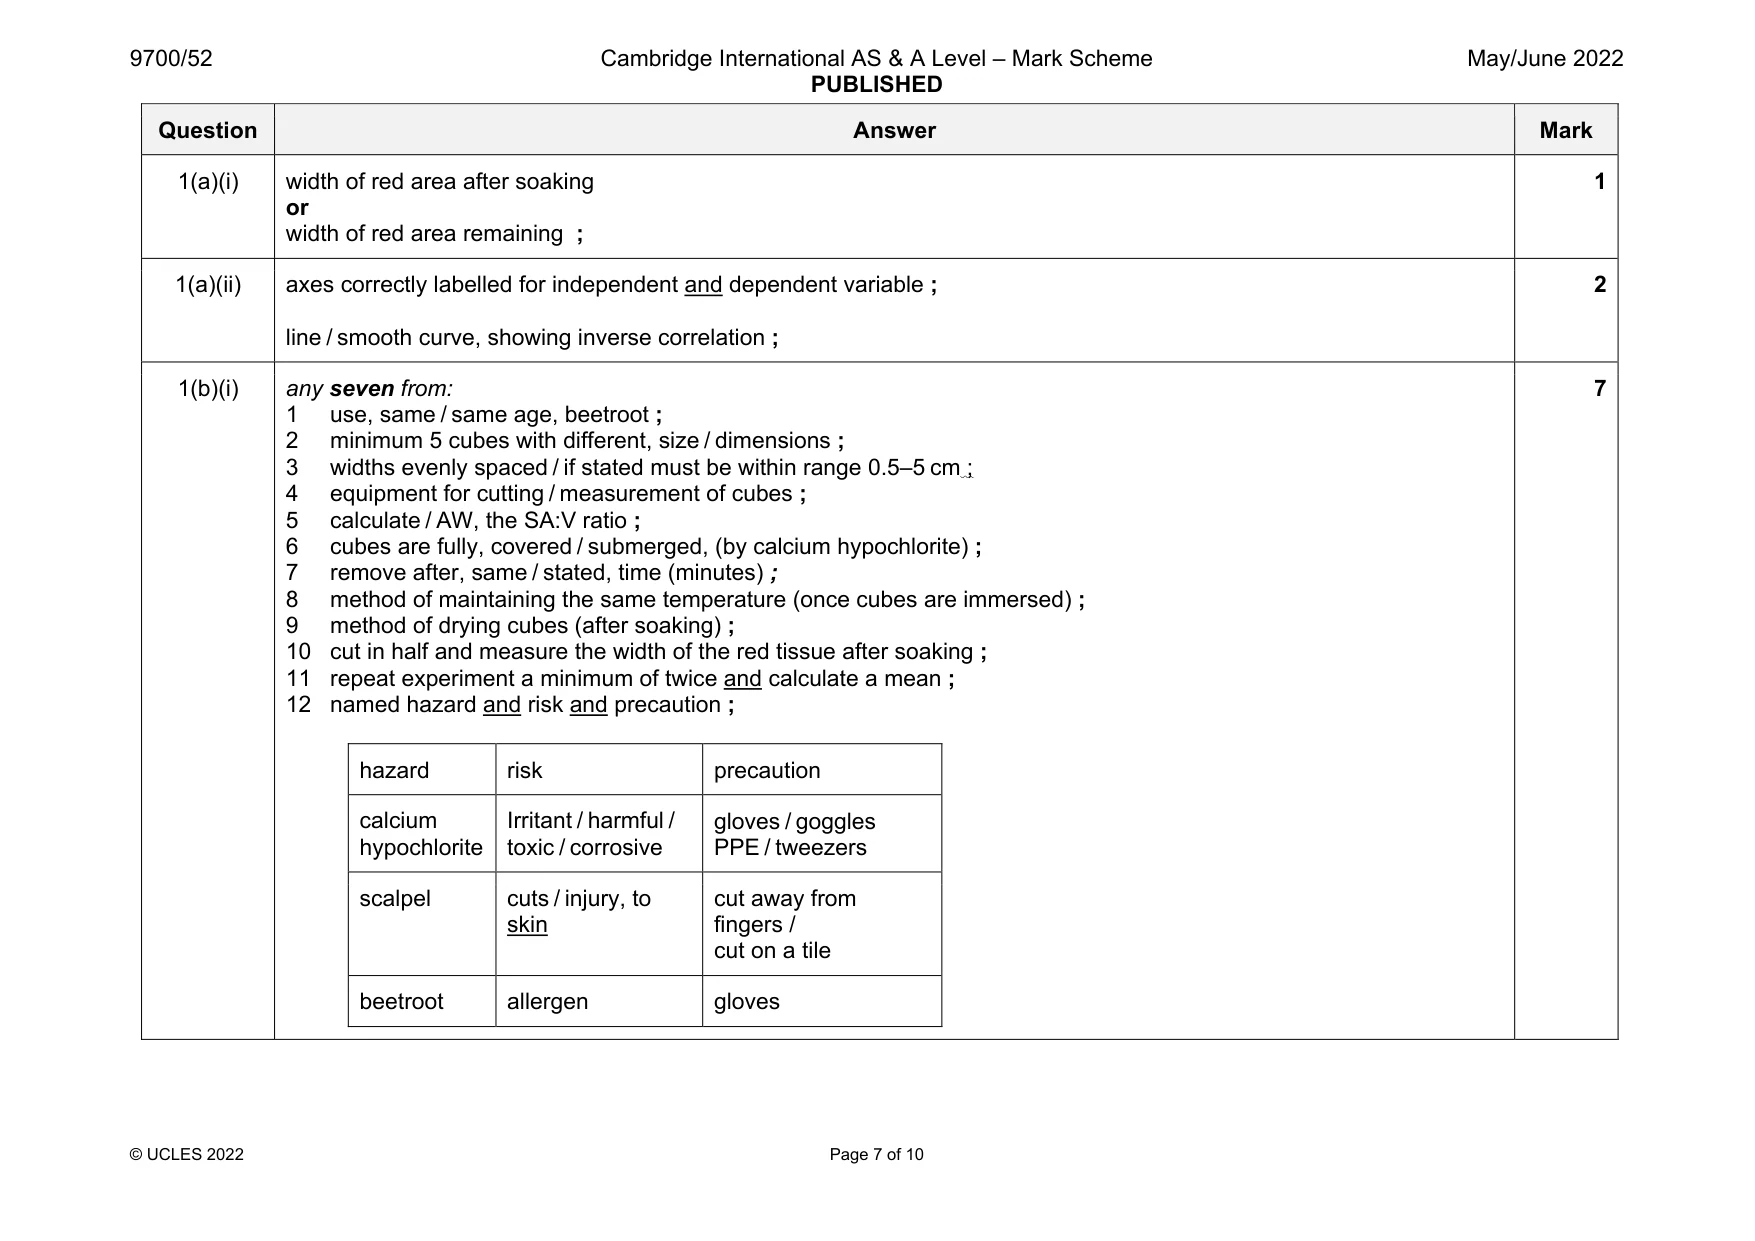
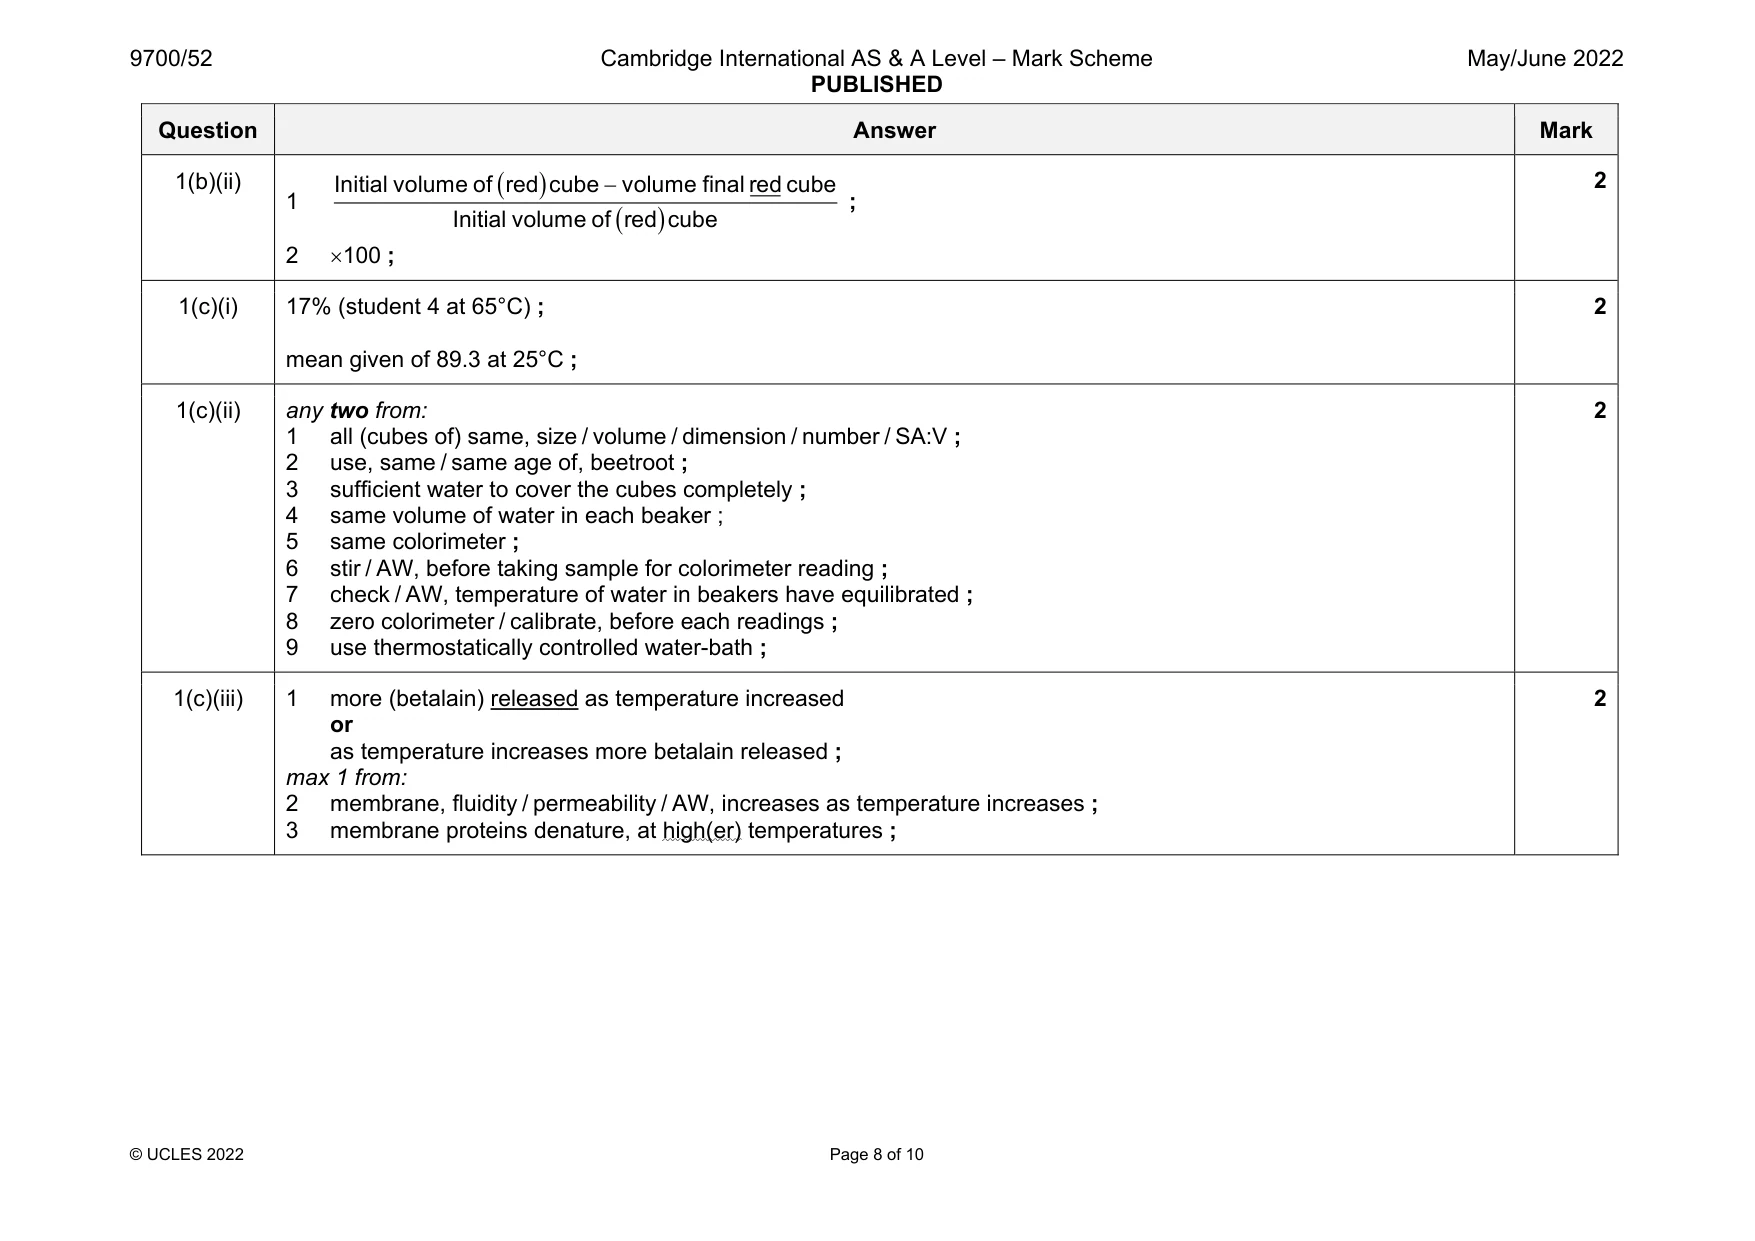
Mark scheme: 1(a)(i) width of red area after soaking or width of red area remaining ; 1 1(a)(ii) axes correctly labelled for independent and dependent variable ; line / smooth curve, showing inverse correlation ; 2 1(b)(i) any seven from: 1 use, same / same age, beetroot ; 2 minimum 5 cubes with different, size / dimensions ; 3 widths evenly spaced / if stated must be within range 0.5–5 cm ; 4 equipment for cutting / measurement of cubes ; 5 calculate / AW, the SA:V ratio ; 6 cubes are fully, covered / submerged, (by calcium hypochlorite) ; 7 remove after, same / stated, time (minutes) ; 8 method of maintaining the same temperature (once cubes are immersed) ; 9 method of drying cubes (after soaking) ; 10 cut in half and measure the width of the red tissue after soaking ; 11 repeat experiment a minimum of twice and calculate a mean ; 12 named hazard and risk and precaution ; hazard risk precaution calcium hypochlorite Irritant / harmful / toxic / corrosive gloves / goggles PPE / tweezers scalpel cuts / injury, to skin cut away from fingers / cut on a tile beetroot allergen gloves 7 Question Answer Mark 1(b)(ii) 1 Initial volume of red cube volume final red cube Initial volume of red cube ; 2 100 ; 2 1(c)(i) 17% (student 4 at 65°C) ; mean given of 89.3 at 25°C ; 2 1(c)(ii) any two from: 1 all (cubes of) same, size / volume / dimension / number / SA:V ; 2 use, same / same age of, beetroot ; 3 sufficient water to cover the cubes completely ; 4 same volume of water in each beaker ; 5 same colorimeter ; 6 stir / AW, before taking sample for colorimeter reading ; 7 check / AW, temperature of water in beakers have equilibrated ; 8 zero colorimeter / calibrate, before each readings ; 9 use thermostatically controlled water-bath ; 2 1(c)(iii) 1 more (betalain) released as temperature increased or as temperature increases more betalain released ; max 1 from: 2 membrane, fluidity / permeability / AW, increases as temperature increases ; 3 membrane proteins denature, at high(er) temperatures ; 2
Q2 · The European badger, Meles meles, pictured in Fig
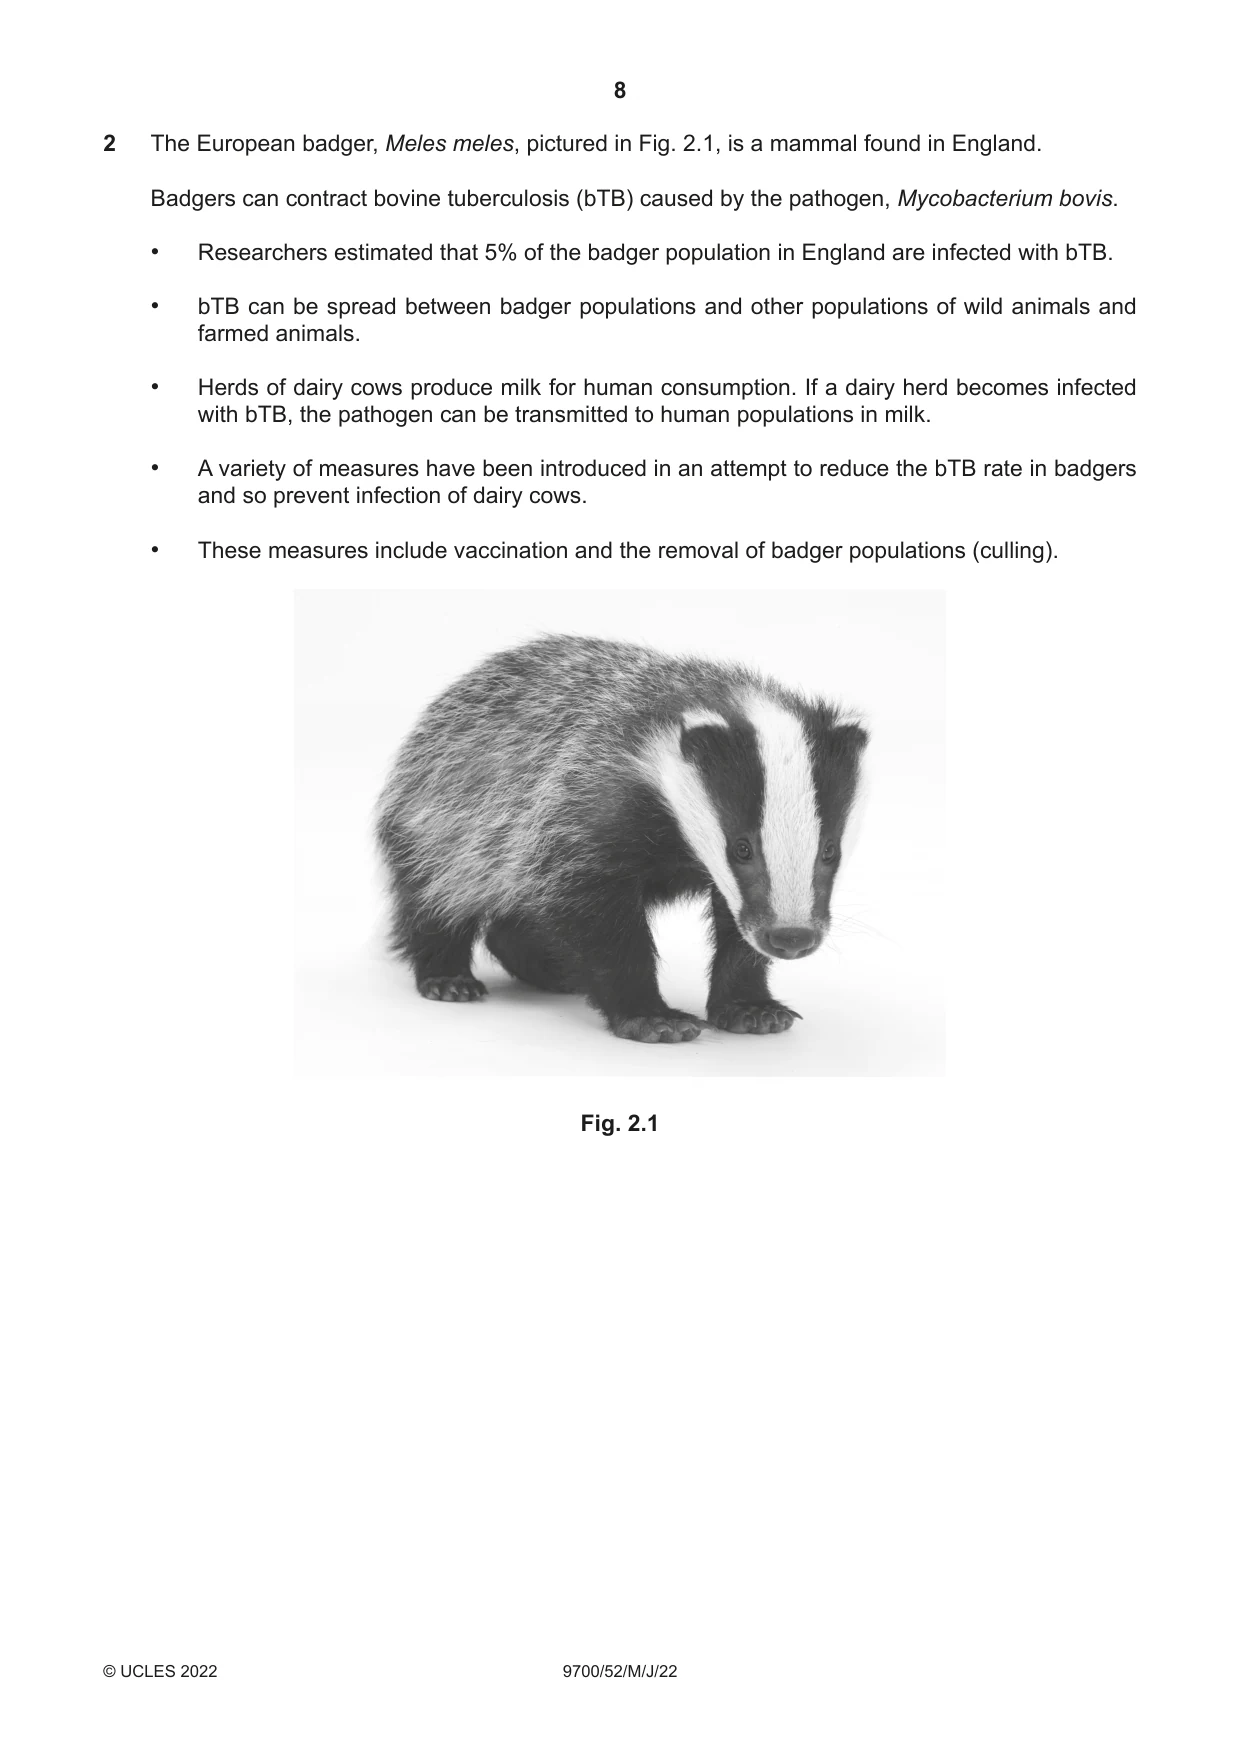
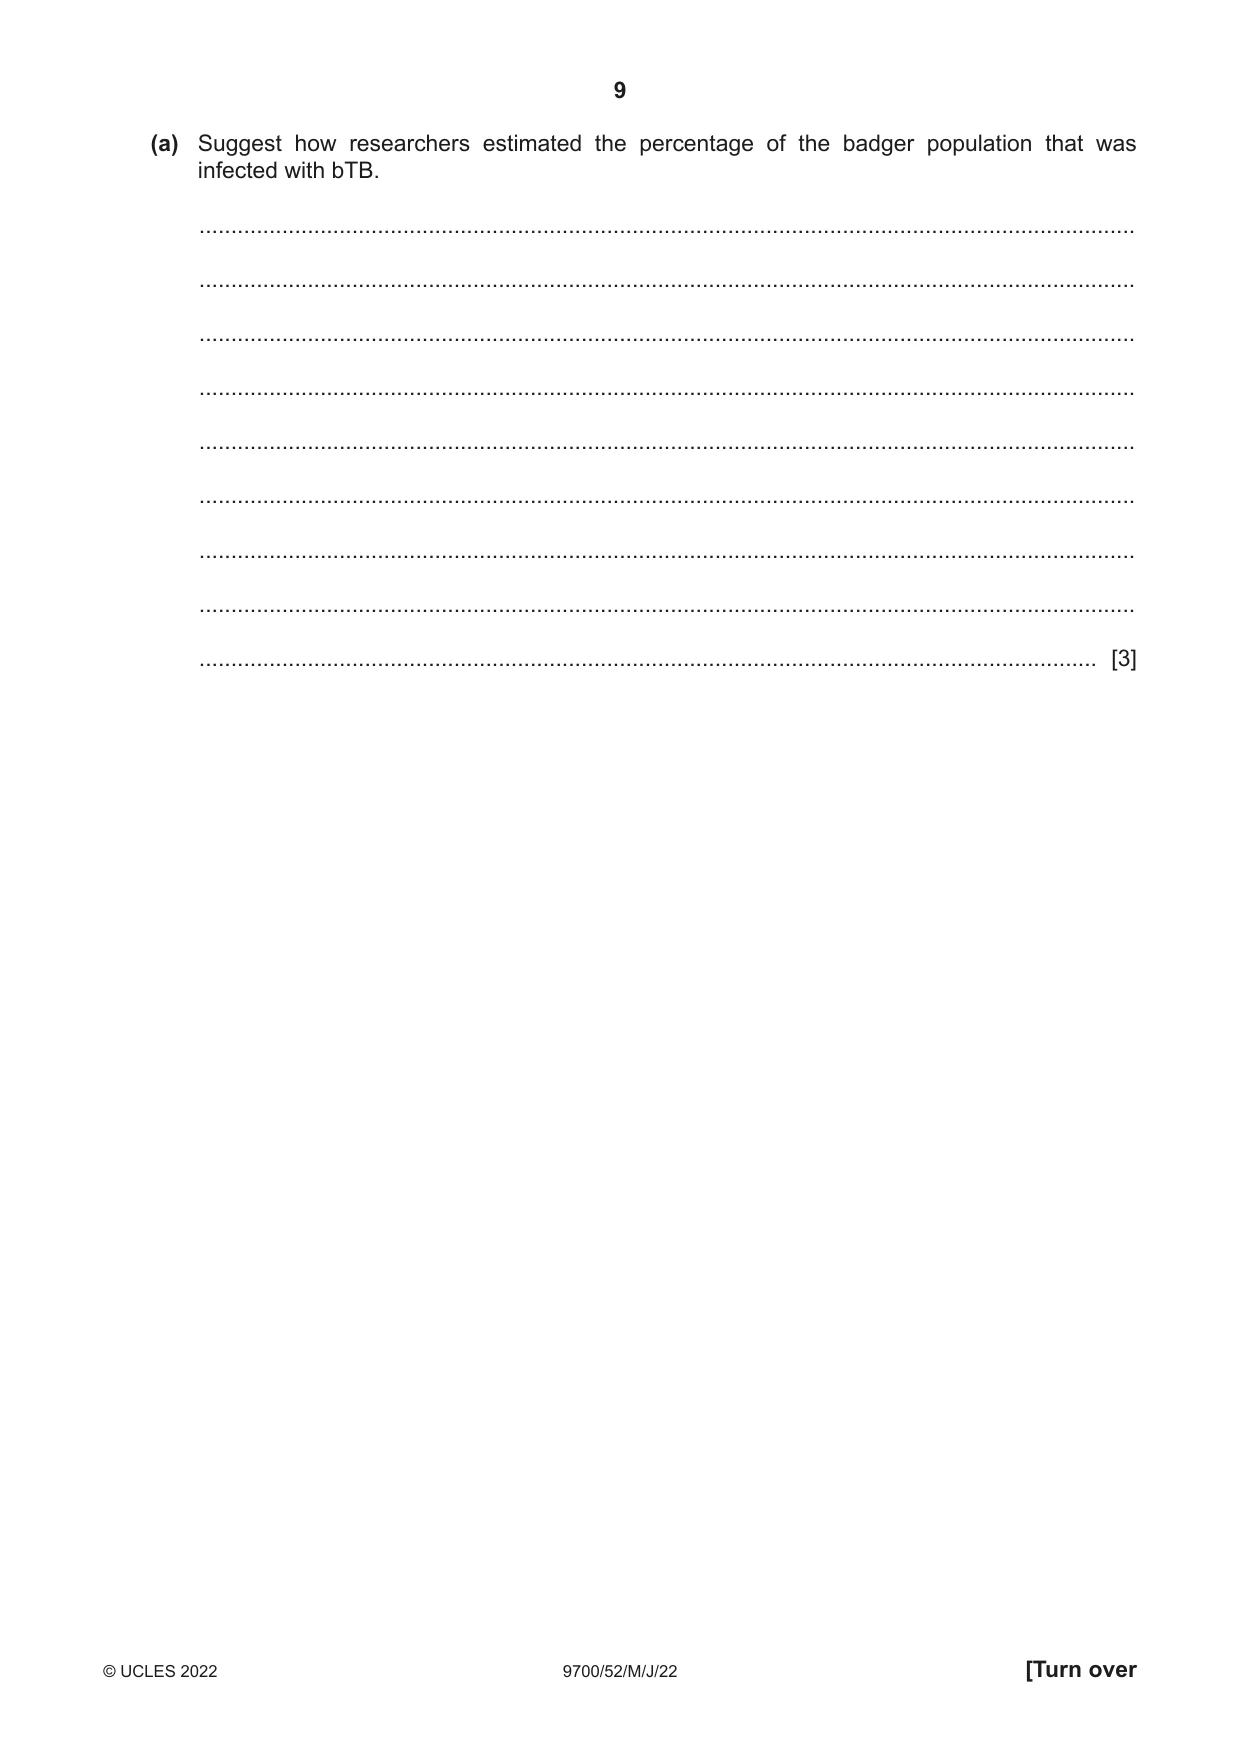
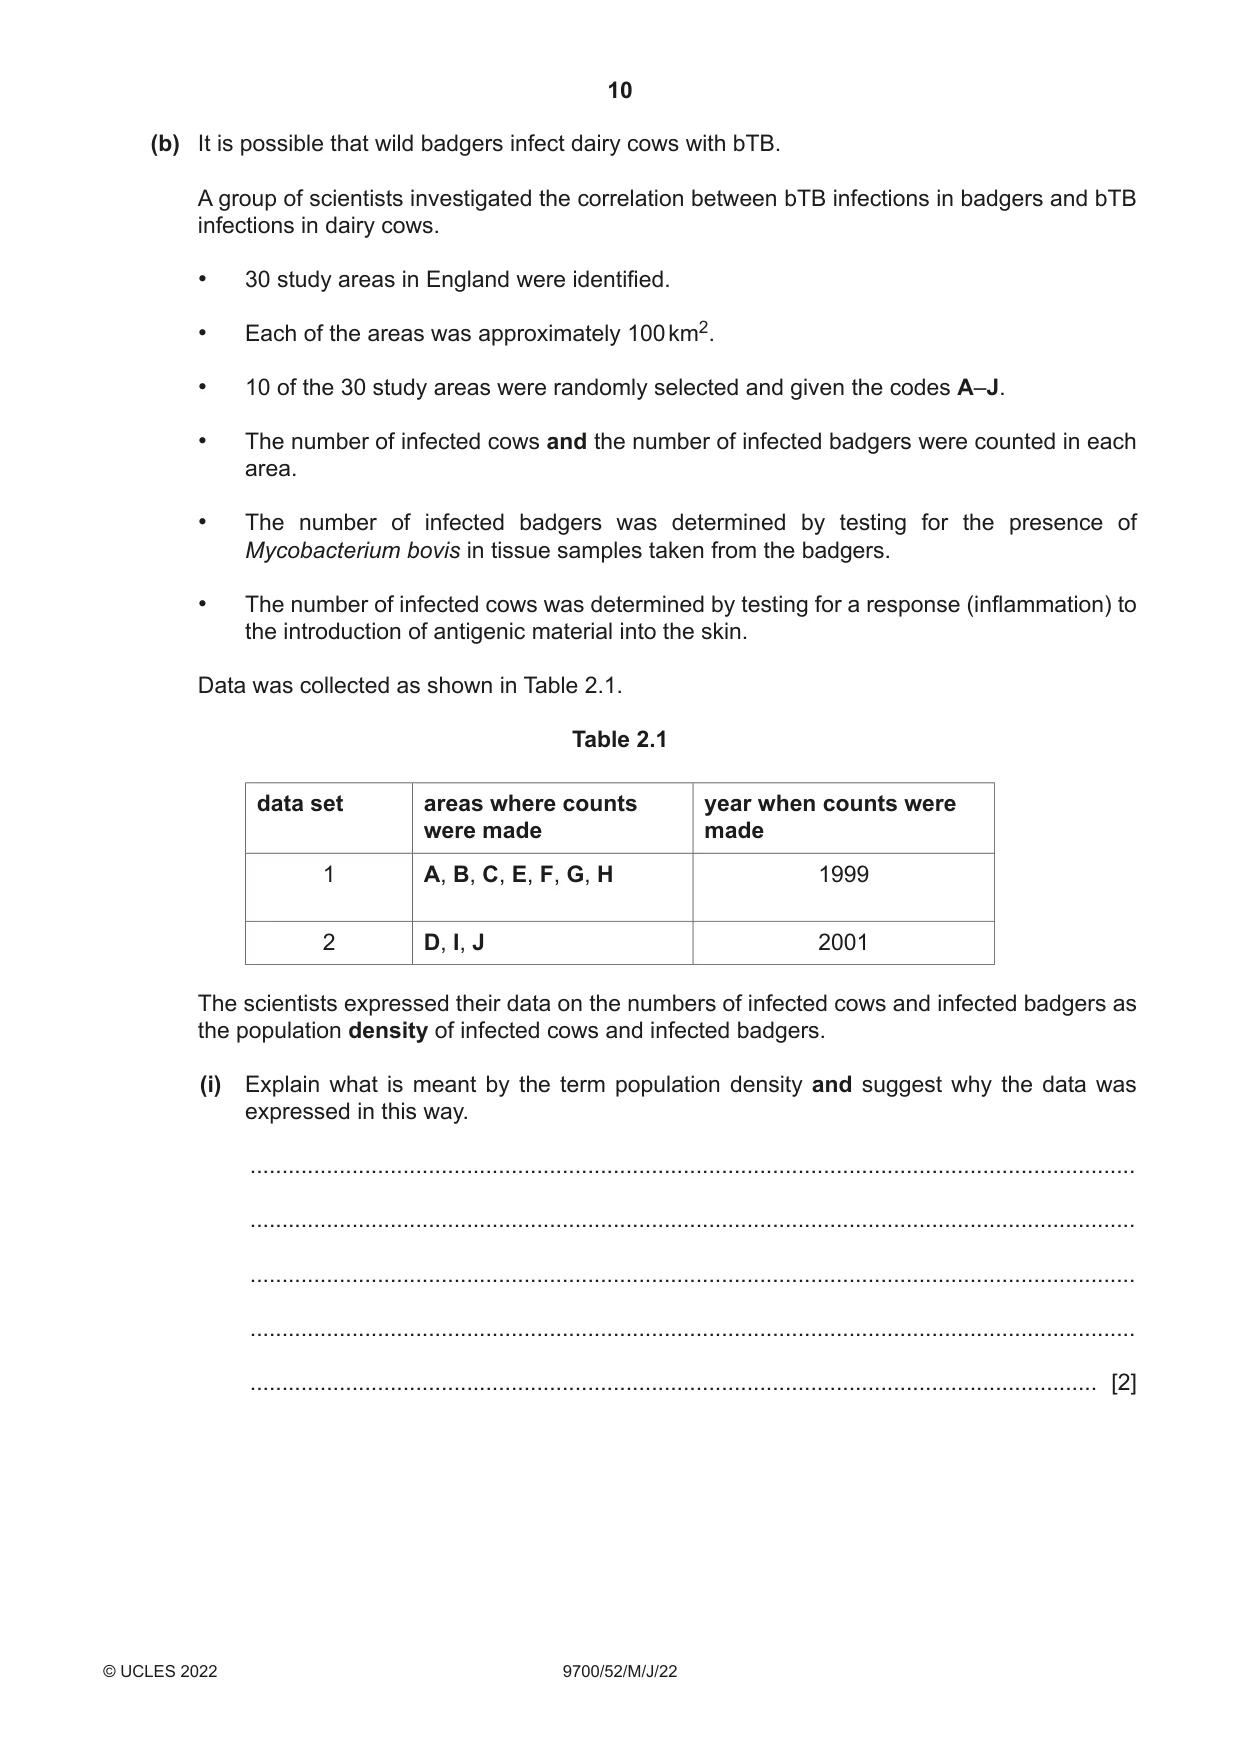
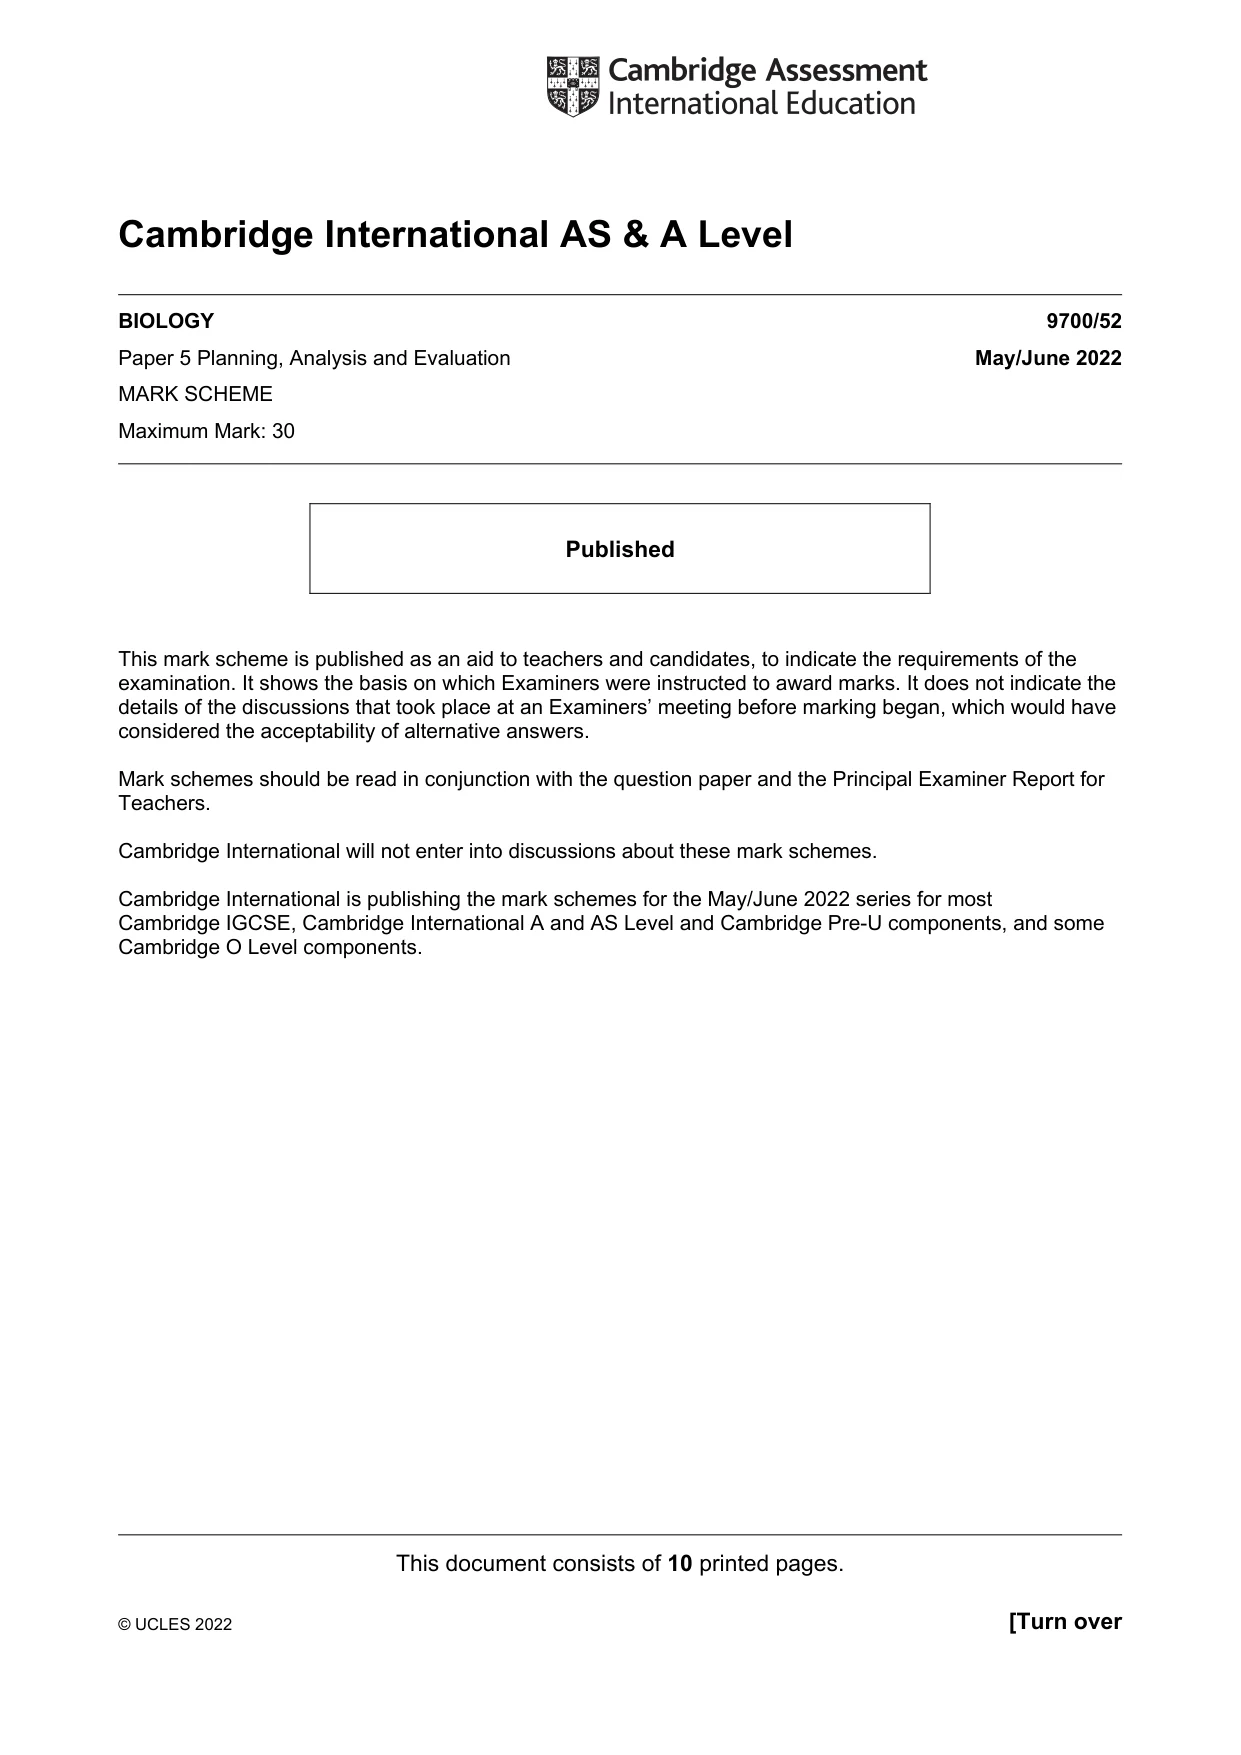
2 The European badger, Meles meles, pictured in Fig. 2.1, is a mammal found in England. Badgers can contract bovine tuberculosis (bTB) caused by the pathogen, Mycobacterium bovis. • Researchers estimated that 5% of the badger population in England are infected with bTB. • bTB can be spread between badger populations and other populations of wild animals and farmed animals. • Herds of dairy cows produce milk for human consumption. If a dairy herd becomes infected with bTB, the pathogen can be transmitted to human populations in milk. • A variety of measures have been introduced in an attempt to reduce the bTB rate in badgers and so prevent infection of dairy cows. • These measures include vaccination and the removal of badger populations (culling). Fig. 2.1 (a) Suggest how researchers estimated the percentage of the badger population that was infected with bTB. ................................................................................................................................................... ................................................................................................................................................... ................................................................................................................................................... ................................................................................................................................................... ................................................................................................................................................... ................................................................................................................................................... ................................................................................................................................................... ................................................................................................................................................... ............................................................................................................................................. [3] (b) It is possible that wild badgers infect dairy cows with bTB. A group of scientists investigated the correlation between bTB infections in badgers and bTB infections in dairy cows. • 30 study areas in England were identified. • Each of the areas was approximately 100 km2. • 10 of the 30 study areas were randomly selected and given the codes A–J. • The number of infected cows and the number of infected badgers were counted in each area. • The number of infected badgers was determined by testing for the presence of Mycobacterium bovis in tissue samples taken from the badgers. • The number of infected cows was determined by testing for a response (inflammation) to the introduction of antigenic material into the skin. Data was collected as shown in Table 2.1. Table 2.1 data set areas where counts year when counts were were made made 1 A, B, C, E, F, G, H 1999 2 D, I, J 2001 The scientists expressed their data on the numbers of infected cows and infected badgers as the population density of infected cows and infected badgers. (i) Explain what is meant by the term population density and suggest why the data was expressed in this way. ........................................................................................................................................... ........................................................................................................................................... ........................................................................................................................................... ........................................................................................................................................... ..................................................................................................................................... [2]
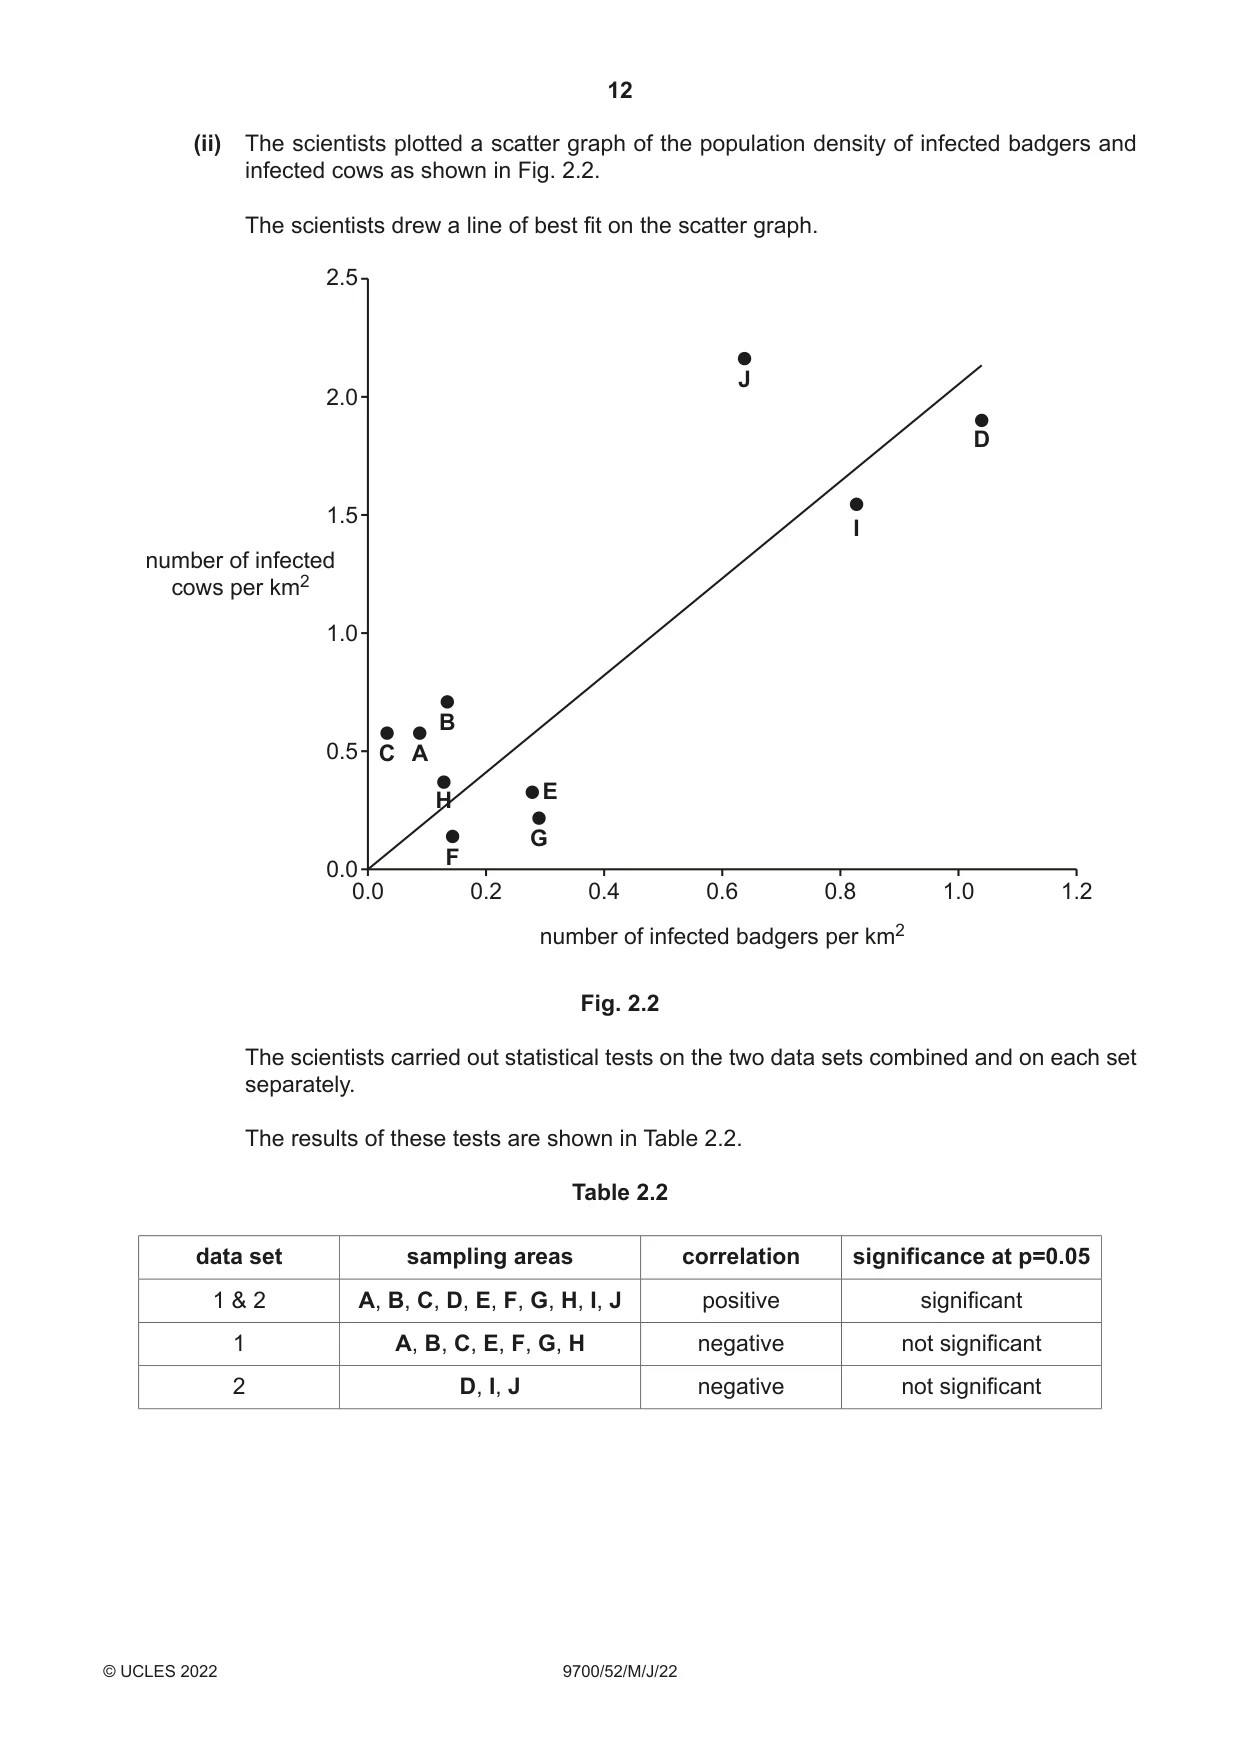
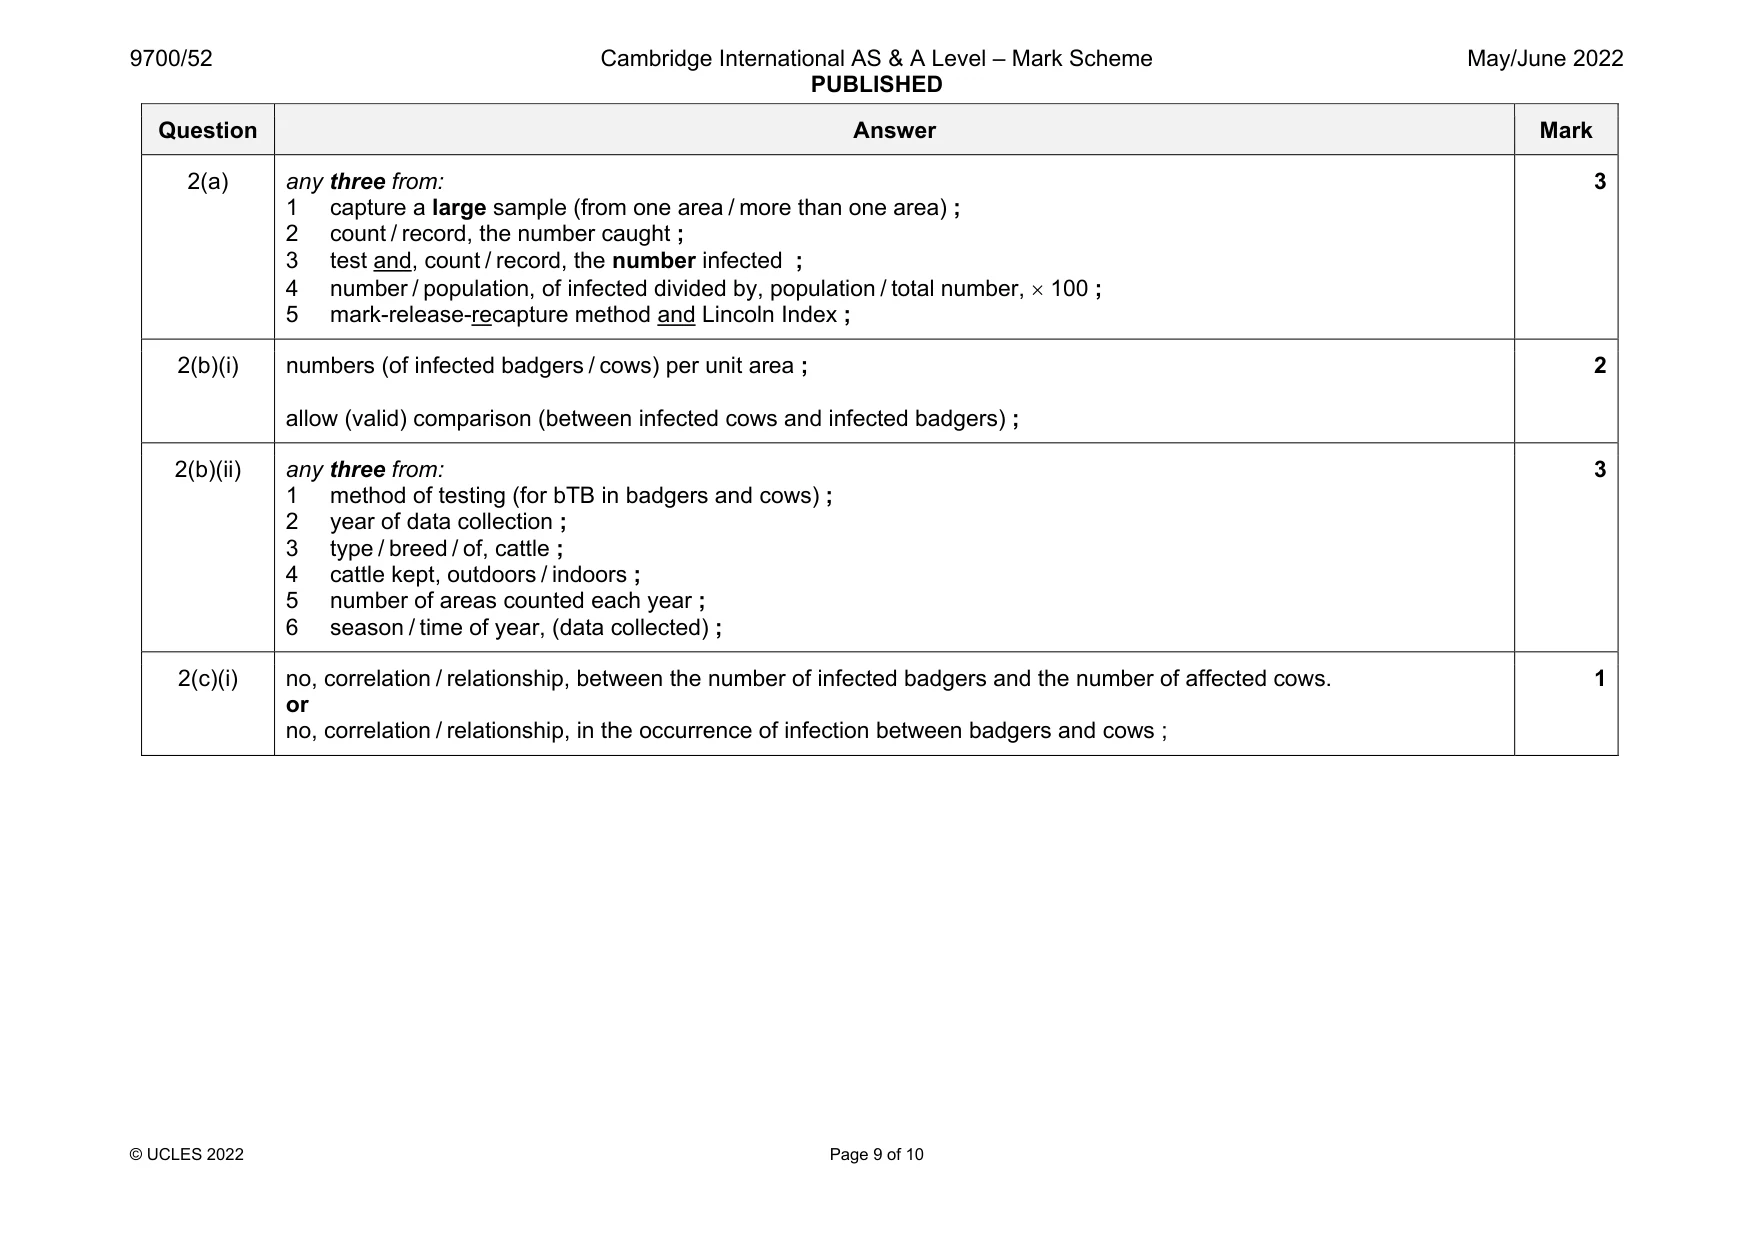
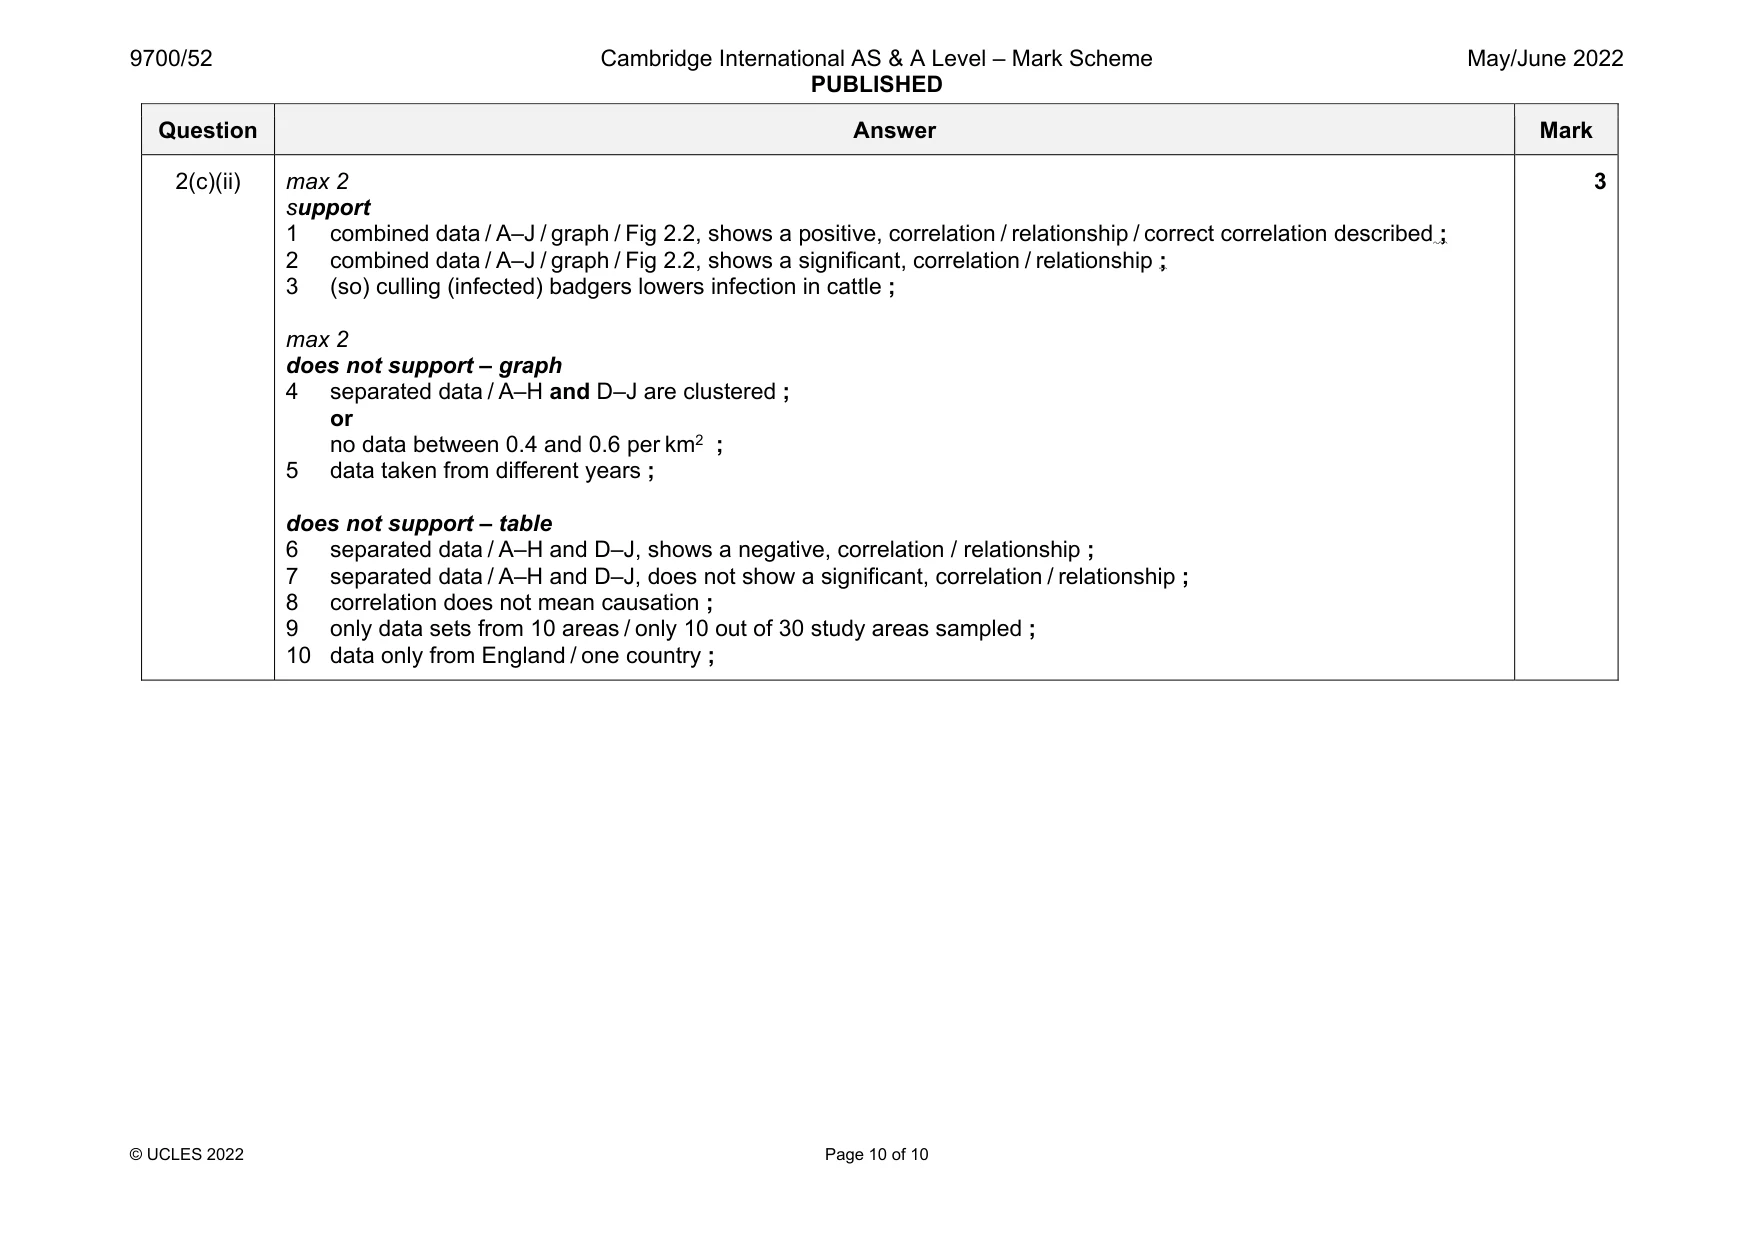
Mark scheme: 2(a) any three from: 1 capture a large sample (from one area / more than one area) ; 2 count / record, the number caught ; 3 test and, count / record, the number infected ; 4 number / population, of infected divided by, population / total number, 100 ; 5 mark-release-recapture method and Lincoln Index ; 3 2(b)(i) numbers (of infected badgers / cows) per unit area ; allow (valid) comparison (between infected cows and infected badgers) ; 2 2(b)(ii) any three from: 1 method of testing (for bTB in badgers and cows) ; 2 year of data collection ; 3 type / breed / of, cattle ; 4 cattle kept, outdoors / indoors ; 5 number of areas counted each year ; 6 season / time of year, (data collected) ; 3 2(c)(i) no, correlation / relationship, between the number of infected badgers and the number of affected cows. or no, correlation / relationship, in the occurrence of infection between badgers and cows ; 1 Question Answer Mark 2(c)(ii) max 2 support 1 combined data / A–J / graph / Fig 2.2, shows a positive, correlation / relationship / correct correlation described ; 2 combined data / A–J / graph / Fig 2.2, shows a significant, correlation / relationship ; 3 (so) culling (infected) badgers lowers infection in cattle ; max 2 does not support – graph 4 separated data / A–H and D–J are clustered ; or no data between 0.4 and 0.6 per km2 ; 5 data taken from different years ; does not support – table 6 separated data / A–H and D–J, shows a negative, correlation / relationship ; 7 separated data / A–H and D–J, does not show a significant, correlation / relationship ; 8 correlation does not mean causation ; 9 only data sets from 10 areas / only 10 out of 30 study areas sampled ; 10 data only from England / one country ; 3
What was in this paper
The subtopics covered by these 2 questions, and how many questions each got. Open one in a new tab to see every Cambridge question on it.
What you needed in this session
Cambridge’s own grade thresholds for 2022 May/June, Paper 5 · Variant 2. A higher threshold means an easier paper — the bar moves with how the cohort did.