Cambridge A Level Biology 9700 — 2022 May/June Paper 5 · Variant 3
9700/53/M/J/22 · 2 questions · 30 marks · ≈34 min
The question paper and its mark scheme, free to read here and free to download. This is Cambridge’s own paper, exactly as it was sat.
Question paper12 pages
Mark scheme10 pages
Answers below. Sit the paper first if you are practising.
Questions as text
Q1 · There are a variety of methods used to estimate the water potential of plant tissues
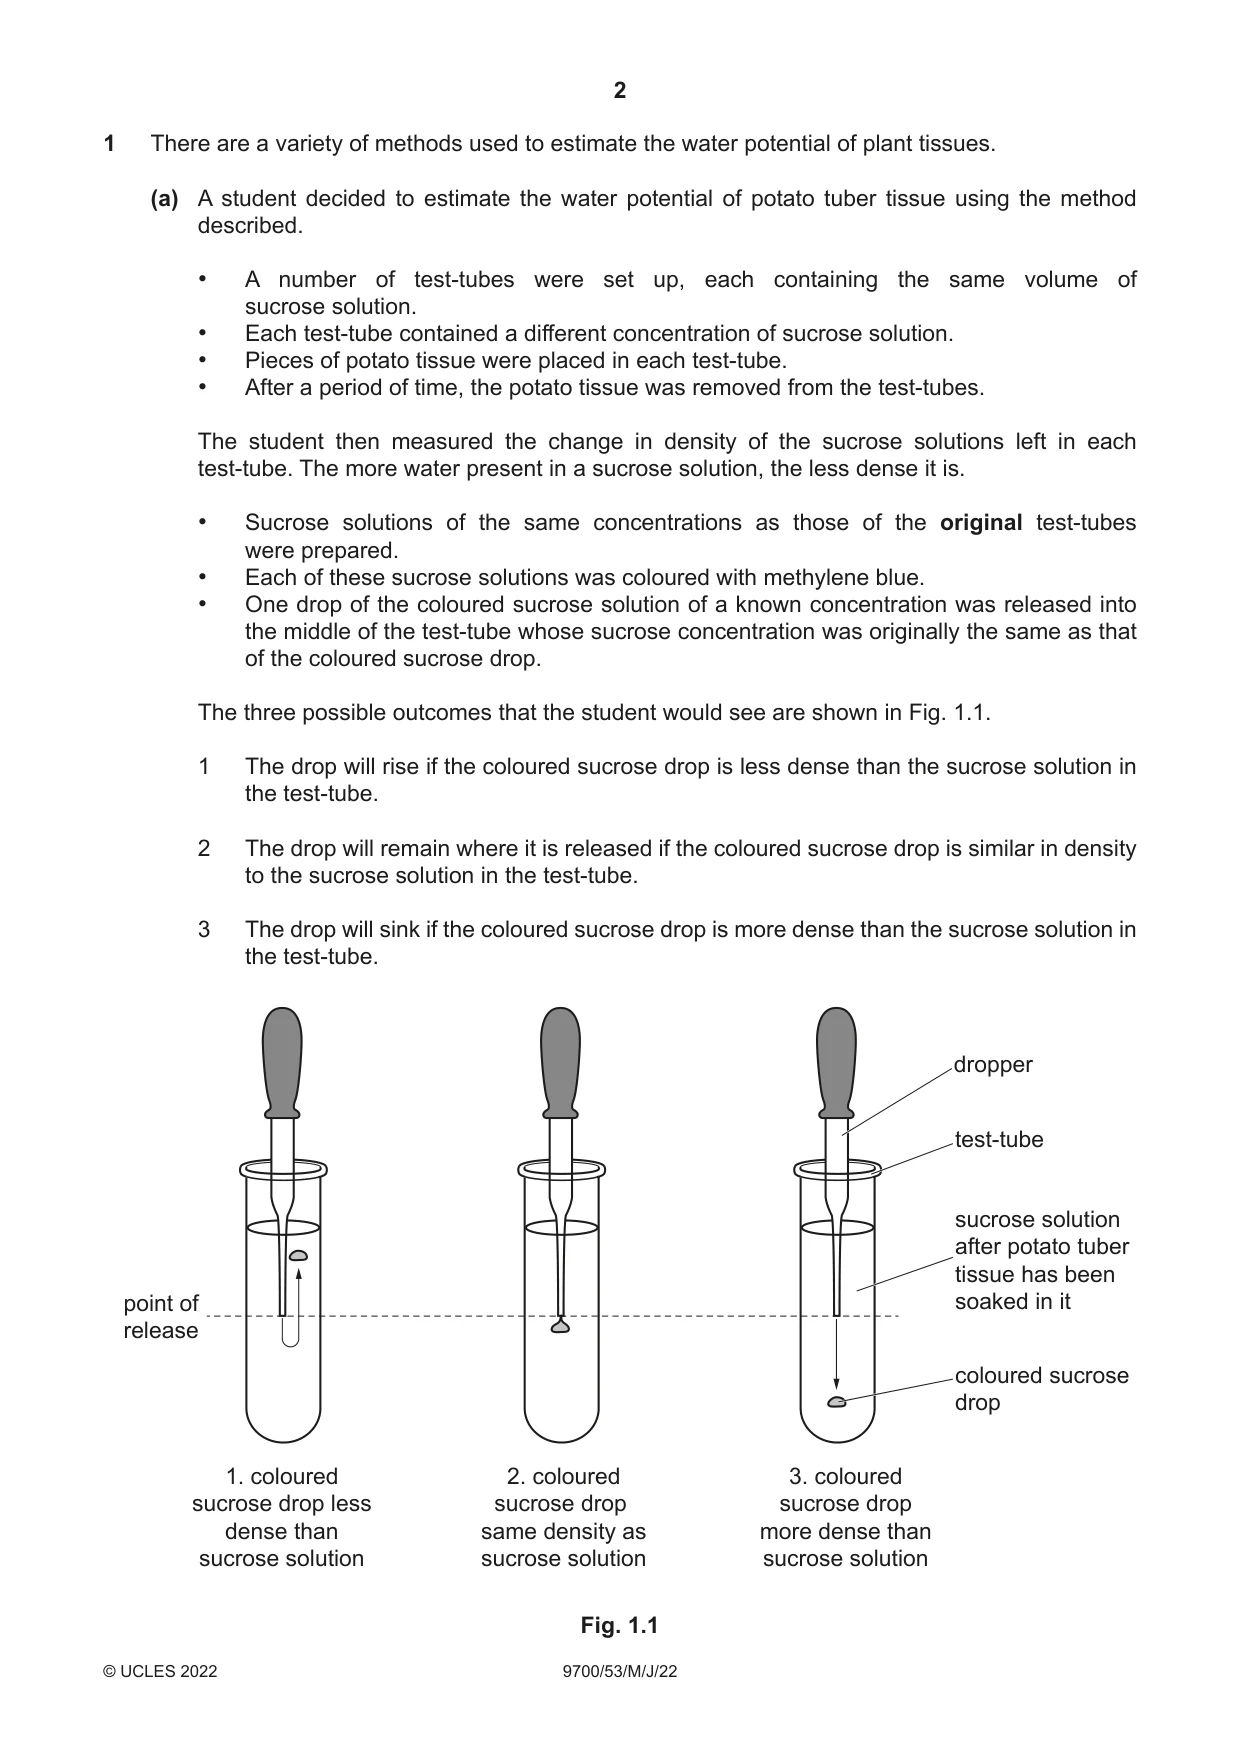
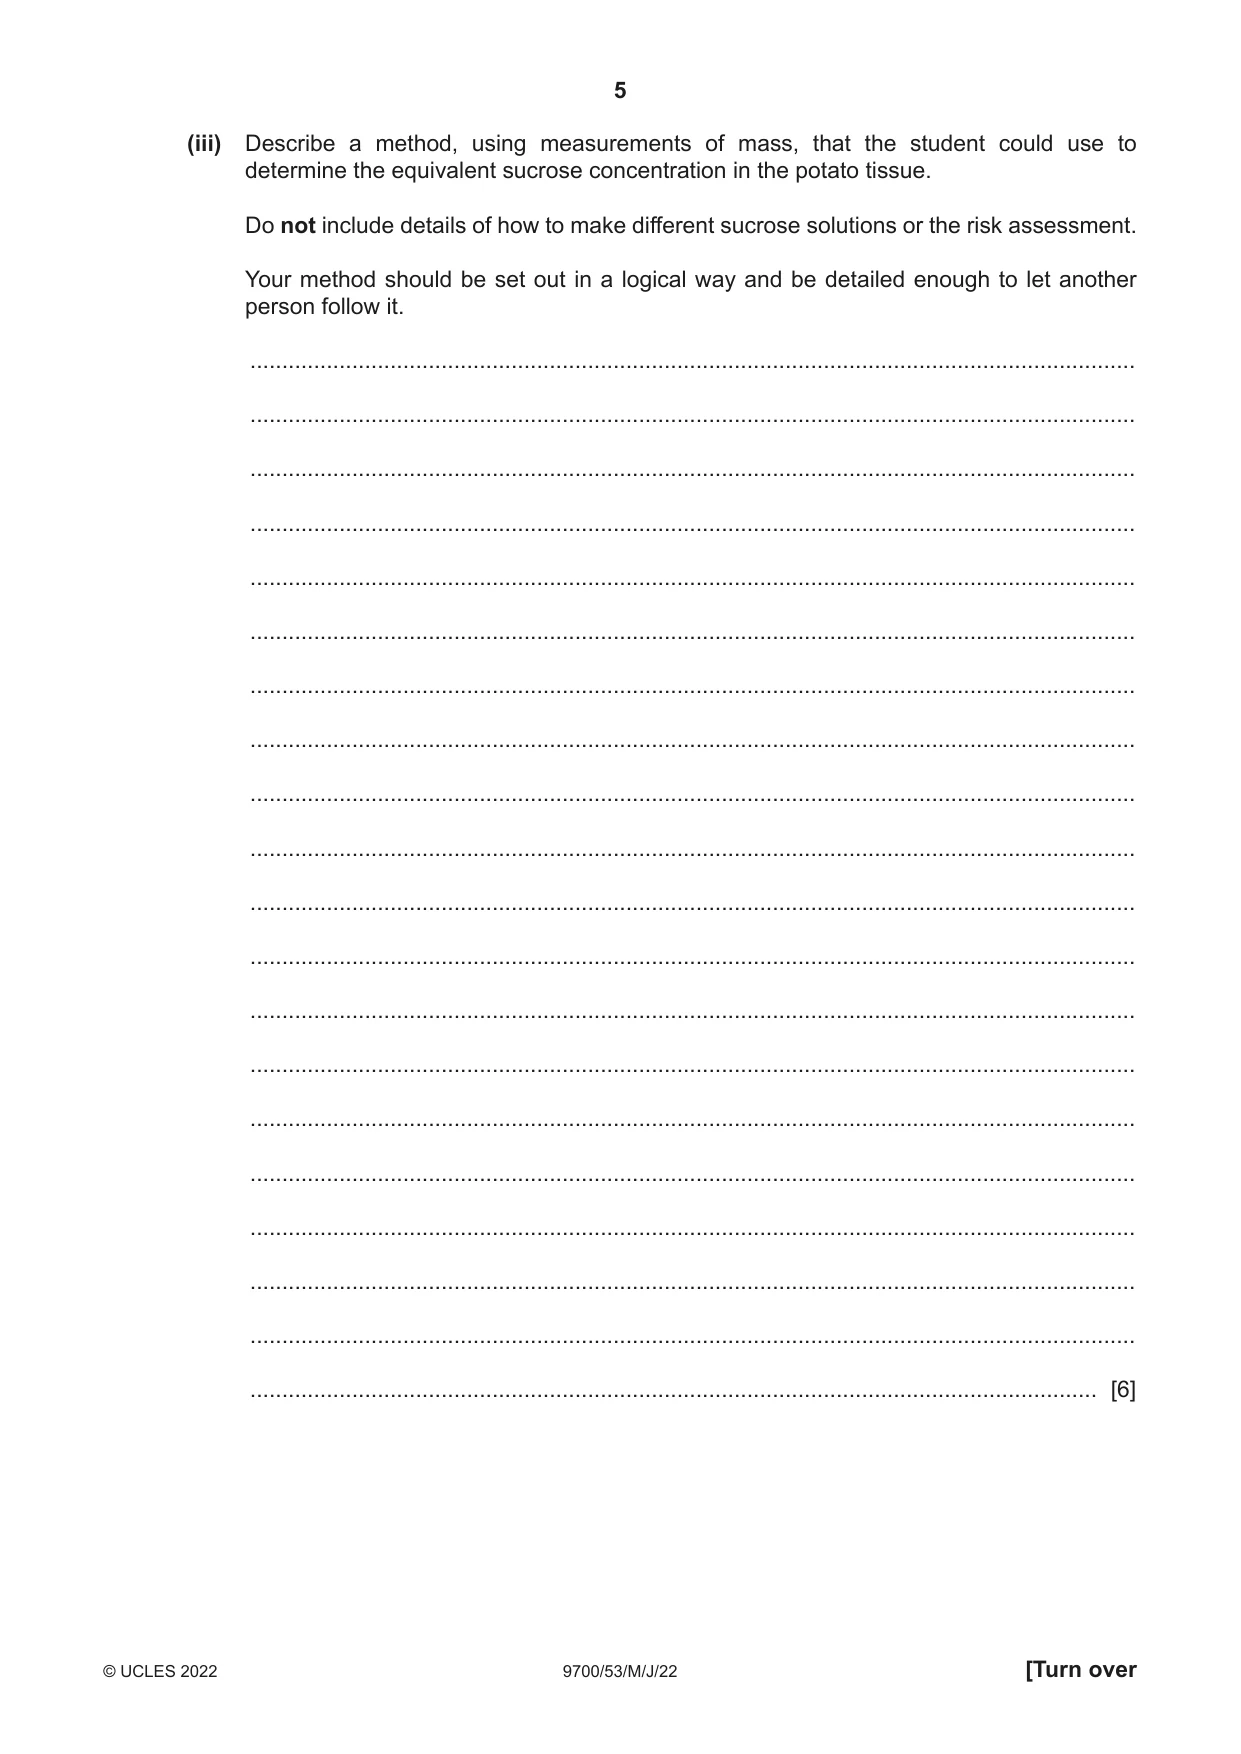
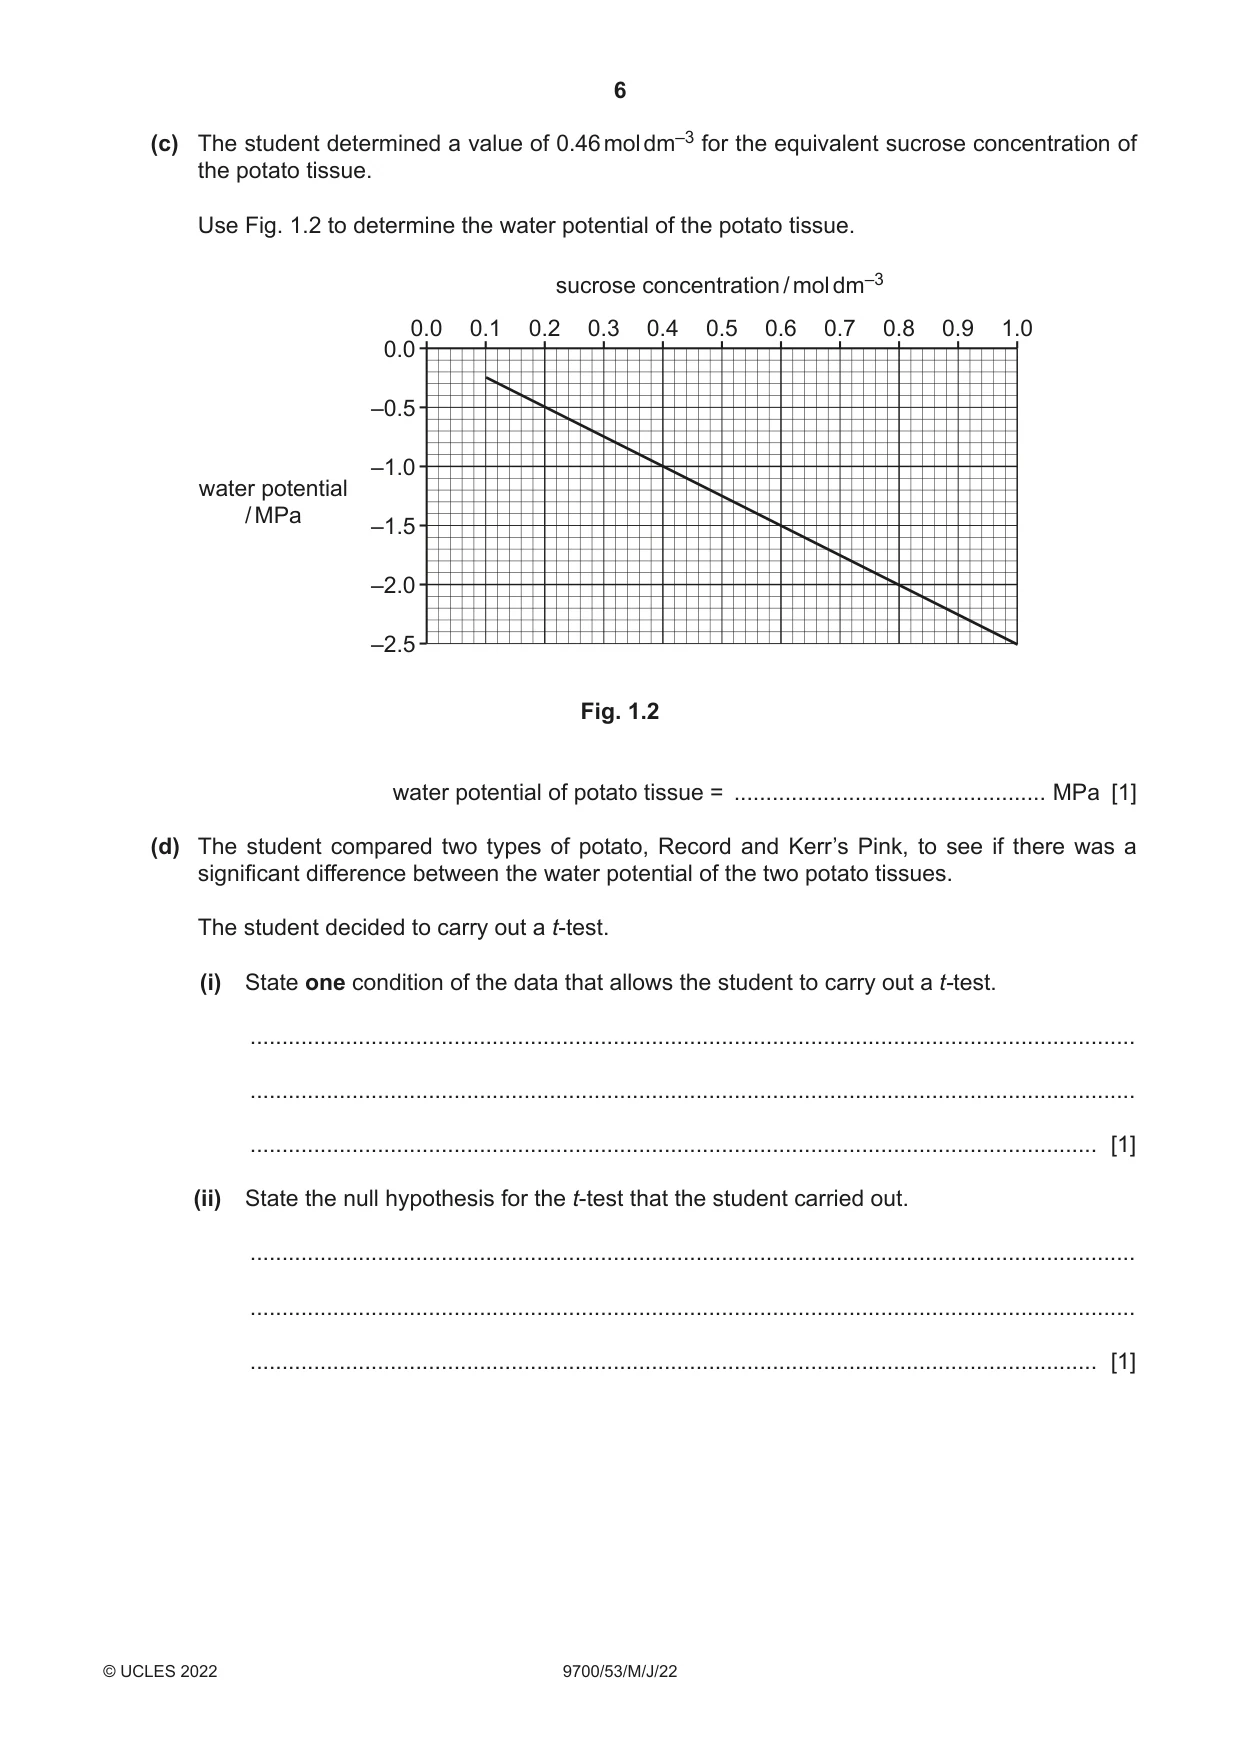
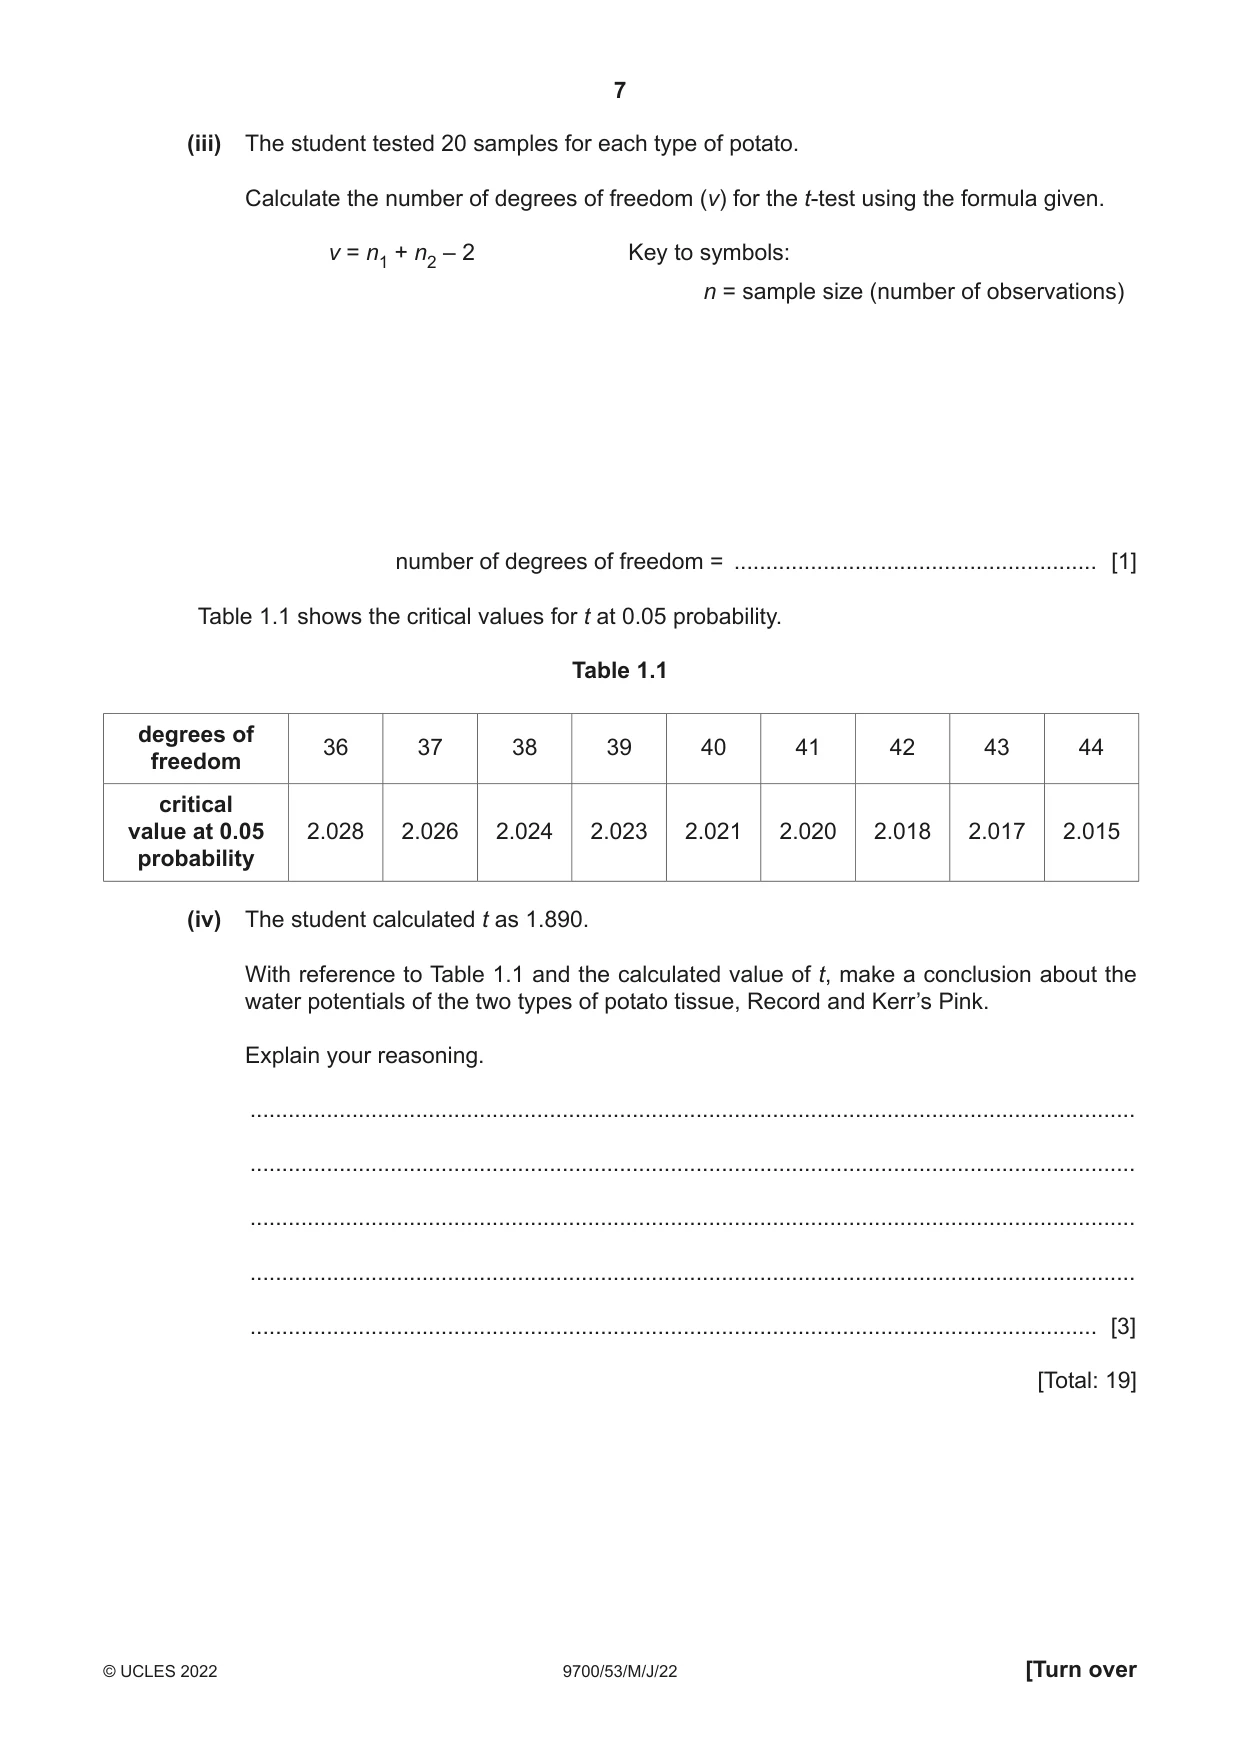
1 There are a variety of methods used to estimate the water potential of plant tissues. (a) A student decided to estimate the water potential of potato tuber tissue using the method described. • A number of test-tubes were set up, each containing the same volume of sucrose solution. • Each test-tube contained a different concentration of sucrose solution. • Pieces of potato tissue were placed in each test-tube. • After a period of time, the potato tissue was removed from the test-tubes. The student then measured the change in density of the sucrose solutions left in each test-tube. The more water present in a sucrose solution, the less dense it is. • Sucrose solutions of the same concentrations as those of the original test-tubes were prepared. • Each of these sucrose solutions was coloured with methylene blue. • One drop of the coloured sucrose solution of a known concentration was released into the middle of the test-tube whose sucrose concentration was originally the same as that of the coloured sucrose drop. The three possible outcomes that the student would see are shown in Fig. 1.1. 1 The drop will rise if the coloured sucrose drop is less dense than the sucrose solution in the test-tube. 2 The drop will remain where it is released if the coloured sucrose drop is similar in density to the sucrose solution in the test-tube. 3 The drop will sink if the coloured sucrose drop is more dense than the sucrose solution in the test-tube. dropper test-tube sucrose solution after potato tuber tissue has been point of soaked in it release coloured sucrose drop 1. coloured 2. coloured 3. coloured sucrose drop less sucrose drop sucrose drop dense than same density as more dense than sucrose solution sucrose solution sucrose solution Fig. 1.1 (i) Identify the independent variable in the experiment. ........................................................................................................................................... ..................................................................................................................................... [1] (ii) Predict the result if the water potential of the potato tissue was higher (less negative) than the surrounding sucrose solution. ........................................................................................................................................... ........................................................................................................................................... ..................................................................................................................................... [1] (iii) Explain the prediction that you gave in (a)(ii). ........................................................................................................................................... ........................................................................................................................................... ........................................................................................................................................... ........................................................................................................................................... ..................................................................................................................................... [2] (b) The student then used another method to estimate the water potential of potato tissue. The student placed pieces of potato tissue in a range of concentrations of sucrose solutions. The equivalent sucrose concentration was identified as the concentration of the sucrose solution in which the potato tissue did not gain or lose mass. The equivalent sucrose concentration indicates the water potential of the potato tissue. (i) The student was given a stock solution of sucrose with a concentration of 1.0 mol dm–3 from which to make a range of dilutions. The student decided to make 20 cm3 of each concentration of sucrose solution. Describe how the student prepared 20 cm3 of solution with a concentration of 0.4 mol dm–3. ........................................................................................................................................... ........................................................................................................................................... ..................................................................................................................................... [1] (ii) The student carried out a risk assessment before carrying out the experiment to find the equivalent sucrose concentration. Suggest one reason why the student decided the level of risk for this method was low to medium. ........................................................................................................................................... ..................................................................................................................................... [1] (iii) Describe a method, using measurements of mass, that the student could use to determine the equivalent sucrose concentration in the potato tissue. Do not include details of how to make different sucrose solutions or the risk assessment. Your method should be set out in a logical way and be detailed enough to let another person follow it. ........................................................................................................................................... ........................................................................................................................................... ........................................................................................................................................... ........................................................................................................................................... ........................................................................................................................................... ........................................................................................................................................... ........................................................................................................................................... ........................................................................................................................................... ........................................................................................................................................... ........................................................................................................................................... ........................................................................................................................................... ........................................................................................................................................... ........................................................................................................................................... ........................................................................................................................................... ........................................................................................................................................... ........................................................................................................................................... ........................................................................................................................................... ........................................................................................................................................... ........................................................................................................................................... ..................................................................................................................................... [6] (c) The student determined a value of 0.46 mol dm–3 for the equivalent sucrose concentration of the potato tissue. Use Fig. 1.2 to determine the water potential of the potato tissue. sucrose concentration / mol dm–3 0.0 0.1 0.2 0.3 0.4 0.5 0.6 0.7 0.8 0.9 1.0 0.0 –0.5 –1.0 water potential / MPa –1.5 –2.0 –2.5 Fig. 1.2 water potential of potato tissue = ................................................. MPa [1] (d) The student compared two types of potato, Record and Kerr’s Pink, to see if there was a significant difference between the water potential of the two potato tissues. The student decided to carry out a t-test. (i) State one condition of the data that allows the student to carry out a t-test. ........................................................................................................................................... ........................................................................................................................................... ..................................................................................................................................... [1] (ii) State the null hypothesis for the t-test that the student carried out. ........................................................................................................................................... ........................................................................................................................................... ..................................................................................................................................... [1] (iii) The student tested 20 samples for each type of potato. Calculate the number of degrees of freedom (v) for the t-test using the formula given. v = n1 + n2 – 2 Key to symbols: n = sample size (number of observations) number of degrees of freedom = ......................................................... [1] Table 1.1 shows the critical values for t at 0.05 probability. Table 1.1 degrees of 36 37 38 39 40 41 42 43 44 freedom critical value at 0.05 2.028 2.026 2.024 2.023 2.021 2.020 2.018 2.017 2.015 probability (iv) The student calculated t as 1.890. With reference to Table 1.1 and the calculated value of t, make a conclusion about the water potentials of the two types of potato tissue, Record and Kerr’s Pink. Explain your reasoning. ........................................................................................................................................... ........................................................................................................................................... ........................................................................................................................................... ........................................................................................................................................... ..................................................................................................................................... [3] [Total: 19]
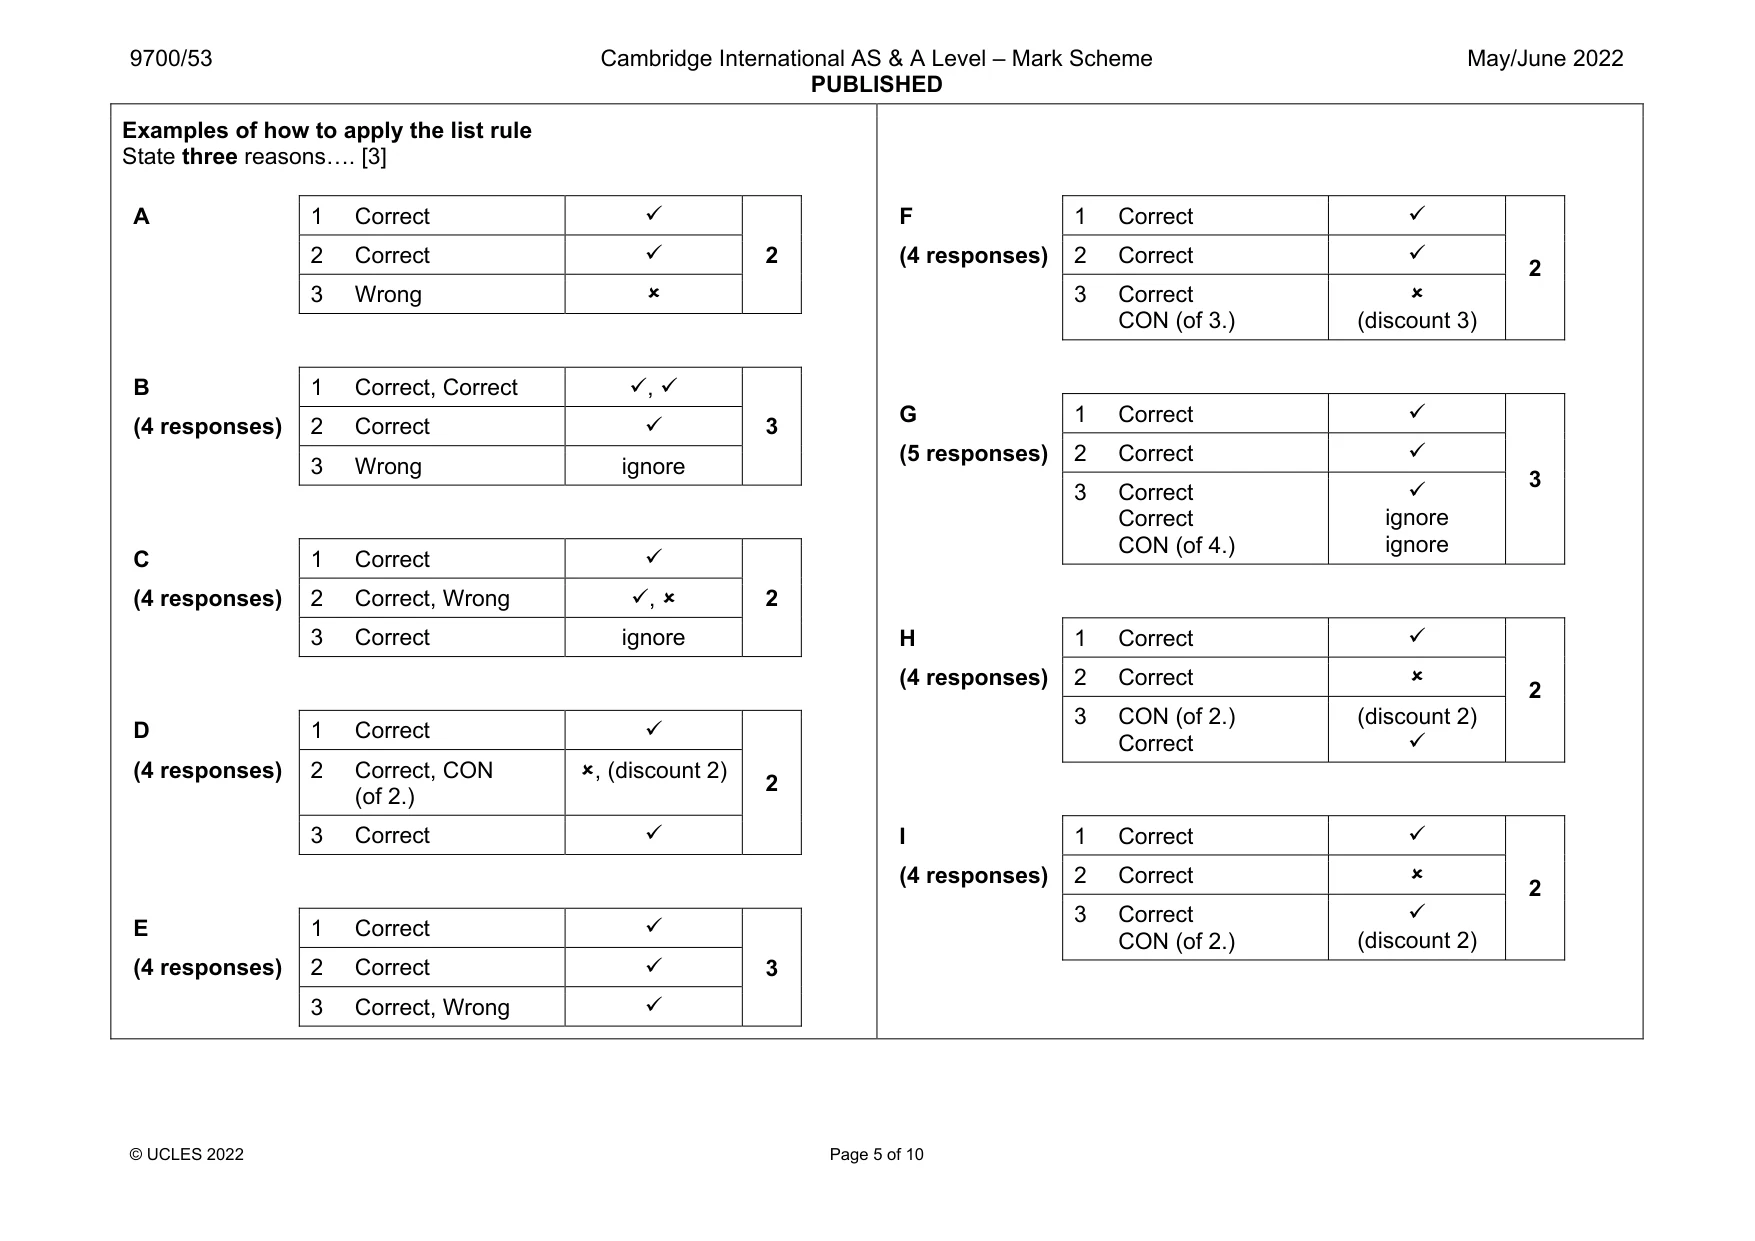
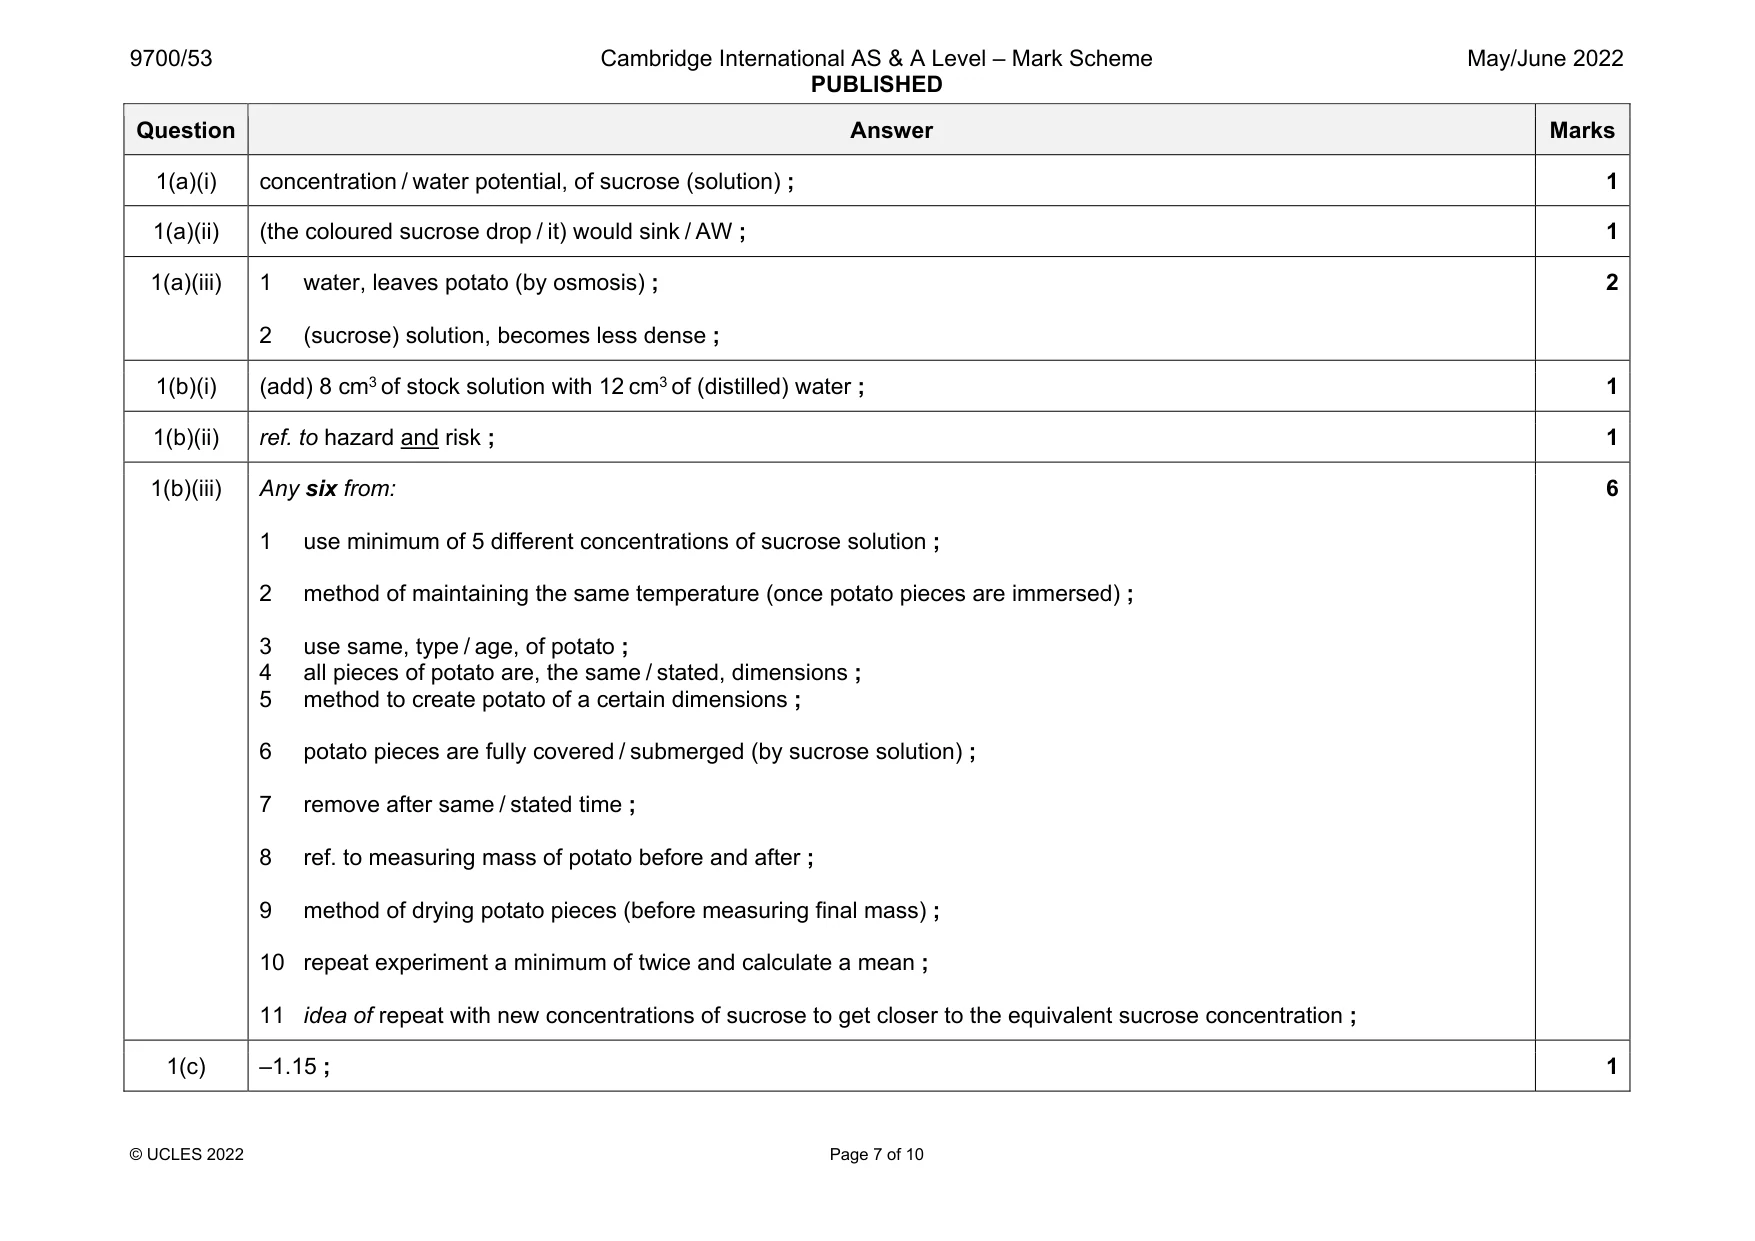
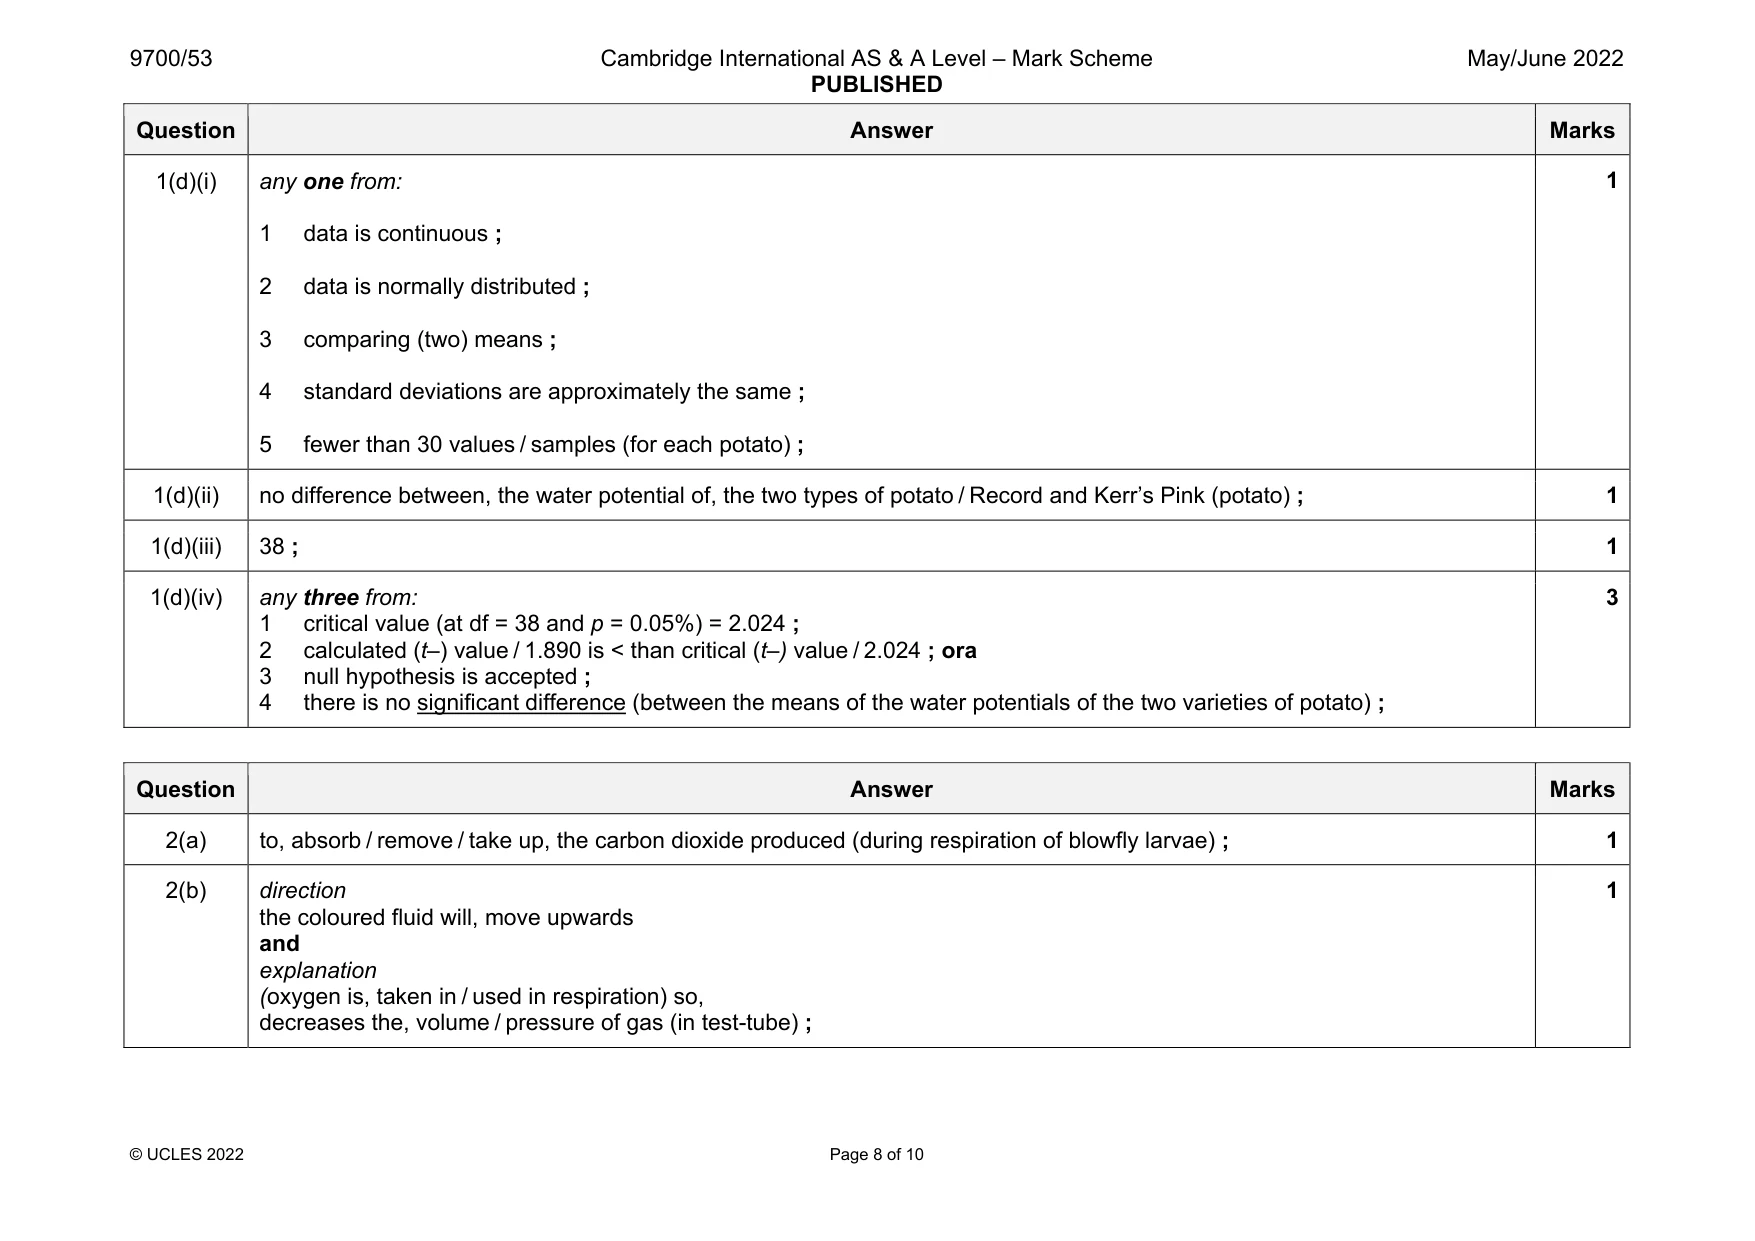
Mark scheme: 1(a)(i) concentration / water potential, of sucrose (solution) ; 1 1(a)(ii) (the coloured sucrose drop / it) would sink / AW ; 1 1(a)(iii) 1 water, leaves potato (by osmosis) ; 2 (sucrose) solution, becomes less dense ; 2 1(b)(i) (add) 8 cm3 of stock solution with 12 cm3 of (distilled) water ; 1 1(b)(ii) ref. to hazard and risk ; 1 1(b)(iii) Any six from: 1 use minimum of 5 different concentrations of sucrose solution ; 2 method of maintaining the same temperature (once potato pieces are immersed) ; 3 use same, type / age, of potato ; 4 all pieces of potato are, the same / stated, dimensions ; 5 method to create potato of a certain dimensions ; 6 potato pieces are fully covered / submerged (by sucrose solution) ; 7 remove after same / stated time ; 8 ref. to measuring mass of potato before and after ; 9 method of drying potato pieces (before measuring final mass) ; 10 repeat experiment a minimum of twice and calculate a mean ; 11 idea of repeat with new concentrations of sucrose to get closer to the equivalent sucrose concentration ; 6 1(c) –1.15 ; 1 Question Answer Marks 1(d)(i) any one from: 1 data is continuous ; 2 data is normally distributed ; 3 comparing (two) means ; 4 standard deviations are approximately the same ; 5 fewer than 30 values / samples (for each potato) ; 1 1(d)(ii) no difference between, the water potential of, the two types of potato / Record and Kerr’s Pink (potato) ; 1 1(d)(iii) 38 ; 1 1(d)(iv) any three from: 1 critical value (at df = 38 and p = 0.05%) = 2.024 ; 2 calculated (t–) value / 1.890 is < than critical (t–) value / 2.024 ; ora 3 null hypothesis is accepted ; 4 there is no significant difference (between the means of the water potentials of the two varieties of potato) ; 3
Q2 · Respiration in blowfly larvae, Calliphora erythrocephala, can be studied by determining…
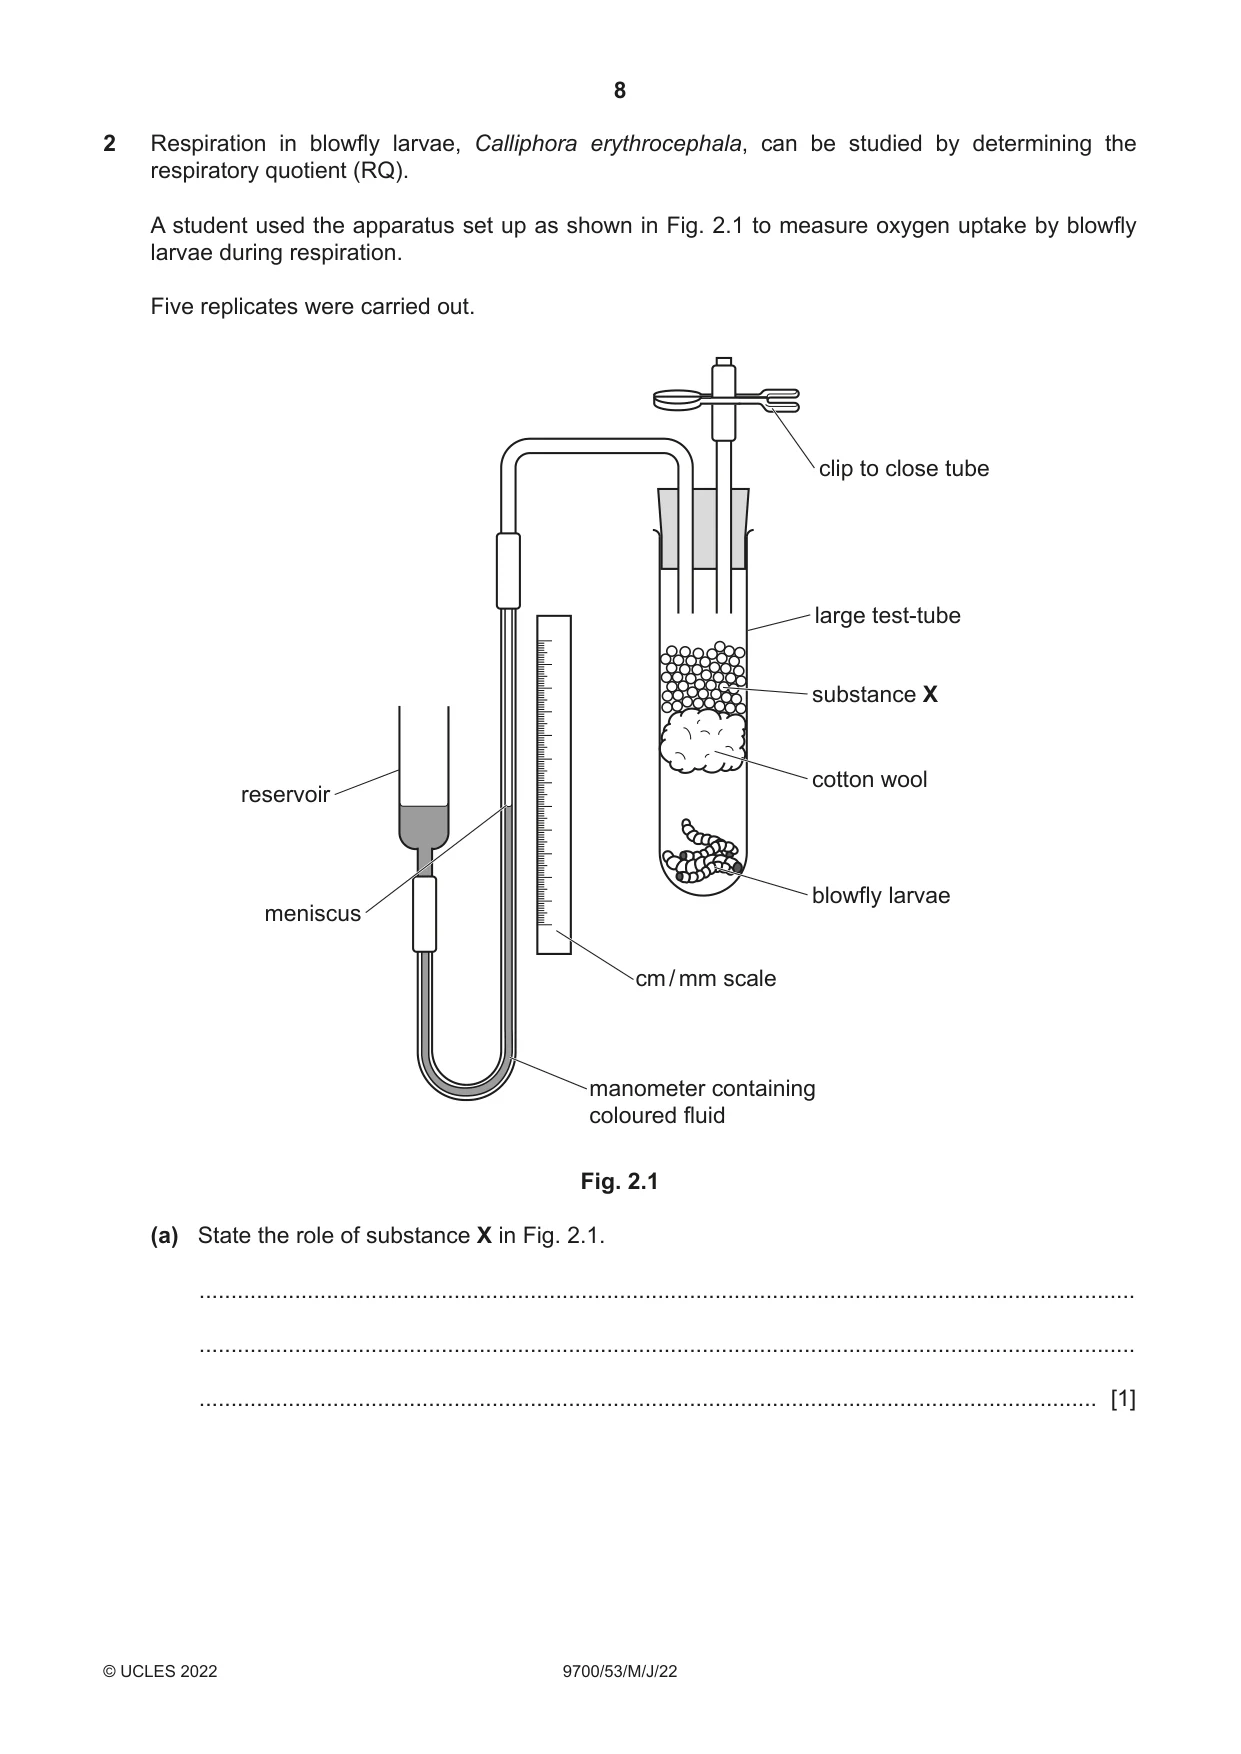
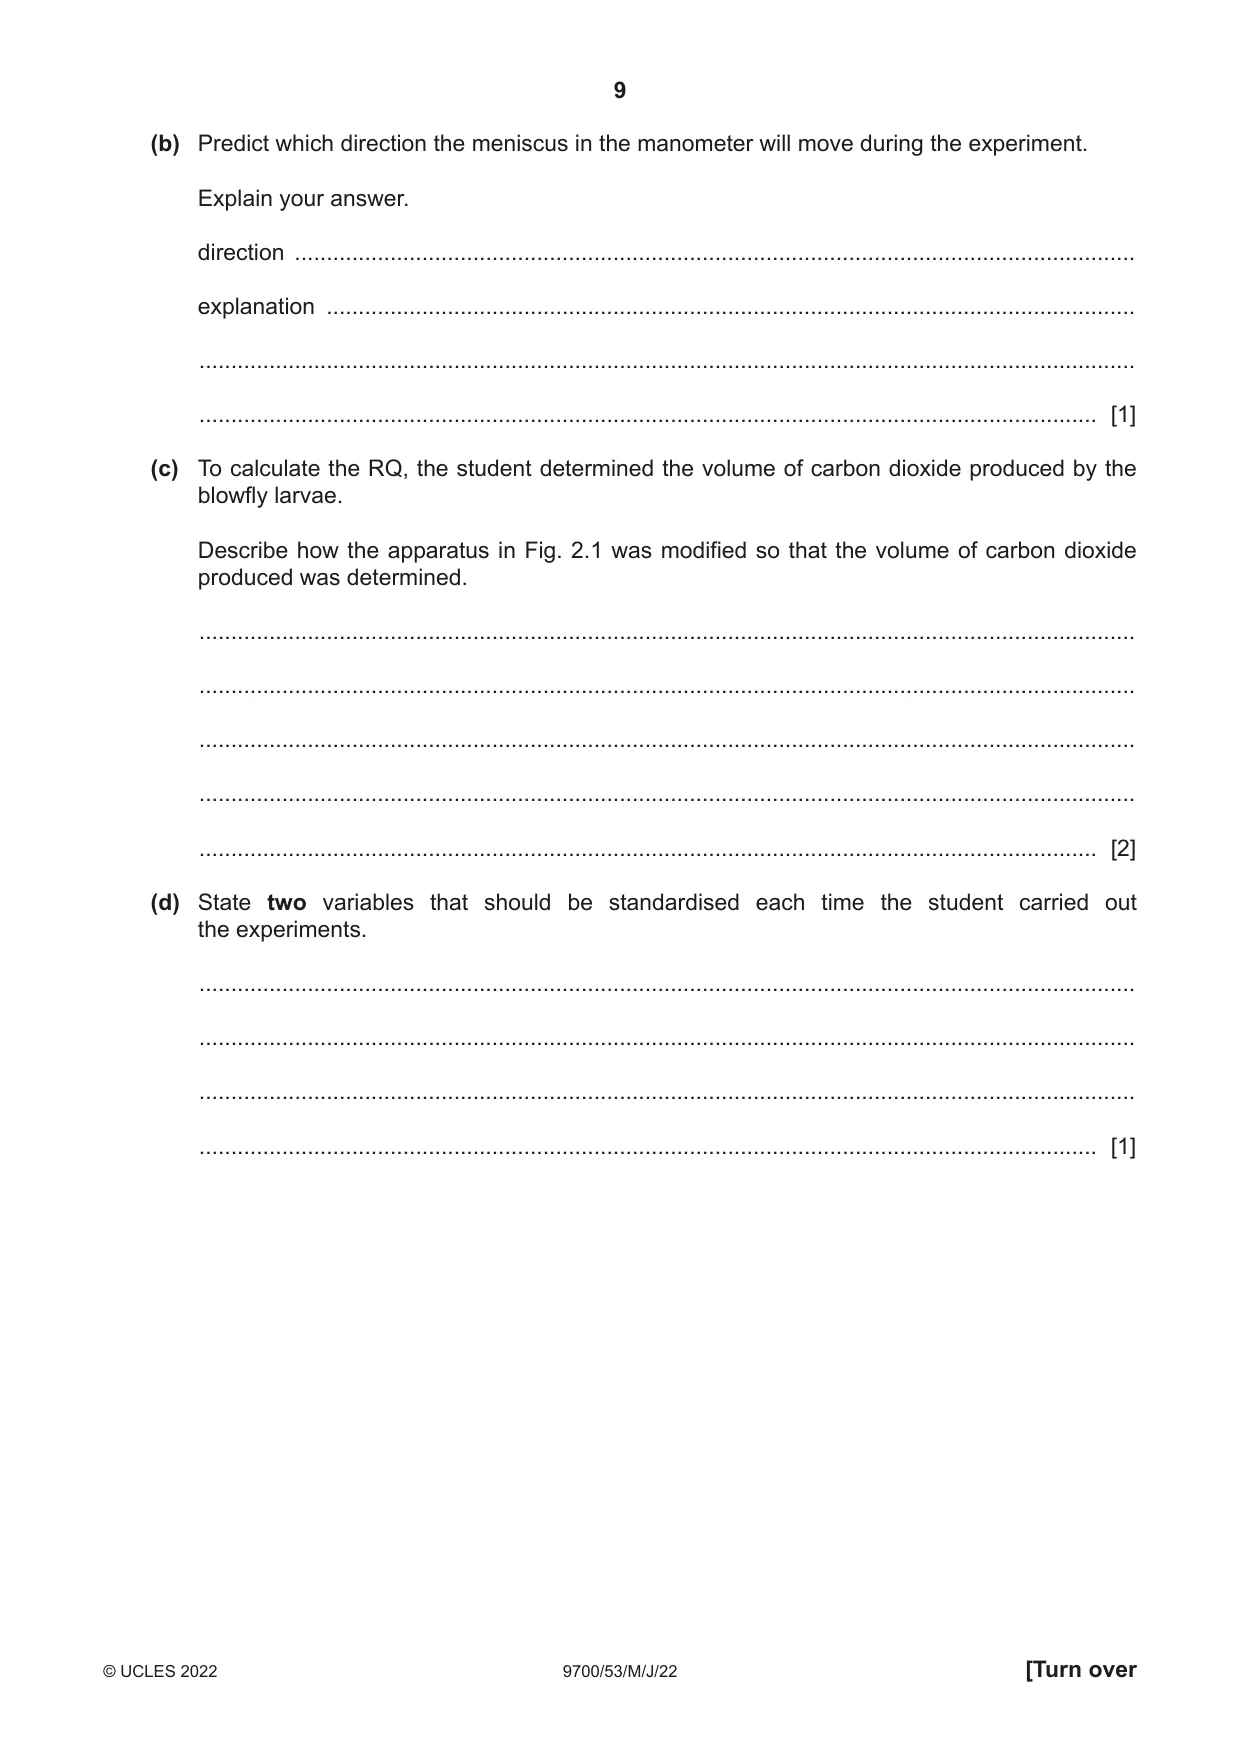
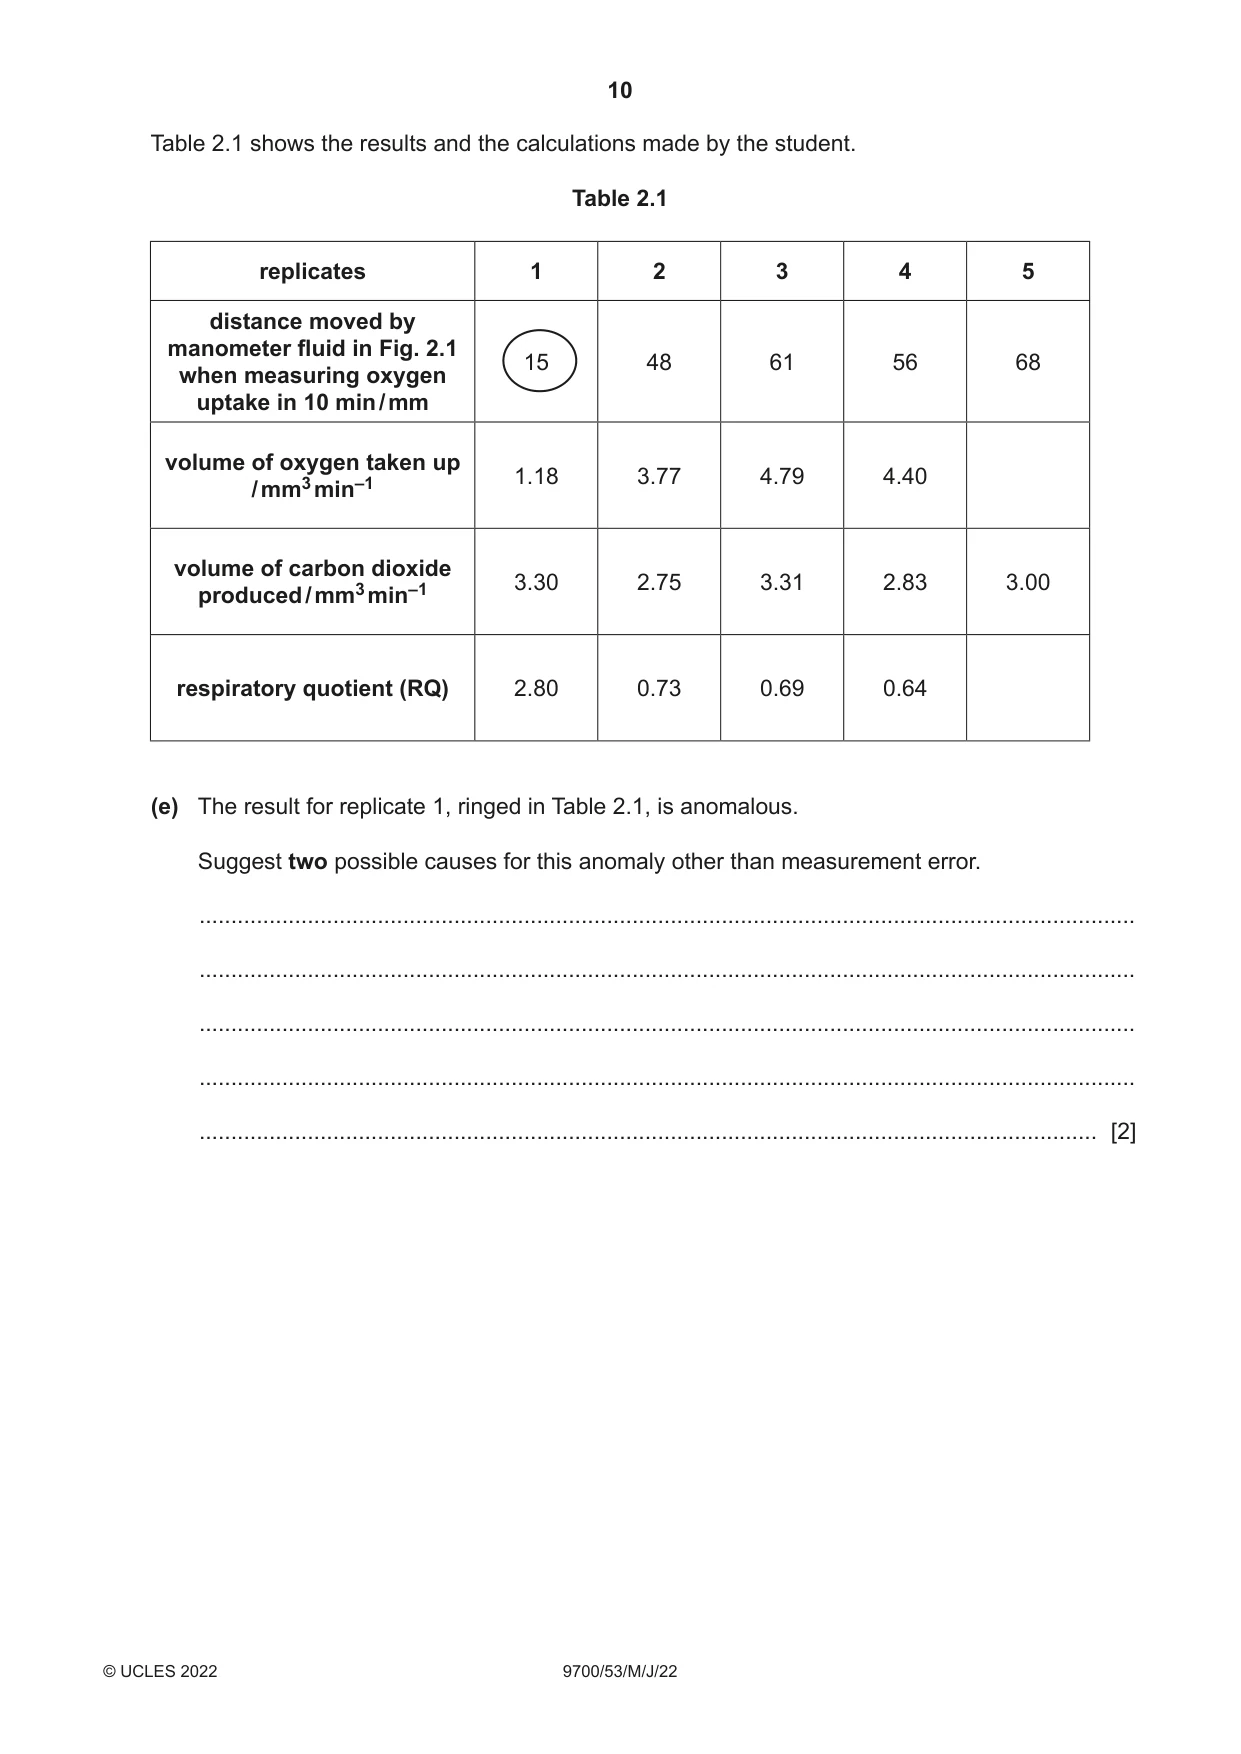
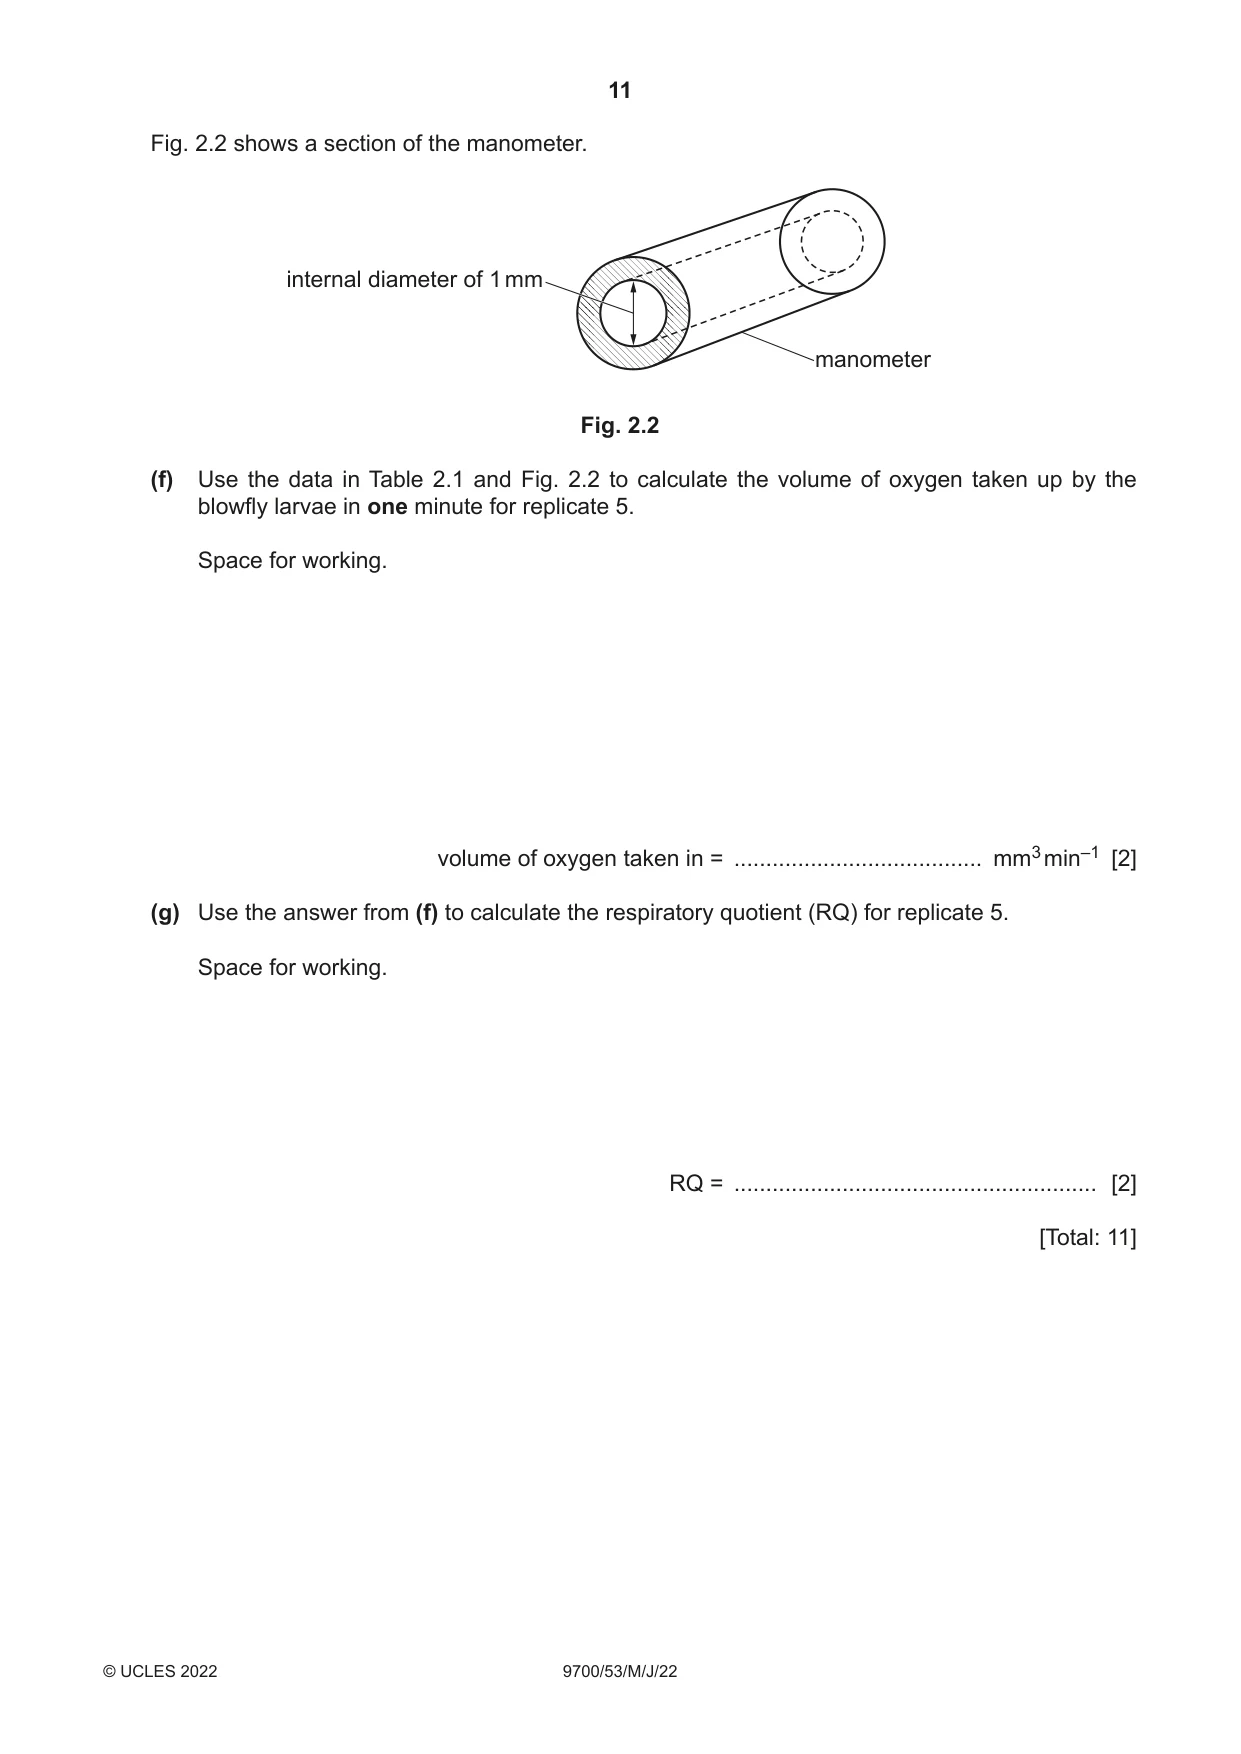
2 Respiration in blowfly larvae, Calliphora erythrocephala, can be studied by determining the respiratory quotient (RQ). A student used the apparatus set up as shown in Fig. 2.1 to measure oxygen uptake by blowfly larvae during respiration. Five replicates were carried out. clip to close tube large test-tube substance X cotton wool reservoir blowfly larvae meniscus cm / mm scale manometer containing coloured fluid Fig. 2.1 (a) State the role of substance X in Fig. 2.1. ................................................................................................................................................... ................................................................................................................................................... ............................................................................................................................................. [1] (b) Predict which direction the meniscus in the manometer will move during the experiment. Explain your answer. direction .................................................................................................................................... explanation ............................................................................................................................... ................................................................................................................................................... ............................................................................................................................................. [1] (c) To calculate the RQ, the student determined the volume of carbon dioxide produced by the blowfly larvae. Describe how the apparatus in Fig. 2.1 was modified so that the volume of carbon dioxide produced was determined. ................................................................................................................................................... ................................................................................................................................................... ................................................................................................................................................... ................................................................................................................................................... ............................................................................................................................................. [2] (d) State two variables that should be standardised each time the student carried out the experiments. ................................................................................................................................................... ................................................................................................................................................... ................................................................................................................................................... ............................................................................................................................................. [1] Table 2.1 shows the results and the calculations made by the student. Table 2.1 replicates 1 2 3 4 5 distance moved by manometer fluid in Fig. 2.1 15 48 61 56 68 when measuring oxygen uptake in 10 min / mm volume of oxygen taken up 1.18 3.77 4.79 4.40 / mm3 min–1 volume of carbon dioxide 3.30 2.75 3.31 2.83 3.00 produced / mm3 min–1 respiratory quotient (RQ) 2.80 0.73 0.69 0.64 (e) The result for replicate 1, ringed in Table 2.1, is anomalous. Suggest two possible causes for this anomaly other than measurement error. ................................................................................................................................................... ................................................................................................................................................... ................................................................................................................................................... ................................................................................................................................................... ............................................................................................................................................. [2]
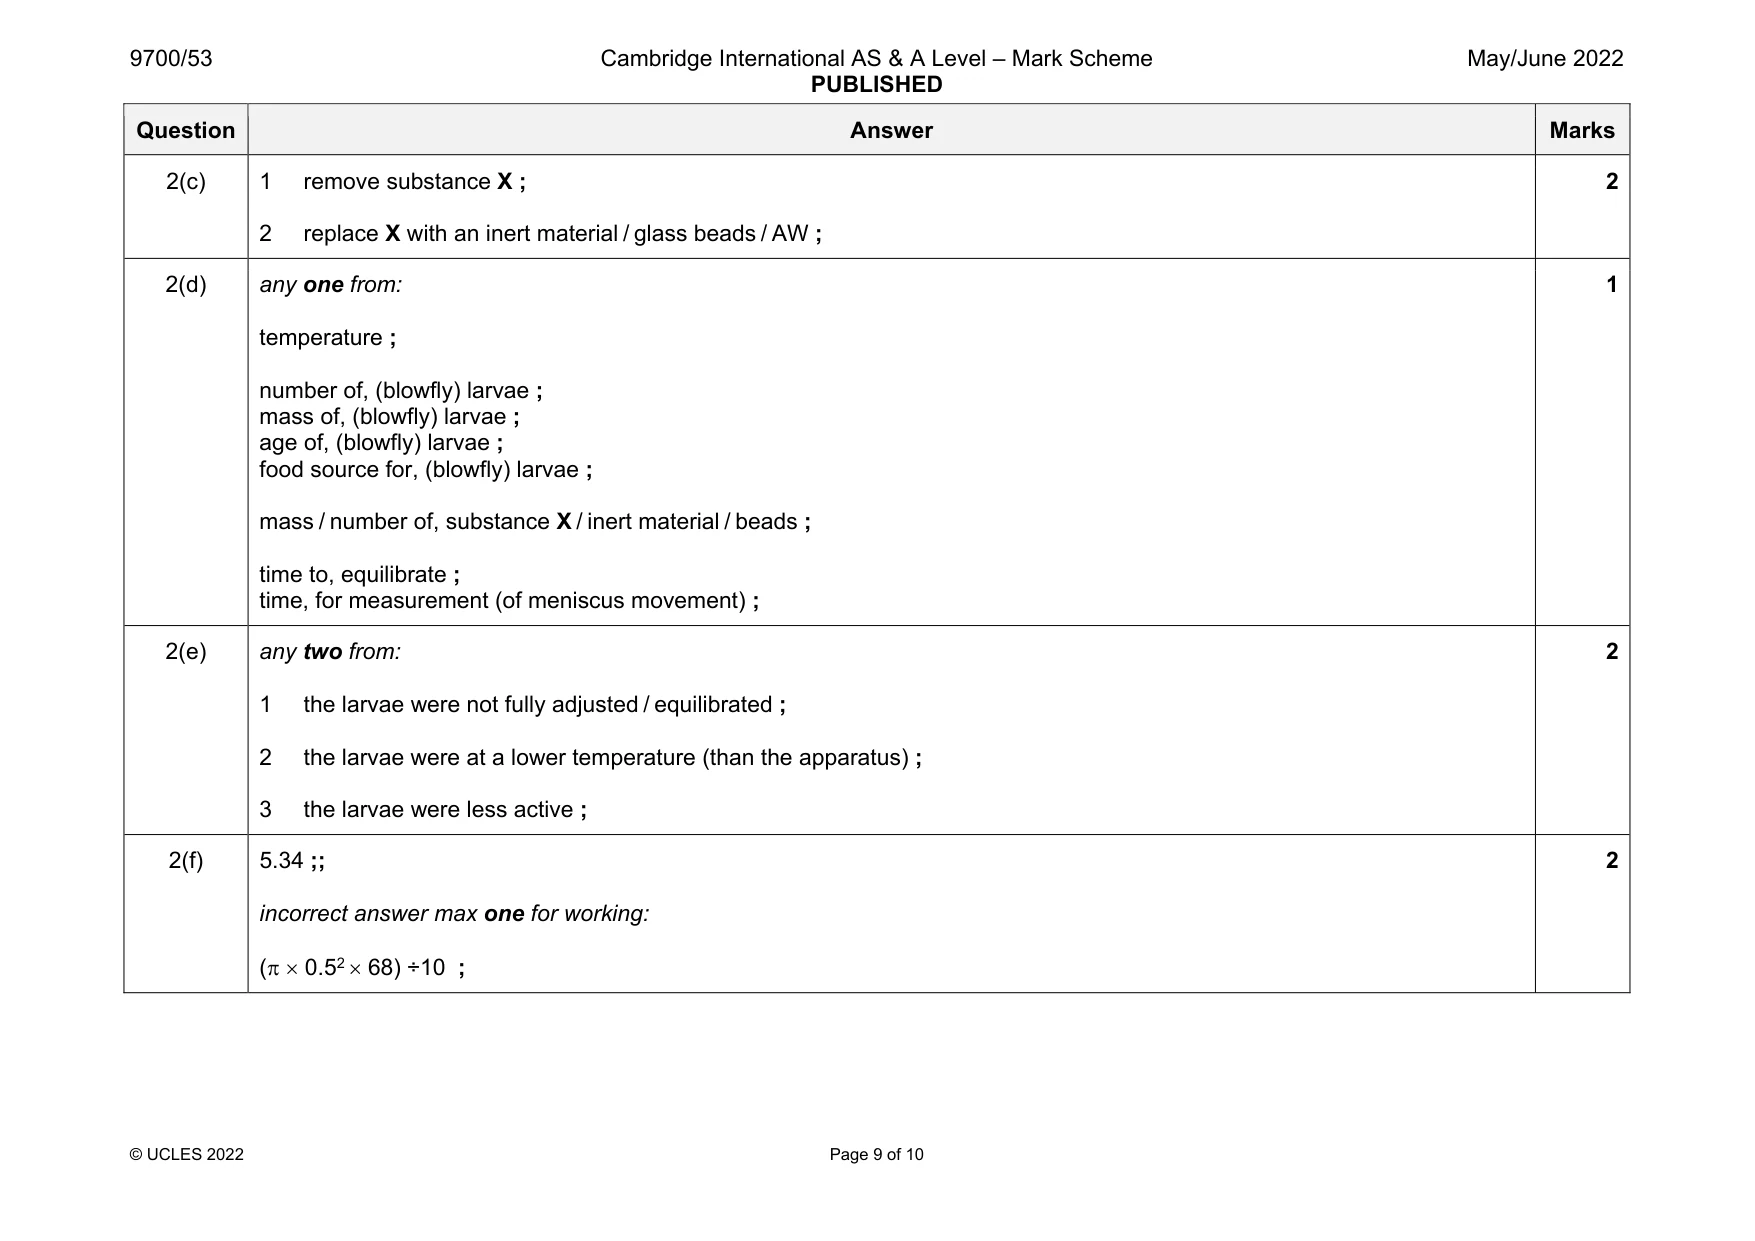
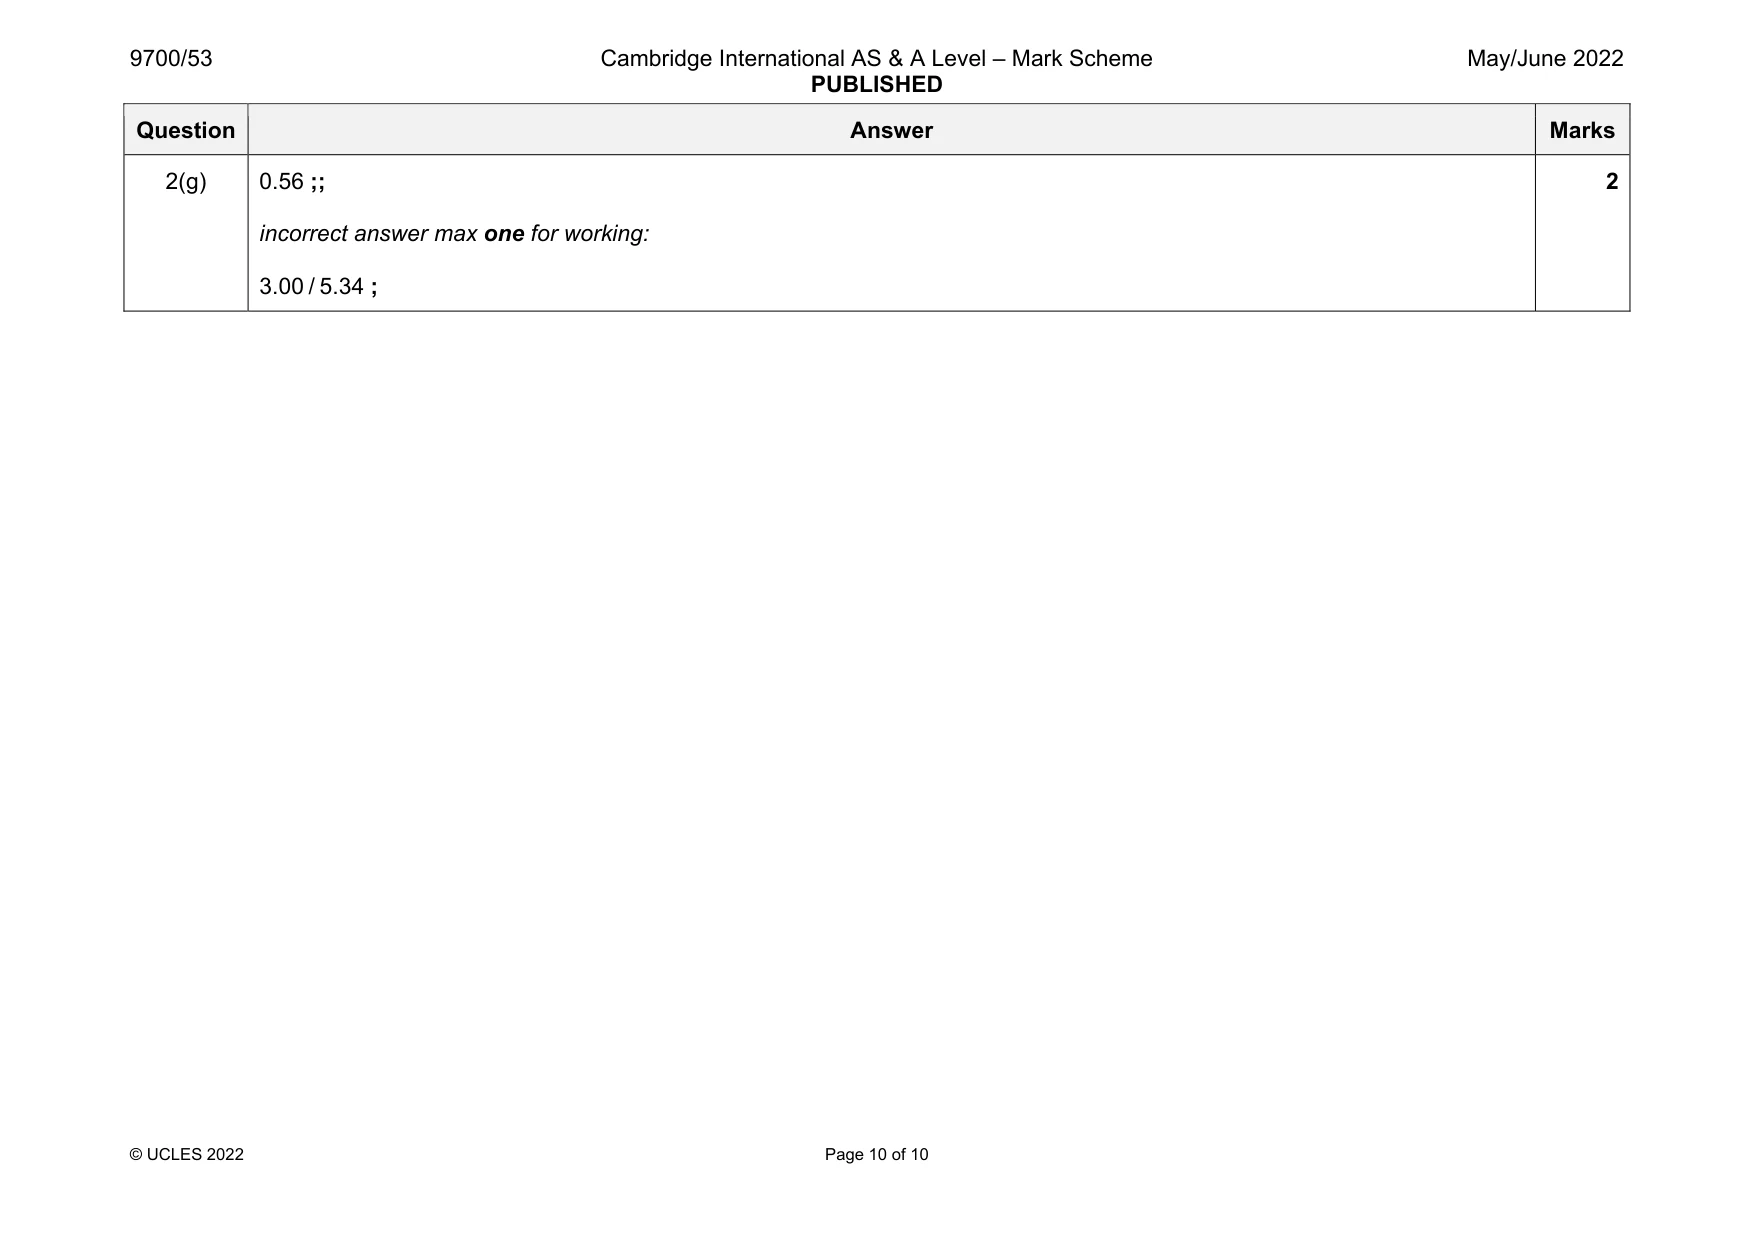
Mark scheme: 2(a) to, absorb / remove / take up, the carbon dioxide produced (during respiration of blowfly larvae) ; 1 2(b) direction the coloured fluid will, move upwards and explanation (oxygen is, taken in / used in respiration) so, decreases the, volume / pressure of gas (in test-tube) ; 1 Question Answer Marks 2(c) 1 remove substance X ; 2 replace X with an inert material / glass beads / AW ; 2 2(d) any one from: temperature ; number of, (blowfly) larvae ; mass of, (blowfly) larvae ; age of, (blowfly) larvae ; food source for, (blowfly) larvae ; mass / number of, substance X / inert material / beads ; time to, equilibrate ; time, for measurement (of meniscus movement) ; 1 2(e) any two from: 1 the larvae were not fully adjusted / equilibrated ; 2 the larvae were at a lower temperature (than the apparatus) ; 3 the larvae were less active ; 2 2(f) 5.34 ;; incorrect answer max one for working: ( 0.52 68) ÷10 ; 2 Question Answer Marks 2(g) 0.56 ;; incorrect answer max one for working: 3.00 / 5.34 ; 2
What was in this paper
The subtopics covered by these 2 questions, and how many questions each got. Open one in a new tab to see every Cambridge question on it.
What you needed in this session
Cambridge’s own grade thresholds for 2022 May/June, Paper 5 · Variant 3. A higher threshold means an easier paper — the bar moves with how the cohort did.