Cambridge A Level Biology 9700 — 2020 Oct/Nov Paper 3 · Variant 5
9700/35/O/N/20 · 2 questions · 40 marks · ≈45 min
The question paper and its mark scheme, free to read here and free to download. This is Cambridge’s own paper, exactly as it was sat.
Question paper16 pages


Mark scheme8 pages
Answers below. Sit the paper first if you are practising.
Questions as text
Q1 · Sucrase is an enzyme which hydrolyses the disaccharide sucrose into reducing sugars, as…
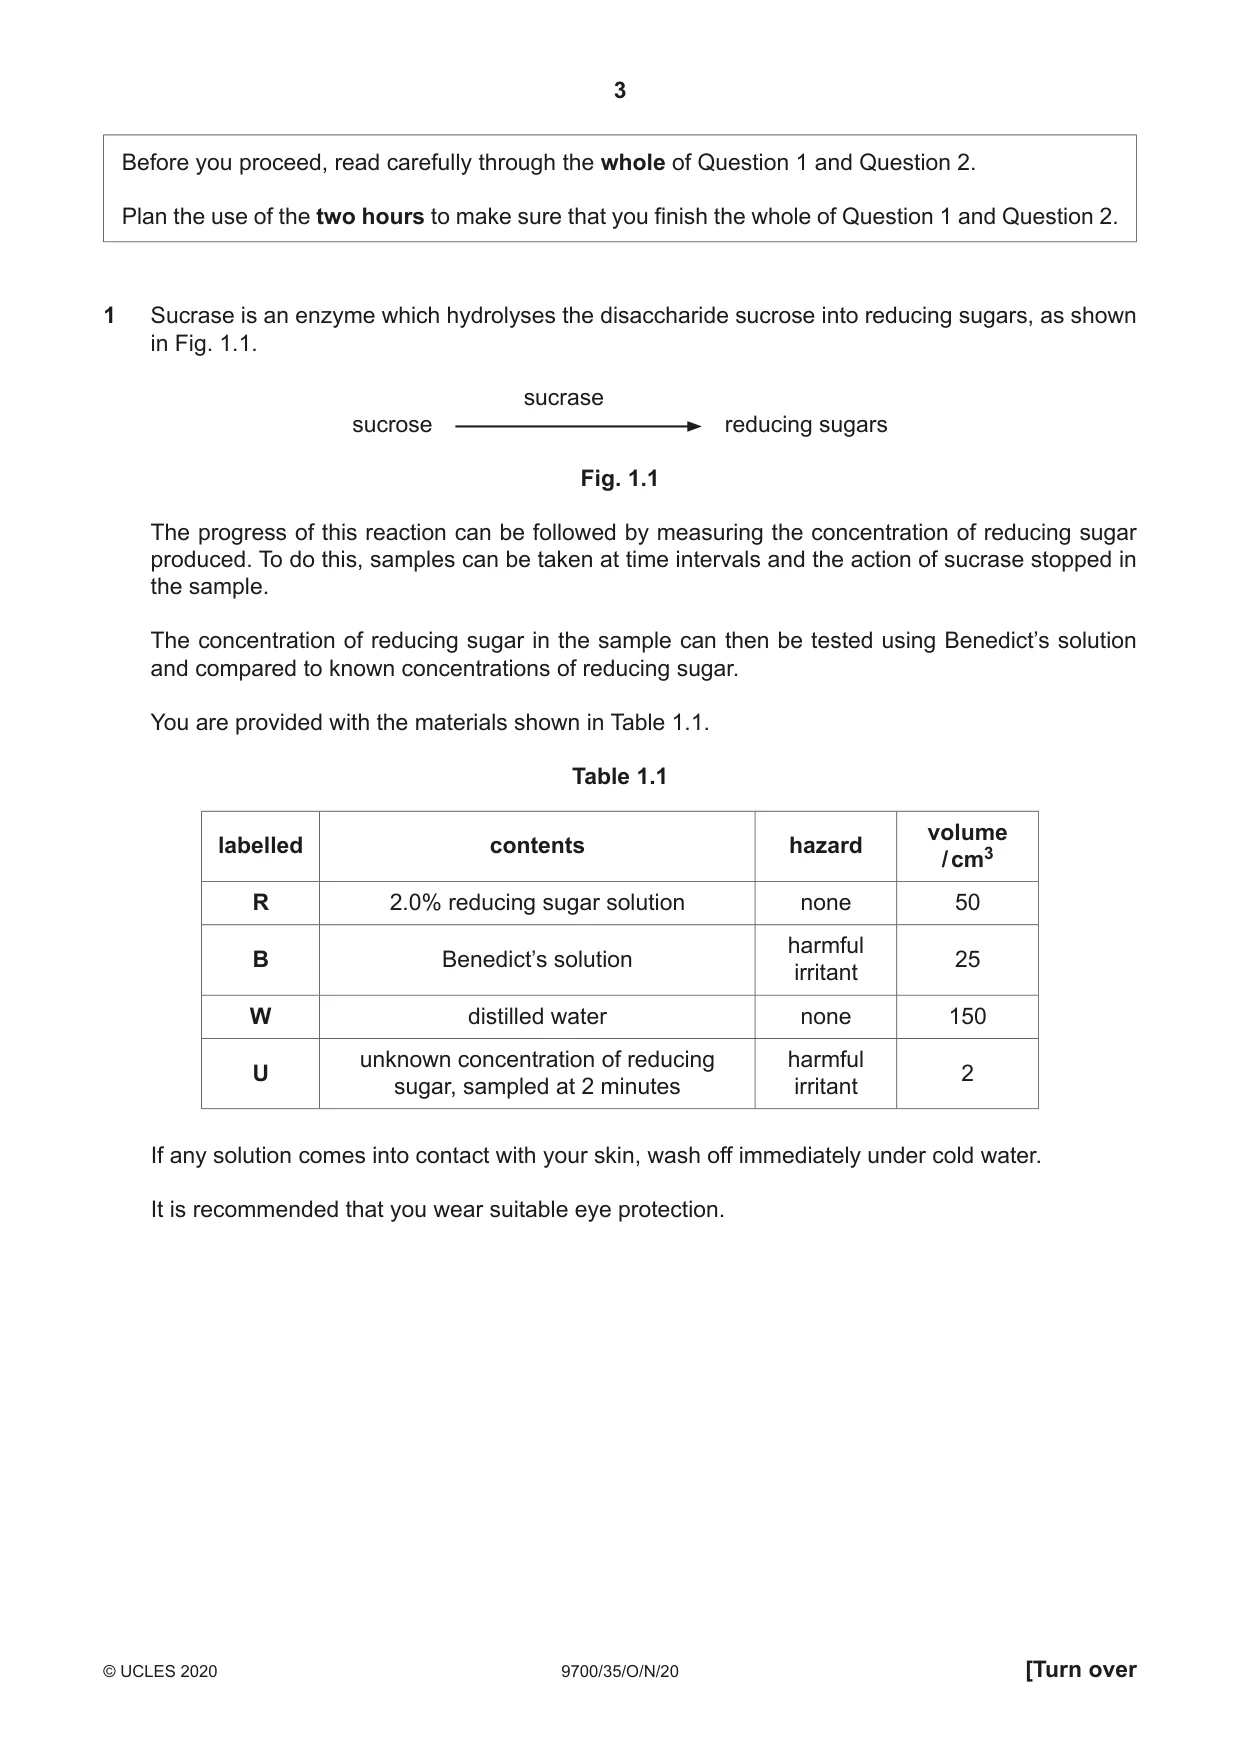
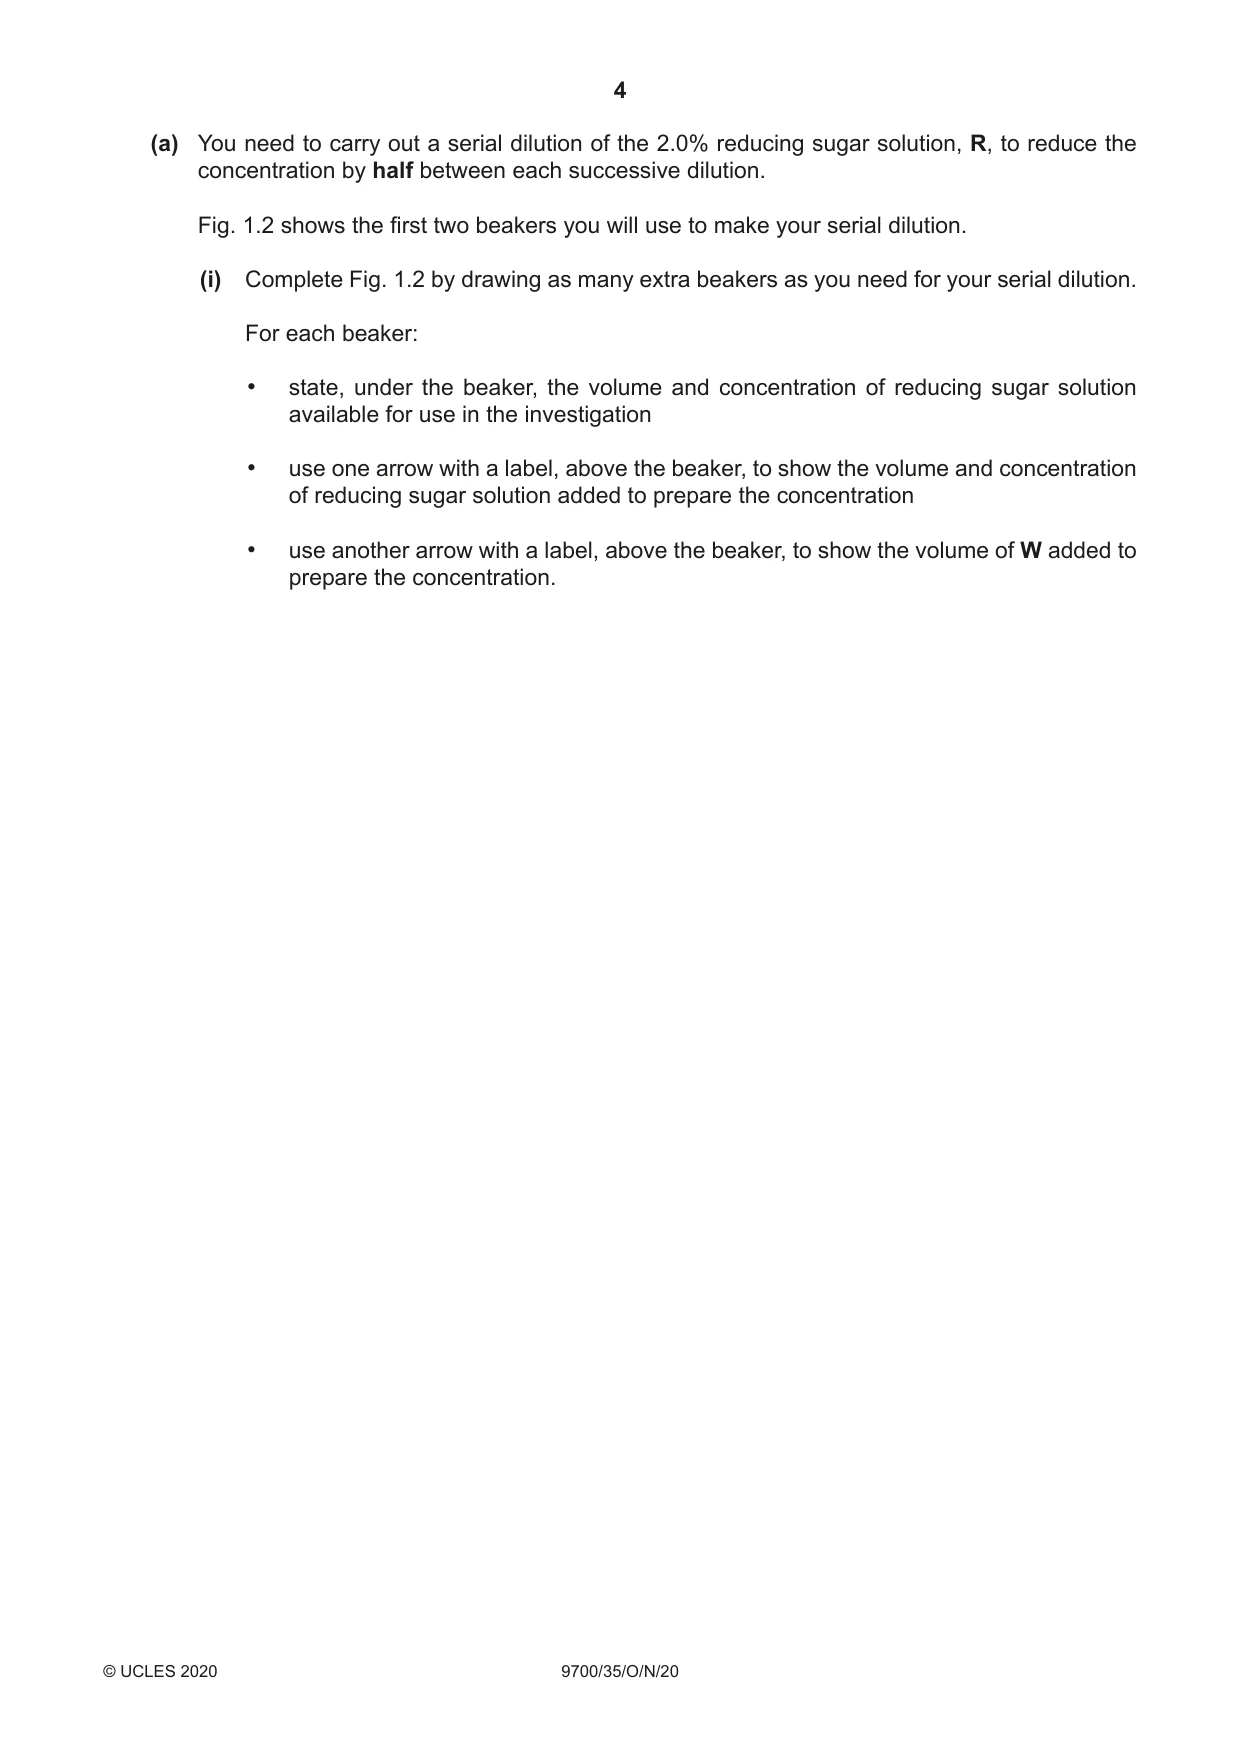
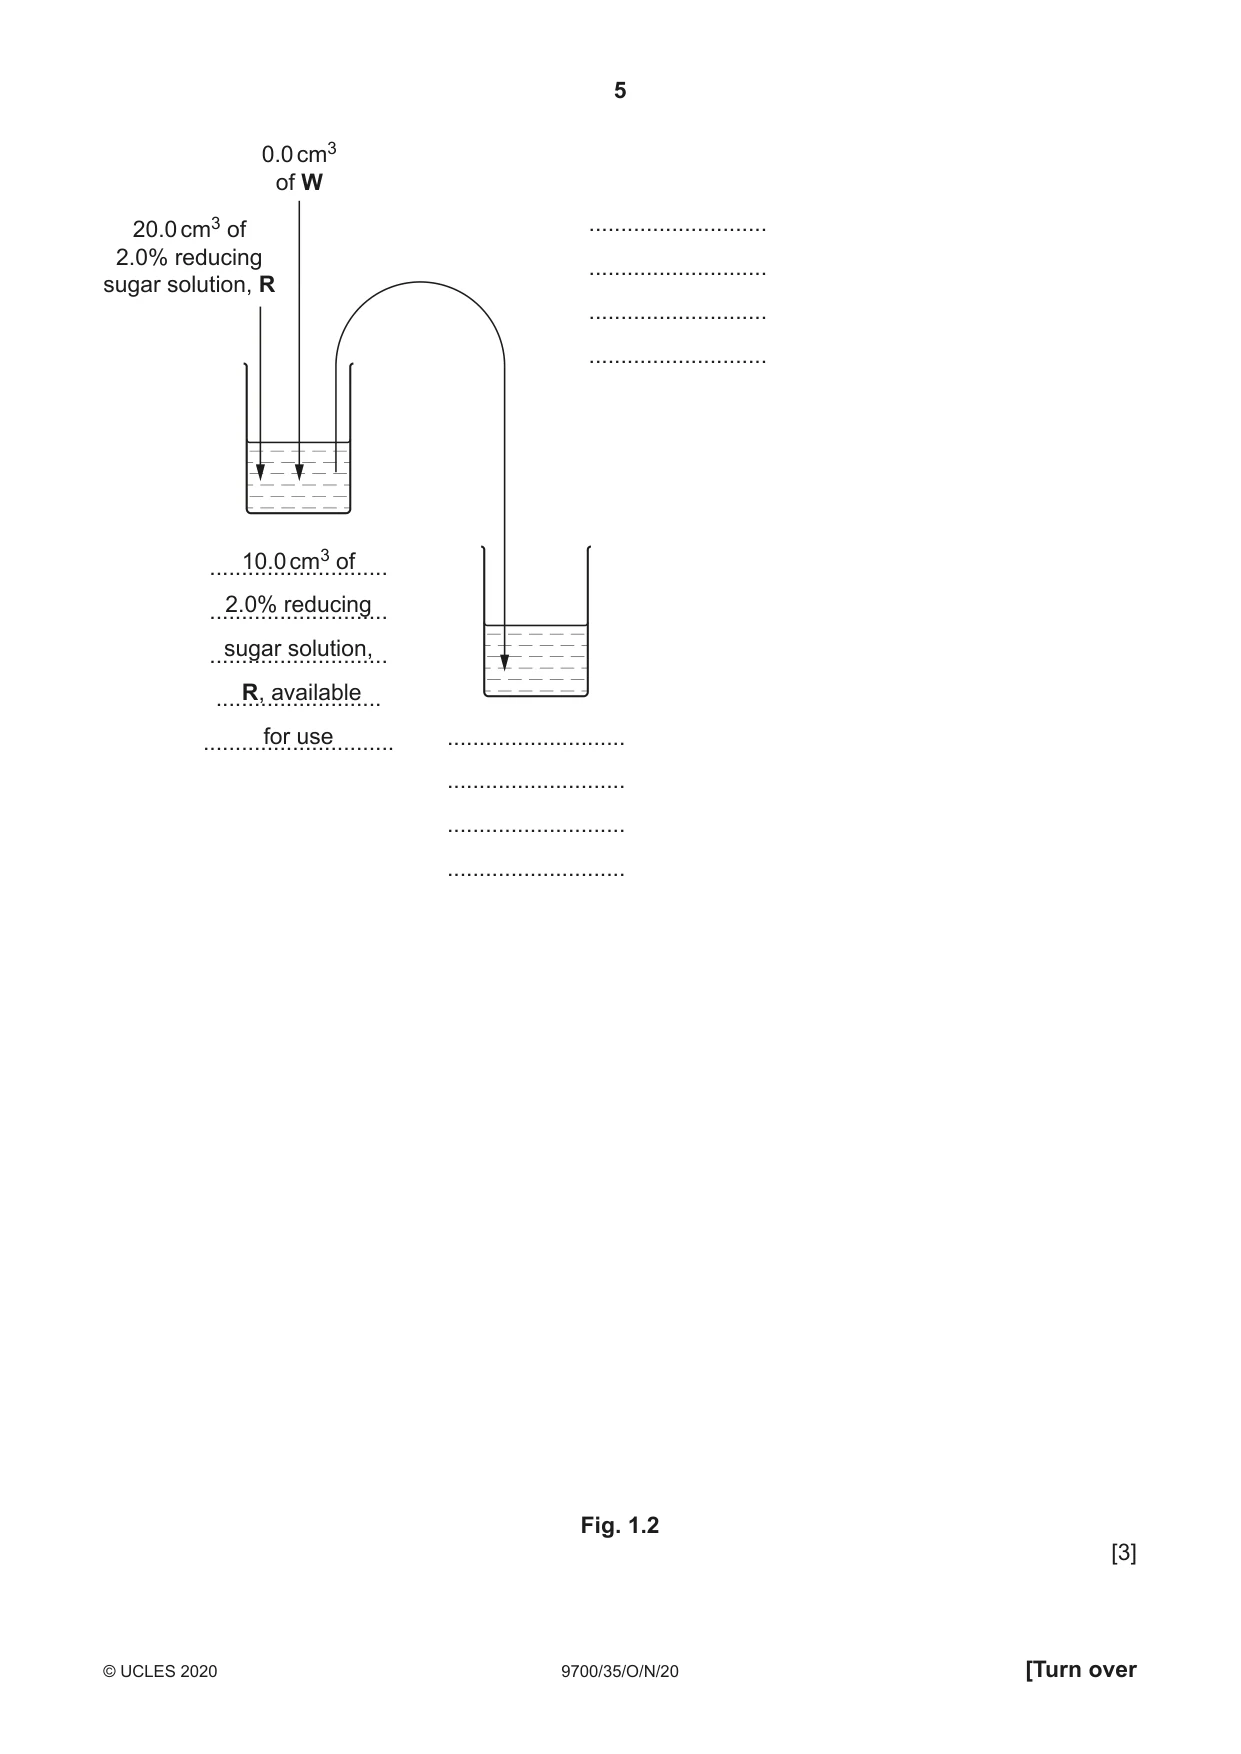
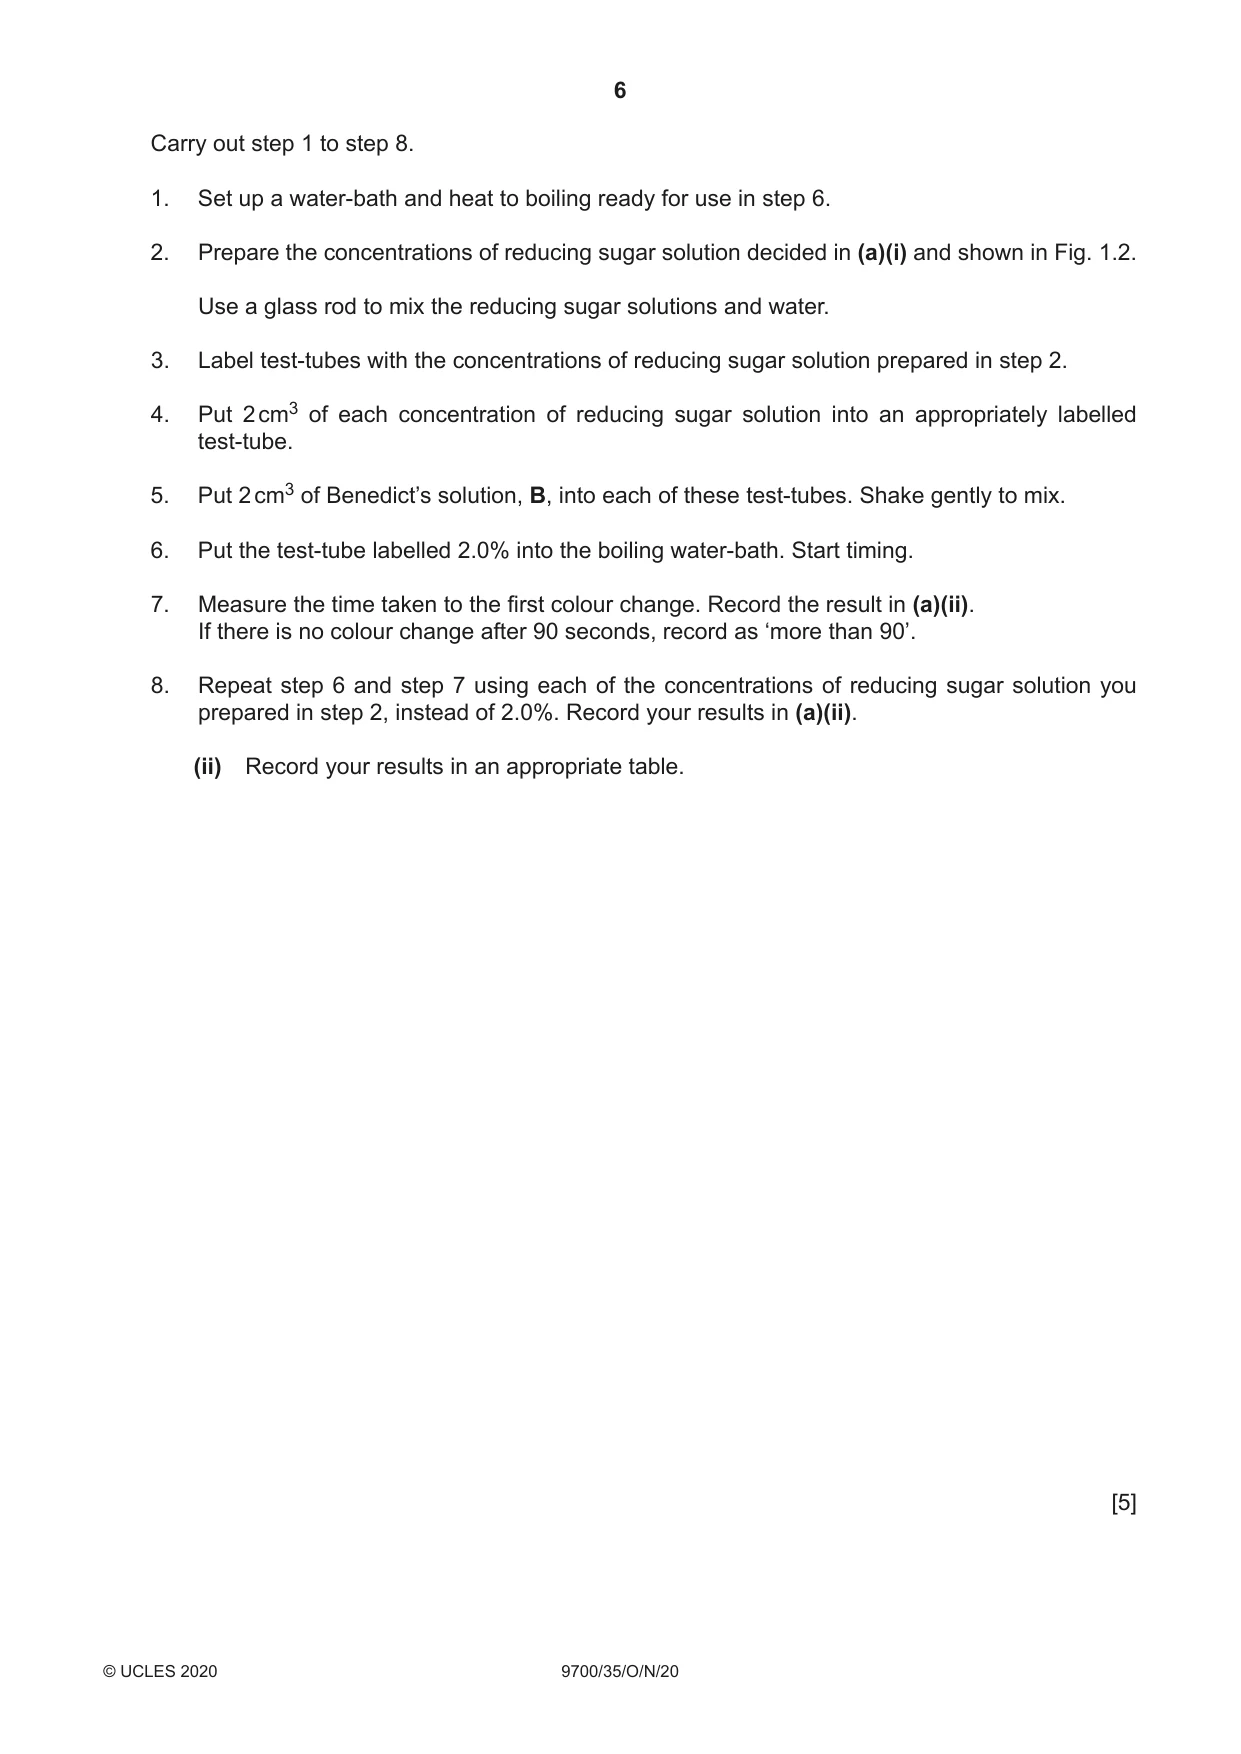
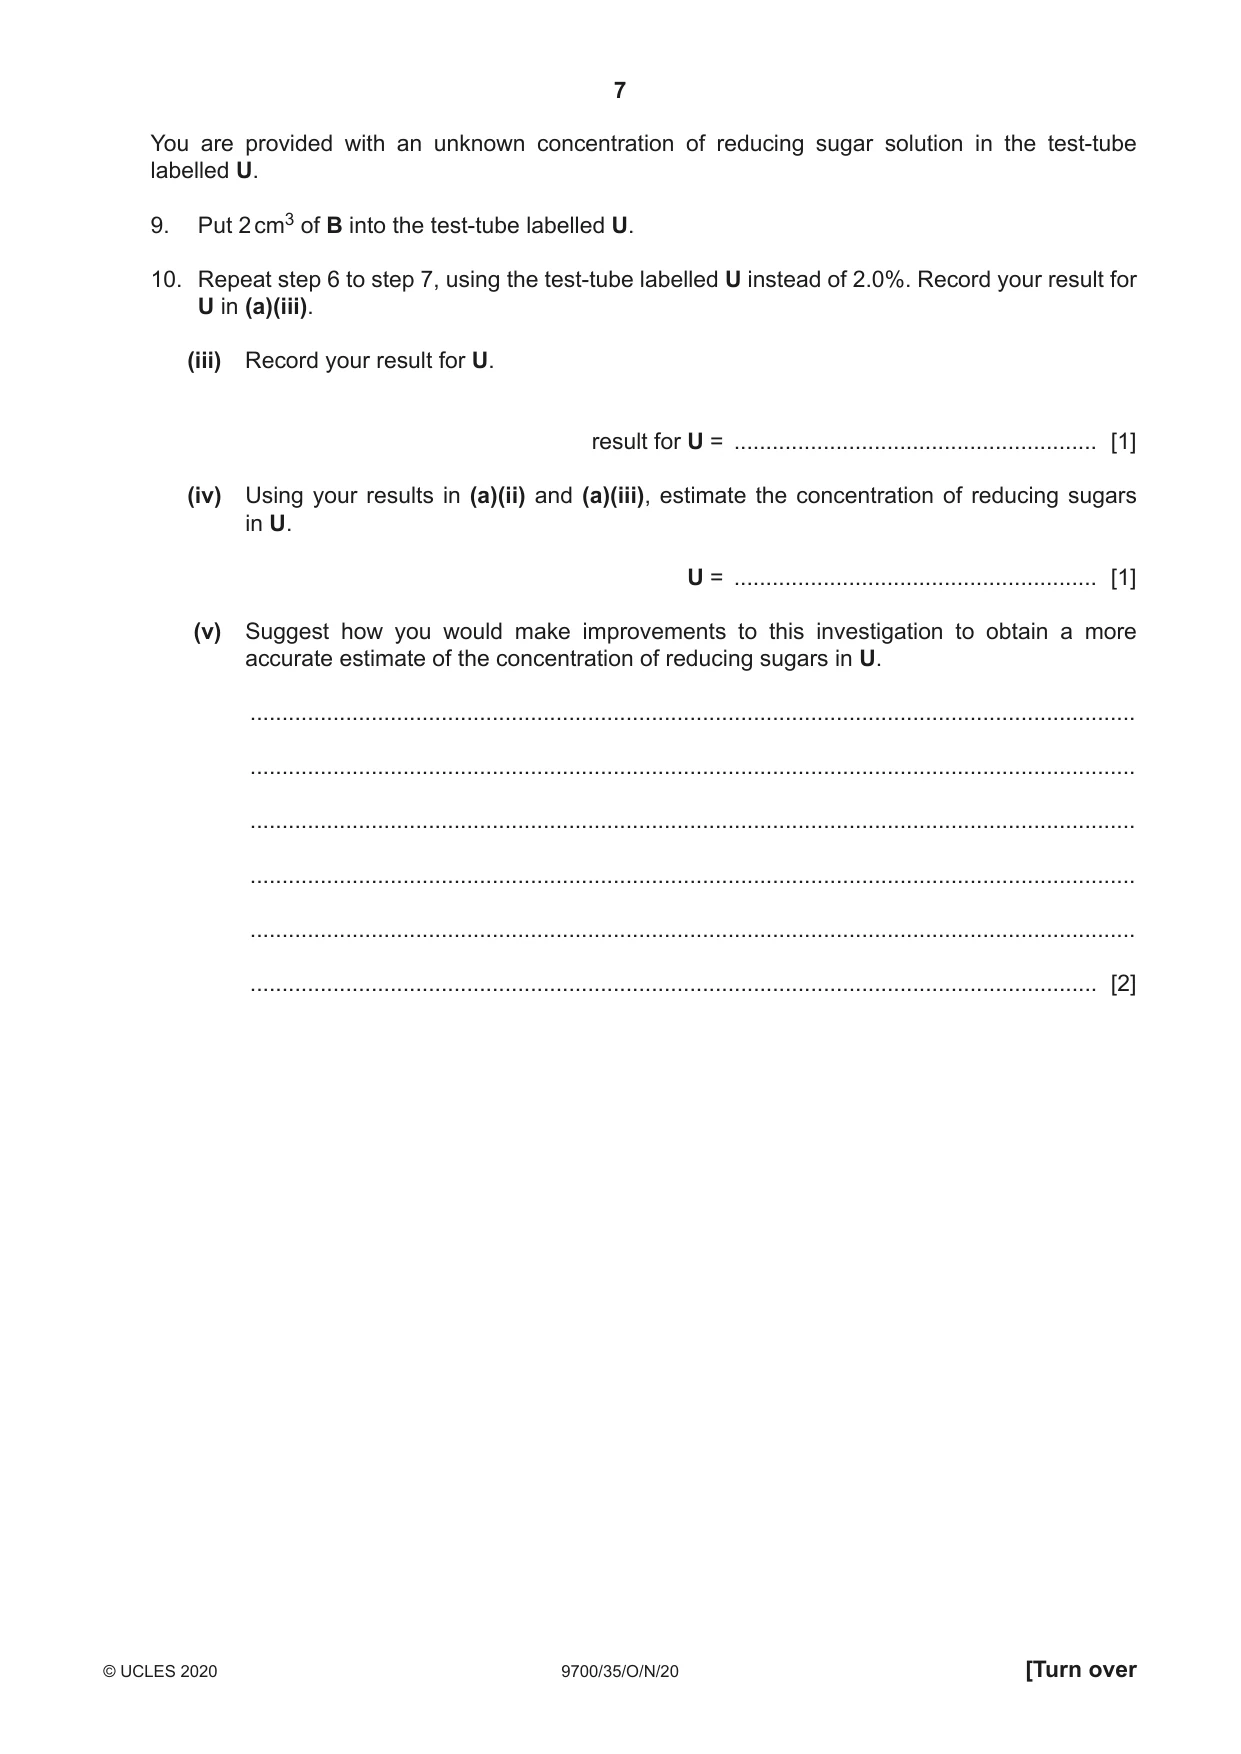
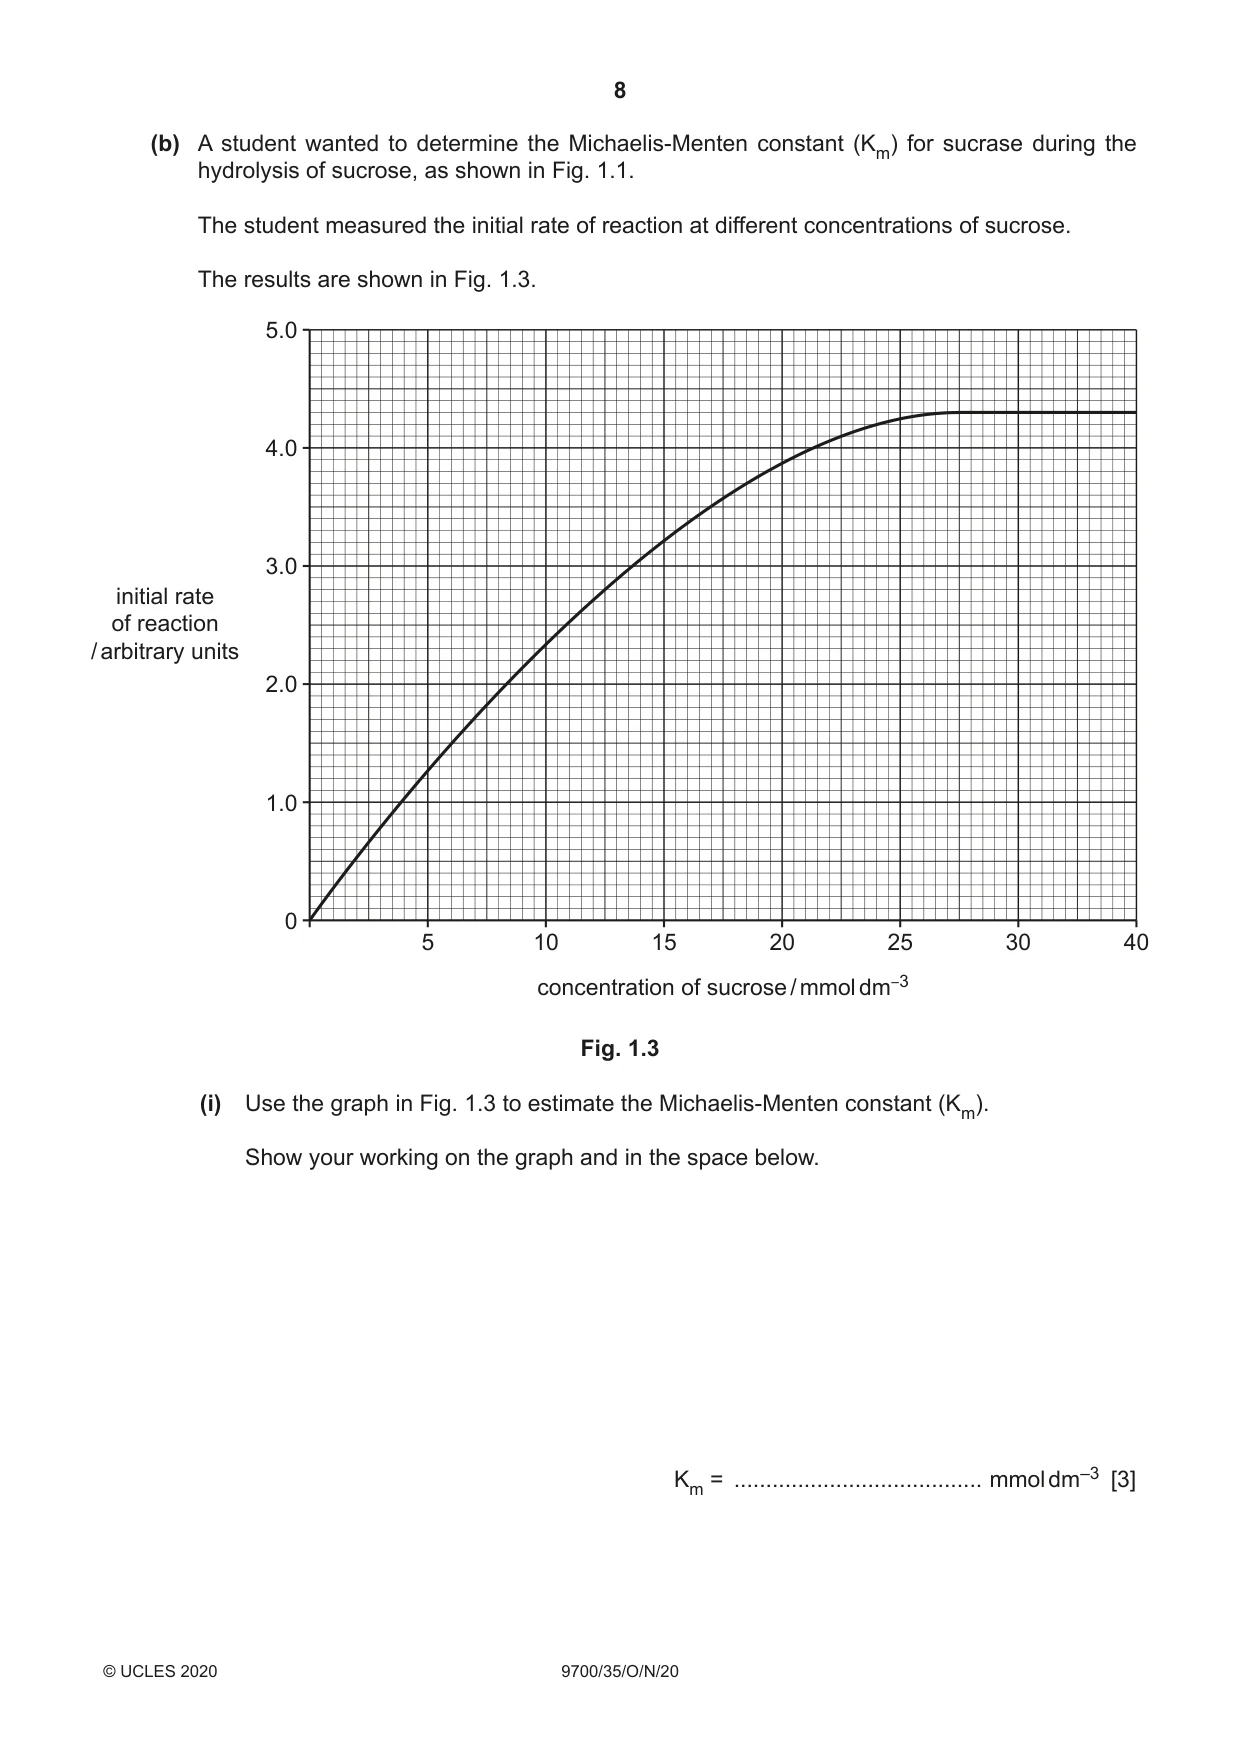
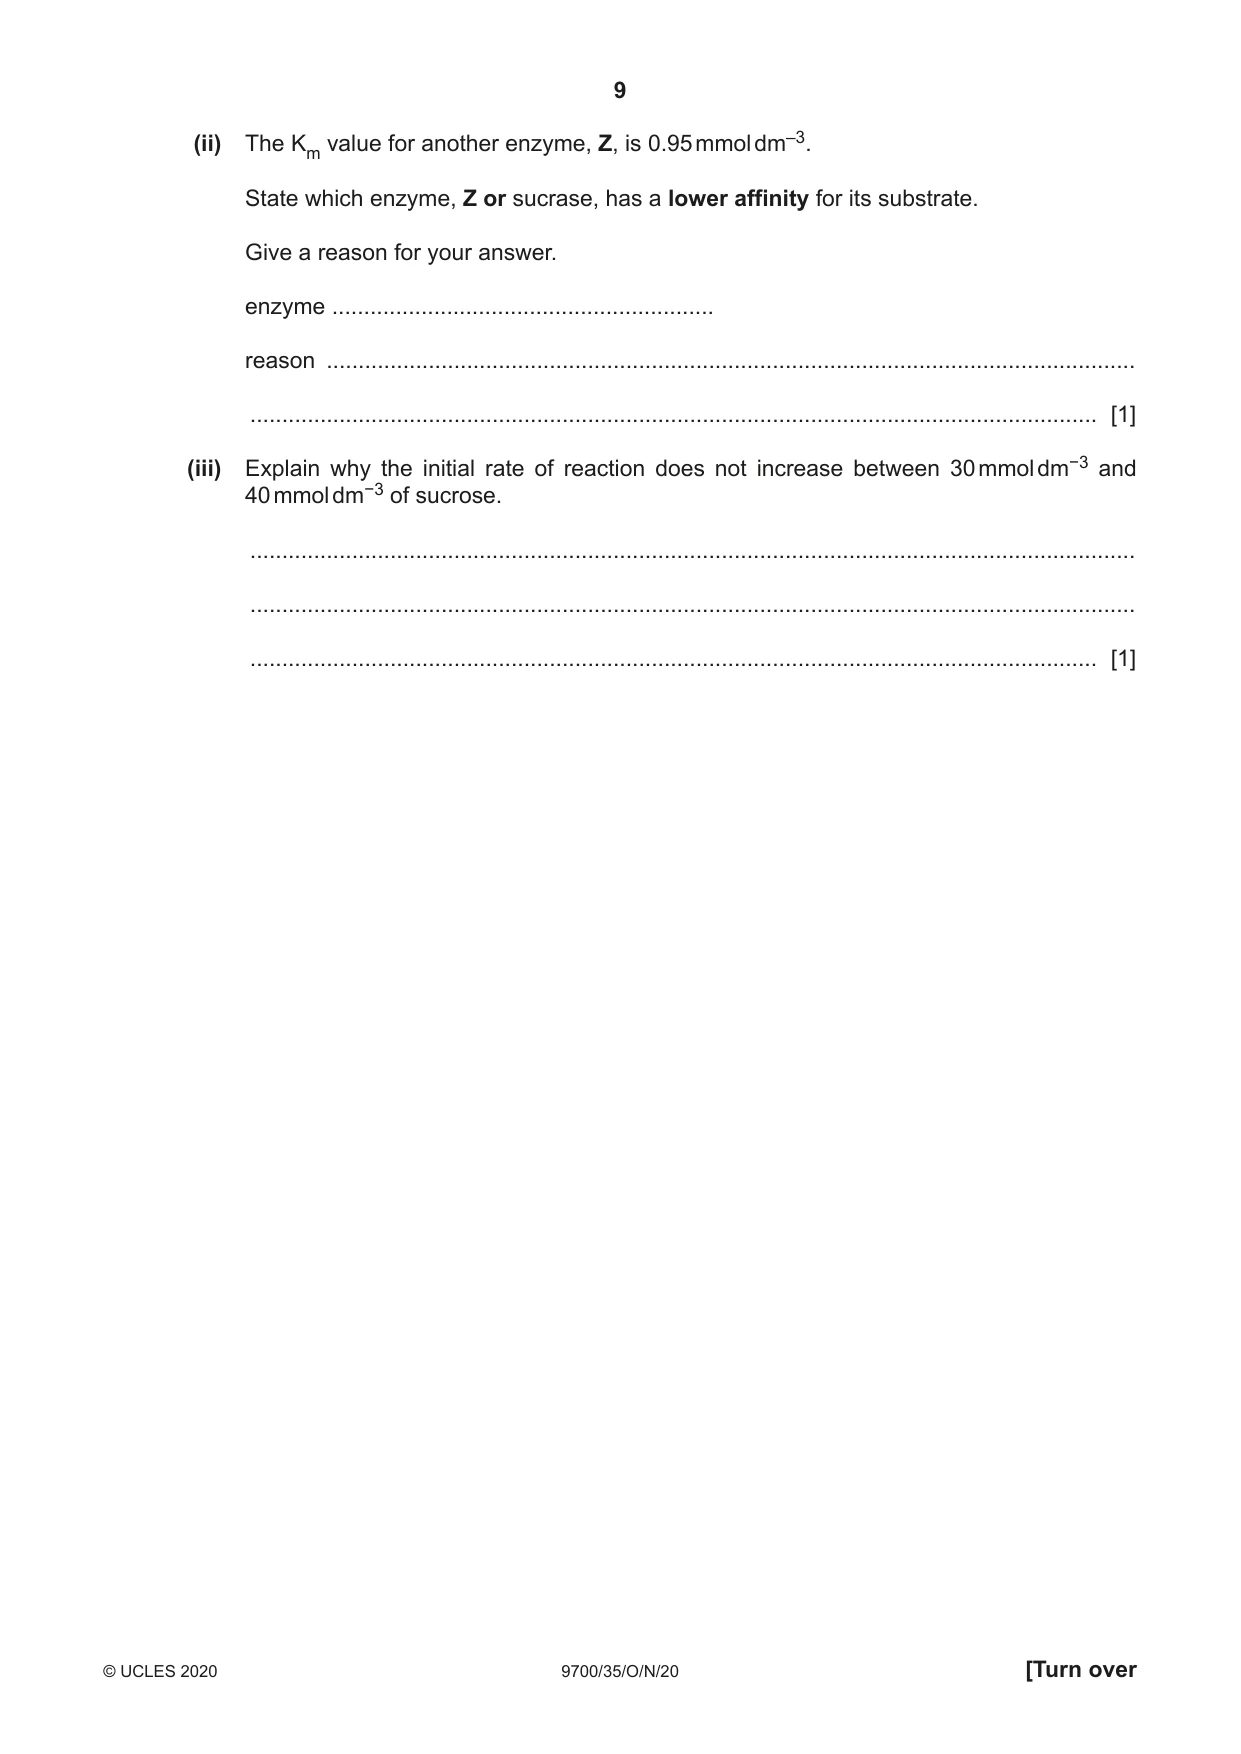
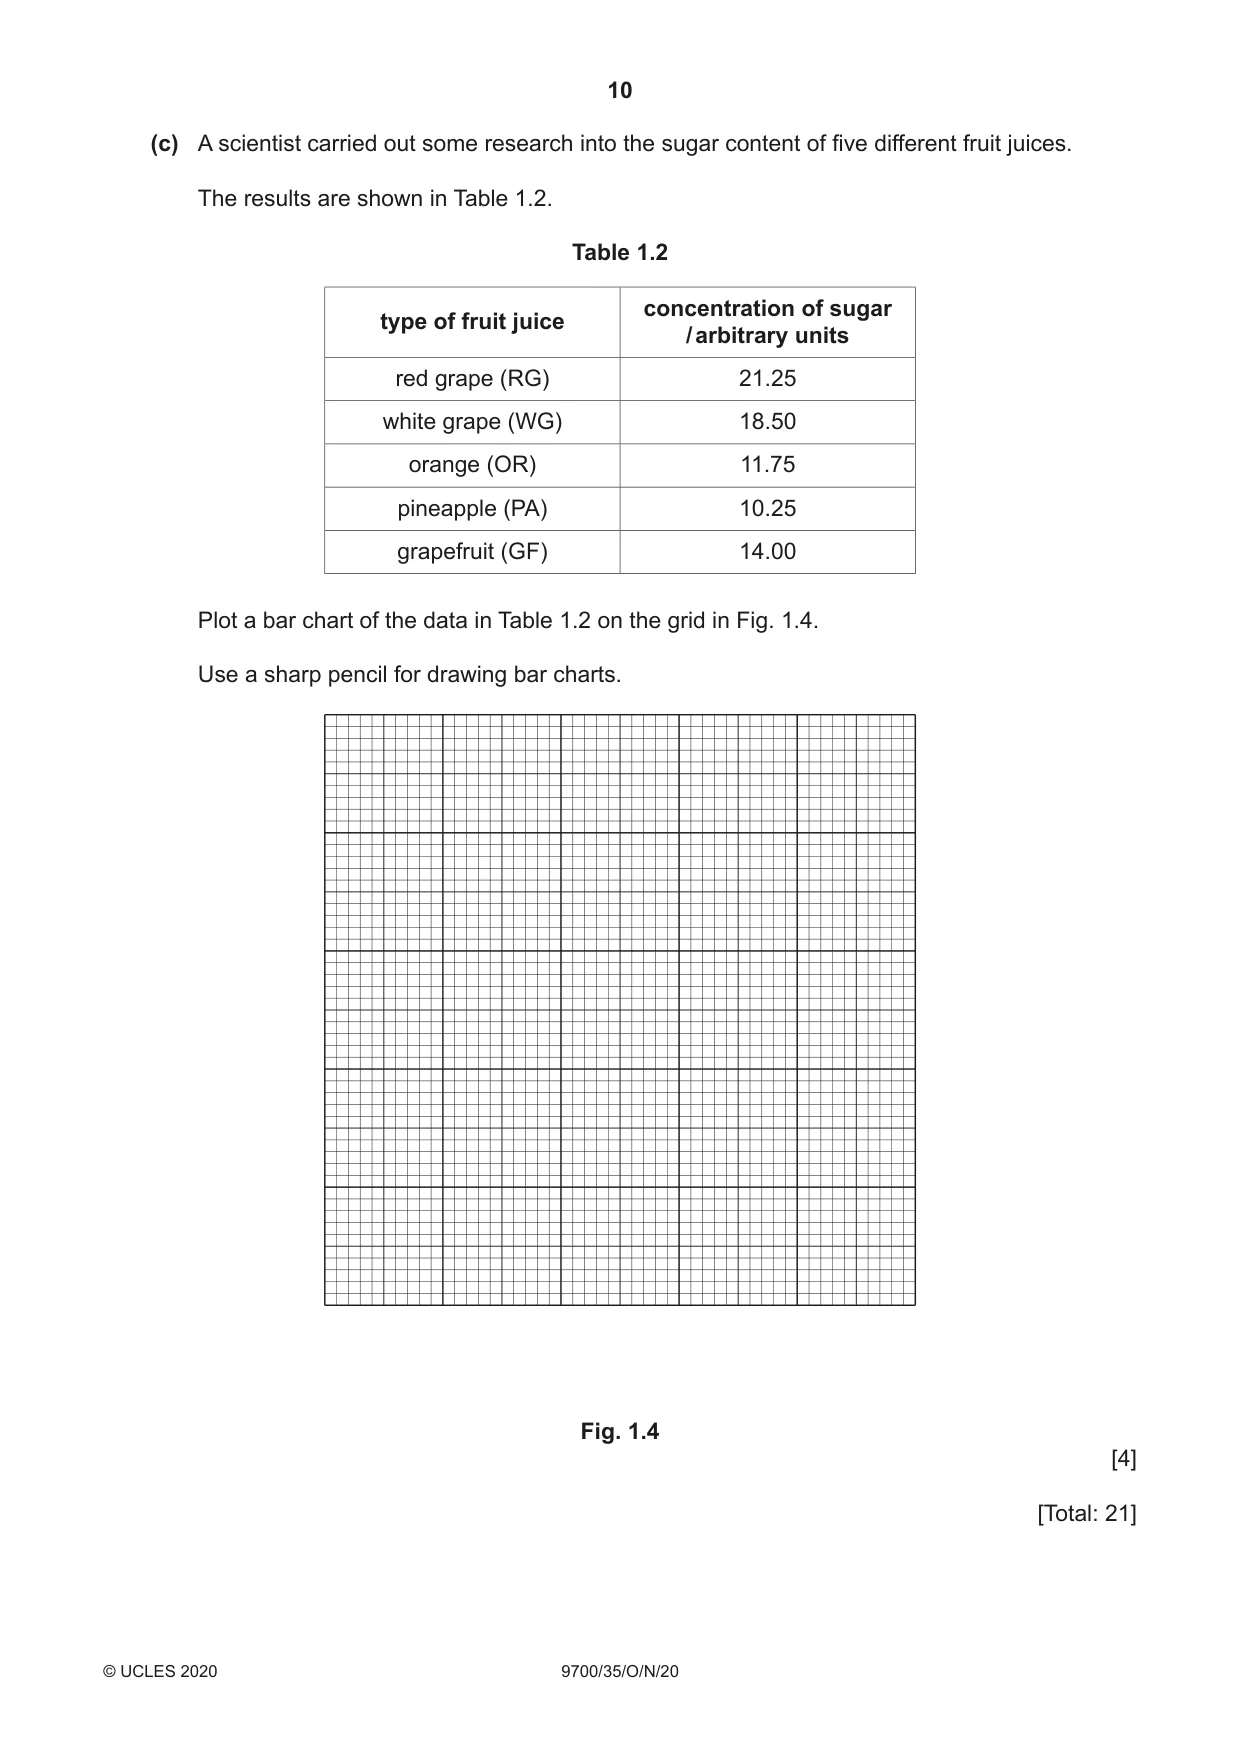
1 Sucrase is an enzyme which hydrolyses the disaccharide sucrose into reducing sugars, as shown in Fig. 1.1. sucrase sucrose reducing sugars Fig. 1.1 The progress of this reaction can be followed by measuring the concentration of reducing sugar produced. To do this, samples can be taken at time intervals and the action of sucrase stopped in the sample. The concentration of reducing sugar in the sample can then be tested using Benedict’s solution and compared to known concentrations of reducing sugar. You are provided with the materials shown in Table 1.1. Table 1.1 volume labelled contents hazard / cm3 R 2.0% reducing sugar solution none 50 harmful B Benedict’s solution 25 irritant W distilled water none 150 unknown concentration of reducing harmful U 2 sugar, sampled at 2 minutes irritant If any solution comes into contact with your skin, wash off immediately under cold water. It is recommended that you wear suitable eye protection. (a) You need to carry out a serial dilution of the 2.0% reducing sugar solution, R, to reduce the concentration by half between each successive dilution. Fig. 1.2 shows the first two beakers you will use to make your serial dilution. (i) Complete Fig. 1.2 by drawing as many extra beakers as you need for your serial dilution. For each beaker: • state, under the beaker, the volume and concentration of reducing sugar solution available for use in the investigation • use one arrow with a label, above the beaker, to show the volume and concentration of reducing sugar solution added to prepare the concentration • use another arrow with a label, above the beaker, to show the volume of W added to prepare the concentration. 0.0 cm3 of W 20.0 cm3 of ............................ 2.0% reducing ............................ sugar solution, R ............................ ............................ 10.0 cm3 of ............................ 2.0% reducing ............................ sugar solution, ............................ ..........................R, available for use ............................ .............................. ............................ ............................ ............................ Fig. 1.2 [3] Carry out step 1 to step 8. 1. Set up a water-bath and heat to boiling ready for use in step 6. 2. Prepare the concentrations of reducing sugar solution decided in (a)(i) and shown in Fig. 1.2. Use a glass rod to mix the reducing sugar solutions and water. 3. Label test-tubes with the concentrations of reducing sugar solution prepared in step 2. 4. Put 2 cm3 of each concentration of reducing sugar solution into an appropriately labelled test-tube. 5. Put 2 cm3 of Benedict’s solution, B, into each of these test-tubes. Shake gently to mix. 6. Put the test-tube labelled 2.0% into the boiling water-bath. Start timing. 7. Measure the time taken to the first colour change. Record the result in (a)(ii). If there is no colour change after 90 seconds, record as ‘more than 90’. 8. Repeat step 6 and step 7 using each of the concentrations of reducing sugar solution you prepared in step 2, instead of 2.0%. Record your results in (a)(ii). (ii) Record your results in an appropriate table. [5] You are provided with an unknown concentration of reducing sugar solution in the test-tube labelled U. 9. Put 2 cm3 of B into the test-tube labelled U. 10. Repeat step 6 to step 7, using the test-tube labelled U instead of 2.0%. Record your result for U in (a)(iii). (iii) Record your result for U. result for U = ......................................................... [1] (iv) Using your results in (a)(ii) and (a)(iii), estimate the concentration of reducing sugars in U. U = ......................................................... [1] (v) Suggest how you would make improvements to this investigation to obtain a more accurate estimate of the concentration of reducing sugars in U. ........................................................................................................................................... ........................................................................................................................................... ........................................................................................................................................... ........................................................................................................................................... ........................................................................................................................................... ..................................................................................................................................... [2] (b) A student wanted to determine the Michaelis-Menten constant (Km) for sucrase during the hydrolysis of sucrose, as shown in Fig. 1.1. The student measured the initial rate of reaction at different concentrations of sucrose. The results are shown in Fig. 1.3. 5.0 4.0 3.0 initial rate of reaction / arbitrary units 2.0 1.0 0 5 10 15 20 25 30 40 concentration of sucrose / mmol dm–3 Fig. 1.3 (i) Use the graph in Fig. 1.3 to estimate the Michaelis-Menten constant (Km). Show your working on the graph and in the space below. Km = ....................................... mmol dm–3 [3] (ii) The Km value for another enzyme, Z, is 0.95 mmol dm–3. State which enzyme, Z or sucrase, has a lower affinity for its substrate. Give a reason for your answer. enzyme ............................................................ reason ............................................................................................................................... ..................................................................................................................................... [1] (iii) Explain why the initial rate of reaction does not increase between 30 mmol dm−3 and 40 mmol dm−3 of sucrose. ........................................................................................................................................... ........................................................................................................................................... ..................................................................................................................................... [1] (c) A scientist carried out some research into the sugar content of five different fruit juices. The results are shown in Table 1.2. Table 1.2 concentration of sugar type of fruit juice / arbitrary units red grape (RG) 21.25 white grape (WG) 18.50 orange (OR) 11.75 pineapple (PA) 10.25 grapefruit (GF) 14.00 Plot a bar chart of the data in Table 1.2 on the grid in Fig. 1.4. Use a sharp pencil for drawing bar charts. Fig. 1.4 [4] [Total: 21]
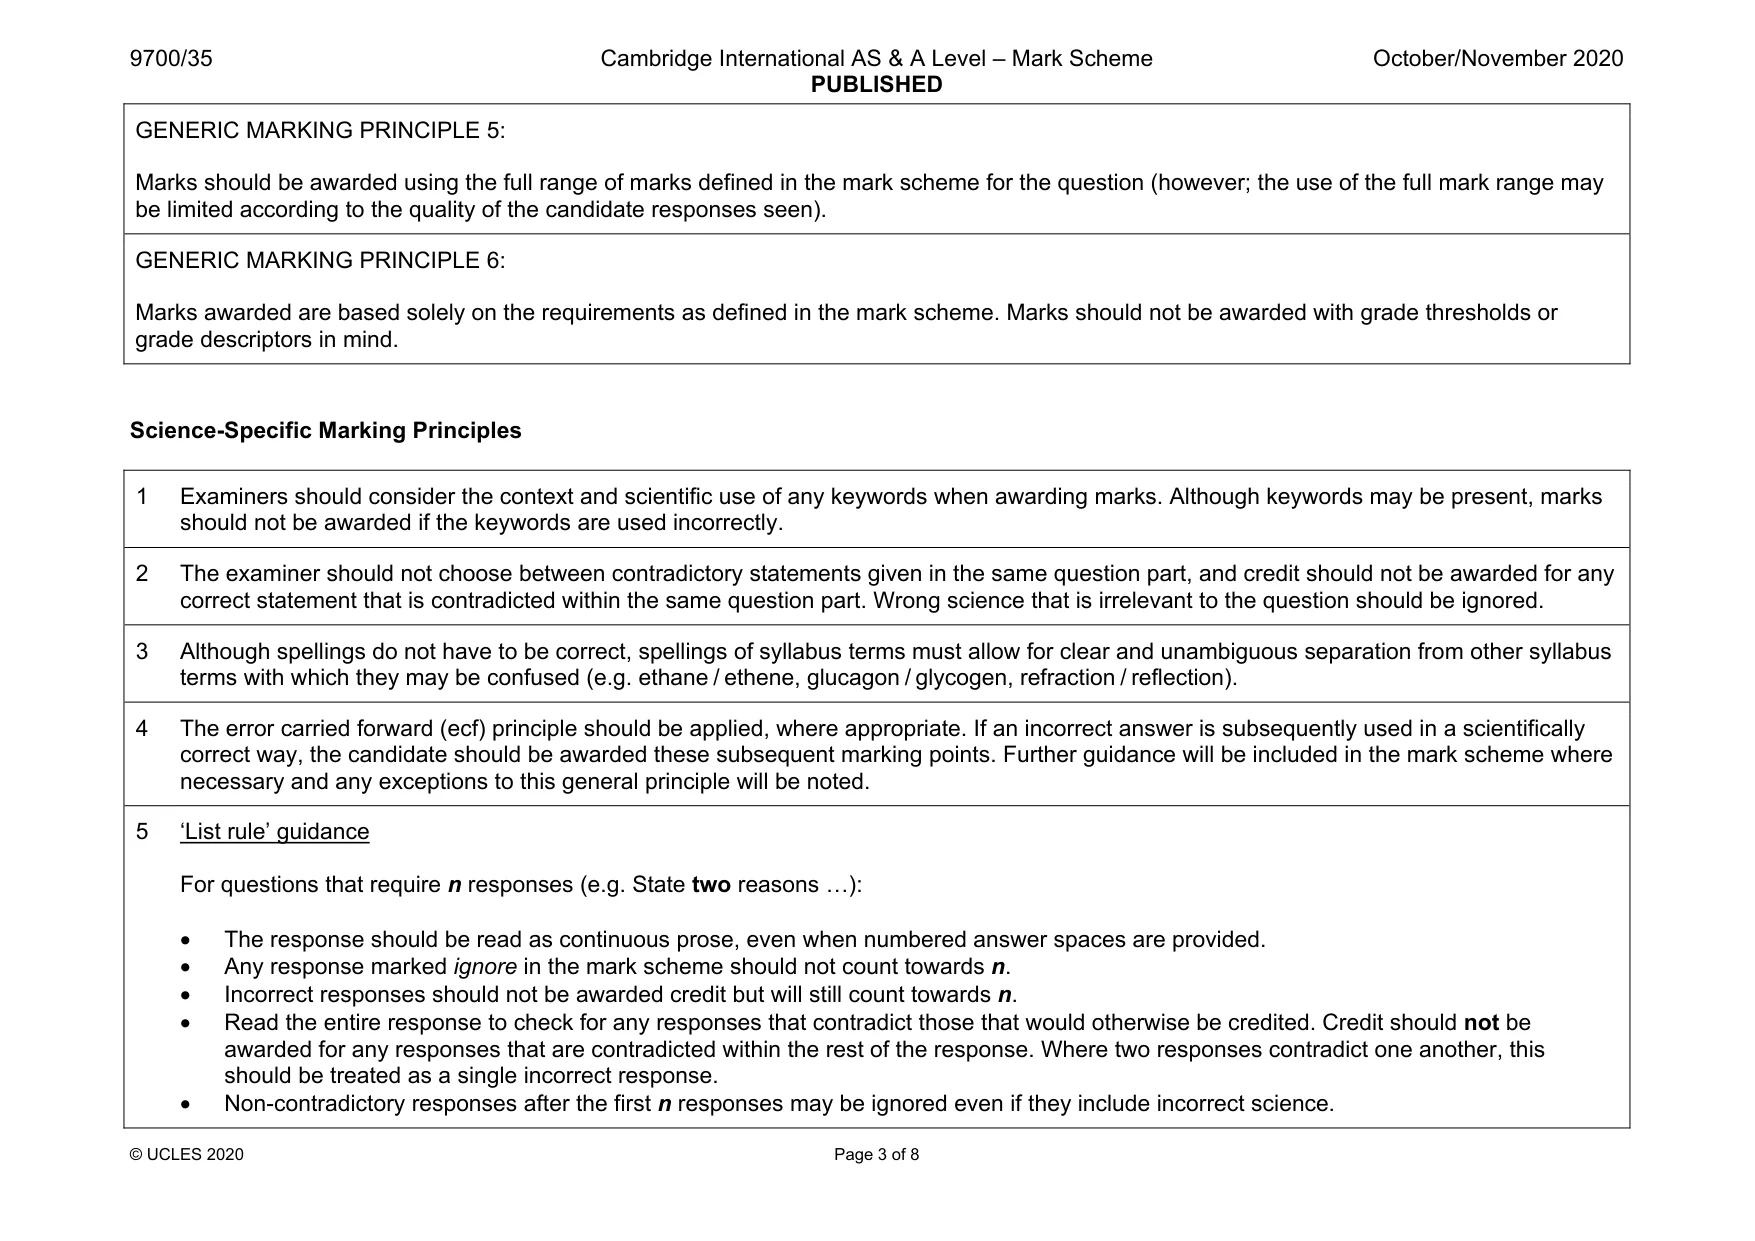
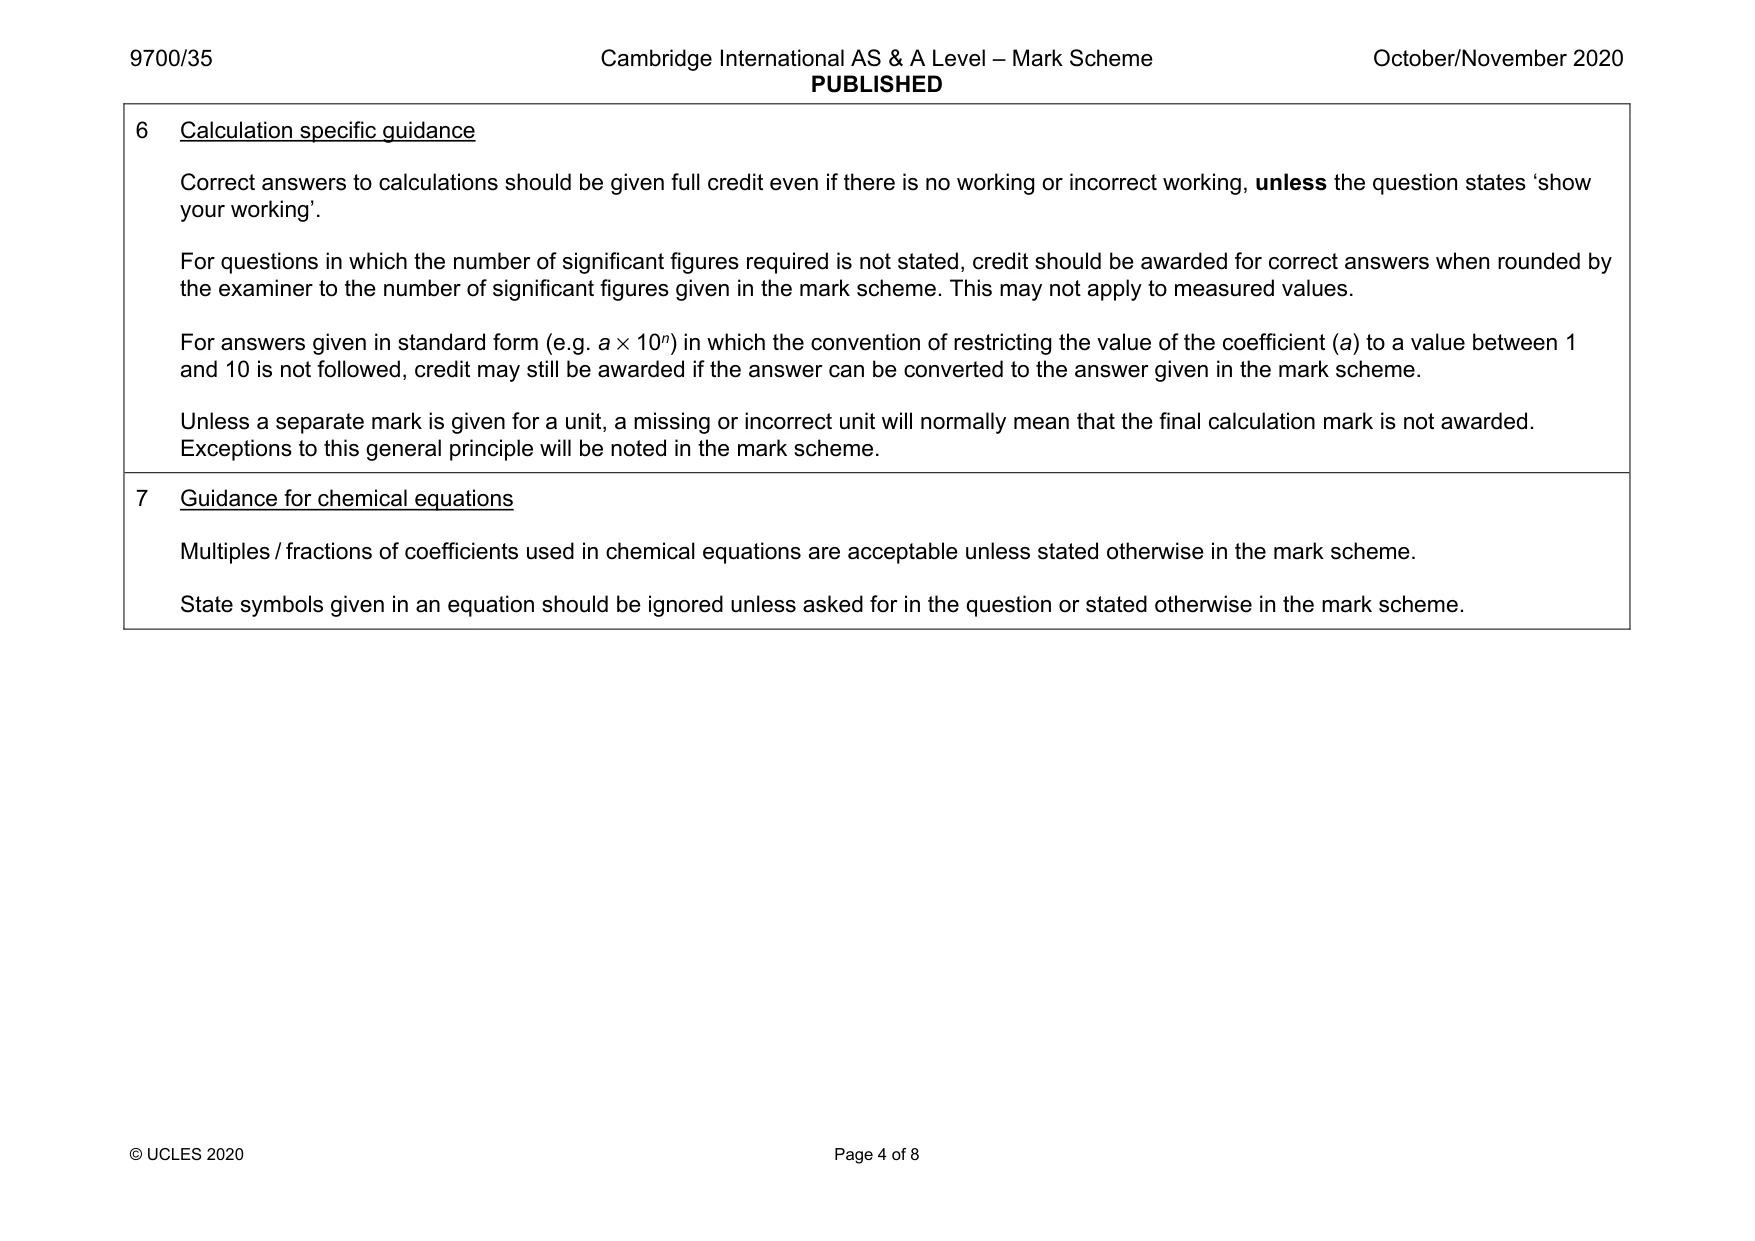
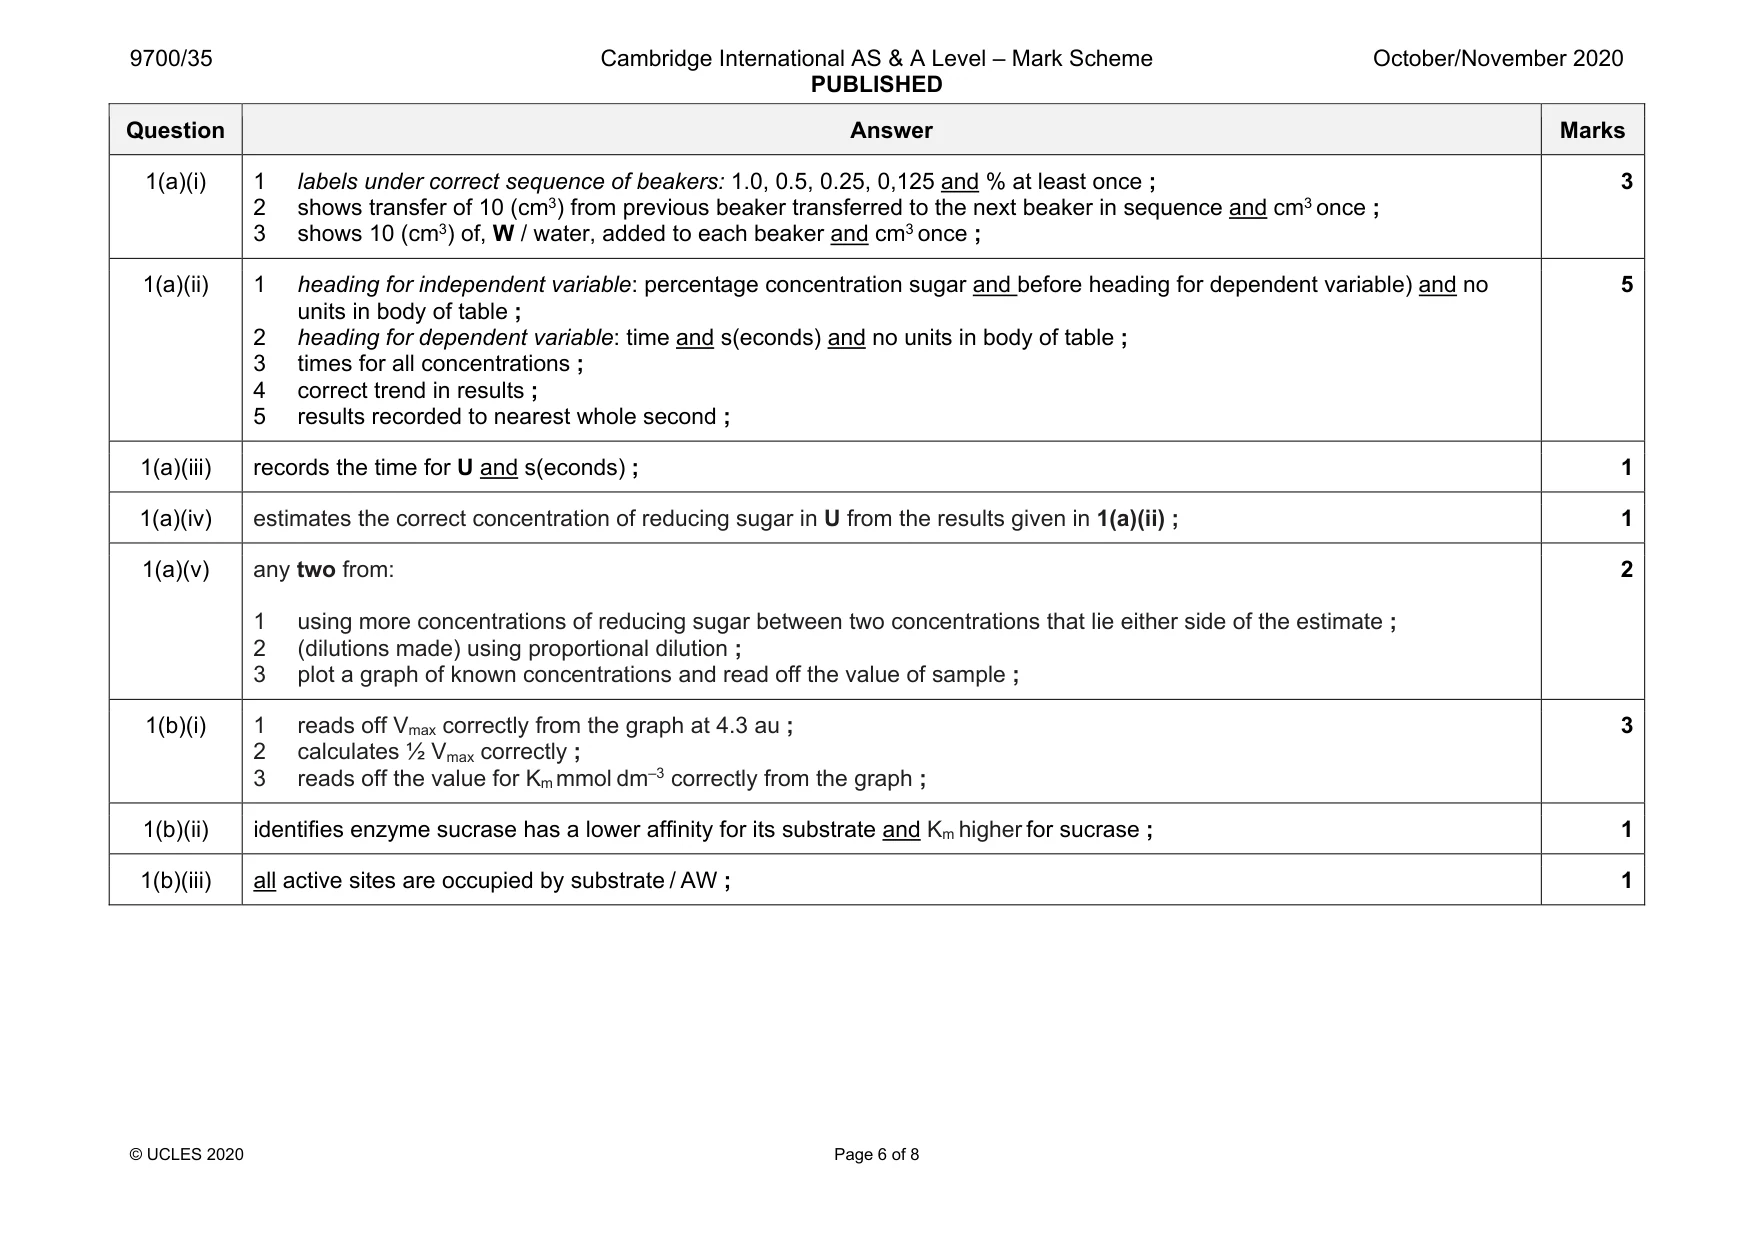
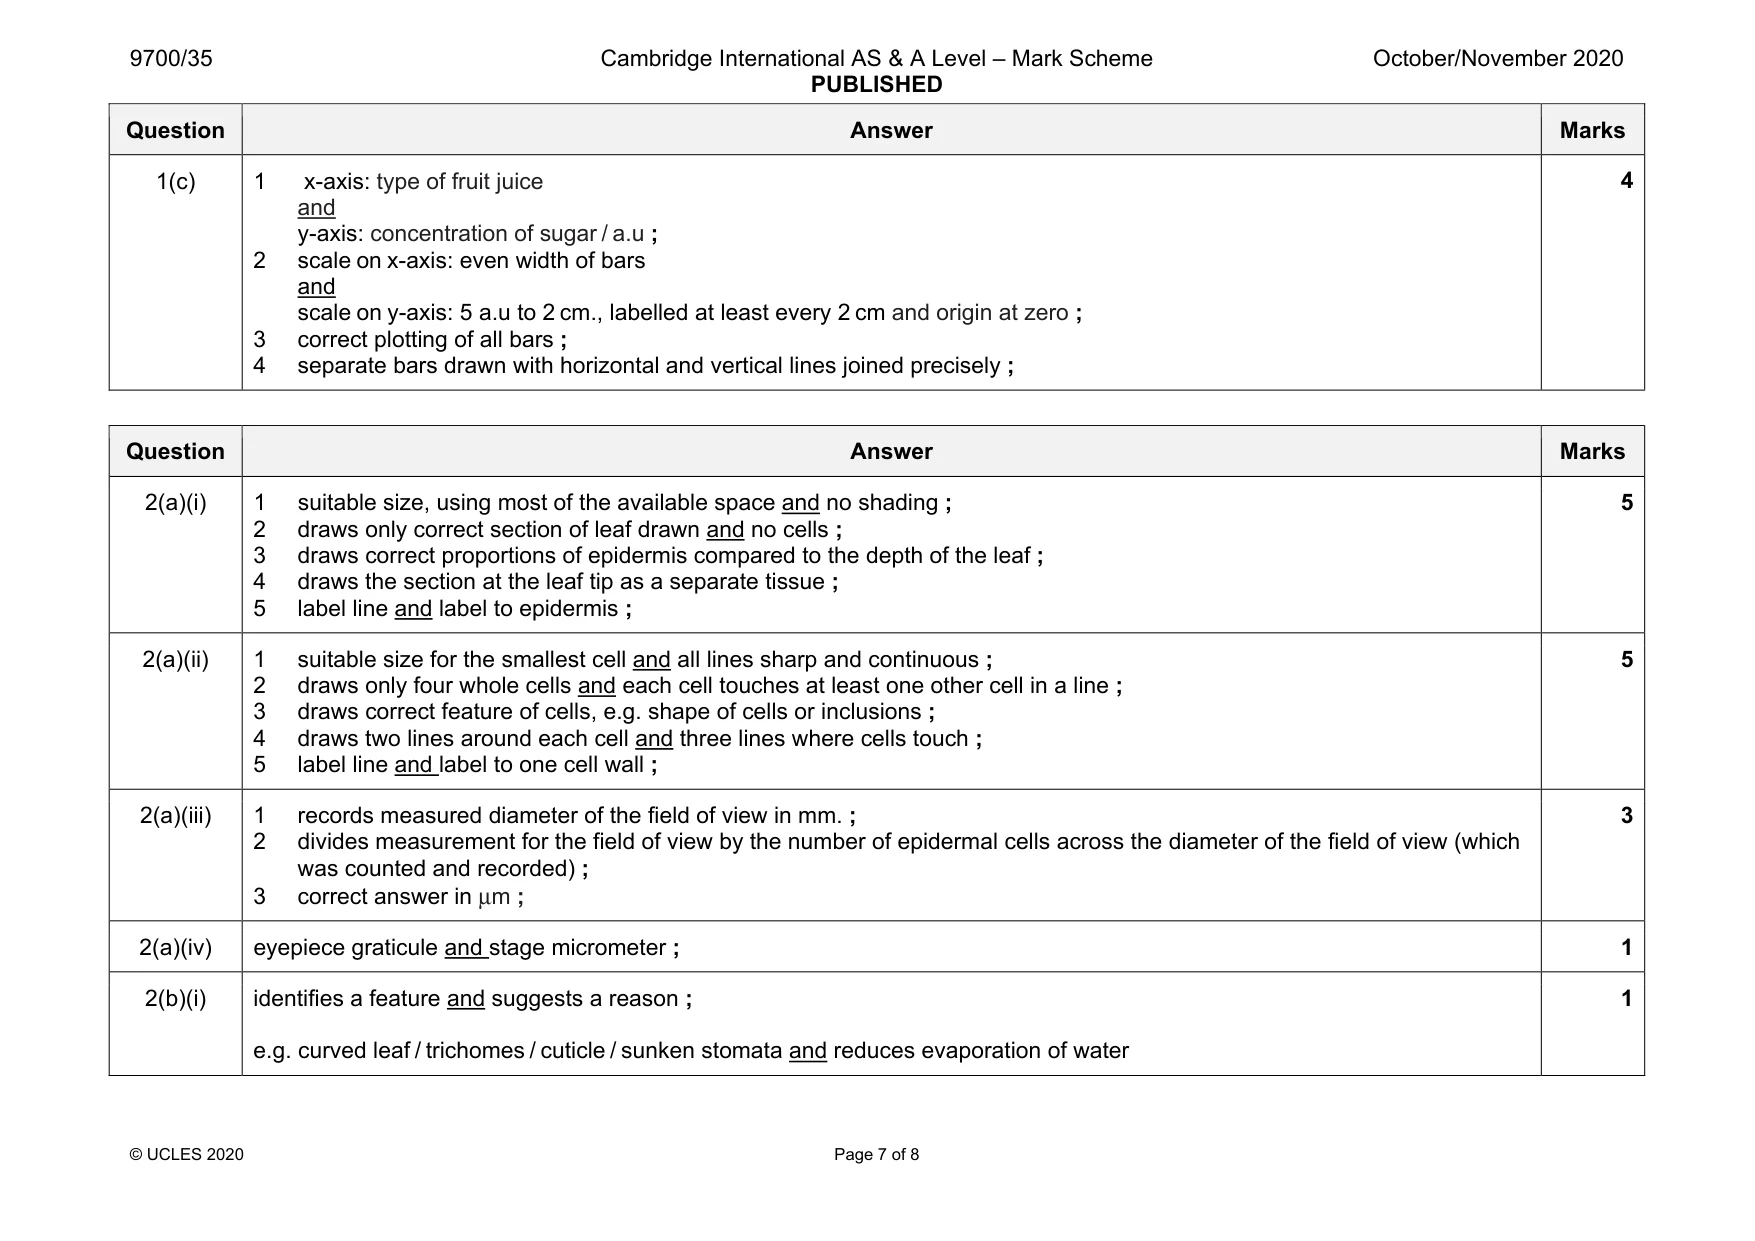
Mark scheme: 1(a)(i) 1 labels under correct sequence of beakers: 1.0, 0.5, 0.25, 0,125 and % at least once ; 2 shows transfer of 10 (cm3) from previous beaker transferred to the next beaker in sequence and cm3 once ; 3 shows 10 (cm3) of, W / water, added to each beaker and cm3 once ; 3 1(a)(ii) 1 heading for independent variable: percentage concentration sugar and before heading for dependent variable) and no units in body of table ; 2 heading for dependent variable: time and s(econds) and no units in body of table ; 3 times for all concentrations ; 4 correct trend in results ; 5 results recorded to nearest whole second ; 5 1(a)(iii) records the time for U and s(econds) ; 1 1(a)(iv) estimates the correct concentration of reducing sugar in U from the results given in 1(a)(ii) ; 1 1(a)(v) any two from: 1 using more concentrations of reducing sugar between two concentrations that lie either side of the estimate ; 2 (dilutions made) using proportional dilution ; 3 plot a graph of known concentrations and read off the value of sample ; 2 1(b)(i) 1 reads off Vmax correctly from the graph at 4.3 au ; 2 calculates ½ Vmax correctly ; 3 reads off the value for Kmmmol dm–3 correctly from the graph ; 3 1(b)(ii) identifies enzyme sucrase has a lower affinity for its substrate and Km higher for sucrase ; 1 1(b)(iii) all active sites are occupied by substrate / AW ; 1 Question Answer Marks 1(c) 1 x-axis: type of fruit juice and y-axis: concentration of sugar / a.u ; 2 scale on x-axis: even width of bars and scale on y-axis: 5 a.u to 2 cm., labelled at least every 2 cm and origin at zero ; 3 correct plotting of all bars ; 4 separate bars drawn with horizontal and vertical lines joined precisely ; 4
Q2 · M1 is a slide of a stained transverse section through a plant leaf
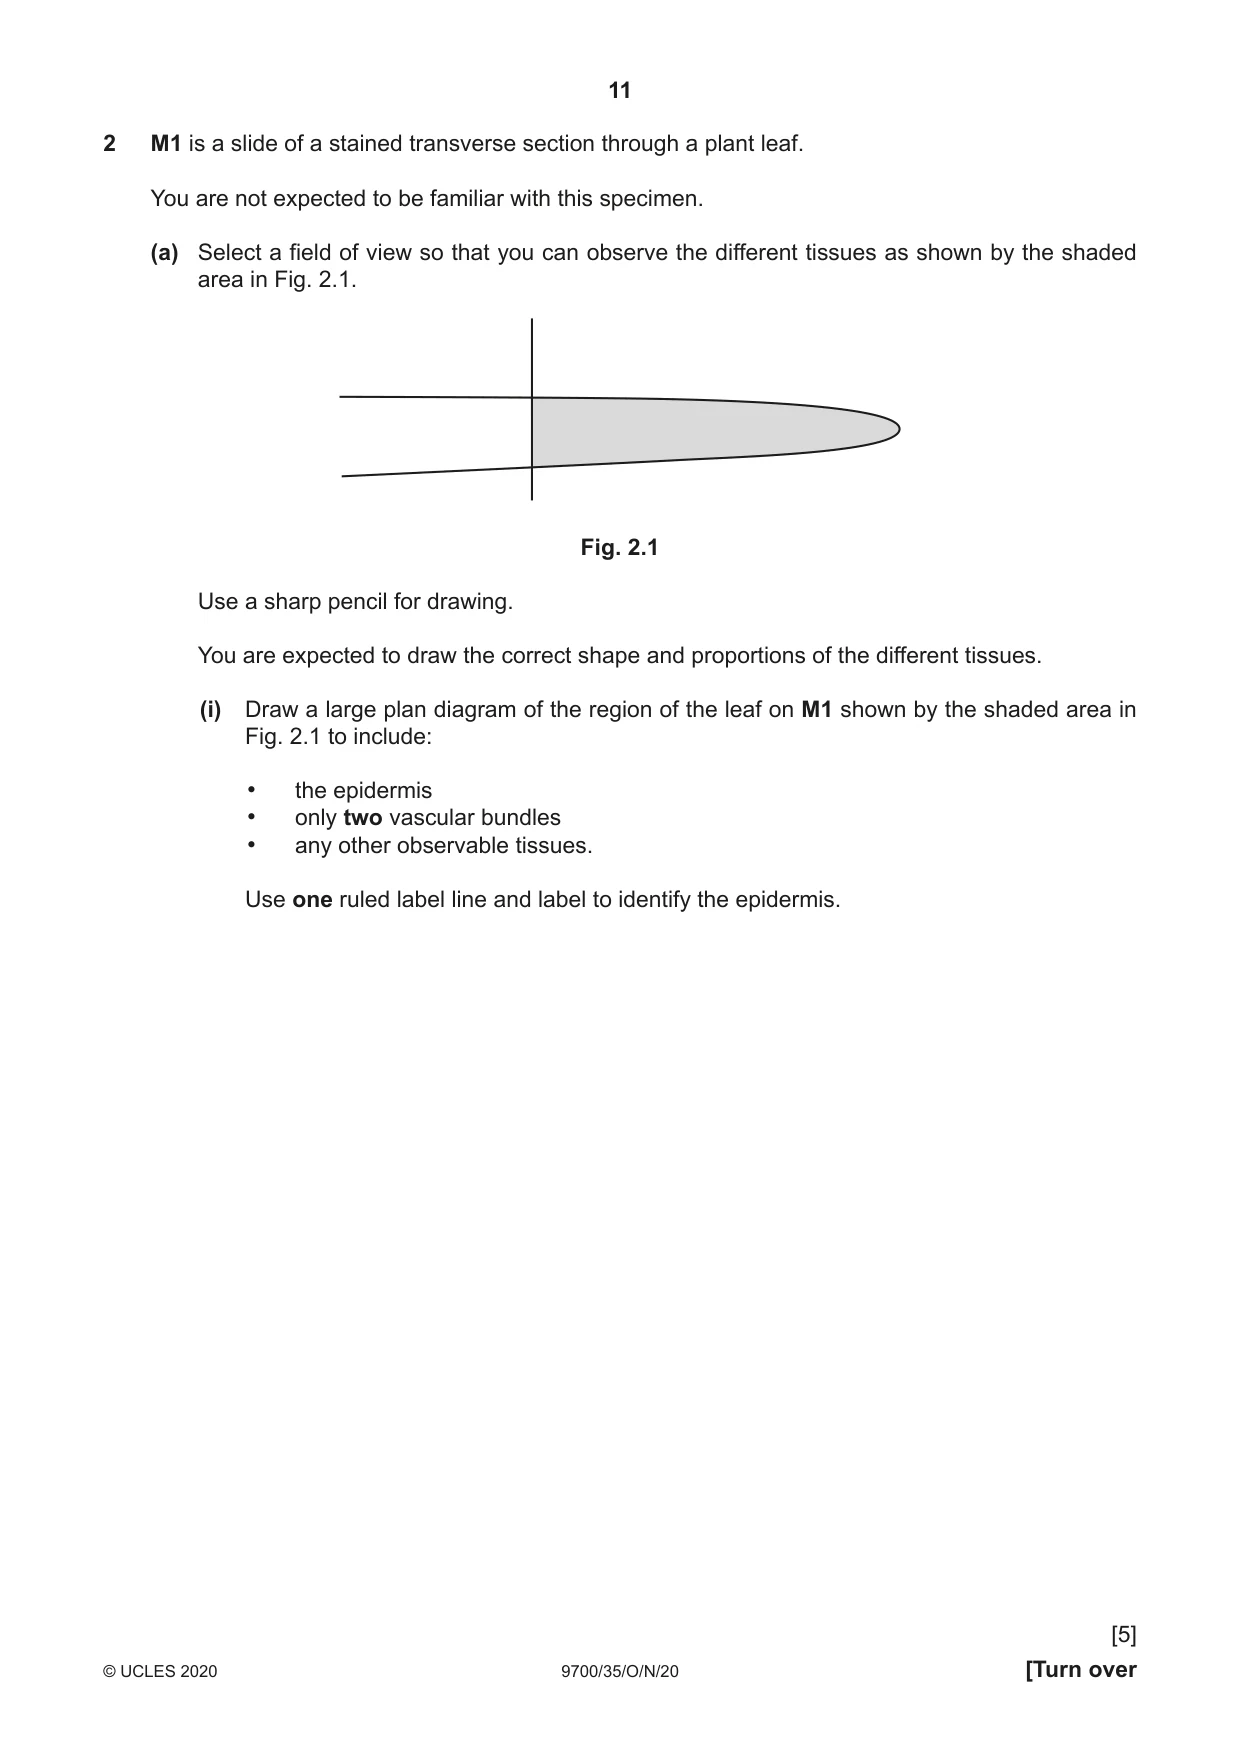
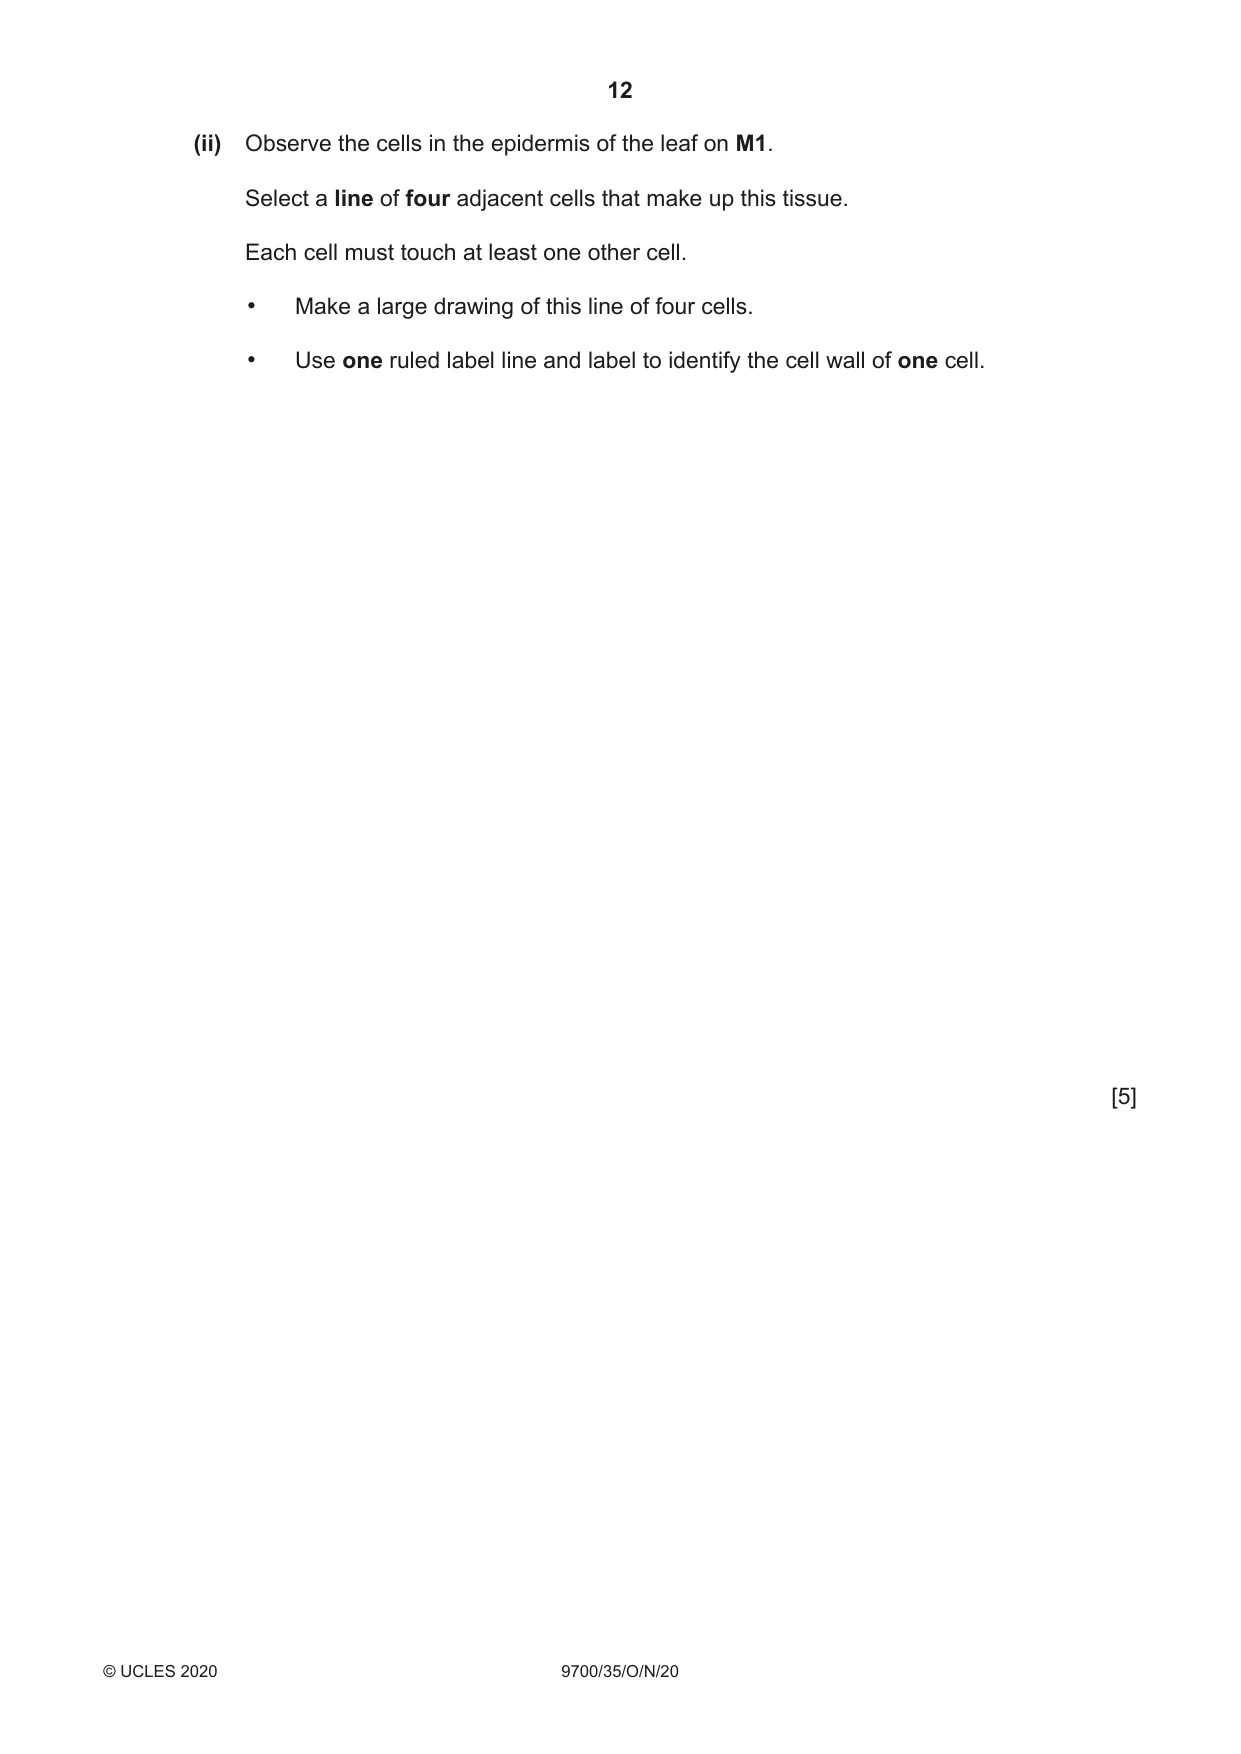
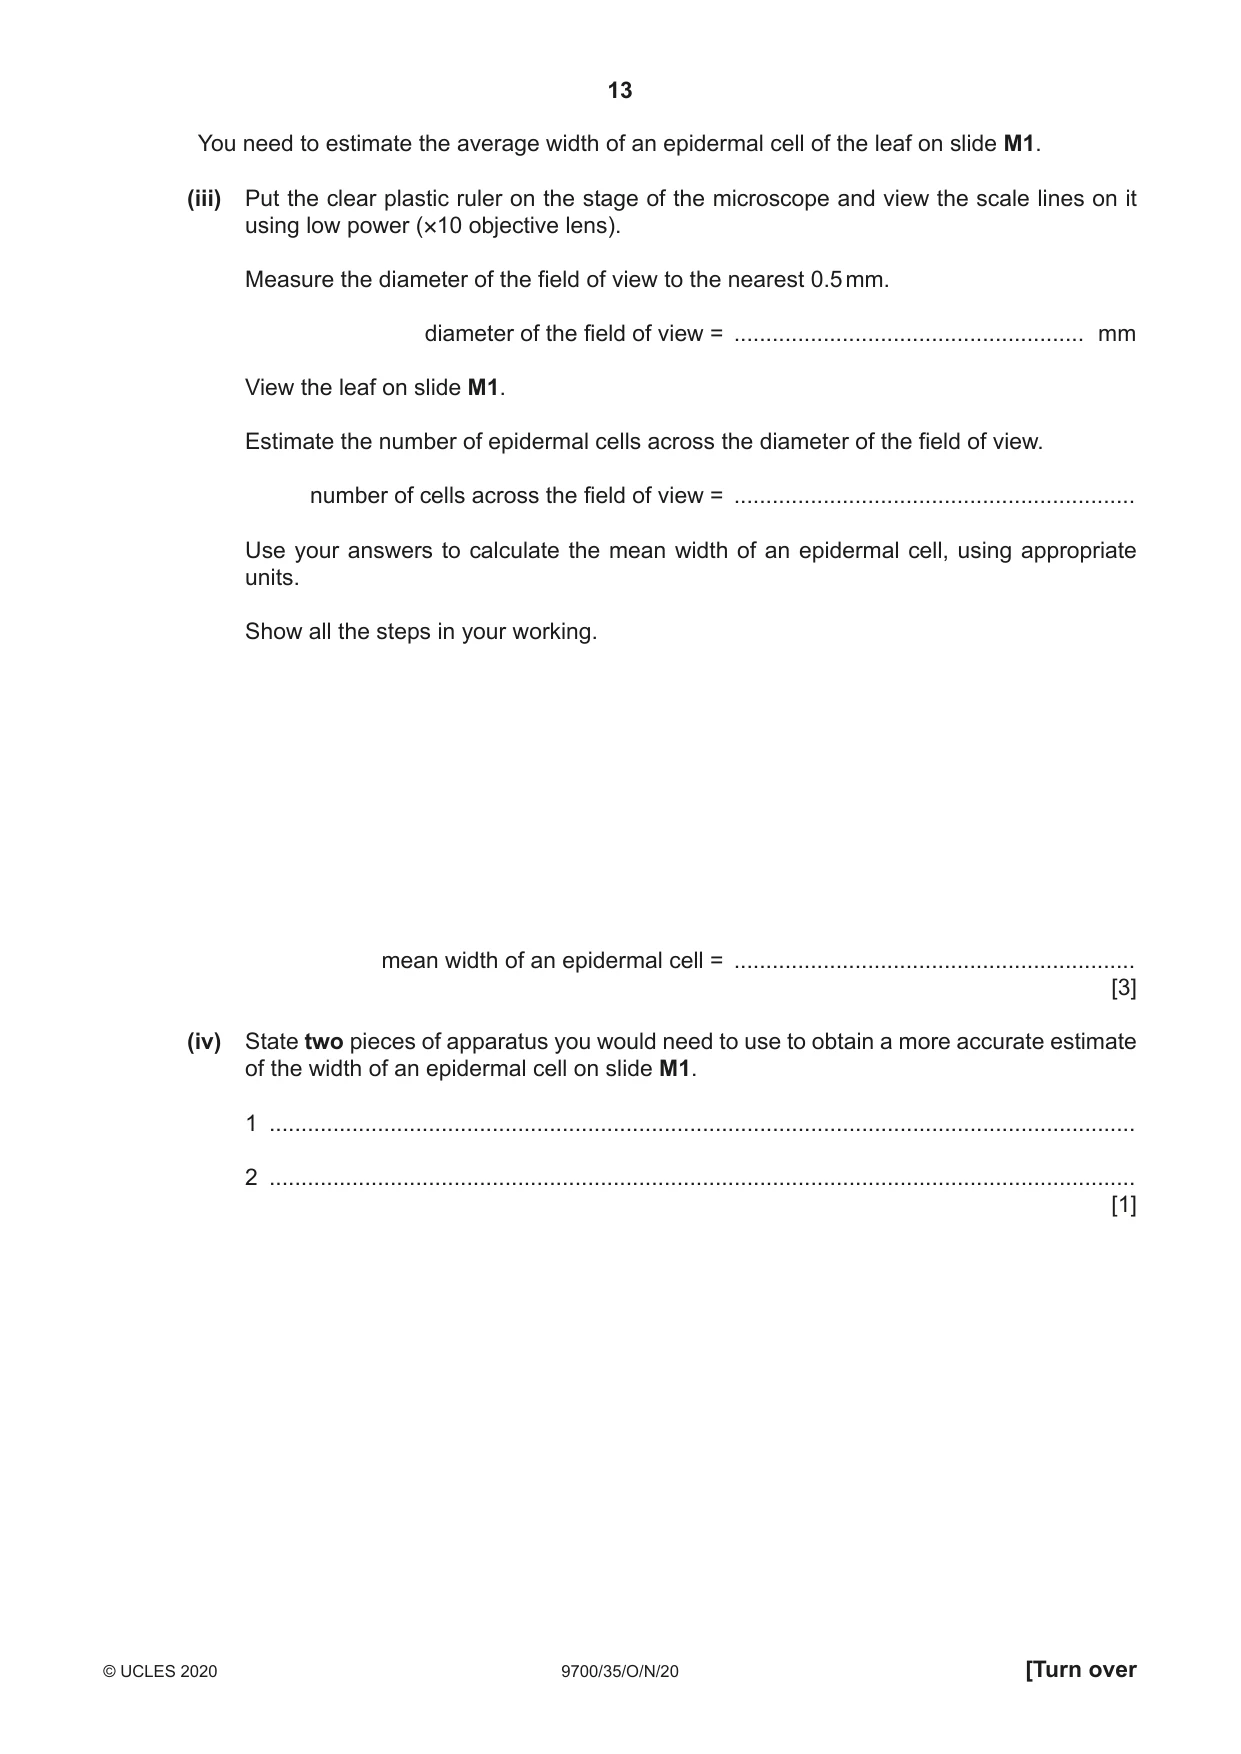
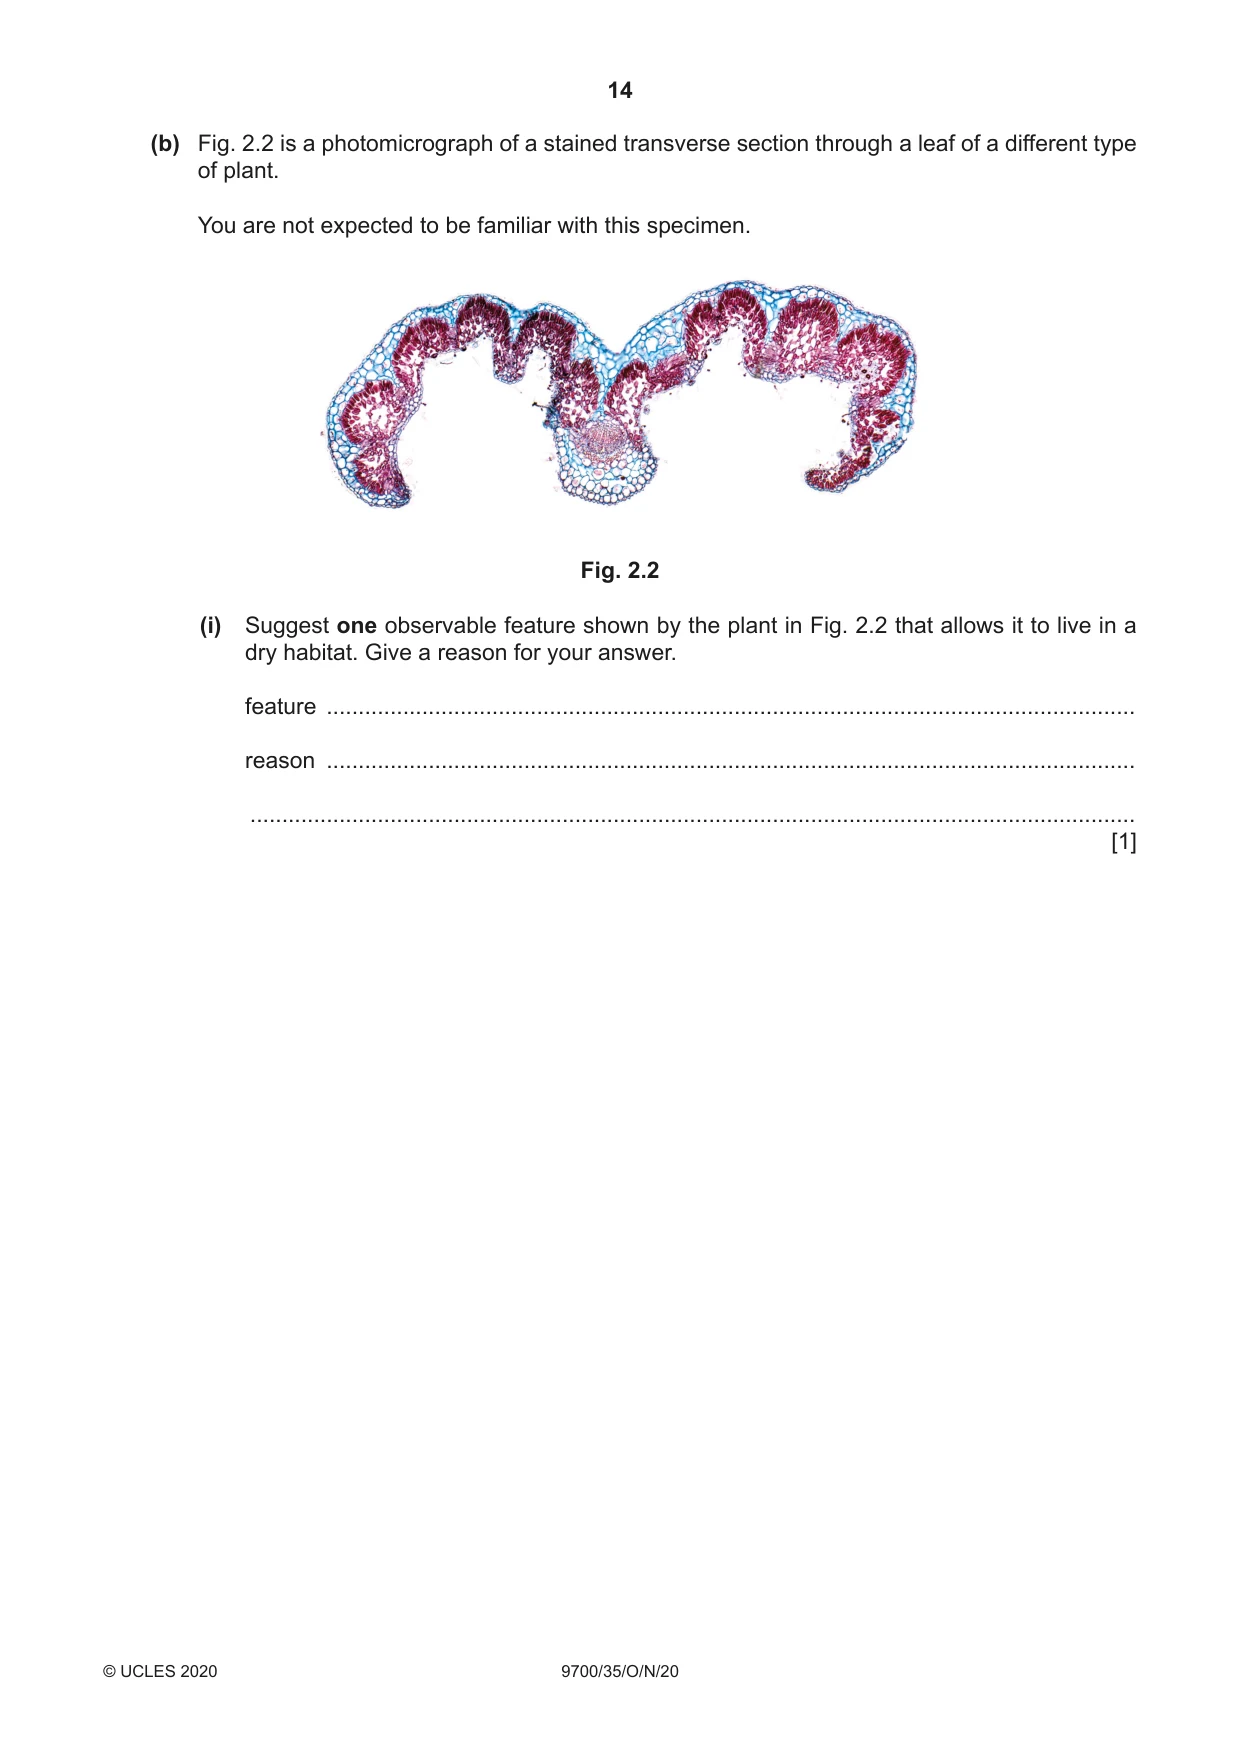
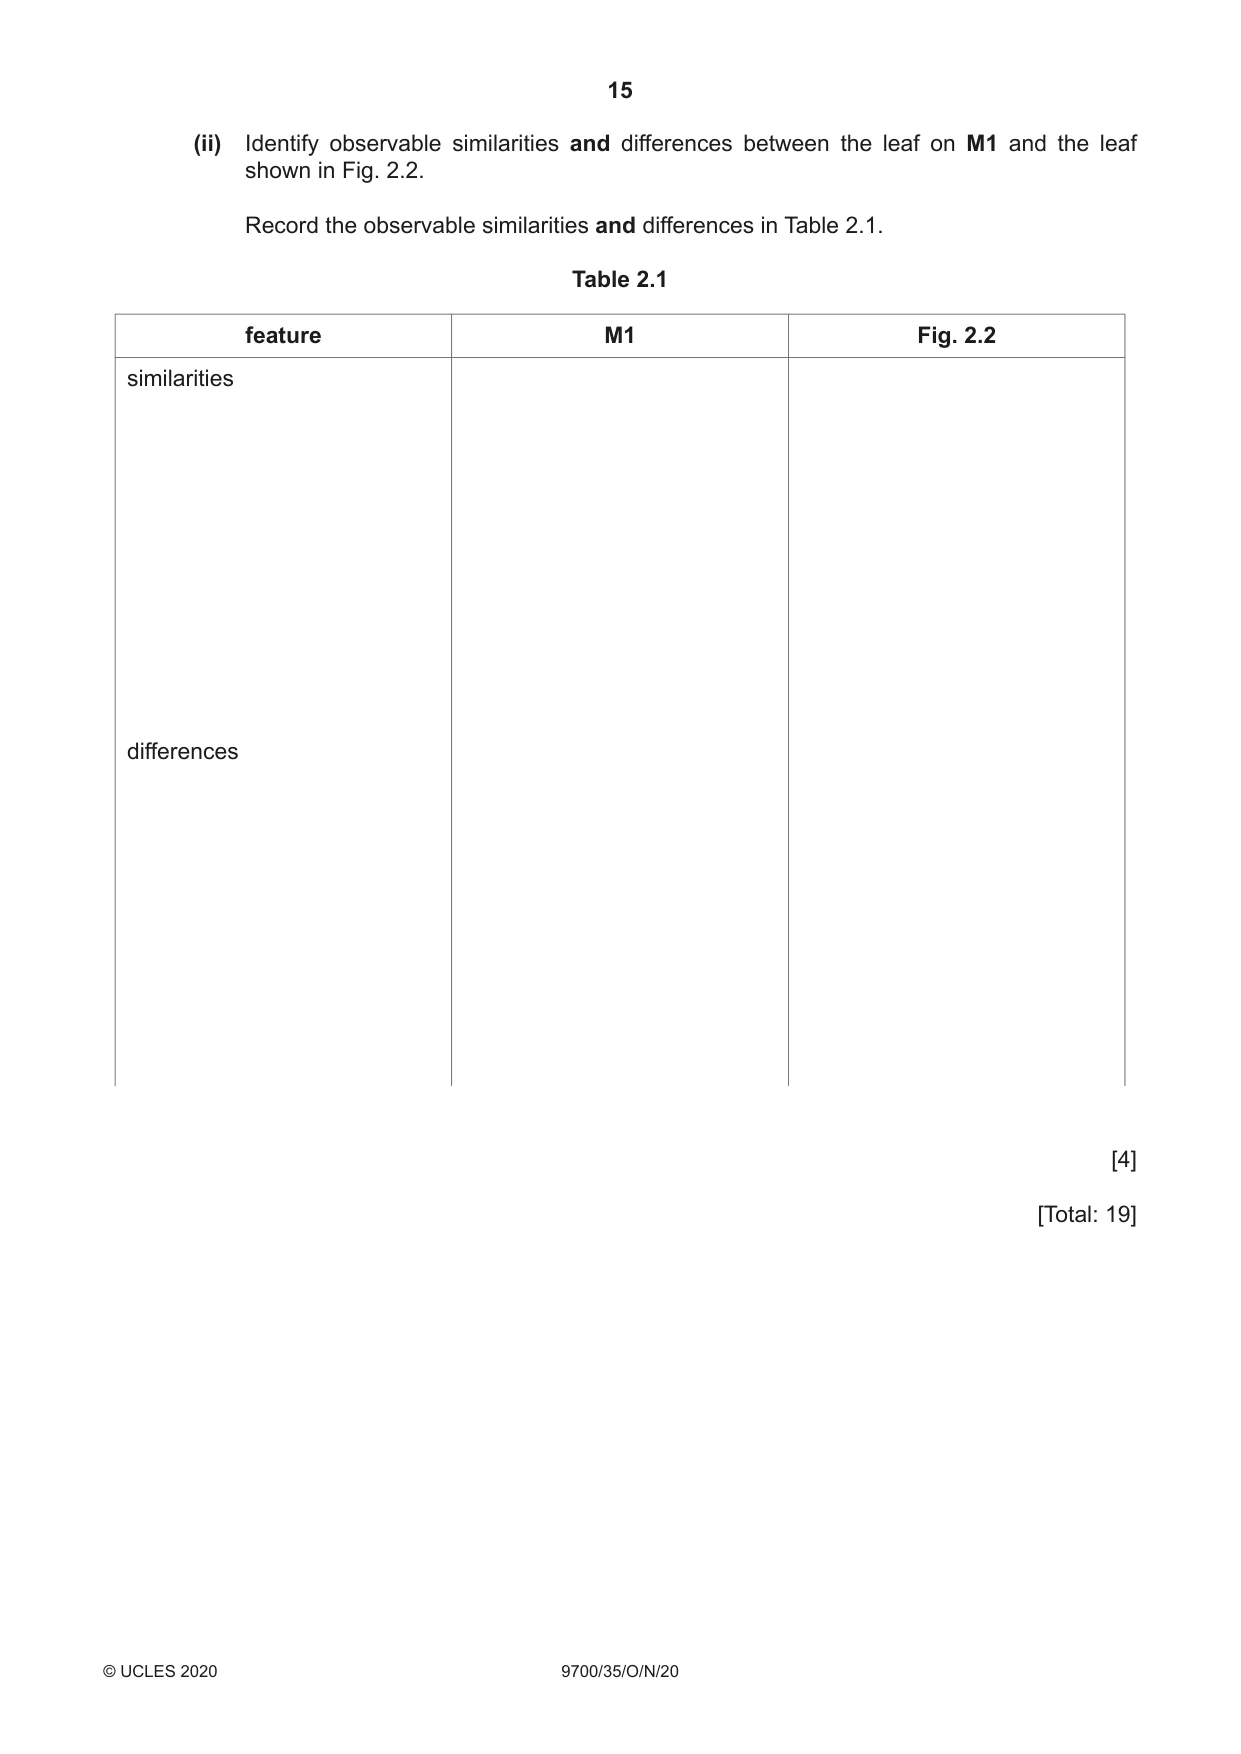
2 M1 is a slide of a stained transverse section through a plant leaf. You are not expected to be familiar with this specimen. (a) Select a field of view so that you can observe the different tissues as shown by the shaded area in Fig. 2.1. Fig. 2.1 Use a sharp pencil for drawing. You are expected to draw the correct shape and proportions of the different tissues. (i) Draw a large plan diagram of the region of the leaf on M1 shown by the shaded area in Fig. 2.1 to include: • the epidermis • only two vascular bundles • any other observable tissues. Use one ruled label line and label to identify the epidermis. [5] (ii) Observe the cells in the epidermis of the leaf on M1. Select a line of four adjacent cells that make up this tissue. Each cell must touch at least one other cell. • Make a large drawing of this line of four cells. • Use one ruled label line and label to identify the cell wall of one cell. [5] You need to estimate the average width of an epidermal cell of the leaf on slide M1. (iii) Put the clear plastic ruler on the stage of the microscope and view the scale lines on it using low power (×10 objective lens). Measure the diameter of the field of view to the nearest 0.5 mm. diameter of the field of view = ....................................................... mm View the leaf on slide M1. Estimate the number of epidermal cells across the diameter of the field of view. number of cells across the field of view = ............................................................... Use your answers to calculate the mean width of an epidermal cell, using appropriate units. Show all the steps in your working. mean width of an epidermal cell = ............................................................... [3] (iv) State two pieces of apparatus you would need to use to obtain a more accurate estimate of the width of an epidermal cell on slide M1. 1 ........................................................................................................................................ 2 ........................................................................................................................................ [1]
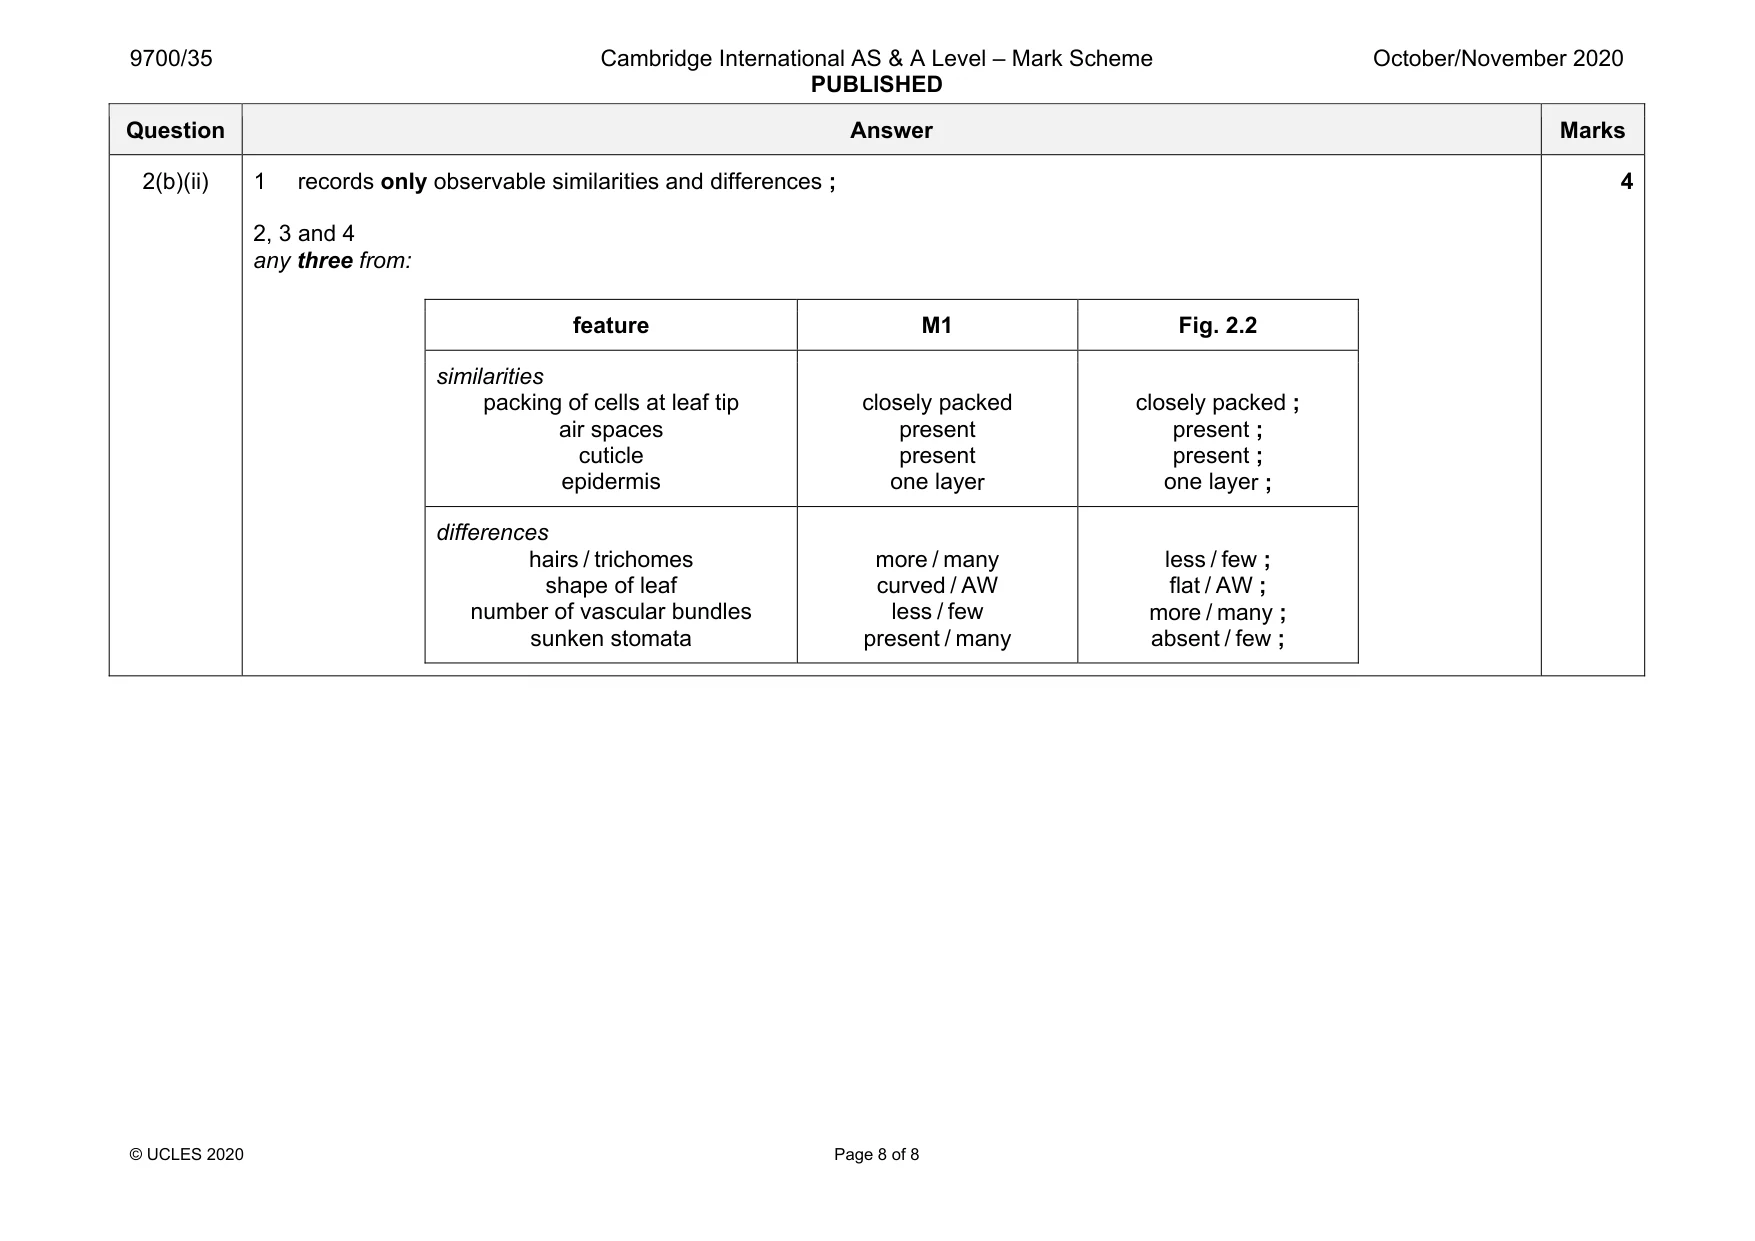
Mark scheme: 2(a)(i) 1 suitable size, using most of the available space and no shading ; 2 draws only correct section of leaf drawn and no cells ; 3 draws correct proportions of epidermis compared to the depth of the leaf ; 4 draws the section at the leaf tip as a separate tissue ; 5 label line and label to epidermis ; 5 2(a)(ii) 1 suitable size for the smallest cell and all lines sharp and continuous ; 2 draws only four whole cells and each cell touches at least one other cell in a line ; 3 draws correct feature of cells, e.g. shape of cells or inclusions ; 4 draws two lines around each cell and three lines where cells touch ; 5 label line and label to one cell wall ; 5 2(a)(iii) 1 records measured diameter of the field of view in mm. ; 2 divides measurement for the field of view by the number of epidermal cells across the diameter of the field of view (which was counted and recorded) ; 3 correct answer in μm ; 3 2(a)(iv) eyepiece graticule and stage micrometer ; 1 2(b)(i) identifies a feature and suggests a reason ; e.g. curved leaf / trichomes / cuticle / sunken stomata and reduces evaporation of water 1 Question Answer Marks 2(b)(ii) 1 records only observable similarities and differences ; 2, 3 and 4 any three from: feature M1 Fig. 2.2 similarities packing of cells at leaf tip air spaces cuticle epidermis closely packed present present one layer closely packed ; present ; present ; one layer ; differences hairs / trichomes shape of leaf number of vascular bundles sunken stomata more / many curved / AW less / few present / many less / few ; flat / AW ; more / many ; absent / few ; 4
What was in this paper
The subtopics covered by these 2 questions, and how many questions each got. Open one in a new tab to see every Cambridge question on it.
What you needed in this session
Cambridge’s own grade thresholds for 2020 Oct/Nov, Paper 3 · Variant 5. A higher threshold means an easier paper — the bar moves with how the cohort did.