Cambridge A Level Biology 9700 — 2020 Oct/Nov Paper 3 · Variant 3
9700/33/O/N/20 · 2 questions · 40 marks · ≈45 min
The question paper and its mark scheme, free to read here and free to download. This is Cambridge’s own paper, exactly as it was sat.
Question paper16 pages





Mark scheme8 pages
Answers below. Sit the paper first if you are practising.
Questions as text
Q1 · Yeast cells contain enzymes that break down sugars to release energy
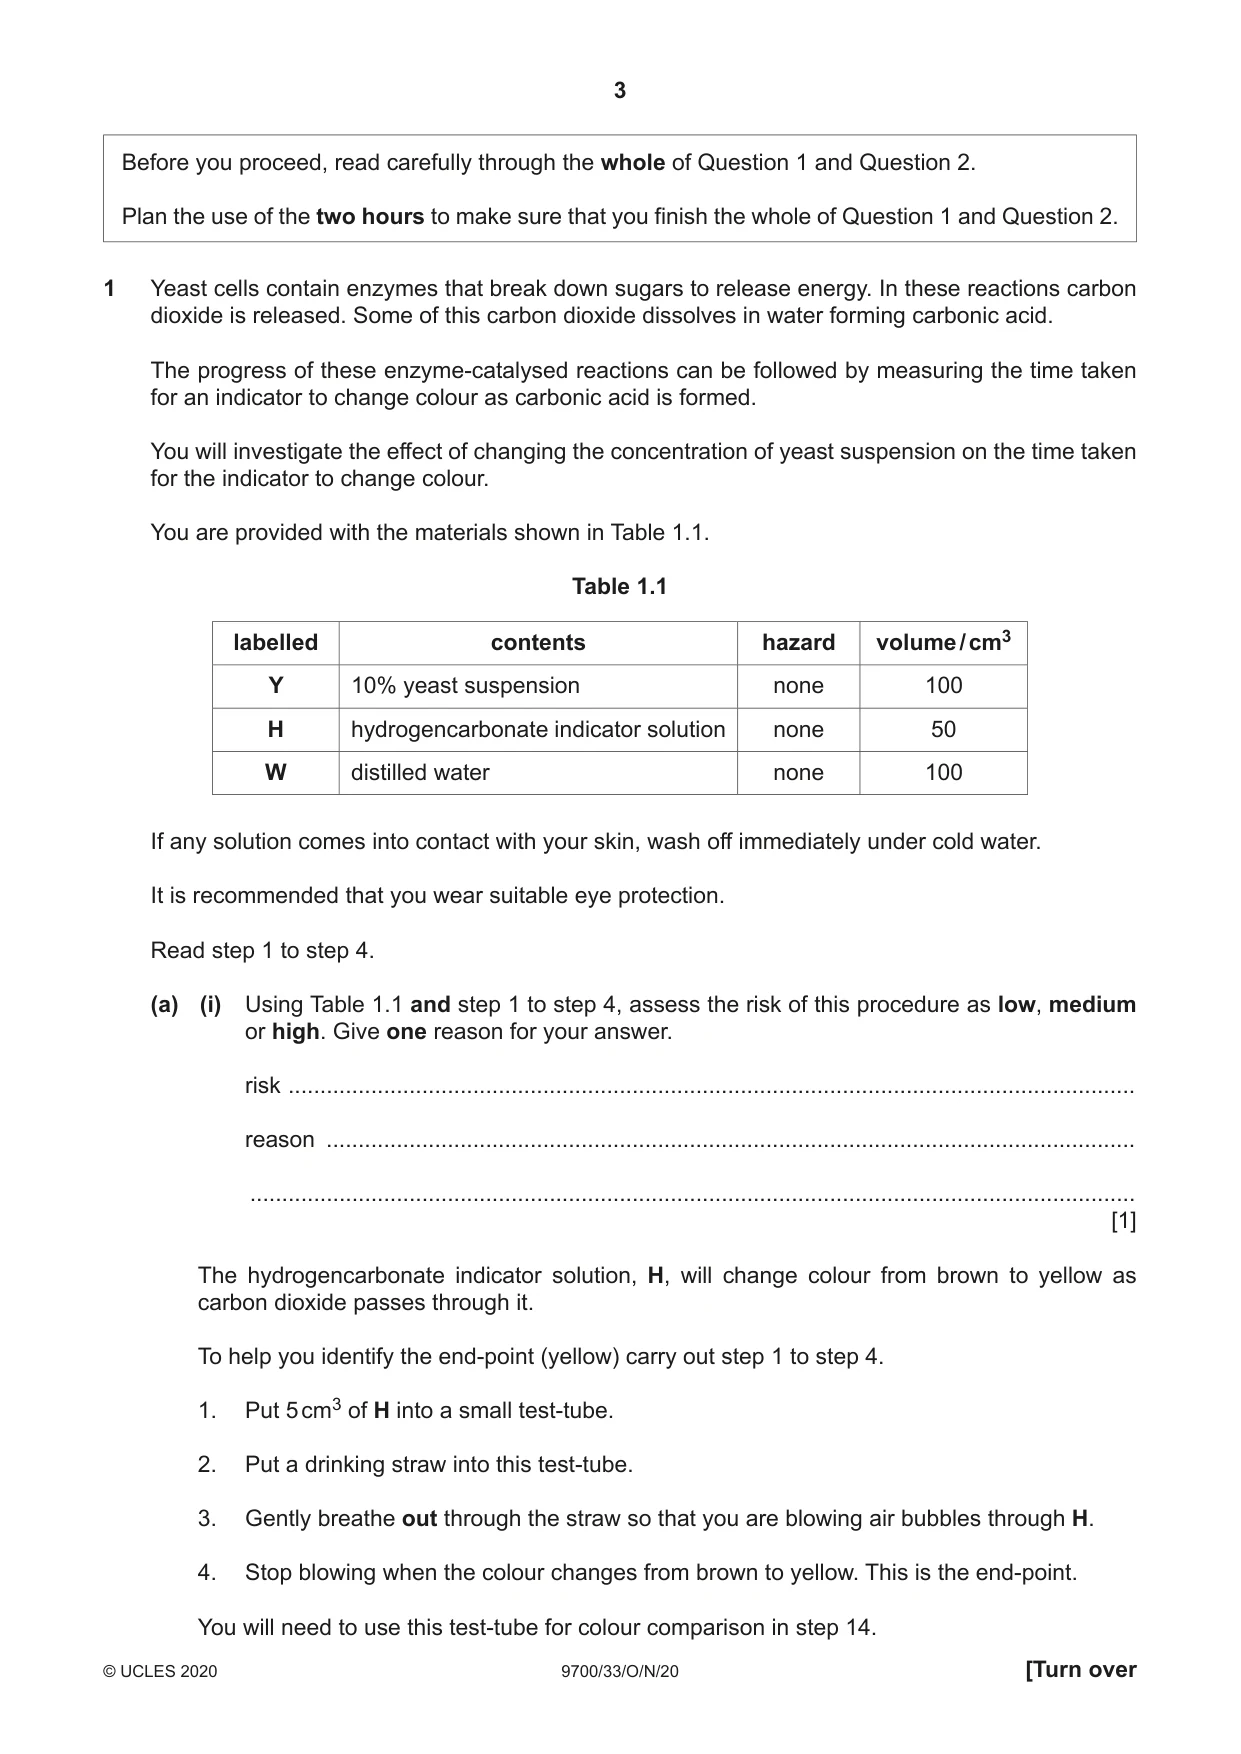
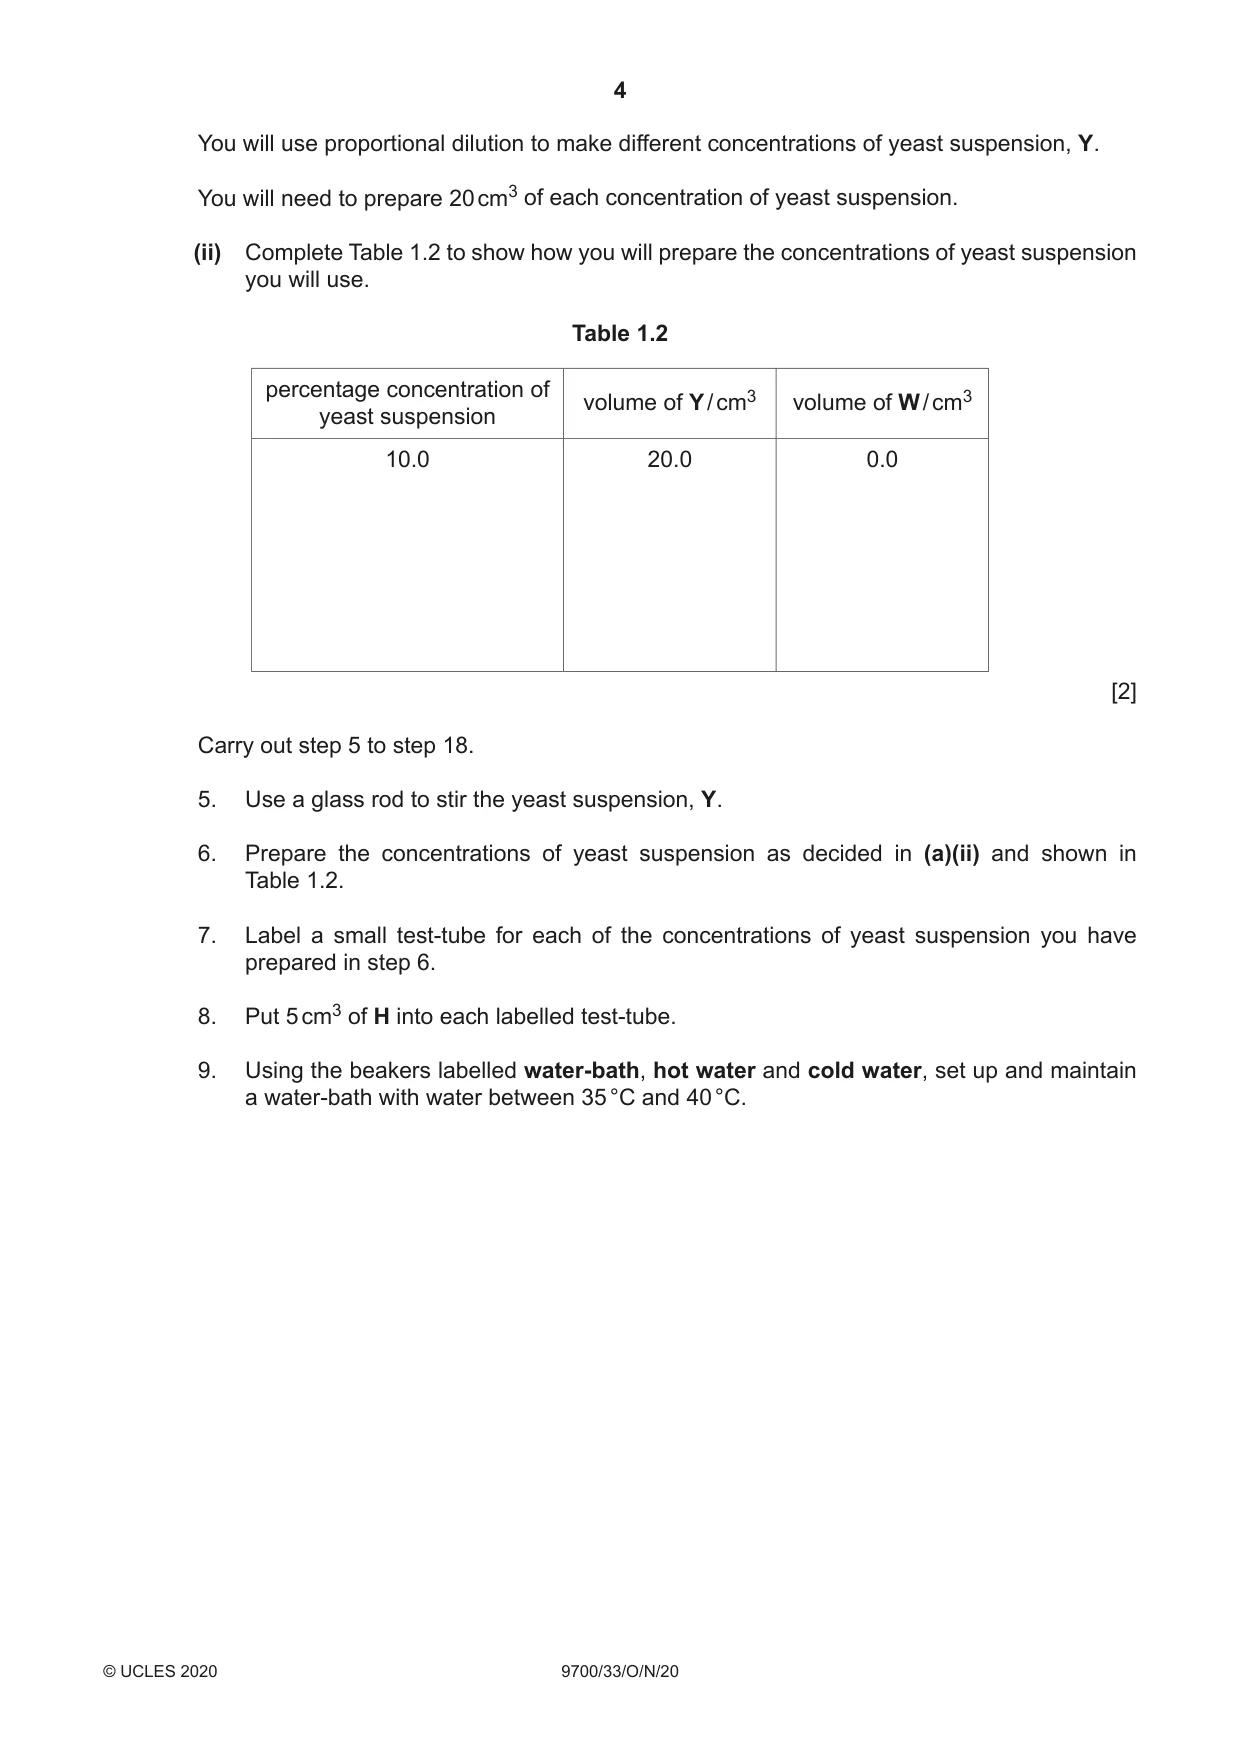
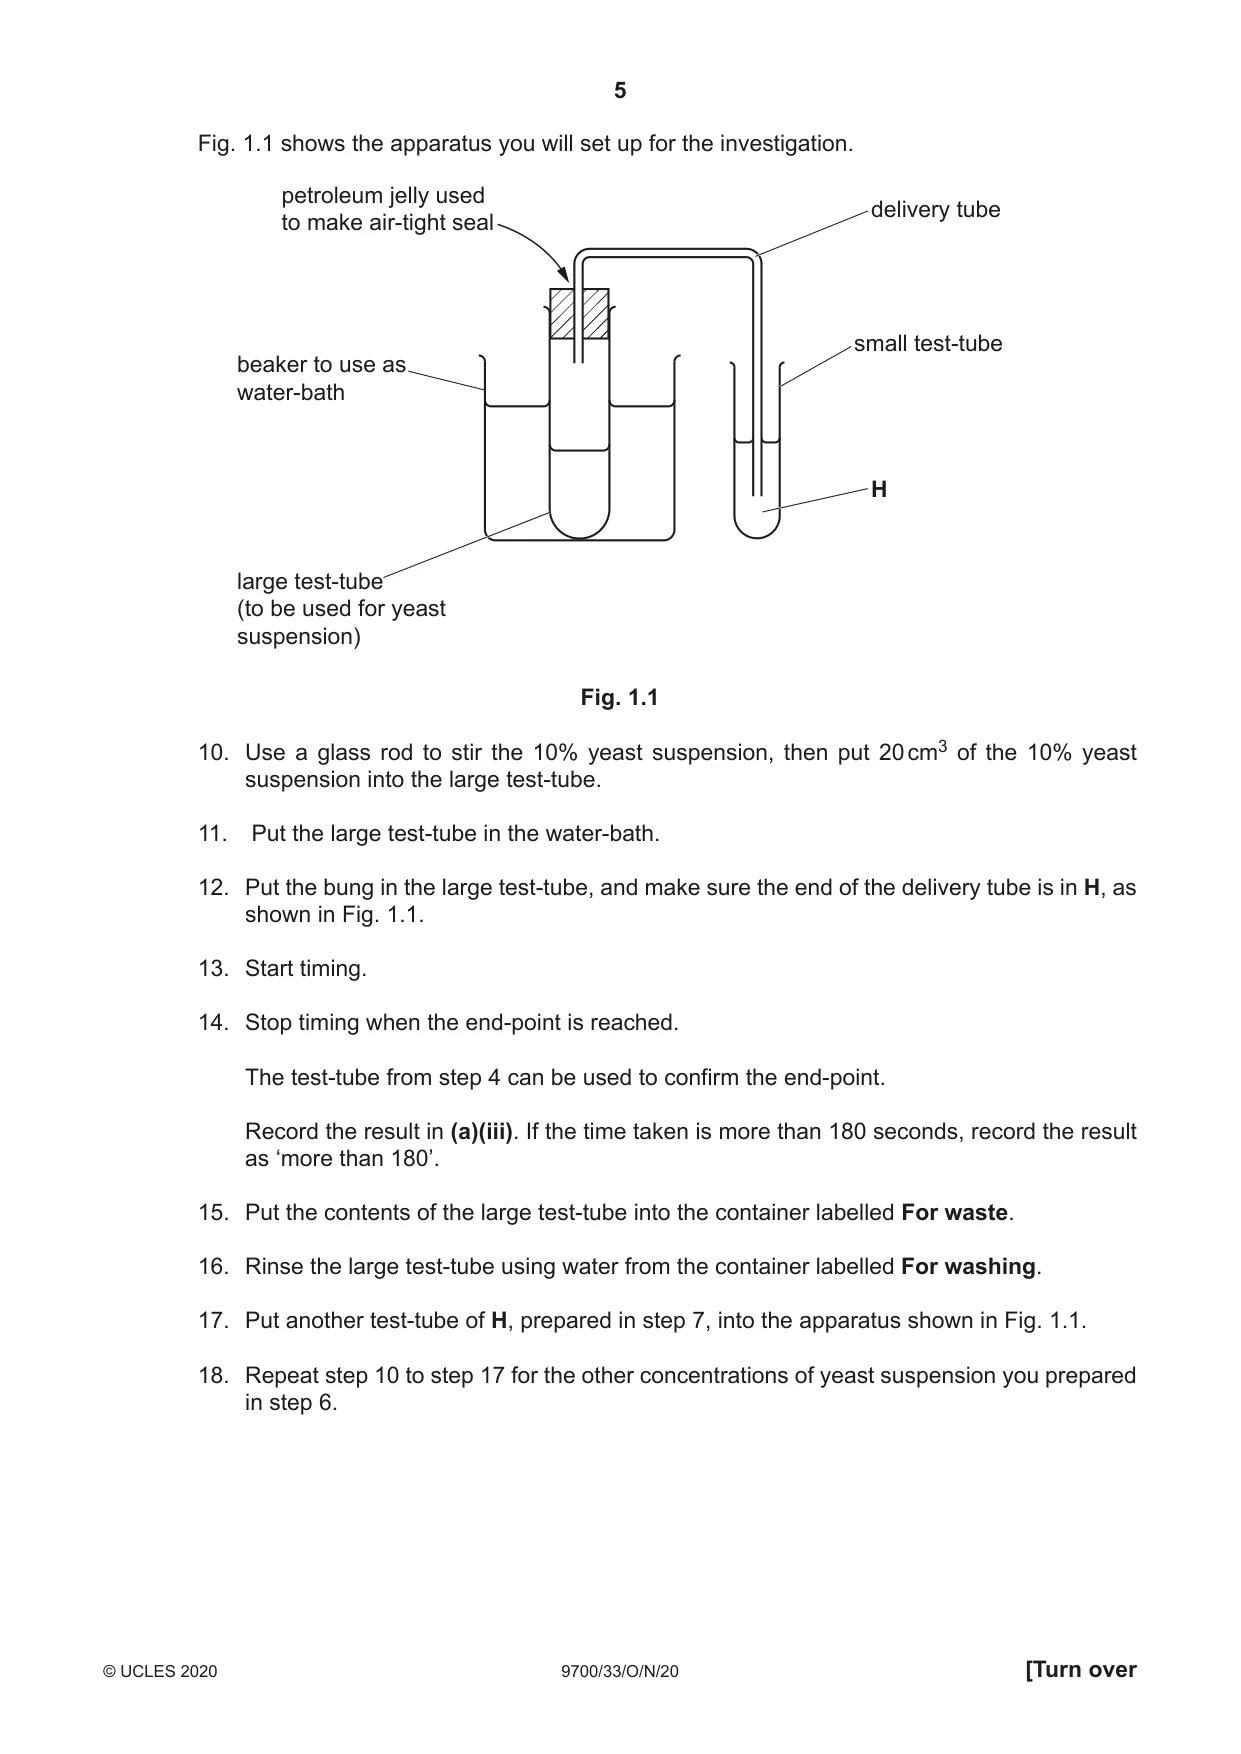
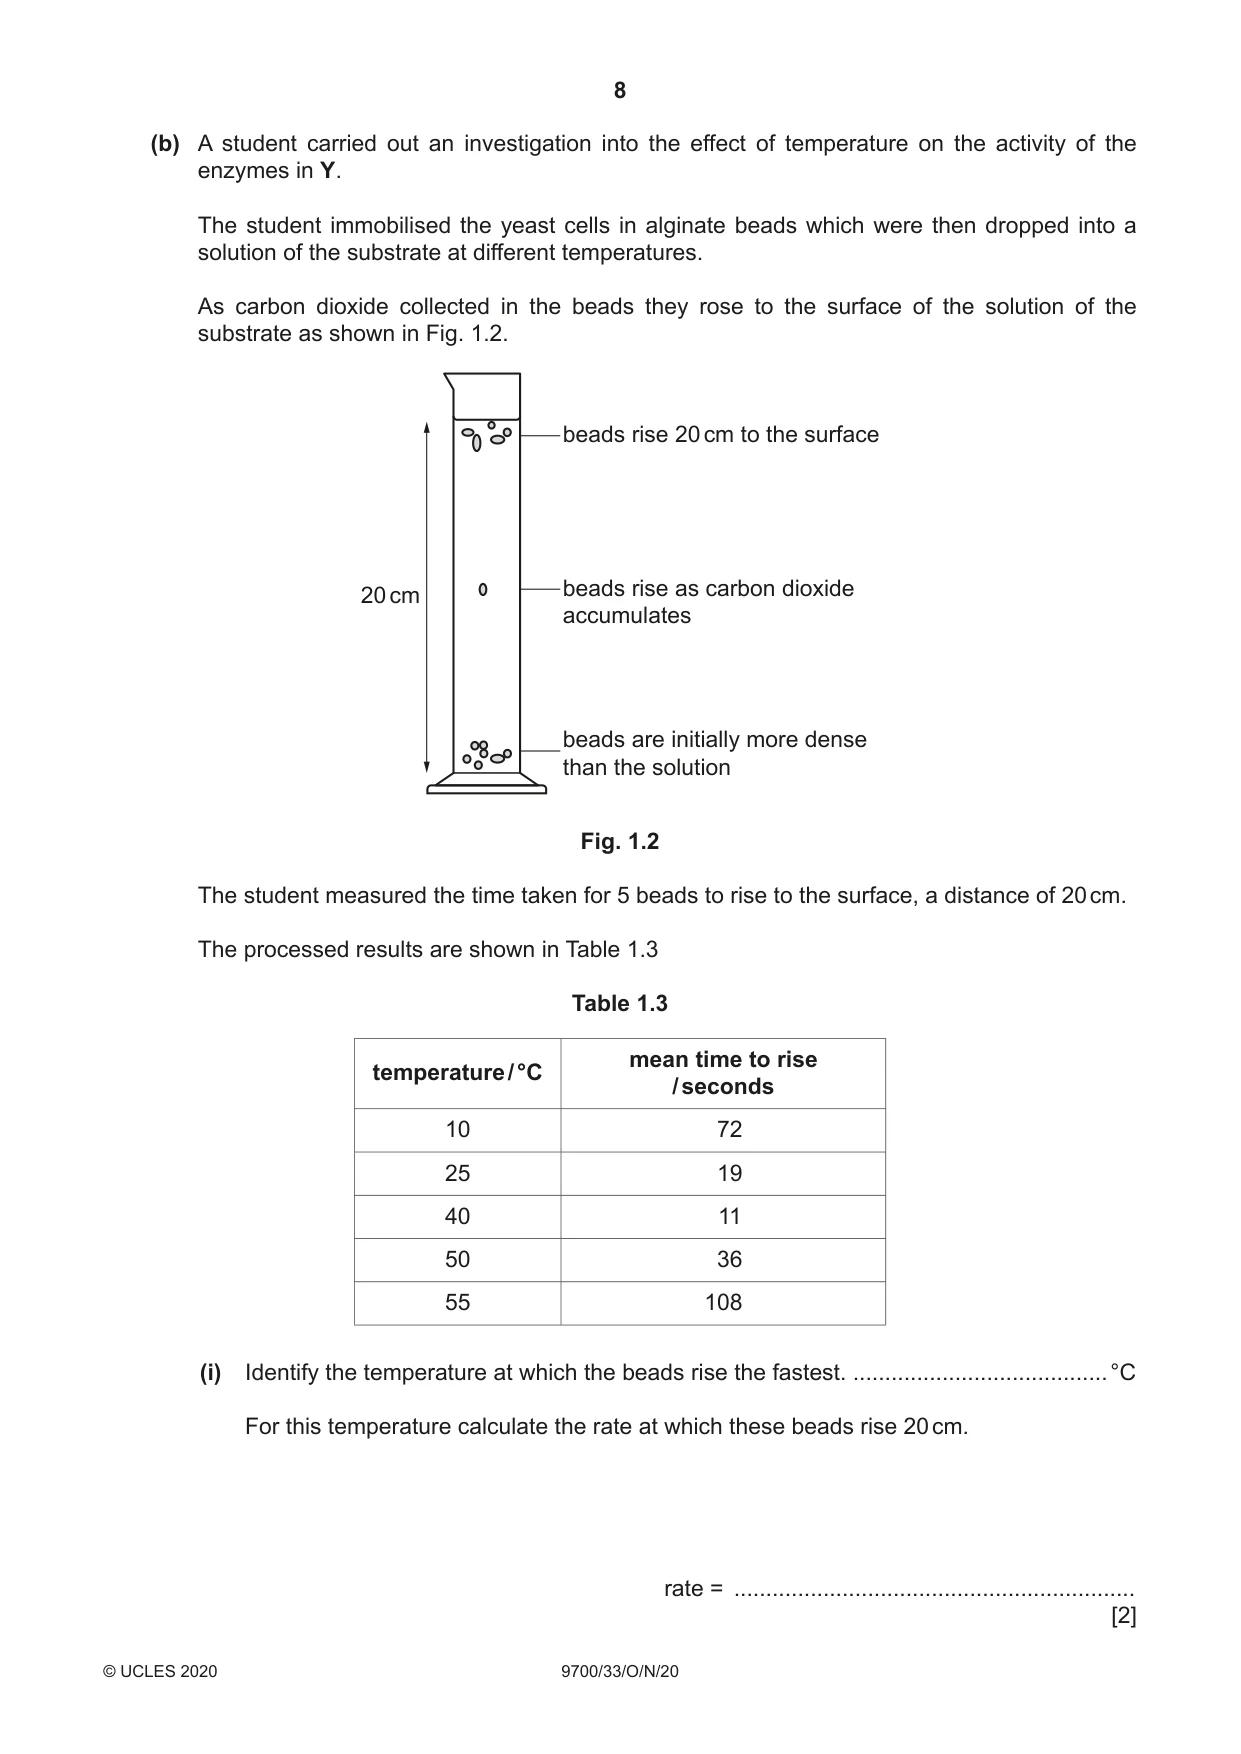
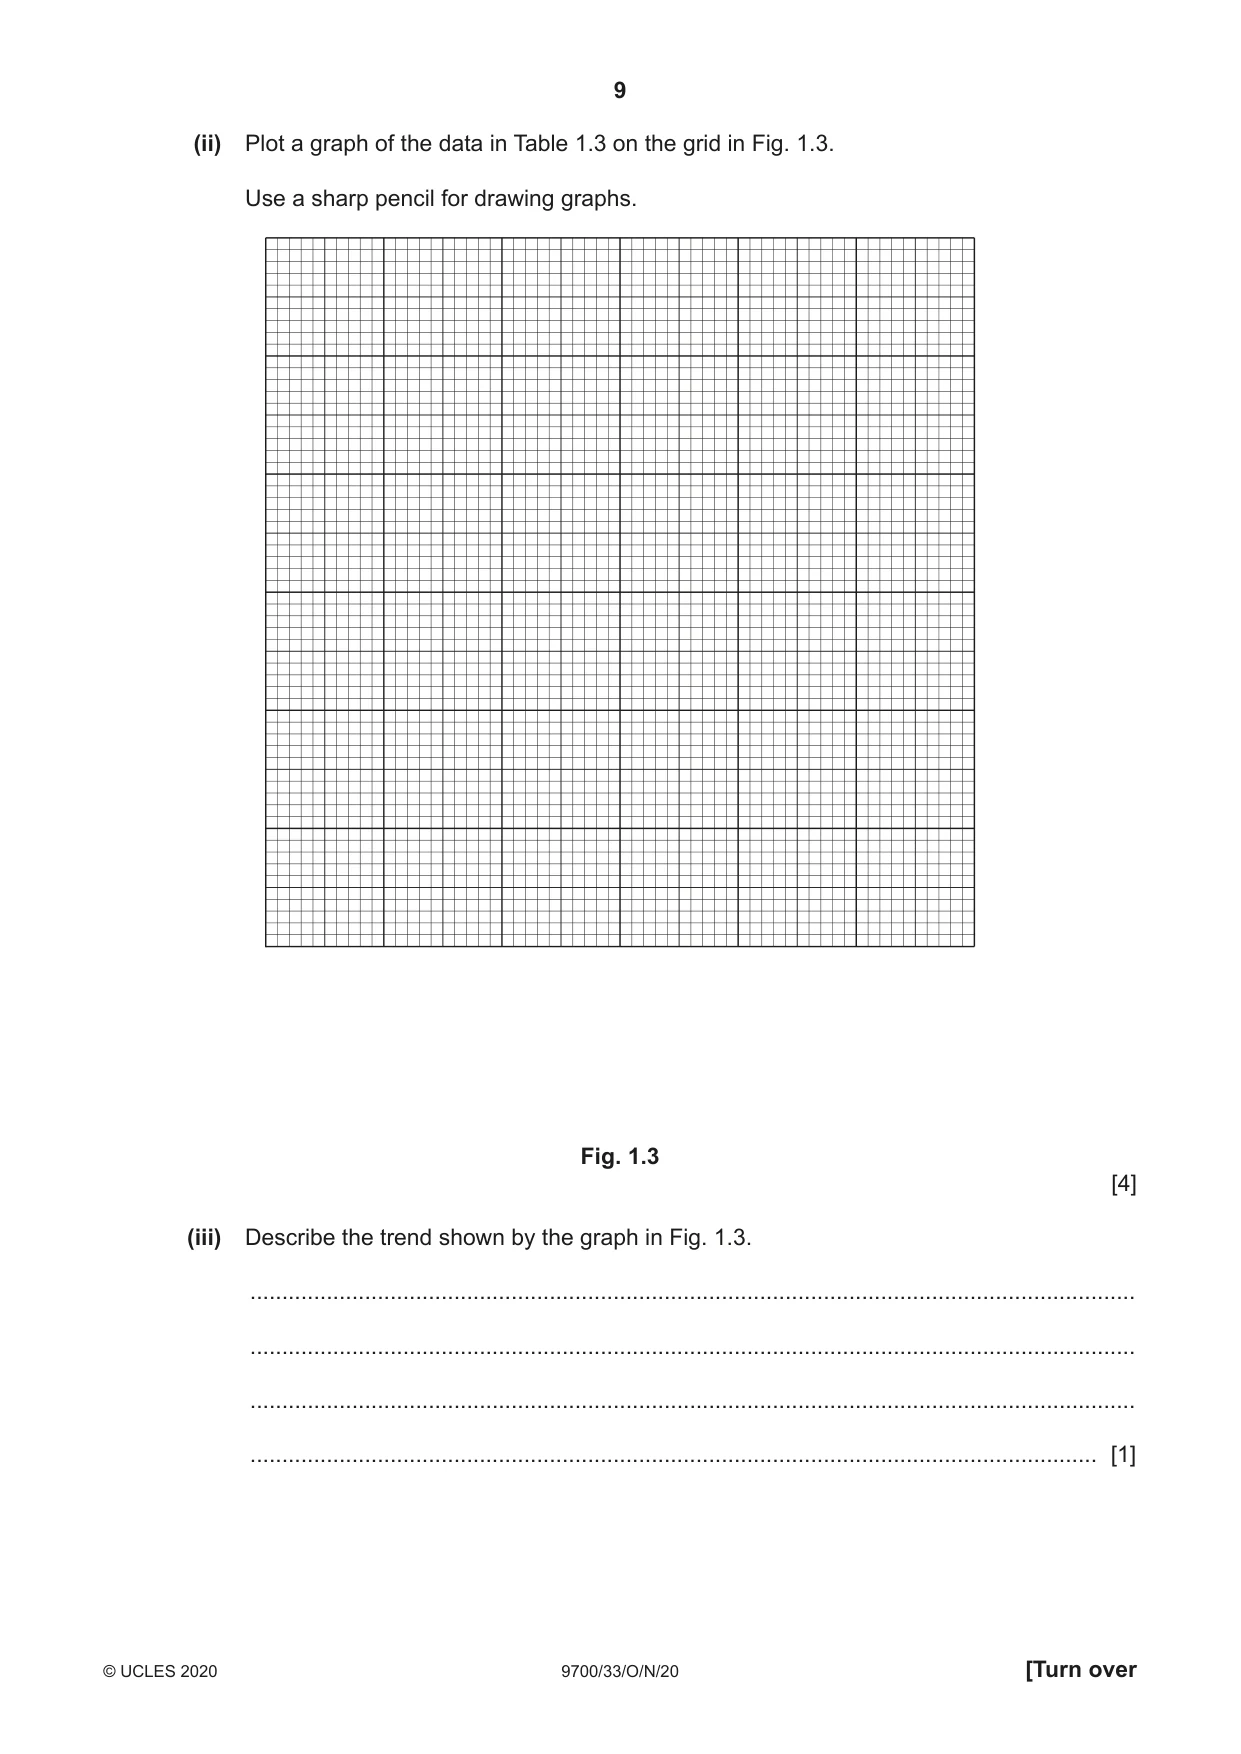
1 Yeast cells contain enzymes that break down sugars to release energy. In these reactions carbon dioxide is released. Some of this carbon dioxide dissolves in water forming carbonic acid. The progress of these enzyme-catalysed reactions can be followed by measuring the time taken for an indicator to change colour as carbonic acid is formed. You will investigate the effect of changing the concentration of yeast suspension on the time taken for the indicator to change colour. You are provided with the materials shown in Table 1.1. Table 1.1 labelled contents hazard volume / cm3 Y 10% yeast suspension none 100 H hydrogencarbonate indicator solution none 50 W distilled water none 100 If any solution comes into contact with your skin, wash off immediately under cold water. It is recommended that you wear suitable eye protection. Read step 1 to step 4. (a) (i) Using Table 1.1 and step 1 to step 4, assess the risk of this procedure as low, medium or high. Give one reason for your answer. risk ..................................................................................................................................... reason ............................................................................................................................... ........................................................................................................................................... [1] The hydrogencarbonate indicator solution, H, will change colour from brown to yellow as carbon dioxide passes through it. To help you identify the end-point (yellow) carry out step 1 to step 4. 1. Put 5 cm3 of H into a small test-tube. 2. Put a drinking straw into this test-tube. 3. Gently breathe out through the straw so that you are blowing air bubbles through H. 4. Stop blowing when the colour changes from brown to yellow. This is the end-point. You will need to use this test-tube for colour comparison in step 14. You will use proportional dilution to make different concentrations of yeast suspension, Y. You will need to prepare 20 cm3 of each concentration of yeast suspension. (ii) Complete Table 1.2 to show how you will prepare the concentrations of yeast suspension you will use. Table 1.2 percentage concentration of volume of Y / cm3 volume of W / cm3 yeast suspension 10.0 20.0 0.0 [2] Carry out step 5 to step 18. 5. Use a glass rod to stir the yeast suspension, Y. 6. Prepare the concentrations of yeast suspension as decided in (a)(ii) and shown in Table 1.2. 7. Label a small test-tube for each of the concentrations of yeast suspension you have prepared in step 6. 8. Put 5 cm3 of H into each labelled test-tube. 9. Using the beakers labelled water-bath, hot water and cold water, set up and maintain a water-bath with water between 35 °C and 40 °C. Fig. 1.1 shows the apparatus you will set up for the investigation. petroleum jelly used delivery tube to make air-tight seal small test-tube beaker to use as water-bath H large test-tube (to be used for yeast suspension) Fig. 1.1 10. Use a glass rod to stir the 10% yeast suspension, then put 20 cm3 of the 10% yeast suspension into the large test-tube. 11. Put the large test-tube in the water-bath. 12. Put the bung in the large test-tube, and make sure the end of the delivery tube is in H, as shown in Fig. 1.1. 13. Start timing. 14. Stop timing when the end-point is reached. The test-tube from step 4 can be used to confirm the end-point. Record the result in (a)(iii). If the time taken is more than 180 seconds, record the result as ‘more than 180’. 15. Put the contents of the large test-tube into the container labelled For waste. 16. Rinse the large test-tube using water from the container labelled For washing. 17. Put another test-tube of H, prepared in step 7, into the apparatus shown in Fig. 1.1. 18. Repeat step 10 to step 17 for the other concentrations of yeast suspension you prepared in step 6. (iii) Record your results in an appropriate table. [5] (iv) Identify one significant source of error in this investigation. Give a reason for your answer. source of error ................................................................................................................... reason ............................................................................................................................... ........................................................................................................................................... [1] (v) A student suggested that collecting the carbon dioxide gas would be a better way to produce quantitative data. Describe the apparatus and a suitable method the student could use to collect and measure the volume of carbon dioxide. You may use a labelled diagram in the space provided. ........................................................................................................................................... ........................................................................................................................................... ........................................................................................................................................... space for diagram [2] (b) A student carried out an investigation into the effect of temperature on the activity of the enzymes in Y. The student immobilised the yeast cells in alginate beads which were then dropped into a solution of the substrate at different temperatures. As carbon dioxide collected in the beads they rose to the surface of the solution of the substrate as shown in Fig. 1.2. beads rise 20 cm to the surface beads rise as carbon dioxide 20 cm accumulates beads are initially more dense than the solution Fig. 1.2 The student measured the time taken for 5 beads to rise to the surface, a distance of 20 cm. The processed results are shown in Table 1.3 Table 1.3 mean time to rise temperature / °C / seconds 10 72 25 19 40 11 50 36 55 108 (i) Identify the temperature at which the beads rise the fastest. ........................................ °C For this temperature calculate the rate at which these beads rise 20 cm. rate = ............................................................... [2] (ii) Plot a graph of the data in Table 1.3 on the grid in Fig. 1.3. Use a sharp pencil for drawing graphs. Fig. 1.3 [4] (iii) Describe the trend shown by the graph in Fig. 1.3. ........................................................................................................................................... ........................................................................................................................................... ........................................................................................................................................... ..................................................................................................................................... [1] (iv) Explain the shape of the graph: between 10 °C and 40 °C ........................................................................................................................................... ........................................................................................................................................... ........................................................................................................................................... ........................................................................................................................................... between 40 °C and 55 °C. ........................................................................................................................................... ........................................................................................................................................... ........................................................................................................................................... ........................................................................................................................................... [3] [Total: 21] Question 2 starts on page 12
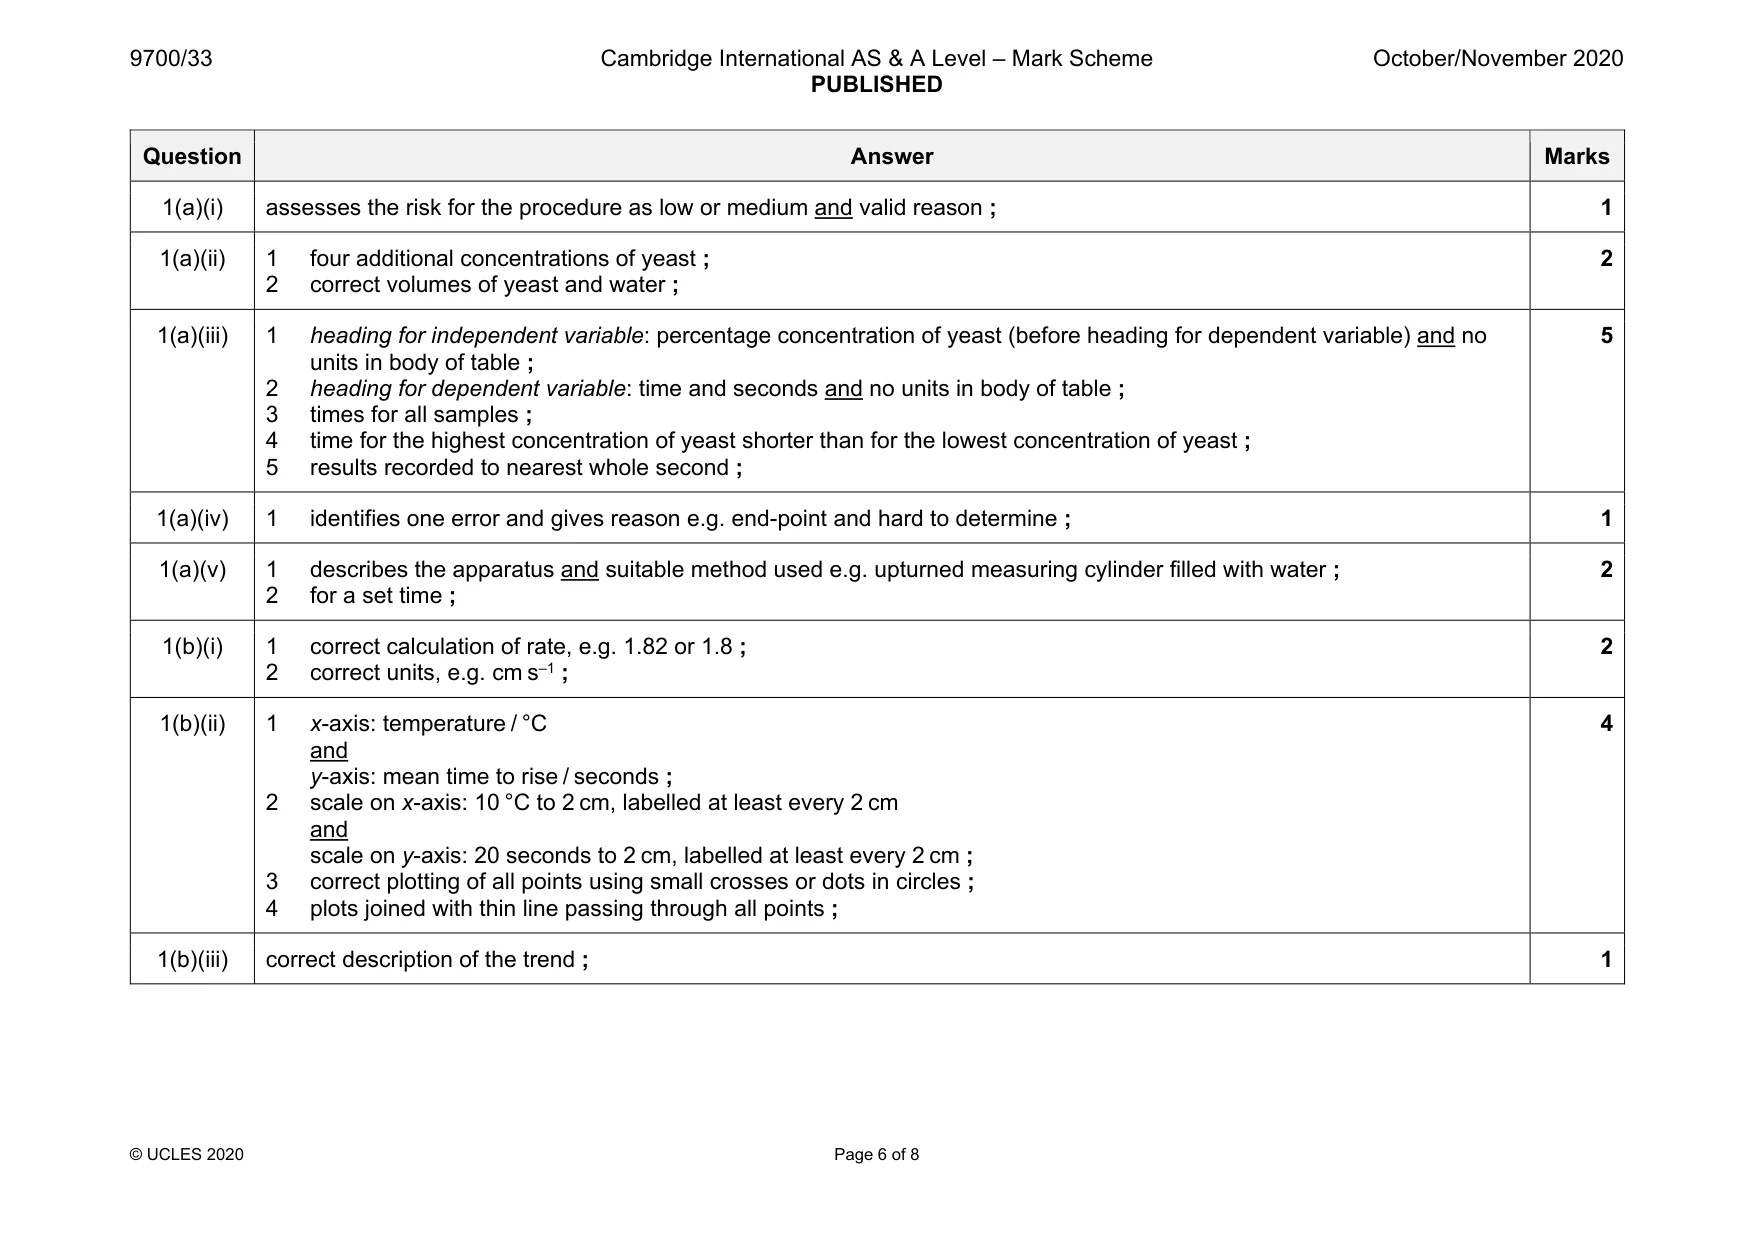
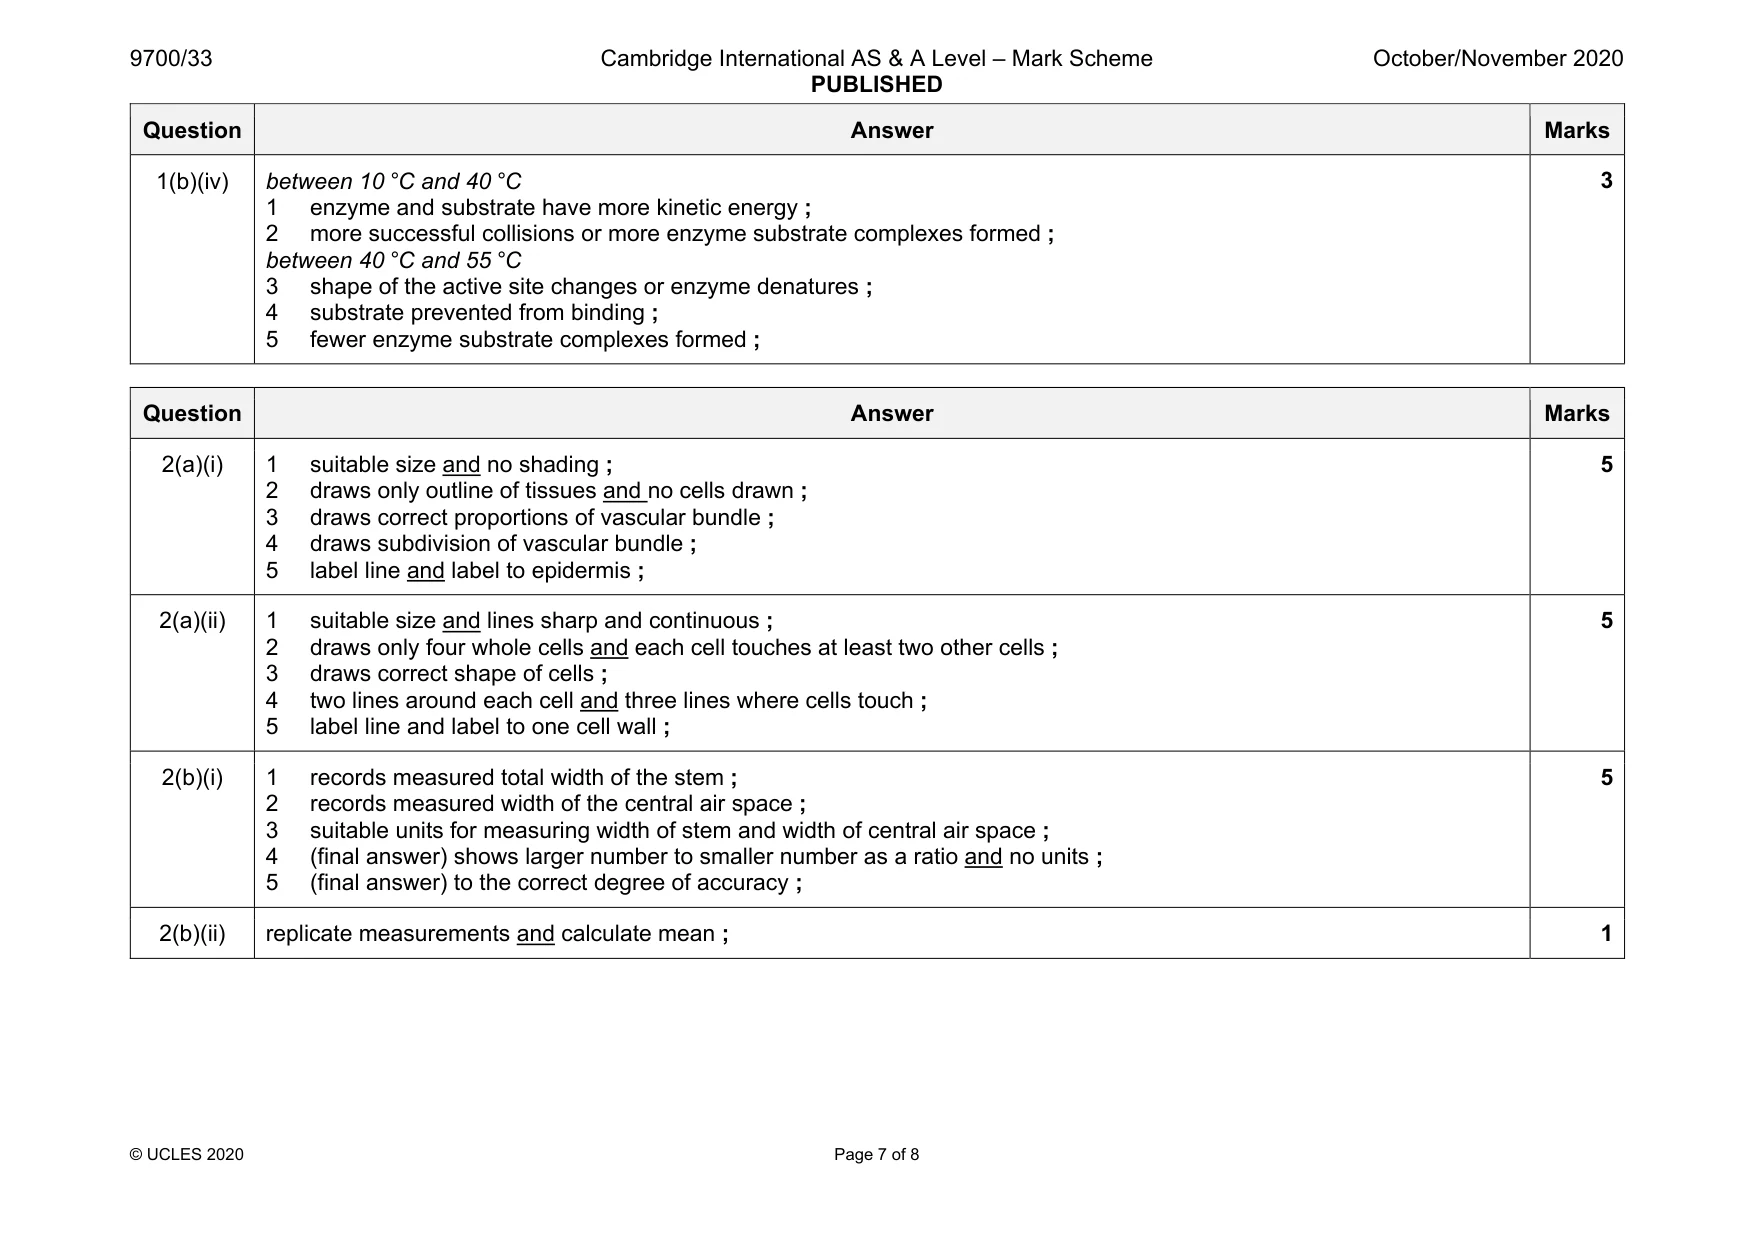
Mark scheme: 1(a)(i) assesses the risk for the procedure as low or medium and valid reason ; 1 1(a)(ii) 1 four additional concentrations of yeast ; 2 correct volumes of yeast and water ; 2 1(a)(iii) 1 heading for independent variable: percentage concentration of yeast (before heading for dependent variable) and no units in body of table ; 2 heading for dependent variable: time and seconds and no units in body of table ; 3 times for all samples ; 4 time for the highest concentration of yeast shorter than for the lowest concentration of yeast ; 5 results recorded to nearest whole second ; 5 1(a)(iv) 1 identifies one error and gives reason e.g. end-point and hard to determine ; 1 1(a)(v) 1 describes the apparatus and suitable method used e.g. upturned measuring cylinder filled with water ; 2 for a set time ; 2 1(b)(i) 1 correct calculation of rate, e.g. 1.82 or 1.8 ; 2 correct units, e.g. cm s–1 ; 2 1(b)(ii) 1 x-axis: temperature / °C and y-axis: mean time to rise / seconds ; 2 scale on x-axis: 10 °C to 2 cm, labelled at least every 2 cm and scale on y-axis: 20 seconds to 2 cm, labelled at least every 2 cm ; 3 correct plotting of all points using small crosses or dots in circles ; 4 plots joined with thin line passing through all points ; 4 1(b)(iii) correct description of the trend ; 1 Question Answer Marks 1(b)(iv) between 10 °C and 40 °C 1 enzyme and substrate have more kinetic energy ; 2 more successful collisions or more enzyme substrate complexes formed ; between 40 °C and 55 °C 3 shape of the active site changes or enzyme denatures ; 4 substrate prevented from binding ; 5 fewer enzyme substrate complexes formed ; 3
Q2 · K1 is a slide of a stained transverse section through a plant stem
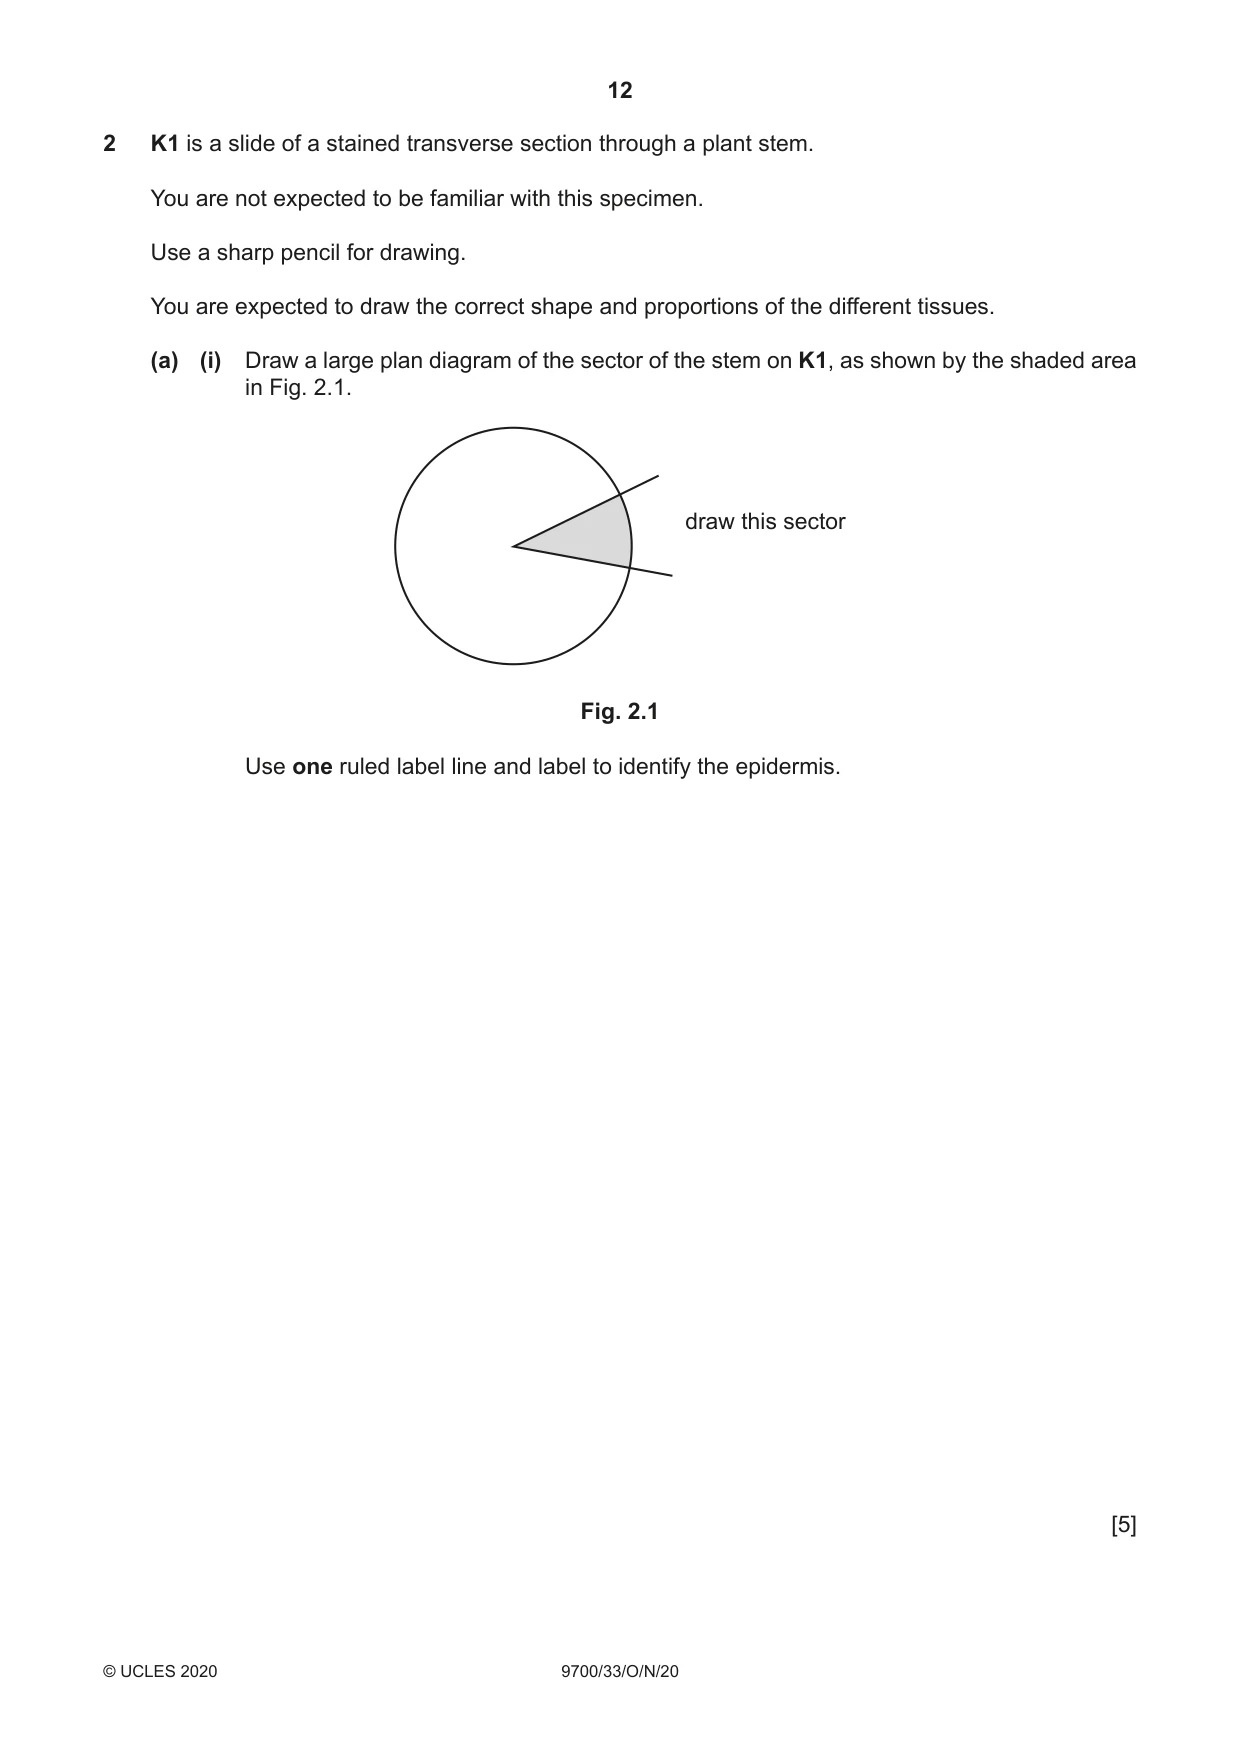
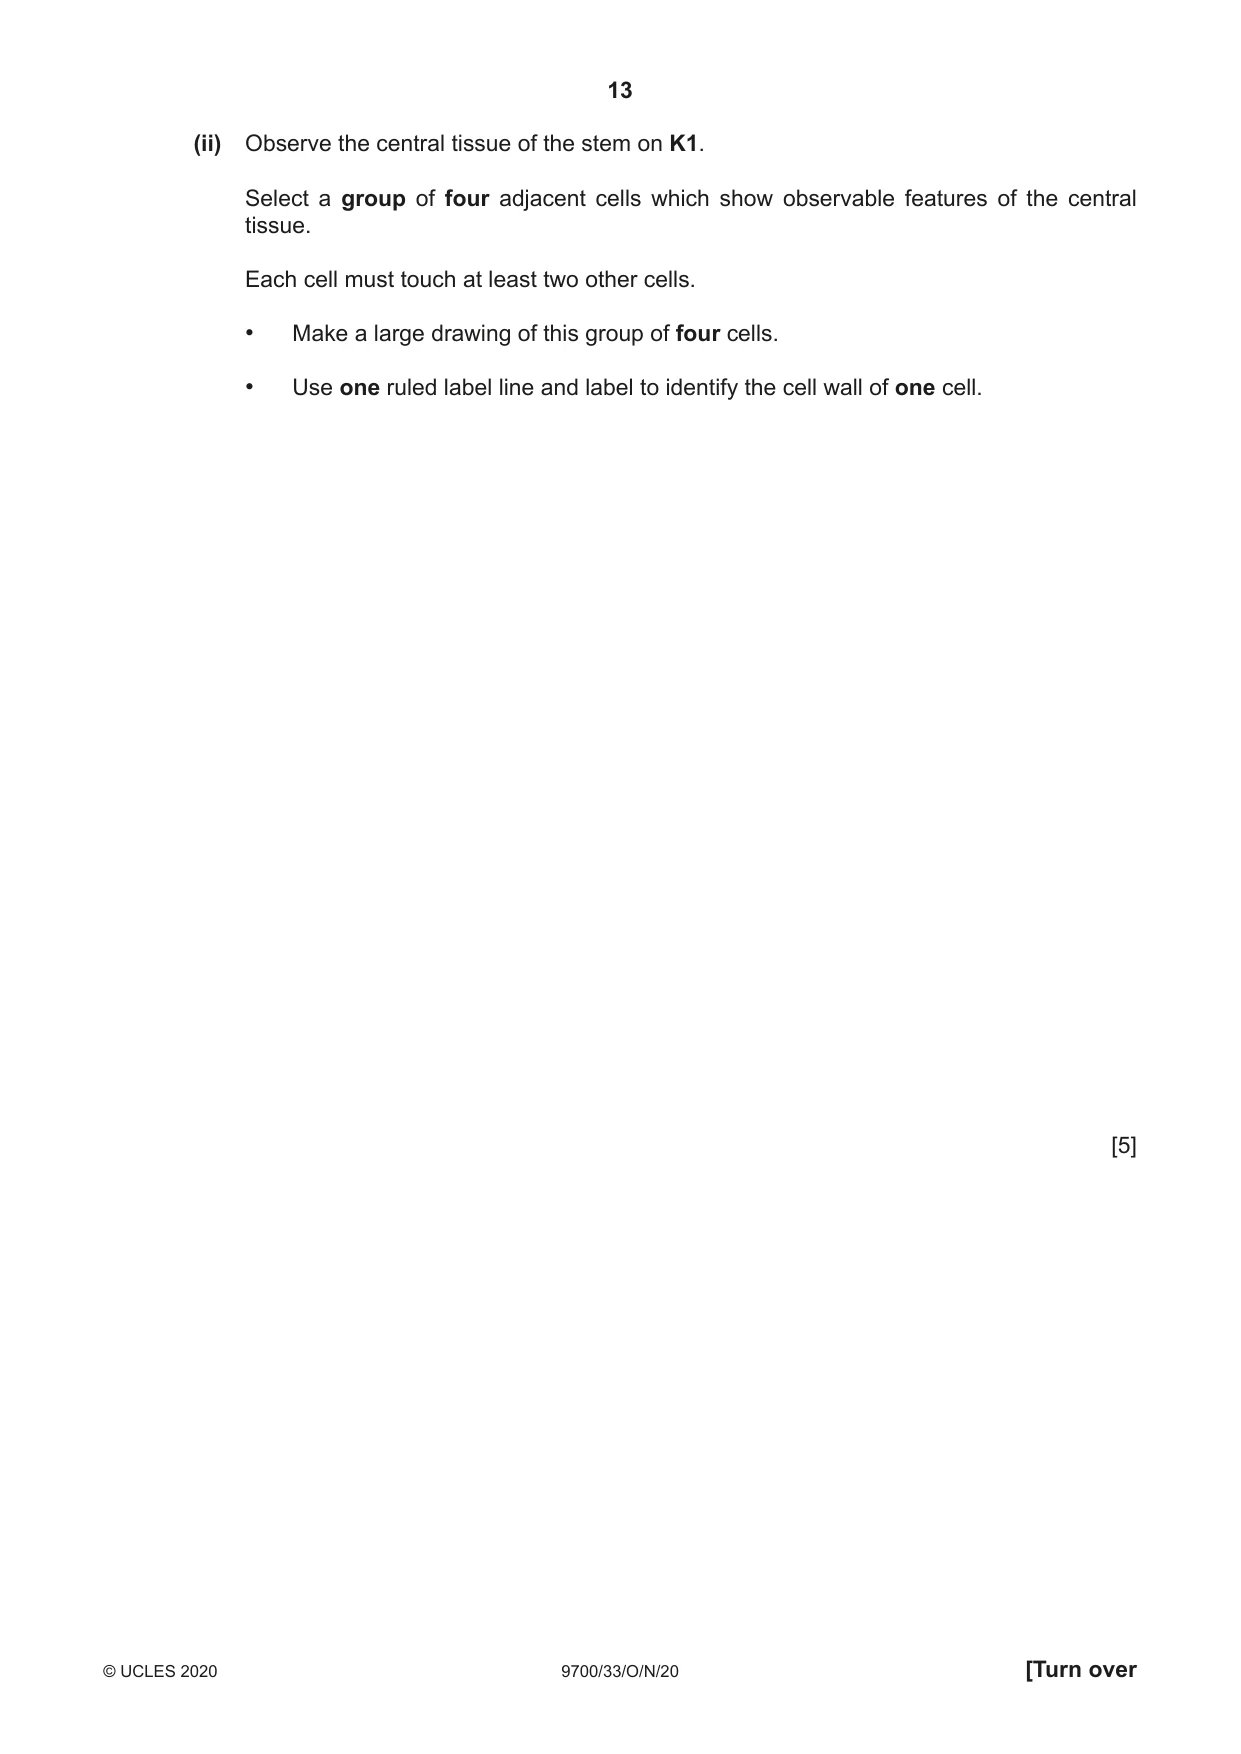
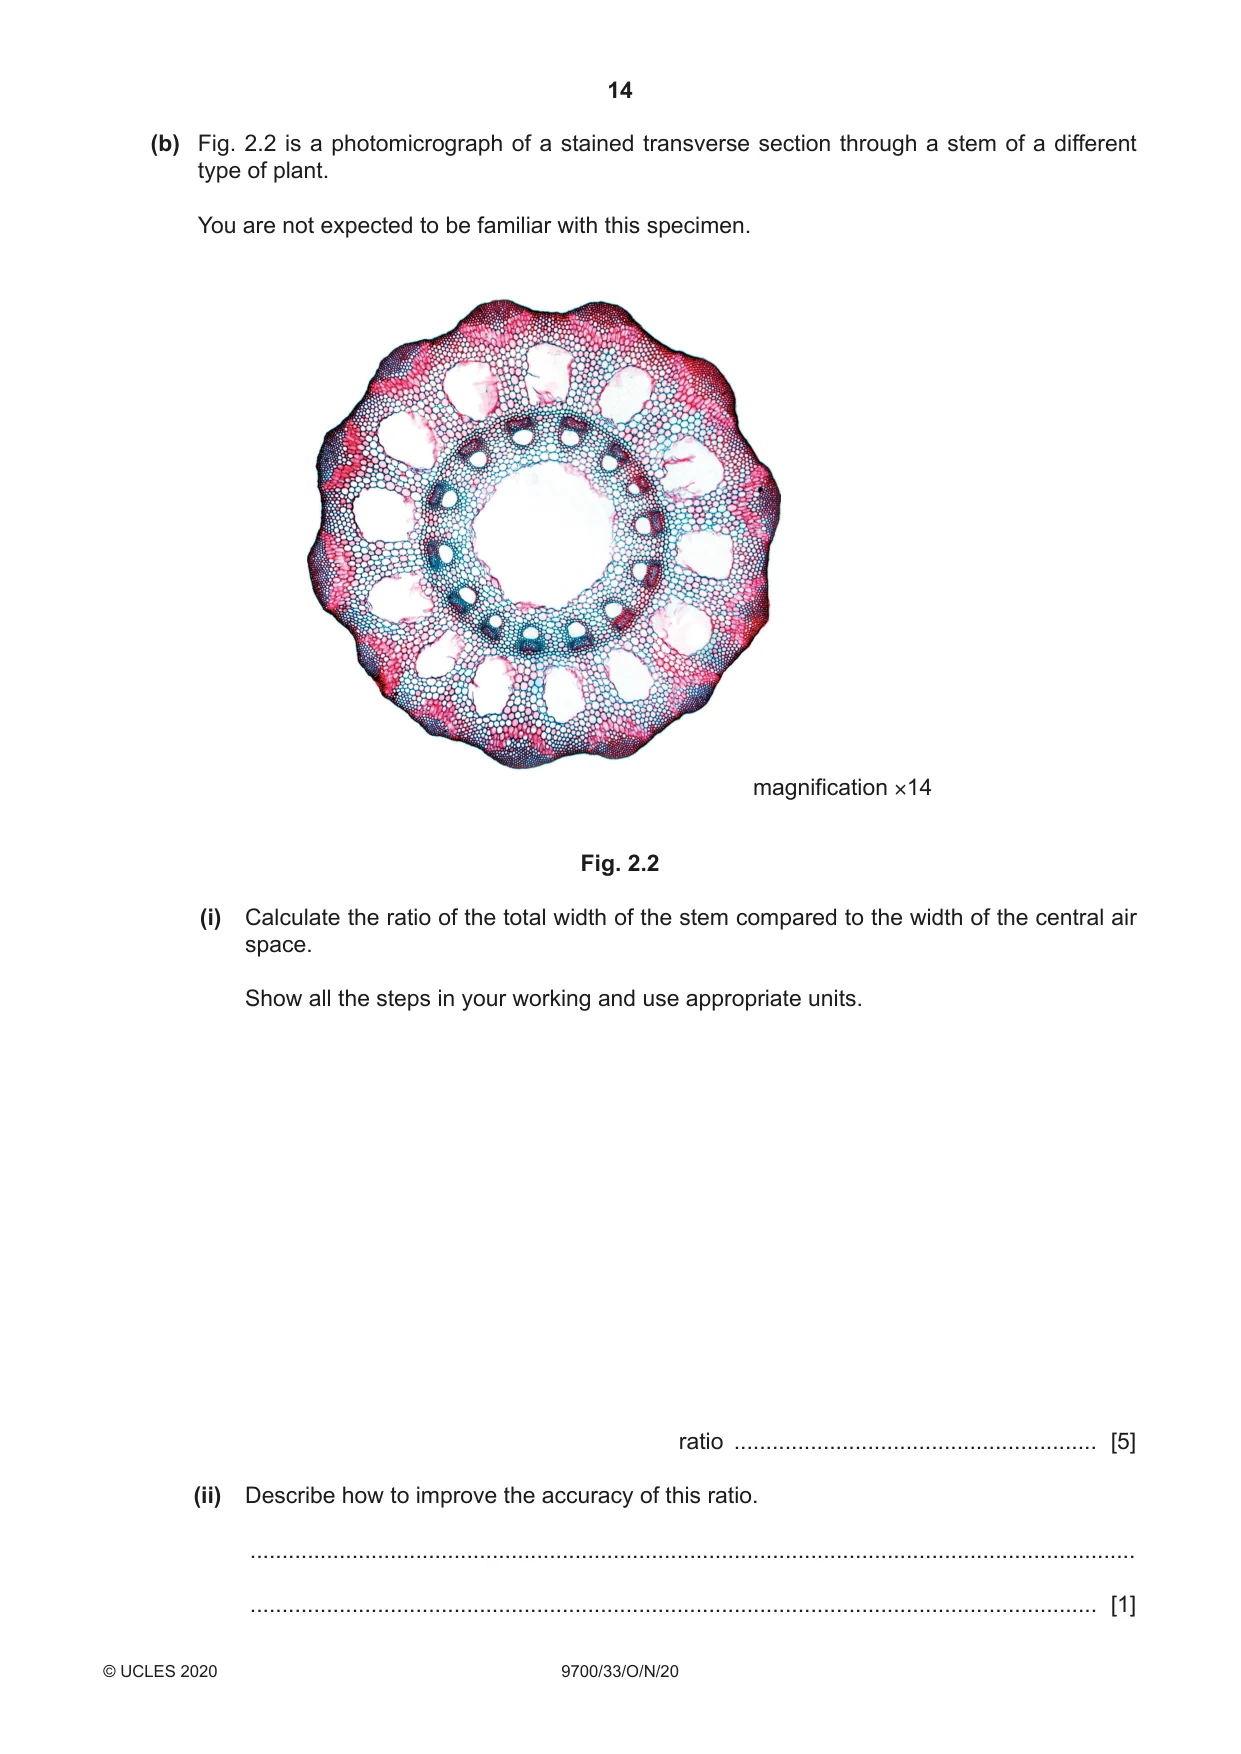
2 K1 is a slide of a stained transverse section through a plant stem. You are not expected to be familiar with this specimen. Use a sharp pencil for drawing. You are expected to draw the correct shape and proportions of the different tissues. (a) (i) Draw a large plan diagram of the sector of the stem on K1, as shown by the shaded area in Fig. 2.1. draw this sector Fig. 2.1 Use one ruled label line and label to identify the epidermis. [5] (ii) Observe the central tissue of the stem on K1. Select a group of four adjacent cells which show observable features of the central tissue. Each cell must touch at least two other cells. • Make a large drawing of this group of four cells. • Use one ruled label line and label to identify the cell wall of one cell. [5] (b) Fig. 2.2 is a photomicrograph of a stained transverse section through a stem of a different type of plant. You are not expected to be familiar with this specimen. magnification ×14 Fig. 2.2 (i) Calculate the ratio of the total width of the stem compared to the width of the central air space. Show all the steps in your working and use appropriate units. ratio ......................................................... [5] (ii) Describe how to improve the accuracy of this ratio. ........................................................................................................................................... ..................................................................................................................................... [1]
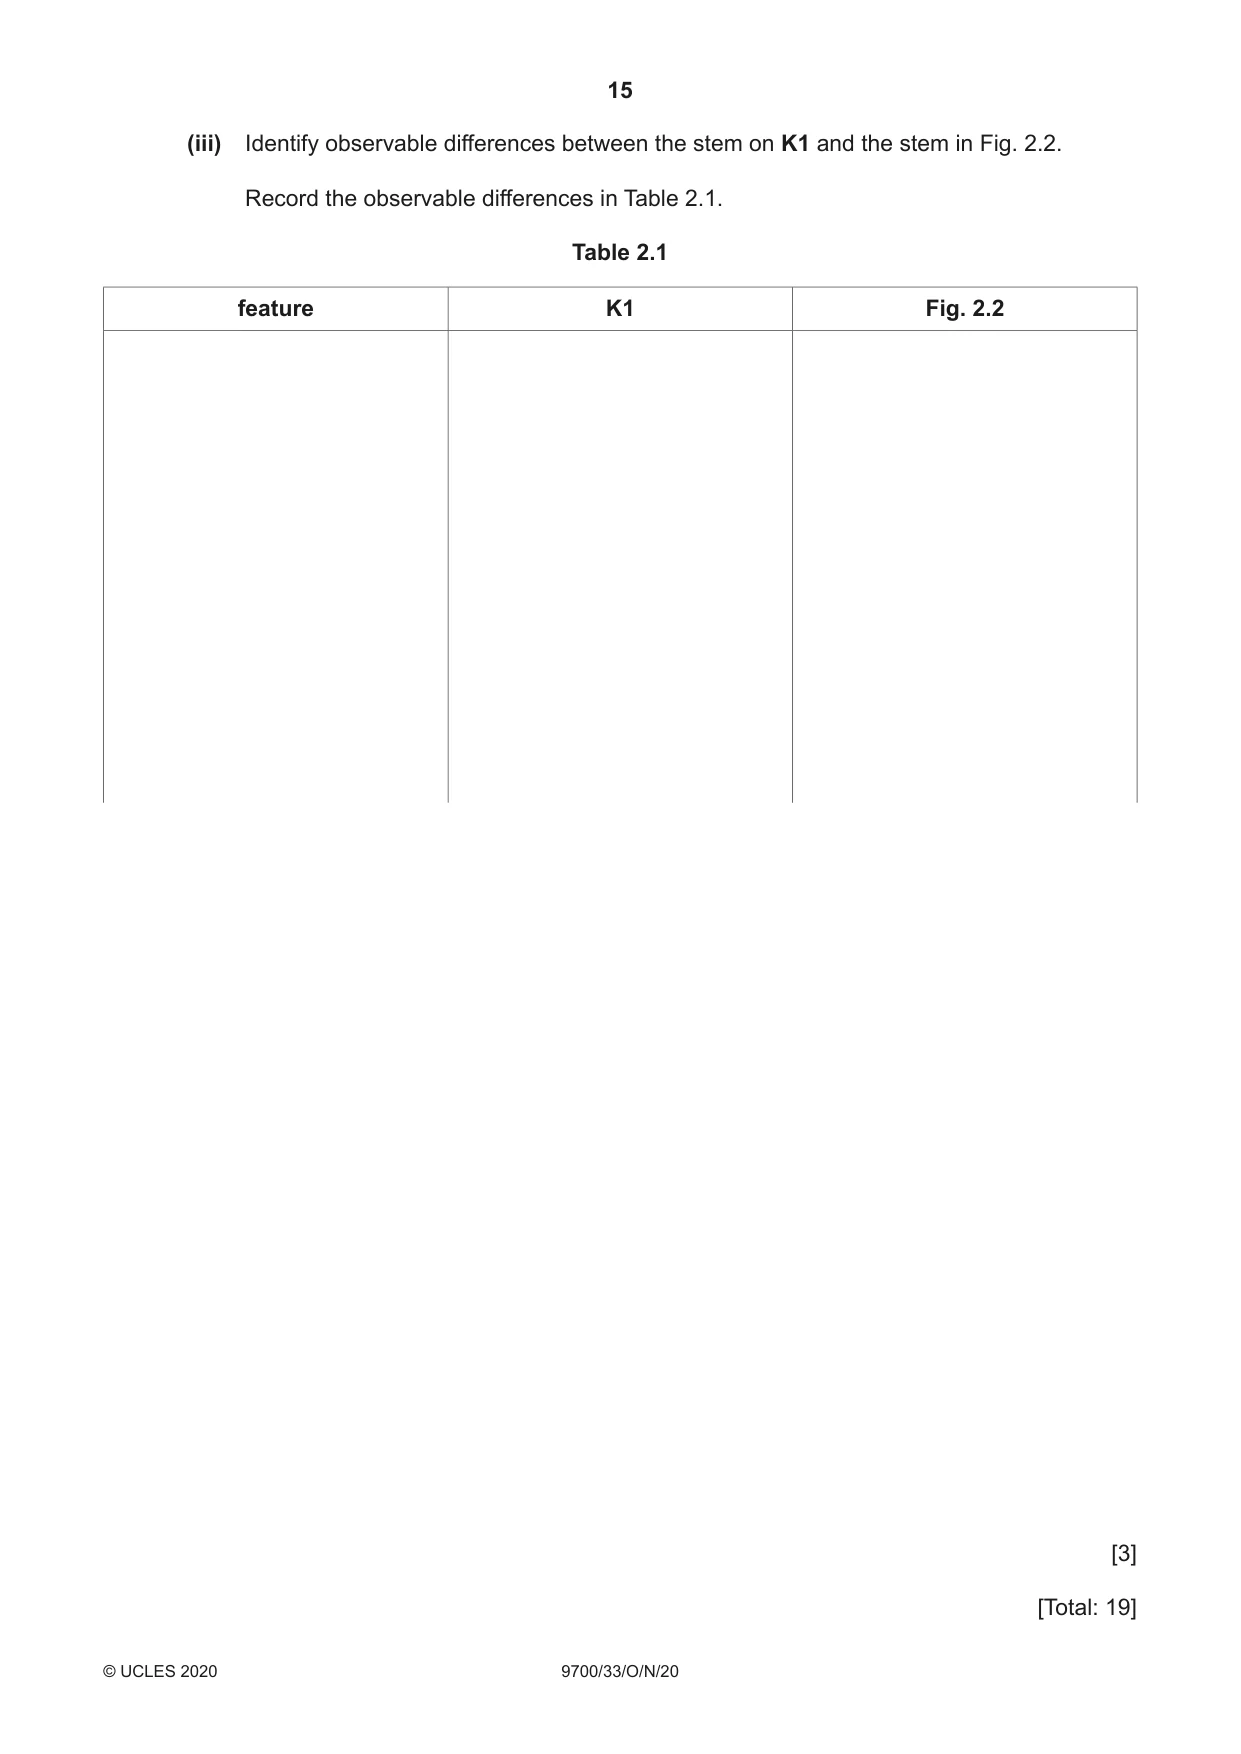
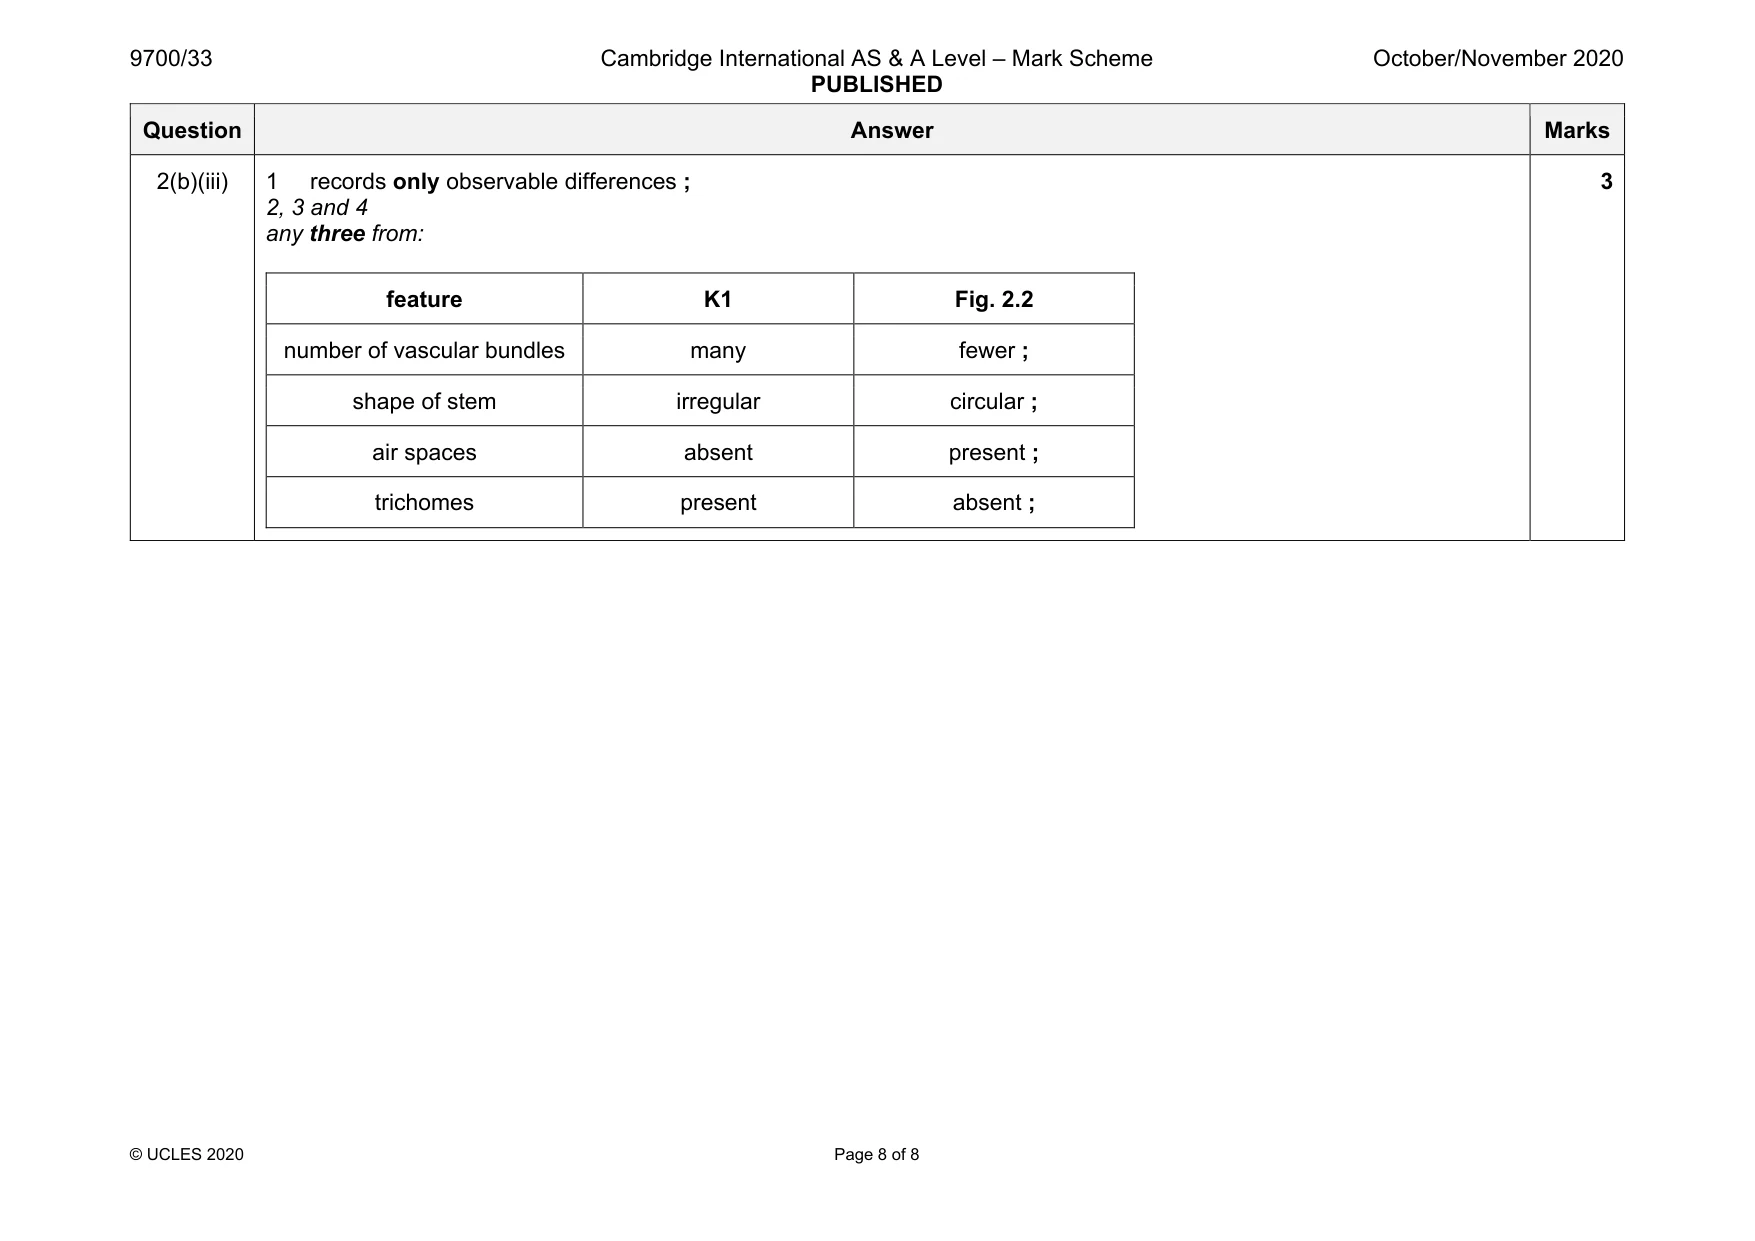
Mark scheme: 2(a)(i) 1 suitable size and no shading ; 2 draws only outline of tissues and no cells drawn ; 3 draws correct proportions of vascular bundle ; 4 draws subdivision of vascular bundle ; 5 label line and label to epidermis ; 5 2(a)(ii) 1 suitable size and lines sharp and continuous ; 2 draws only four whole cells and each cell touches at least two other cells ; 3 draws correct shape of cells ; 4 two lines around each cell and three lines where cells touch ; 5 label line and label to one cell wall ; 5 2(b)(i) 1 records measured total width of the stem ; 2 records measured width of the central air space ; 3 suitable units for measuring width of stem and width of central air space ; 4 (final answer) shows larger number to smaller number as a ratio and no units ; 5 (final answer) to the correct degree of accuracy ; 5 2(b)(ii) replicate measurements and calculate mean ; 1 Question Answer Marks 2(b)(iii) 1 records only observable differences ; 2, 3 and 4 any three from: feature K1 Fig. 2.2 number of vascular bundles many fewer ; shape of stem irregular circular ; air spaces absent present ; trichomes present absent ; 3
More questions on Cells as the basic units of living organisms
What was in this paper
The subtopics covered by these 2 questions, and how many questions each got. Open one in a new tab to see every Cambridge question on it.
What you needed in this session
Cambridge’s own grade thresholds for 2020 Oct/Nov, Paper 3 · Variant 3. A higher threshold means an easier paper — the bar moves with how the cohort did.