Cambridge A Level Biology 9700 — 2020 Oct/Nov Paper 3 · Variant 1
9700/31/O/N/20 · 2 questions · 40 marks · ≈45 min
The question paper and its mark scheme, free to read here and free to download. This is Cambridge’s own paper, exactly as it was sat.
Question paper16 pages


Mark scheme7 pages
Answers below. Sit the paper first if you are practising.
Questions as text
Q1 · Milk contains nutrients, including proteins, fats, carbohydrates, vitamins and minerals…
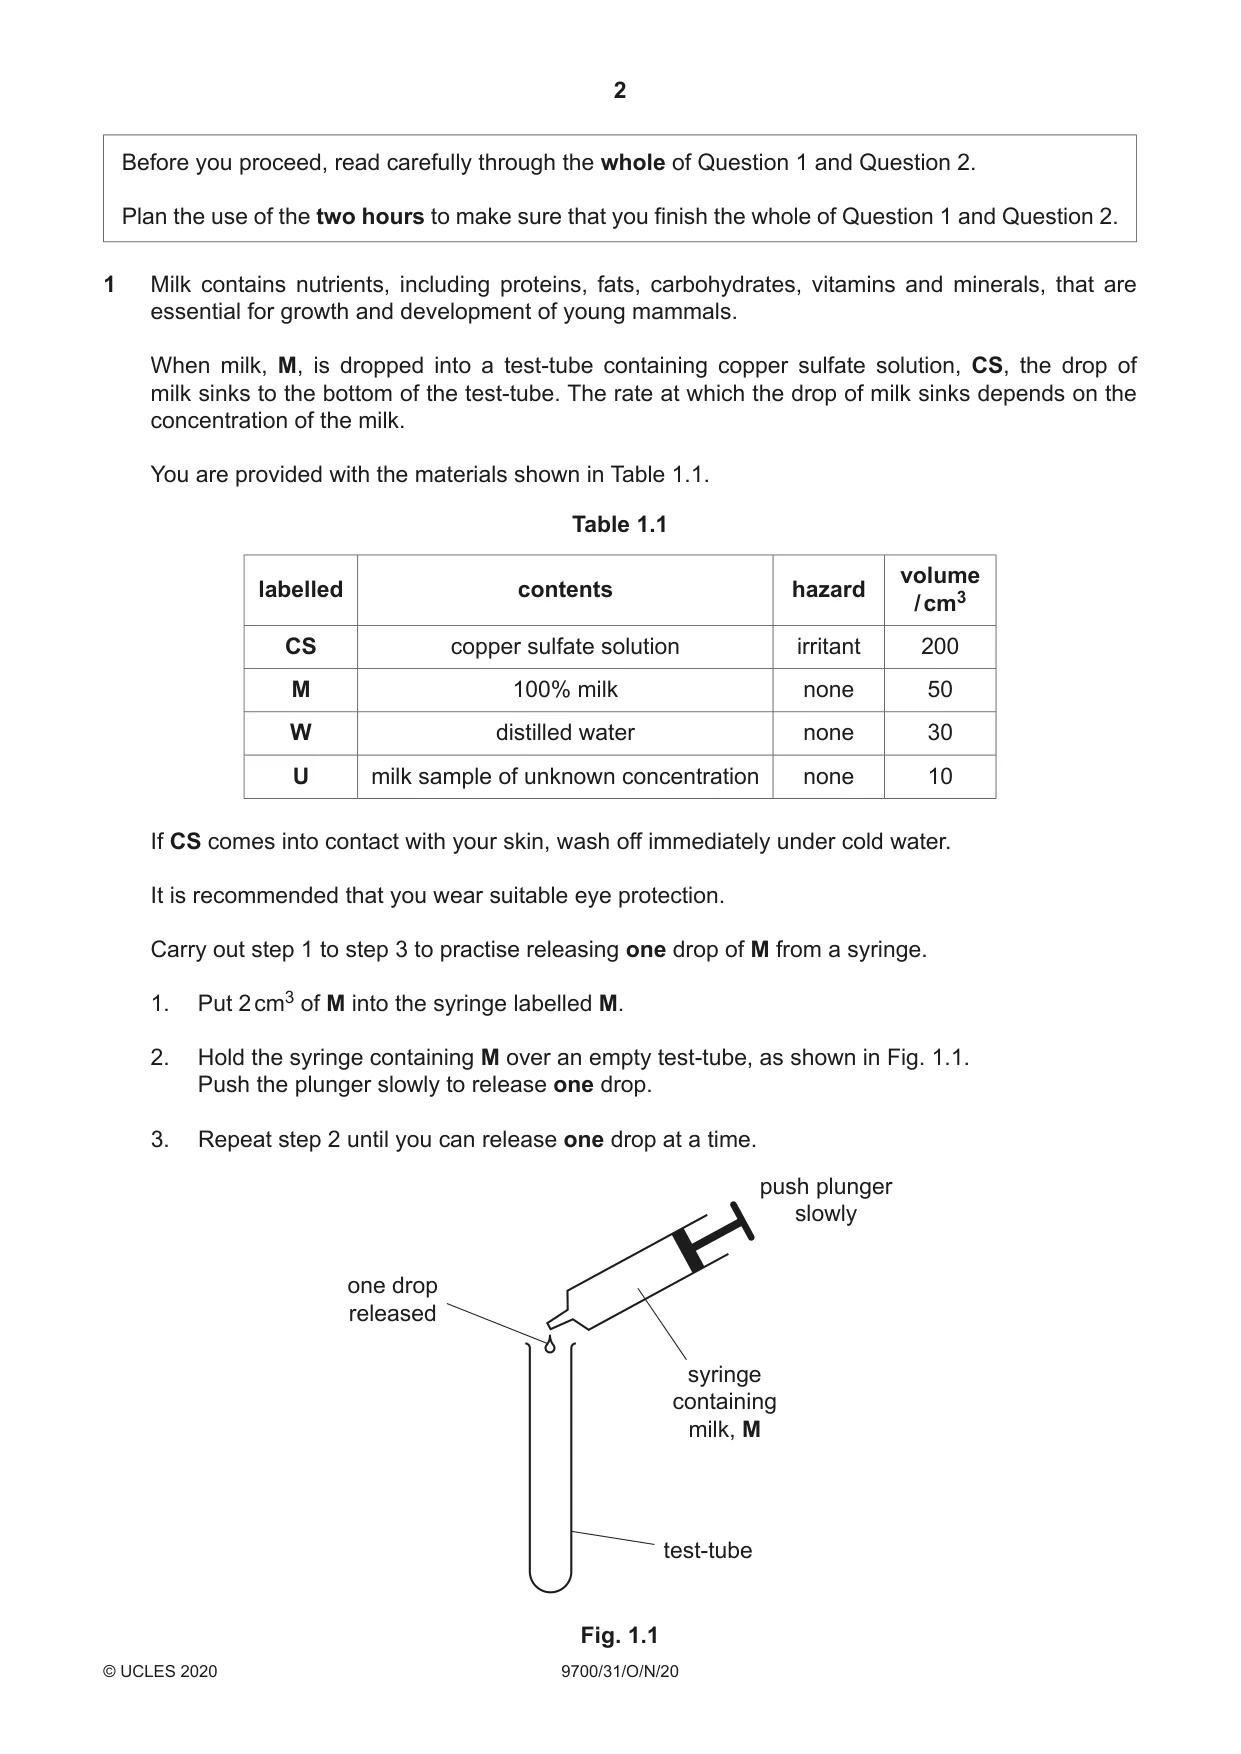
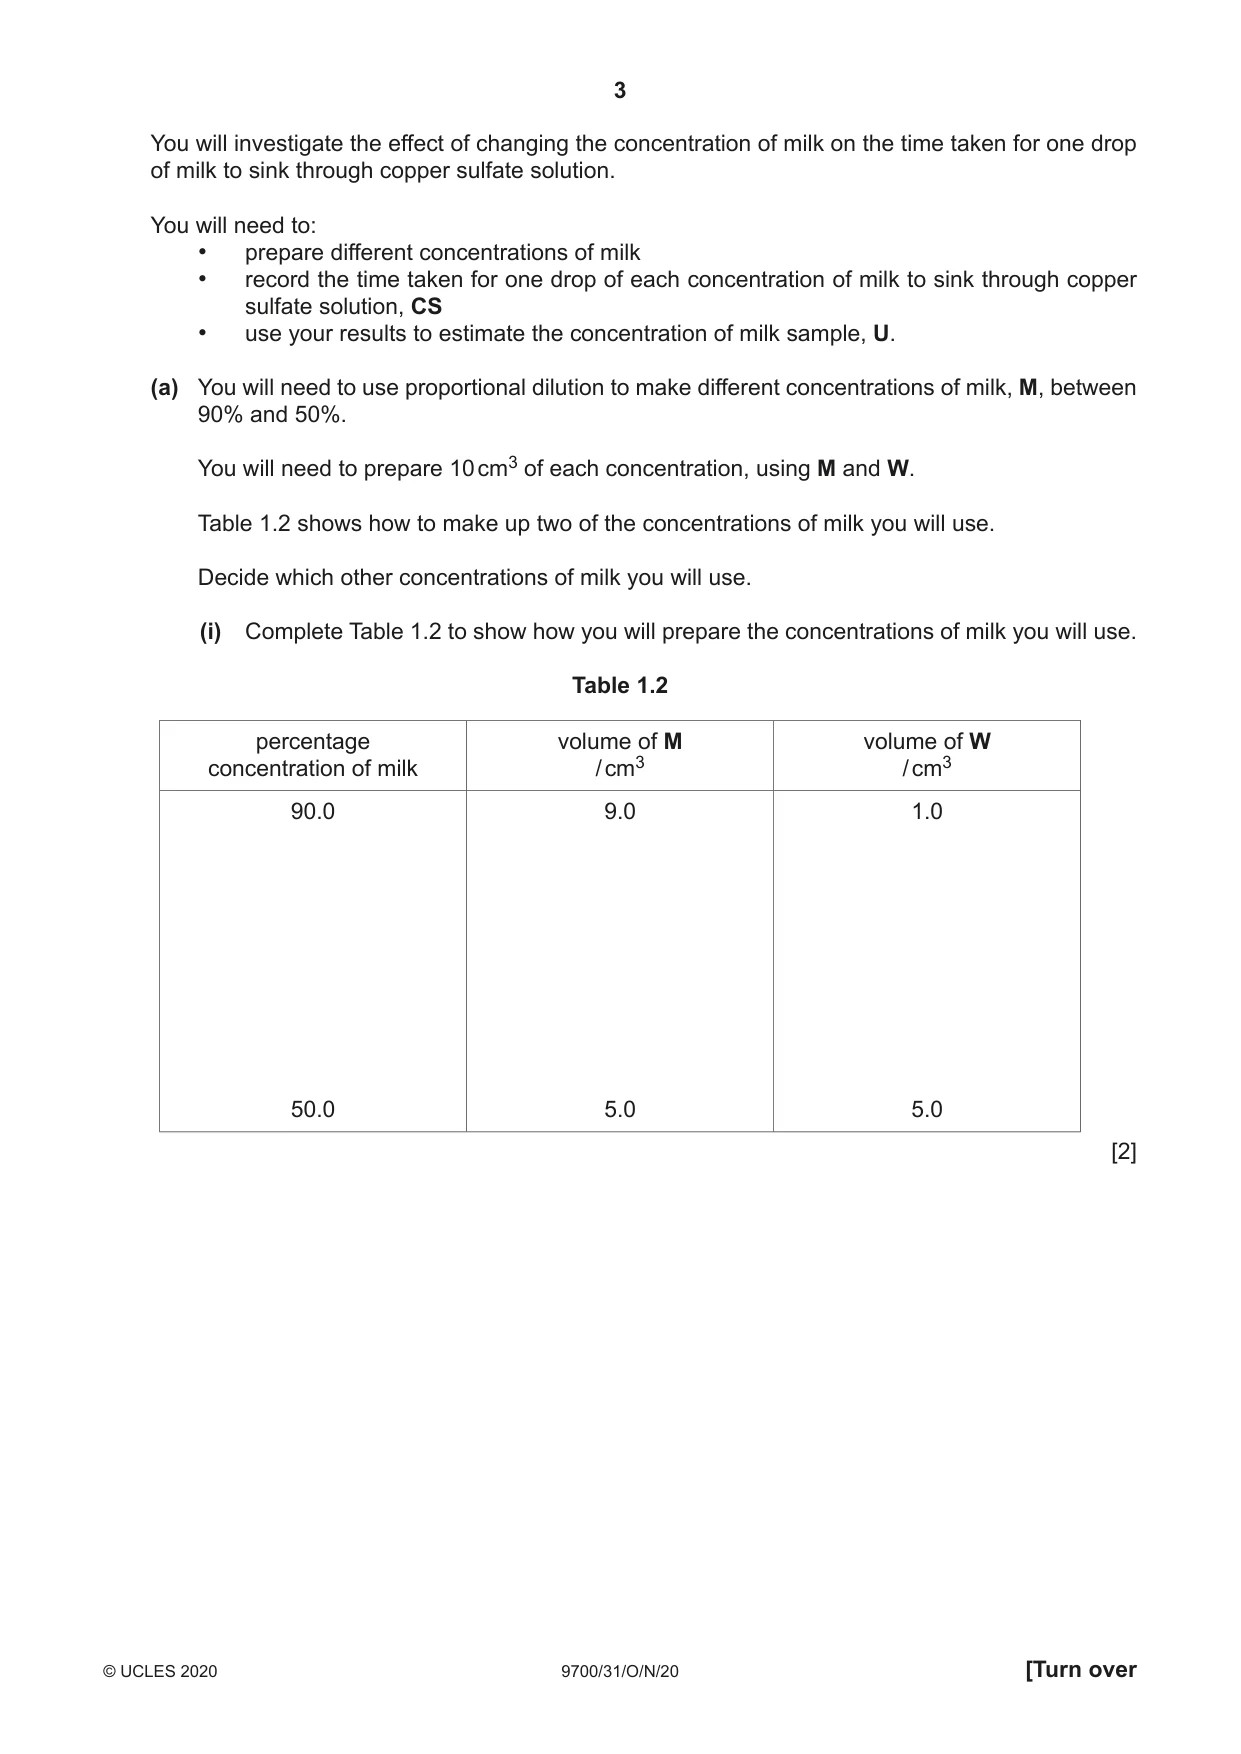
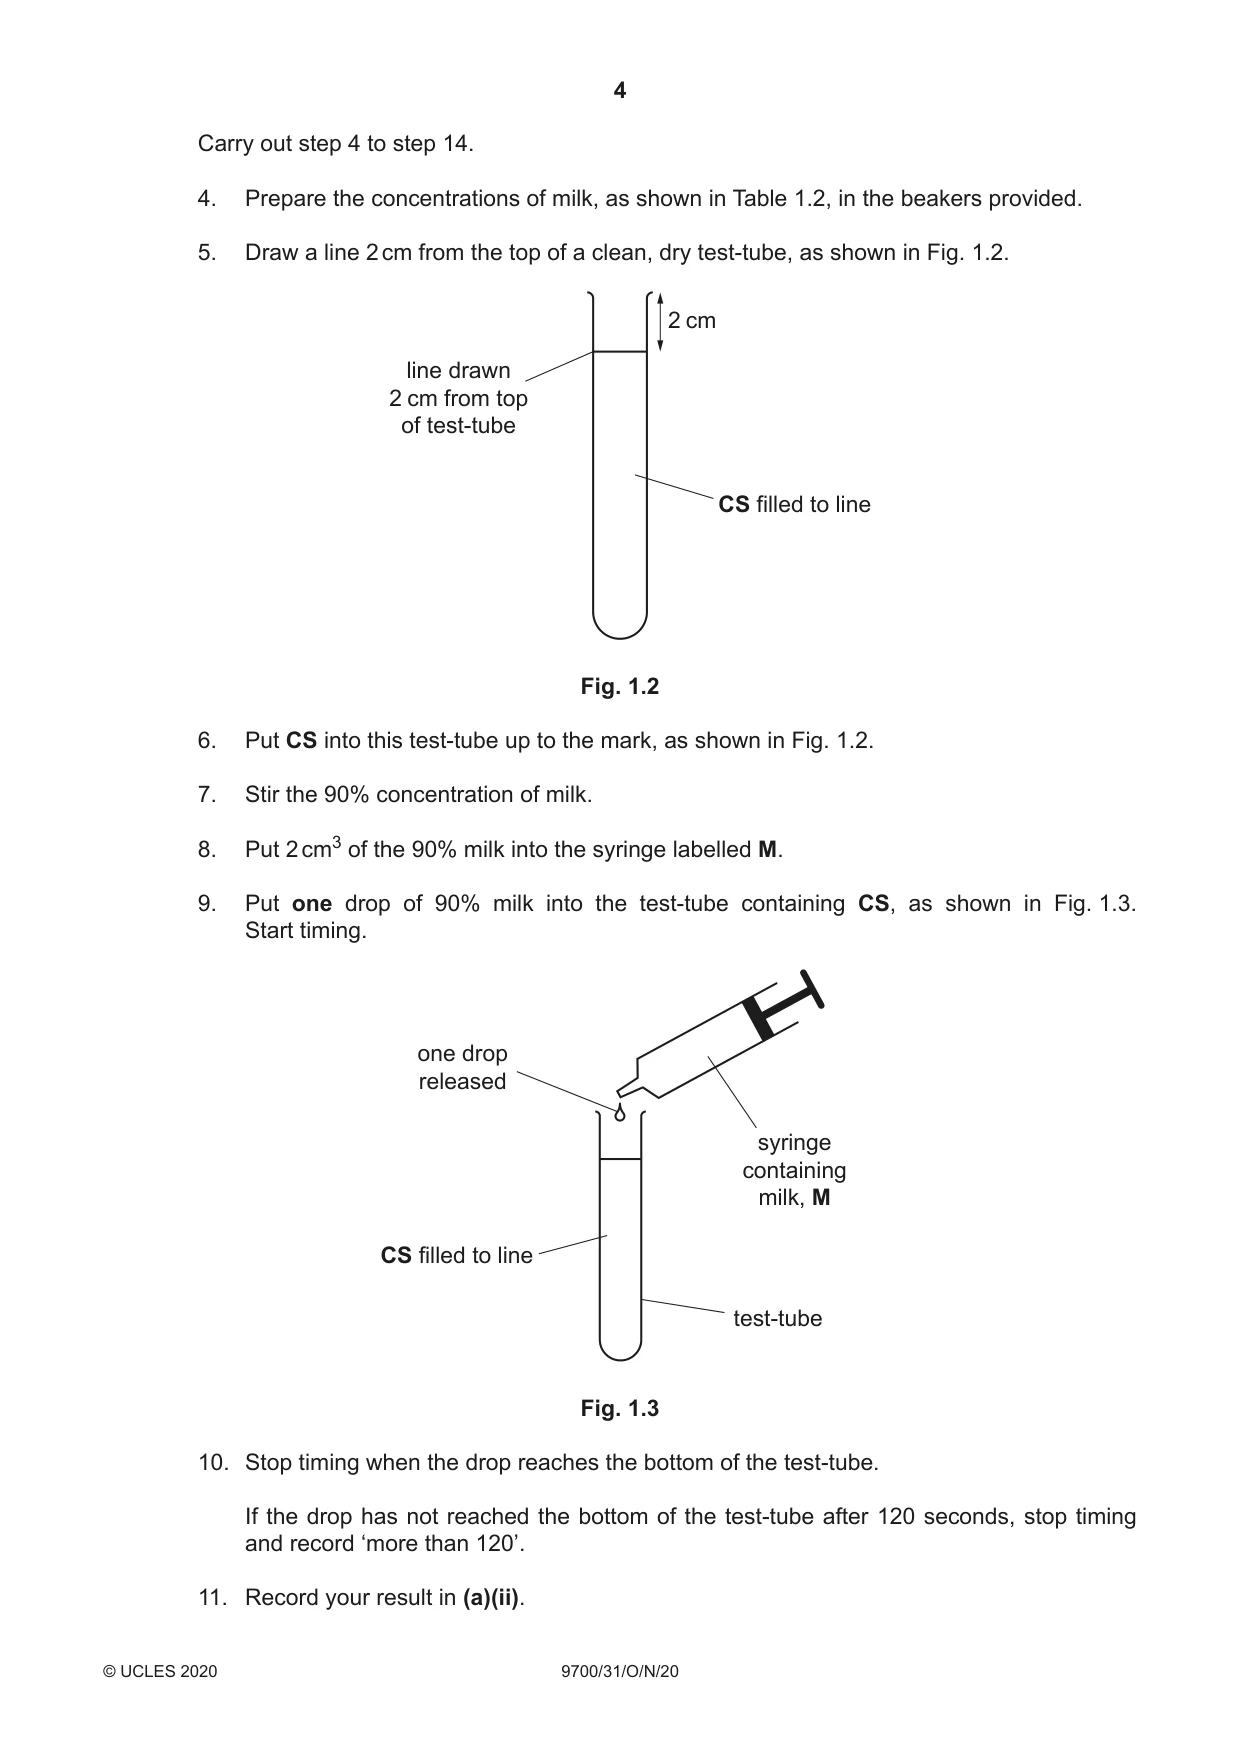
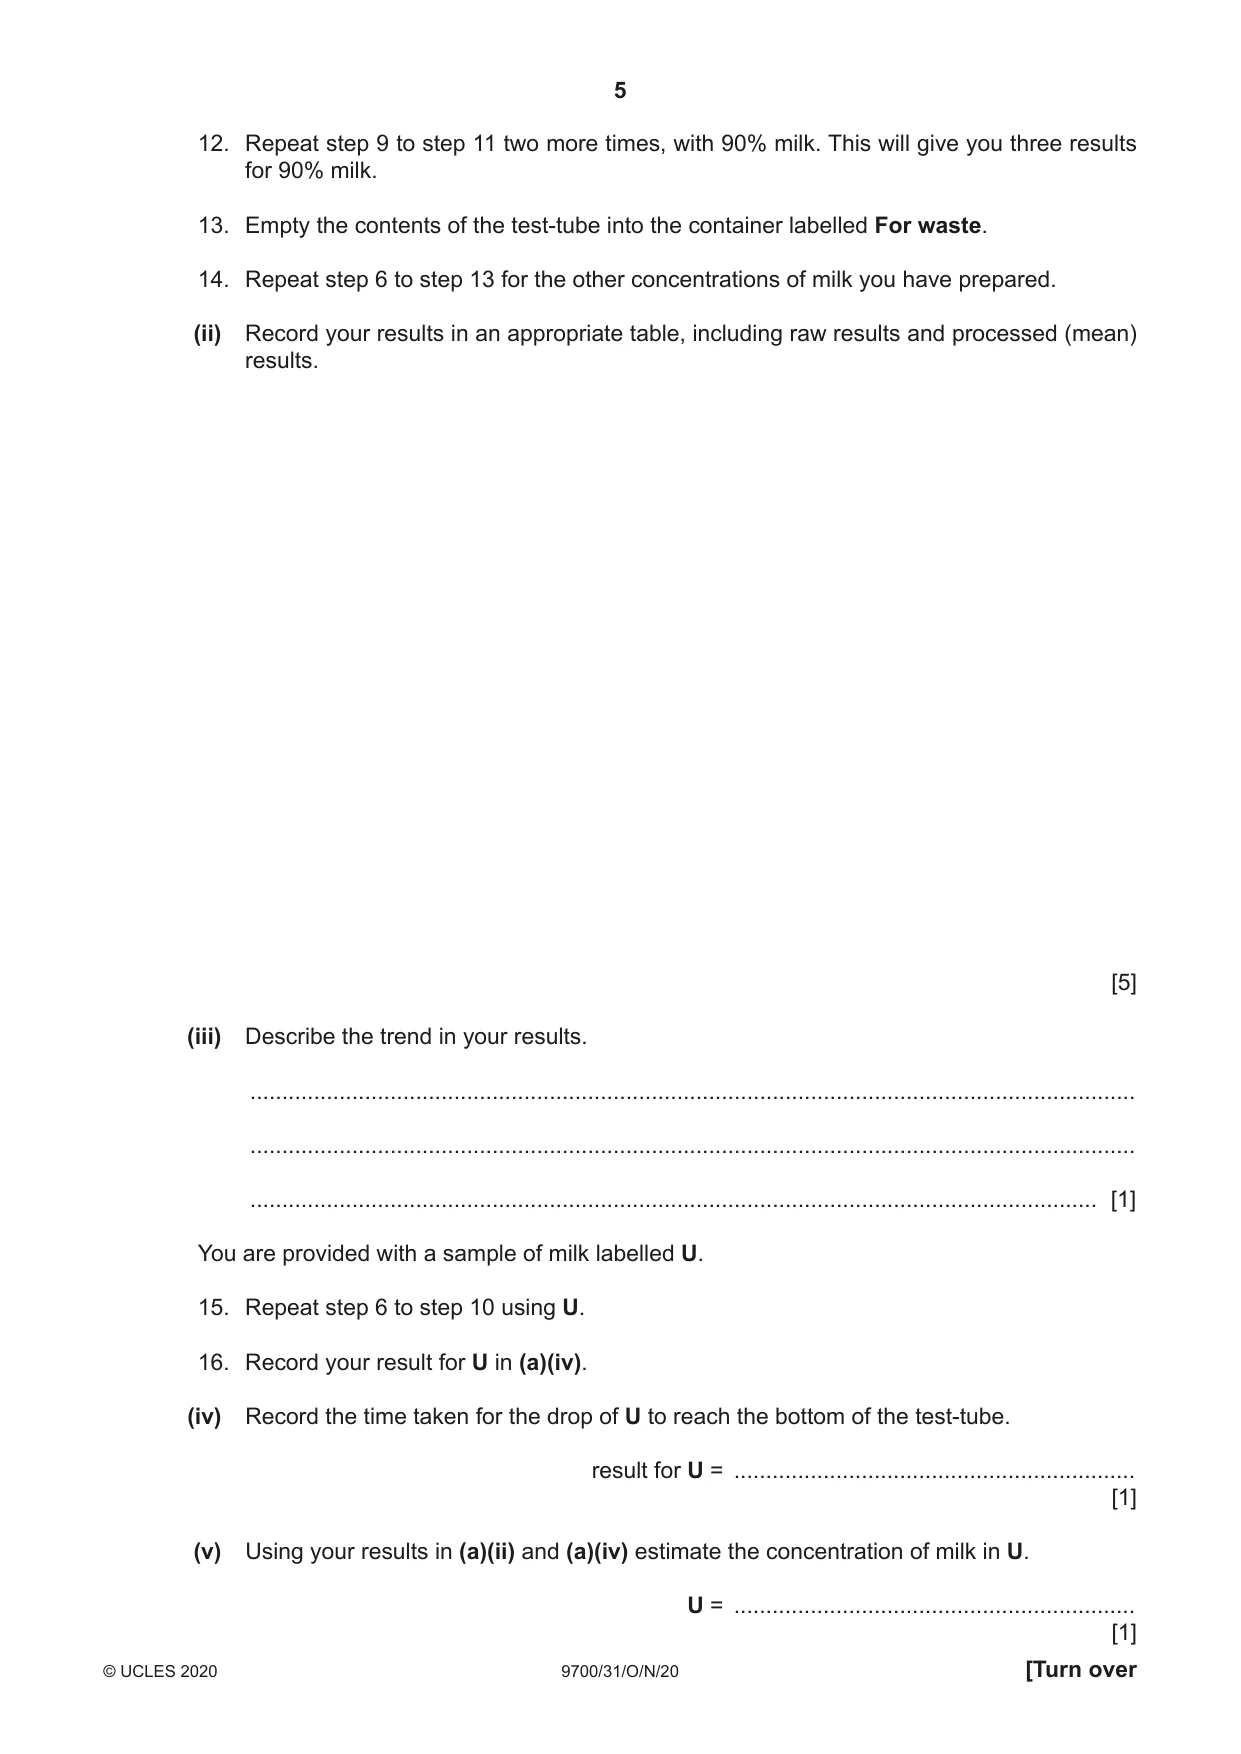
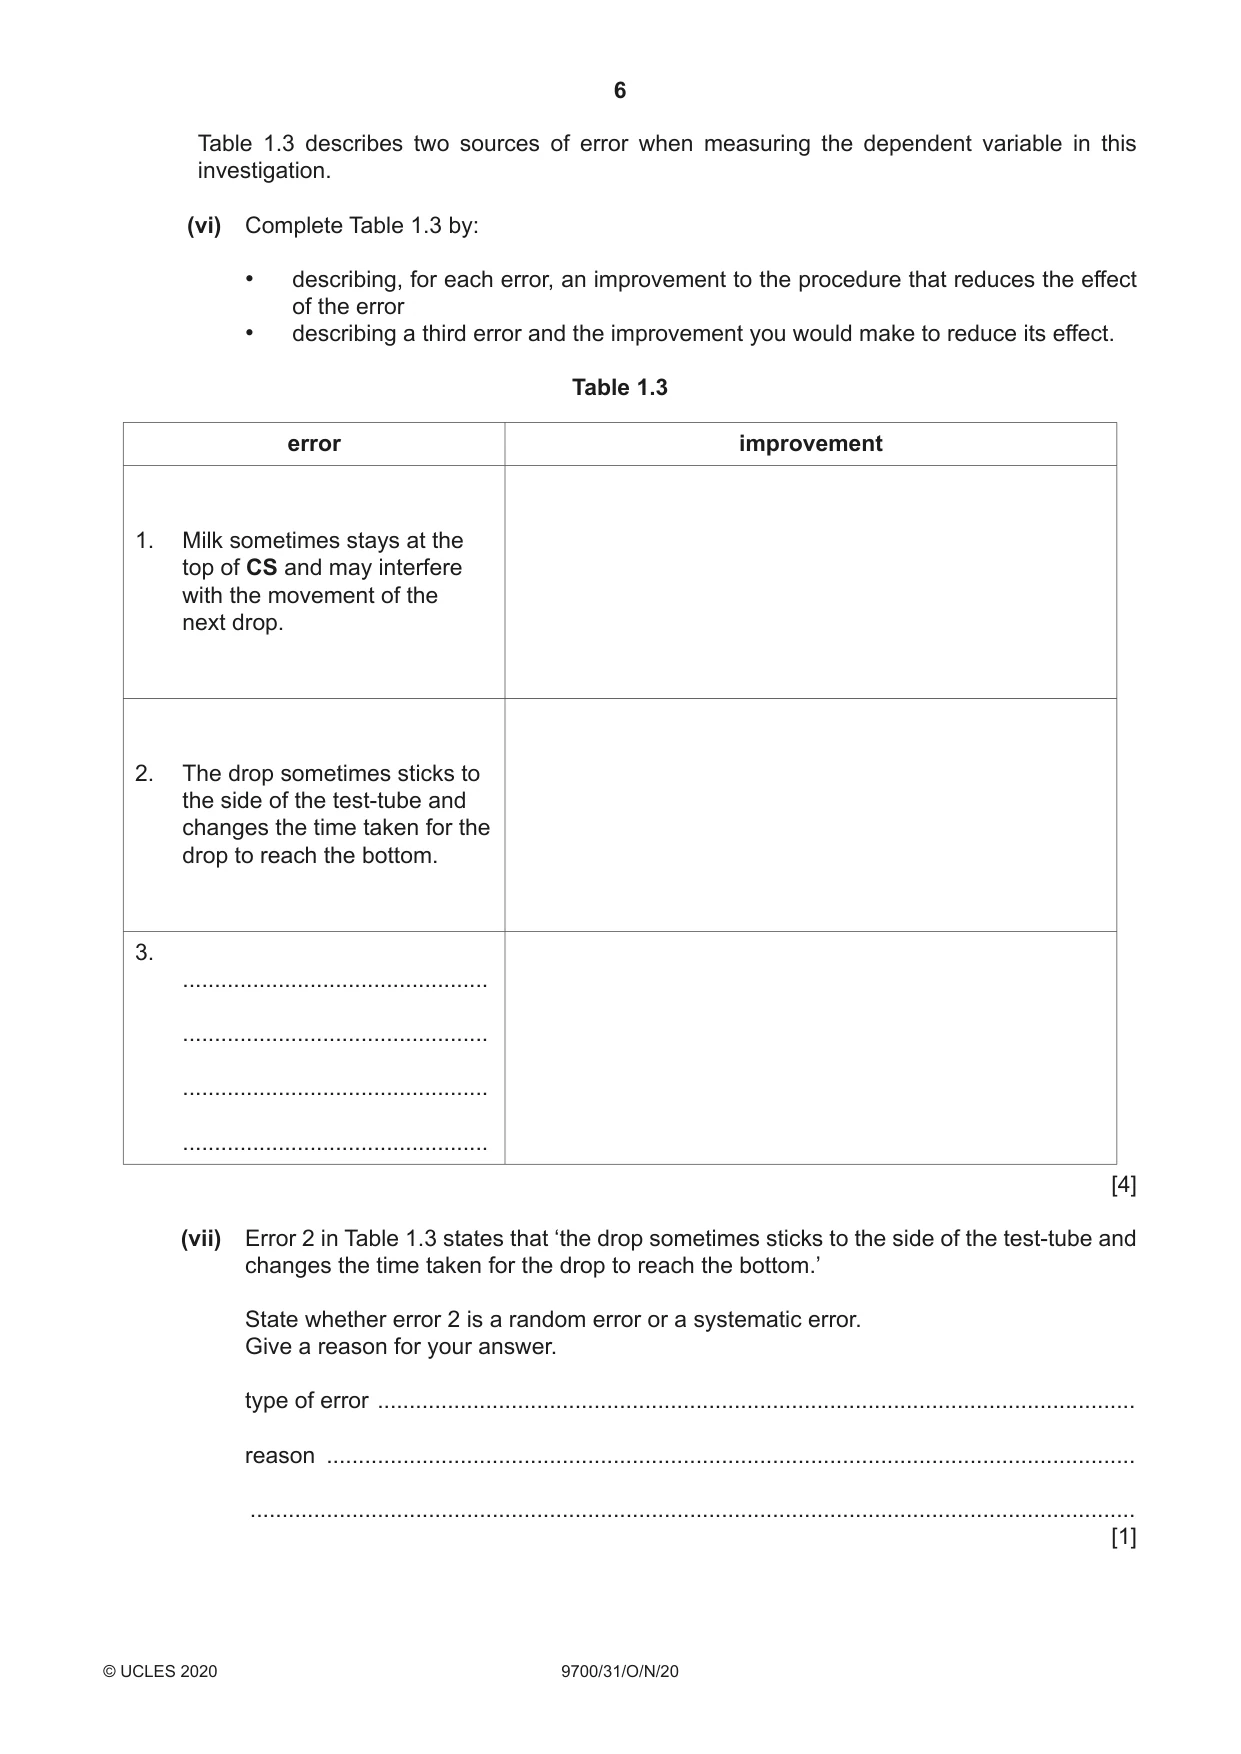
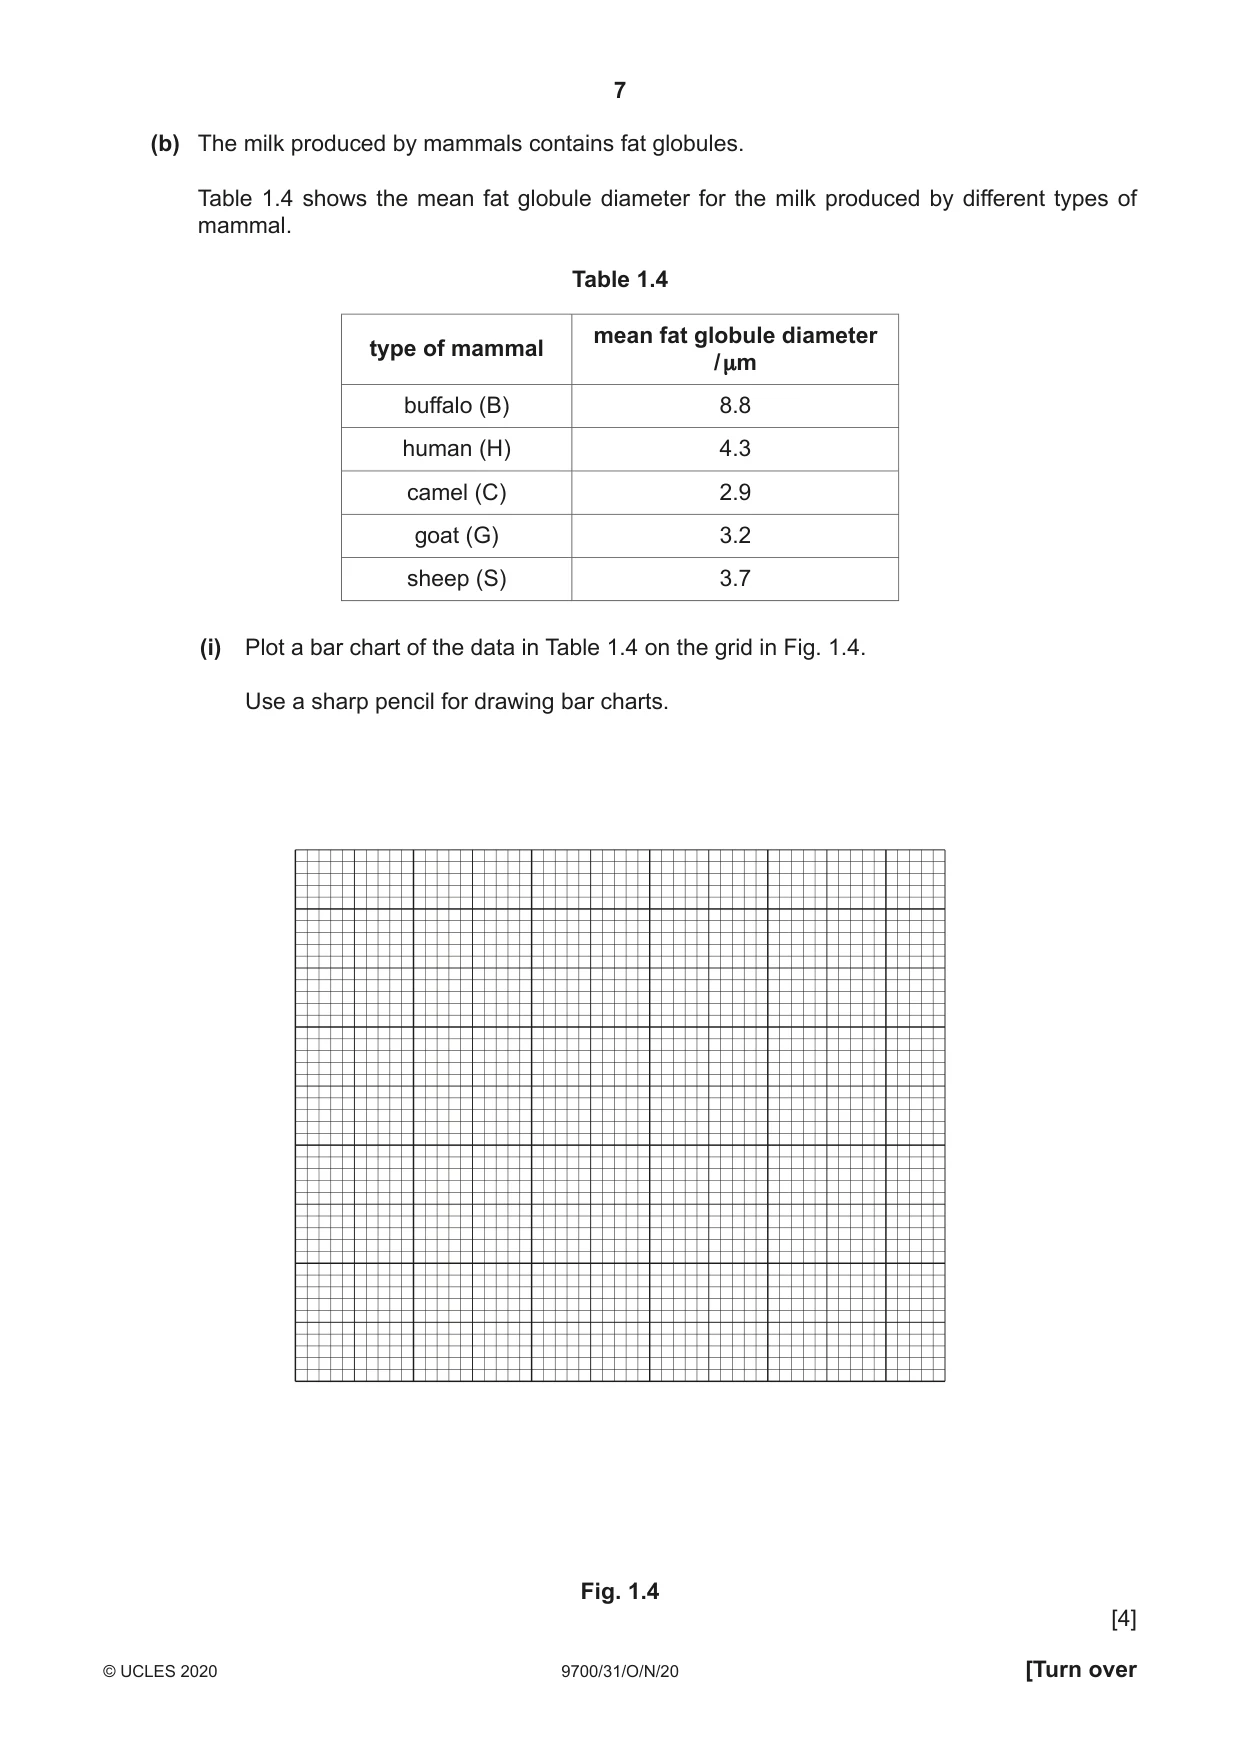
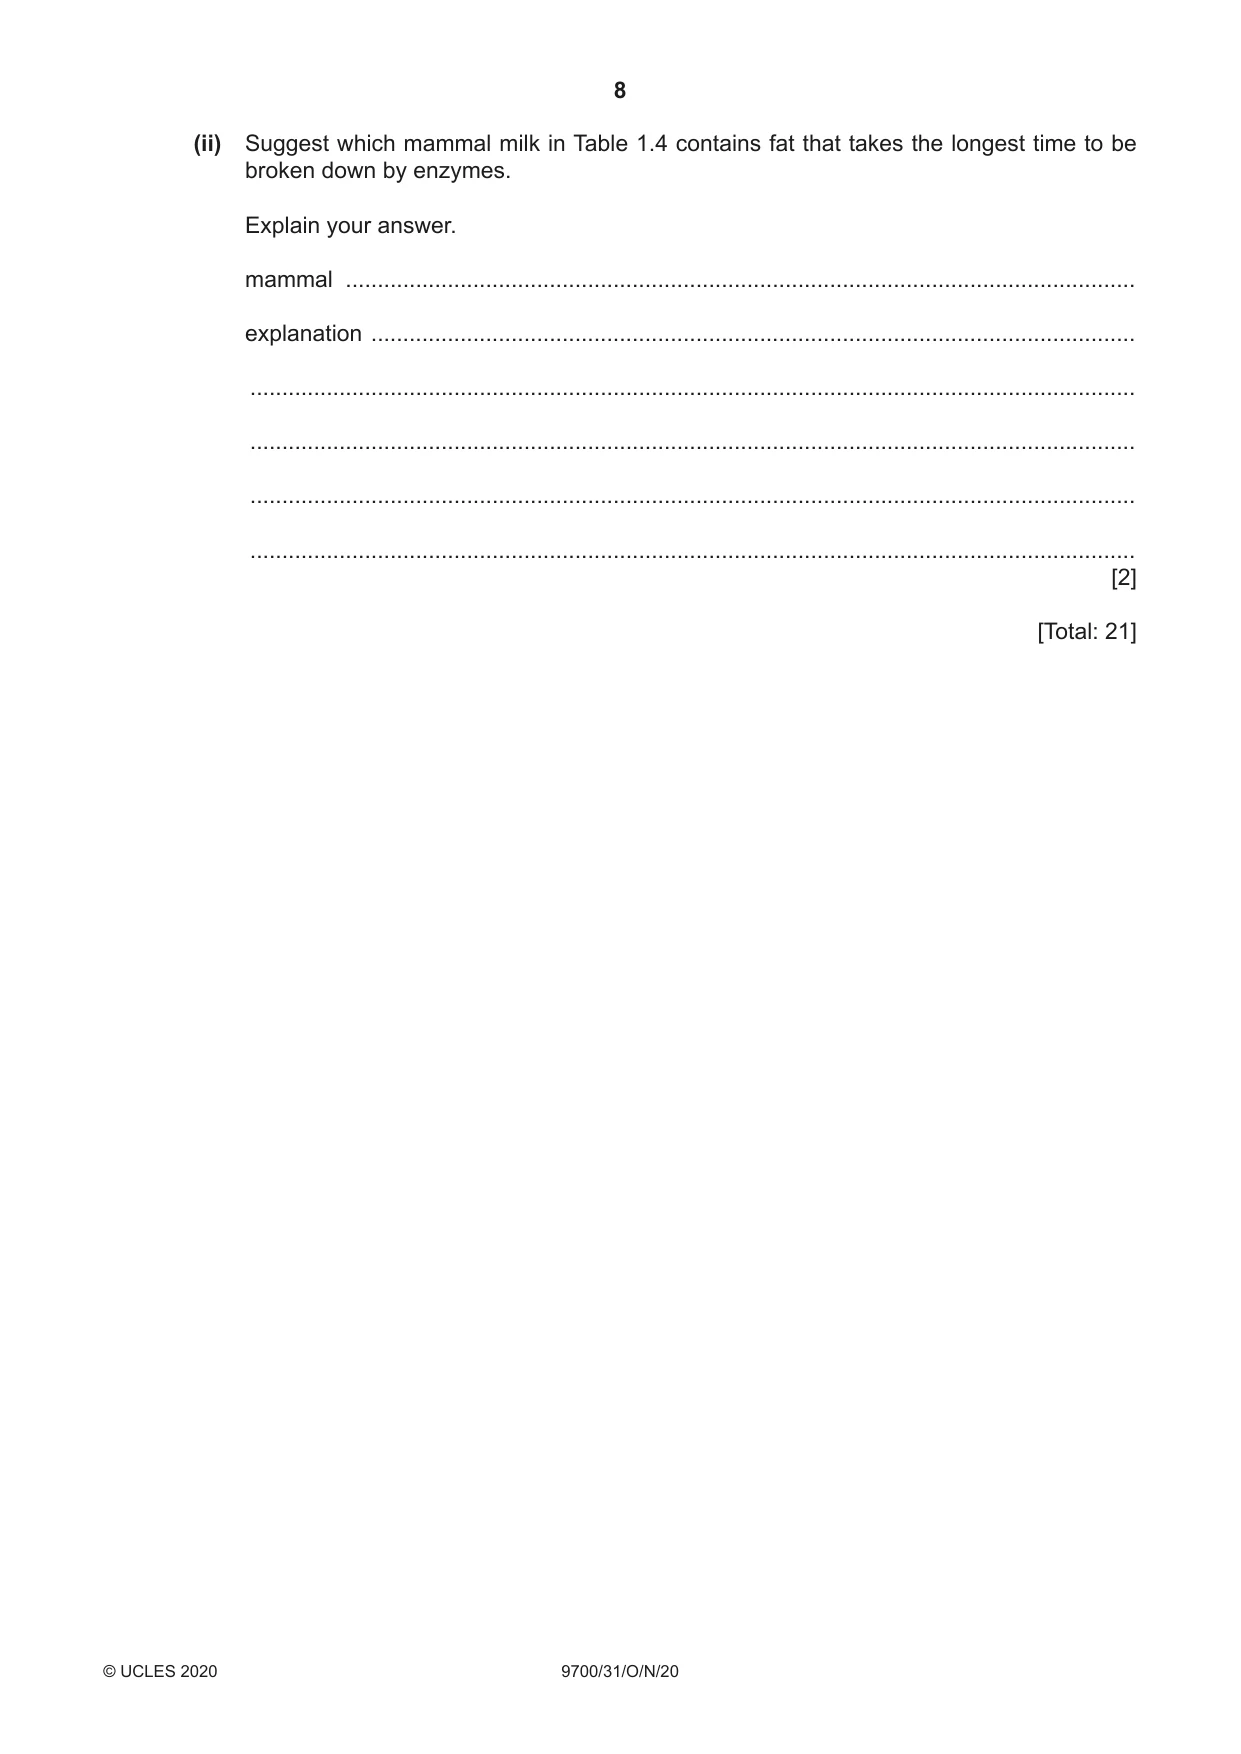
1 Milk contains nutrients, including proteins, fats, carbohydrates, vitamins and minerals, that are essential for growth and development of young mammals. When milk, M, is dropped into a test-tube containing copper sulfate solution, CS, the drop of milk sinks to the bottom of the test-tube. The rate at which the drop of milk sinks depends on the concentration of the milk. You are provided with the materials shown in Table 1.1. Table 1.1 volume labelled contents hazard / cm3 CS copper sulfate solution irritant 200 M 100% milk none 50 W distilled water none 30 U milk sample of unknown concentration none 10 If CS comes into contact with your skin, wash off immediately under cold water. It is recommended that you wear suitable eye protection. Carry out step 1 to step 3 to practise releasing one drop of M from a syringe. 1. Put 2 cm3 of M into the syringe labelled M. 2. Hold the syringe containing M over an empty test-tube, as shown in Fig. 1.1. Push the plunger slowly to release one drop. 3. Repeat step 2 until you can release one drop at a time. push plunger slowly one drop released syringe containing milk, M test-tube Fig. 1.1 You will investigate the effect of changing the concentration of milk on the time taken for one drop of milk to sink through copper sulfate solution. You will need to: • prepare different concentrations of milk • record the time taken for one drop of each concentration of milk to sink through copper sulfate solution, CS • use your results to estimate the concentration of milk sample, U. (a) You will need to use proportional dilution to make different concentrations of milk, M, between 90% and 50%. You will need to prepare 10 cm3 of each concentration, using M and W. Table 1.2 shows how to make up two of the concentrations of milk you will use. Decide which other concentrations of milk you will use. (i) Complete Table 1.2 to show how you will prepare the concentrations of milk you will use. Table 1.2 percentage volume of M volume of W concentration of milk / cm3 / cm3 90.0 9.0 1.0 50.0 5.0 5.0 [2] Carry out step 4 to step 14. 4. Prepare the concentrations of milk, as shown in Table 1.2, in the beakers provided. 5. Draw a line 2 cm from the top of a clean, dry test-tube, as shown in Fig. 1.2. 2 cm line drawn 2 cm from top of test-tube CS filled to line Fig. 1.2 6. Put CS into this test-tube up to the mark, as shown in Fig. 1.2. 7. Stir the 90% concentration of milk. 8. Put 2 cm3 of the 90% milk into the syringe labelled M. 9. Put one drop of 90% milk into the test-tube containing CS, as shown in Fig. 1.3. Start timing. one drop released syringe containing milk, M CS filled to line test-tube Fig. 1.3 10. Stop timing when the drop reaches the bottom of the test-tube. If the drop has not reached the bottom of the test-tube after 120 seconds, stop timing and record ‘more than 120’. 11. Record your result in (a)(ii). 12. Repeat step 9 to step 11 two more times, with 90% milk. This will give you three results for 90% milk. 13. Empty the contents of the test-tube into the container labelled For waste. 14. Repeat step 6 to step 13 for the other concentrations of milk you have prepared. (ii) Record your results in an appropriate table, including raw results and processed (mean) results. [5] (iii) Describe the trend in your results. ........................................................................................................................................... ........................................................................................................................................... ..................................................................................................................................... [1] You are provided with a sample of milk labelled U. 15. Repeat step 6 to step 10 using U. 16. Record your result for U in (a)(iv). (iv) Record the time taken for the drop of U to reach the bottom of the test-tube. result for U = ............................................................... [1] (v) Using your results in (a)(ii) and (a)(iv) estimate the concentration of milk in U. U = ............................................................... [1] Table 1.3 describes two sources of error when measuring the dependent variable in this investigation. (vi) Complete Table 1.3 by: • describing, for each error, an improvement to the procedure that reduces the effect of the error • describing a third error and the improvement you would make to reduce its effect. Table 1.3 error improvement 1. Milk sometimes stays at the top of CS and may interfere with the movement of the next drop. 2. The drop sometimes sticks to the side of the test-tube and changes the time taken for the drop to reach the bottom. 3. ................................................ ................................................ ................................................ ................................................ [4] (vii) Error 2 in Table 1.3 states that ‘the drop sometimes sticks to the side of the test-tube and changes the time taken for the drop to reach the bottom.’ State whether error 2 is a random error or a systematic error. Give a reason for your answer. type of error ....................................................................................................................... reason ............................................................................................................................... ........................................................................................................................................... [1] (b) The milk produced by mammals contains fat globules. Table 1.4 shows the mean fat globule diameter for the milk produced by different types of mammal. Table 1.4 mean fat globule diameter type of mammal / µm buffalo (B) 8.8 human (H) 4.3 camel (C) 2.9 goat (G) 3.2 sheep (S) 3.7 (i) Plot a bar chart of the data in Table 1.4 on the grid in Fig. 1.4. Use a sharp pencil for drawing bar charts. Fig. 1.4 [4] (ii) Suggest which mammal milk in Table 1.4 contains fat that takes the longest time to be broken down by enzymes. Explain your answer. mammal ............................................................................................................................ explanation ........................................................................................................................ ........................................................................................................................................... ........................................................................................................................................... ........................................................................................................................................... ........................................................................................................................................... [2] [Total: 21] Question 2 starts on page 10
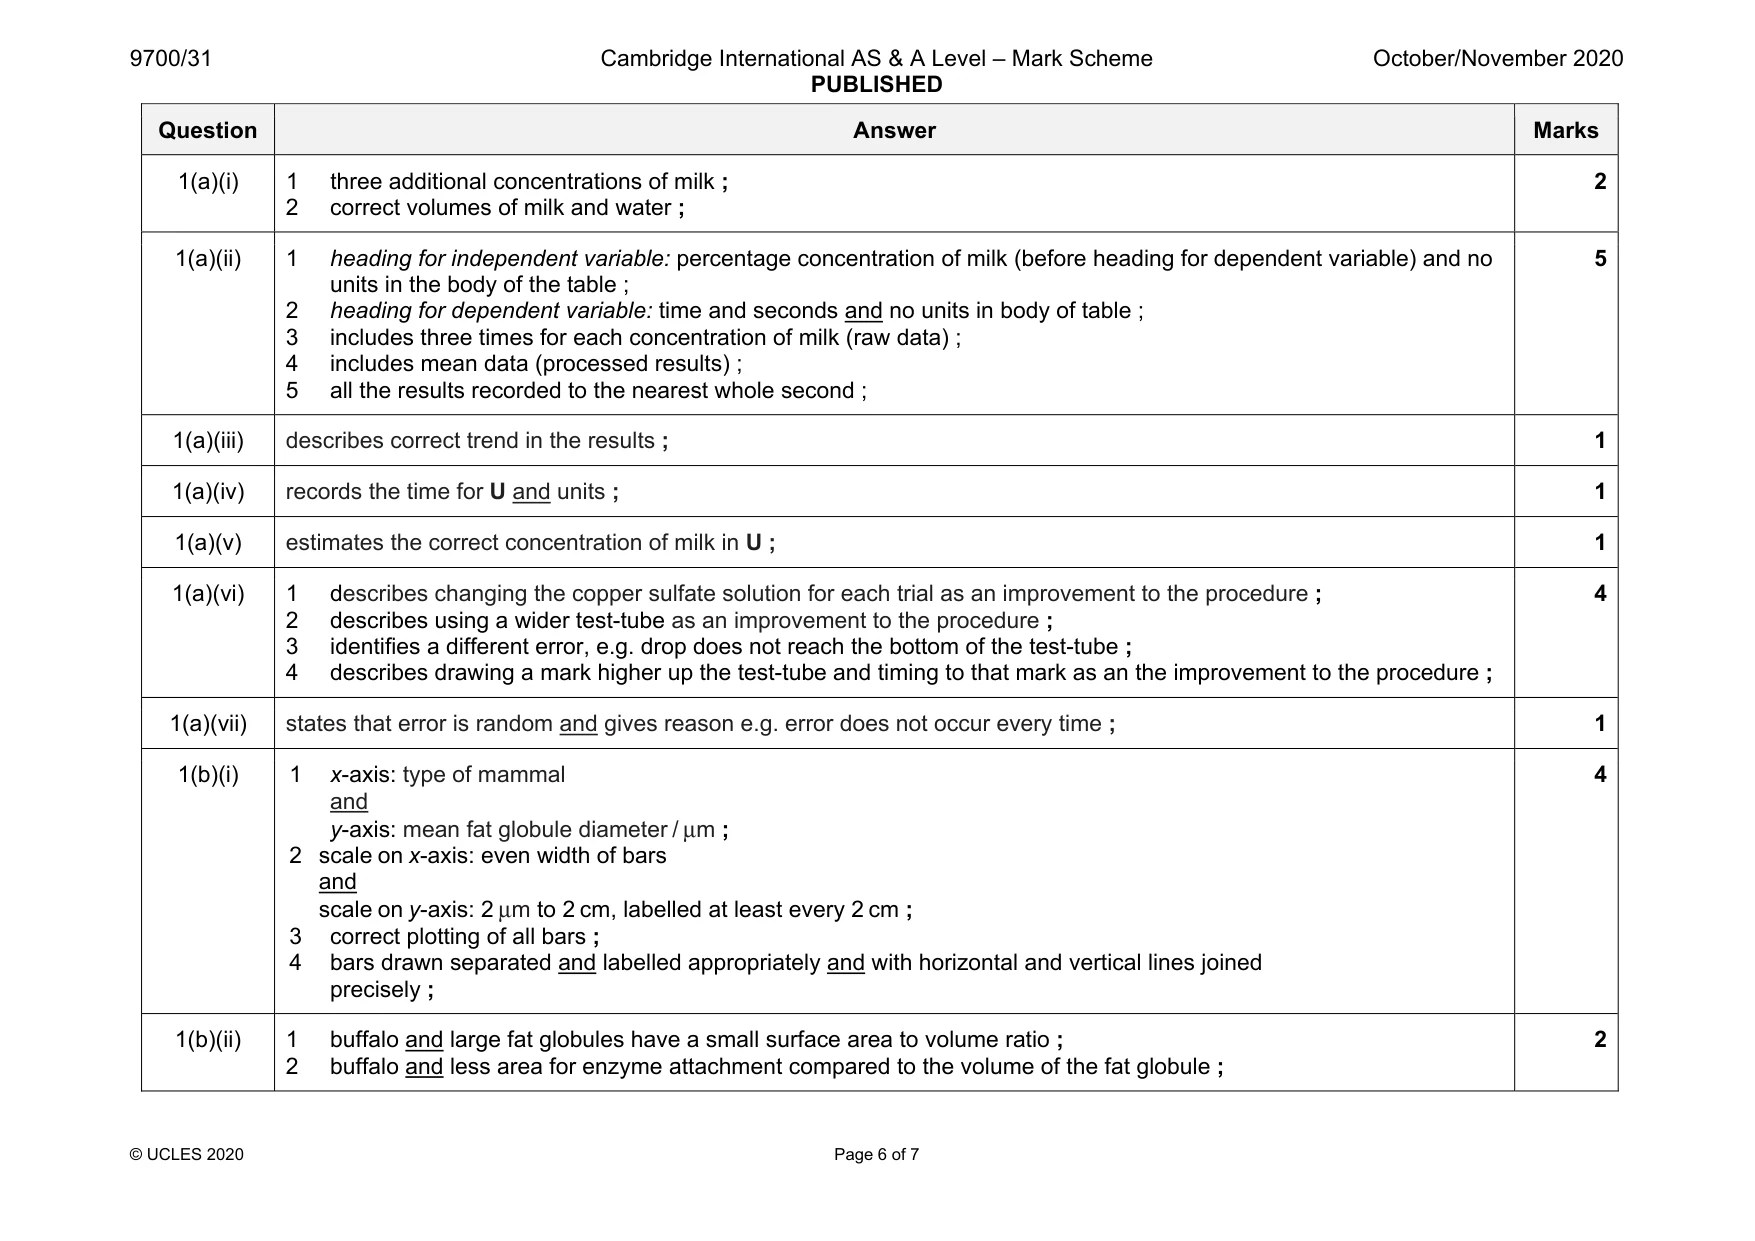
Mark scheme: 1(a)(i) 1 three additional concentrations of milk ; 2 correct volumes of milk and water ; 2 1(a)(ii) 1 heading for independent variable: percentage concentration of milk (before heading for dependent variable) and no units in the body of the table ; 2 heading for dependent variable: time and seconds and no units in body of table ; 3 includes three times for each concentration of milk (raw data) ; 4 includes mean data (processed results) ; 5 all the results recorded to the nearest whole second ; 5 1(a)(iii) describes correct trend in the results ; 1 1(a)(iv) records the time for U and units ; 1 1(a)(v) estimates the correct concentration of milk in U ; 1 1(a)(vi) 1 describes changing the copper sulfate solution for each trial as an improvement to the procedure ; 2 describes using a wider test-tube as an improvement to the procedure ; 3 identifies a different error, e.g. drop does not reach the bottom of the test-tube ; 4 describes drawing a mark higher up the test-tube and timing to that mark as an the improvement to the procedure ; 4 1(a)(vii) states that error is random and gives reason e.g. error does not occur every time ; 1 1(b)(i) 1 x-axis: type of mammal and y-axis: mean fat globule diameter / μm ; 2 scale on x-axis: even width of bars and scale on y-axis: 2 μm to 2 cm, labelled at least every 2 cm ; 3 correct plotting of all bars ; 4 bars drawn separated and labelled appropriately and with horizontal and vertical lines joined precisely ; 4 1(b)(ii) 1 buffalo and large fat globules have a small surface area to volume ratio ; 2 buffalo and less area for enzyme attachment compared to the volume of the fat globule ; 2
Q2 · A photomicrograph of a stained transverse section through a plant root
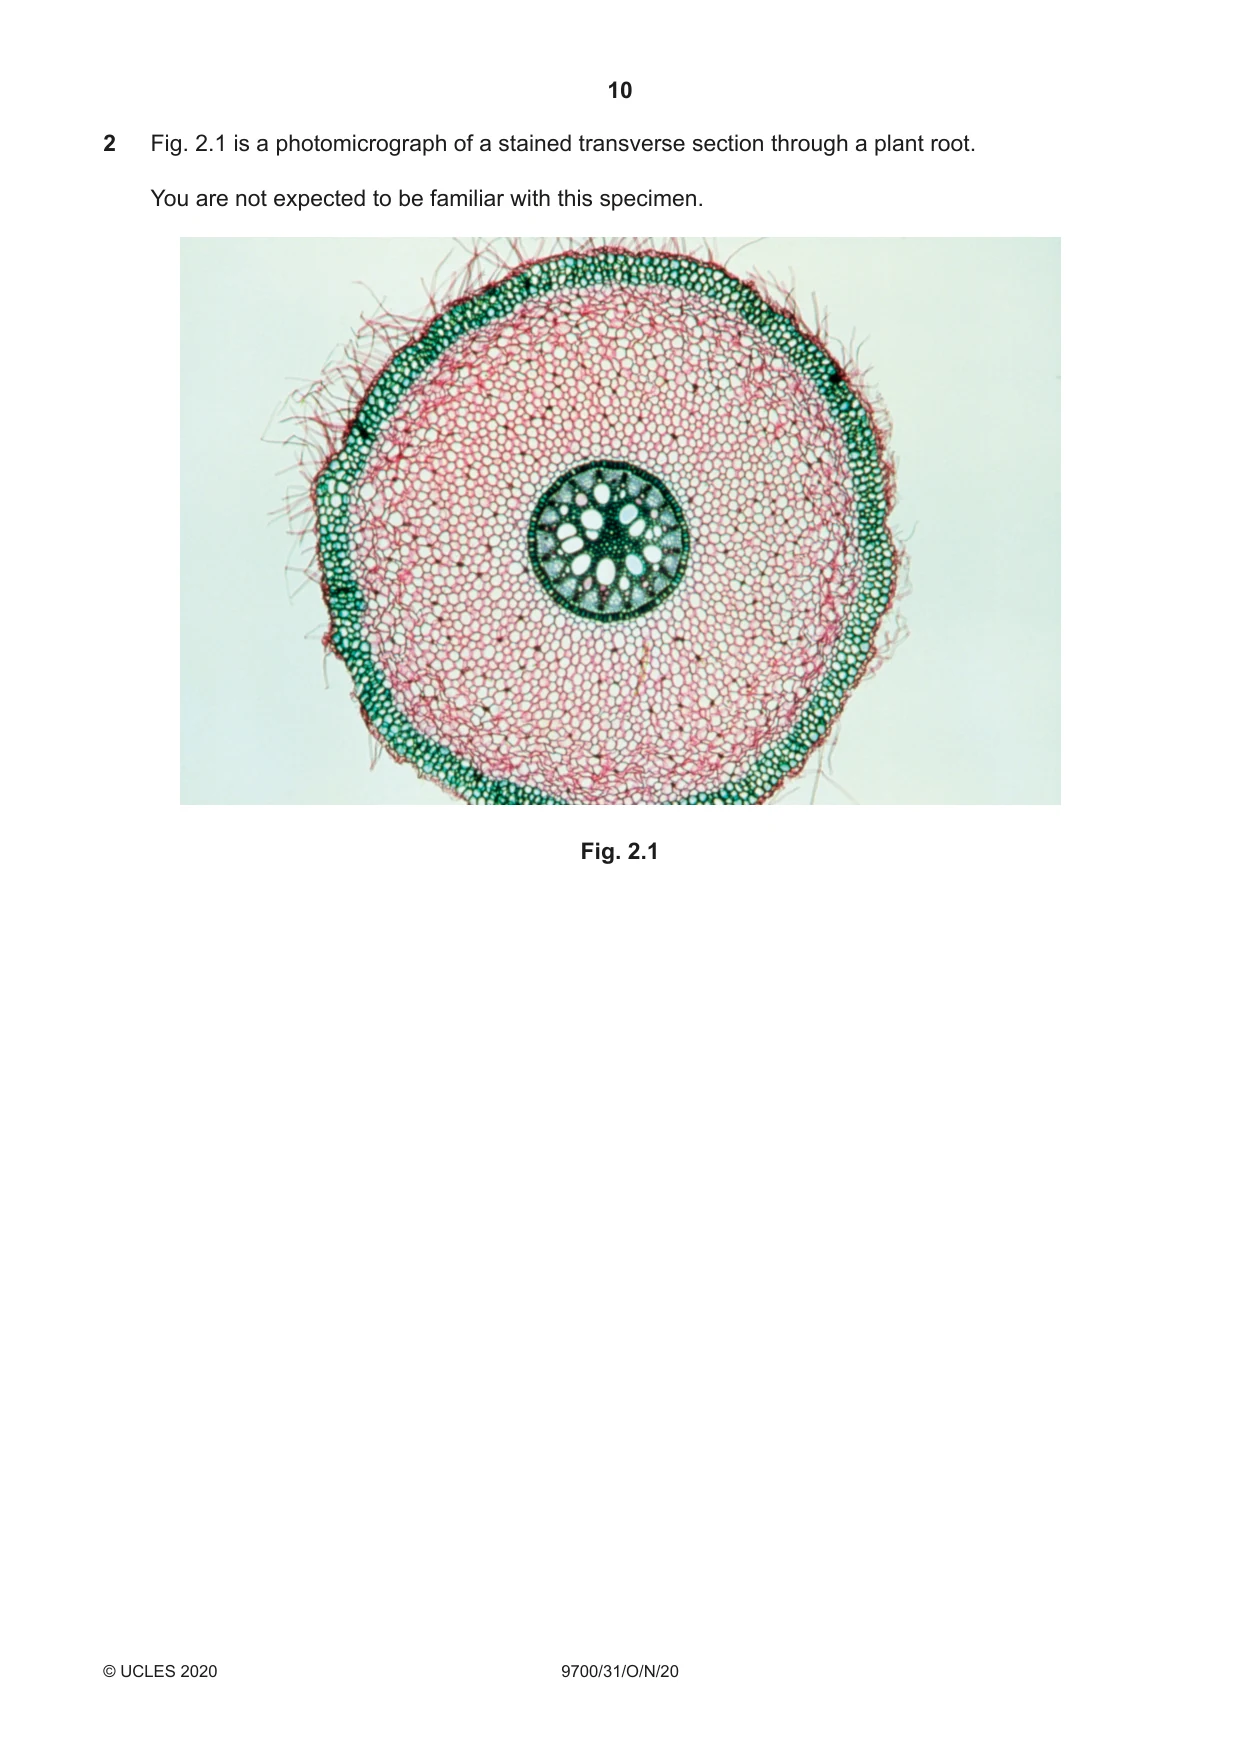
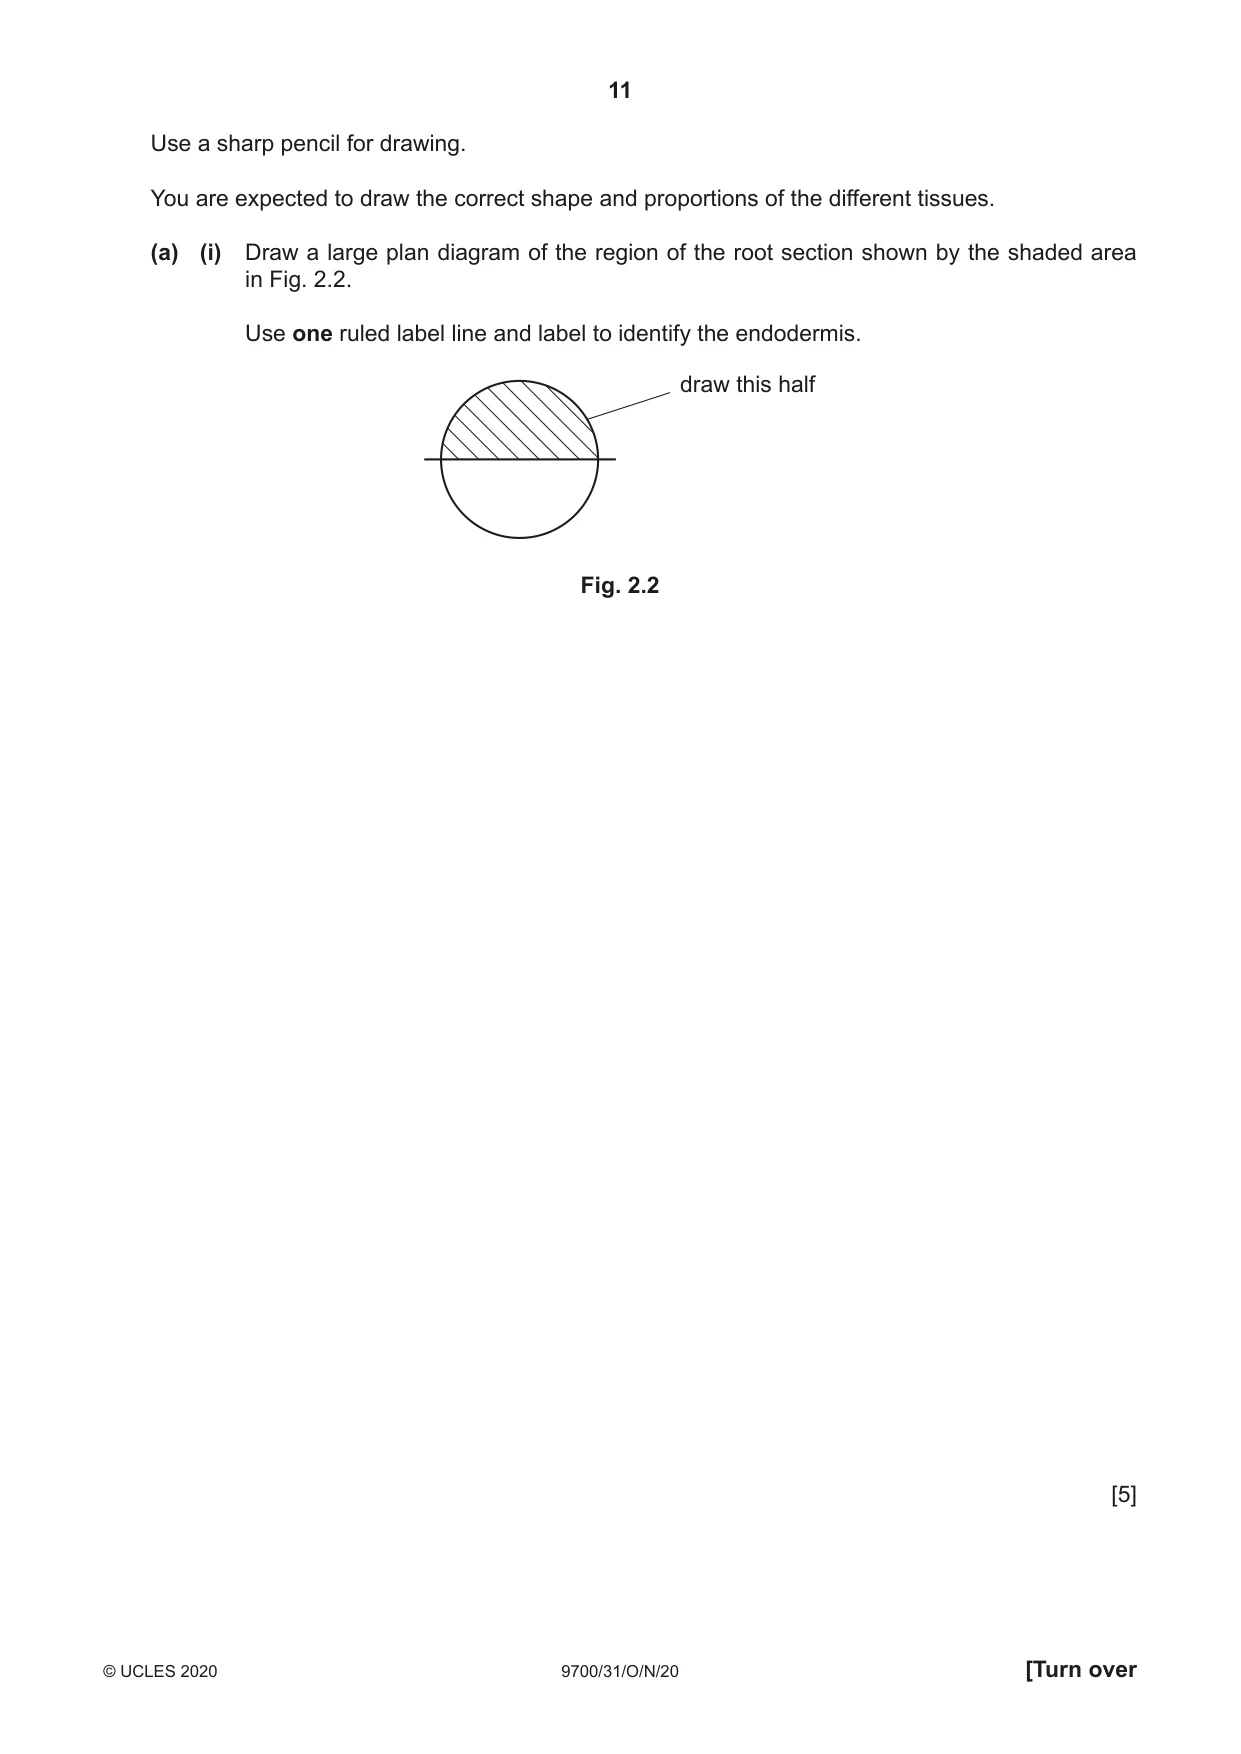
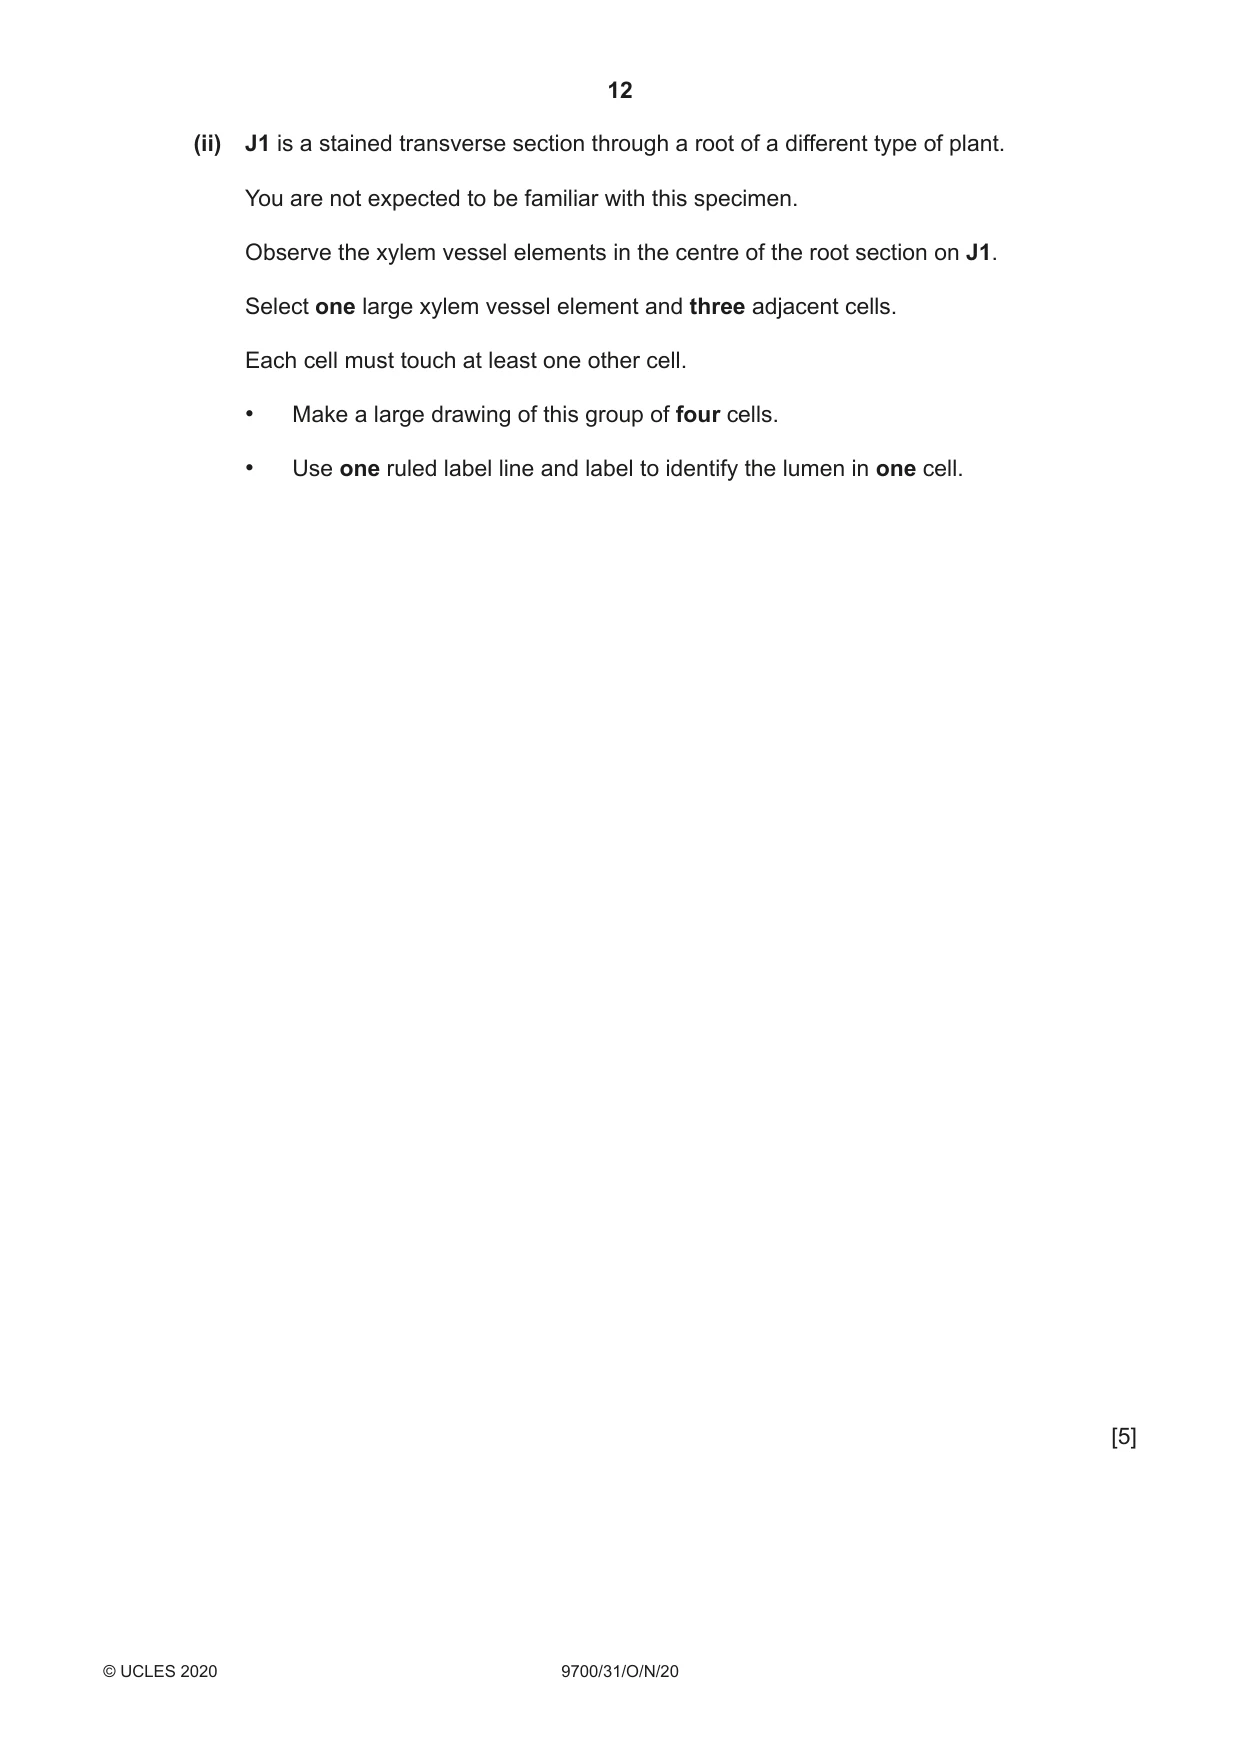
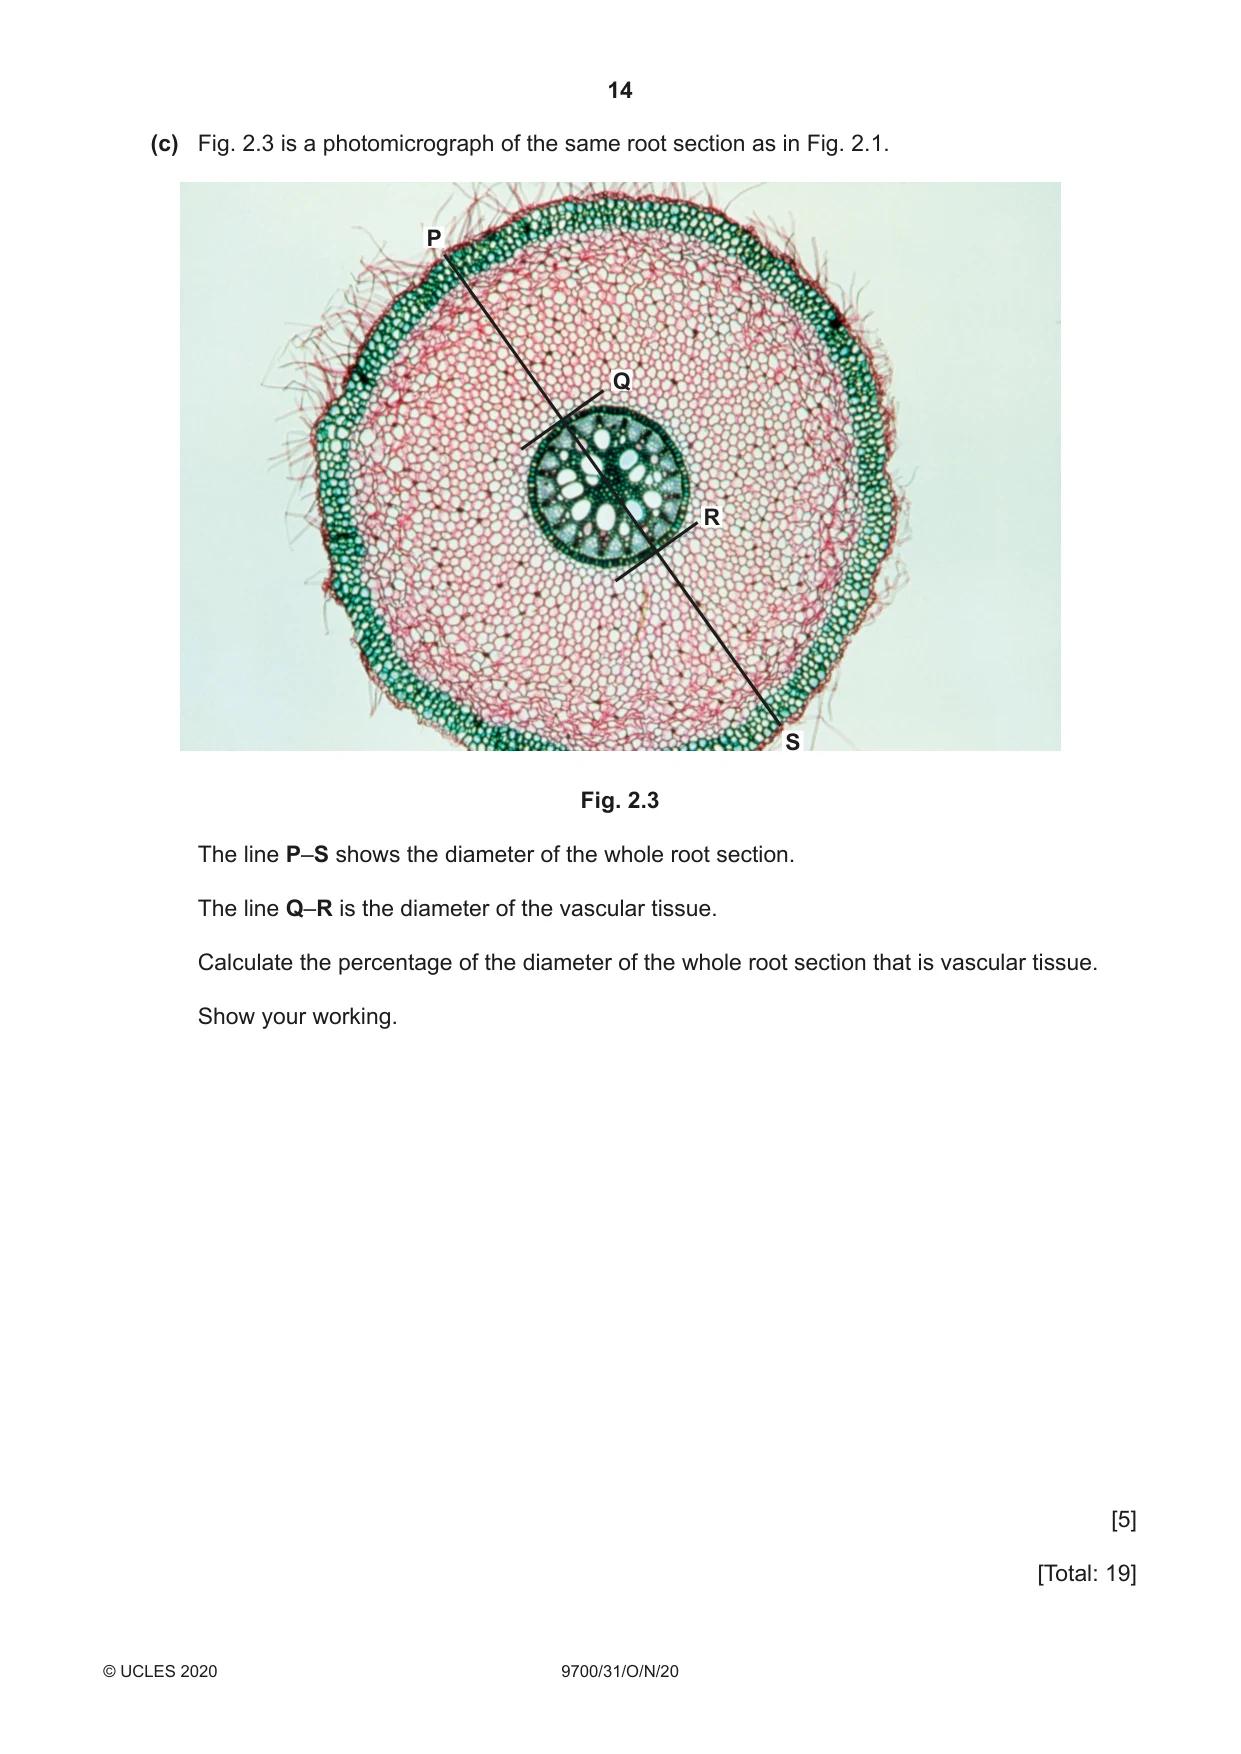
2 Fig. 2.1 is a photomicrograph of a stained transverse section through a plant root. You are not expected to be familiar with this specimen. Fig. 2.1 Use a sharp pencil for drawing. You are expected to draw the correct shape and proportions of the different tissues. (a) (i) Draw a large plan diagram of the region of the root section shown by the shaded area in Fig. 2.2. Use one ruled label line and label to identify the endodermis. draw this half Fig. 2.2 [5] (ii) J1 is a stained transverse section through a root of a different type of plant. You are not expected to be familiar with this specimen. Observe the xylem vessel elements in the centre of the root section on J1. Select one large xylem vessel element and three adjacent cells. Each cell must touch at least one other cell. • Make a large drawing of this group of four cells. • Use one ruled label line and label to identify the lumen in one cell. [5]
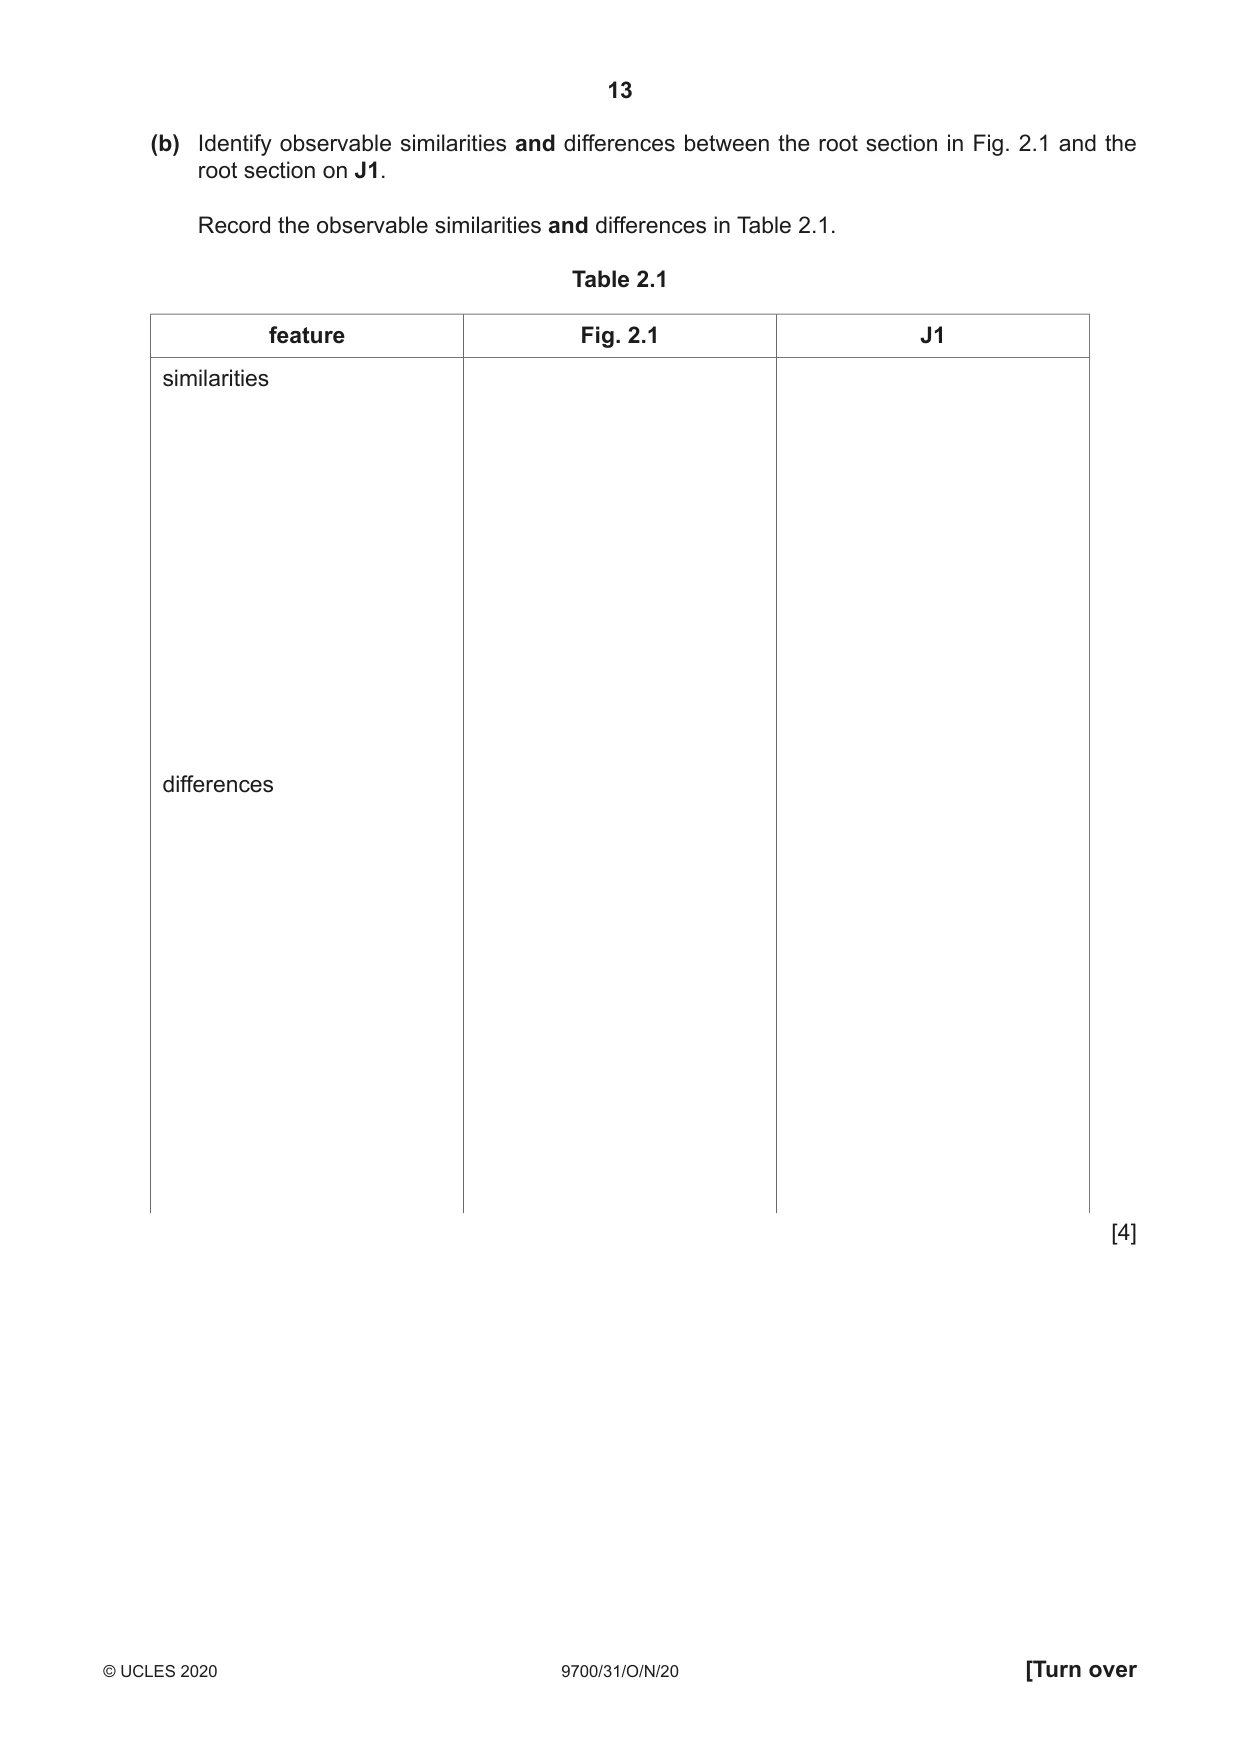
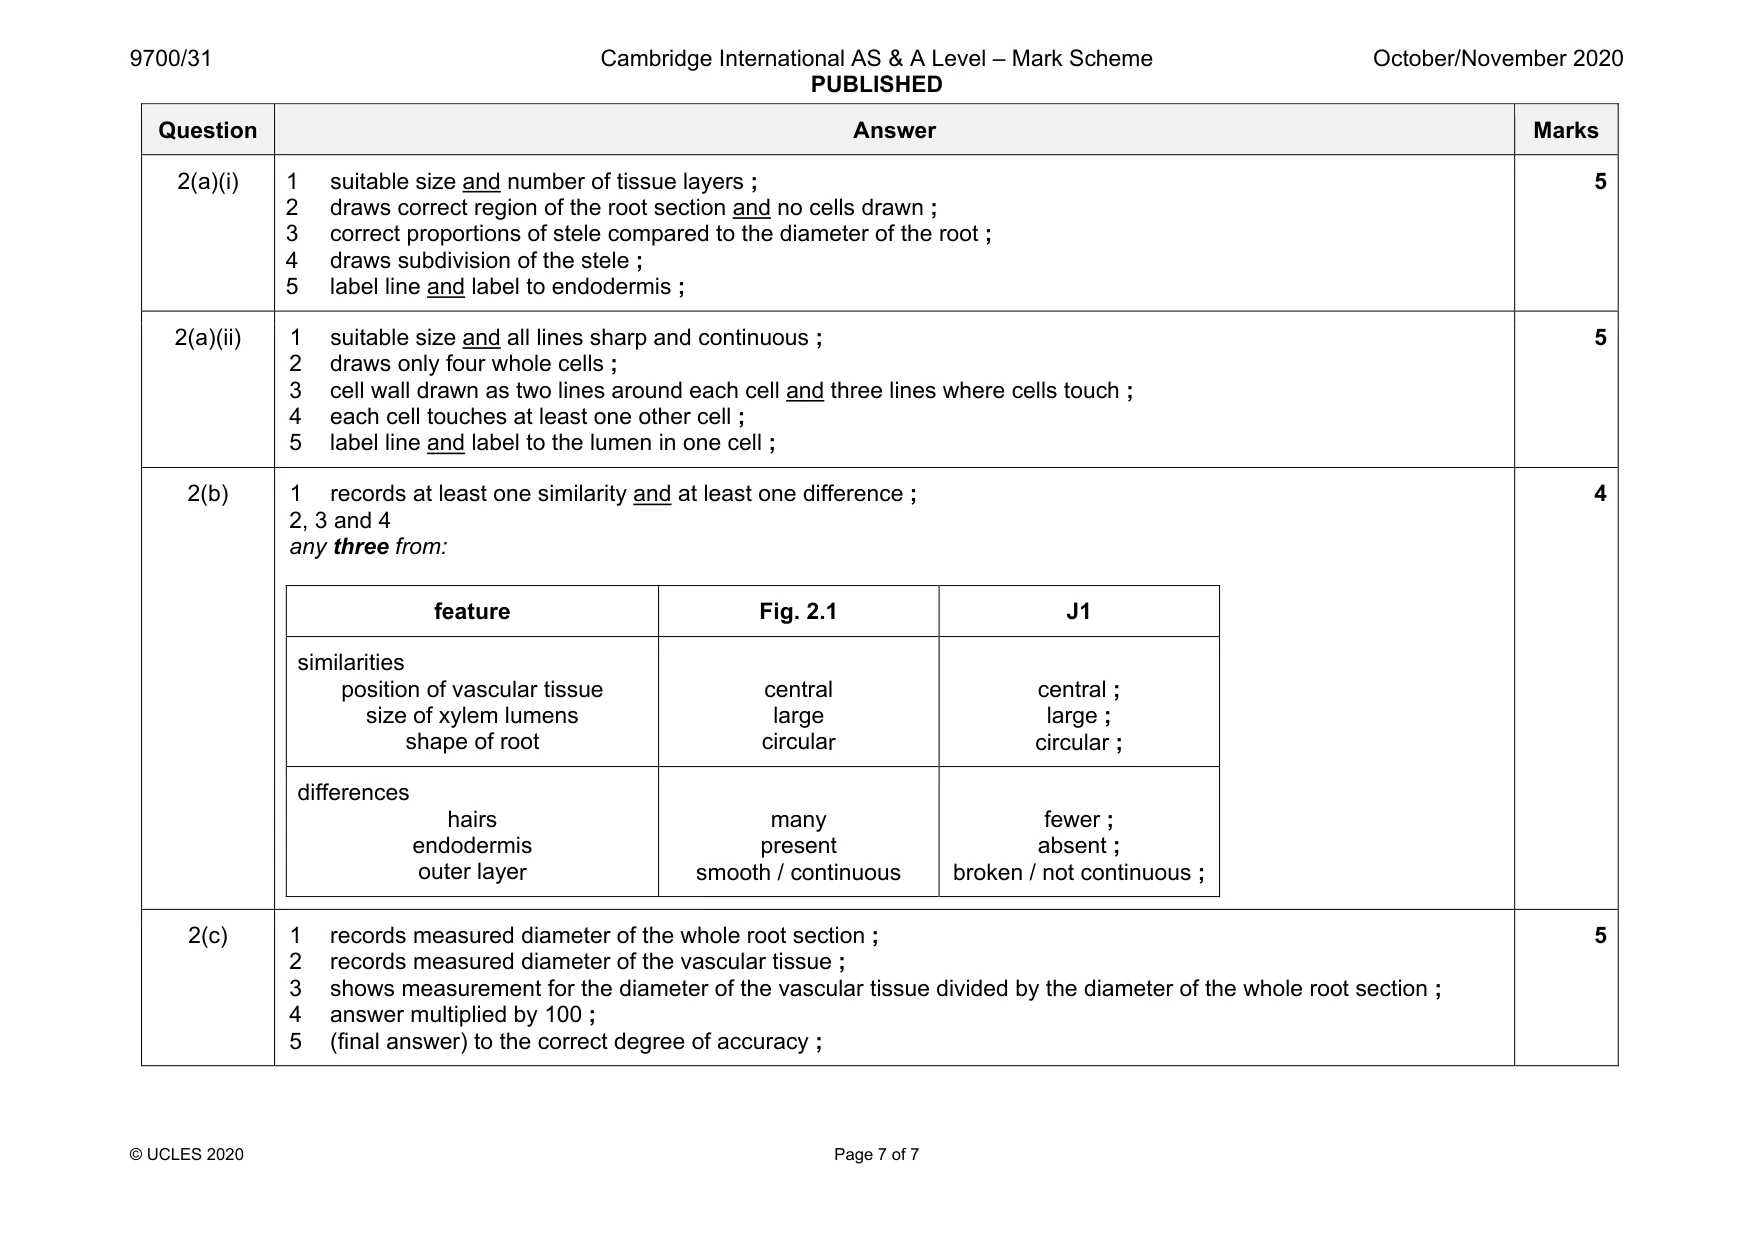
Mark scheme: 2(a)(i) 1 suitable size and number of tissue layers ; 2 draws correct region of the root section and no cells drawn ; 3 correct proportions of stele compared to the diameter of the root ; 4 draws subdivision of the stele ; 5 label line and label to endodermis ; 5 2(a)(ii) 1 suitable size and all lines sharp and continuous ; 2 draws only four whole cells ; 3 cell wall drawn as two lines around each cell and three lines where cells touch ; 4 each cell touches at least one other cell ; 5 label line and label to the lumen in one cell ; 5 2(b) 1 records at least one similarity and at least one difference ; 2, 3 and 4 any three from: feature Fig. 2.1 J1 similarities position of vascular tissue size of xylem lumens shape of root central large circular central ; large ; circular ; differences hairs endodermis outer layer many present smooth / continuous fewer ; absent ; broken / not continuous ; 4 2(c) 1 records measured diameter of the whole root section ; 2 records measured diameter of the vascular tissue ; 3 shows measurement for the diameter of the vascular tissue divided by the diameter of the whole root section ; 4 answer multiplied by 100 ; 5 (final answer) to the correct degree of accuracy ; 5
What was in this paper
The subtopics covered by these 2 questions, and how many questions each got. Open one in a new tab to see every Cambridge question on it.
What you needed in this session
Cambridge’s own grade thresholds for 2020 Oct/Nov, Paper 3 · Variant 1. A higher threshold means an easier paper — the bar moves with how the cohort did.