Cambridge A Level Biology 9700 — 2020 May/June Paper 5 · Variant 1
9700/51/M/J/20 · 2 questions · 25 marks · ≈28 min
The question paper and its mark scheme, free to read here and free to download. This is Cambridge’s own paper, exactly as it was sat.
Question paper12 pages


Mark scheme9 pages
Answers below. Sit the paper first if you are practising.
Questions as text
Q1 · Chlorella is a green, single-celled protoctist that is photosynthetic
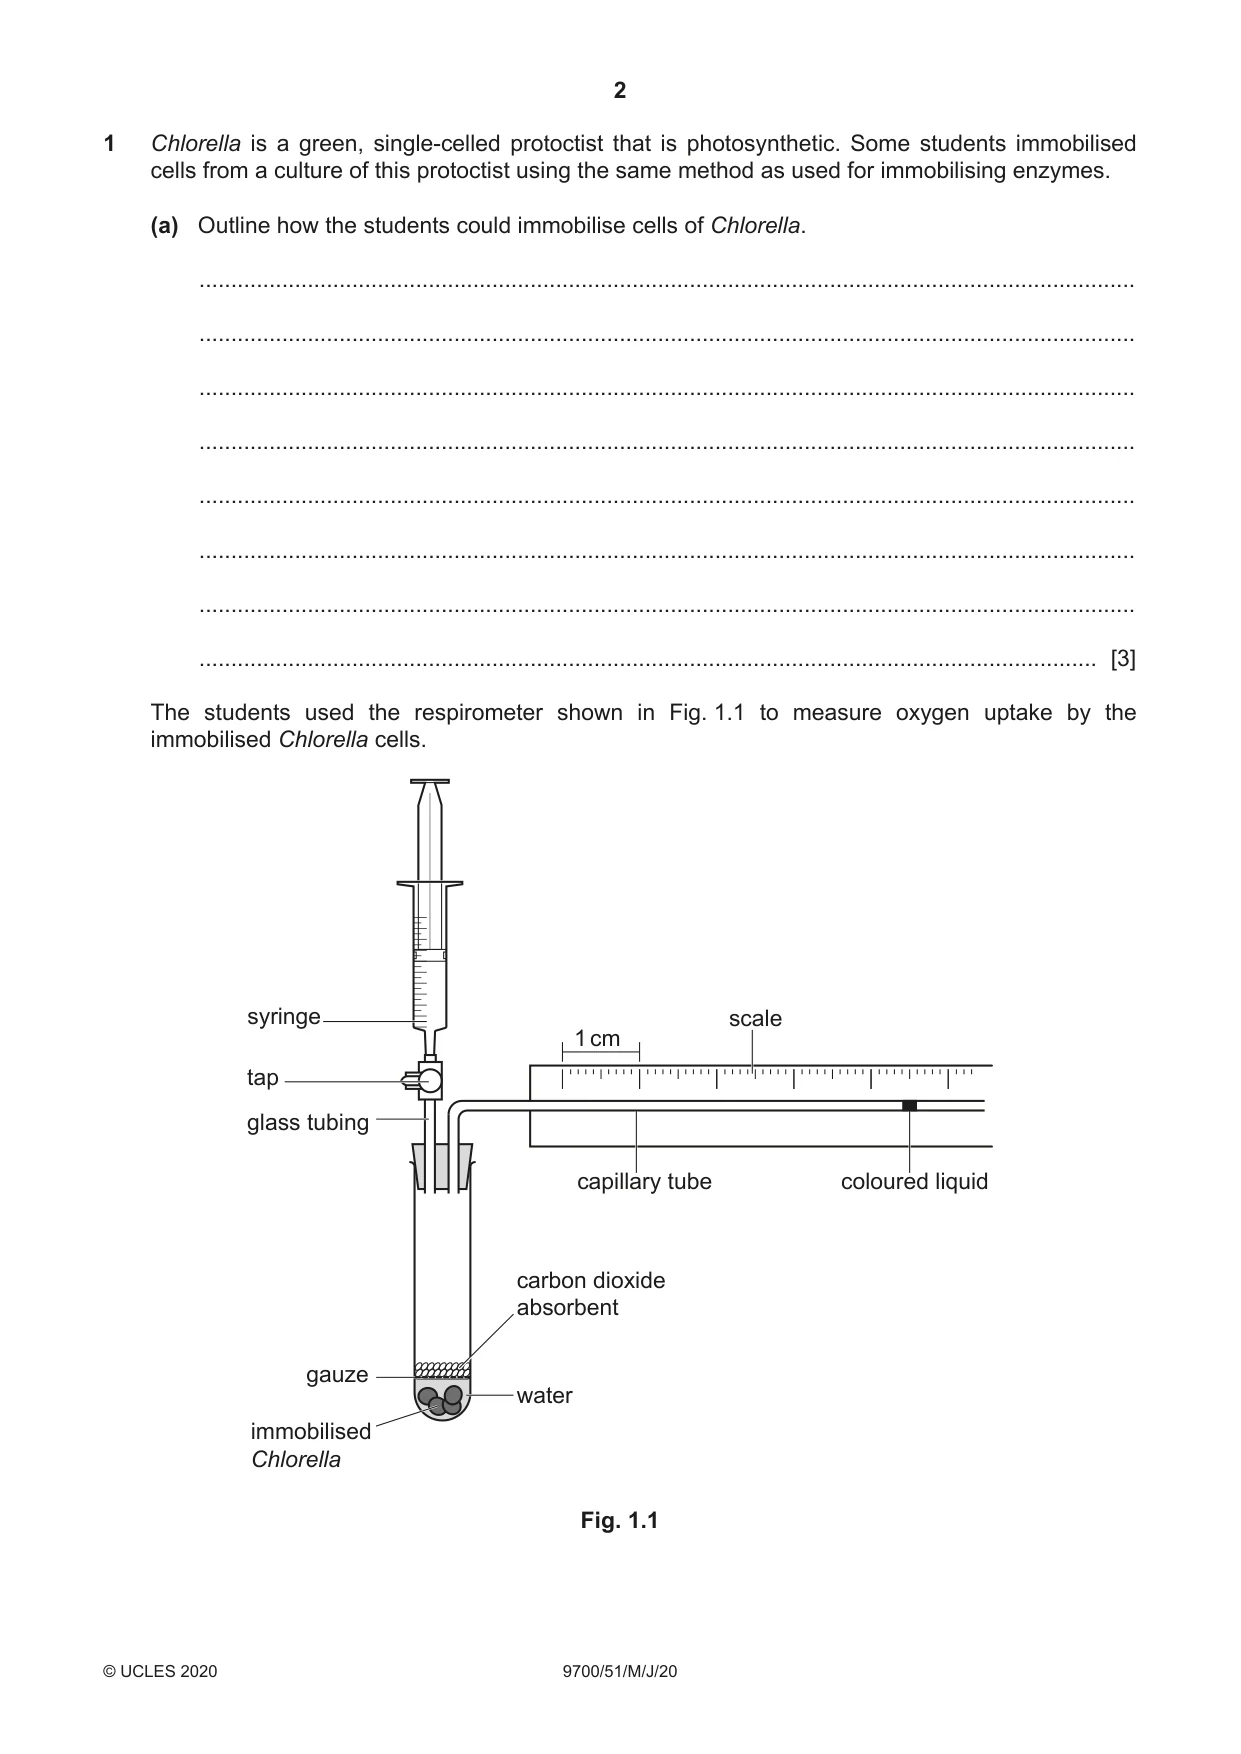
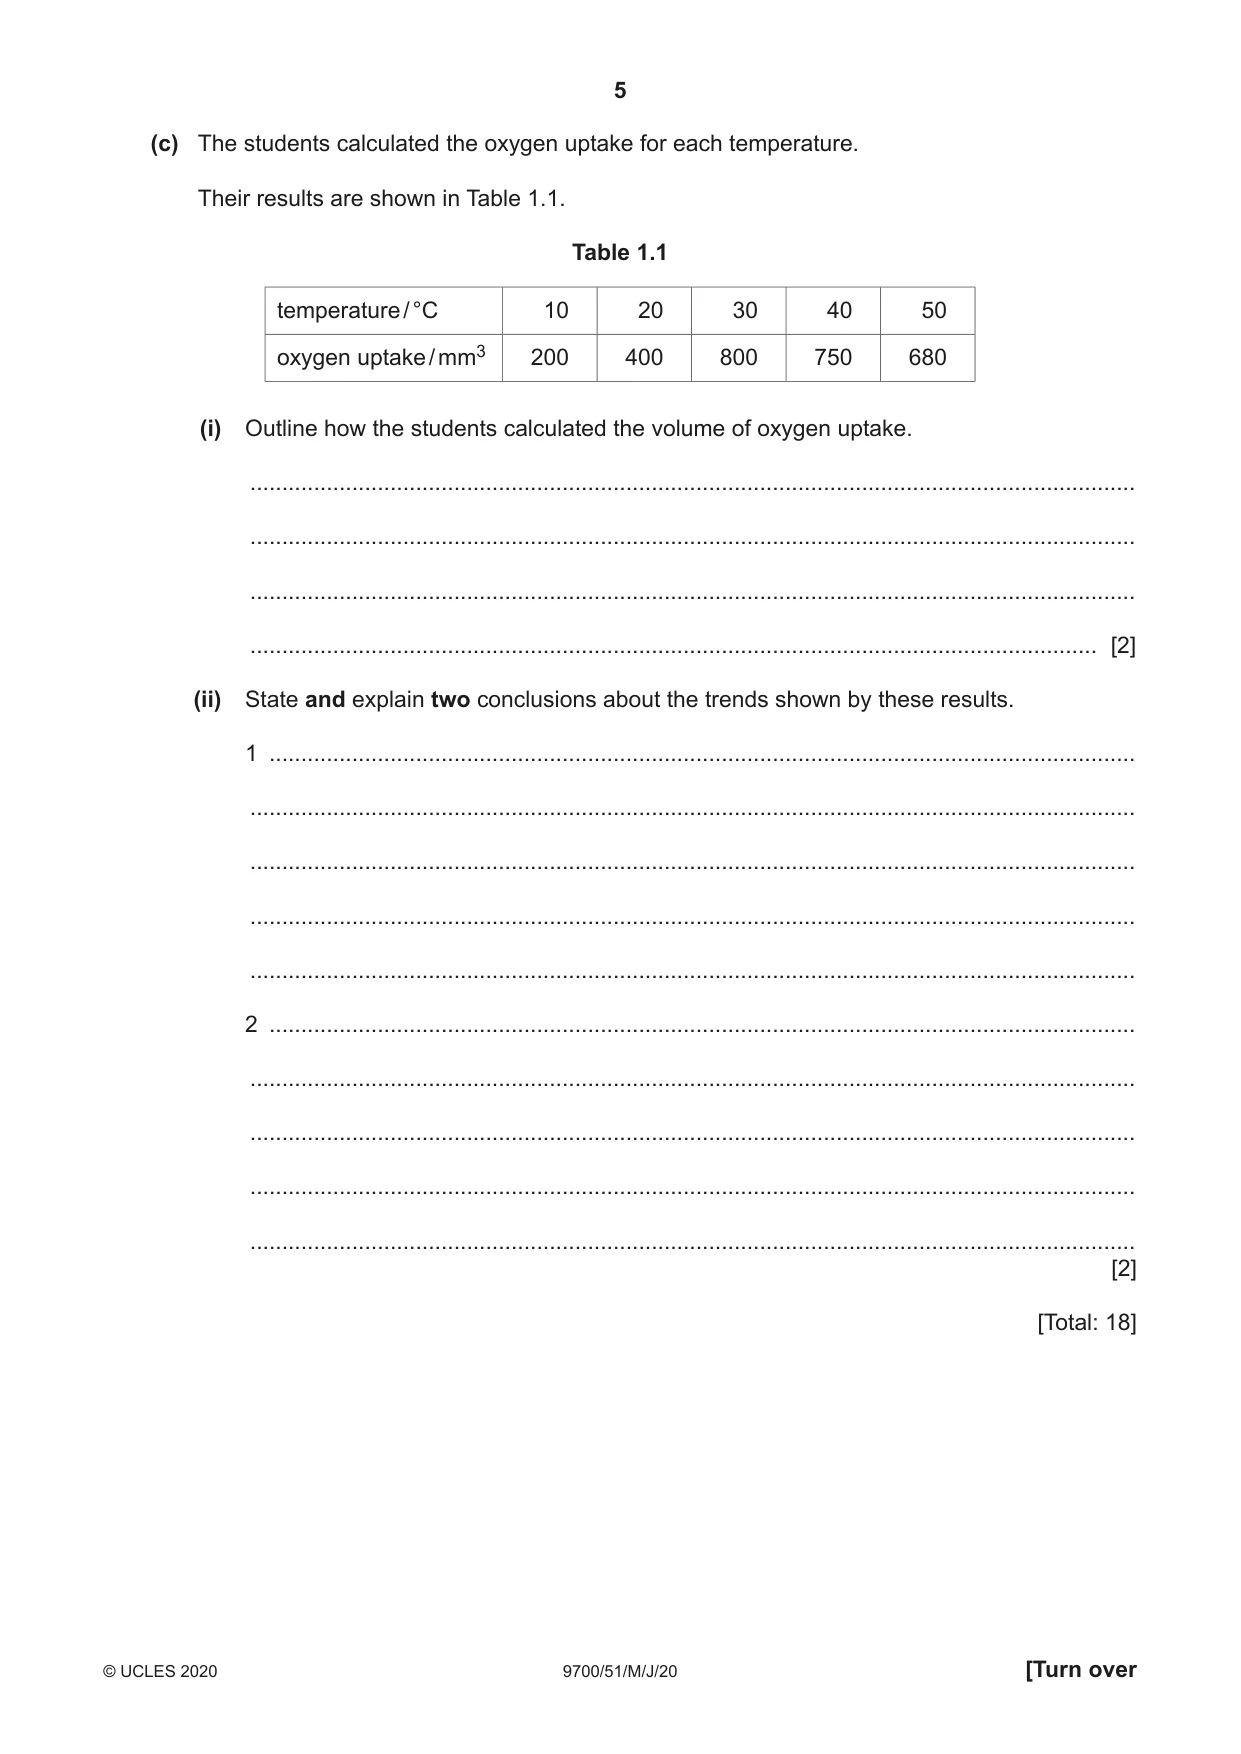
1 Chlorella is a green, single-celled protoctist that is photosynthetic. Some students immobilised cells from a culture of this protoctist using the same method as used for immobilising enzymes. (a) Outline how the students could immobilise cells of Chlorella. ................................................................................................................................................... ................................................................................................................................................... ................................................................................................................................................... ................................................................................................................................................... ................................................................................................................................................... ................................................................................................................................................... ................................................................................................................................................... ............................................................................................................................................. [3] The students used the respirometer shown in Fig. 1.1 to measure oxygen uptake by the immobilised Chlorella cells. syringe scale 1 cm tap glass tubing capillary tube coloured liquid carbon dioxide absorbent gauze water immobilised Chlorella Fig. 1.1 The students used the respirometer to test the hypothesis: The volume of oxygen taken up by respiration in immobilised Chlorella increases with an increase in temperature. (b) (i) State the independent variable and the dependent variable in this investigation. independent variable ......................................................................................................... ........................................................................................................................................... dependent variable ............................................................................................................ ........................................................................................................................................... [2] (ii) The students decided to measure oxygen uptake for 5 minutes using a range of temperatures from 10 °C to 50 °C. Discuss whether the range of temperatures used by the students was suitable for their investigation. ........................................................................................................................................... ........................................................................................................................................... ........................................................................................................................................... ........................................................................................................................................... ........................................................................................................................................... ........................................................................................................................................... ..................................................................................................................................... [2] (iii) Describe a method by which the students could set up the respirometer and use it to test their hypothesis: The volume of oxygen taken up by respiration in immobilised Chlorella increases with an increase in temperature. Your method should be set out in a logical order and be detailed enough to let another person follow it. Details of immobilising Chlorella are not required. ........................................................................................................................................... ........................................................................................................................................... ........................................................................................................................................... ........................................................................................................................................... ........................................................................................................................................... ........................................................................................................................................... ........................................................................................................................................... ........................................................................................................................................... ........................................................................................................................................... ........................................................................................................................................... ........................................................................................................................................... ........................................................................................................................................... ........................................................................................................................................... ........................................................................................................................................... ........................................................................................................................................... ........................................................................................................................................... ........................................................................................................................................... ........................................................................................................................................... ........................................................................................................................................... ........................................................................................................................................... ........................................................................................................................................... ........................................................................................................................................... ..................................................................................................................................... [7] (c) The students calculated the oxygen uptake for each temperature. Their results are shown in Table 1.1. Table 1.1 temperature / °C 10 20 30 40 50 oxygen uptake / mm3 200 400 800 750 680 (i) Outline how the students calculated the volume of oxygen uptake. ........................................................................................................................................... ........................................................................................................................................... ........................................................................................................................................... ..................................................................................................................................... [2] (ii) State and explain two conclusions about the trends shown by these results. 1 ........................................................................................................................................ ........................................................................................................................................... ........................................................................................................................................... ........................................................................................................................................... ........................................................................................................................................... 2 ........................................................................................................................................ ........................................................................................................................................... ........................................................................................................................................... ........................................................................................................................................... ........................................................................................................................................... [2] [Total: 18]
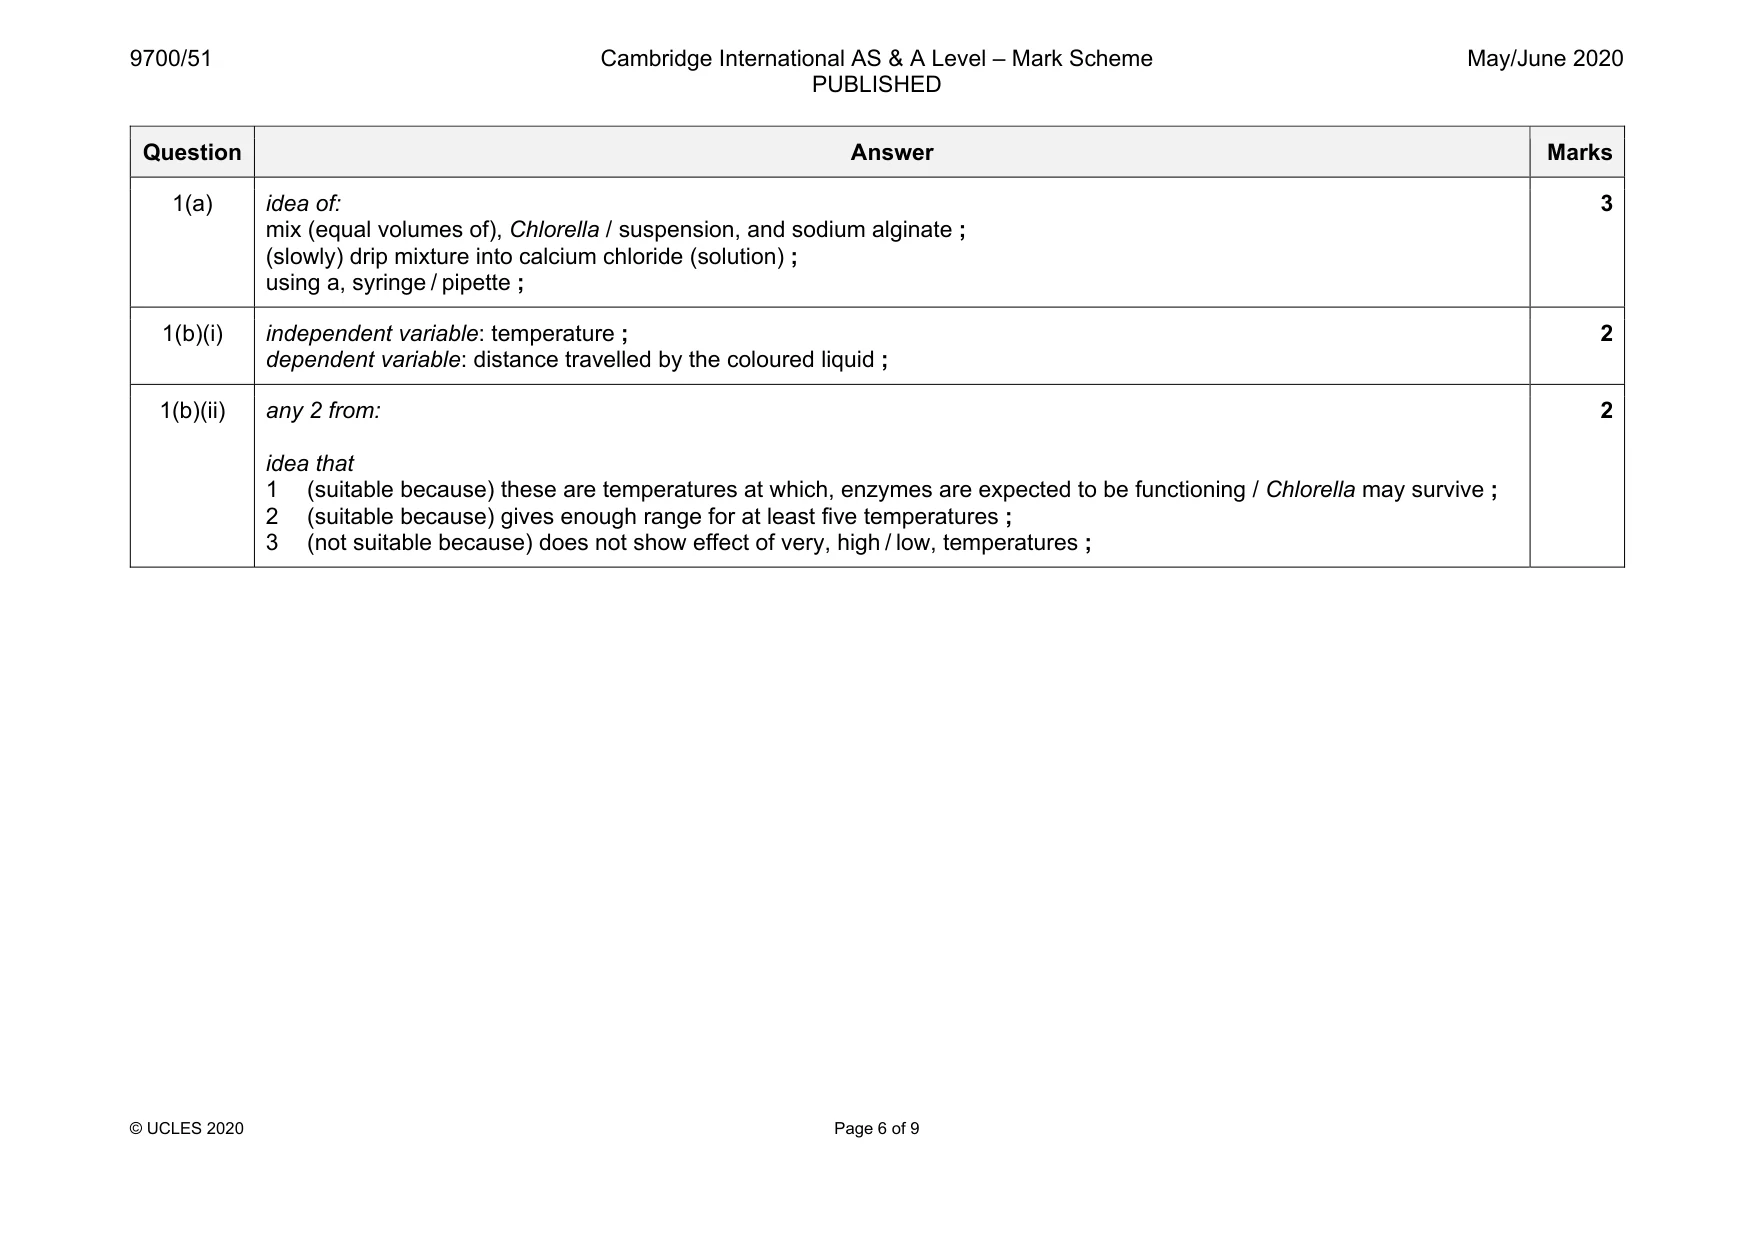
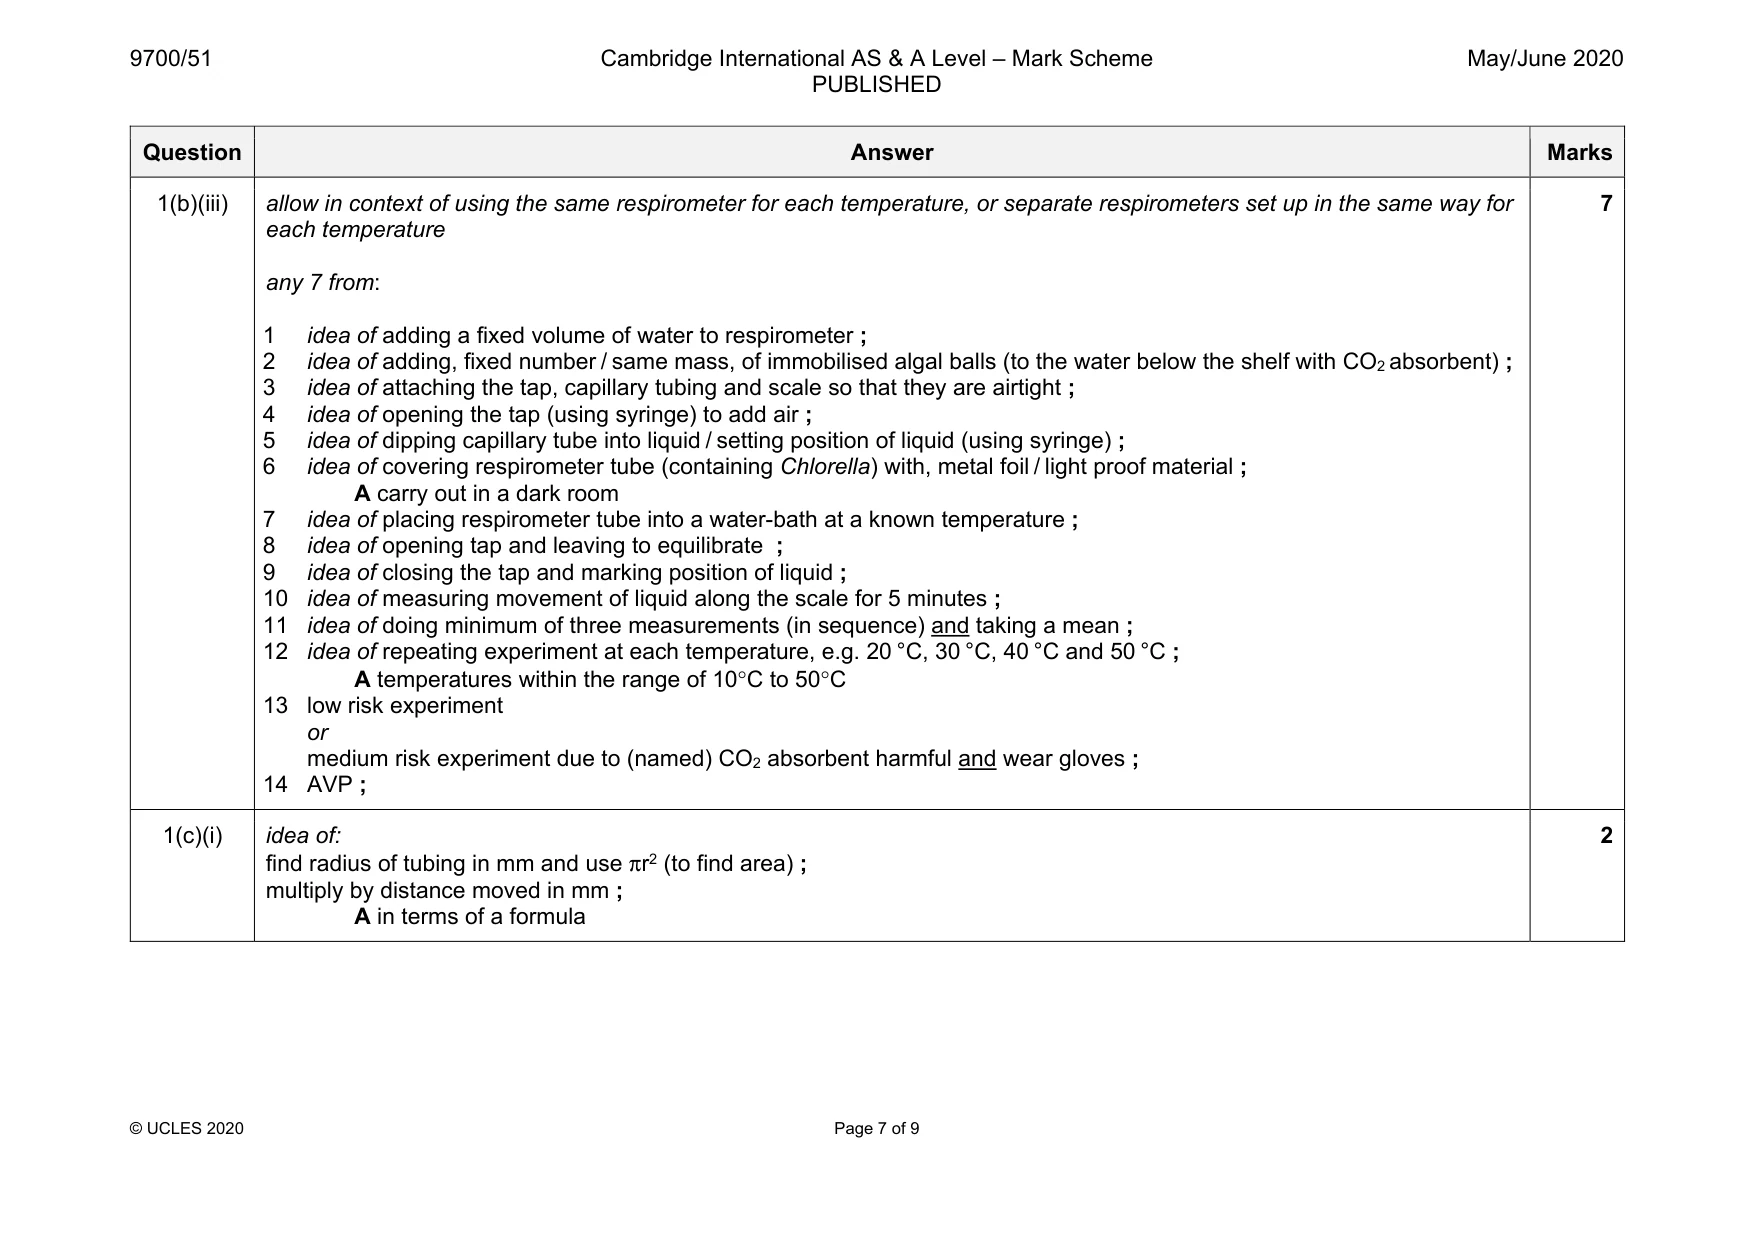
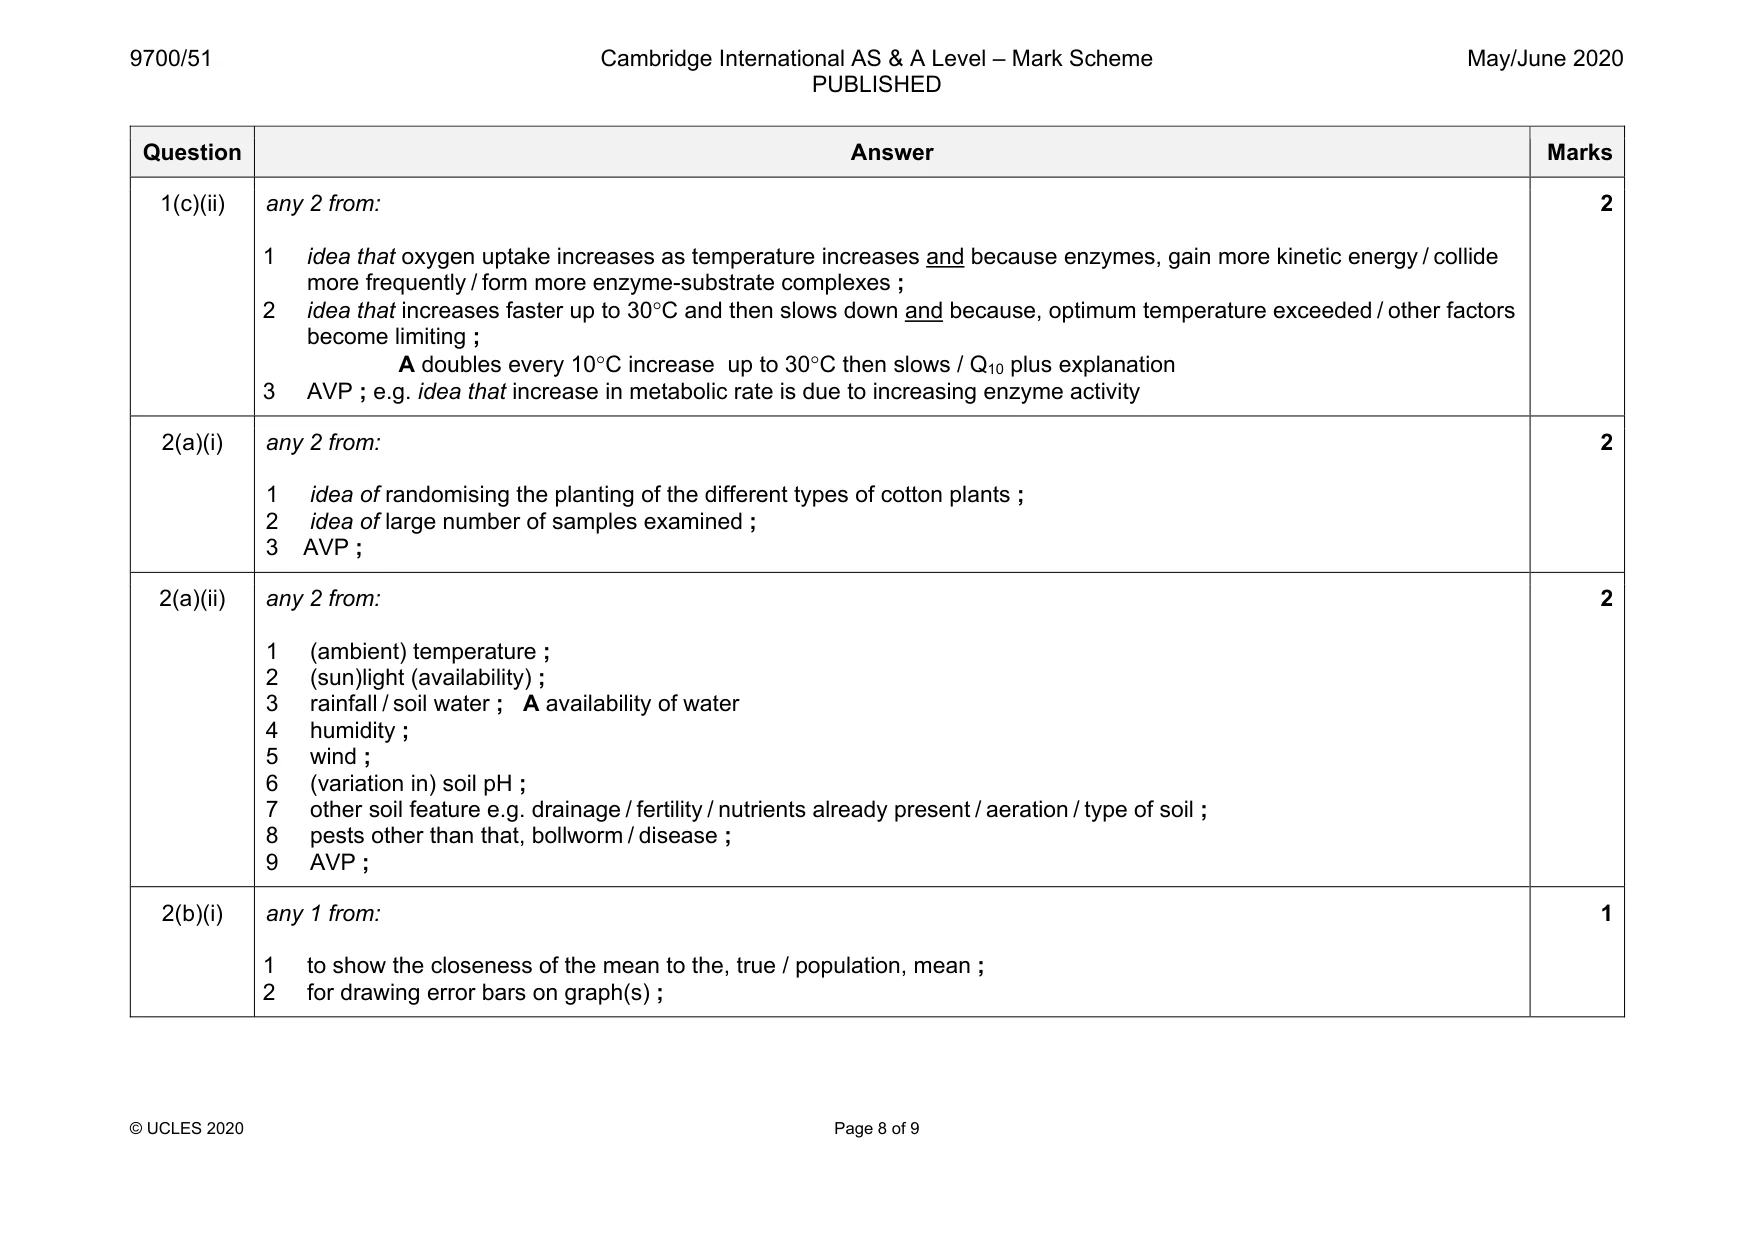
Mark scheme: 1(a) idea of: mix (equal volumes of), Chlorella / suspension, and sodium alginate ; (slowly) drip mixture into calcium chloride (solution) ; using a, syringe / pipette ; 1(b)(i) independent variable: temperature ; dependent variable: distance travelled by the coloured liquid ; 2 1(b)(ii) any 2 from: idea that 1 (suitable because) these are temperatures at which, enzymes are expected to be functioning / Chlorella may survive ; 2 (suitable because) gives enough range for at least five temperatures ; 3 (not suitable because) does not show effect of very, high / low, temperatures ; 2 Question Answer Marks 1(b)(iii) allow in context of using the same respirometer for each temperature, or separate respirometers set up in the same way for each temperature any 7 from: 1 idea of adding a fixed volume of water to respirometer ; 2 idea of adding, fixed number / same mass, of immobilised algal balls (to the water below the shelf with CO2 absorbent) ; 3 idea of attaching the tap, capillary tubing and scale so that they are airtight ; 4 idea of opening the tap (using syringe) to add air ; 5 idea of dipping capillary tube into liquid / setting position of liquid (using syringe) ; 6 idea of covering respirometer tube (containing Chlorella) with, metal foil / light proof material ; A carry out in a dark room 7 idea of placing respirometer tube into a water-bath at a known temperature ; 8 idea of opening tap and leaving to equilibrate ; 9 idea of closing the tap and marking position of liquid ; 10 idea of measuring movement of liquid along the scale for 5 minutes ; 11 idea of doing minimum of three measurements (in sequence) and taking a mean ; 12 idea of repeating experiment at each temperature, e.g. 20 °C, 30 °C, 40 °C and 50 °C ; A temperatures within the range of 10°C to 50°C 13 low risk experiment or medium risk experiment due to (named) CO2 absorbent harmful and wear gloves ; 14 AVP ; 7 1(c)(i) idea of: find radius of tubing in mm and use πr2 (to find area) ; multiply by distance moved in mm ; A in terms of a formula 2 Question Answer Marks 1(c)(ii) any 2 from: 1 idea that oxygen uptake increases as temperature increases and because enzymes, gain more kinetic energy / collide more frequently / form more enzyme-substrate complexes ; 2 idea that increases faster up to 30°C and then slows down and because, optimum temperature exceeded / other factors become limiting ; A doubles every 10°C increase up to 30°C then slows / Q10 plus explanation 3 AVP ; e.g. idea that increase in metabolic rate is due to increasing enzyme activity 2
Q2 · The cotton bollworm, Helicoverpa armigera, is an insect pest of cotton
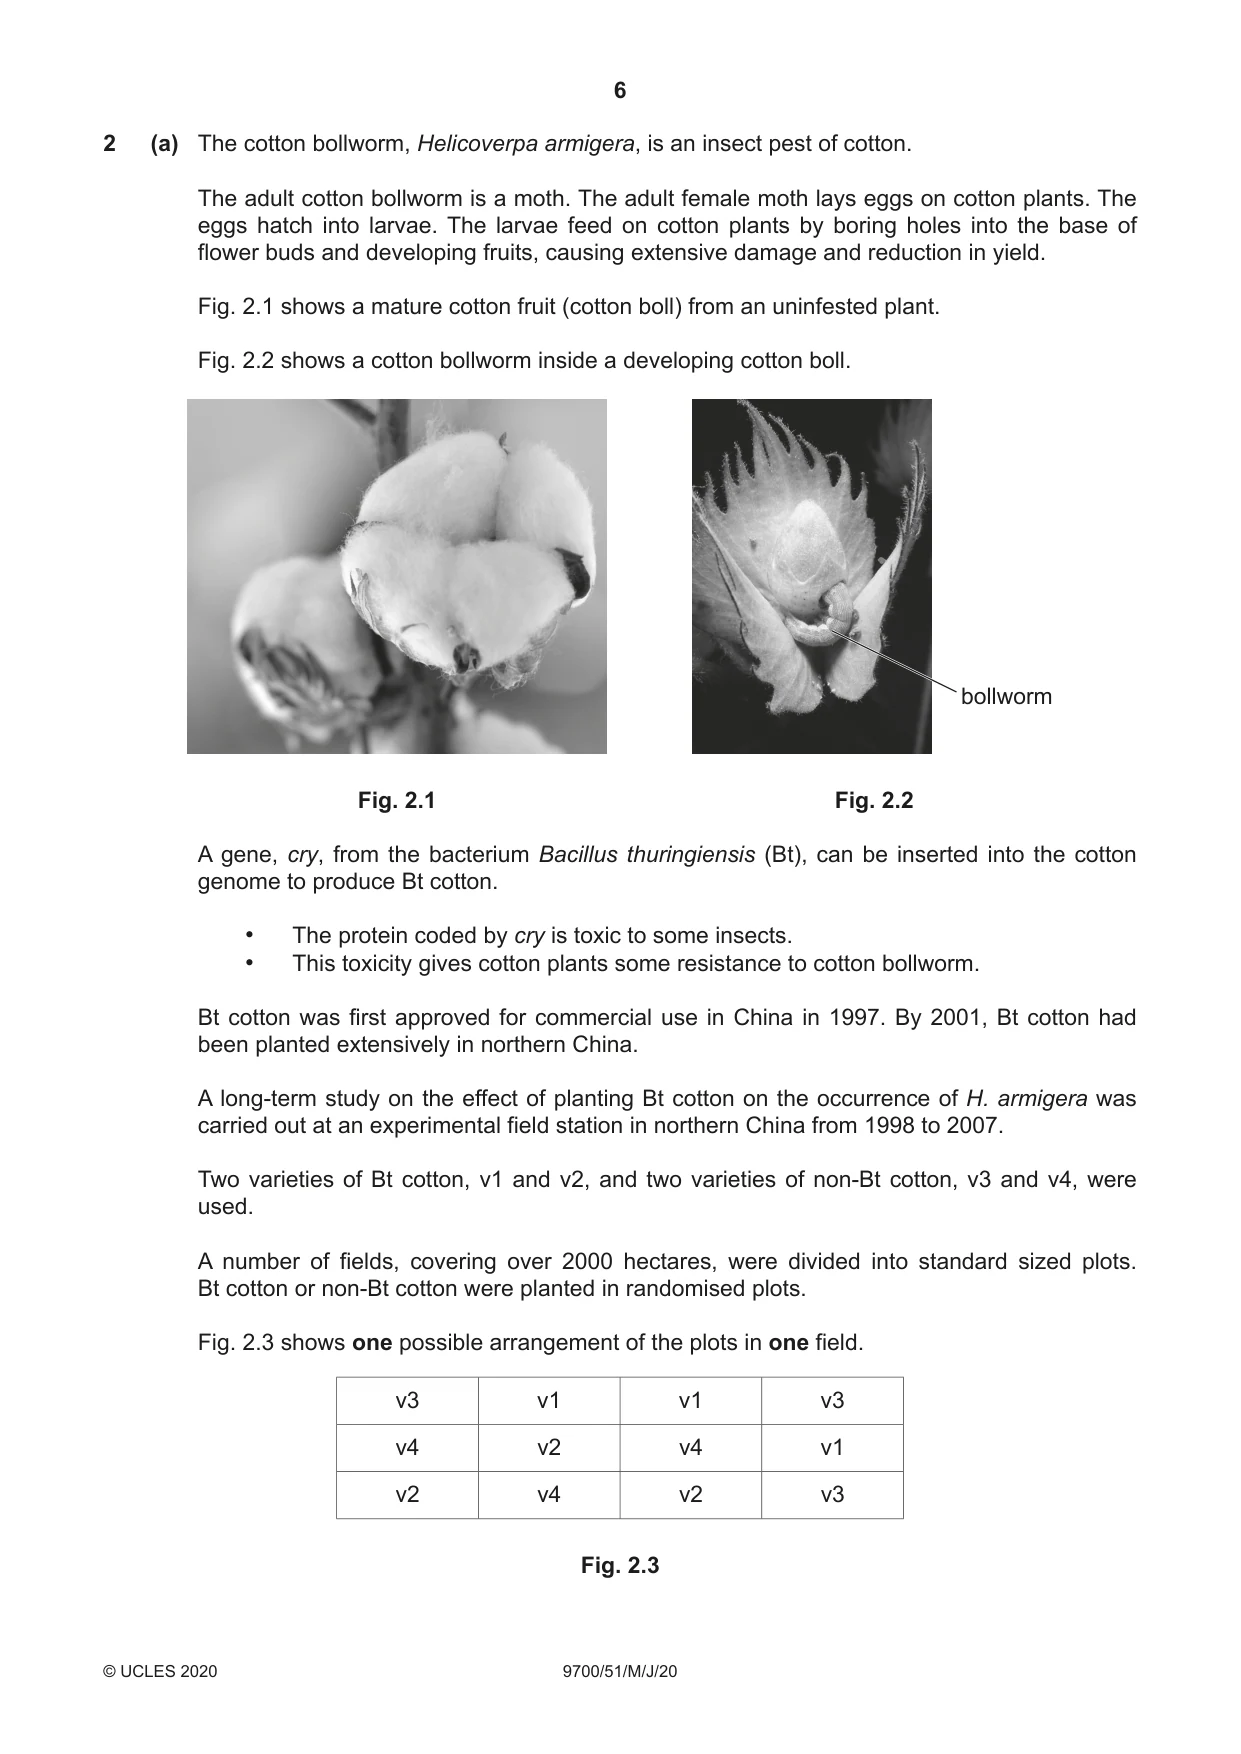
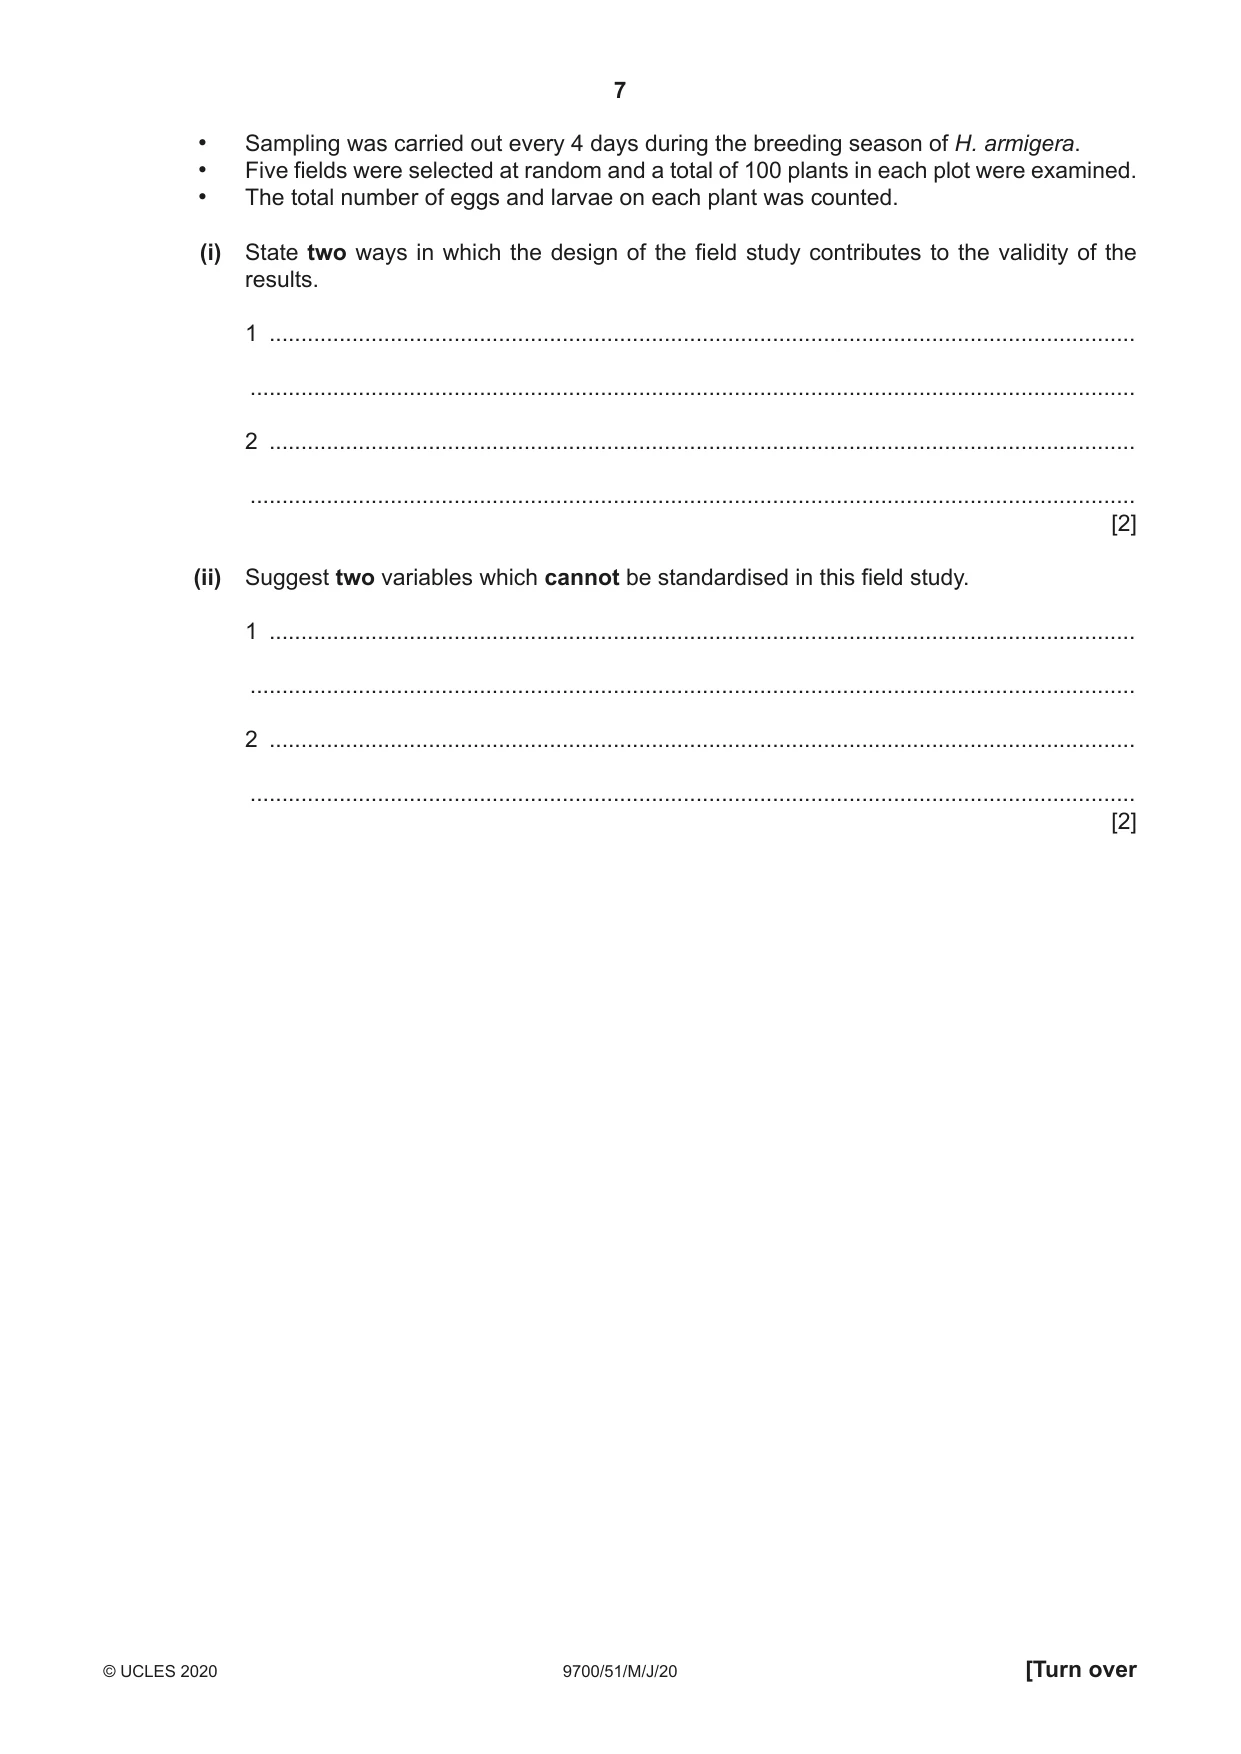
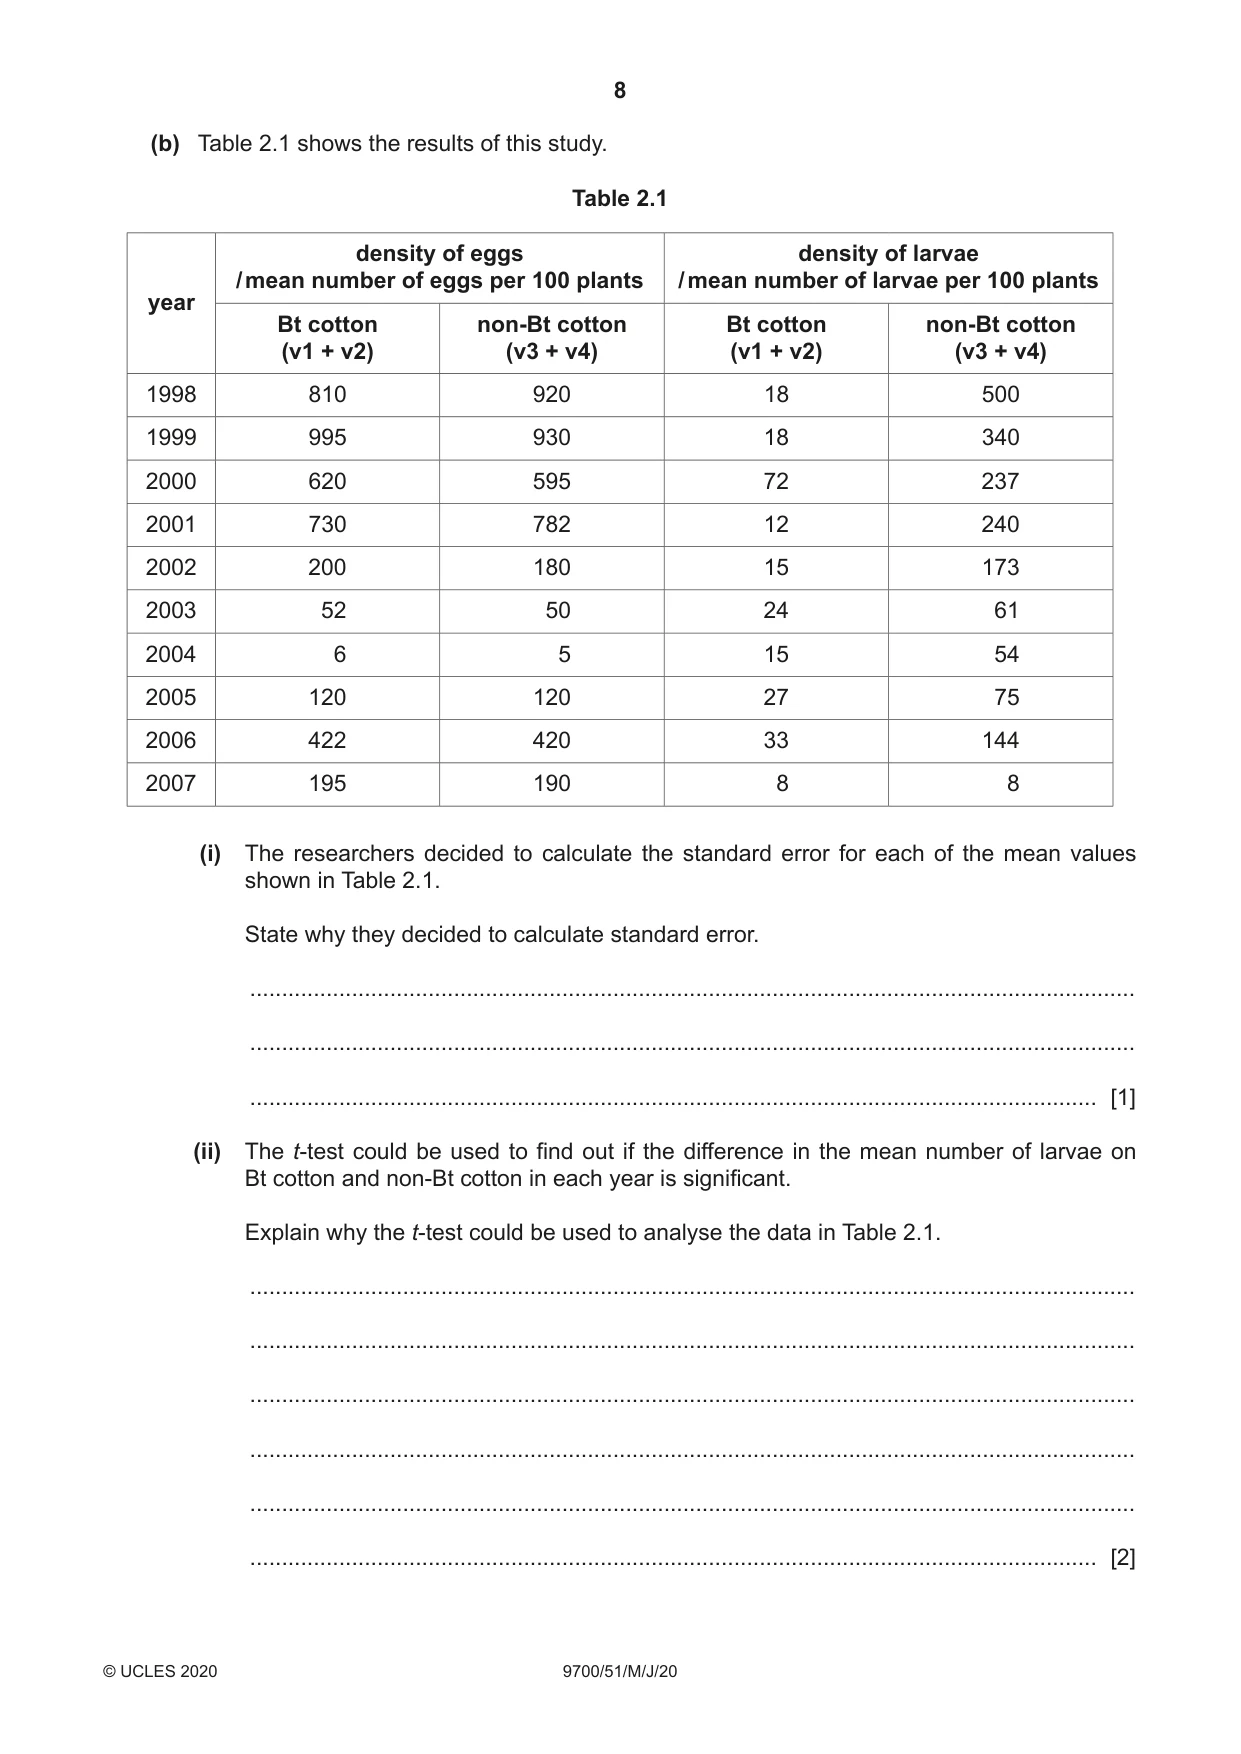
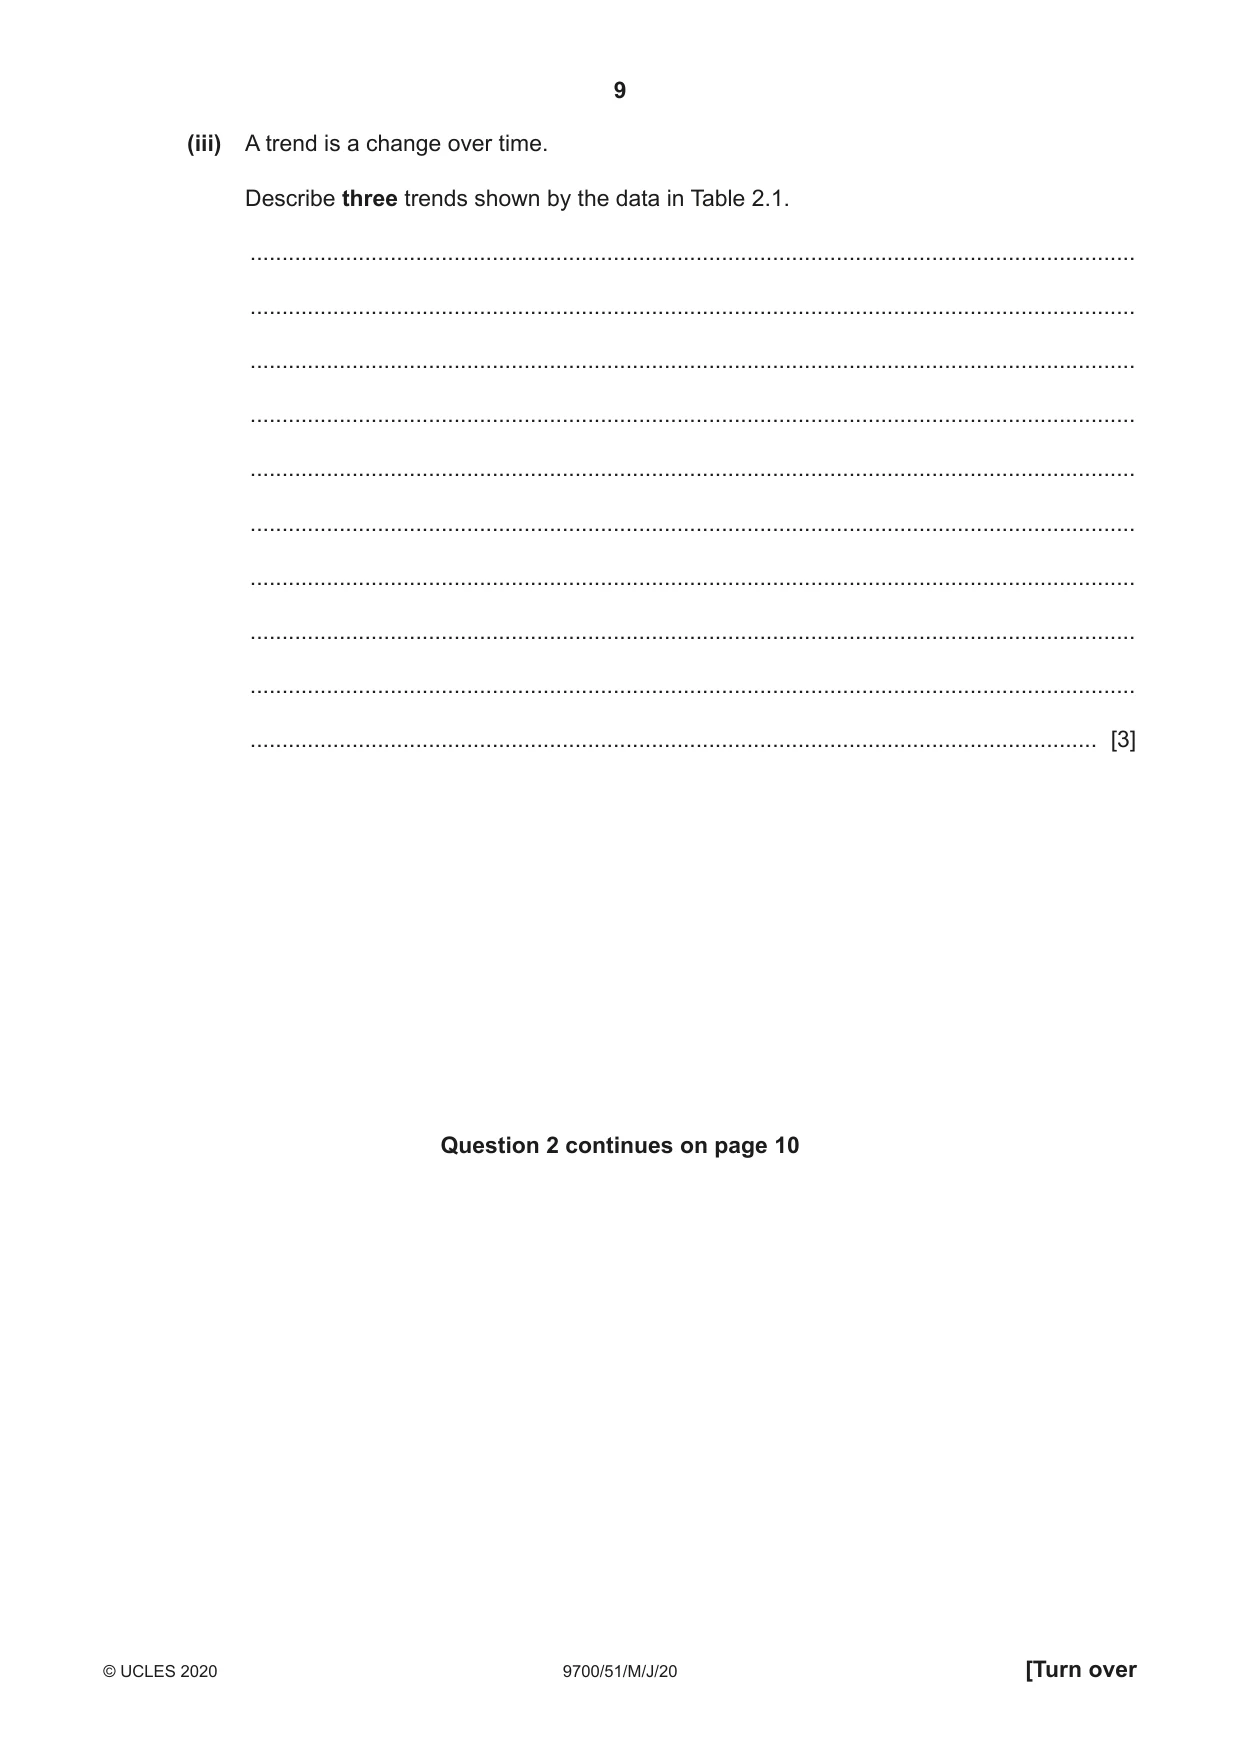
2 (a) The cotton bollworm, Helicoverpa armigera, is an insect pest of cotton. The adult cotton bollworm is a moth. The adult female moth lays eggs on cotton plants. The eggs hatch into larvae. The larvae feed on cotton plants by boring holes into the base of flower buds and developing fruits, causing extensive damage and reduction in yield. Fig. 2.1 shows a mature cotton fruit (cotton boll) from an uninfested plant. Fig. 2.2 shows a cotton bollworm inside a developing cotton boll. bollworm Fig. 2.1 Fig. 2.2 A gene, cry, from the bacterium Bacillus thuringiensis (Bt), can be inserted into the cotton genome to produce Bt cotton. • The protein coded by cry is toxic to some insects. • This toxicity gives cotton plants some resistance to cotton bollworm. Bt cotton was first approved for commercial use in China in 1997. By 2001, Bt cotton had been planted extensively in northern China. A long-term study on the effect of planting Bt cotton on the occurrence of H. armigera was carried out at an experimental field station in northern China from 1998 to 2007. Two varieties of Bt cotton, v1 and v2, and two varieties of non-Bt cotton, v3 and v4, were used. A number of fields, covering over 2000 hectares, were divided into standard sized plots. Bt cotton or non-Bt cotton were planted in randomised plots. Fig. 2.3 shows one possible arrangement of the plots in one field. v3 v1 v1 v3 v4 v2 v4 v1 v2 v4 v2 v3 Fig. 2.3 • Sampling was carried out every 4 days during the breeding season of H. armigera. • Five fields were selected at random and a total of 100 plants in each plot were examined. • The total number of eggs and larvae on each plant was counted. (i) State two ways in which the design of the field study contributes to the validity of the results. 1 ........................................................................................................................................ ........................................................................................................................................... 2 ........................................................................................................................................ ........................................................................................................................................... [2] (ii) Suggest two variables which cannot be standardised in this field study. 1 ........................................................................................................................................ ........................................................................................................................................... 2 ........................................................................................................................................ ........................................................................................................................................... [2] (b) Table 2.1 shows the results of this study. Table 2.1 density of eggs density of larvae / mean number of eggs per 100 plants / mean number of larvae per 100 plants year Bt cotton non-Bt cotton Bt cotton non-Bt cotton (v1 + v2) (v3 + v4) (v1 + v2) (v3 + v4) 1998 810 920 18 500 1999 995 930 18 340 2000 620 595 72 237 2001 730 782 12 240 2002 200 180 15 173 2003 52 50 24 61 2004 6 5 15 54 2005 120 120 27 75 2006 422 420 33 144 2007 195 190 8 8 (i) The researchers decided to calculate the standard error for each of the mean values shown in Table 2.1. State why they decided to calculate standard error. ........................................................................................................................................... ........................................................................................................................................... ..................................................................................................................................... [1] (ii) The t-test could be used to find out if the difference in the mean number of larvae on Bt cotton and non-Bt cotton in each year is significant. Explain why the t-test could be used to analyse the data in Table 2.1. ........................................................................................................................................... ........................................................................................................................................... ........................................................................................................................................... ........................................................................................................................................... ........................................................................................................................................... ..................................................................................................................................... [2]
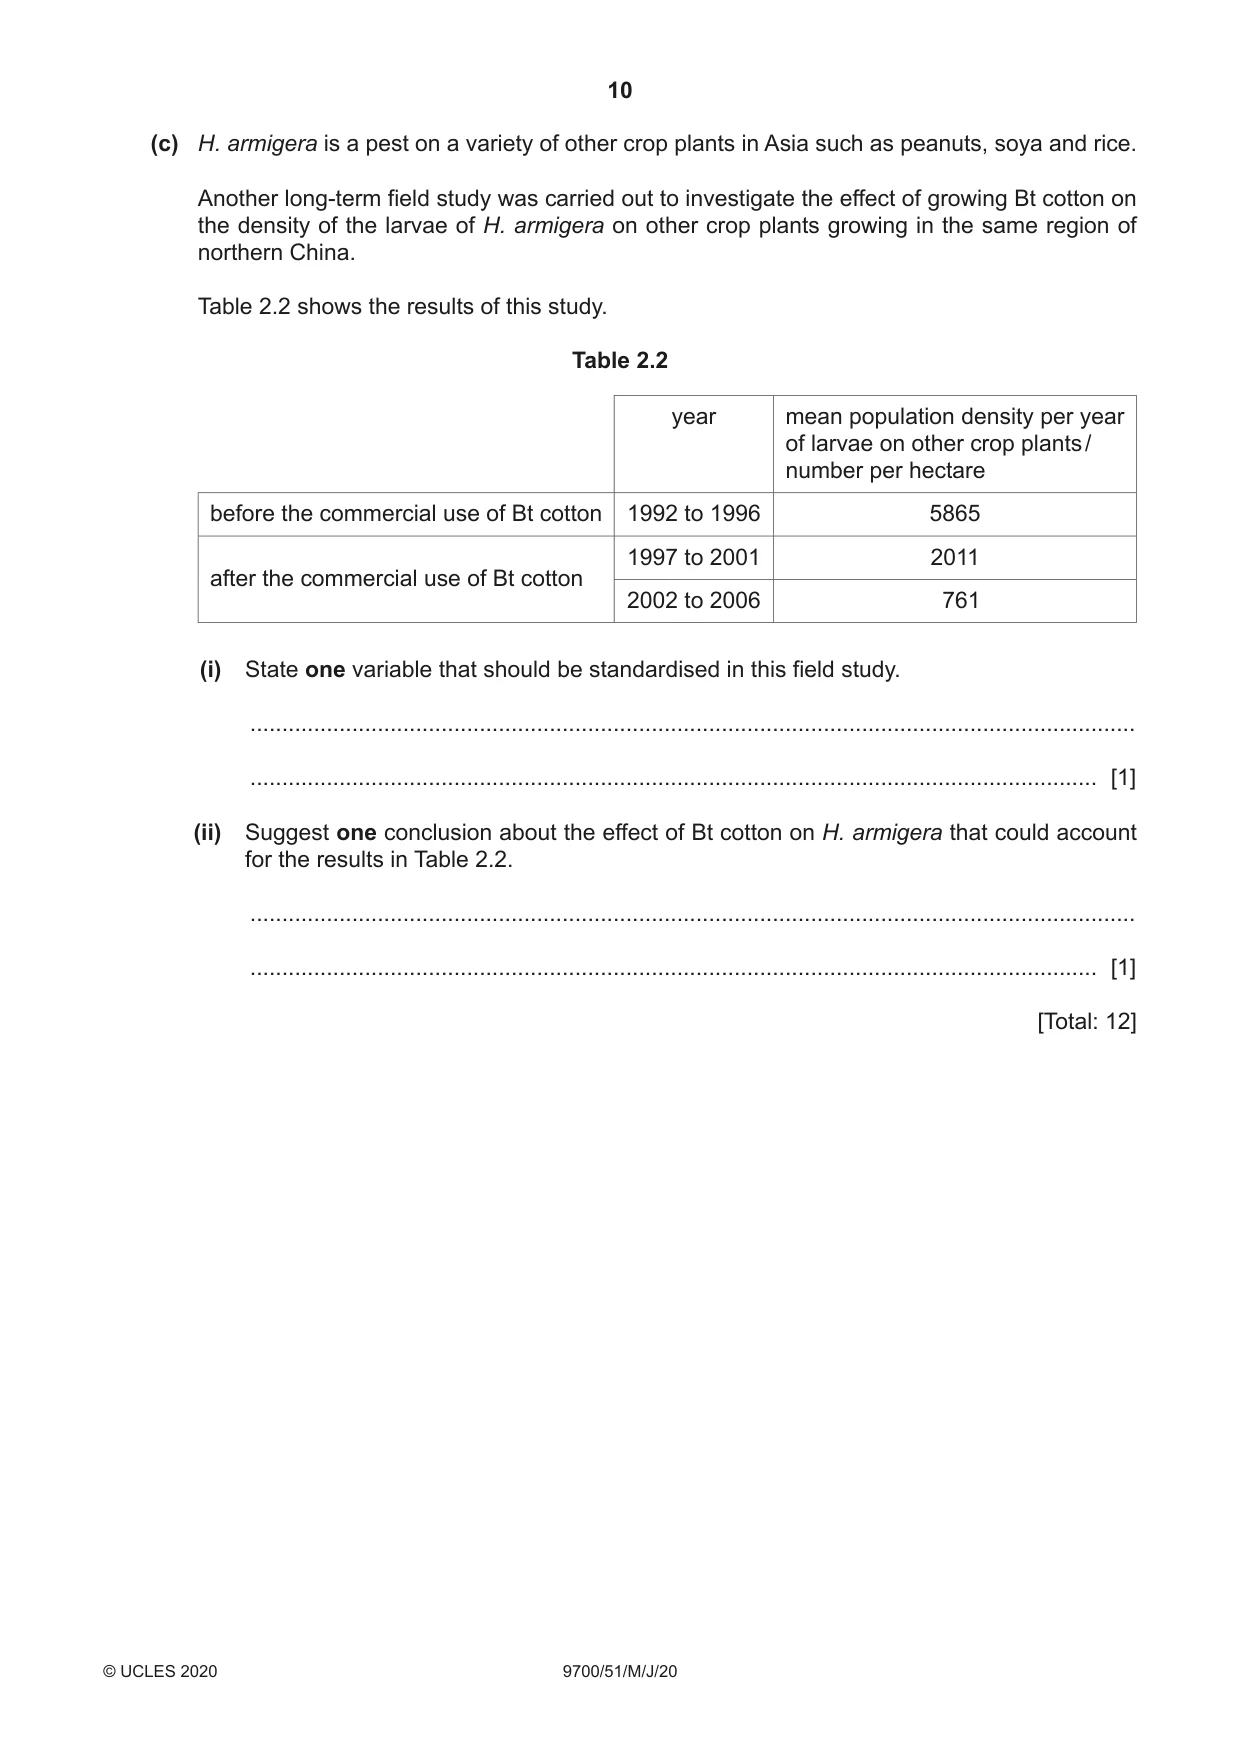
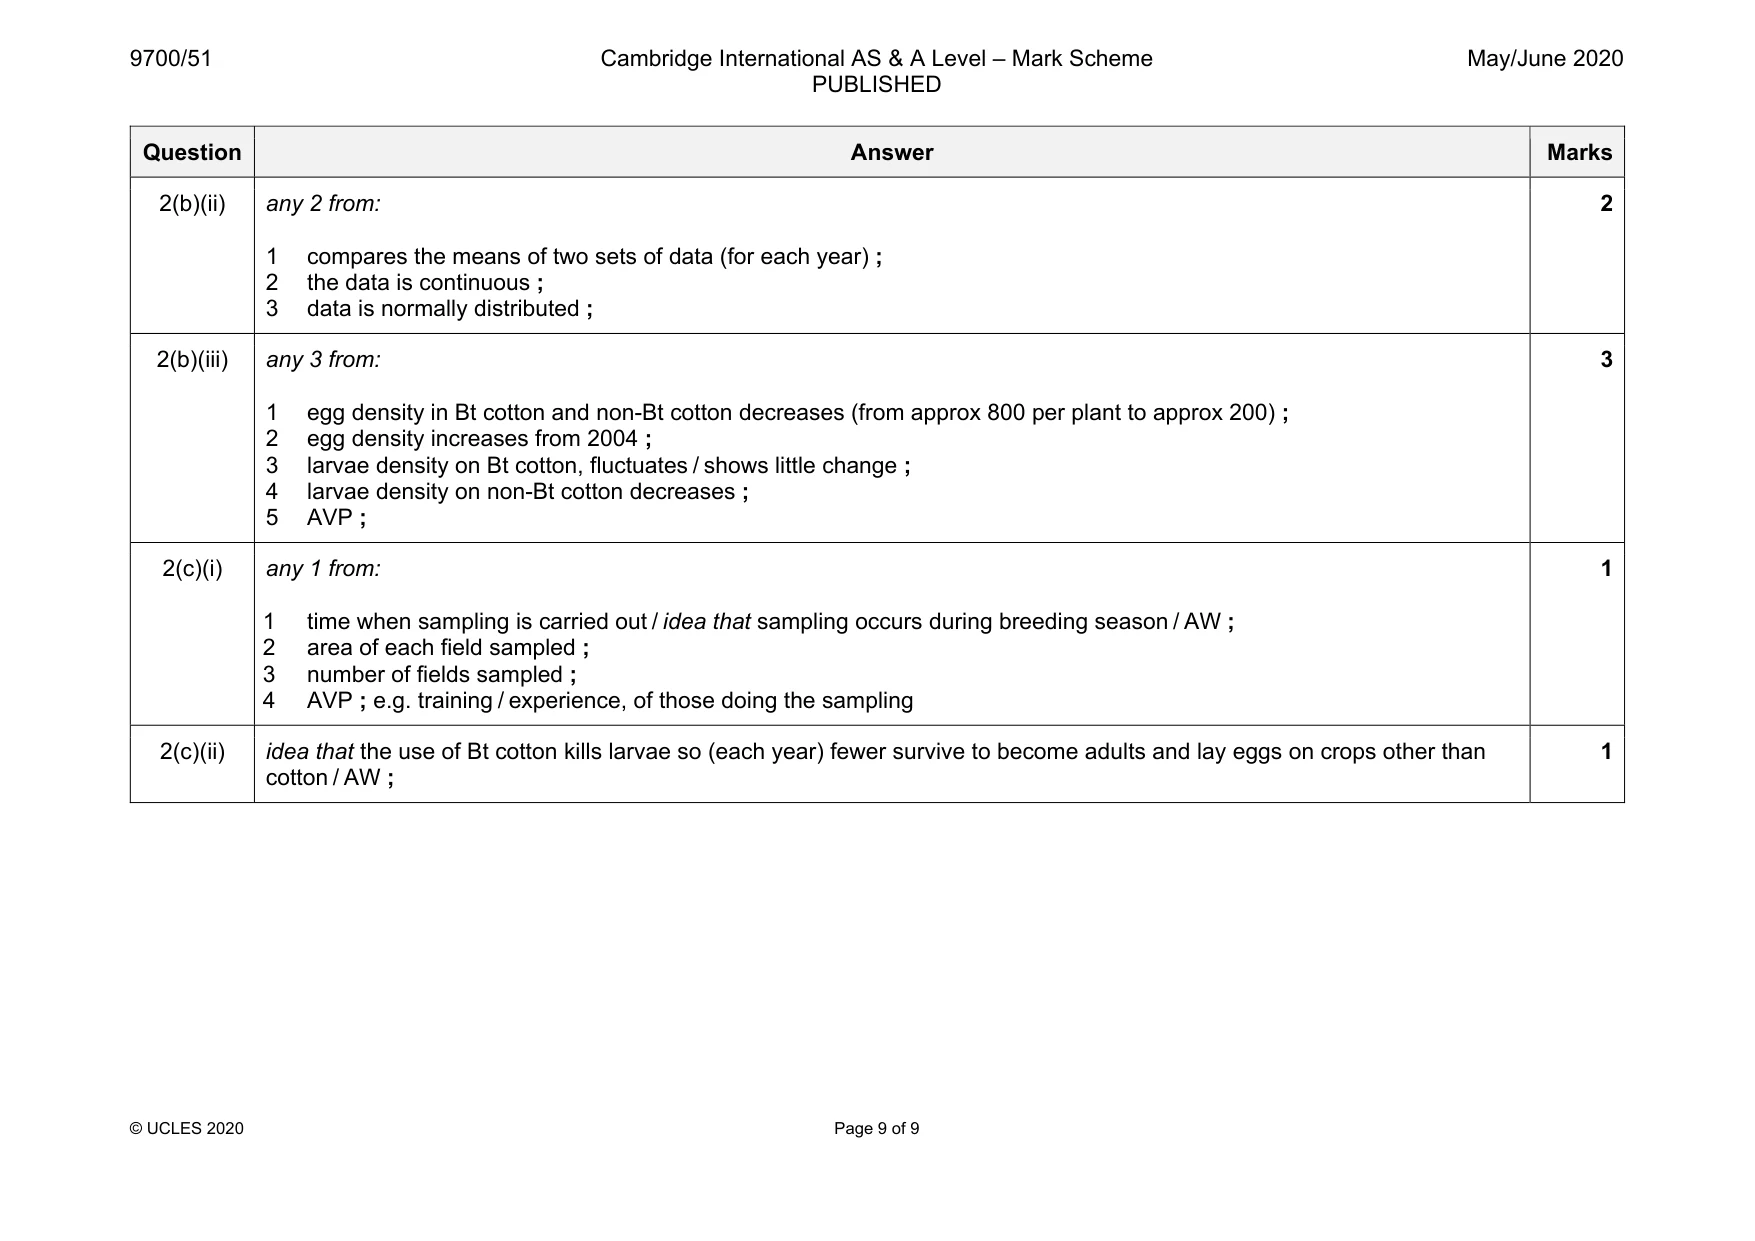
Mark scheme: 2(a)(i) any 2 from: 1 idea of randomising the planting of the different types of cotton plants ; 2 idea of large number of samples examined ; 3 AVP ; 2 2(a)(ii) any 2 from: 1 (ambient) temperature ; 2 (sun)light (availability) ; 3 rainfall / soil water ; A availability of water 4 humidity ; 5 wind ; 6 (variation in) soil pH ; 7 other soil feature e.g. drainage / fertility / nutrients already present / aeration / type of soil ; 8 pests other than that, bollworm / disease ; 9 AVP ; 2 2(b)(i) any 1 from: 1 to show the closeness of the mean to the, true / population, mean ; 2 for drawing error bars on graph(s) ; 1 Question Answer Marks 2(b)(ii) any 2 from: 1 compares the means of two sets of data (for each year) ; 2 the data is continuous ; 3 data is normally distributed ; 2 2(b)(iii) any 3 from: 1 egg density in Bt cotton and non-Bt cotton decreases (from approx 800 per plant to approx 200) ; 2 egg density increases from 2004 ; 3 larvae density on Bt cotton, fluctuates / shows little change ; 4 larvae density on non-Bt cotton decreases ; 5 AVP ; 3 2(c)(i) any 1 from: 1 time when sampling is carried out / idea that sampling occurs during breeding season / AW ; 2 area of each field sampled ; 3 number of fields sampled ; 4 AVP ; e.g. training / experience, of those doing the sampling 1 2(c)(ii) idea that the use of Bt cotton kills larvae so (each year) fewer survive to become adults and lay eggs on crops other than cotton / AW ; 1
More questions on Genetically modified organisms in agriculture
What was in this paper
The subtopics covered by these 2 questions, and how many questions each got. Open one in a new tab to see every Cambridge question on it.