Cambridge A Level Biology 9700 — 2020 May/June Paper 3 · Variant 4
9700/34/M/J/20 · 2 questions · 32 marks · ≈36 min
The question paper and its mark scheme, free to read here and free to download. This is Cambridge’s own paper, exactly as it was sat.
Question paper16 pages
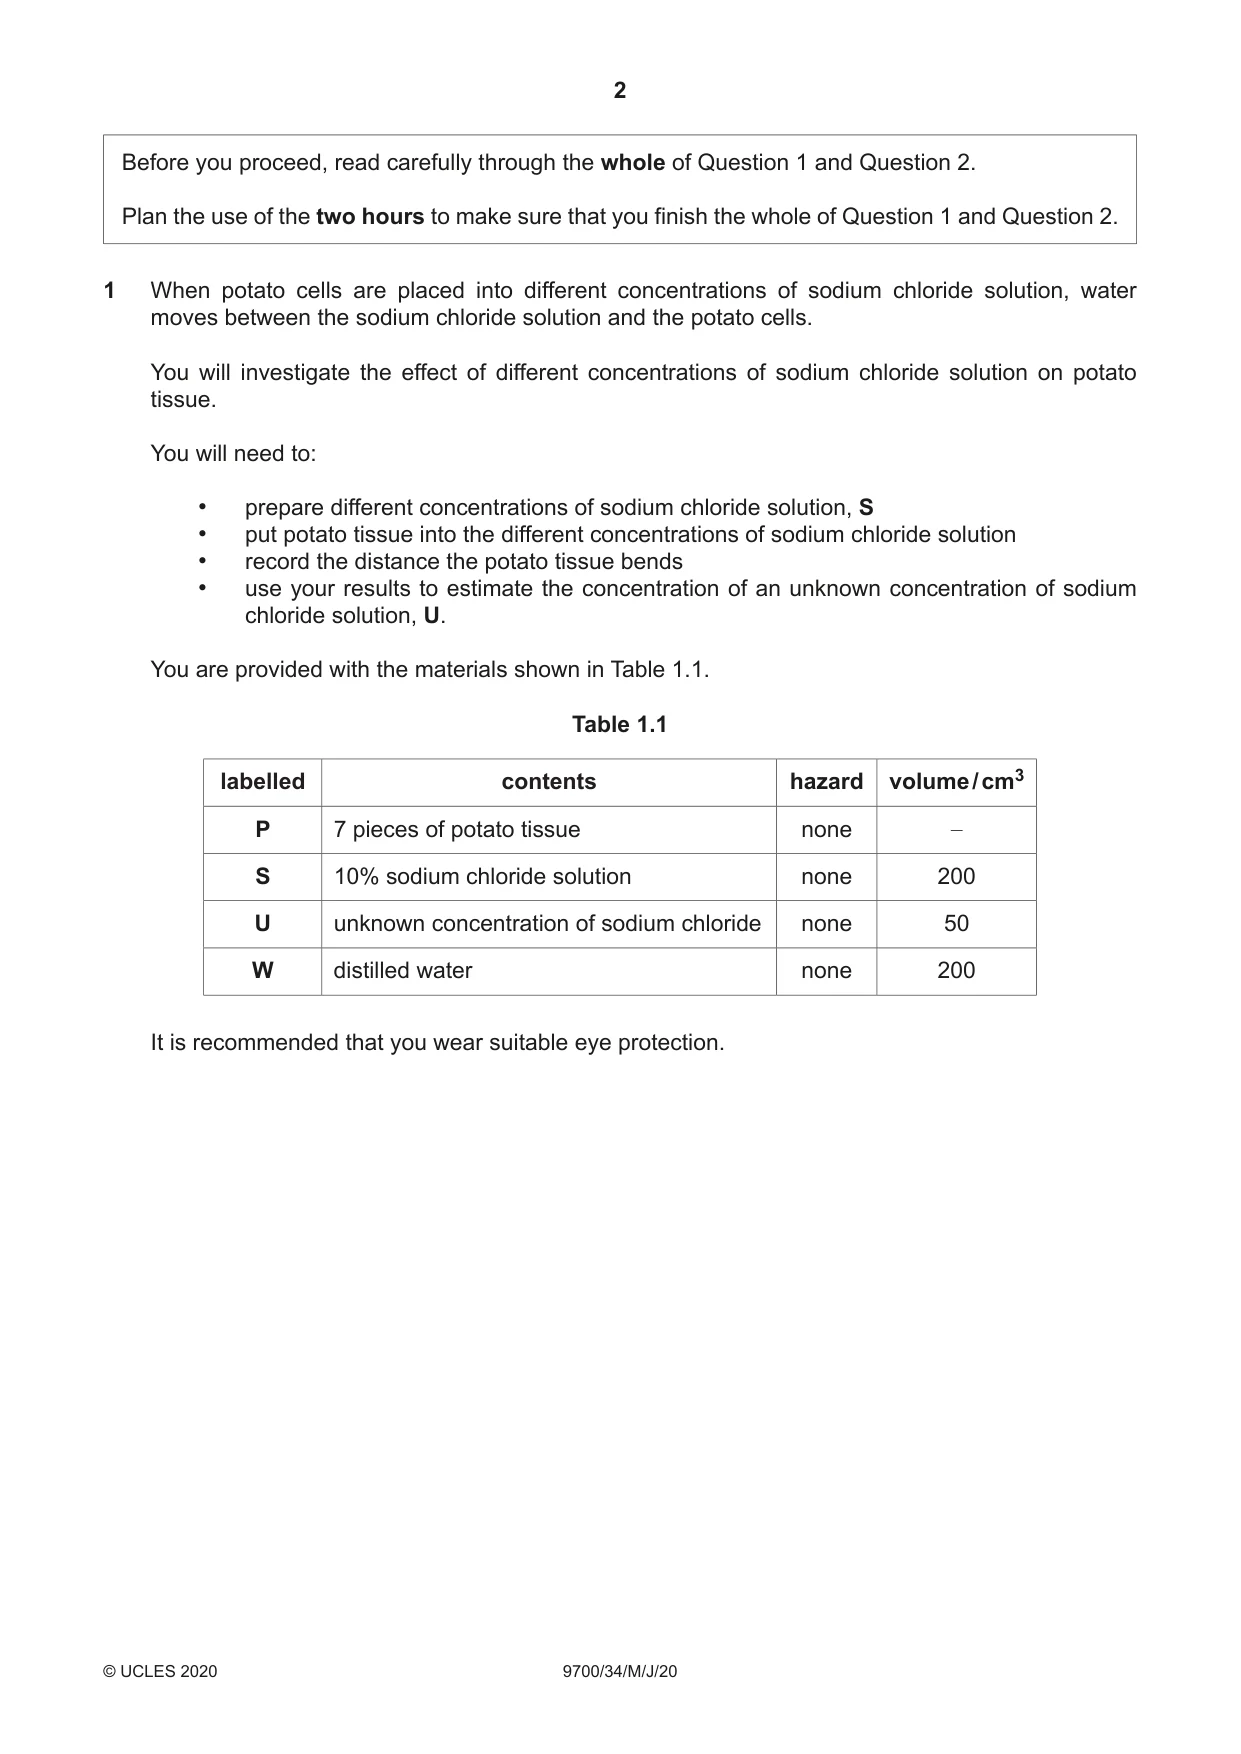
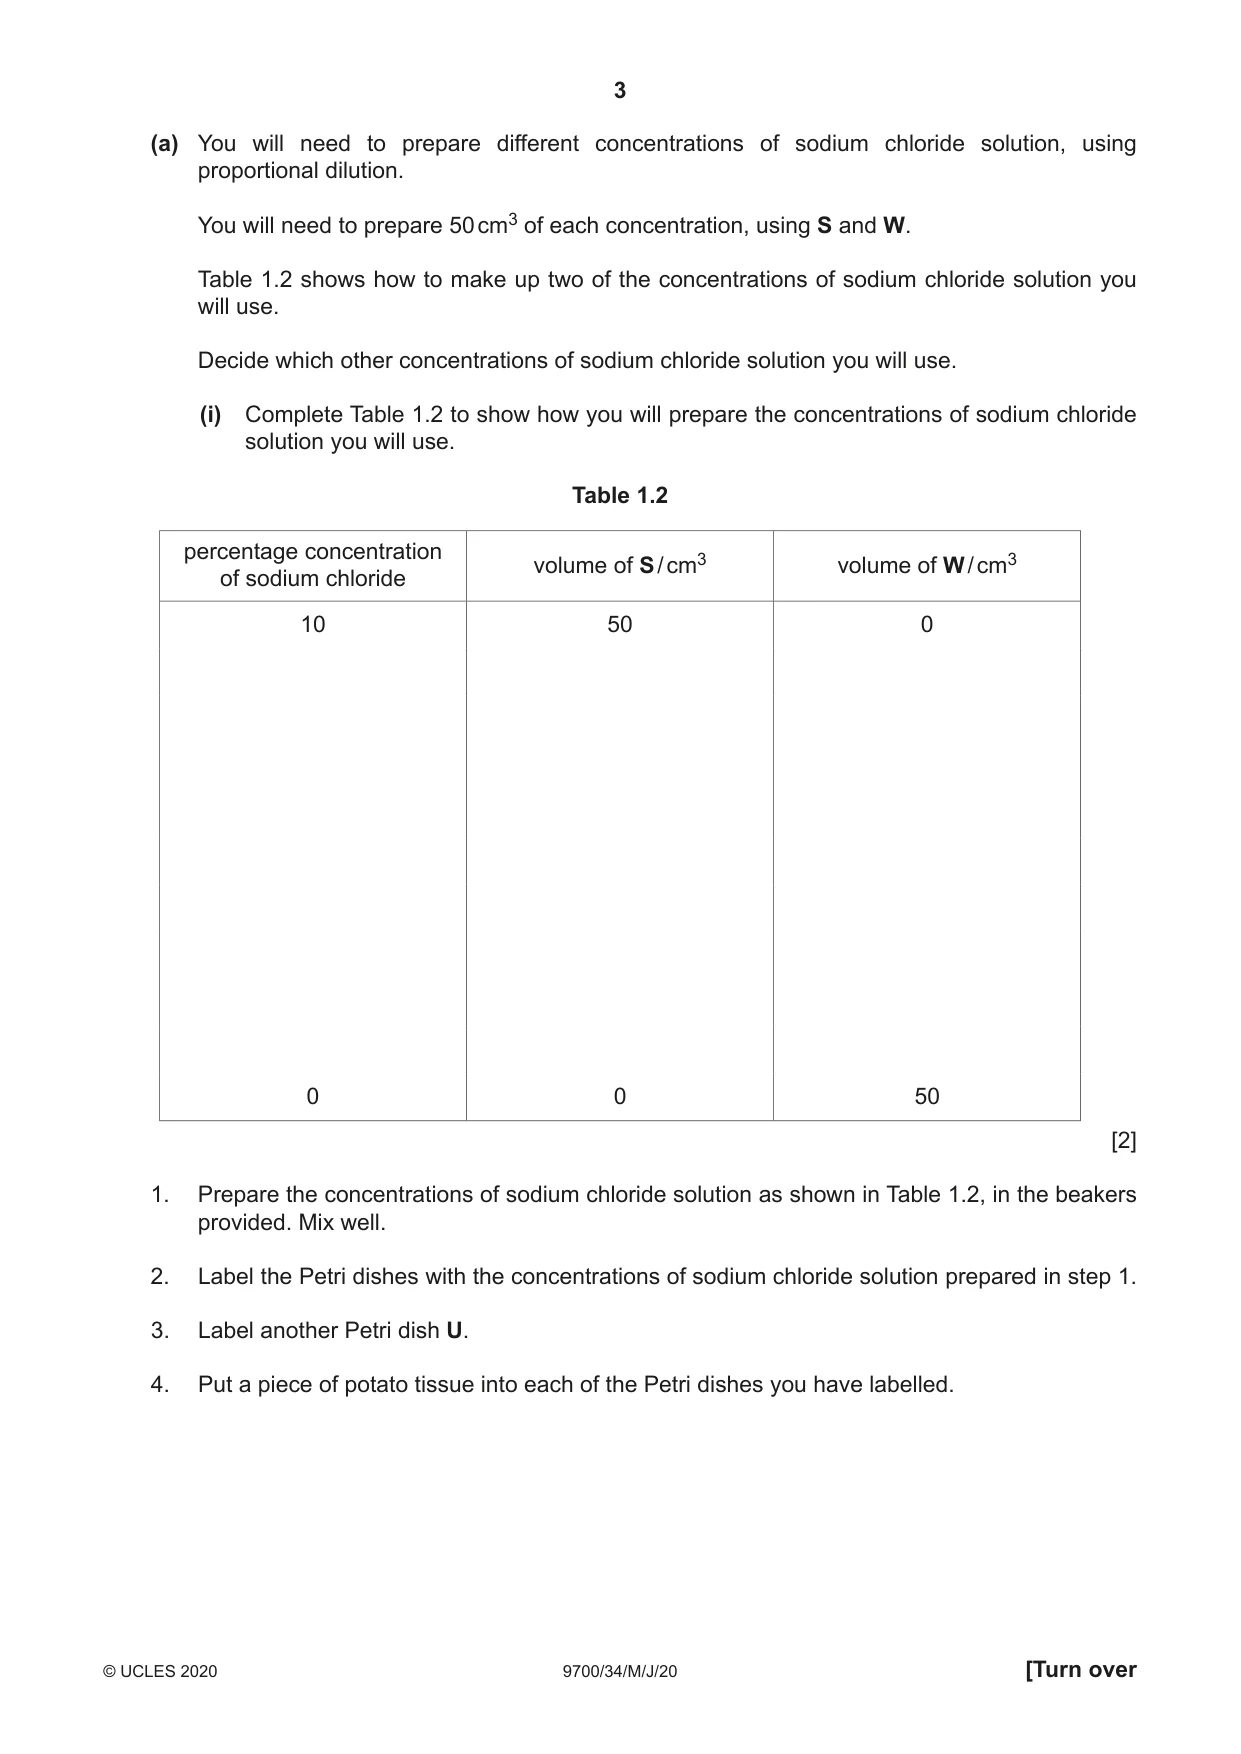
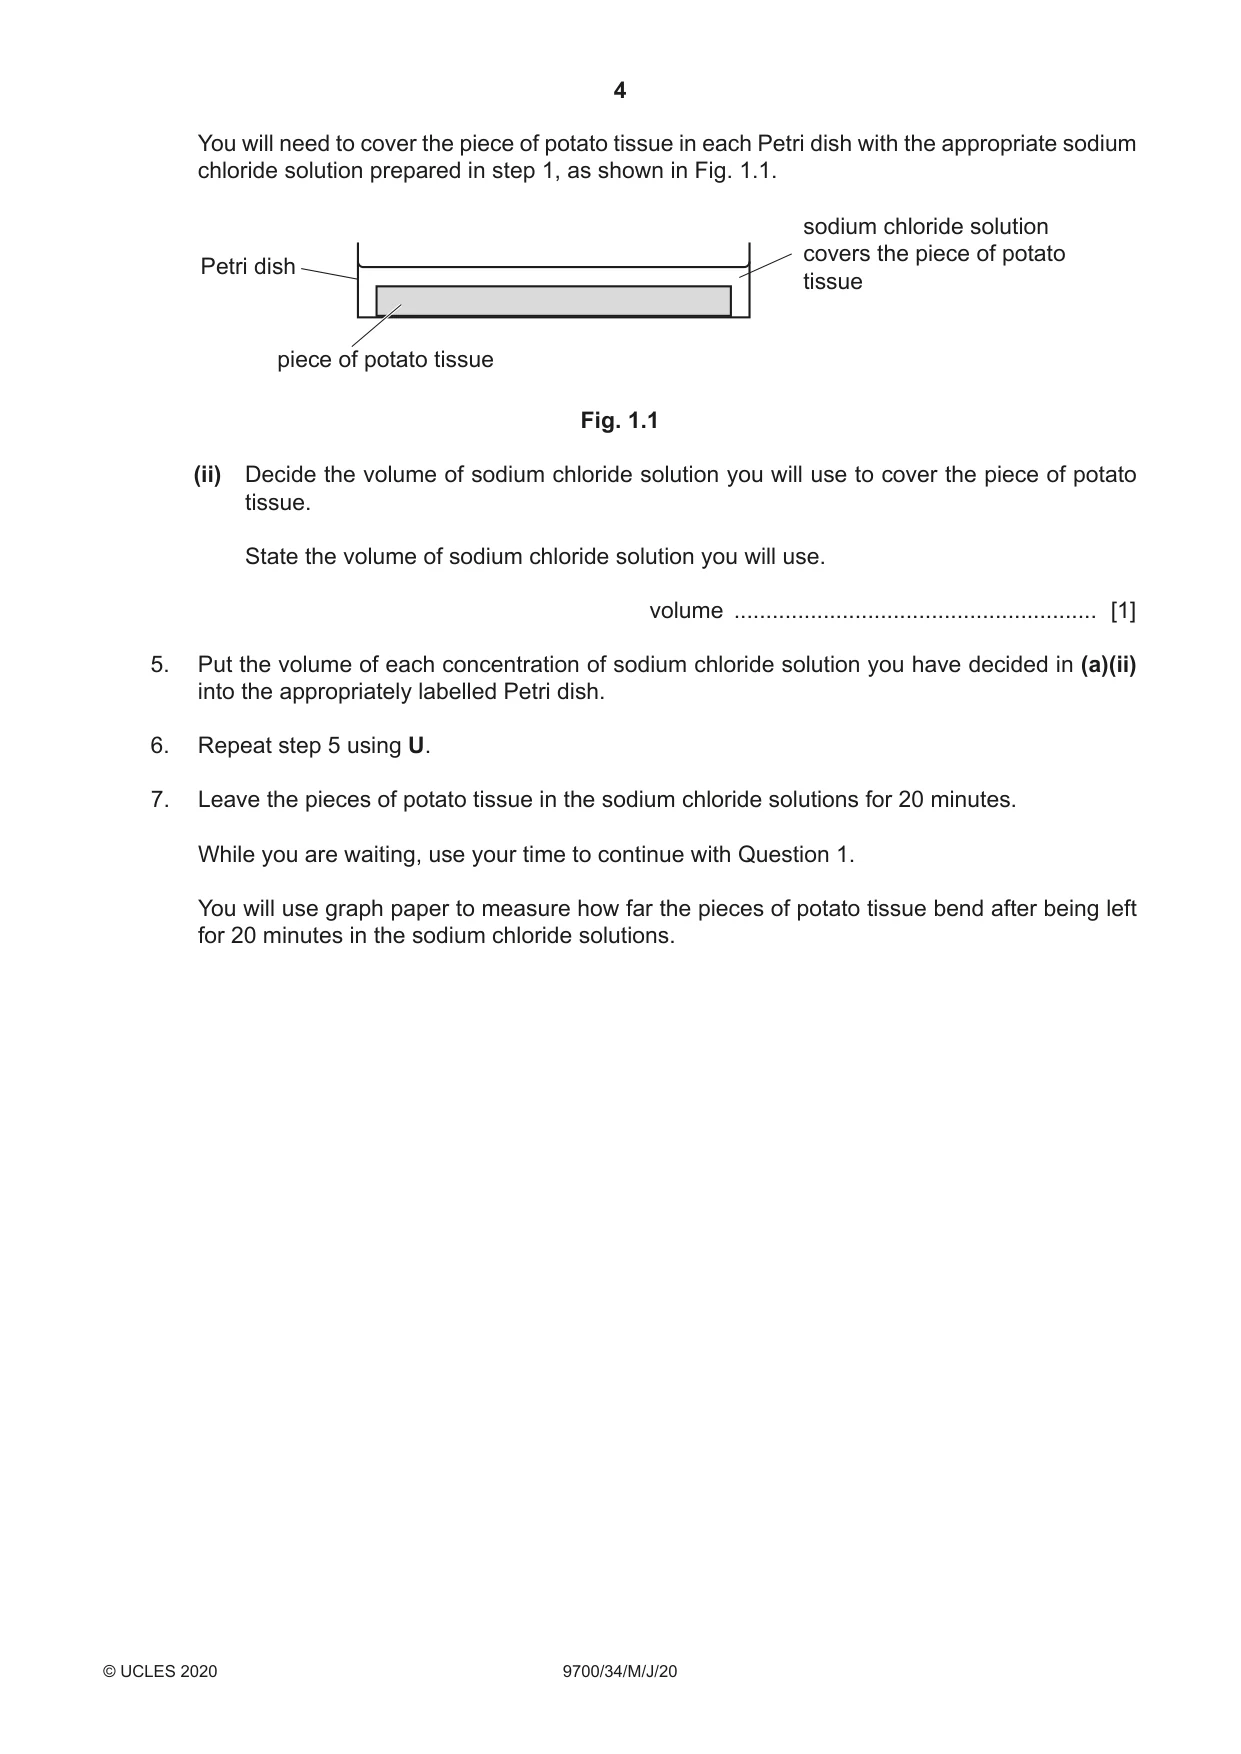
Mark scheme9 pages
Answers below. Sit the paper first if you are practising.
Questions as text
Q1 · When potato cells are placed into different concentrations of sodium chloride solution…
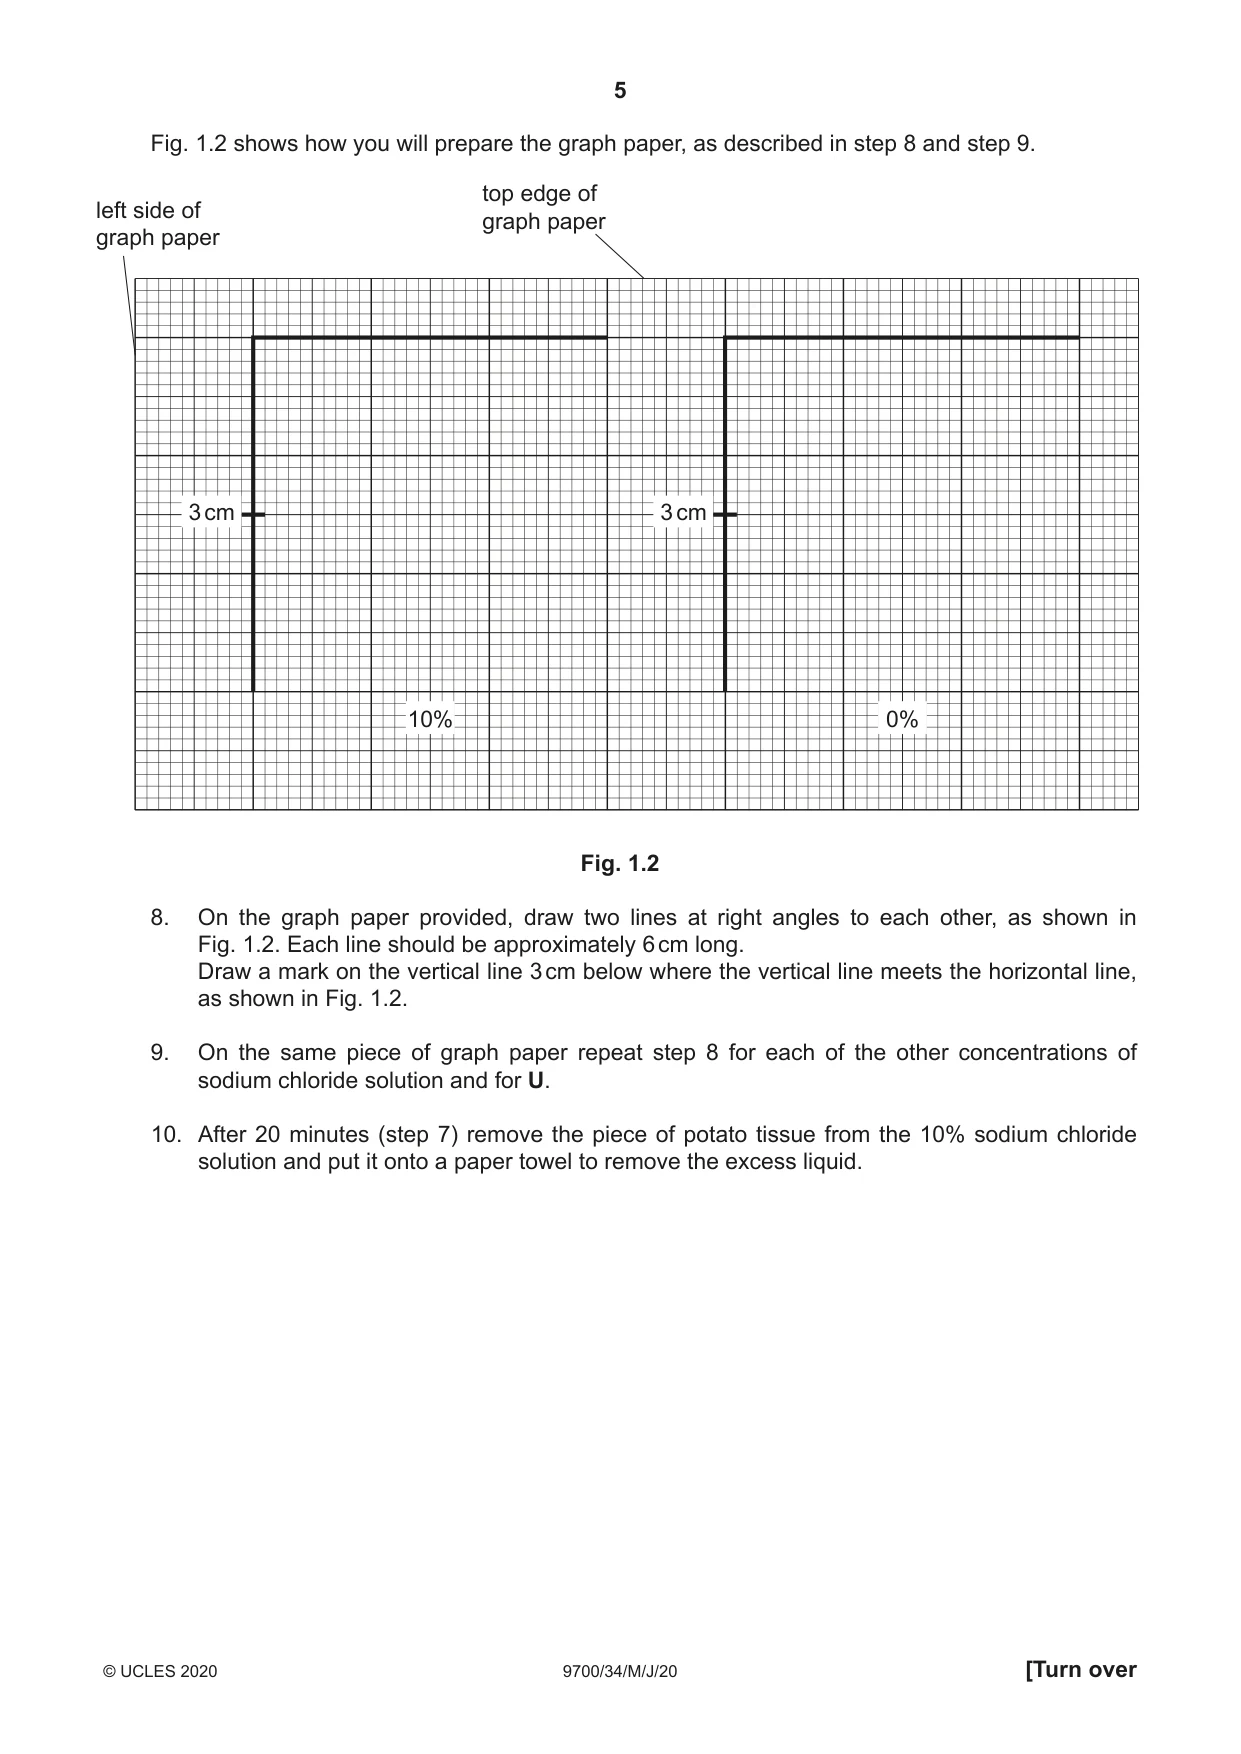
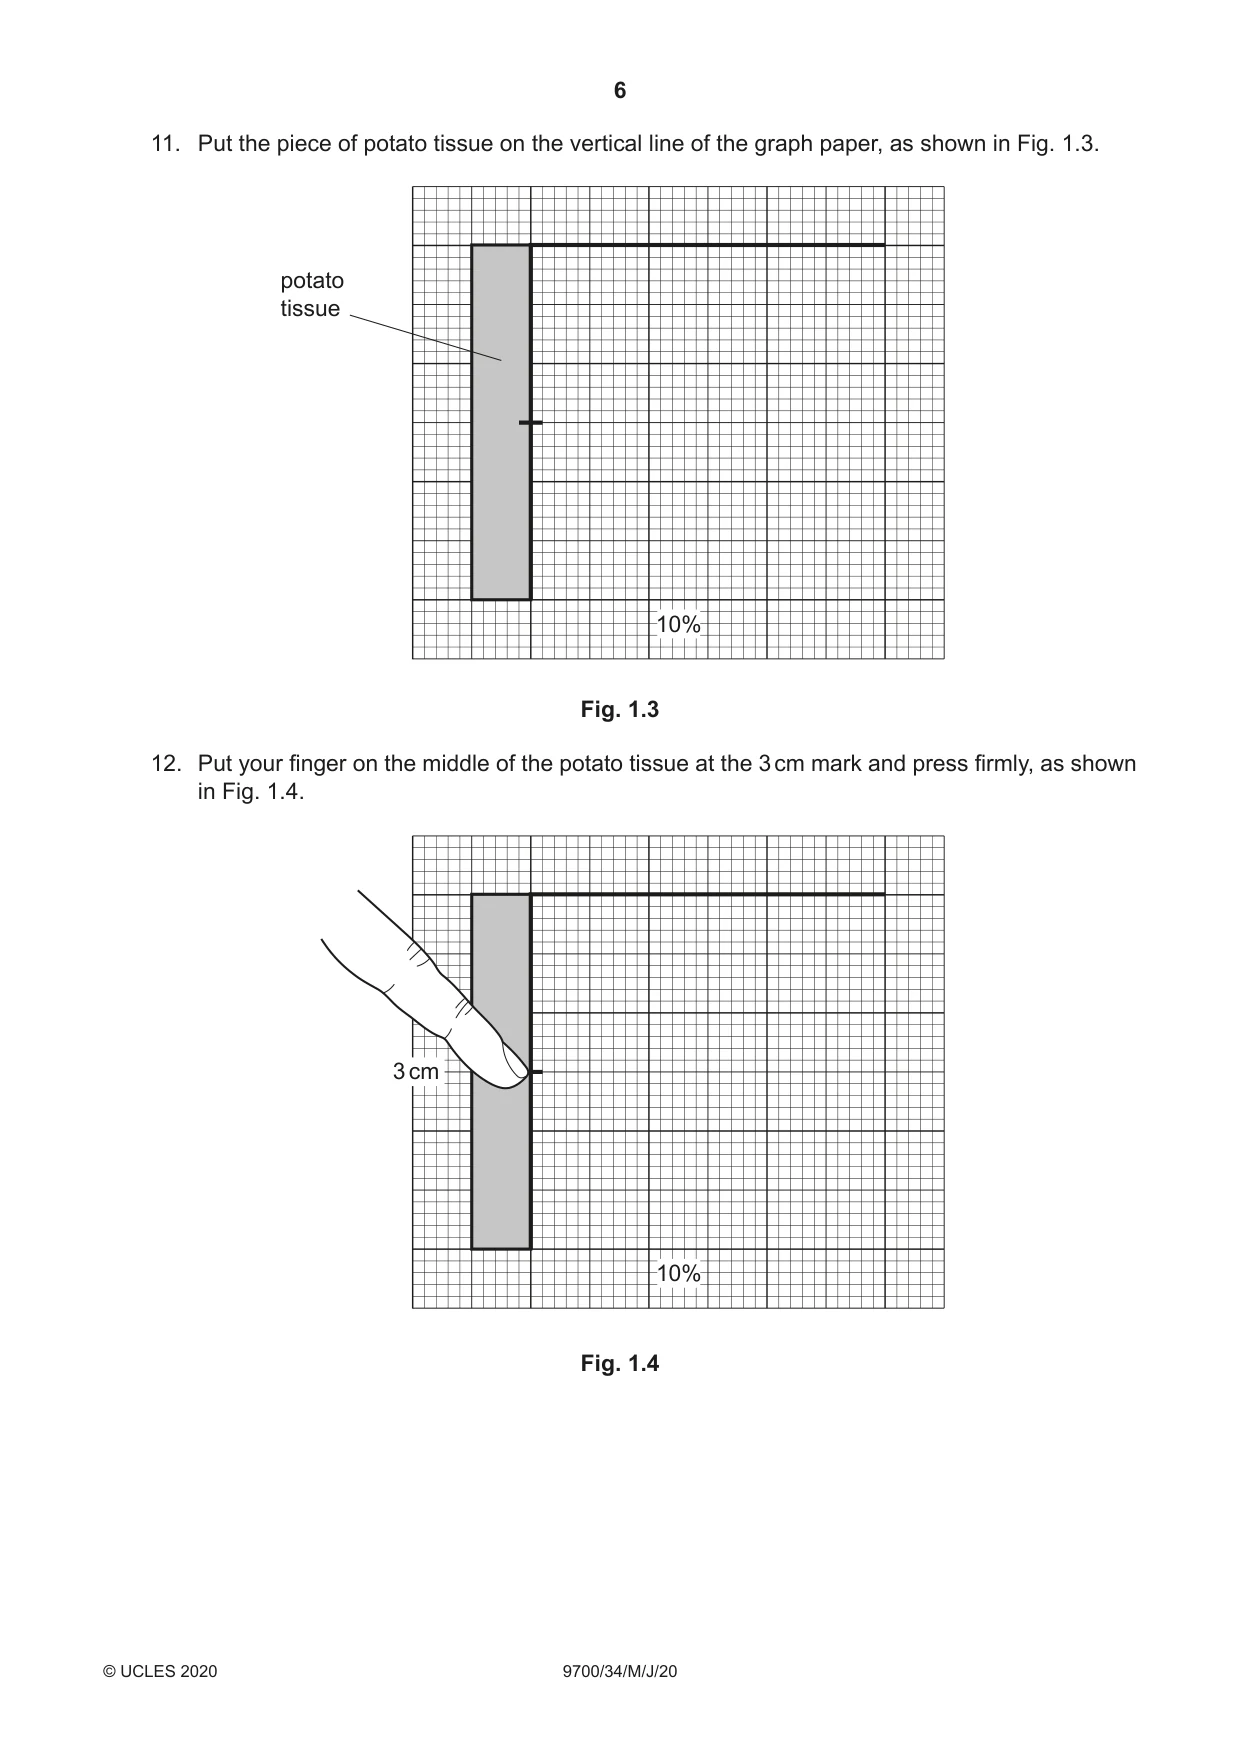
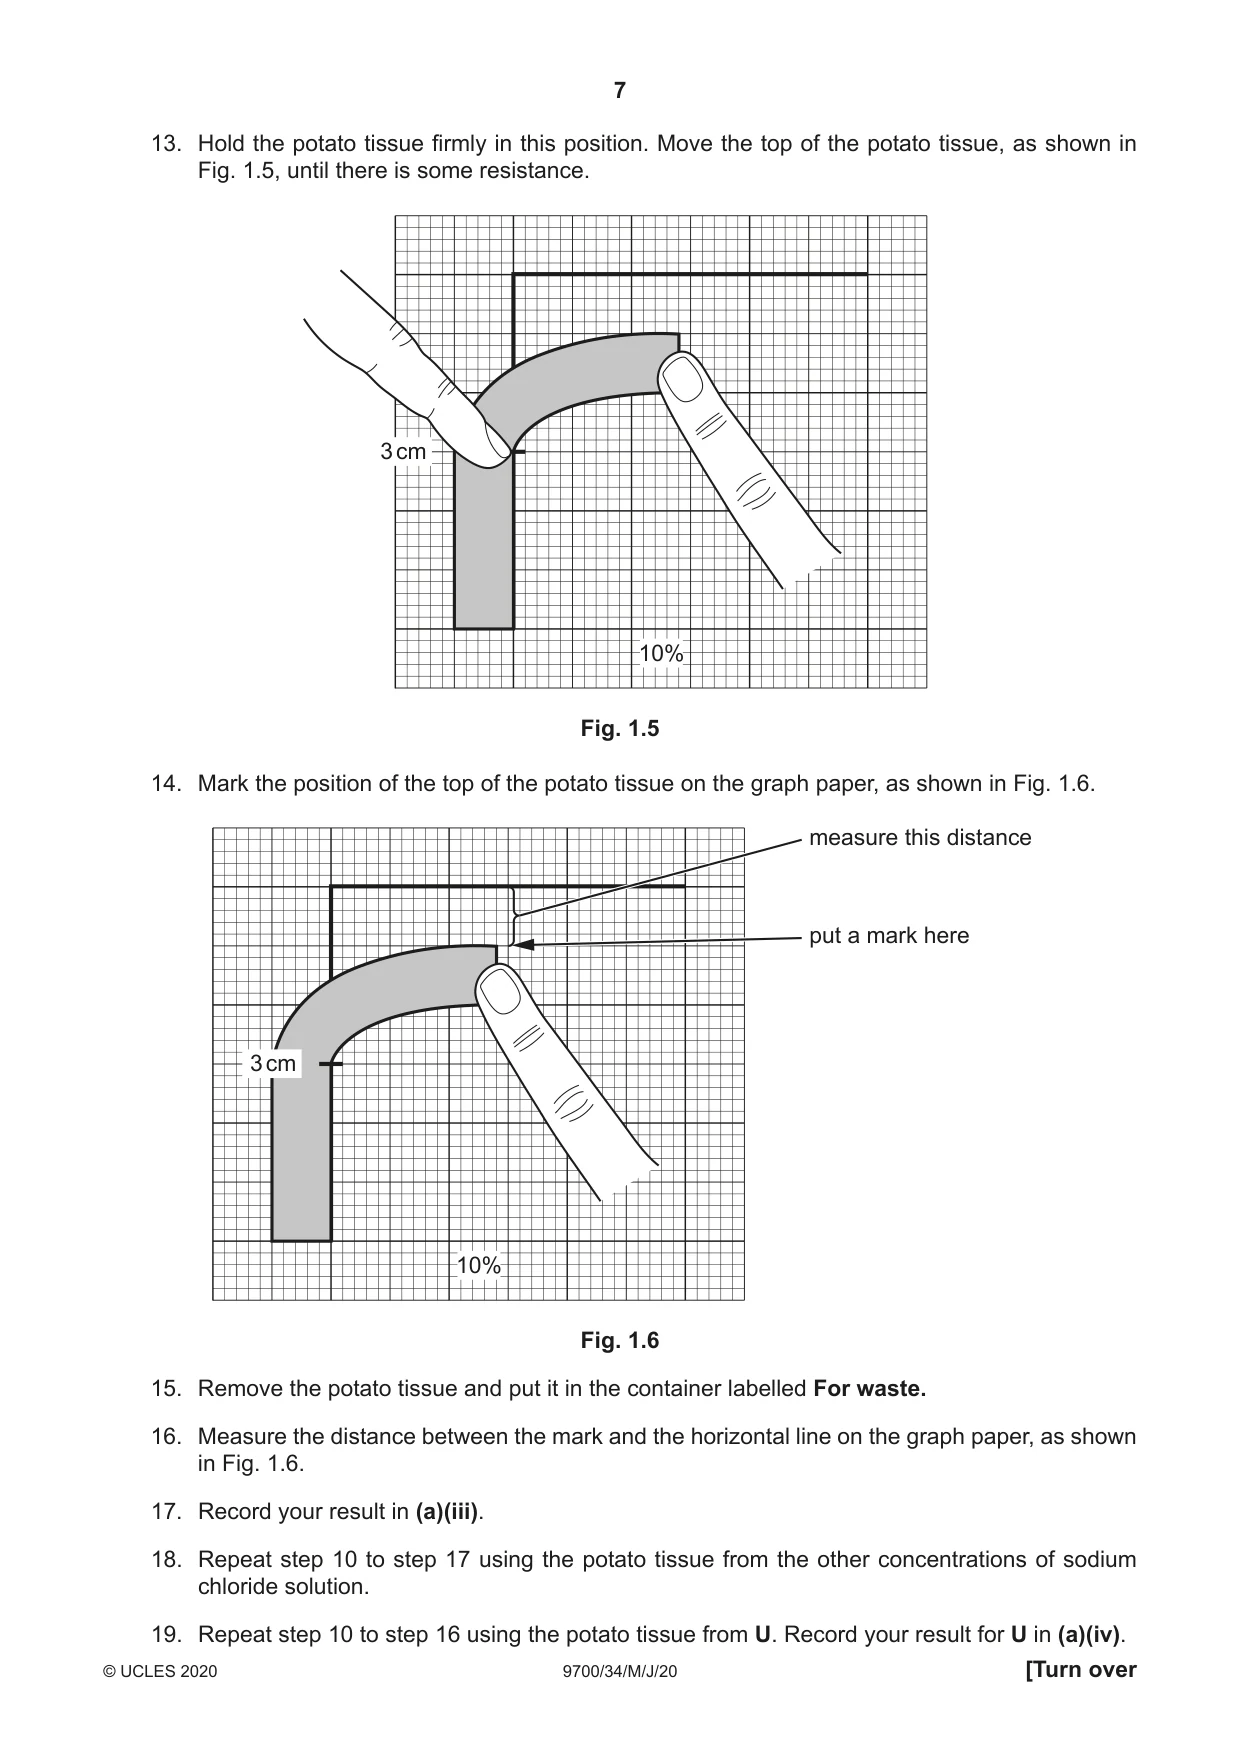
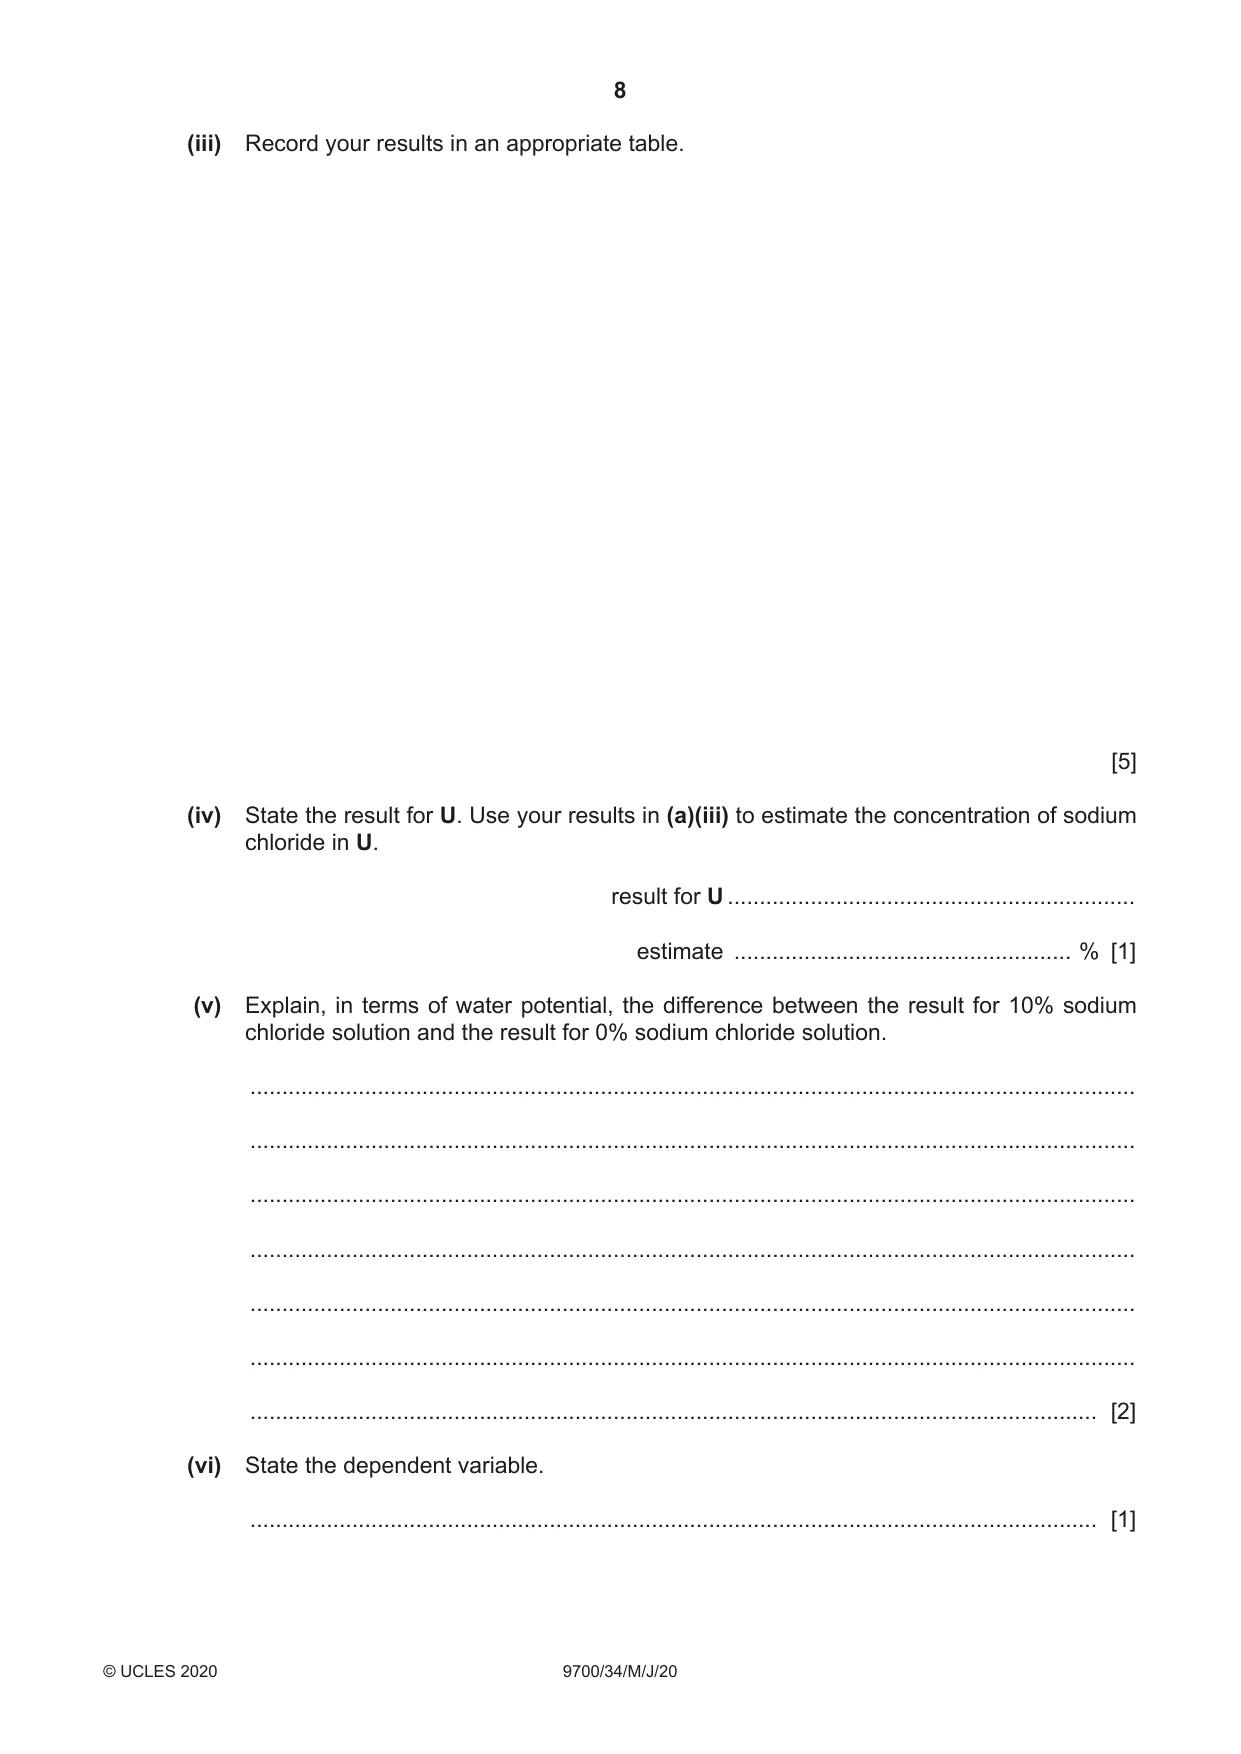
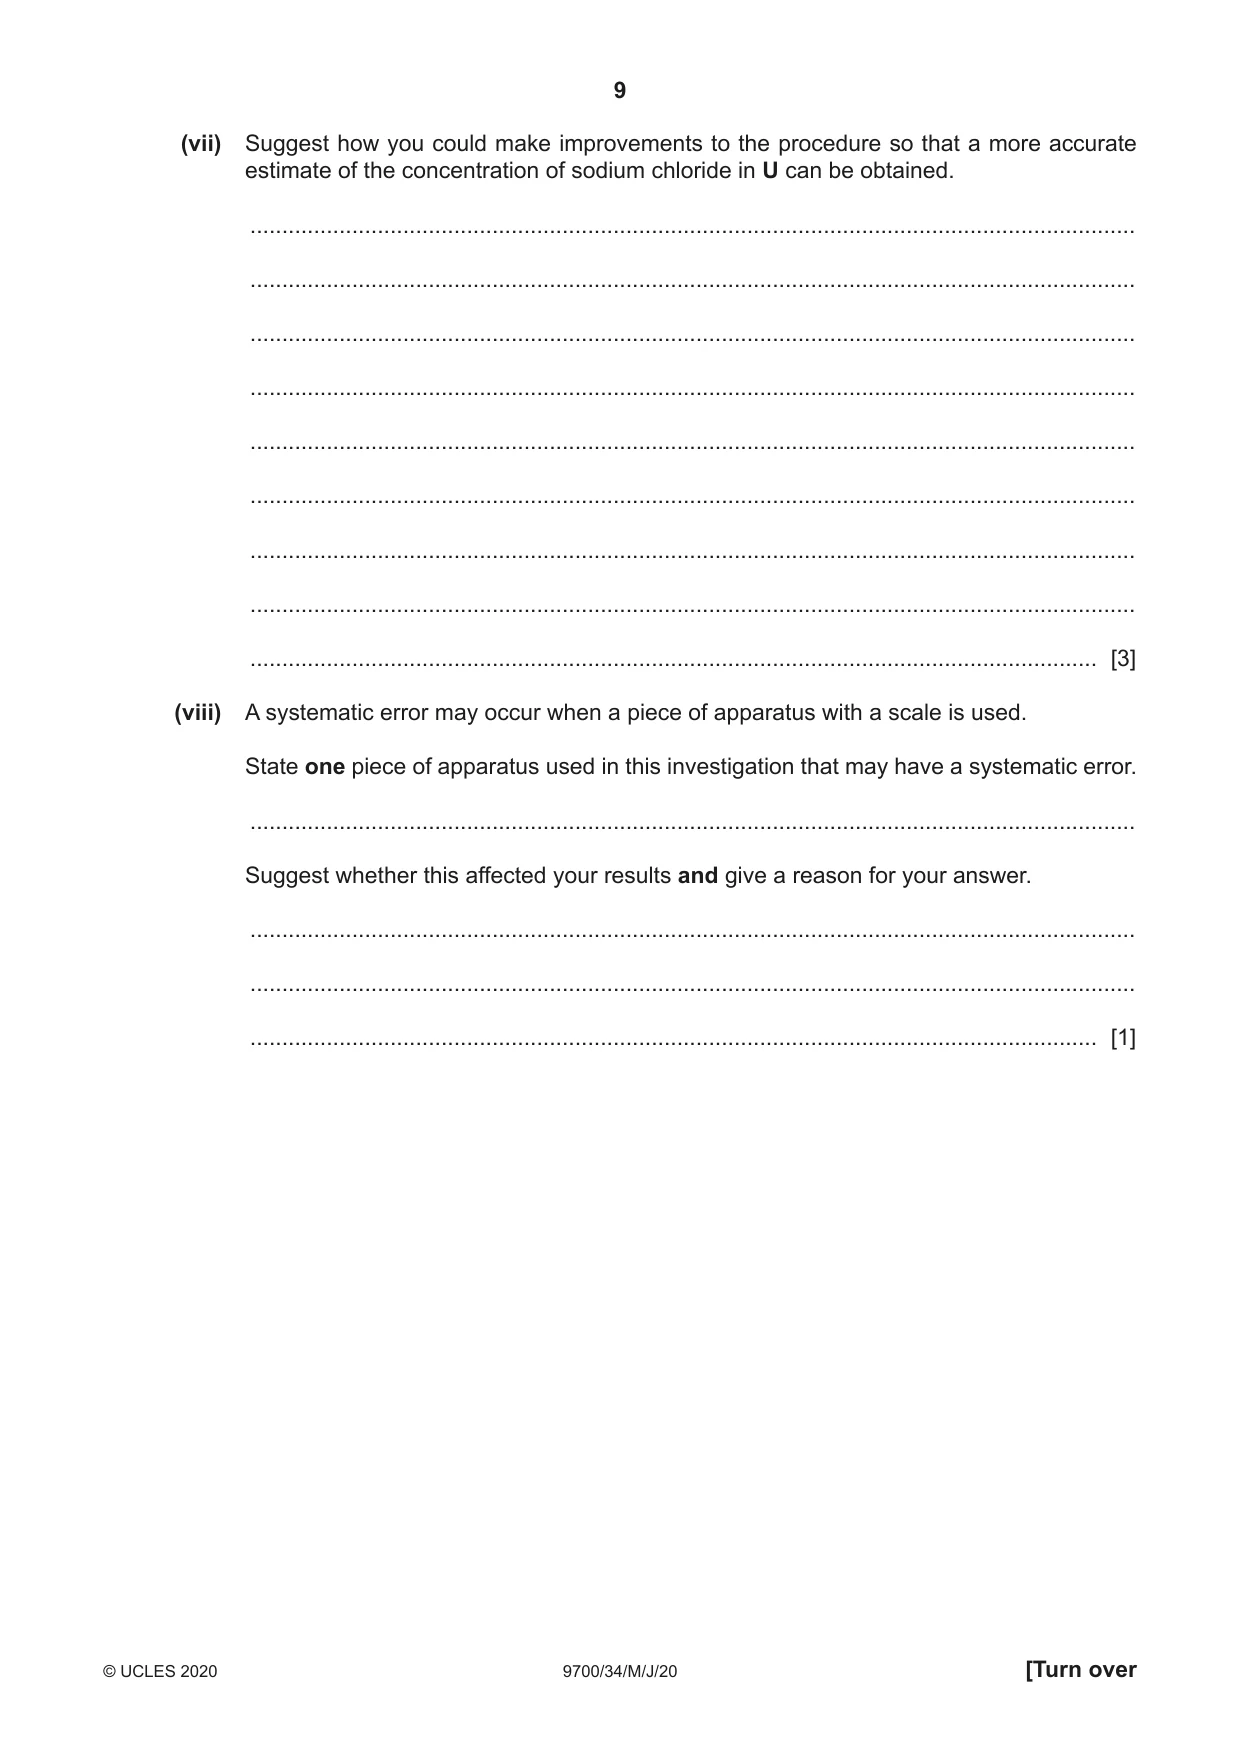
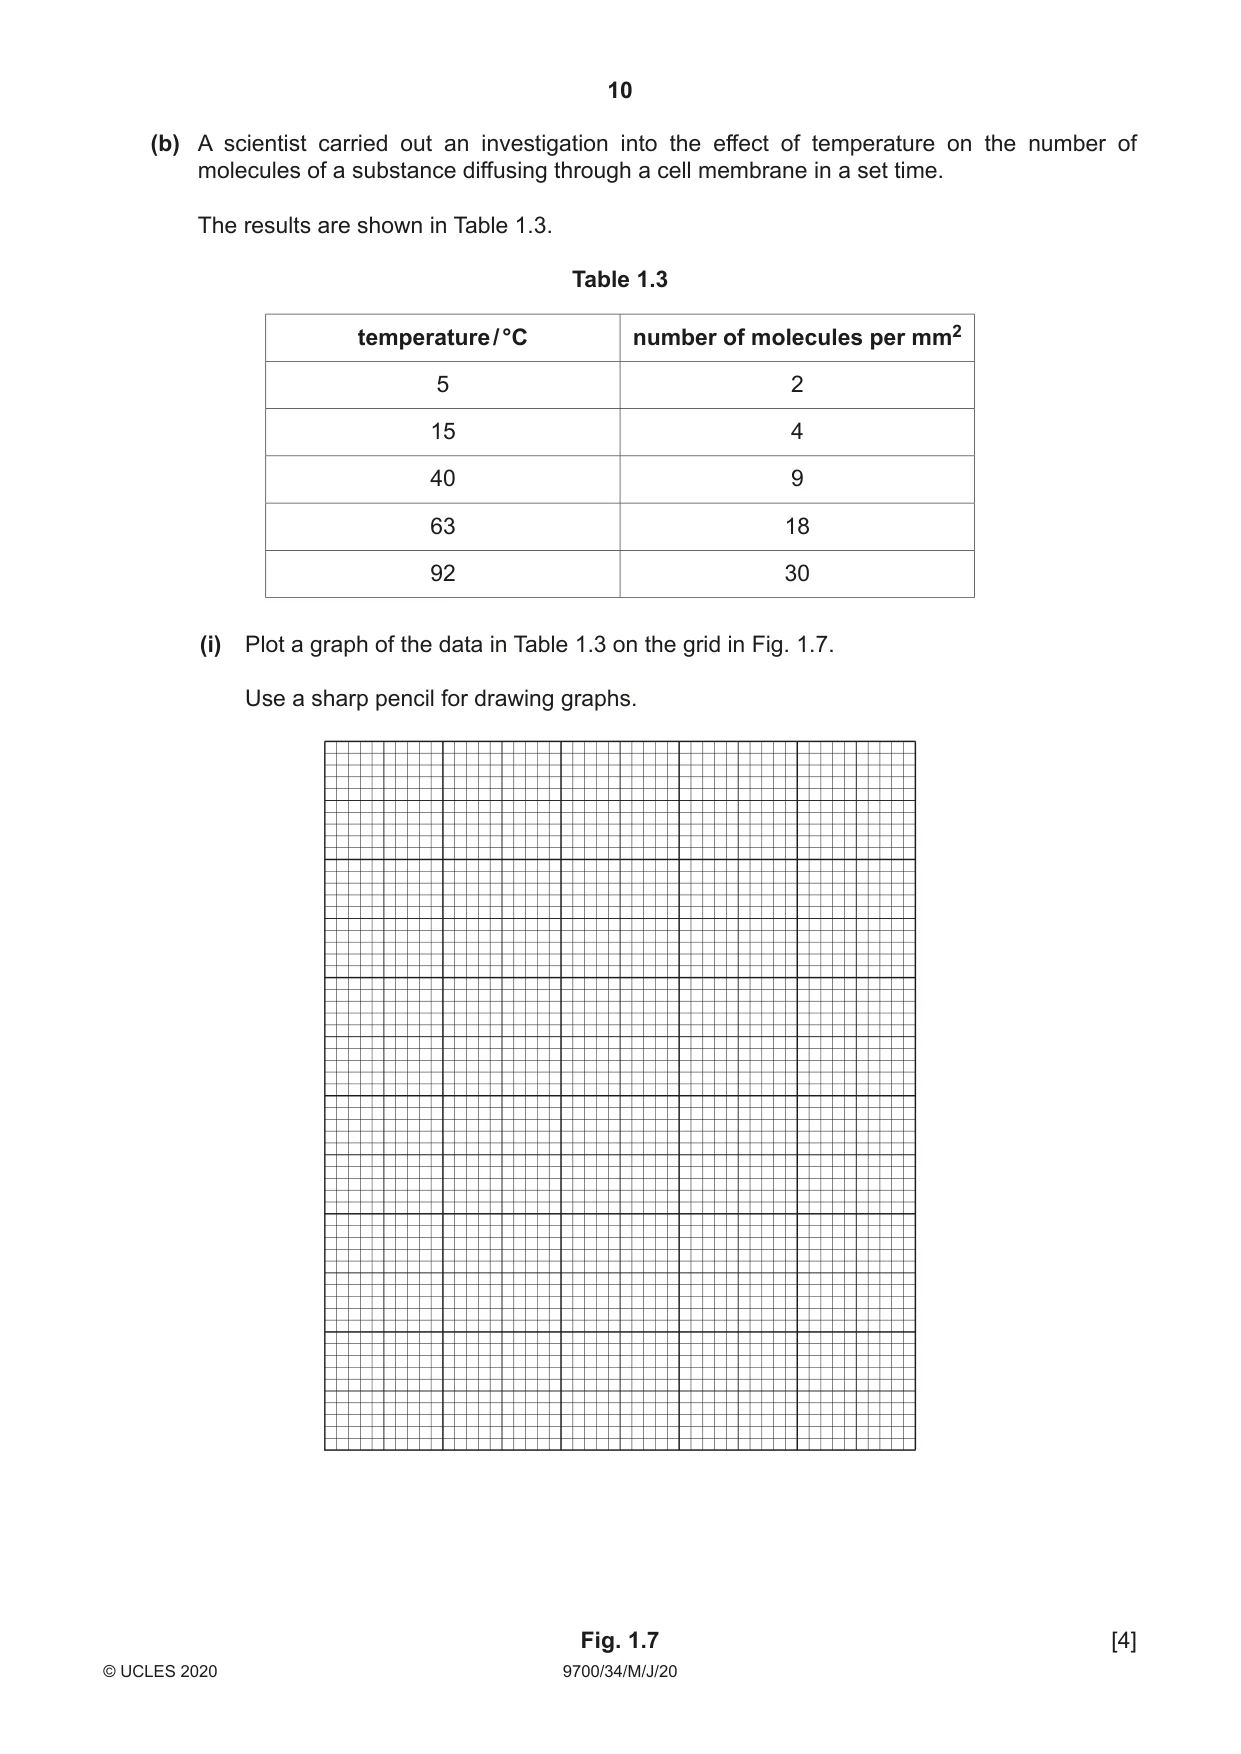
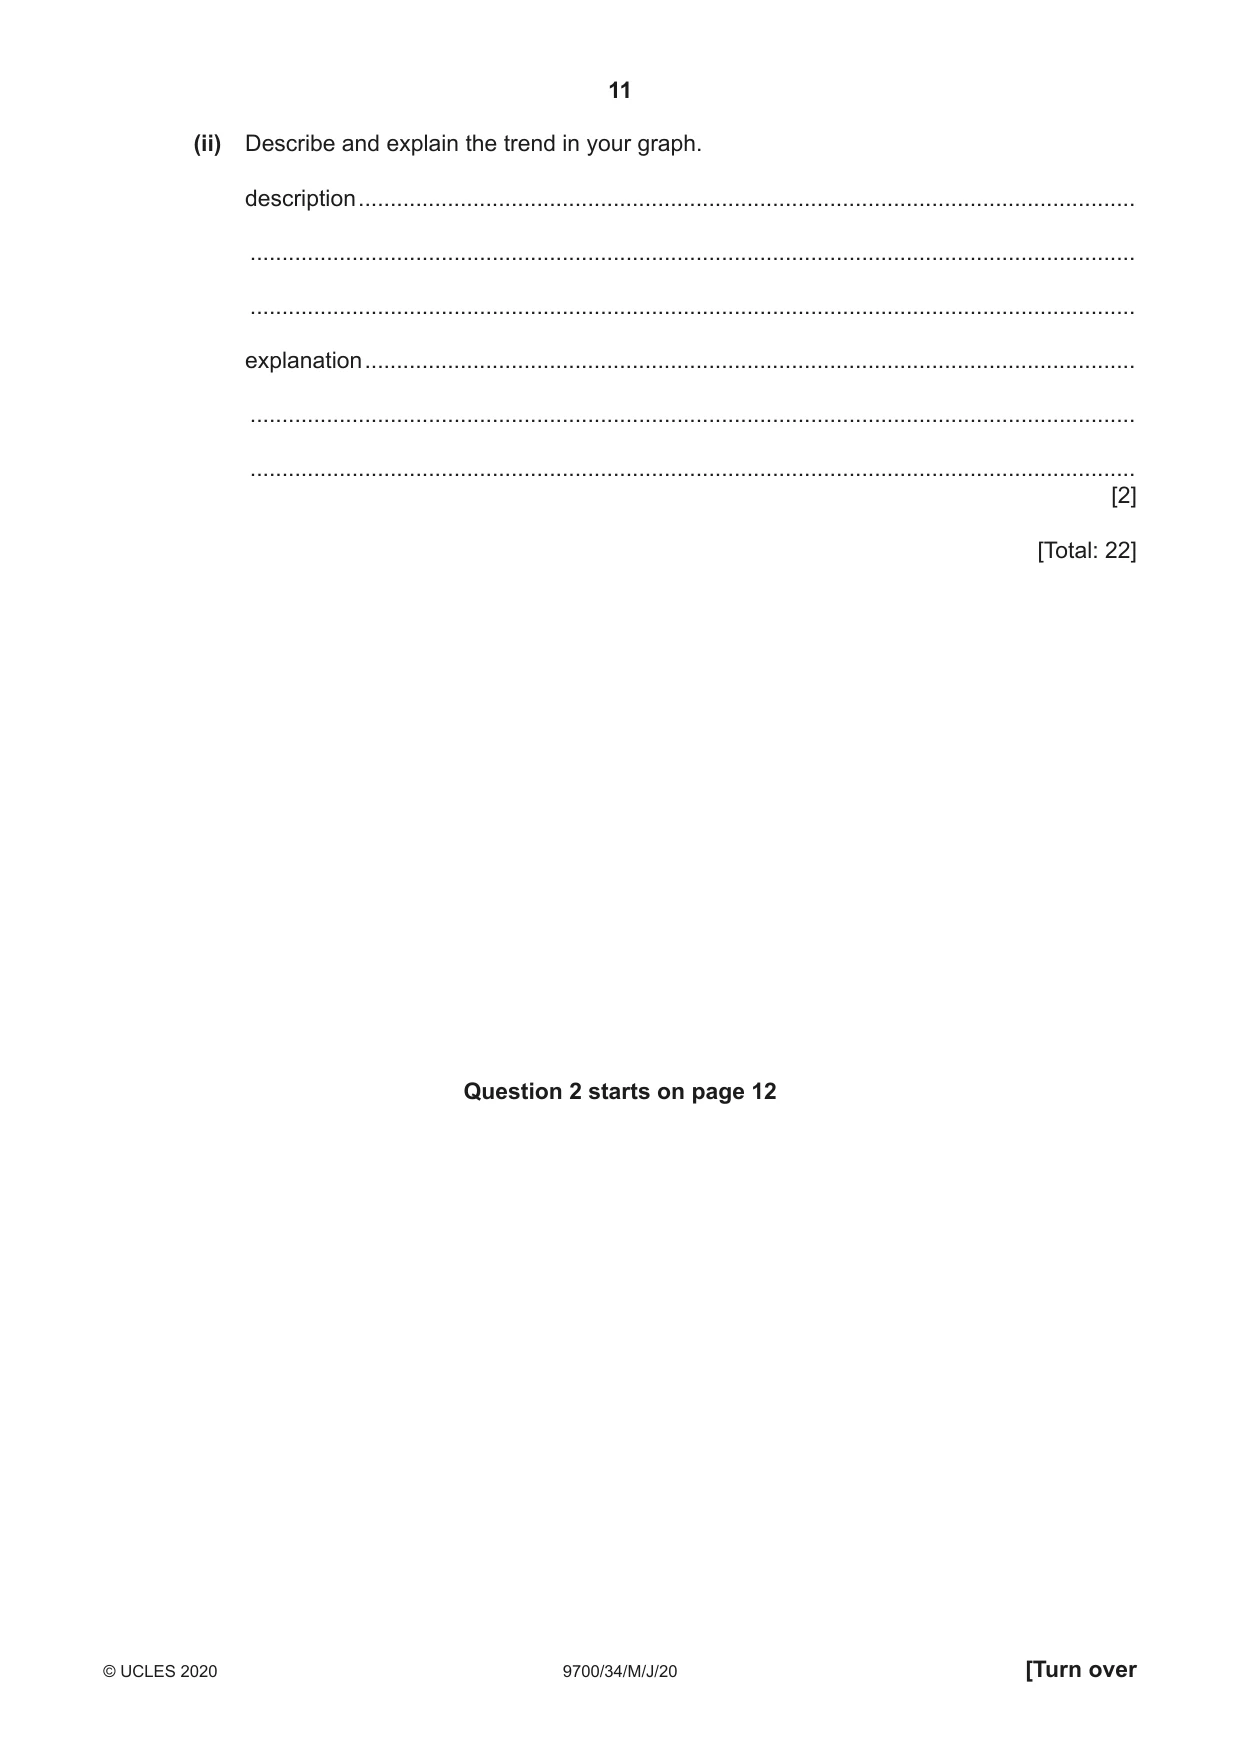
1 When potato cells are placed into different concentrations of sodium chloride solution, water moves between the sodium chloride solution and the potato cells. You will investigate the effect of different concentrations of sodium chloride solution on potato tissue. You will need to: • prepare different concentrations of sodium chloride solution, S • put potato tissue into the different concentrations of sodium chloride solution • record the distance the potato tissue bends • use your results to estimate the concentration of an unknown concentration of sodium chloride solution, U. You are provided with the materials shown in Table 1.1. Table 1.1 labelled contents hazard volume / cm3 P 7 pieces of potato tissue none – S 10% sodium chloride solution none 200 U unknown concentration of sodium chloride none 50 W distilled water none 200 It is recommended that you wear suitable eye protection. (a) You will need to prepare different concentrations of sodium chloride solution, using proportional dilution. You will need to prepare 50 cm3 of each concentration, using S and W. Table 1.2 shows how to make up two of the concentrations of sodium chloride solution you will use. Decide which other concentrations of sodium chloride solution you will use. (i) Complete Table 1.2 to show how you will prepare the concentrations of sodium chloride solution you will use. Table 1.2 percentage concentration volume of S / cm3 volume of W / cm3 of sodium chloride 10 50 0 0 0 50 [2] 1. Prepare the concentrations of sodium chloride solution as shown in Table 1.2, in the beakers provided. Mix well. 2. Label the Petri dishes with the concentrations of sodium chloride solution prepared in step 1. 3. Label another Petri dish U. 4. Put a piece of potato tissue into each of the Petri dishes you have labelled. You will need to cover the piece of potato tissue in each Petri dish with the appropriate sodium chloride solution prepared in step 1, as shown in Fig. 1.1. sodium chloride solution covers the piece of potato Petri dish tissue piece of potato tissue Fig. 1.1 (ii) Decide the volume of sodium chloride solution you will use to cover the piece of potato tissue. State the volume of sodium chloride solution you will use. volume ......................................................... [1] 5. Put the volume of each concentration of sodium chloride solution you have decided in (a)(ii) into the appropriately labelled Petri dish. 6. Repeat step 5 using U. 7. Leave the pieces of potato tissue in the sodium chloride solutions for 20 minutes. While you are waiting, use your time to continue with Question 1. You will use graph paper to measure how far the pieces of potato tissue bend after being left for 20 minutes in the sodium chloride solutions. Fig. 1.2 shows how you will prepare the graph paper, as described in step 8 and step 9. top edge of left side of graph paper graph paper 3 cm 3 cm 10% 0% Fig. 1.2 8. On the graph paper provided, draw two lines at right angles to each other, as shown in Fig. 1.2. Each line should be approximately 6 cm long. Draw a mark on the vertical line 3 cm below where the vertical line meets the horizontal line, as shown in Fig. 1.2. 9. On the same piece of graph paper repeat step 8 for each of the other concentrations of sodium chloride solution and for U. 10. After 20 minutes (step 7) remove the piece of potato tissue from the 10% sodium chloride solution and put it onto a paper towel to remove the excess liquid. 11. Put the piece of potato tissue on the vertical line of the graph paper, as shown in Fig. 1.3. potato tissue 10% Fig. 1.3 12. Put your finger on the middle of the potato tissue at the 3 cm mark and press firmly, as shown in Fig. 1.4. 3 cm 10% Fig. 1.4 13. Hold the potato tissue firmly in this position. Move the top of the potato tissue, as shown in Fig. 1.5, until there is some resistance. 3 cm 10% Fig. 1.5 14. Mark the position of the top of the potato tissue on the graph paper, as shown in Fig. 1.6. measure this distance put a mark here 3 cm 10% Fig. 1.6 15. Remove the potato tissue and put it in the container labelled For waste. 16. Measure the distance between the mark and the horizontal line on the graph paper, as shown in Fig. 1.6. 17. Record your result in (a)(iii). 18. Repeat step 10 to step 17 using the potato tissue from the other concentrations of sodium chloride solution. 19. Repeat step 10 to step 16 using the potato tissue from U. Record your result for U in (a)(iv). (iii) Record your results in an appropriate table. [5] (iv) State the result for U. Use your results in (a)(iii) to estimate the concentration of sodium chloride in U. result for U ................................................................ estimate ..................................................... % [1] (v) Explain, in terms of water potential, the difference between the result for 10% sodium chloride solution and the result for 0% sodium chloride solution. ........................................................................................................................................... ........................................................................................................................................... ........................................................................................................................................... ........................................................................................................................................... ........................................................................................................................................... ........................................................................................................................................... ..................................................................................................................................... [2] (vi) State the dependent variable. ..................................................................................................................................... [1] (vii) Suggest how you could make improvements to the procedure so that a more accurate estimate of the concentration of sodium chloride in U can be obtained. ........................................................................................................................................... ........................................................................................................................................... ........................................................................................................................................... ........................................................................................................................................... ........................................................................................................................................... ........................................................................................................................................... ........................................................................................................................................... ........................................................................................................................................... ..................................................................................................................................... [3] (viii) A systematic error may occur when a piece of apparatus with a scale is used. State one piece of apparatus used in this investigation that may have a systematic error. ........................................................................................................................................... Suggest whether this affected your results and give a reason for your answer. ........................................................................................................................................... ........................................................................................................................................... ..................................................................................................................................... [1] (b) A scientist carried out an investigation into the effect of temperature on the number of molecules of a substance diffusing through a cell membrane in a set time. The results are shown in Table 1.3. Table 1.3 temperature / °C number of molecules per mm2 5 2 15 4 40 9 63 18 92 30 (i) Plot a graph of the data in Table 1.3 on the grid in Fig. 1.7. Use a sharp pencil for drawing graphs. Fig. 1.7 [4] (ii) Describe and explain the trend in your graph. description .......................................................................................................................... ........................................................................................................................................... ........................................................................................................................................... explanation ......................................................................................................................... ........................................................................................................................................... ........................................................................................................................................... [2] [Total: 22] Question 2 starts on page 12
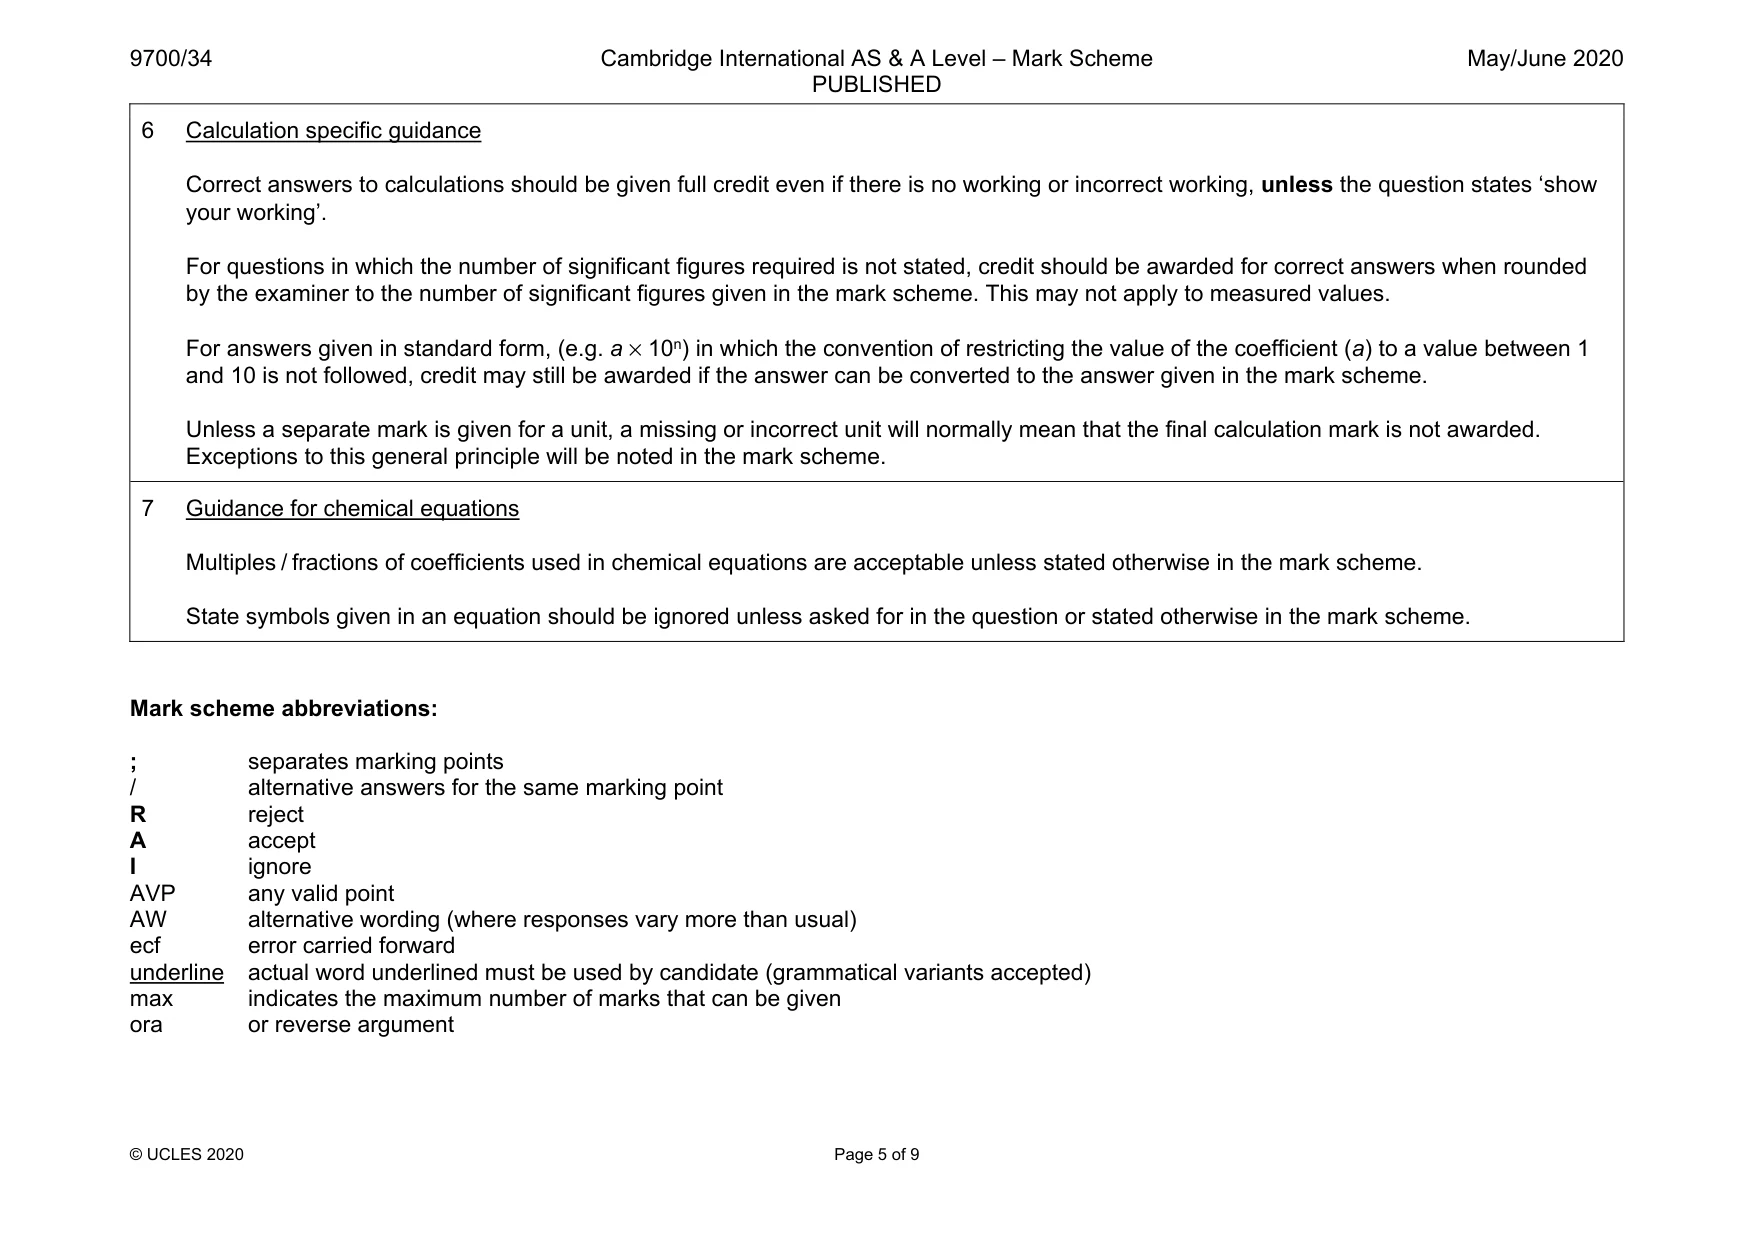
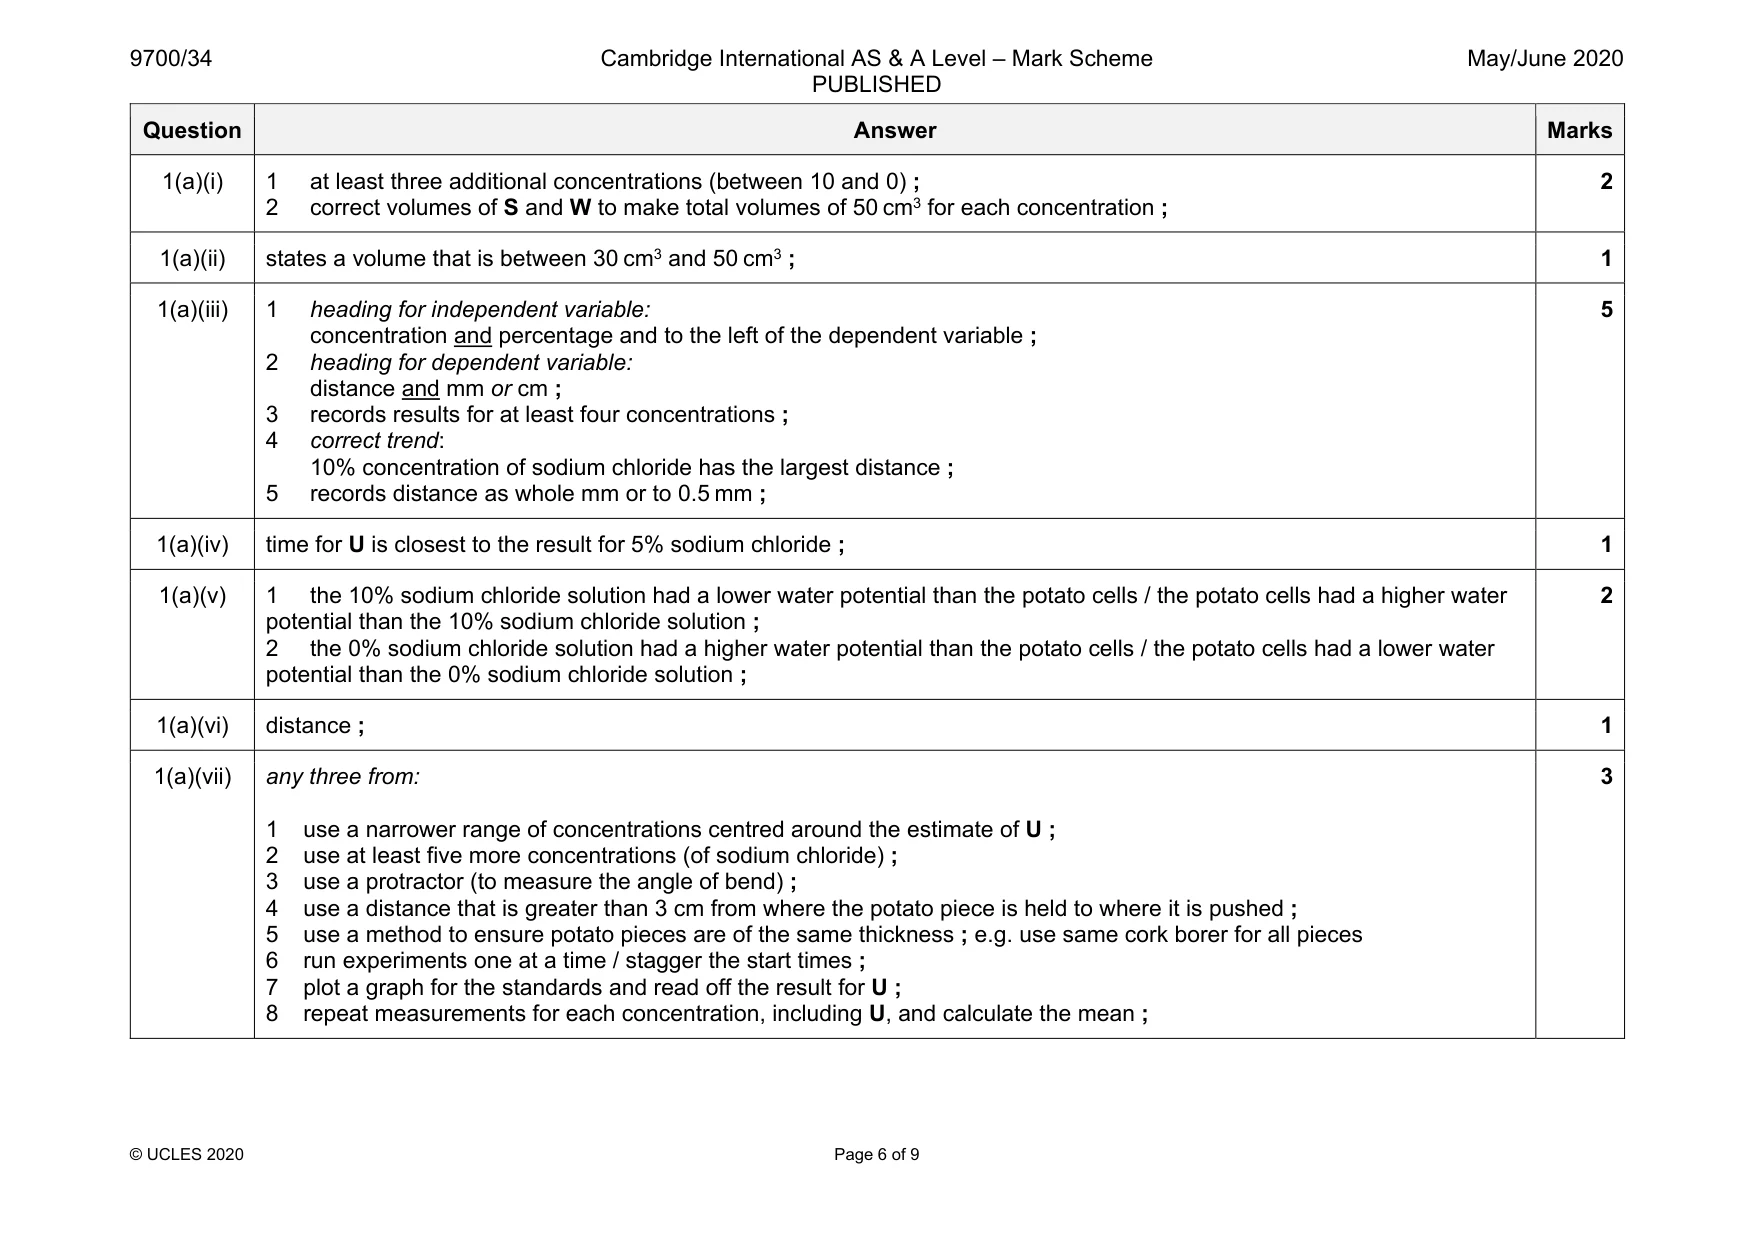
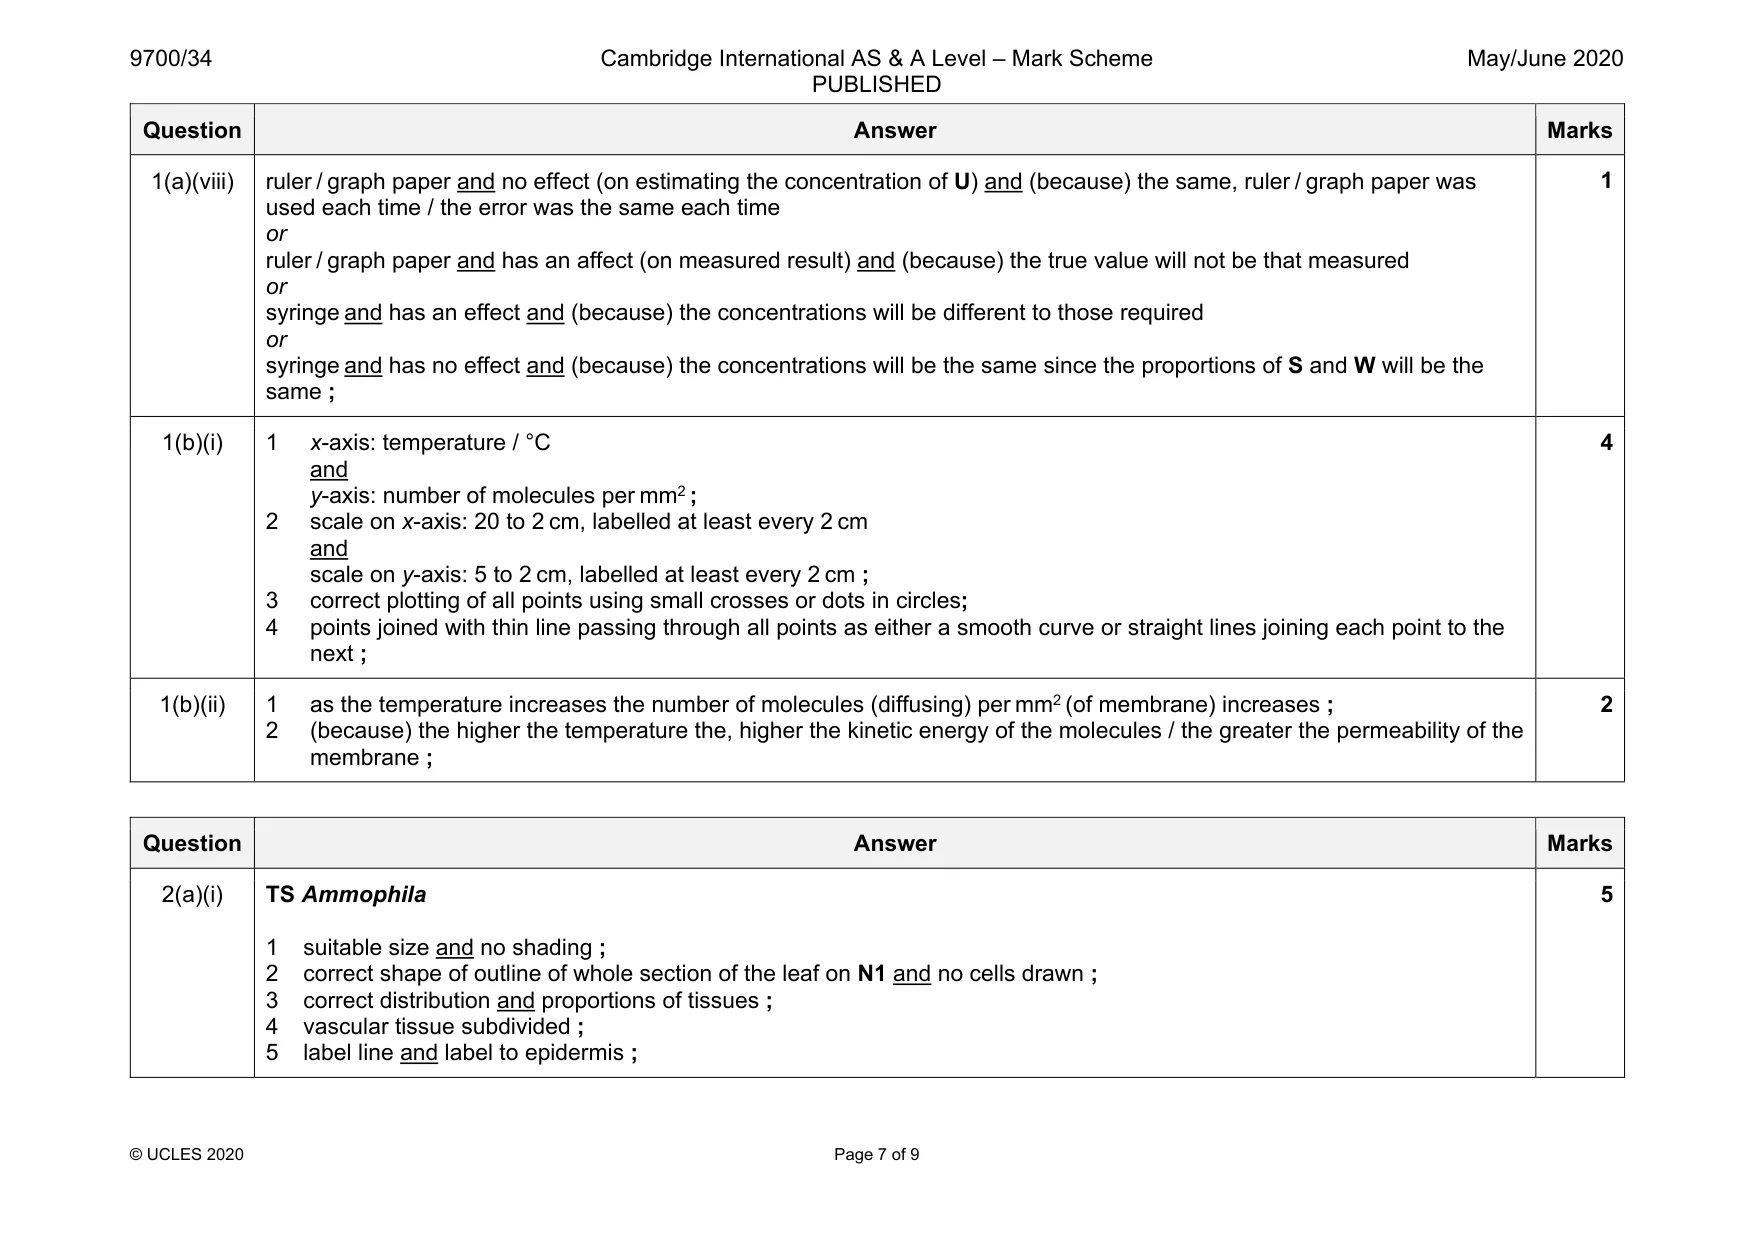
Mark scheme: 1(a)(i) 1 at least three additional concentrations (between 10 and 0) ; 2 correct volumes of S and W to make total volumes of 50 cm3 for each concentration ; 2 1(a)(ii) states a volume that is between 30 cm3 and 50 cm3 ; 1 1(a)(iii) 1 heading for independent variable: concentration and percentage and to the left of the dependent variable ; 2 heading for dependent variable: distance and mm or cm ; 3 records results for at least four concentrations ; 4 correct trend: 10% concentration of sodium chloride has the largest distance ; 5 records distance as whole mm or to 0.5 mm ; 5 1(a)(iv) time for U is closest to the result for 5% sodium chloride ; 1 1(a)(v) 1 the 10% sodium chloride solution had a lower water potential than the potato cells / the potato cells had a higher water potential than the 10% sodium chloride solution ; 2 the 0% sodium chloride solution had a higher water potential than the potato cells / the potato cells had a lower water potential than the 0% sodium chloride solution ; 2 1(a)(vi) distance ; 1 1(a)(vii) any three from: 1 use a narrower range of concentrations centred around the estimate of U ; 2 use at least five more concentrations (of sodium chloride) ; 3 use a protractor (to measure the angle of bend) ; 4 use a distance that is greater than 3 cm from where the potato piece is held to where it is pushed ; 5 use a method to ensure potato pieces are of the same thickness ; e.g. use same cork borer for all pieces 6 run experiments one at a time / stagger the start times ; 7 plot a graph for the standards and read off the result for U ; 8 repeat measurements for each concentration, including U, and calculate the mean ; 3 Question Answer Marks 1(a)(viii) ruler / graph paper and no effect (on estimating the concentration of U) and (because) the same, ruler / graph paper was used each time / the error was the same each time or ruler / graph paper and has an affect (on measured result) and (because) the true value will not be that measured or syringe and has an effect and (because) the concentrations will be different to those required or syringe and has no effect and (because) the concentrations will be the same since the proportions of S and W will be the same ; 1 1(b)(i) 1 x-axis: temperature / °C and y-axis: number of molecules per mm2 ; 2 scale on x-axis: 20 to 2 cm, labelled at least every 2 cm and scale on y-axis: 5 to 2 cm, labelled at least every 2 cm ; 3 correct plotting of all points using small crosses or dots in circles; 4 points joined with thin line passing through all points as either a smooth curve or straight lines joining each point to the next ; 4 1(b)(ii) 1 as the temperature increases the number of molecules (diffusing) per mm2 (of membrane) increases ; 2 (because) the higher the temperature the, higher the kinetic energy of the molecules / the greater the permeability of the membrane ; 2
Q2 · N1 is a slide of a stained transverse section through a plant leaf
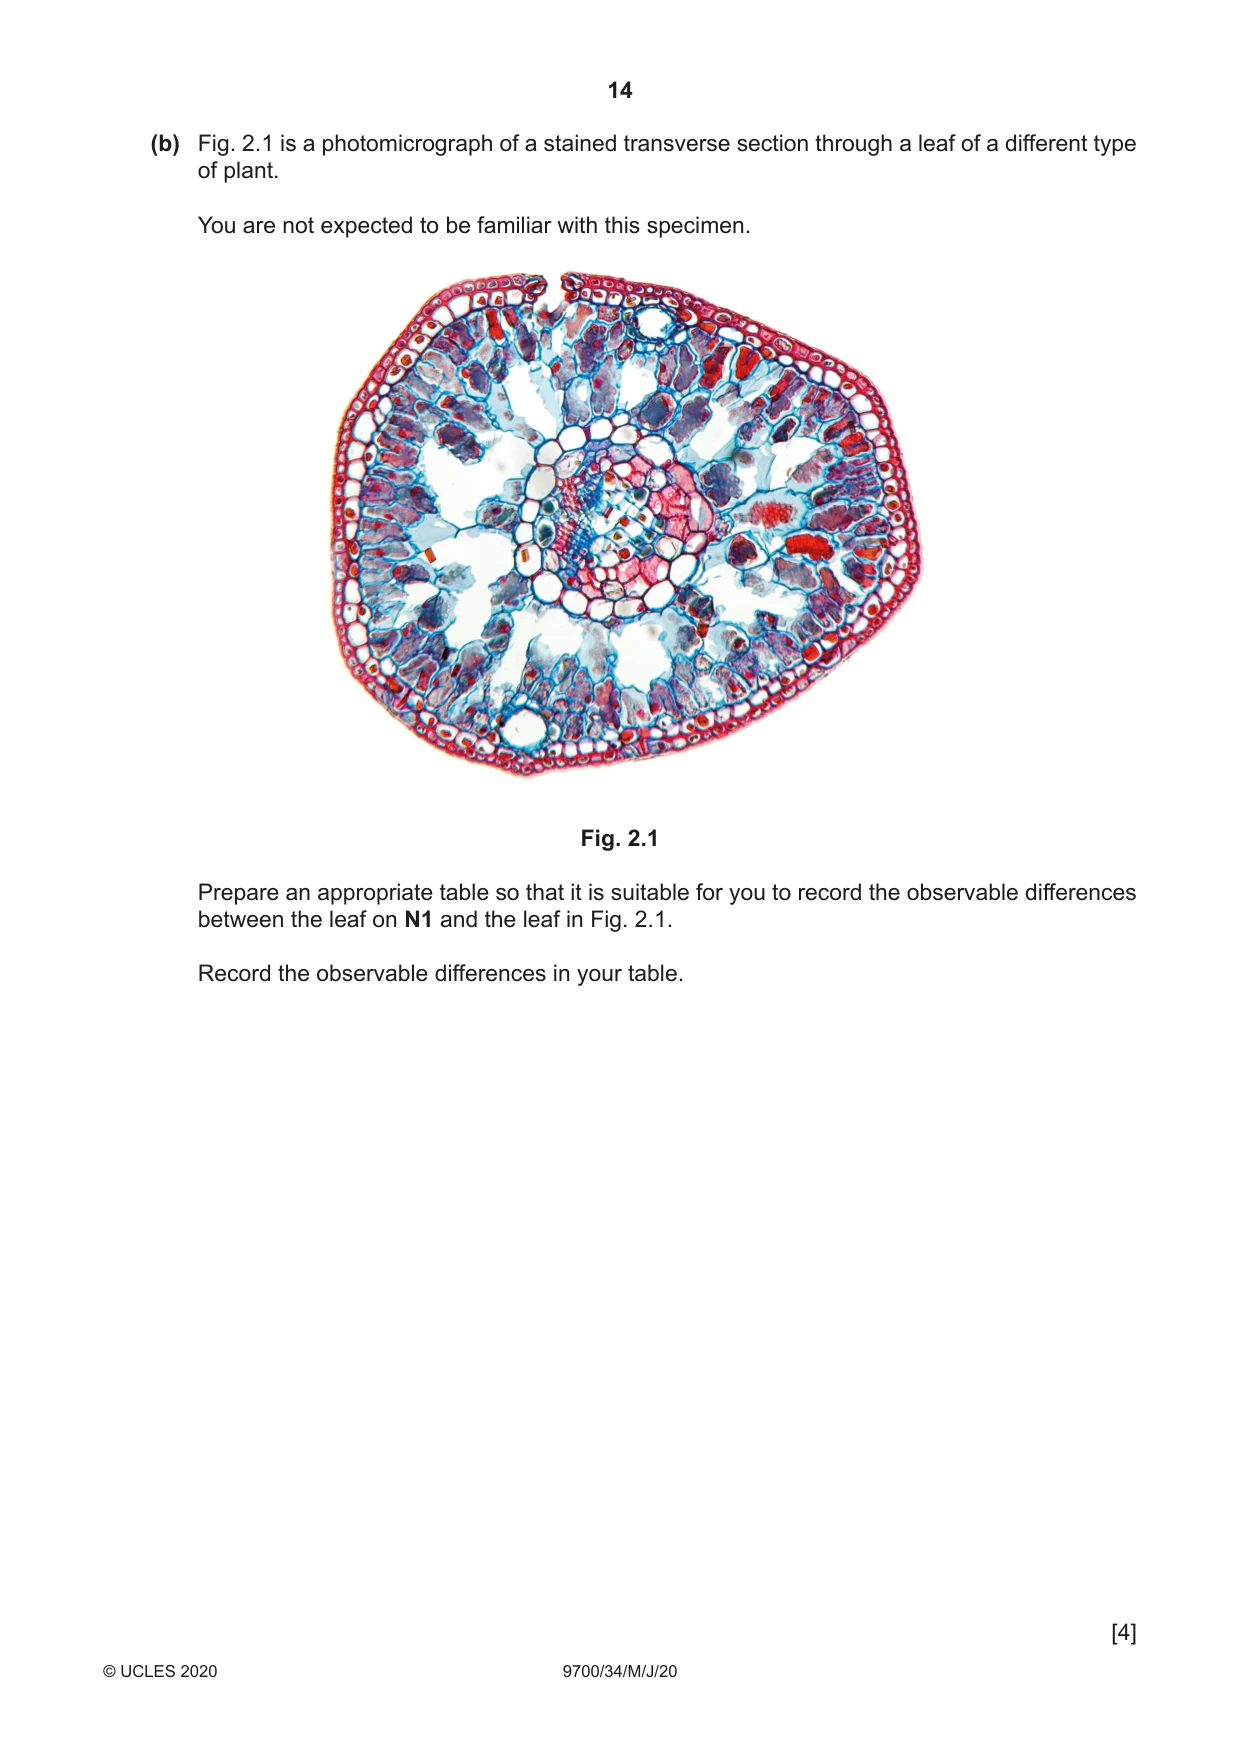
2 N1 is a slide of a stained transverse section through a plant leaf. You are not expected to be familiar with this specimen. Use a sharp pencil for drawing. You are expected to draw the correct shape and proportions of the different tissues. (a) (i) Draw a large plan diagram of the whole section of the leaf on N1. On your diagram: • ignore the trichomes (hair-like structures) • use one ruled label line and label to identify the epidermis. [5] (ii) Observe the epidermis with trichomes of the leaf on N1. Select three adjacent, touching, epidermal cells where only one cell has a trichome attached. Make a large drawing of these three epidermal cells and the attached trichome. Use one ruled label line and label to identify a cell wall of one cell. [5] (b) Fig. 2.1 is a photomicrograph of a stained transverse section through a leaf of a different type of plant. You are not expected to be familiar with this specimen. Fig. 2.1 Prepare an appropriate table so that it is suitable for you to record the observable differences between the leaf on N1 and the leaf in Fig. 2.1. Record the observable differences in your table.
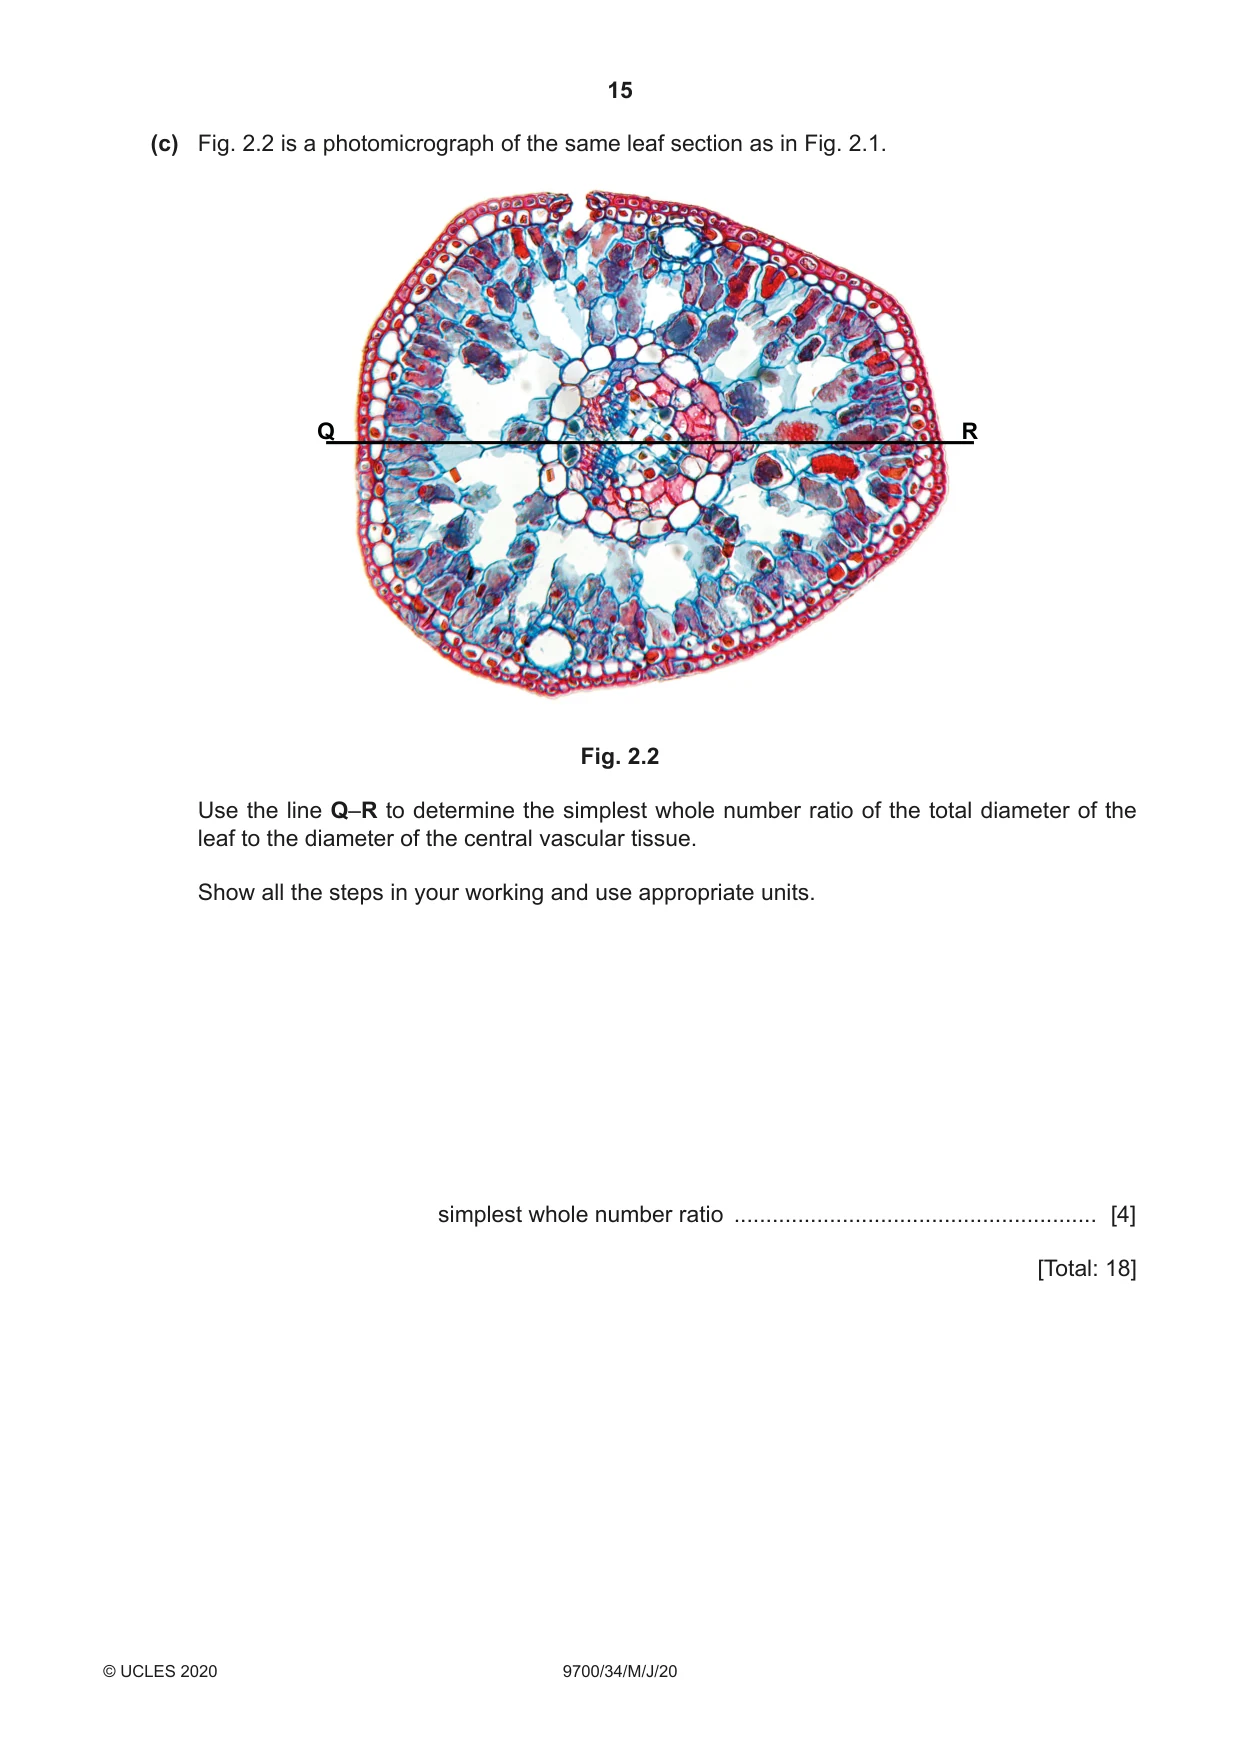
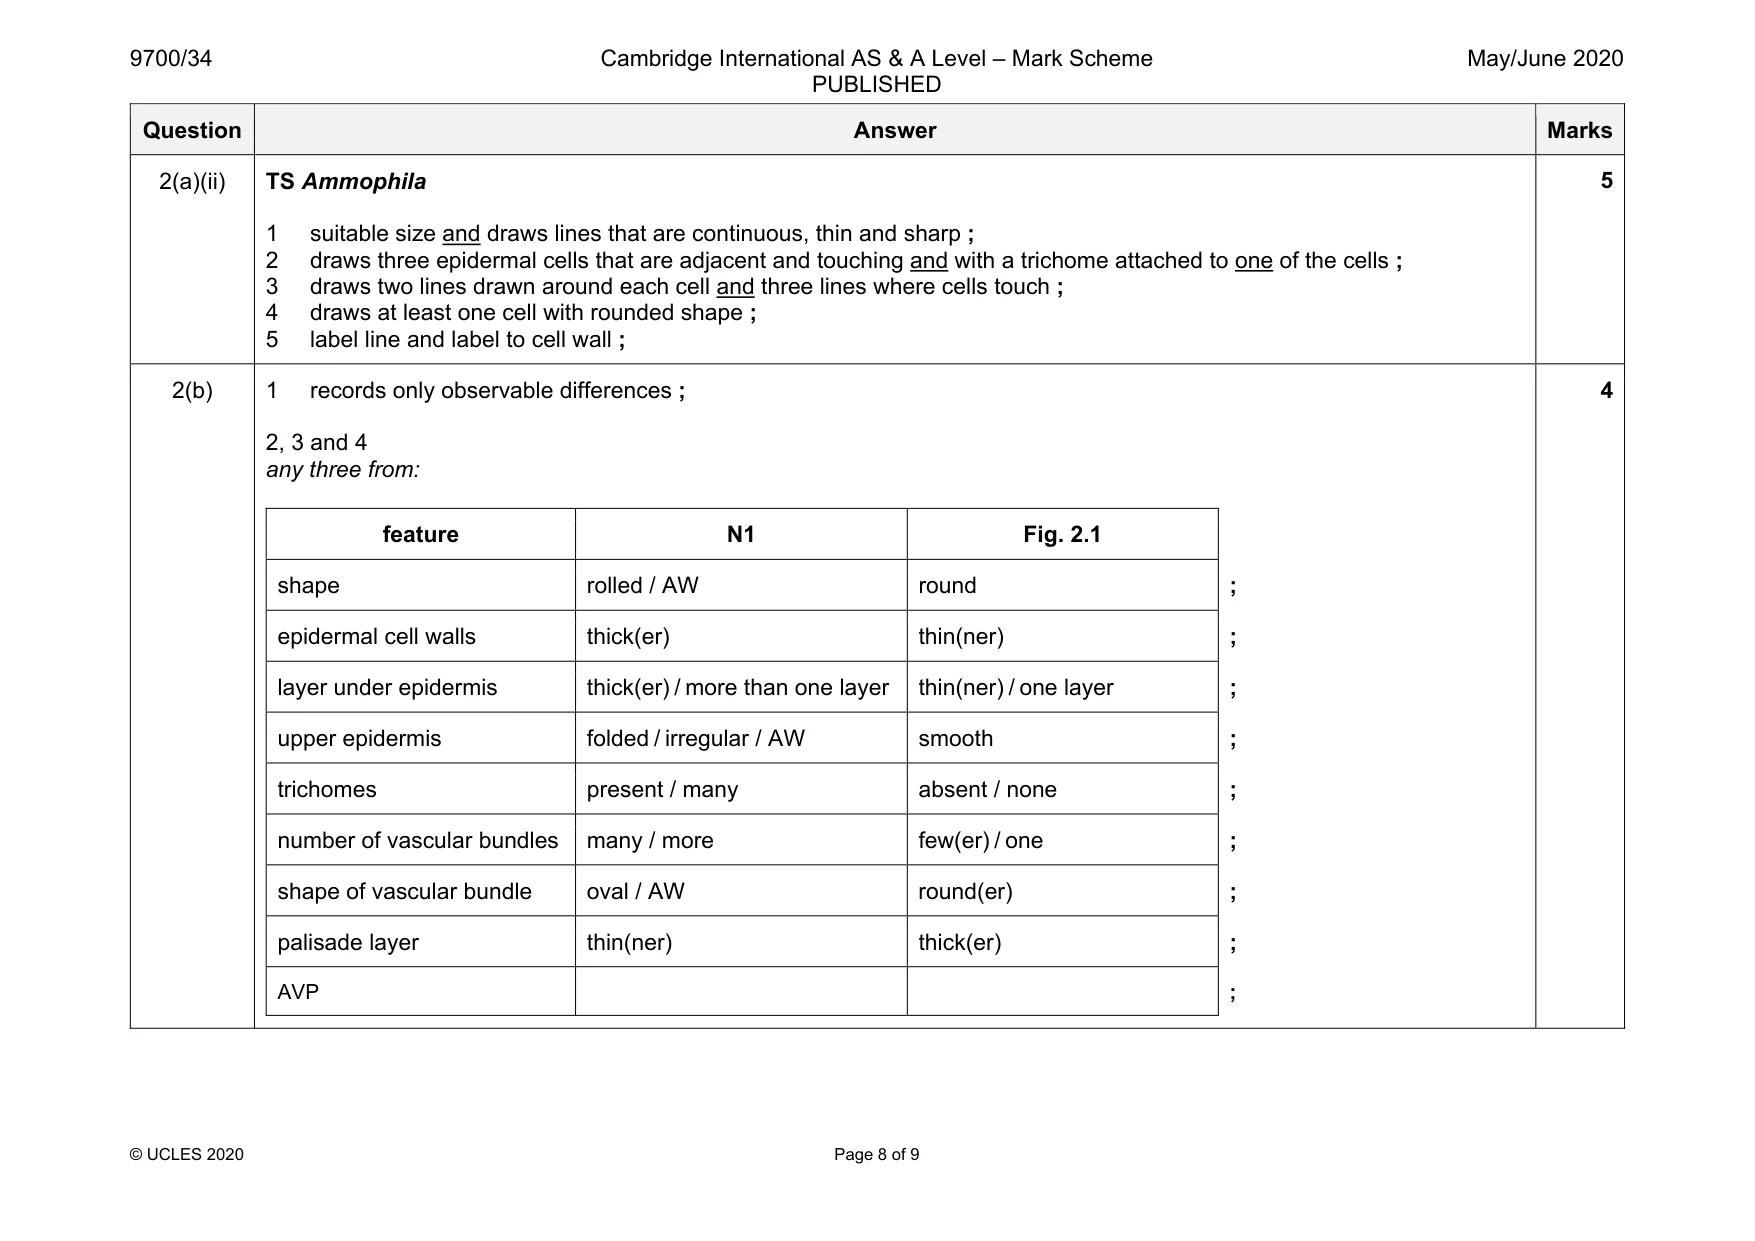
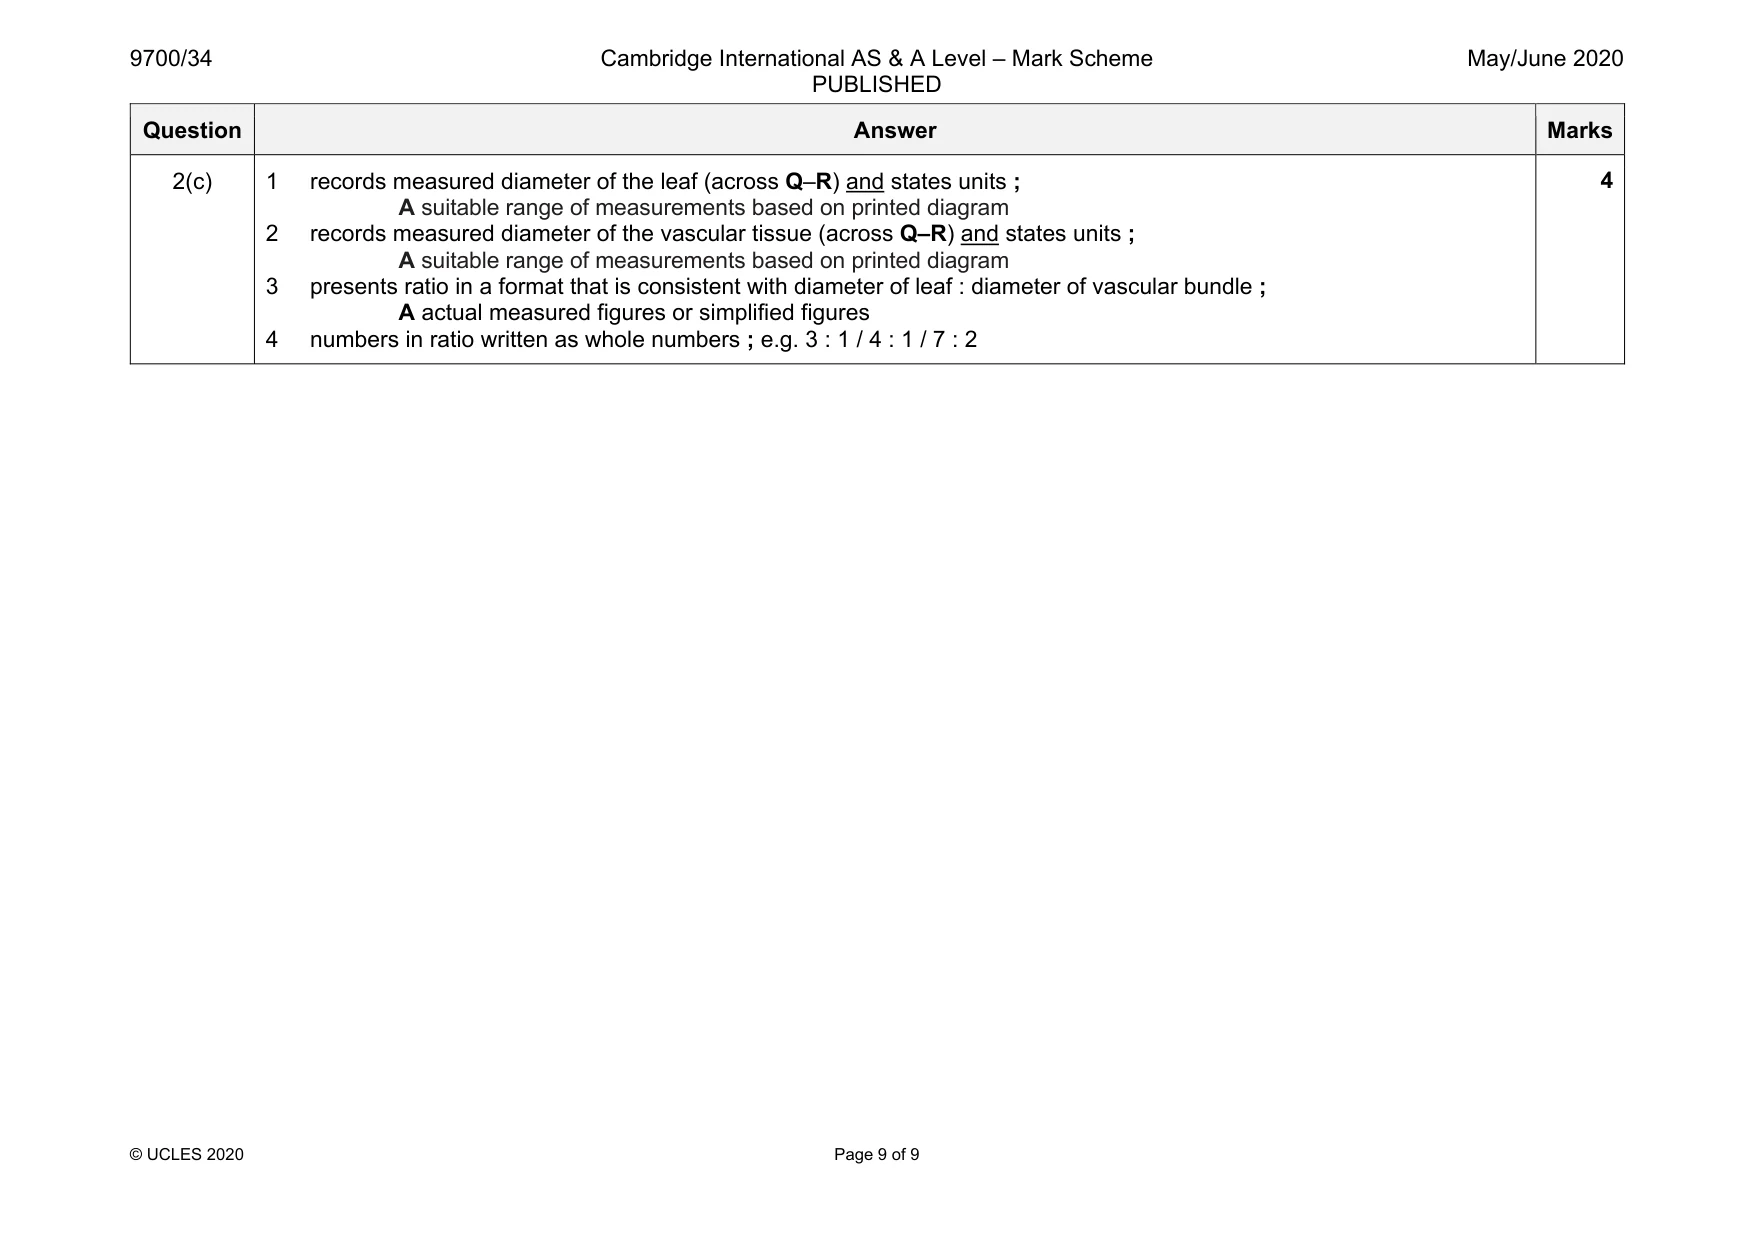
Mark scheme: 2(a)(i) TS Ammophila 1 suitable size and no shading ; 2 correct shape of outline of whole section of the leaf on N1 and no cells drawn ; 3 correct distribution and proportions of tissues ; 4 vascular tissue subdivided ; 5 label line and label to epidermis ; 5 Question Answer Marks 2(a)(ii) TS Ammophila 1 suitable size and draws lines that are continuous, thin and sharp ; 2 draws three epidermal cells that are adjacent and touching and with a trichome attached to one of the cells ; 3 draws two lines drawn around each cell and three lines where cells touch ; 4 draws at least one cell with rounded shape ; 5 label line and label to cell wall ; 5 2(b) 1 records only observable differences ; 2, 3 and 4 any three from: feature N1 Fig. 2.1 shape rolled / AW round ; epidermal cell walls thick(er) thin(ner) ; layer under epidermis thick(er) / more than one layer thin(ner) / one layer ; upper epidermis folded / irregular / AW smooth ; trichomes present / many absent / none ; number of vascular bundles many / more few(er) / one ; shape of vascular bundle oval / AW round(er) ; palisade layer thin(ner) thick(er) ; AVP ; 4 Question Answer Marks 2(c) 1 records measured diameter of the leaf (across Q–R) and states units ; A suitable range of measurements based on printed diagram 2 records measured diameter of the vascular tissue (across Q–R) and states units ; A suitable range of measurements based on printed diagram 3 presents ratio in a format that is consistent with diameter of leaf : diameter of vascular bundle ; A actual measured figures or simplified figures 4 numbers in ratio written as whole numbers ; e.g. 3 : 1 / 4 : 1 / 7 : 2 4
More questions on Cells as the basic units of living organisms
What was in this paper
The subtopics covered by these 2 questions, and how many questions each got. Open one in a new tab to see every Cambridge question on it.