Cambridge A Level Biology 9700 — 2020 May/June Paper 3 · Variant 2
9700/32/M/J/20 · 2 questions · 31 marks · ≈35 min
The question paper and its mark scheme, free to read here and free to download. This is Cambridge’s own paper, exactly as it was sat.
Question paper16 pages

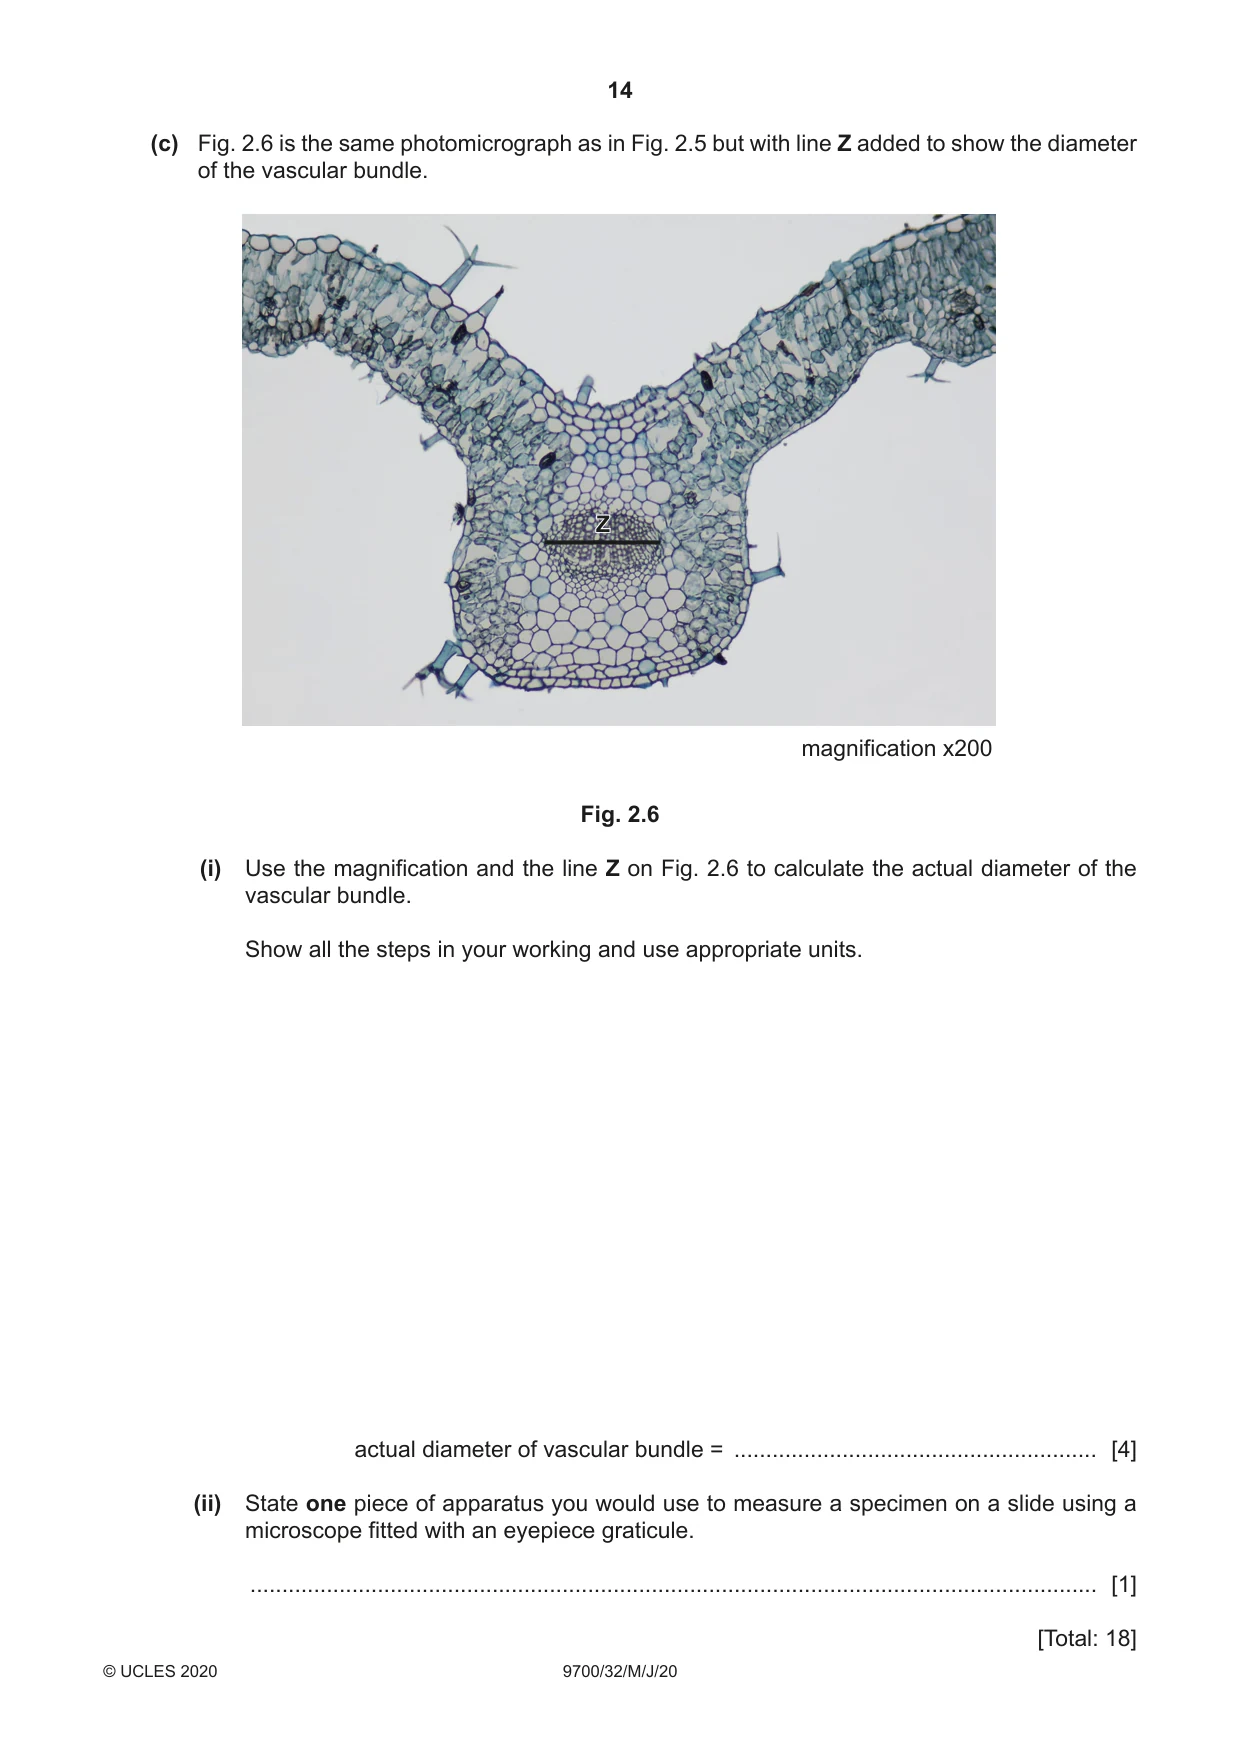


Mark scheme9 pages
Answers below. Sit the paper first if you are practising.
Questions as text
Q1 · When plant cells are placed into sodium chloride solution, osmosis occurs and water will…
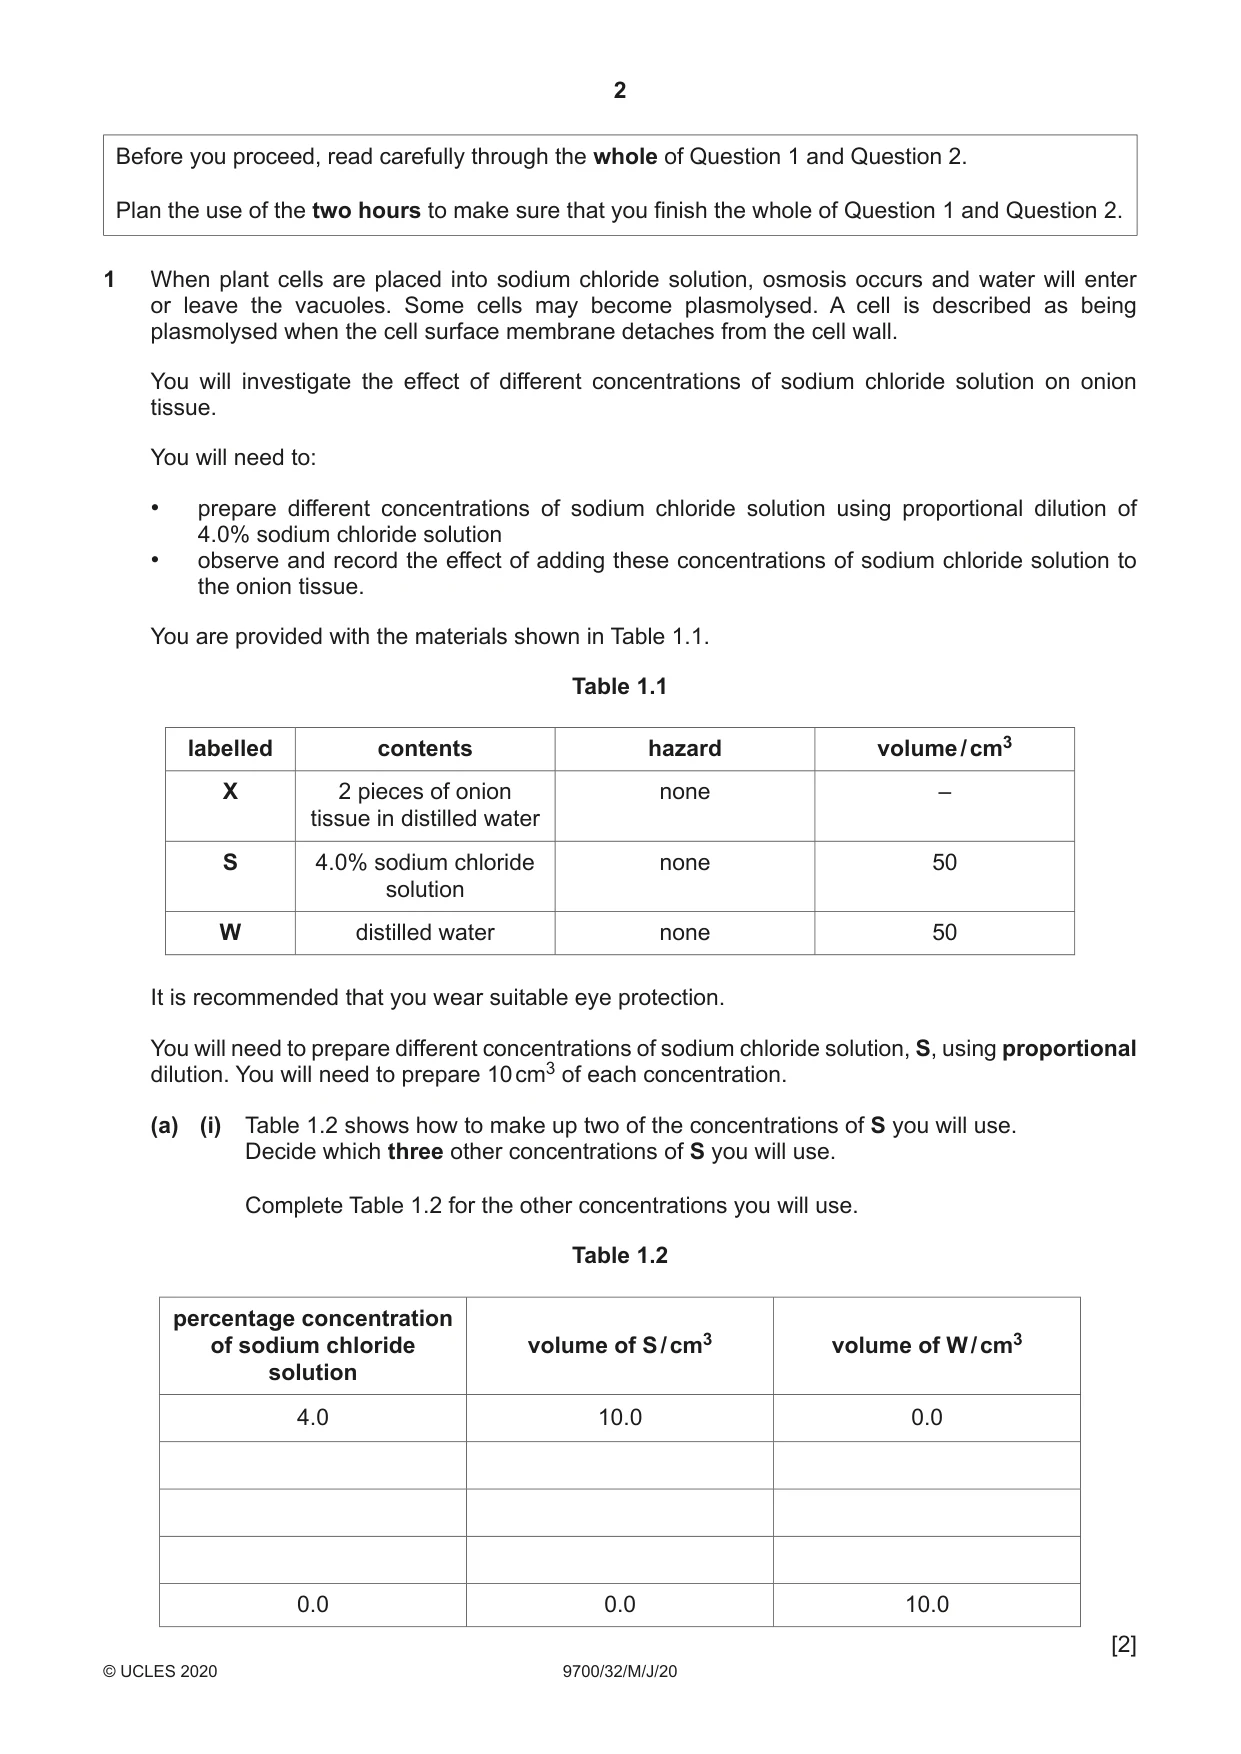
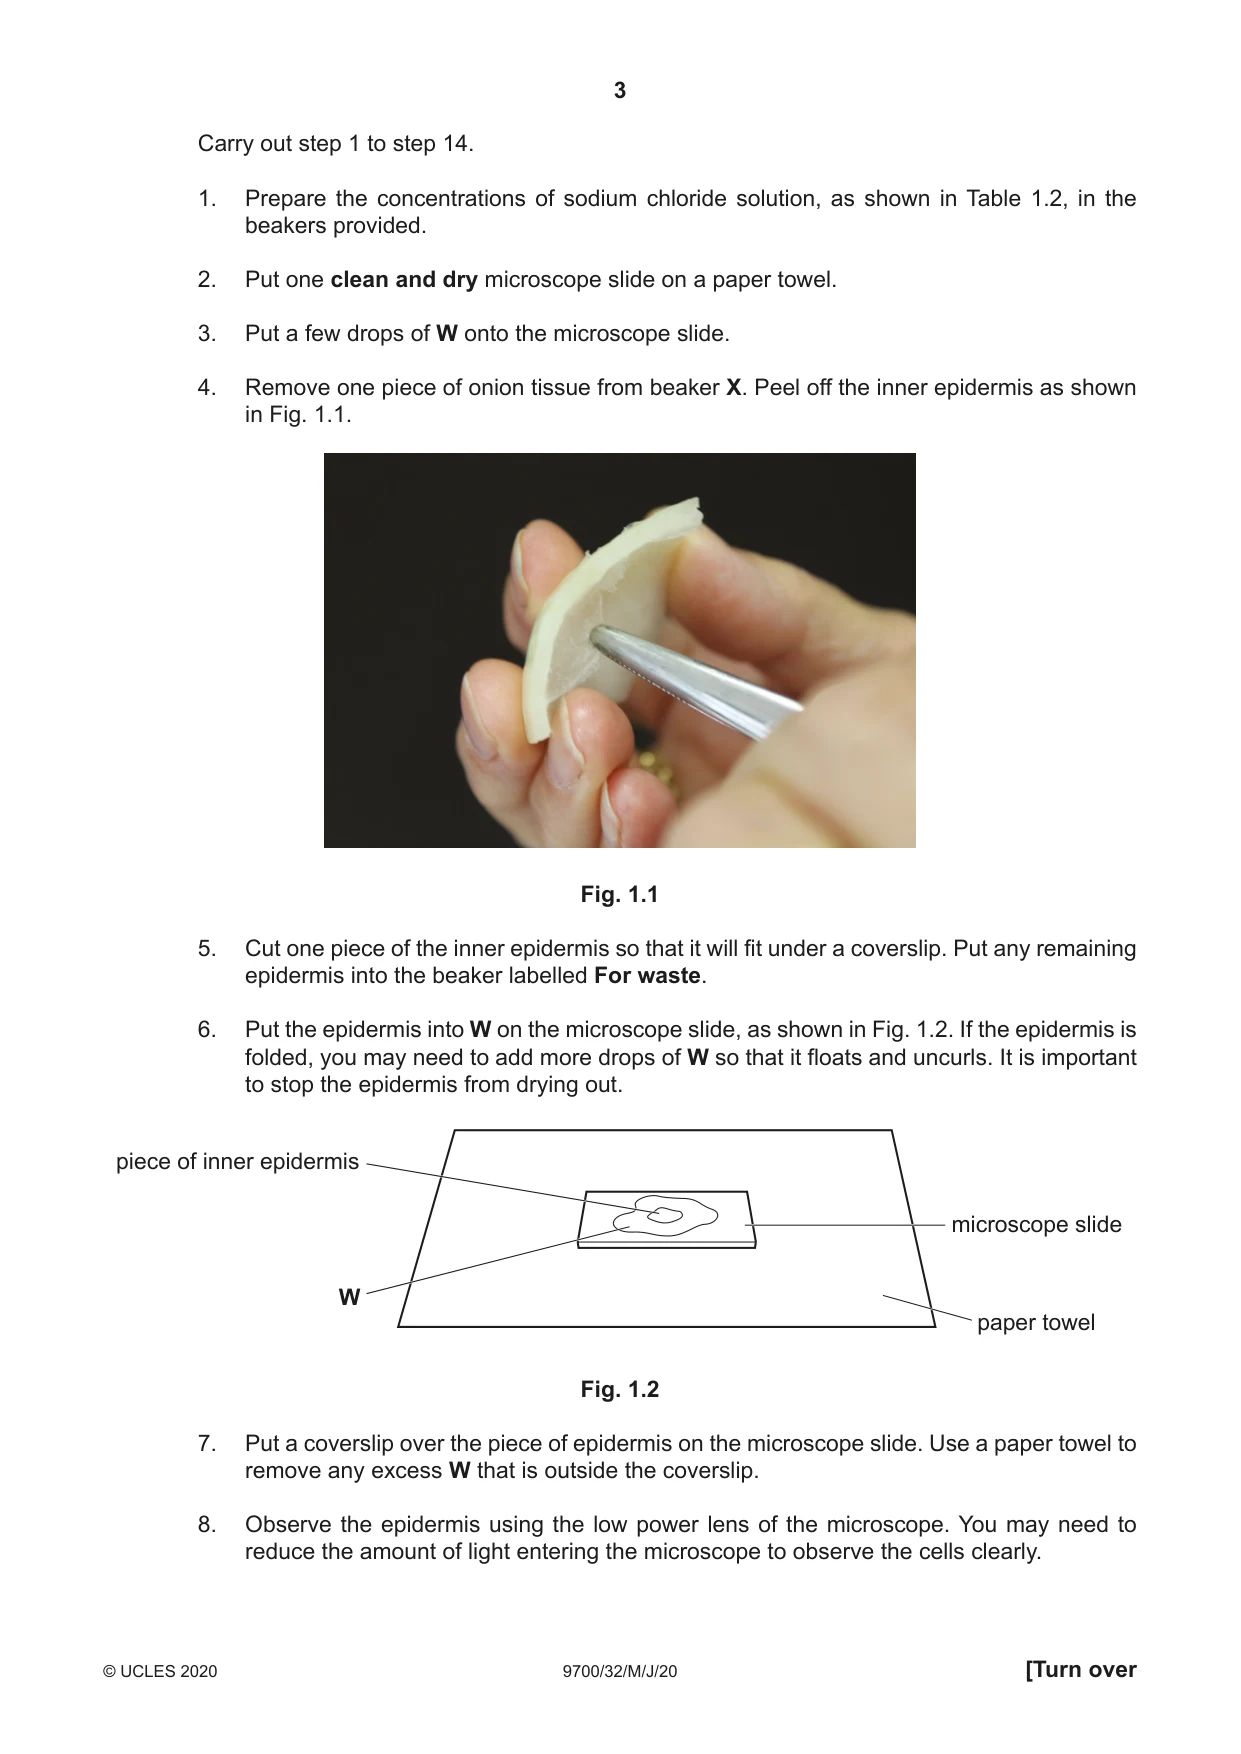
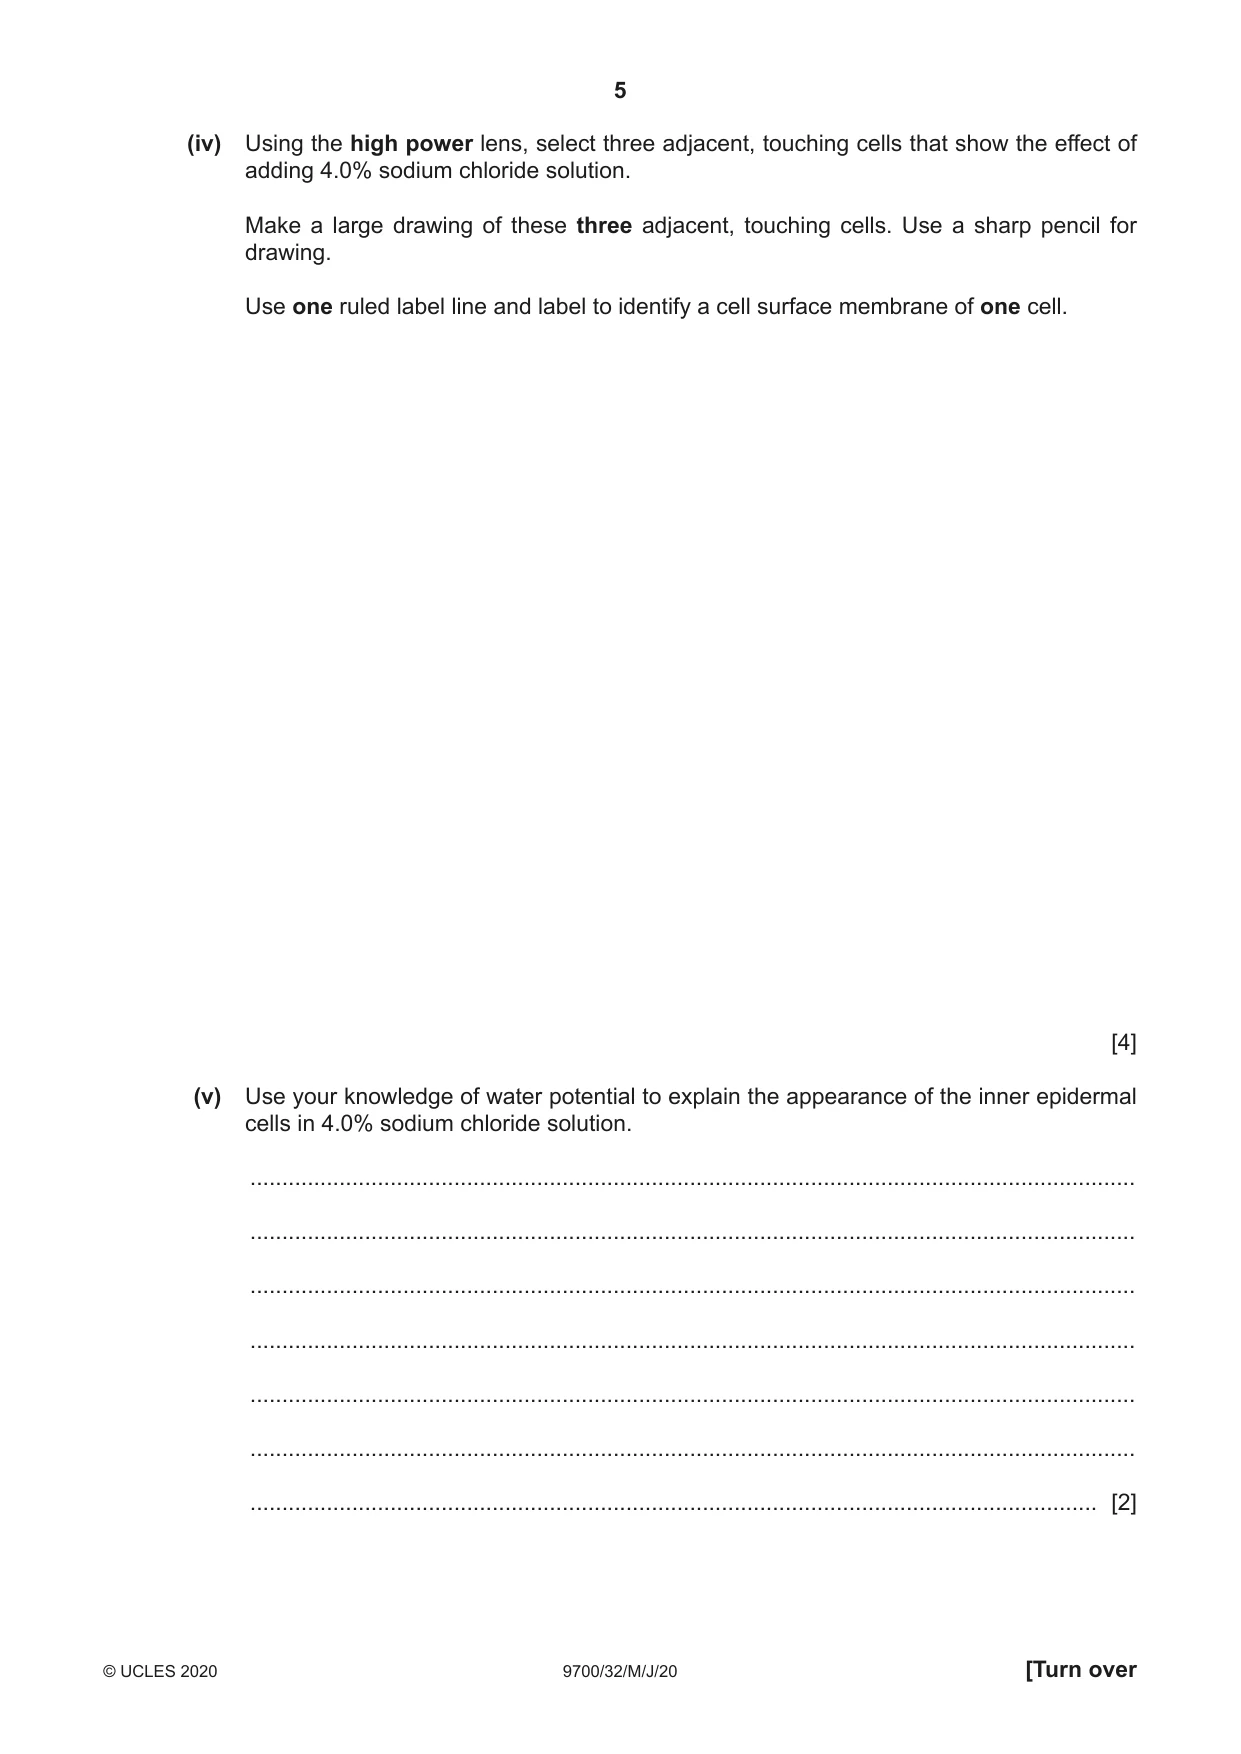
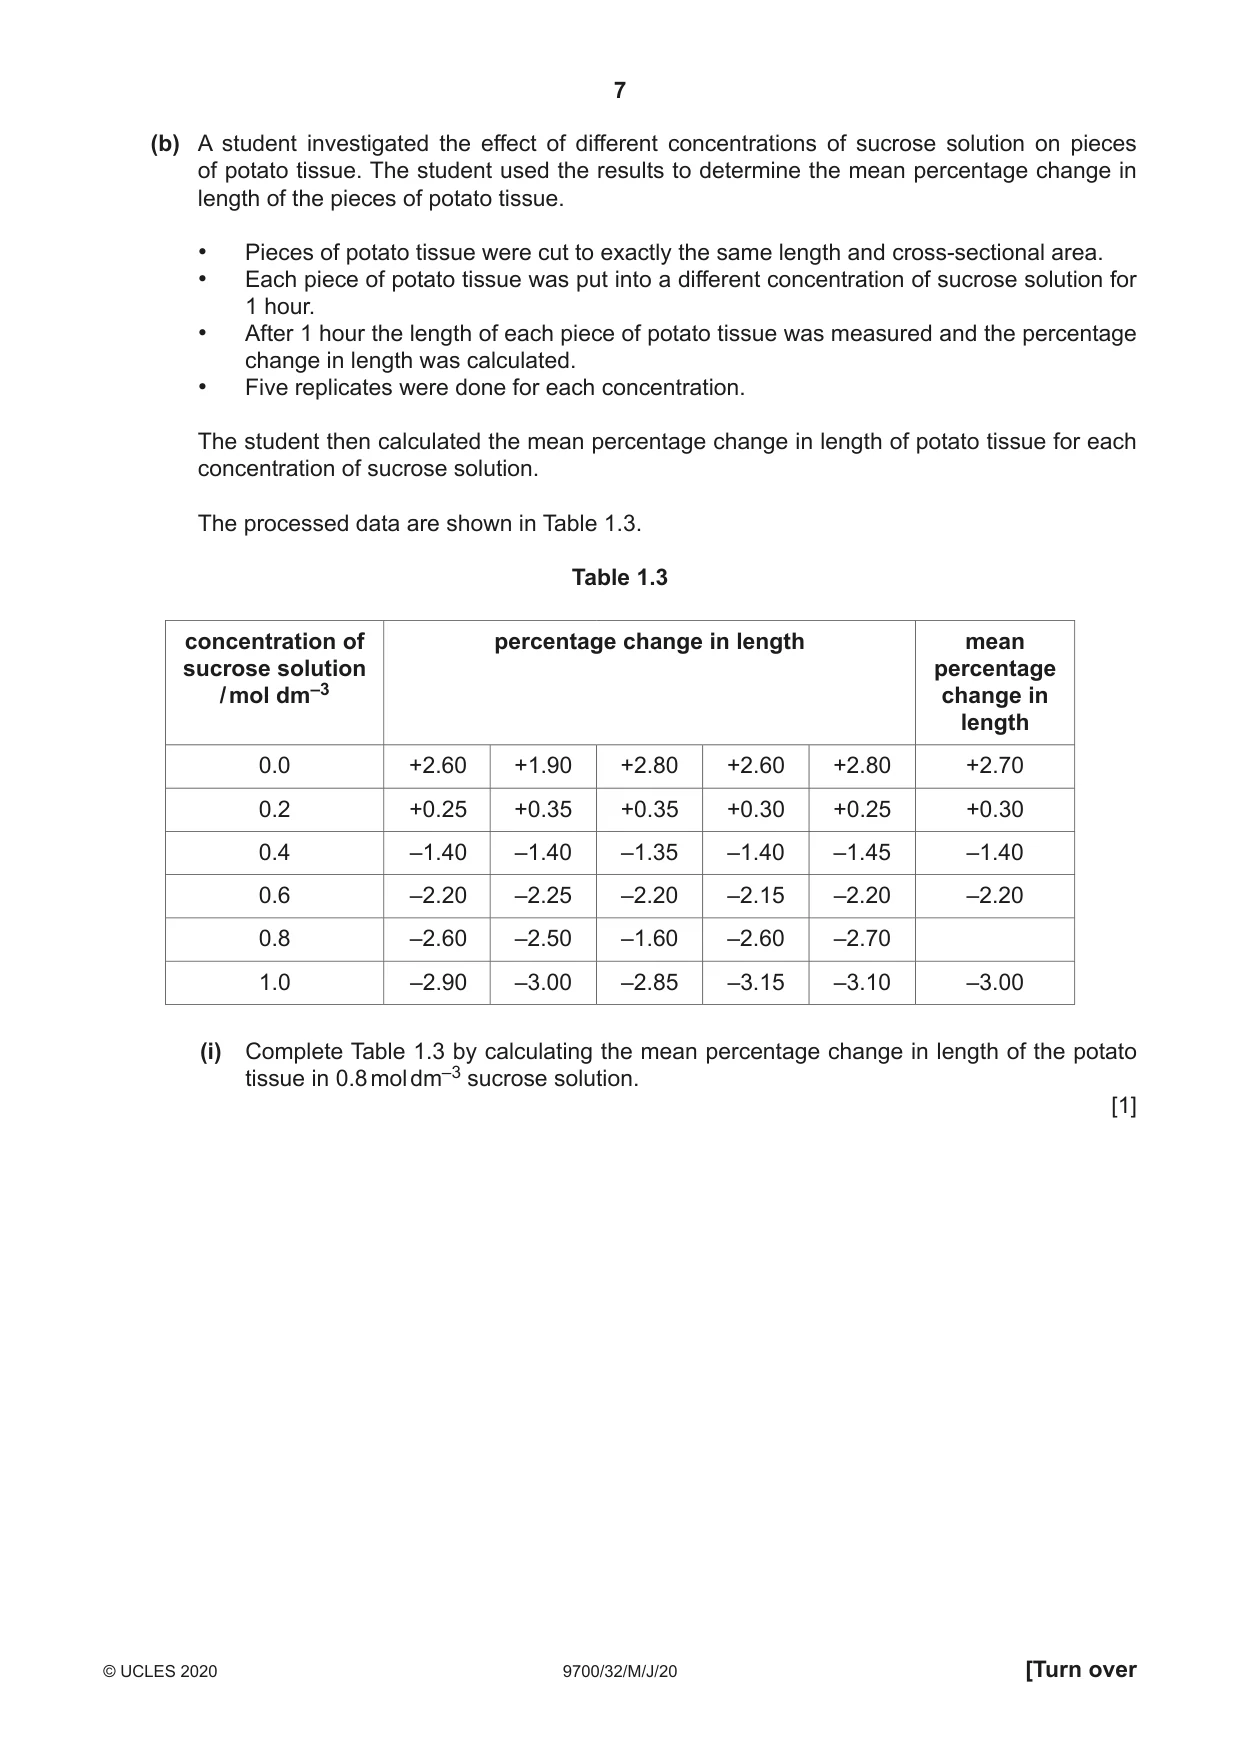
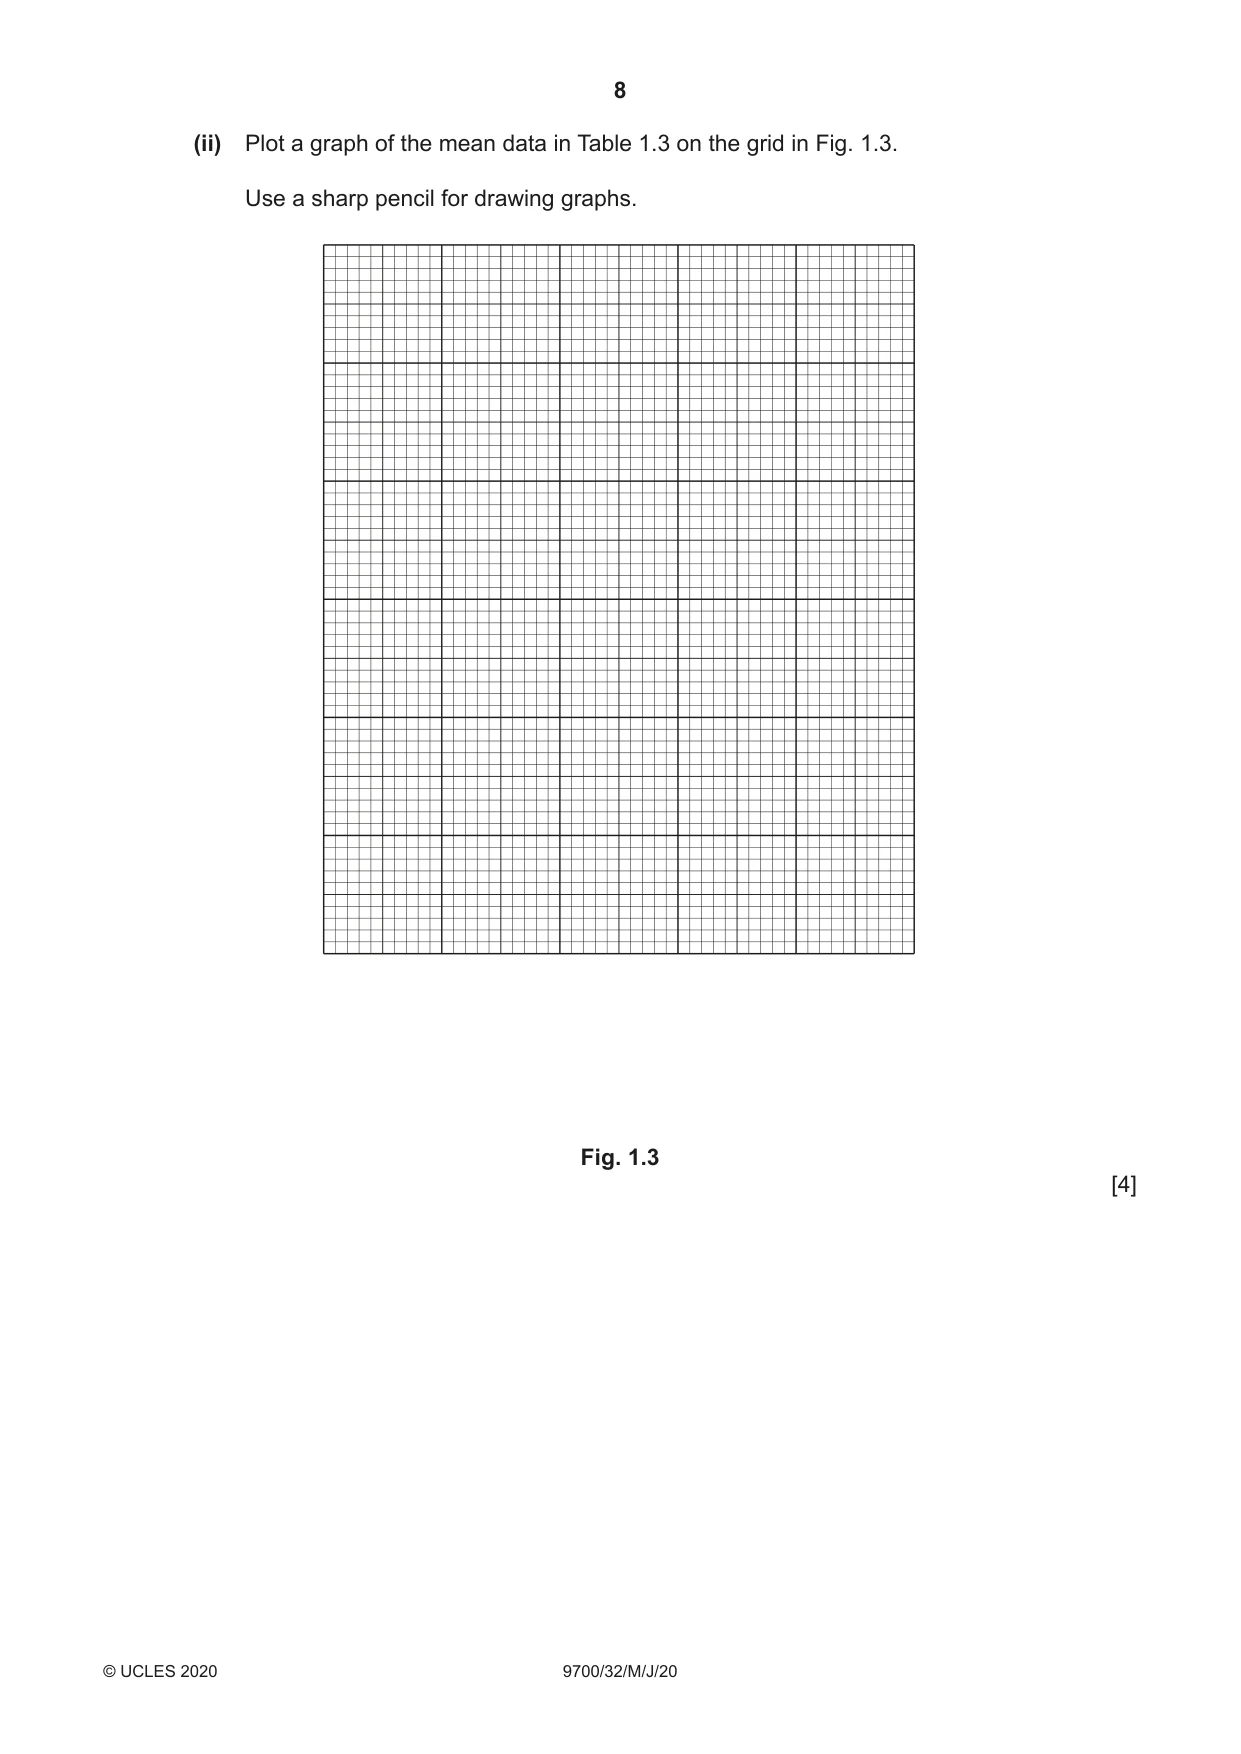
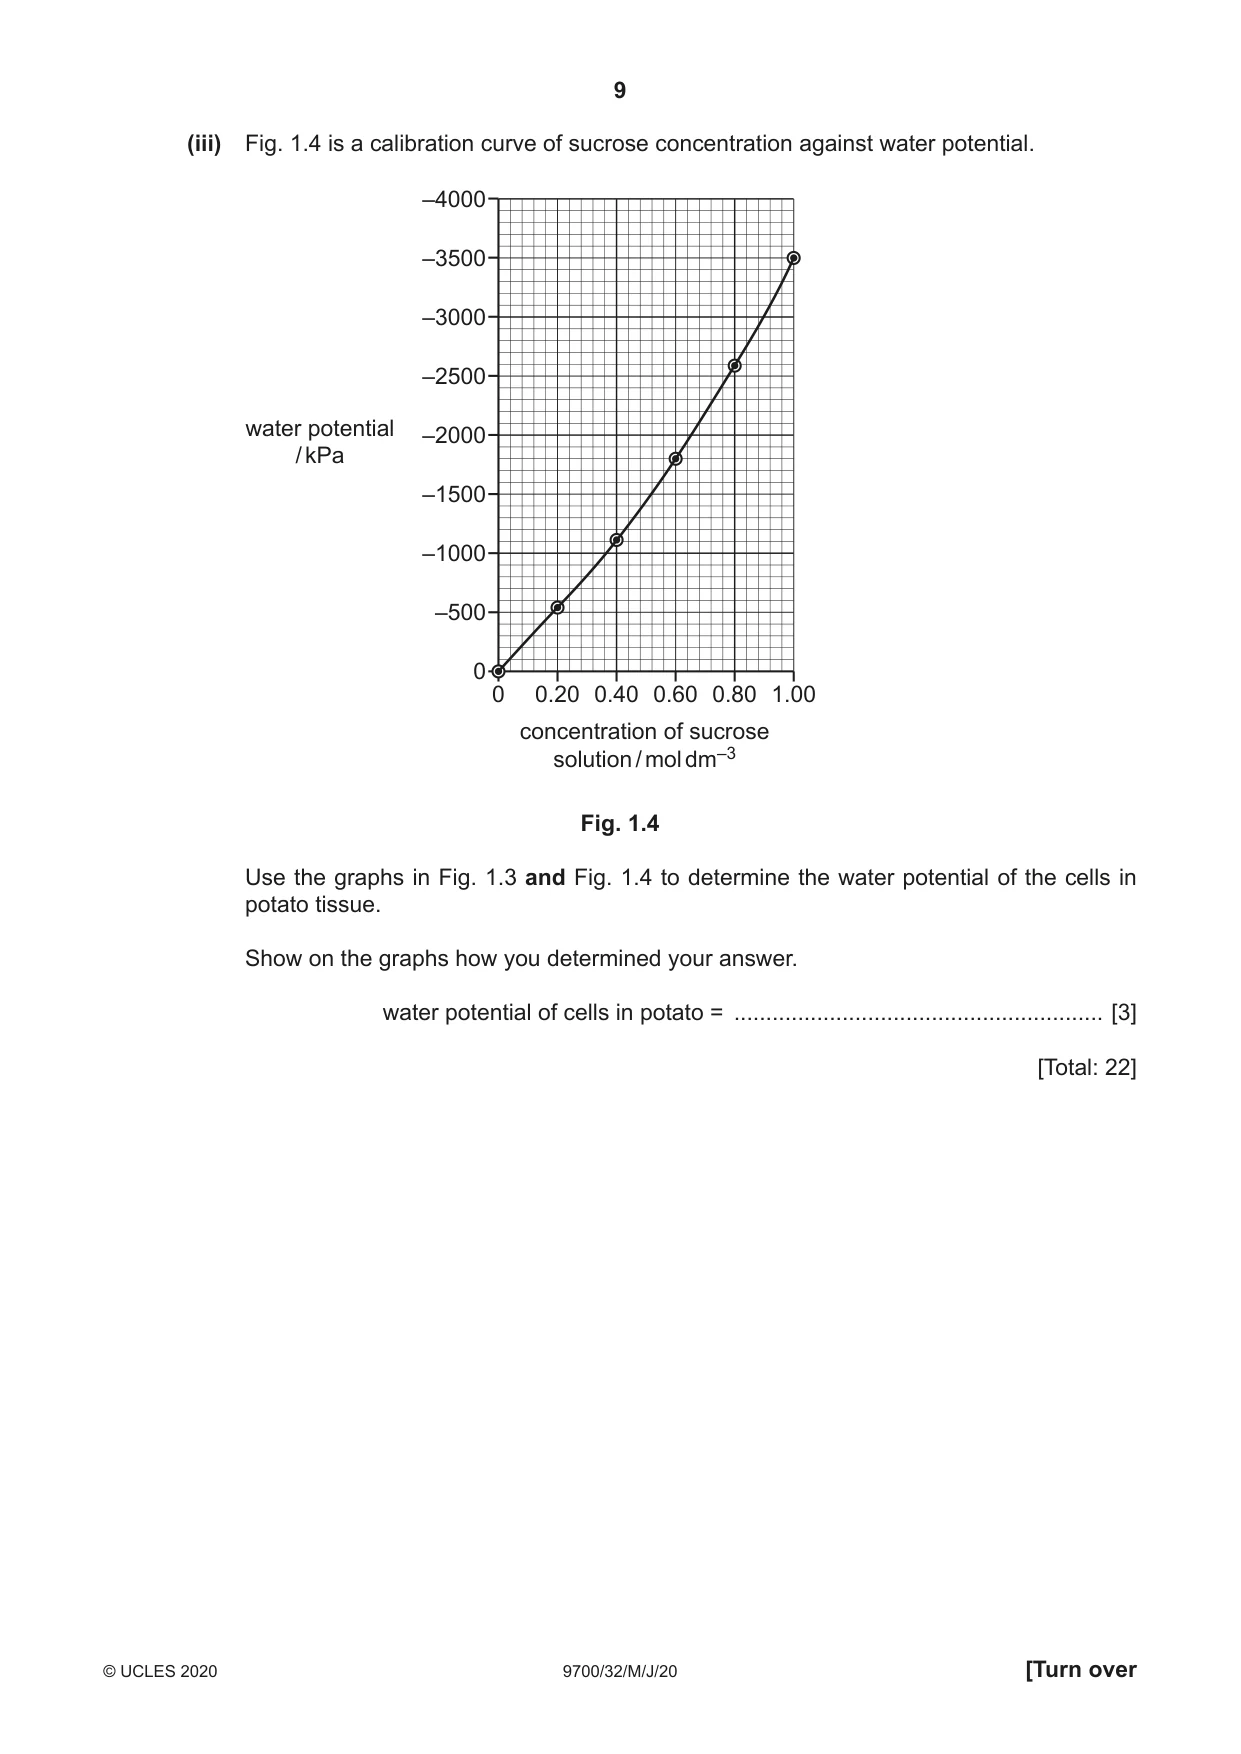
1 When plant cells are placed into sodium chloride solution, osmosis occurs and water will enter or leave the vacuoles. Some cells may become plasmolysed. A cell is described as being plasmolysed when the cell surface membrane detaches from the cell wall. You will investigate the effect of different concentrations of sodium chloride solution on onion tissue. You will need to: • prepare different concentrations of sodium chloride solution using proportional dilution of 4.0% sodium chloride solution • observe and record the effect of adding these concentrations of sodium chloride solution to the onion tissue. You are provided with the materials shown in Table 1.1. Table 1.1 labelled contents hazard volume / cm3 X 2 pieces of onion none – tissue in distilled water S 4.0% sodium chloride none 50 solution W distilled water none 50 It is recommended that you wear suitable eye protection. You will need to prepare different concentrations of sodium chloride solution, S, using proportional dilution. You will need to prepare 10 cm3 of each concentration. (a) (i) Table 1.2 shows how to make up two of the concentrations of S you will use. Decide which three other concentrations of S you will use. Complete Table 1.2 for the other concentrations you will use. Table 1.2 percentage concentration of sodium chloride volume of S / cm3 volume of W / cm3 solution 4.0 10.0 0.0 0.0 0.0 10.0 [2] Carry out step 1 to step 14. 1. Prepare the concentrations of sodium chloride solution, as shown in Table 1.2, in the beakers provided. 2. Put one clean and dry microscope slide on a paper towel. 3. Put a few drops of W onto the microscope slide. 4. Remove one piece of onion tissue from beaker X. Peel off the inner epidermis as shown in Fig. 1.1. Fig. 1.1 5. Cut one piece of the inner epidermis so that it will fit under a coverslip. Put any remaining epidermis into the beaker labelled For waste. 6. Put the epidermis into W on the microscope slide, as shown in Fig. 1.2. If the epidermis is folded, you may need to add more drops of W so that it floats and uncurls. It is important to stop the epidermis from drying out. piece of inner epidermis microscope slide W paper towel Fig. 1.2 7. Put a coverslip over the piece of epidermis on the microscope slide. Use a paper towel to remove any excess W that is outside the coverslip. 8. Observe the epidermis using the low power lens of the microscope. You may need to reduce the amount of light entering the microscope to observe the cells clearly. You will need to observe and record the effect of adding W and the different concentrations of sodium chloride solution on the onion tissue. You will do this by counting the number of plasmolysed cells within a sample of cells. (ii) Decide the total number of cells in your sample. State the total number of cells in your sample ............................................................ [1] 9. Count the number of plasmolysed cells observed in your sample for W. Record your results in (a)(iii). 10. Take the microscope slide off the microscope and remove the coverslip. 11. Use a paper towel to remove W from around the epidermis. 12. Put a few drops of the lowest concentration of sodium chloride solution you prepared in step 1 onto the epidermis. 13. Repeat step 7 to step 11 using the lowest concentration of sodium chloride solution instead of W. 14. Repeat step 12 to step 13 using the remaining concentrations of sodium chloride solution. The 4.0% sodium chloride solution is used last. (iii) Record your results in an appropriate table. [3] (iv) Using the high power lens, select three adjacent, touching cells that show the effect of adding 4.0% sodium chloride solution. Make a large drawing of these three adjacent, touching cells. Use a sharp pencil for drawing. Use one ruled label line and label to identify a cell surface membrane of one cell. [4] (v) Use your knowledge of water potential to explain the appearance of the inner epidermal cells in 4.0% sodium chloride solution. ........................................................................................................................................... ........................................................................................................................................... ........................................................................................................................................... ........................................................................................................................................... ........................................................................................................................................... ........................................................................................................................................... ..................................................................................................................................... [2] (vi) Suggest how you could modify the procedure to have more confidence in your results. ........................................................................................................................................... ........................................................................................................................................... ........................................................................................................................................... ........................................................................................................................................... ........................................................................................................................................... ........................................................................................................................................... ..................................................................................................................................... [2] (b) A student investigated the effect of different concentrations of sucrose solution on pieces of potato tissue. The student used the results to determine the mean percentage change in length of the pieces of potato tissue. • Pieces of potato tissue were cut to exactly the same length and cross-sectional area. • Each piece of potato tissue was put into a different concentration of sucrose solution for 1 hour. • After 1 hour the length of each piece of potato tissue was measured and the percentage change in length was calculated. • Five replicates were done for each concentration. The student then calculated the mean percentage change in length of potato tissue for each concentration of sucrose solution. The processed data are shown in Table 1.3. Table 1.3 concentration of percentage change in length mean sucrose solution percentage / mol dm–3 change in length 0.0 +2.60 +1.90 +2.80 +2.60 +2.80 +2.70 0.2 +0.25 +0.35 +0.35 +0.30 +0.25 +0.30 0.4 –1.40 –1.40 –1.35 –1.40 –1.45 –1.40 0.6 –2.20 –2.25 –2.20 –2.15 –2.20 –2.20 0.8 –2.60 –2.50 –1.60 –2.60 –2.70 1.0 –2.90 –3.00 –2.85 –3.15 –3.10 –3.00 (i) Complete Table 1.3 by calculating the mean percentage change in length of the potato tissue in 0.8 mol dm–3 sucrose solution. [1] (ii) Plot a graph of the mean data in Table 1.3 on the grid in Fig. 1.3. Use a sharp pencil for drawing graphs. Fig. 1.3 [4] (iii) Fig. 1.4 is a calibration curve of sucrose concentration against water potential. –4000 –3500 –3000 –2500 water potential –2000 / kPa –1500 –1000 –500 0 0 0.20 0.40 0.60 0.80 1.00 concentration of sucrose solution / mol dm–3 Fig. 1.4 Use the graphs in Fig. 1.3 and Fig. 1.4 to determine the water potential of the cells in potato tissue. Show on the graphs how you determined your answer. water potential of cells in potato = .......................................................... [3] [Total: 22]
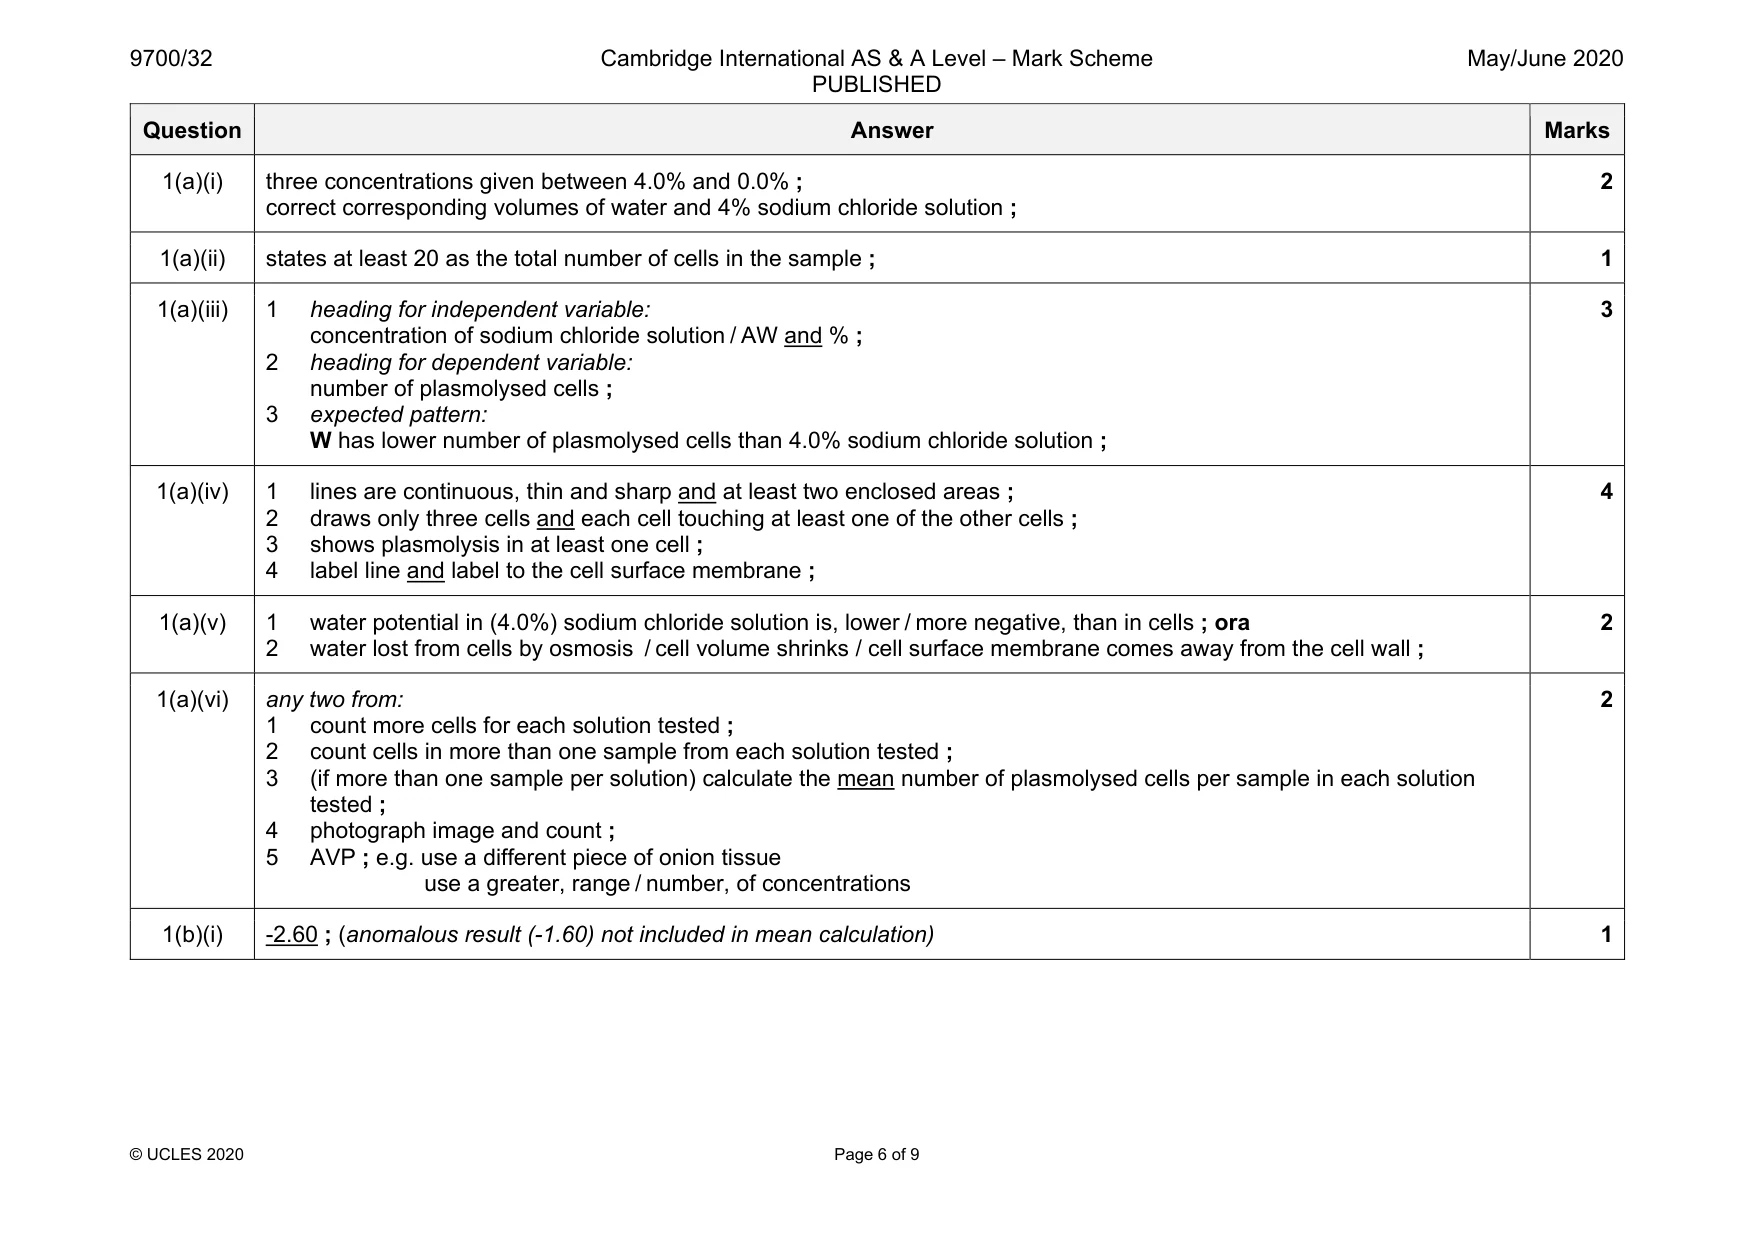
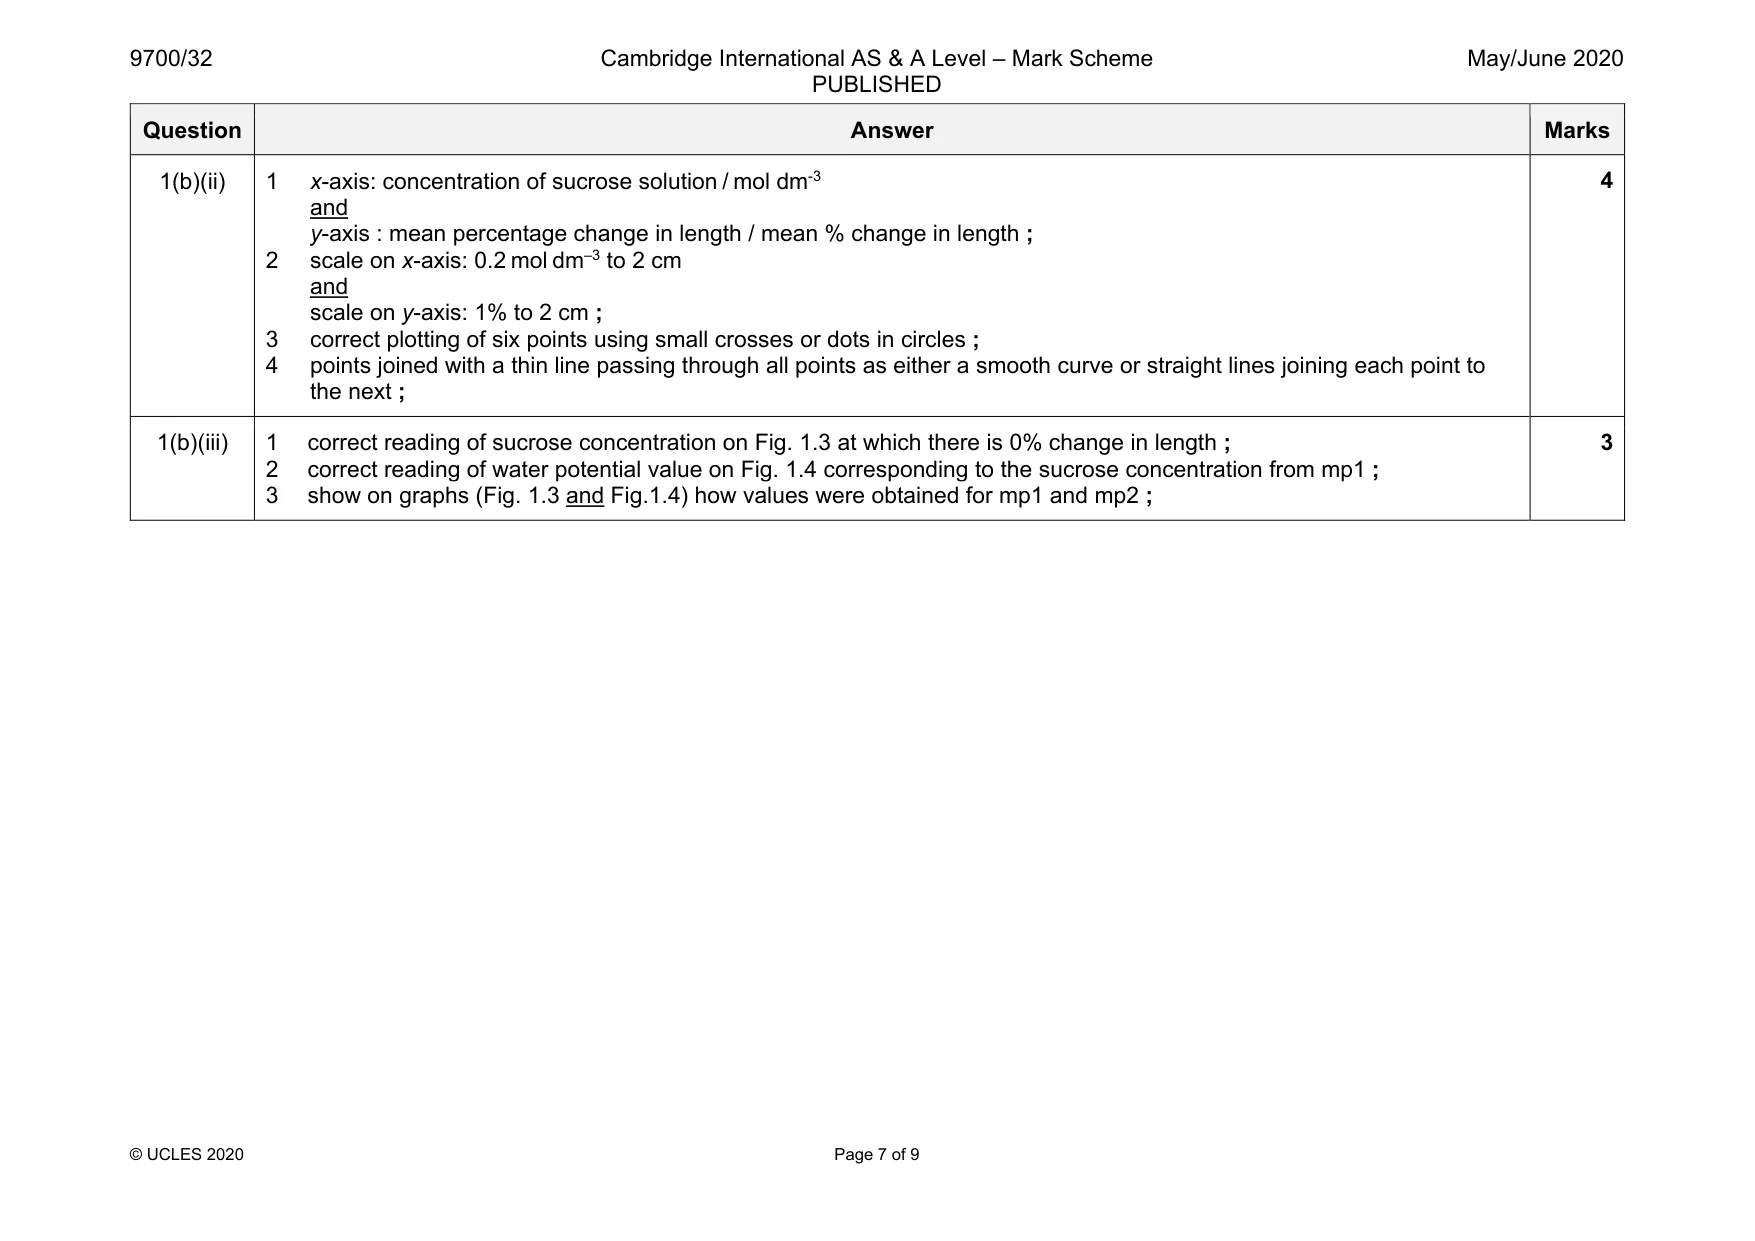
Mark scheme: 1(a)(i) three concentrations given between 4.0% and 0.0% ; correct corresponding volumes of water and 4% sodium chloride solution ; 2 1(a)(ii) states at least 20 as the total number of cells in the sample ; 1 1(a)(iii) 1 heading for independent variable: concentration of sodium chloride solution / AW and % ; 2 heading for dependent variable: number of plasmolysed cells ; 3 expected pattern: W has lower number of plasmolysed cells than 4.0% sodium chloride solution ; 3 1(a)(iv) 1 lines are continuous, thin and sharp and at least two enclosed areas ; 2 draws only three cells and each cell touching at least one of the other cells ; 3 shows plasmolysis in at least one cell ; 4 label line and label to the cell surface membrane ; 4 1(a)(v) 1 water potential in (4.0%) sodium chloride solution is, lower / more negative, than in cells ; ora 2 water lost from cells by osmosis / cell volume shrinks / cell surface membrane comes away from the cell wall ; 2 1(a)(vi) any two from: 1 count more cells for each solution tested ; 2 count cells in more than one sample from each solution tested ; 3 (if more than one sample per solution) calculate the mean number of plasmolysed cells per sample in each solution tested ; 4 photograph image and count ; 5 AVP ; e.g. use a different piece of onion tissue use a greater, range / number, of concentrations 2 1(b)(i) -2.60 ; (anomalous result (-1.60) not included in mean calculation) 1 Question Answer Marks 1(b)(ii) 1 x-axis: concentration of sucrose solution / mol dm-3 and y-axis : mean percentage change in length / mean % change in length ; 2 scale on x-axis: 0.2 mol dm–3 to 2 cm and scale on y-axis: 1% to 2 cm ; 3 correct plotting of six points using small crosses or dots in circles ; 4 points joined with a thin line passing through all points as either a smooth curve or straight lines joining each point to the next ; 4 1(b)(iii) 1 correct reading of sucrose concentration on Fig. 1.3 at which there is 0% change in length ; 2 correct reading of water potential value on Fig. 1.4 corresponding to the sucrose concentration from mp1 ; 3 show on graphs (Fig. 1.3 and Fig.1.4) how values were obtained for mp1 and mp2 ; 3
Q2 · Water moves through xylem vessel elements in plants
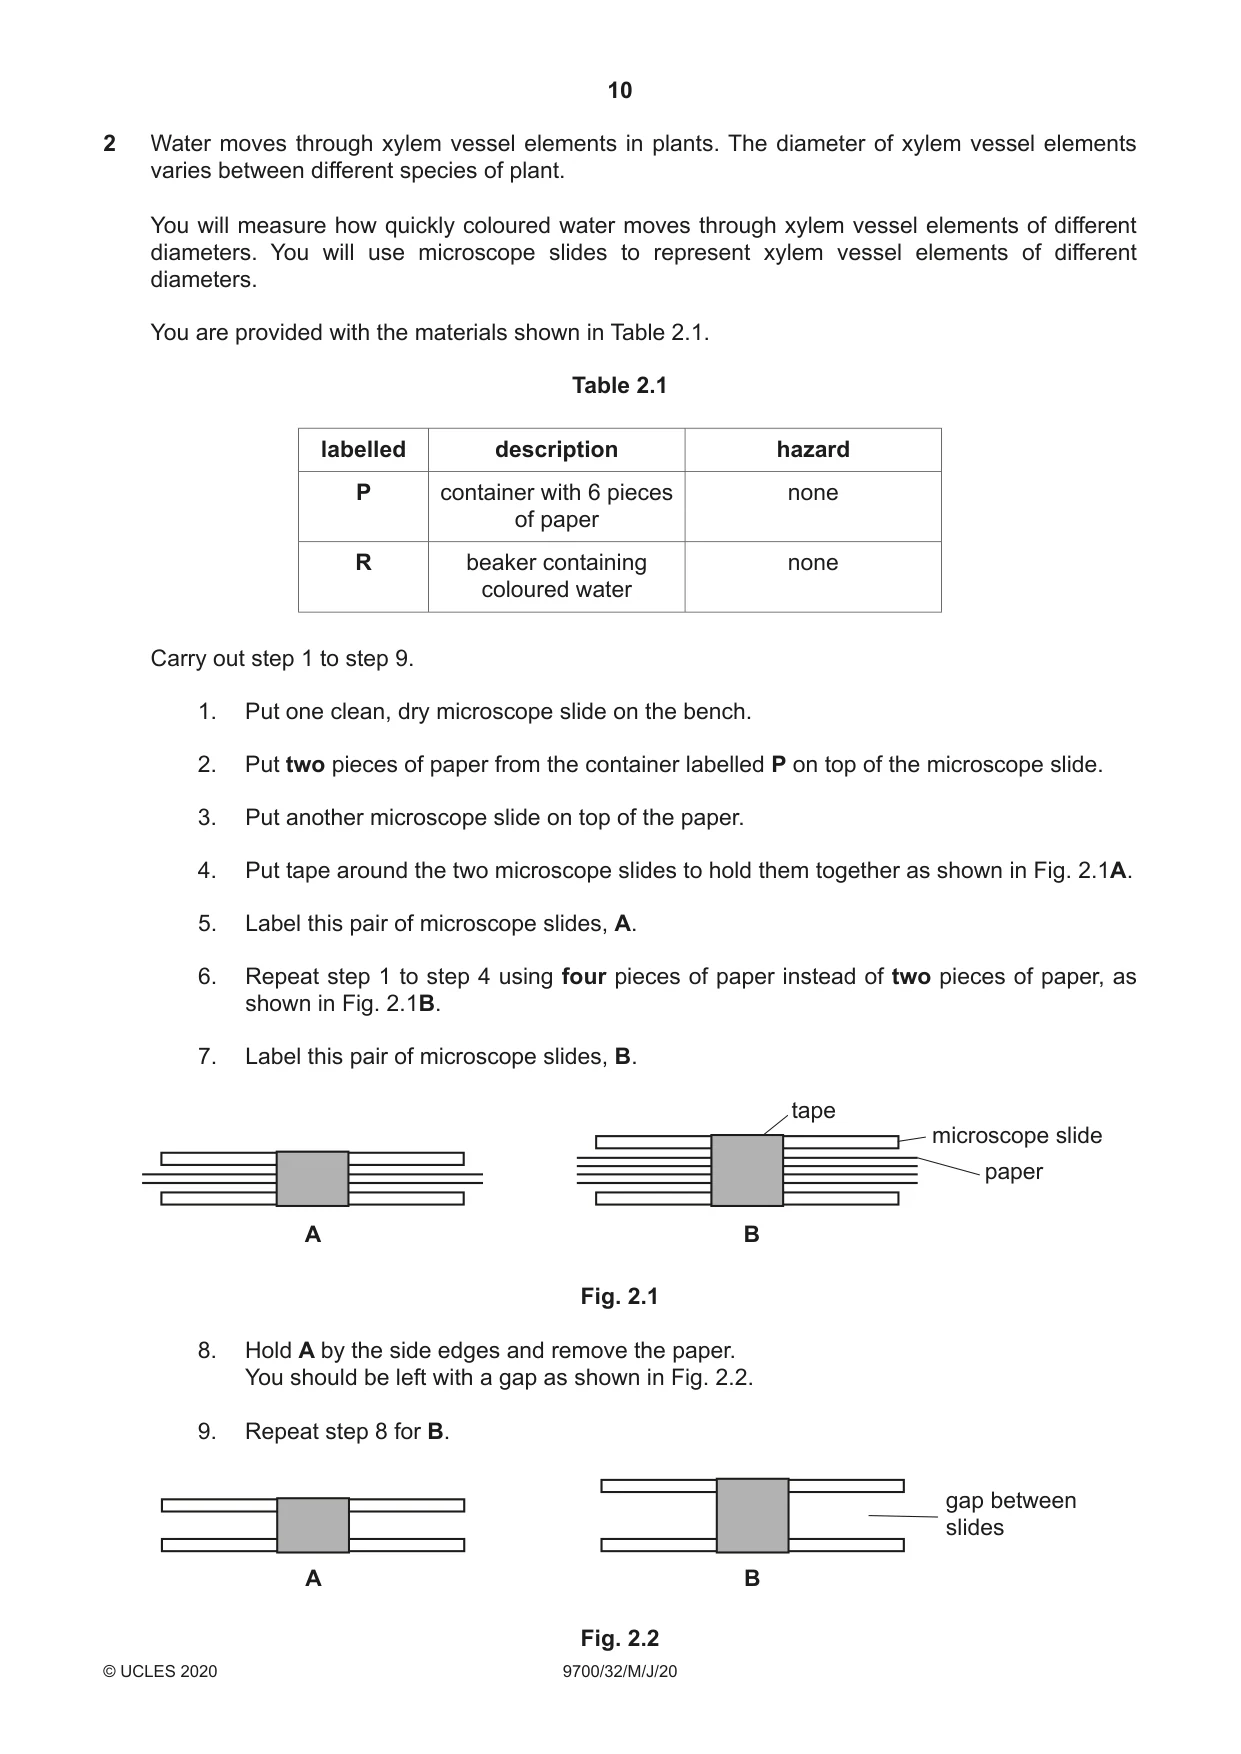
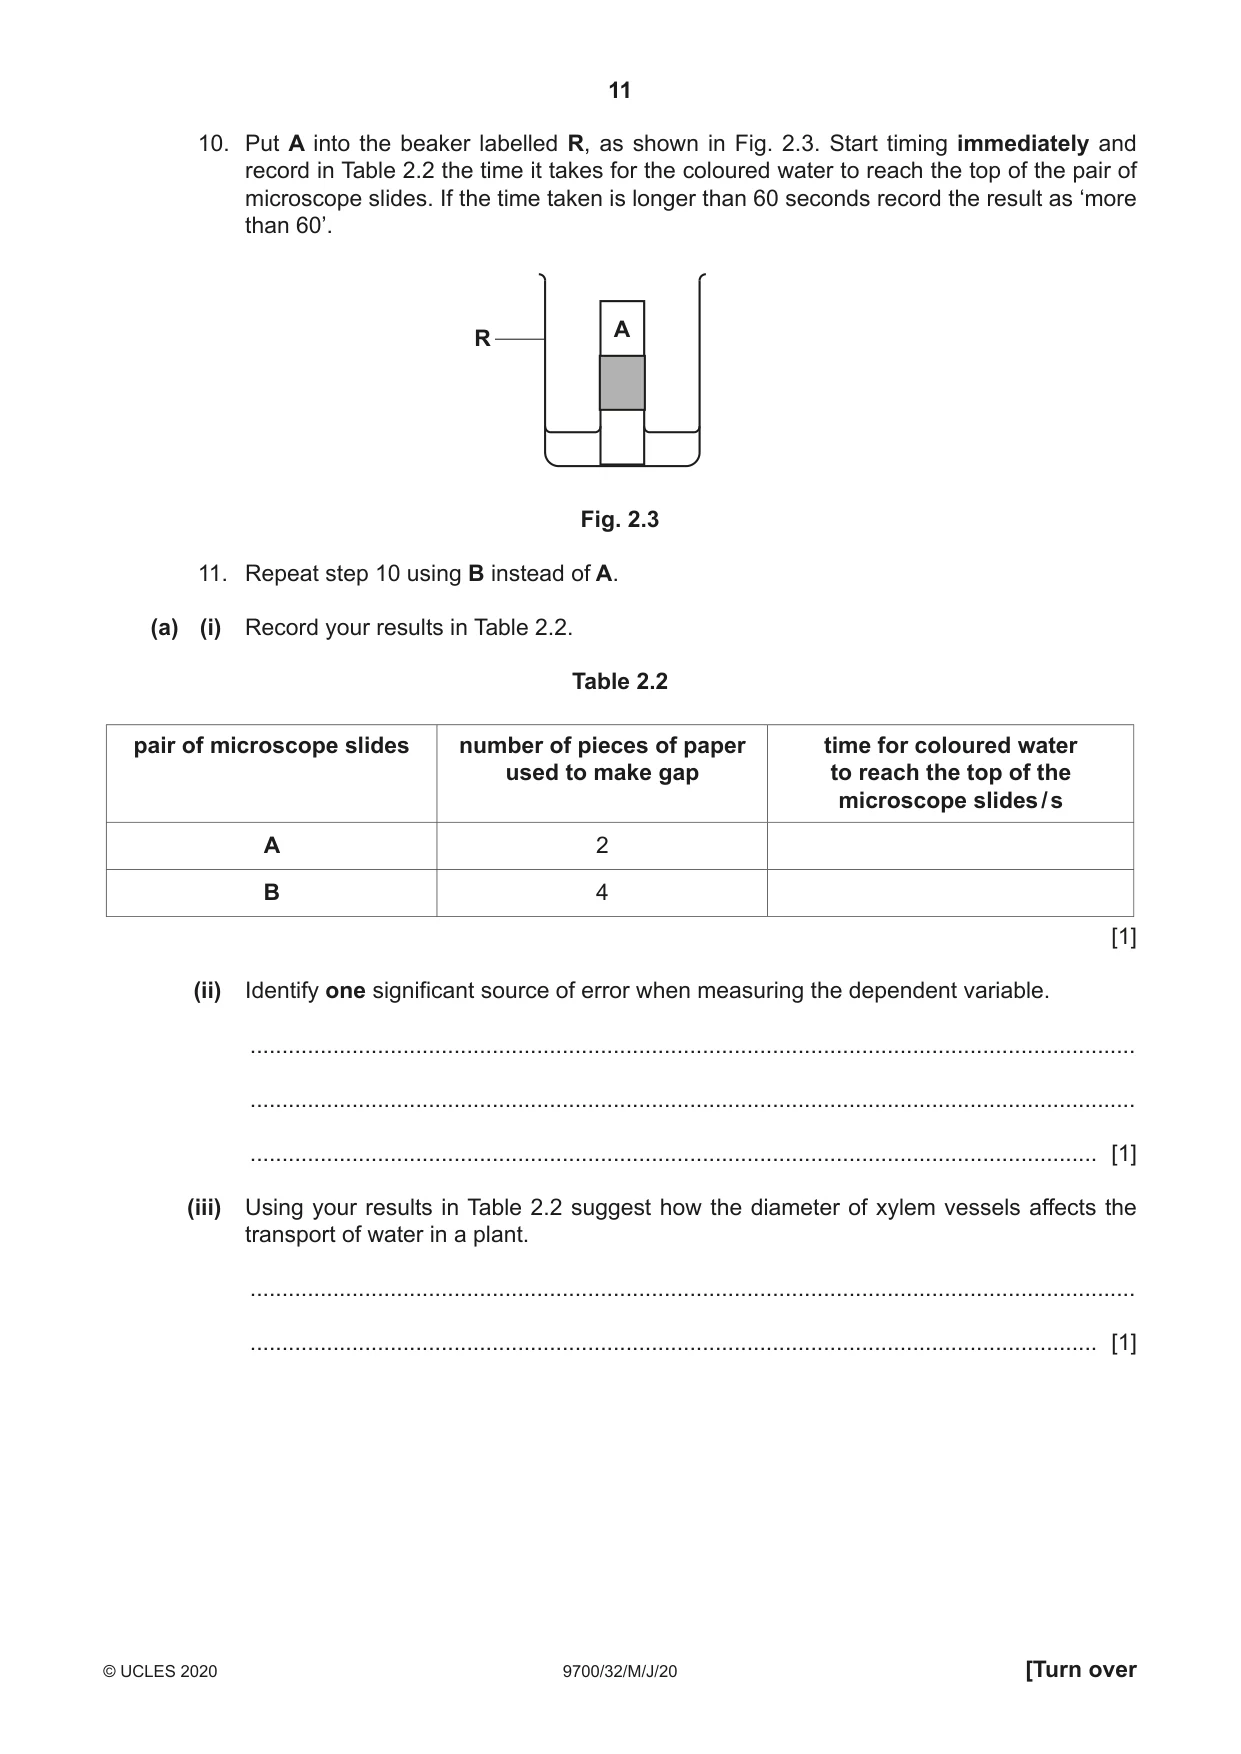
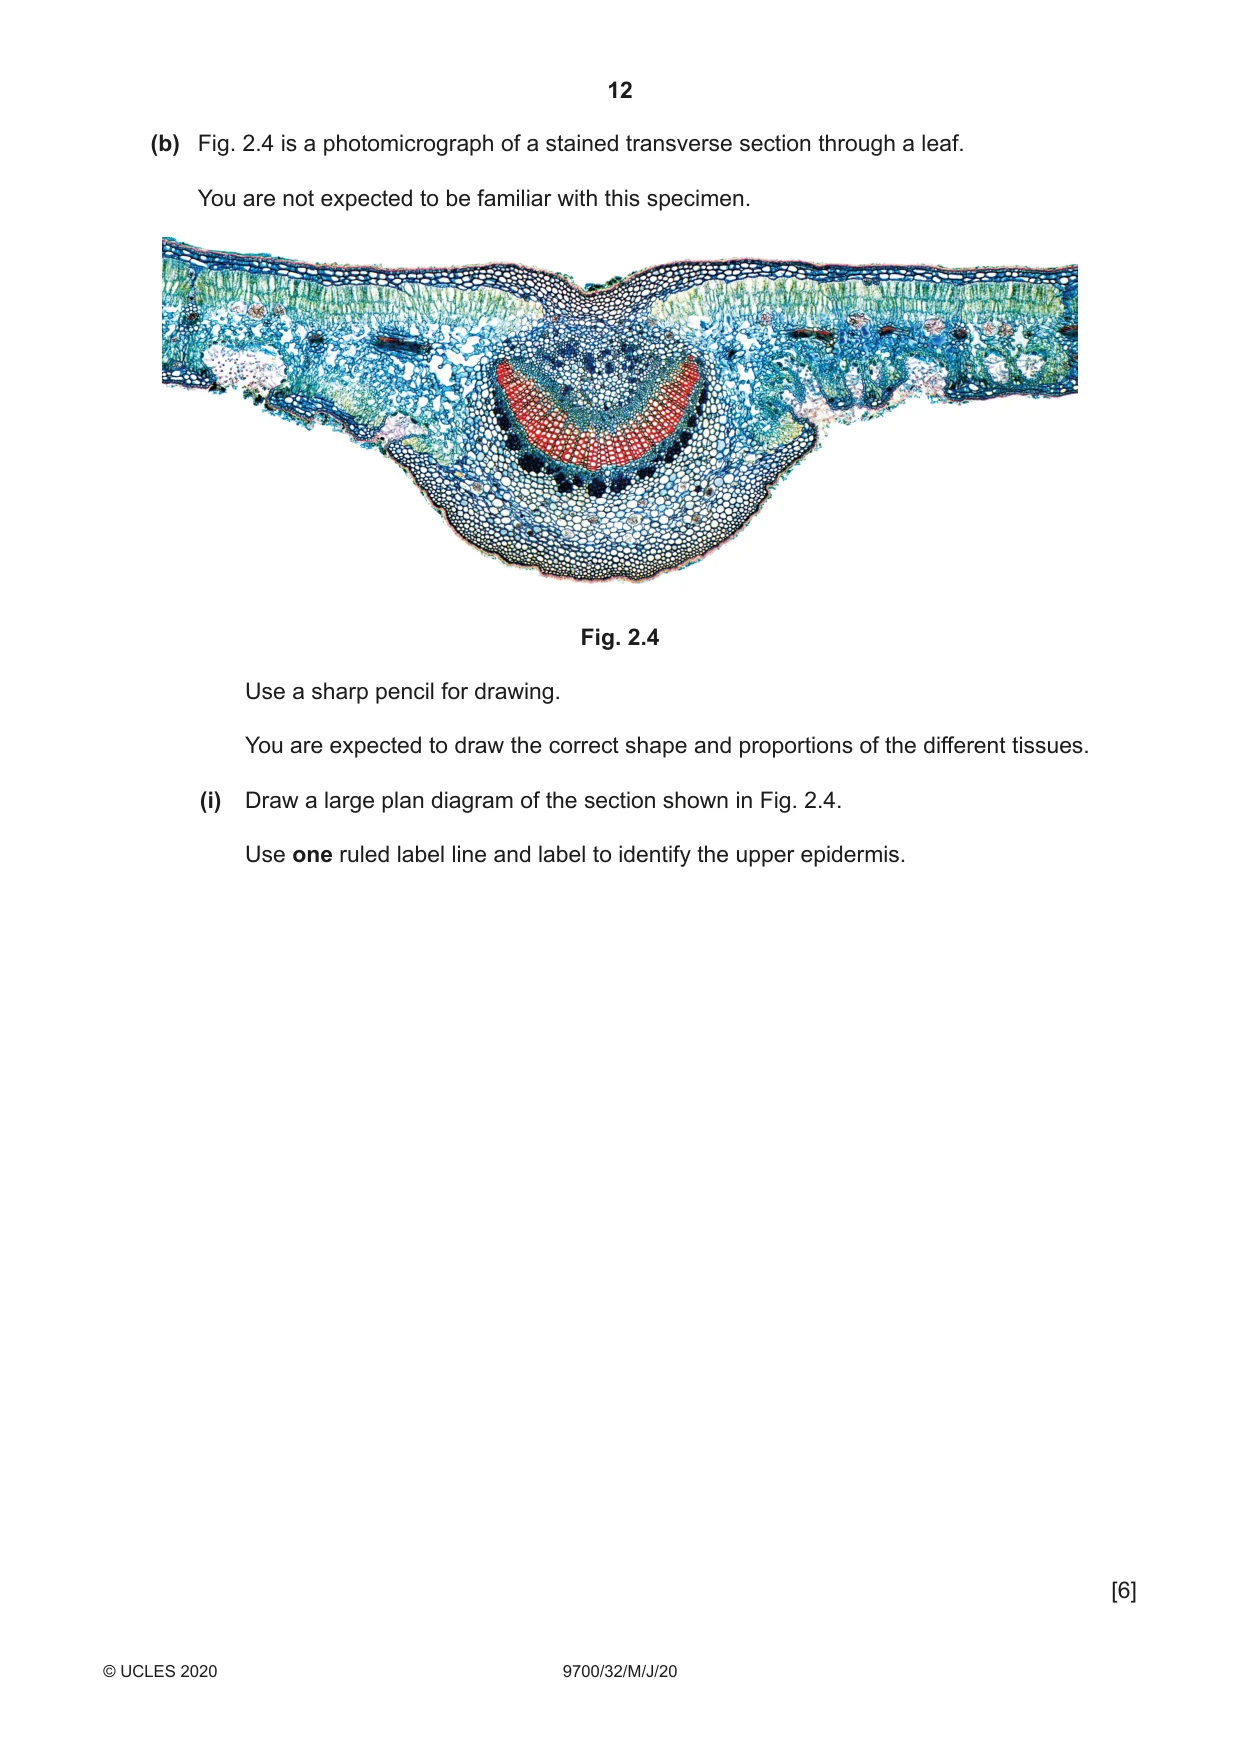
2 Water moves through xylem vessel elements in plants. The diameter of xylem vessel elements varies between different species of plant. You will measure how quickly coloured water moves through xylem vessel elements of different diameters. You will use microscope slides to represent xylem vessel elements of different diameters. You are provided with the materials shown in Table 2.1. Table 2.1 labelled description hazard P container with 6 pieces none of paper R beaker containing none coloured water Carry out step 1 to step 9. 1. Put one clean, dry microscope slide on the bench. 2. Put two pieces of paper from the container labelled P on top of the microscope slide. 3. Put another microscope slide on top of the paper. 4. Put tape around the two microscope slides to hold them together as shown in Fig. 2.1A. 5. Label this pair of microscope slides, A. 6. Repeat step 1 to step 4 using four pieces of paper instead of two pieces of paper, as shown in Fig. 2.1B. 7. Label this pair of microscope slides, B. tape microscope slide paper A B Fig. 2.1 8. Hold A by the side edges and remove the paper. You should be left with a gap as shown in Fig. 2.2. 9. Repeat step 8 for B. gap between slides A B Fig. 2.2 10. Put A into the beaker labelled R, as shown in Fig. 2.3. Start timing immediately and record in Table 2.2 the time it takes for the coloured water to reach the top of the pair of microscope slides. If the time taken is longer than 60 seconds record the result as ‘more than 60’. A R Fig. 2.3 11. Repeat step 10 using B instead of A. (a) (i) Record your results in Table 2.2. Table 2.2 pair of microscope slides number of pieces of paper time for coloured water used to make gap to reach the top of the microscope slides / s A 2 B 4 [1] (ii) Identify one significant source of error when measuring the dependent variable. ........................................................................................................................................... ........................................................................................................................................... ..................................................................................................................................... [1] (iii) Using your results in Table 2.2 suggest how the diameter of xylem vessels affects the transport of water in a plant. ........................................................................................................................................... ..................................................................................................................................... [1] (b) Fig. 2.4 is a photomicrograph of a stained transverse section through a leaf. You are not expected to be familiar with this specimen. Fig. 2.4 Use a sharp pencil for drawing. You are expected to draw the correct shape and proportions of the different tissues. (i) Draw a large plan diagram of the section shown in Fig. 2.4. Use one ruled label line and label to identify the upper epidermis. [6]
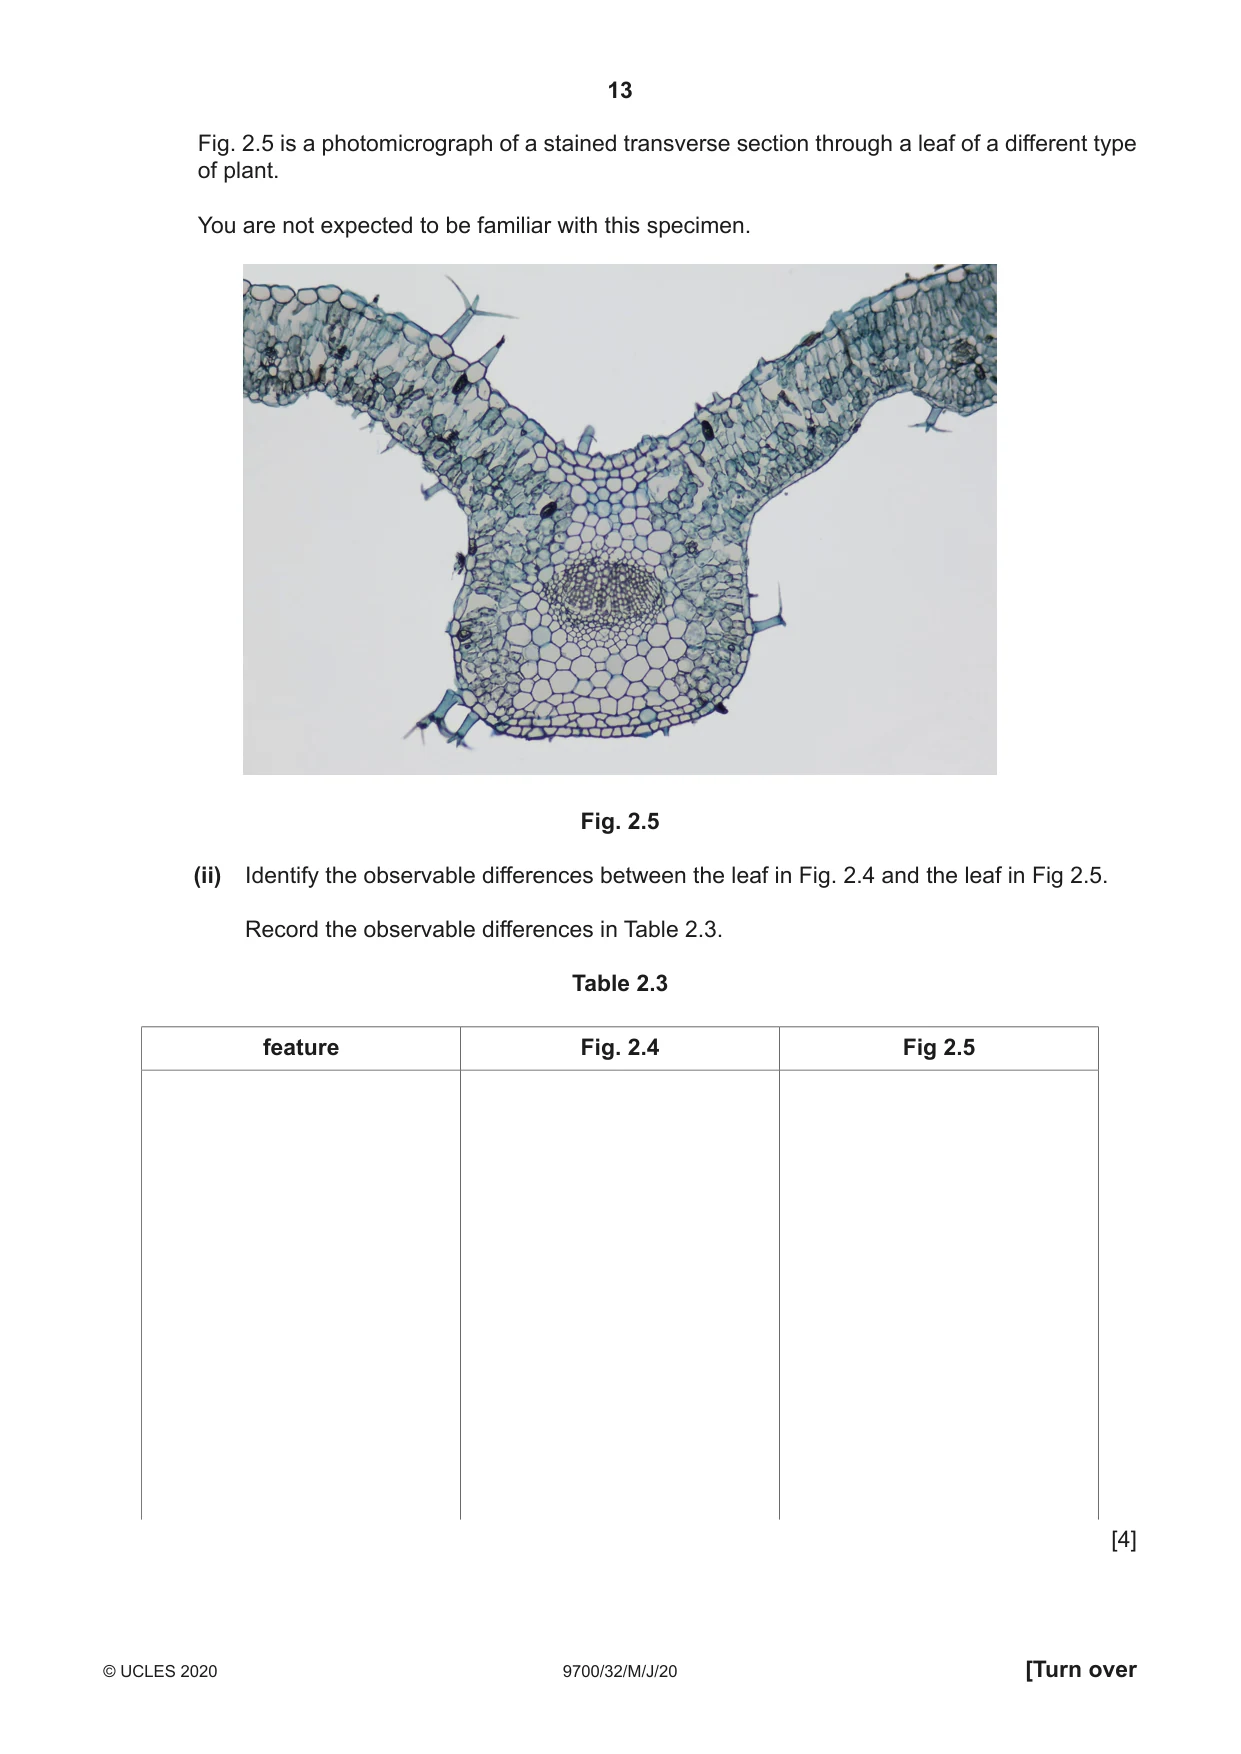
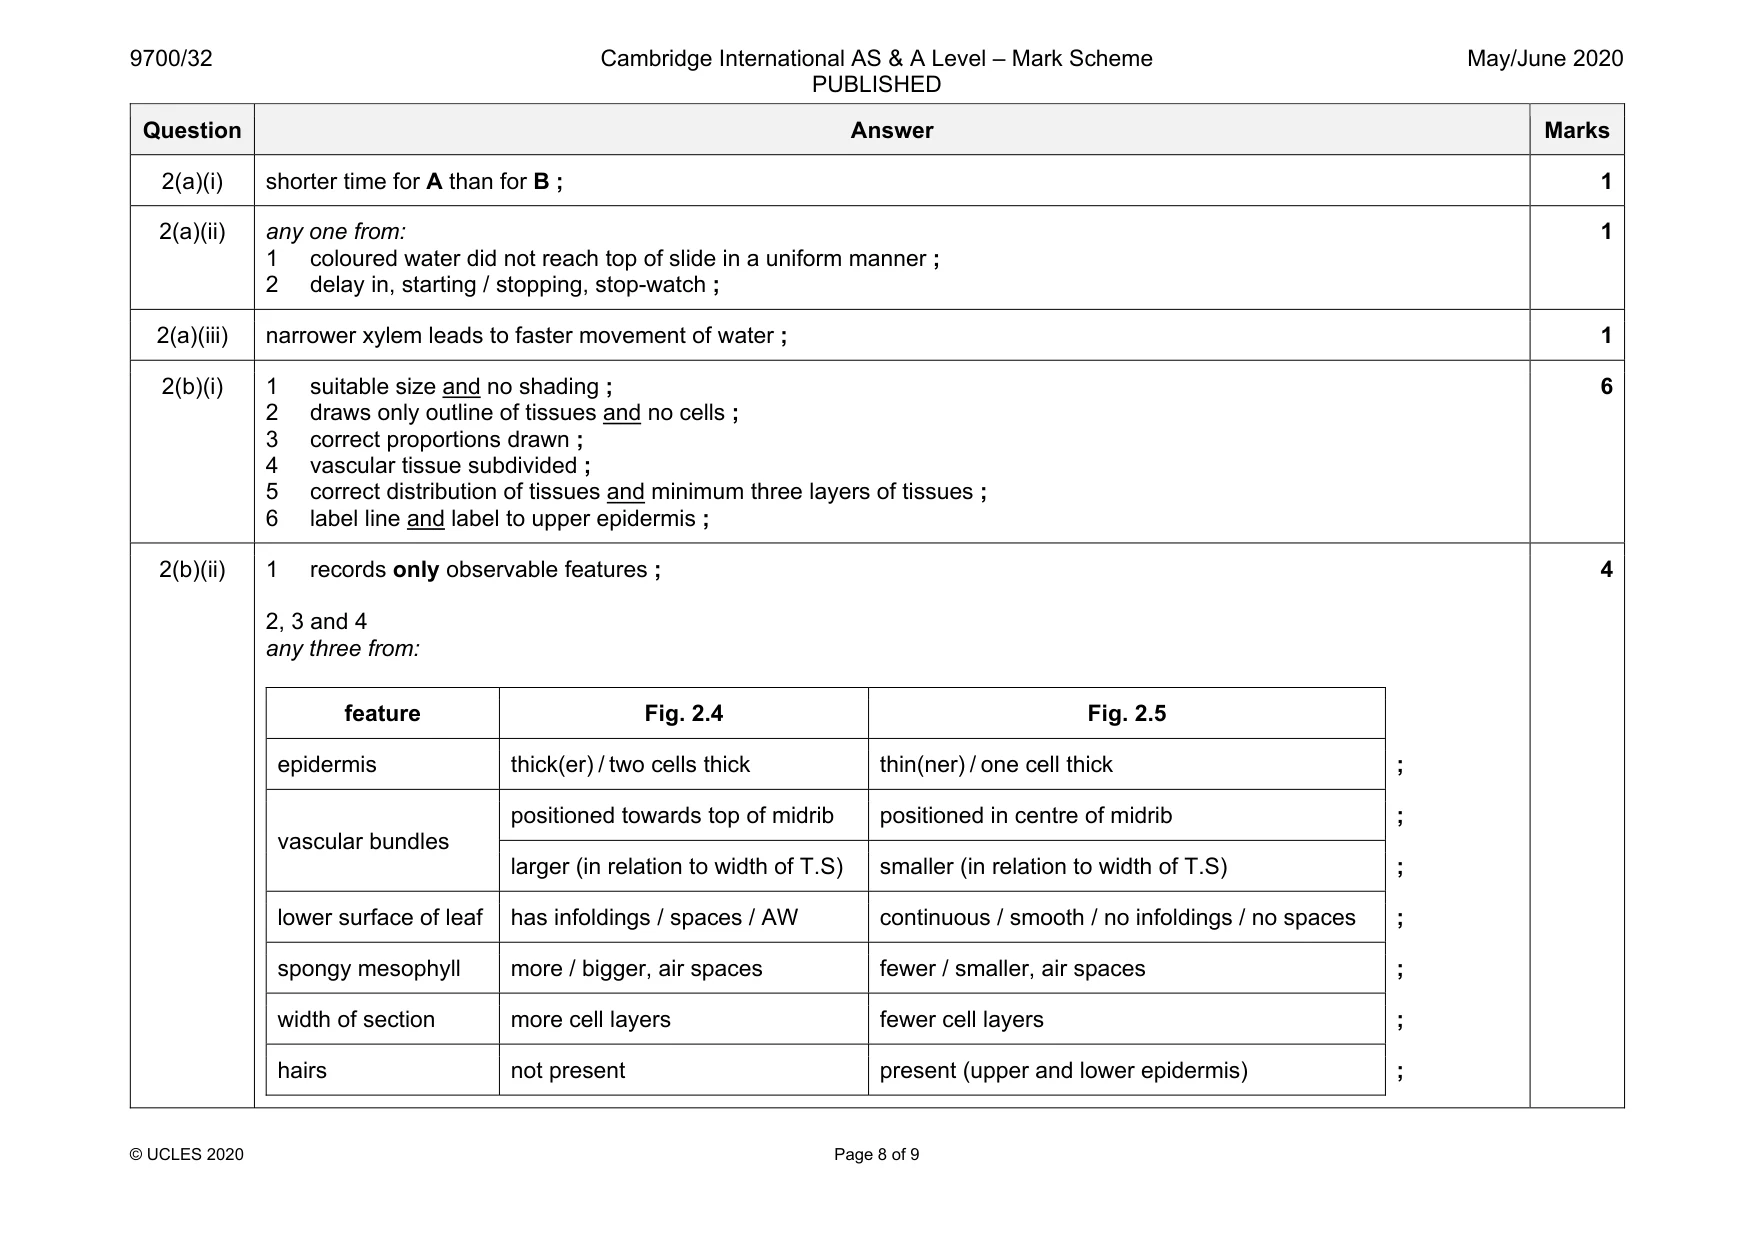
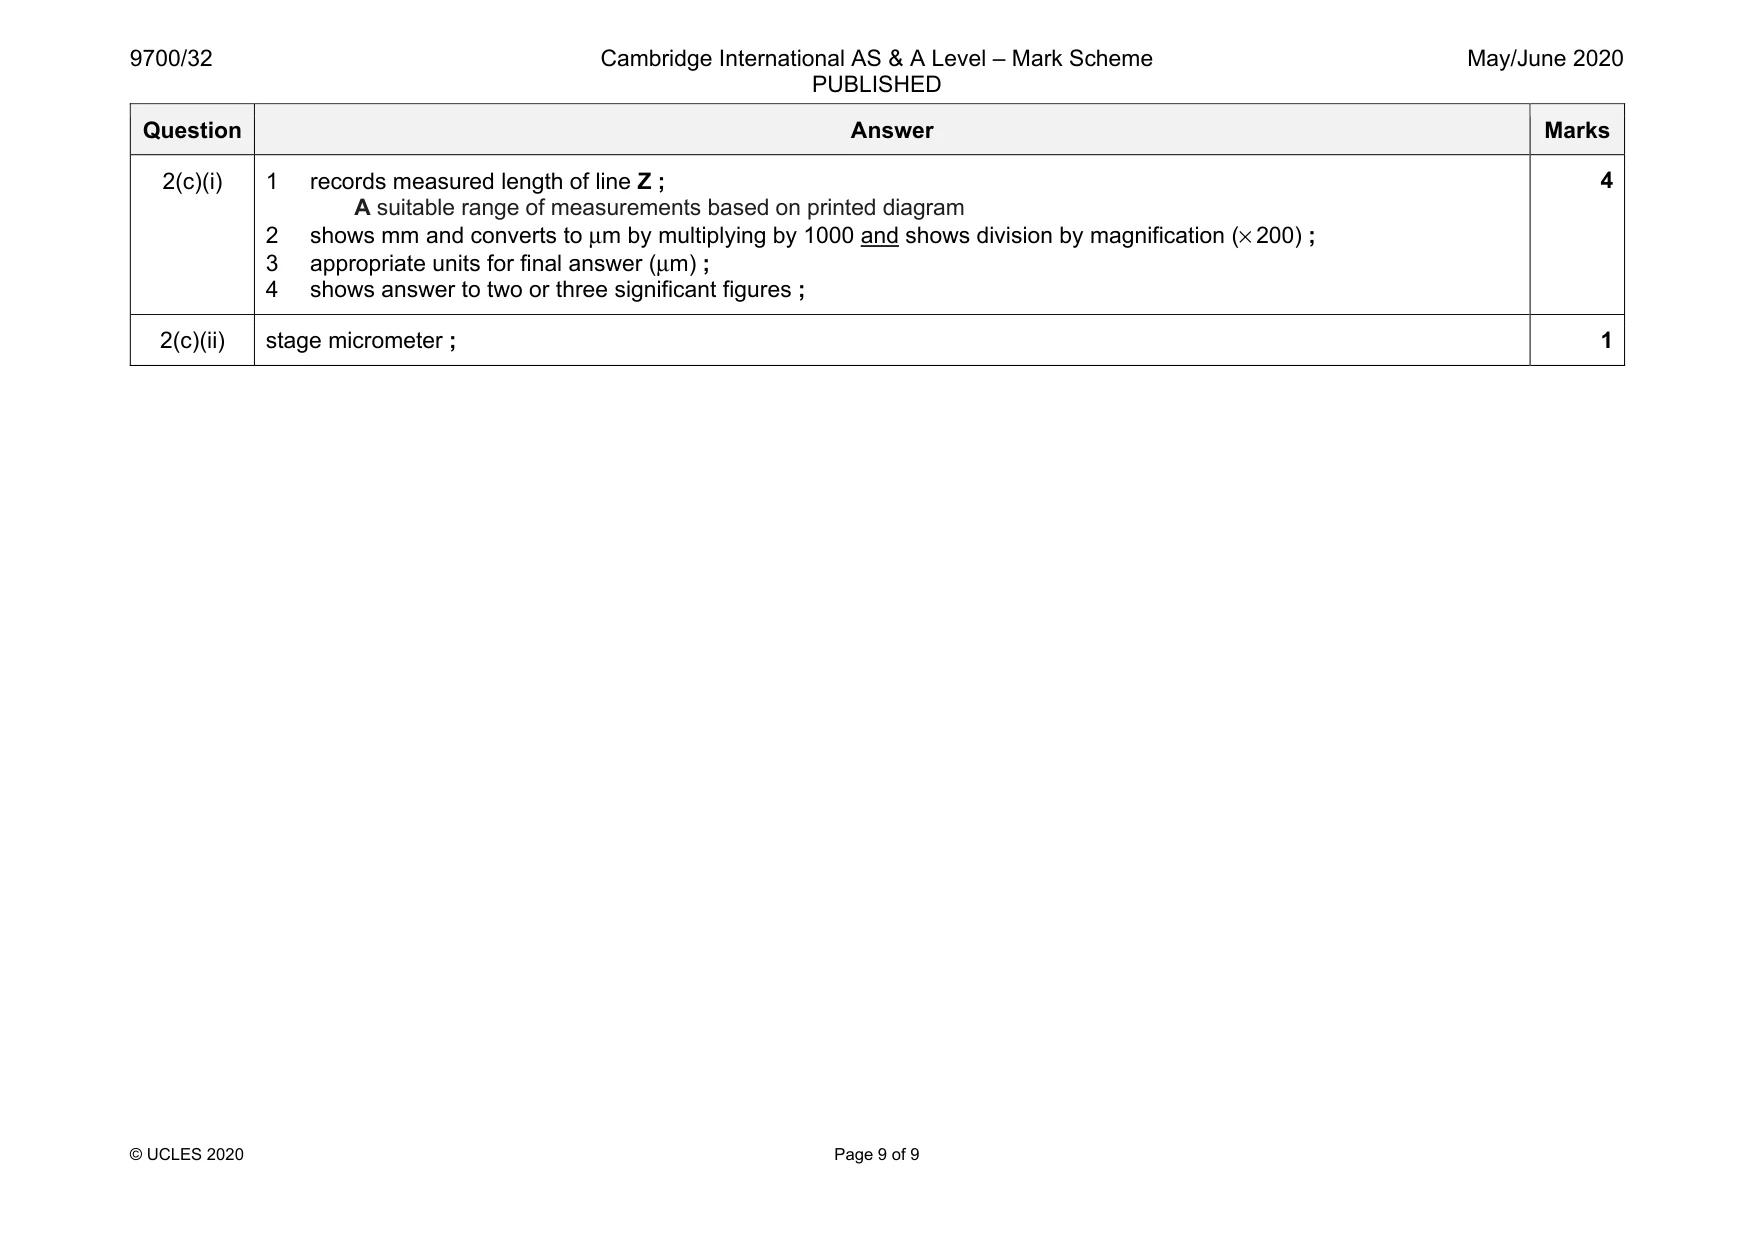
Mark scheme: 2(a)(i) shorter time for A than for B ; 1 2(a)(ii) any one from: 1 coloured water did not reach top of slide in a uniform manner ; 2 delay in, starting / stopping, stop-watch ; 1 2(a)(iii) narrower xylem leads to faster movement of water ; 1 2(b)(i) 1 suitable size and no shading ; 2 draws only outline of tissues and no cells ; 3 correct proportions drawn ; 4 vascular tissue subdivided ; 5 correct distribution of tissues and minimum three layers of tissues ; 6 label line and label to upper epidermis ; 6 2(b)(ii) 1 records only observable features ; 2, 3 and 4 any three from: feature Fig. 2.4 Fig. 2.5 epidermis thick(er) / two cells thick thin(ner) / one cell thick ; vascular bundles positioned towards top of midrib positioned in centre of midrib ; larger (in relation to width of T.S) smaller (in relation to width of T.S) ; lower surface of leaf has infoldings / spaces / AW continuous / smooth / no infoldings / no spaces ; spongy mesophyll more / bigger, air spaces fewer / smaller, air spaces ; width of section more cell layers fewer cell layers ; hairs not present present (upper and lower epidermis) ; 4 Question Answer Marks 2(c)(i) 1 records measured length of line Z ; A suitable range of measurements based on printed diagram 2 shows mm and converts to μm by multiplying by 1000 and shows division by magnification (× 200) ; 3 appropriate units for final answer (μm) ; 4 shows answer to two or three significant figures ; 4 2(c)(ii) stage micrometer ; 1
What was in this paper
The subtopics covered by these 2 questions, and how many questions each got. Open one in a new tab to see every Cambridge question on it.