Cambridge A Level Biology 9700 — 2020 May/June Paper 3 · Variant 3
9700/33/M/J/20 · 2 questions · 29 marks · ≈33 min
The question paper and its mark scheme, free to read here and free to download. This is Cambridge’s own paper, exactly as it was sat.
Question paper12 pages
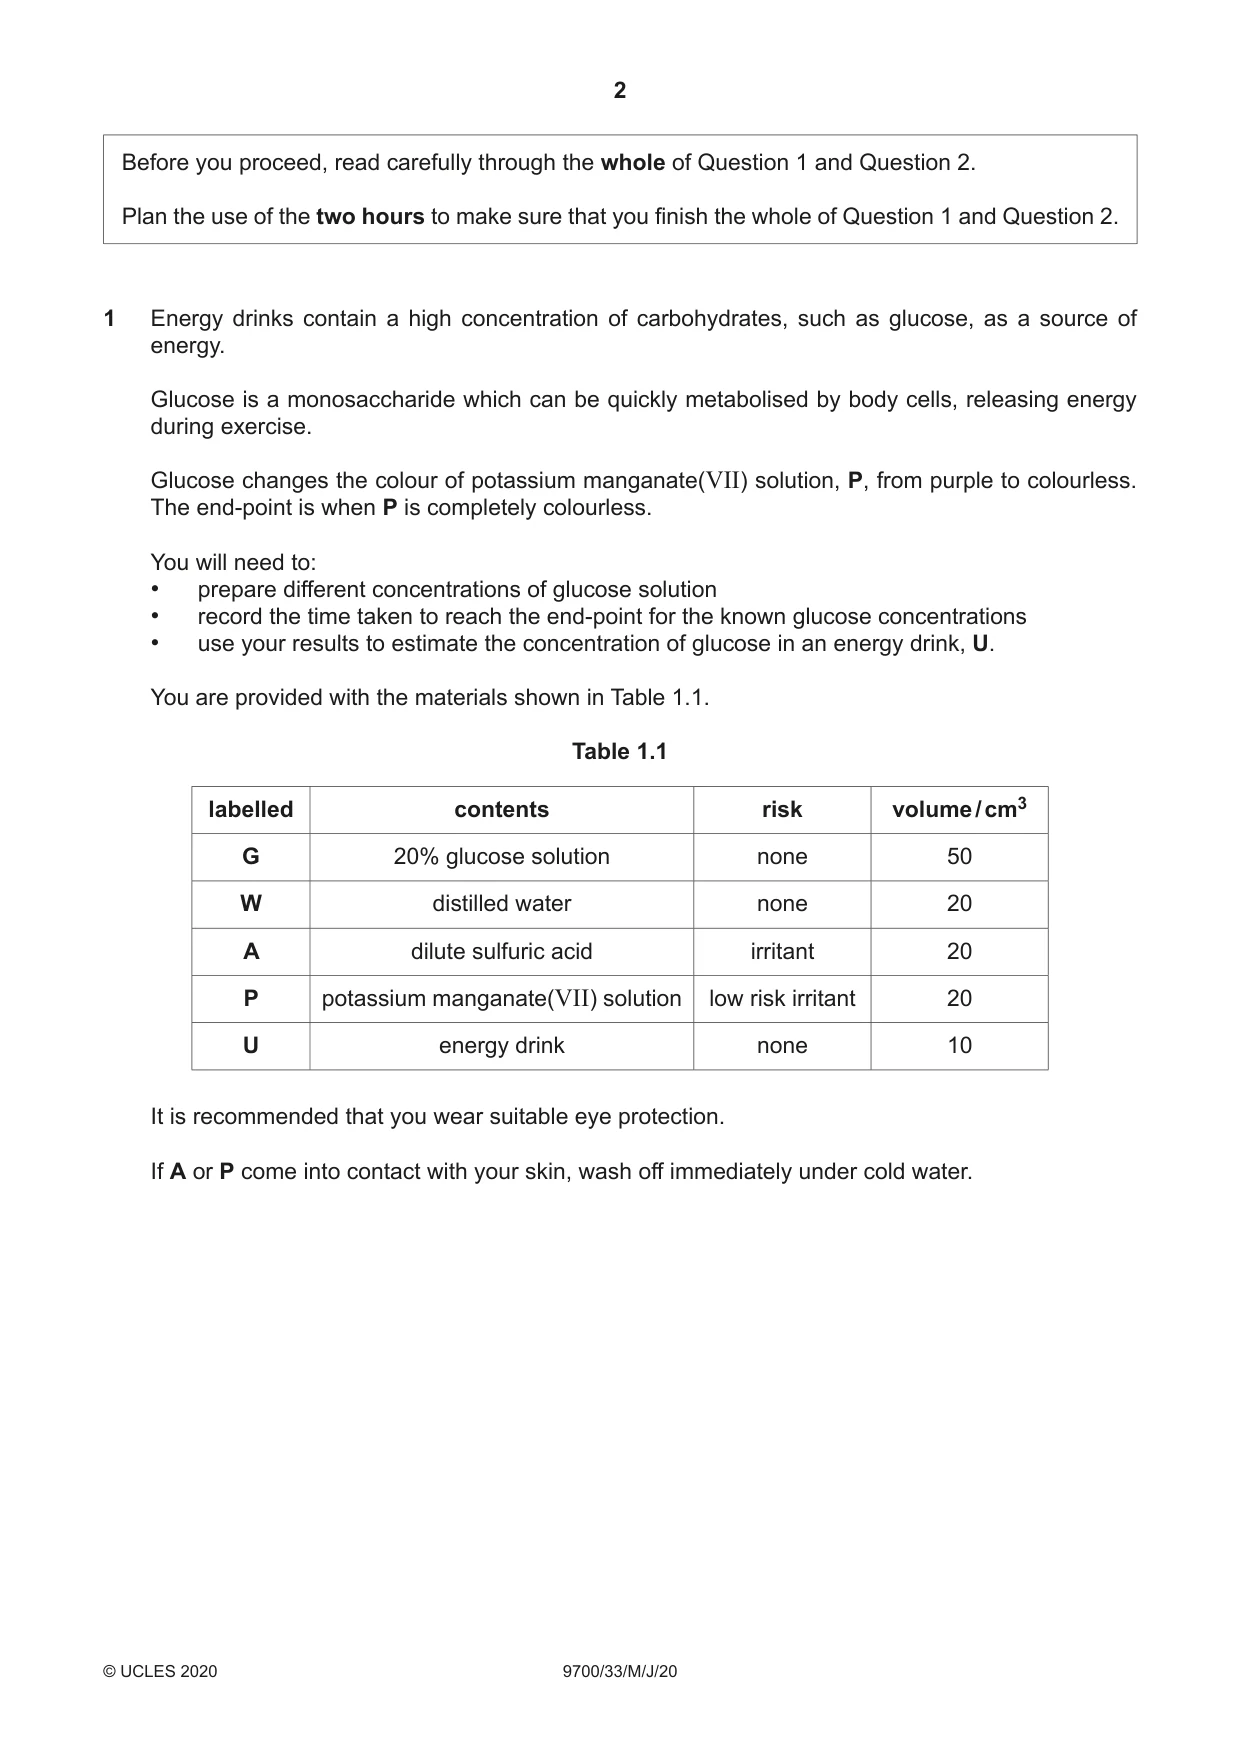
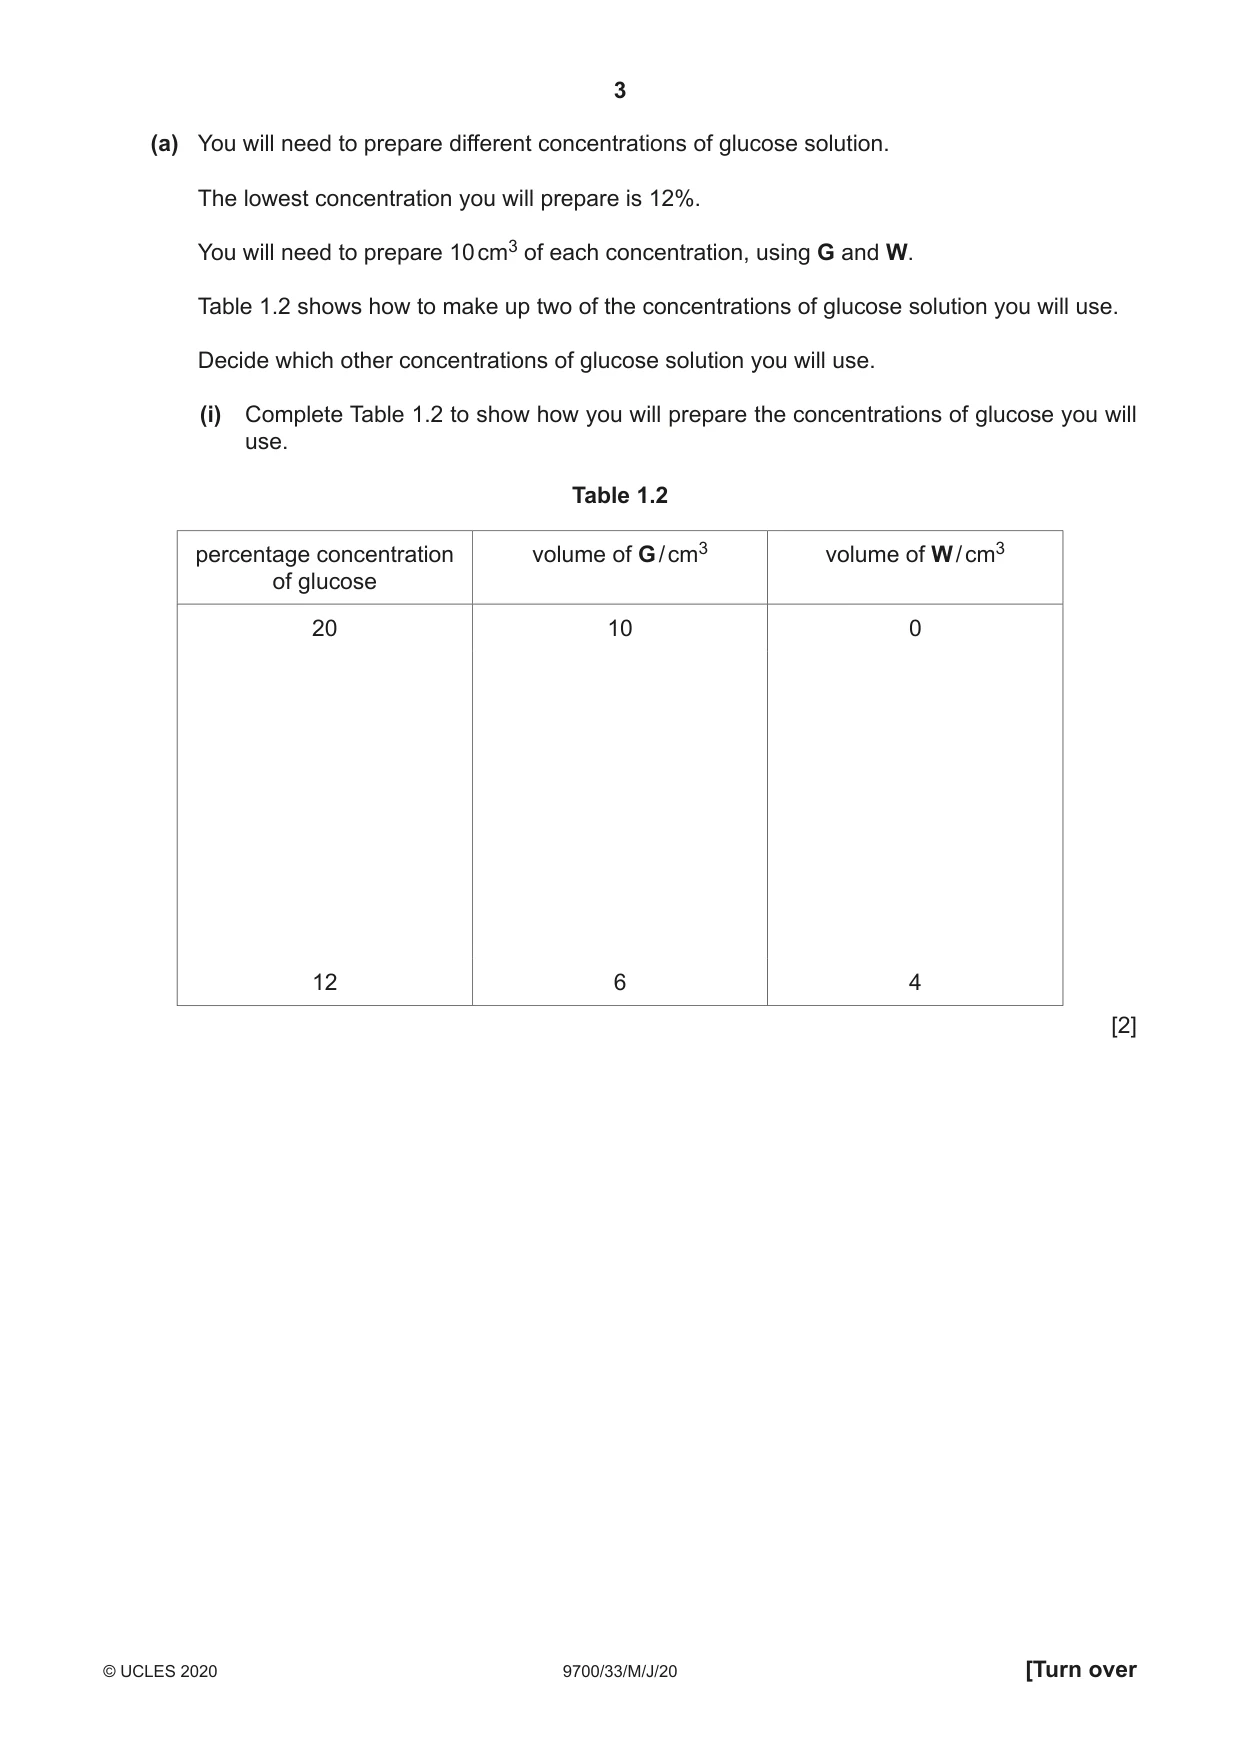
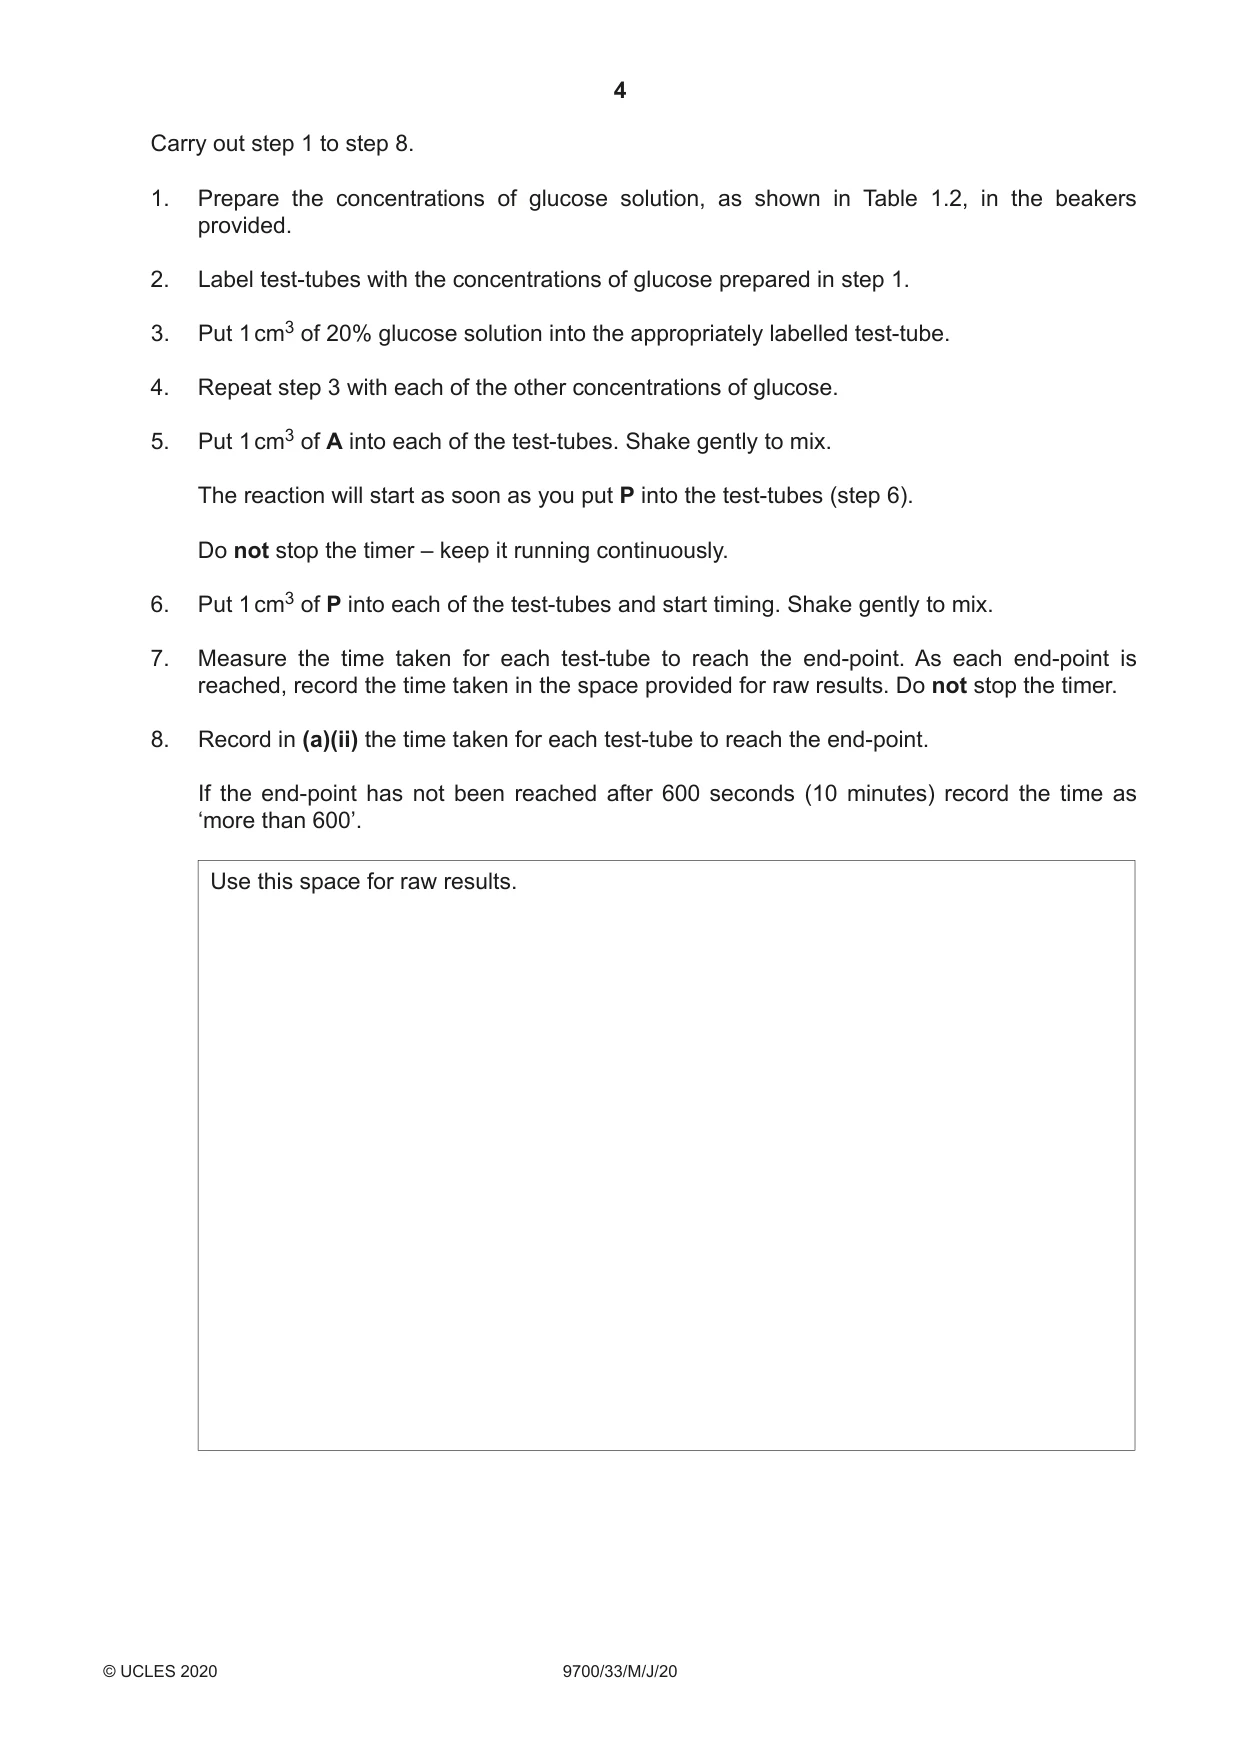
Mark scheme9 pages
Answers below. Sit the paper first if you are practising.
Questions as text
Q1 · Energy drinks contain a high concentration of carbohydrates, such as glucose, as a source…
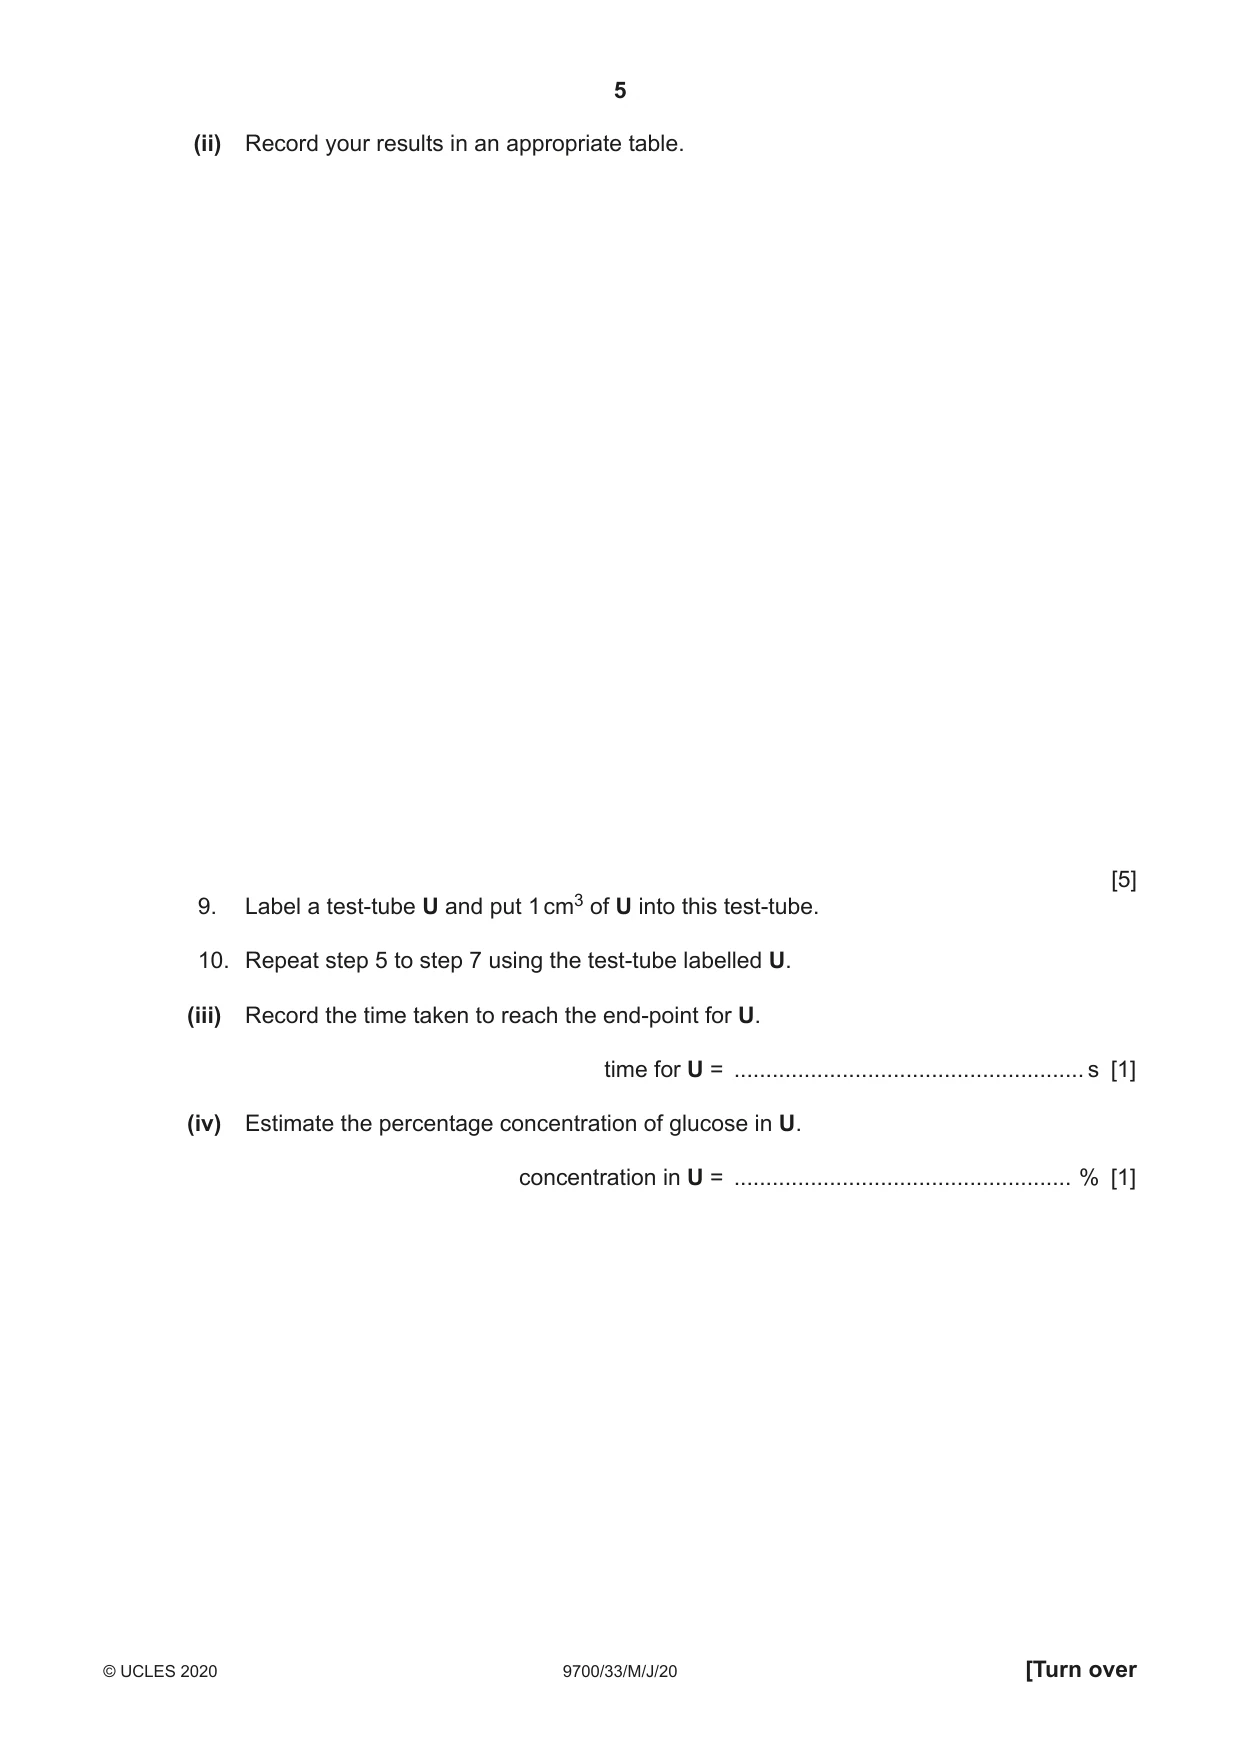
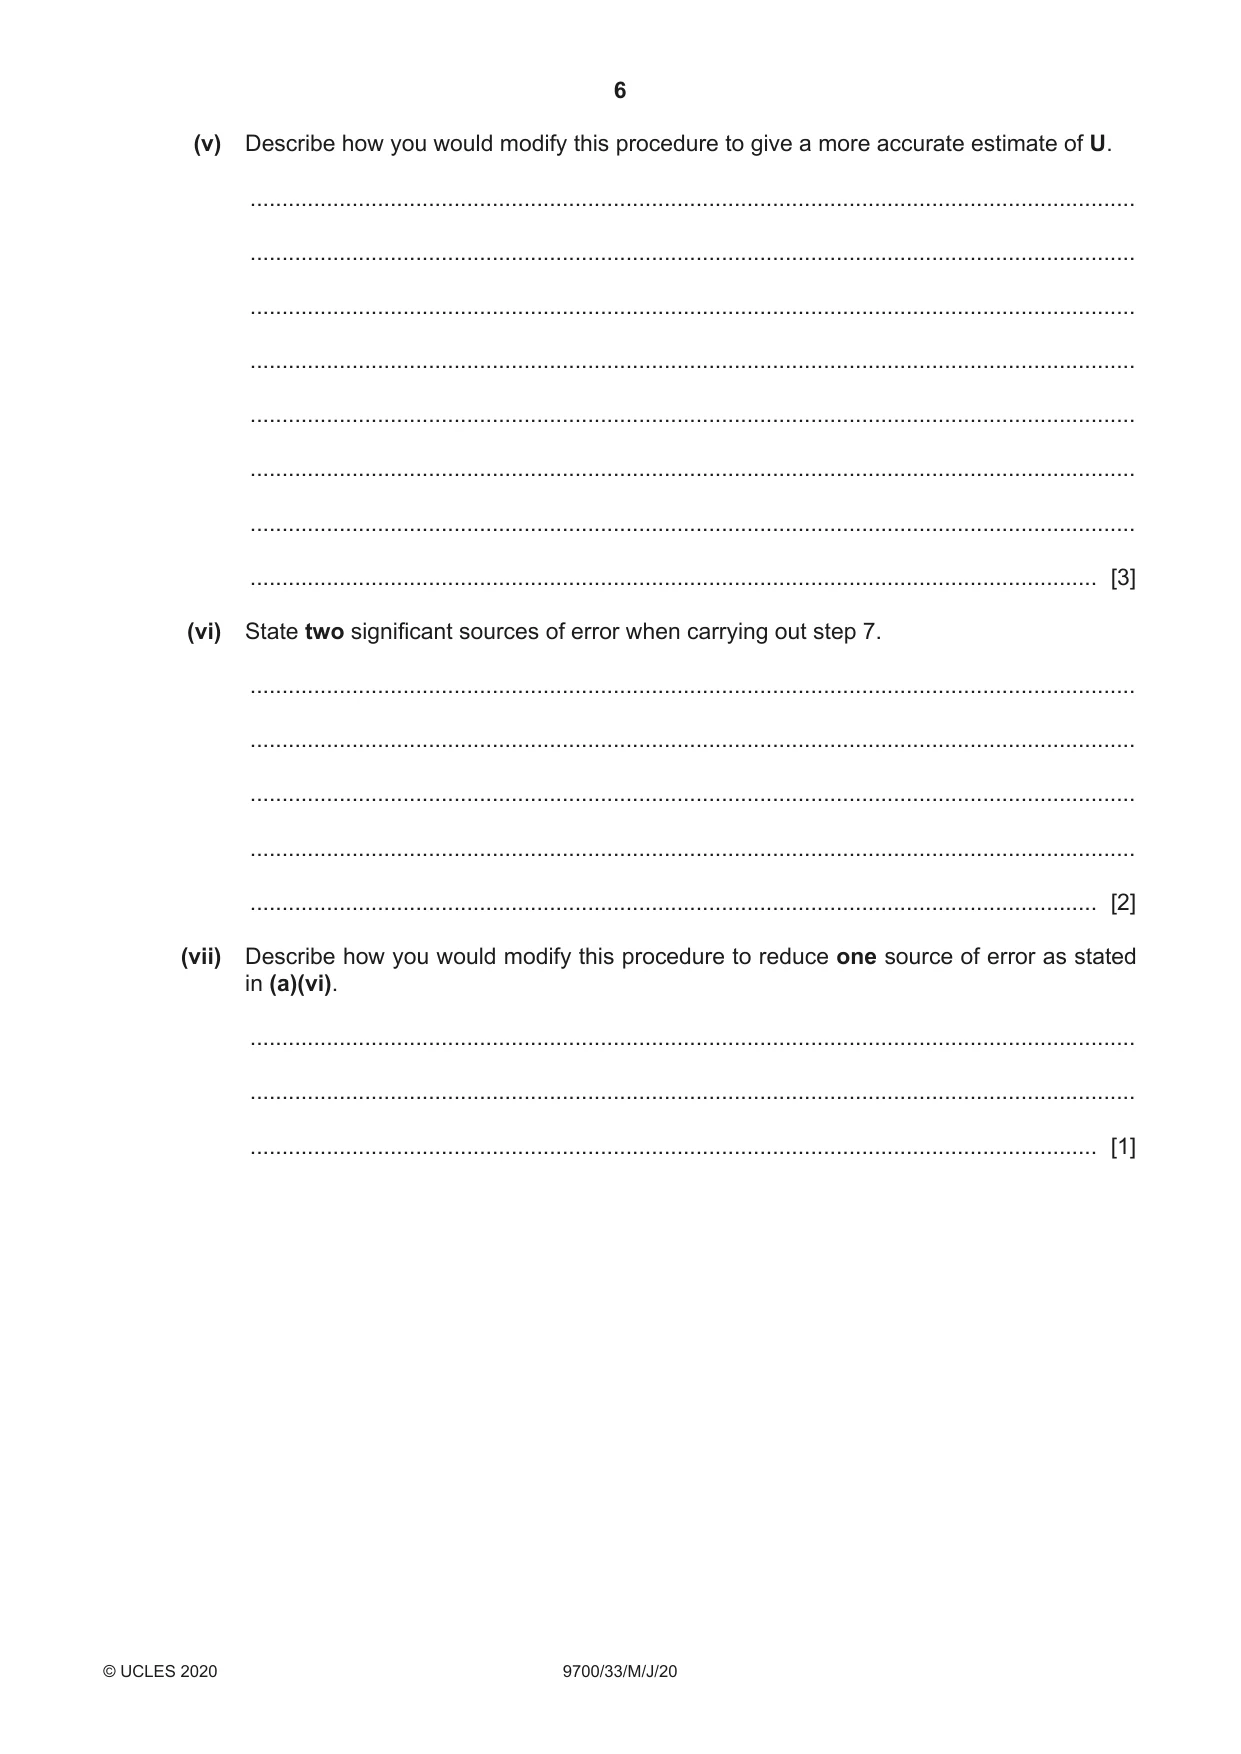
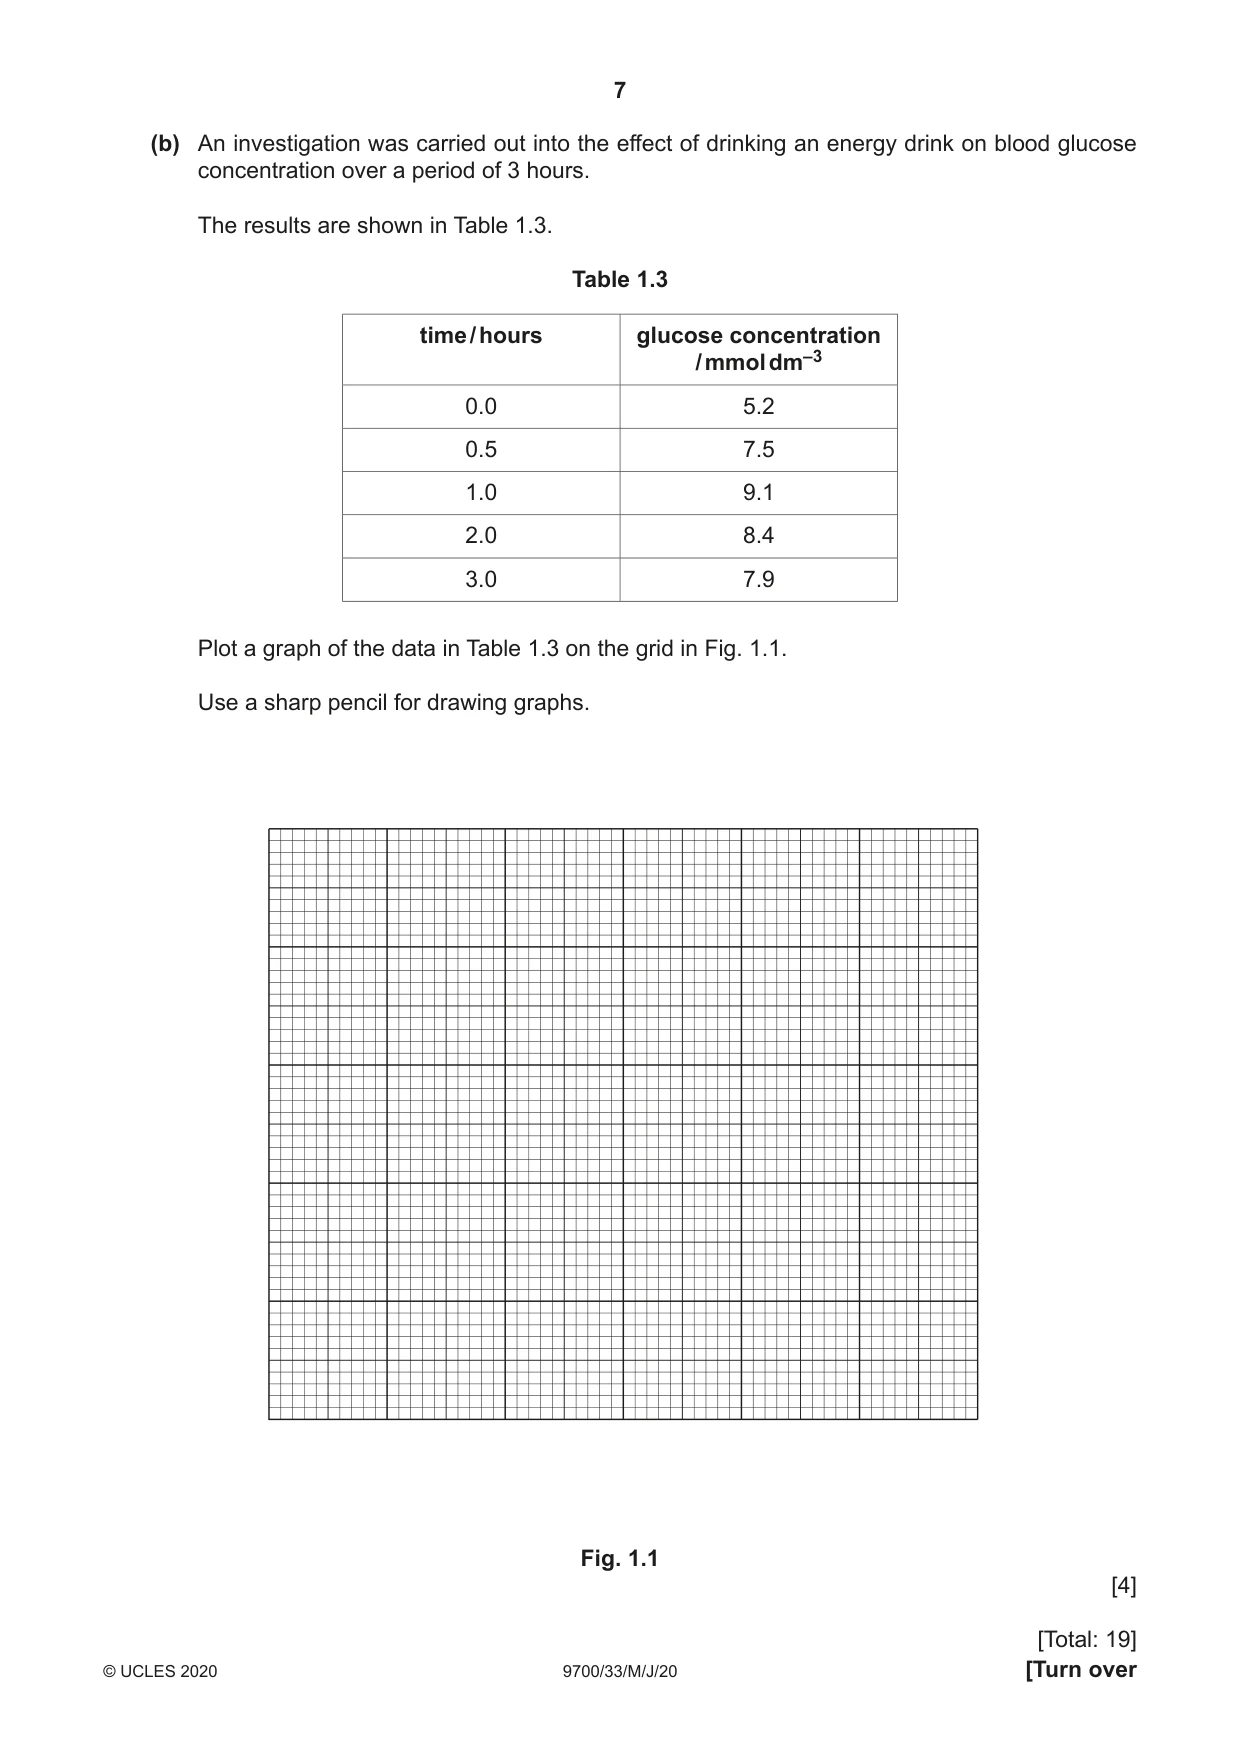
1 Energy drinks contain a high concentration of carbohydrates, such as glucose, as a source of energy. Glucose is a monosaccharide which can be quickly metabolised by body cells, releasing energy during exercise. Glucose changes the colour of potassium manganate(VII) solution, P, from purple to colourless. The end-point is when P is completely colourless. You will need to: • prepare different concentrations of glucose solution • record the time taken to reach the end-point for the known glucose concentrations • use your results to estimate the concentration of glucose in an energy drink, U. You are provided with the materials shown in Table 1.1. Table 1.1 labelled contents risk volume / cm3 G 20% glucose solution none 50 W distilled water none 20 A dilute sulfuric acid irritant 20 P potassium manganate(VII) solution low risk irritant 20 U energy drink none 10 It is recommended that you wear suitable eye protection. If A or P come into contact with your skin, wash off immediately under cold water. (a) You will need to prepare different concentrations of glucose solution. The lowest concentration you will prepare is 12%. You will need to prepare 10 cm3 of each concentration, using G and W. Table 1.2 shows how to make up two of the concentrations of glucose solution you will use. Decide which other concentrations of glucose solution you will use. (i) Complete Table 1.2 to show how you will prepare the concentrations of glucose you will use. Table 1.2 percentage concentration volume of G / cm3 volume of W / cm3 of glucose 20 10 0 12 6 4 [2] Carry out step 1 to step 8. 1. Prepare the concentrations of glucose solution, as shown in Table 1.2, in the beakers provided. 2. Label test-tubes with the concentrations of glucose prepared in step 1. 3. Put 1 cm3 of 20% glucose solution into the appropriately labelled test-tube. 4. Repeat step 3 with each of the other concentrations of glucose. 5. Put 1 cm3 of A into each of the test-tubes. Shake gently to mix. The reaction will start as soon as you put P into the test-tubes (step 6). Do not stop the timer – keep it running continuously. 6. Put 1 cm3 of P into each of the test-tubes and start timing. Shake gently to mix. 7. Measure the time taken for each test-tube to reach the end-point. As each end-point is reached, record the time taken in the space provided for raw results. Do not stop the timer. 8. Record in (a)(ii) the time taken for each test-tube to reach the end-point. If the end-point has not been reached after 600 seconds (10 minutes) record the time as ‘more than 600’. Use this space for raw results. (ii) Record your results in an appropriate table. [5] 9. Label a test-tube U and put 1 cm3 of U into this test-tube. 10. Repeat step 5 to step 7 using the test-tube labelled U. (iii) Record the time taken to reach the end-point for U. time for U = ....................................................... s [1] (iv) Estimate the percentage concentration of glucose in U. concentration in U = ..................................................... % [1] (v) Describe how you would modify this procedure to give a more accurate estimate of U. ........................................................................................................................................... ........................................................................................................................................... ........................................................................................................................................... ........................................................................................................................................... ........................................................................................................................................... ........................................................................................................................................... ........................................................................................................................................... ..................................................................................................................................... [3] (vi) State two significant sources of error when carrying out step 7. ........................................................................................................................................... ........................................................................................................................................... ........................................................................................................................................... ........................................................................................................................................... ..................................................................................................................................... [2] (vii) Describe how you would modify this procedure to reduce one source of error as stated in (a)(vi). ........................................................................................................................................... ........................................................................................................................................... ..................................................................................................................................... [1] (b) An investigation was carried out into the effect of drinking an energy drink on blood glucose concentration over a period of 3 hours. The results are shown in Table 1.3. Table 1.3 time / hours glucose concentration / mmol dm–3 0.0 5.2 0.5 7.5 1.0 9.1 2.0 8.4 3.0 7.9 Plot a graph of the data in Table 1.3 on the grid in Fig. 1.1. Use a sharp pencil for drawing graphs. Fig. 1.1 [4] [Total: 19]
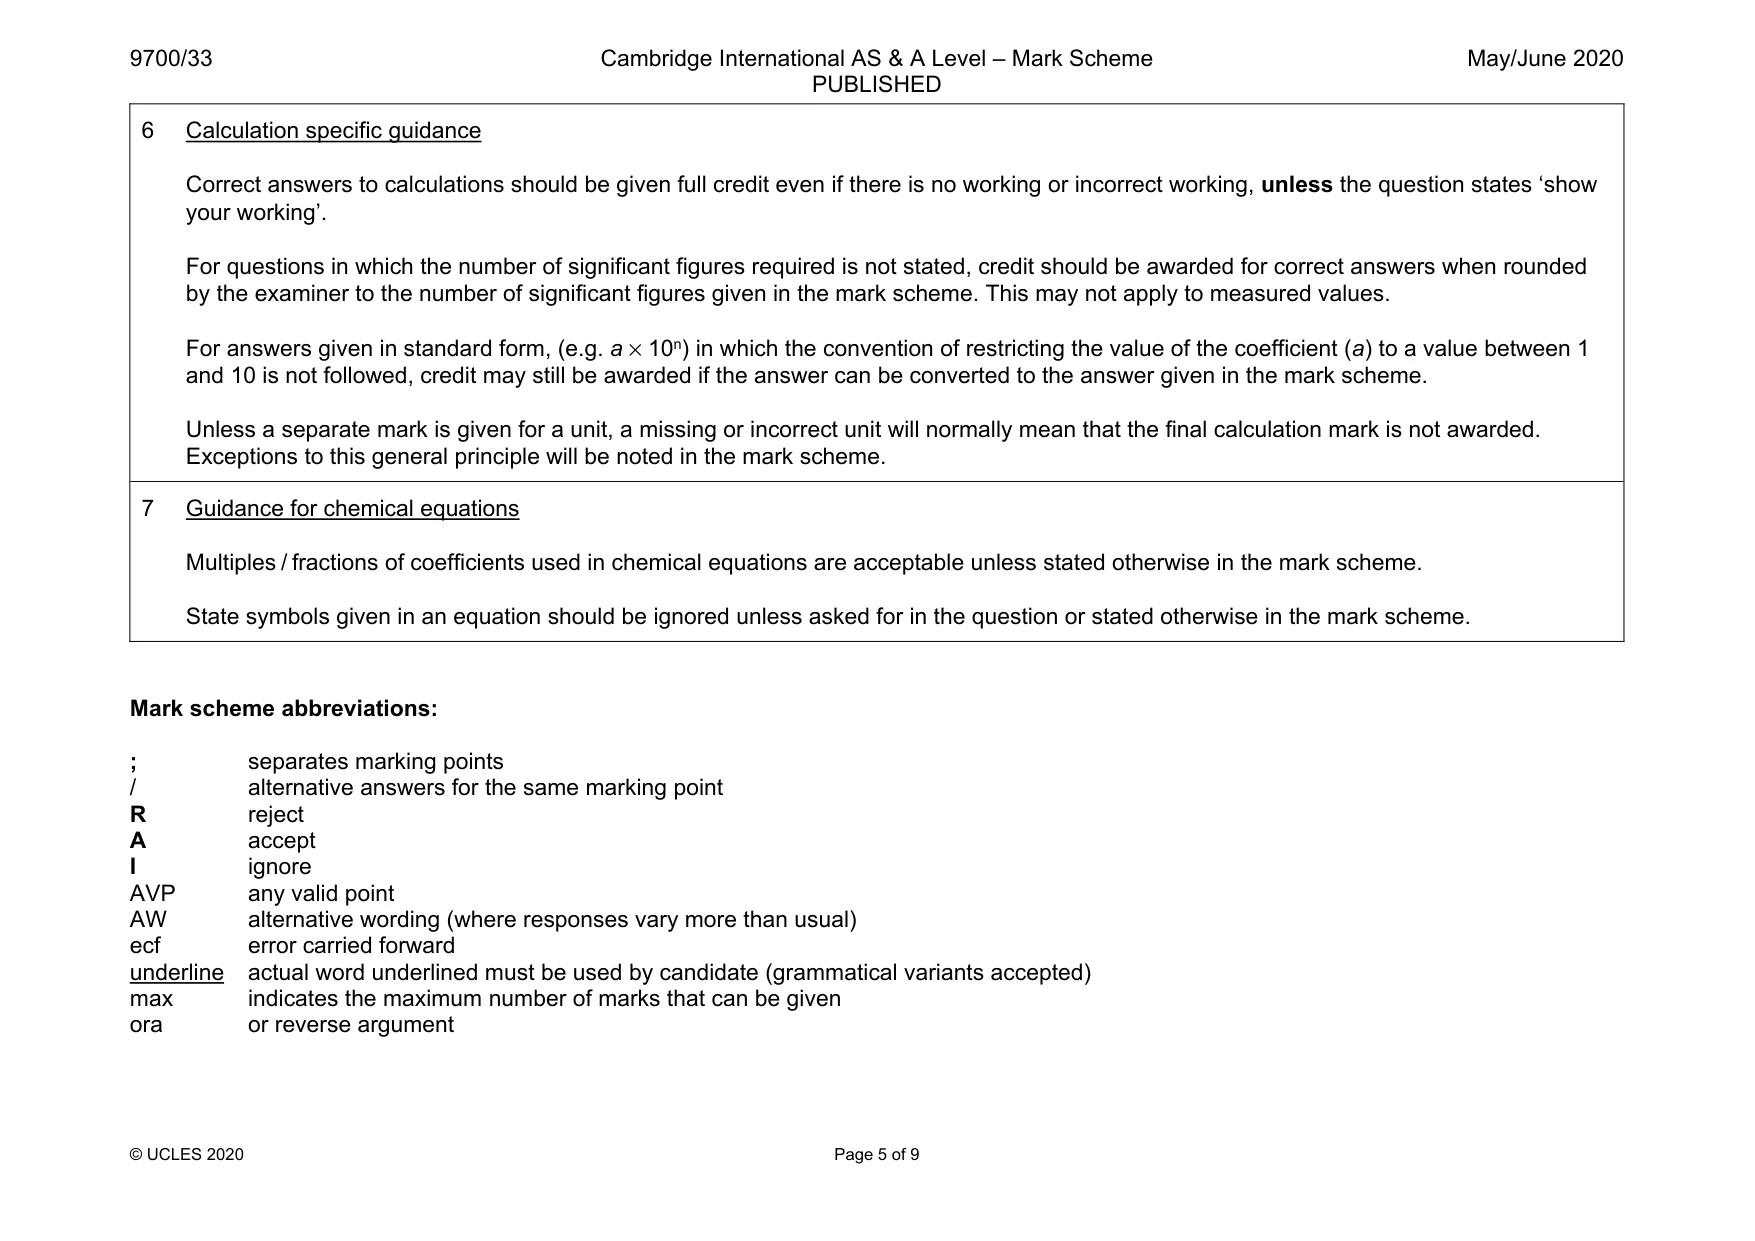
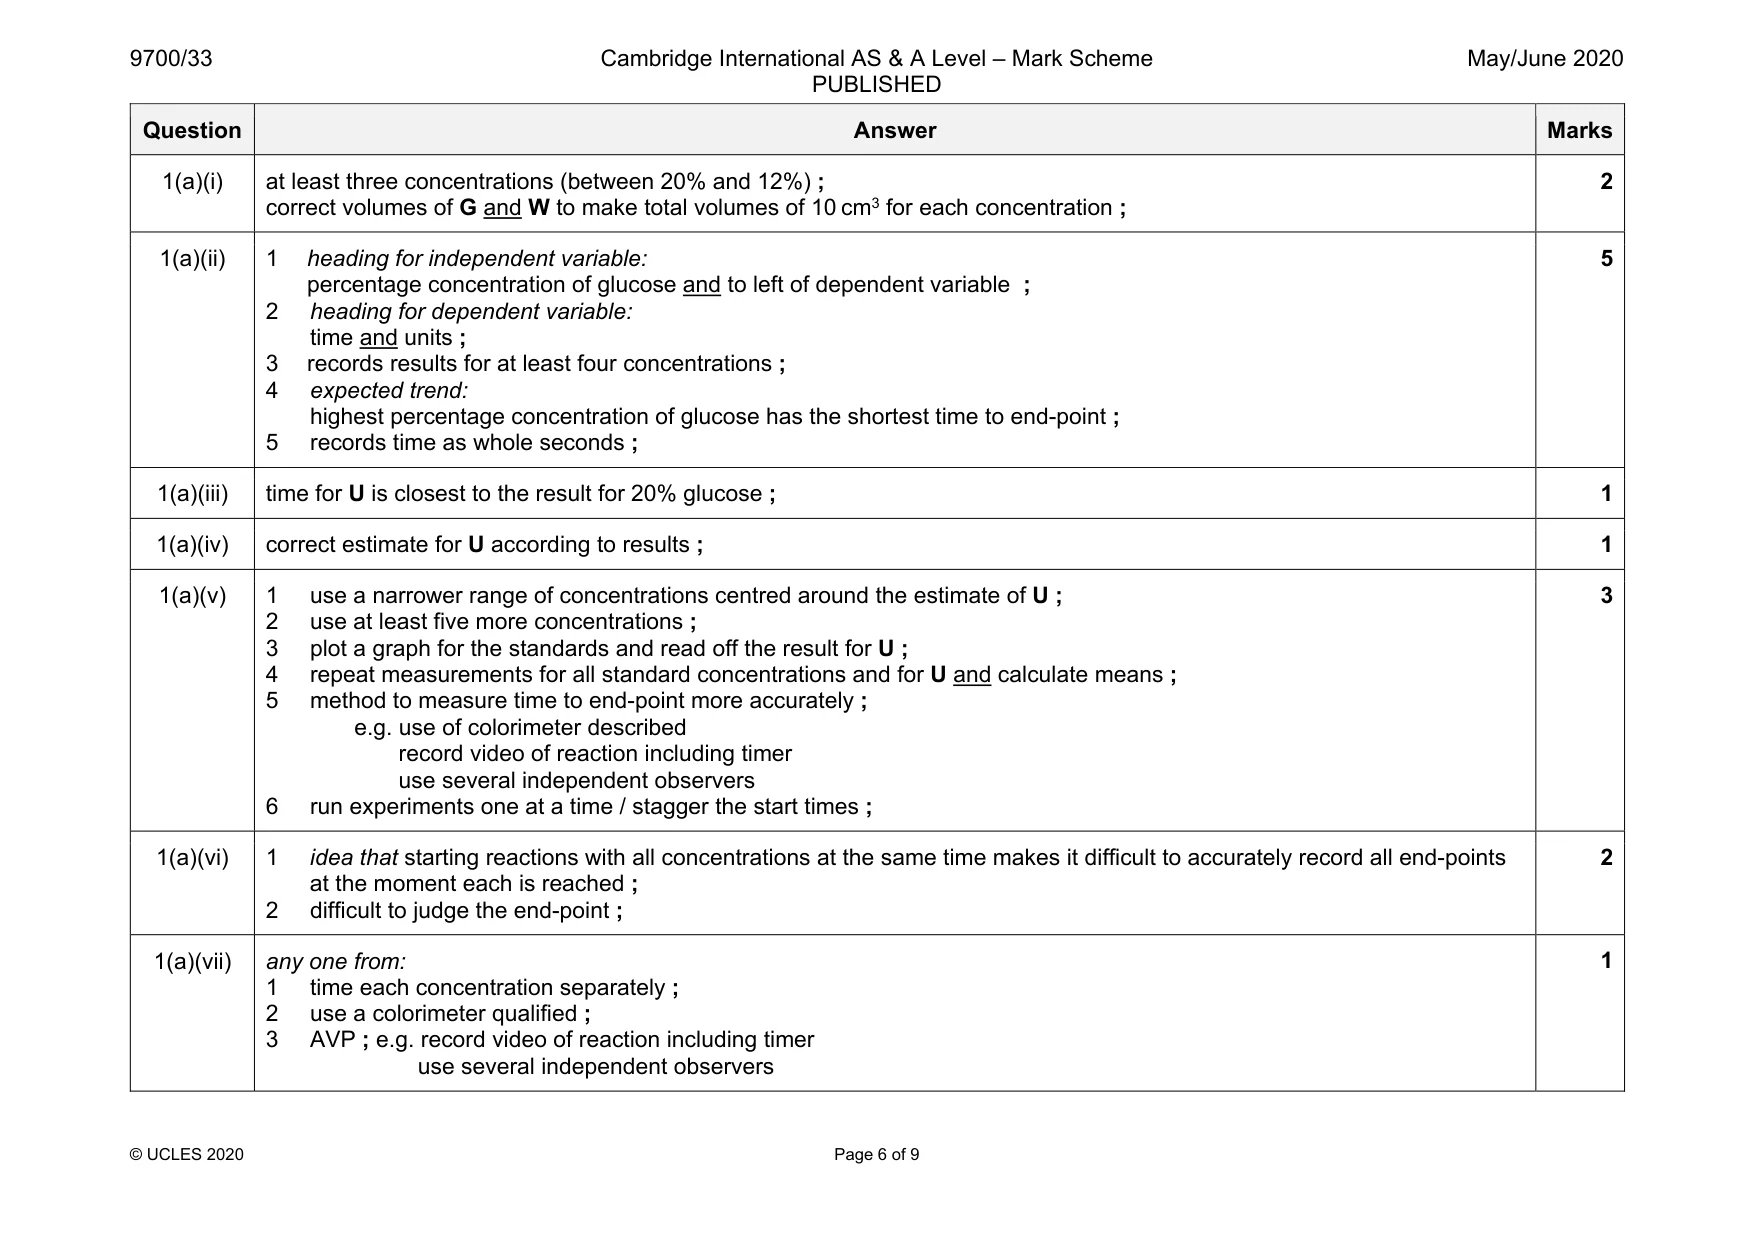
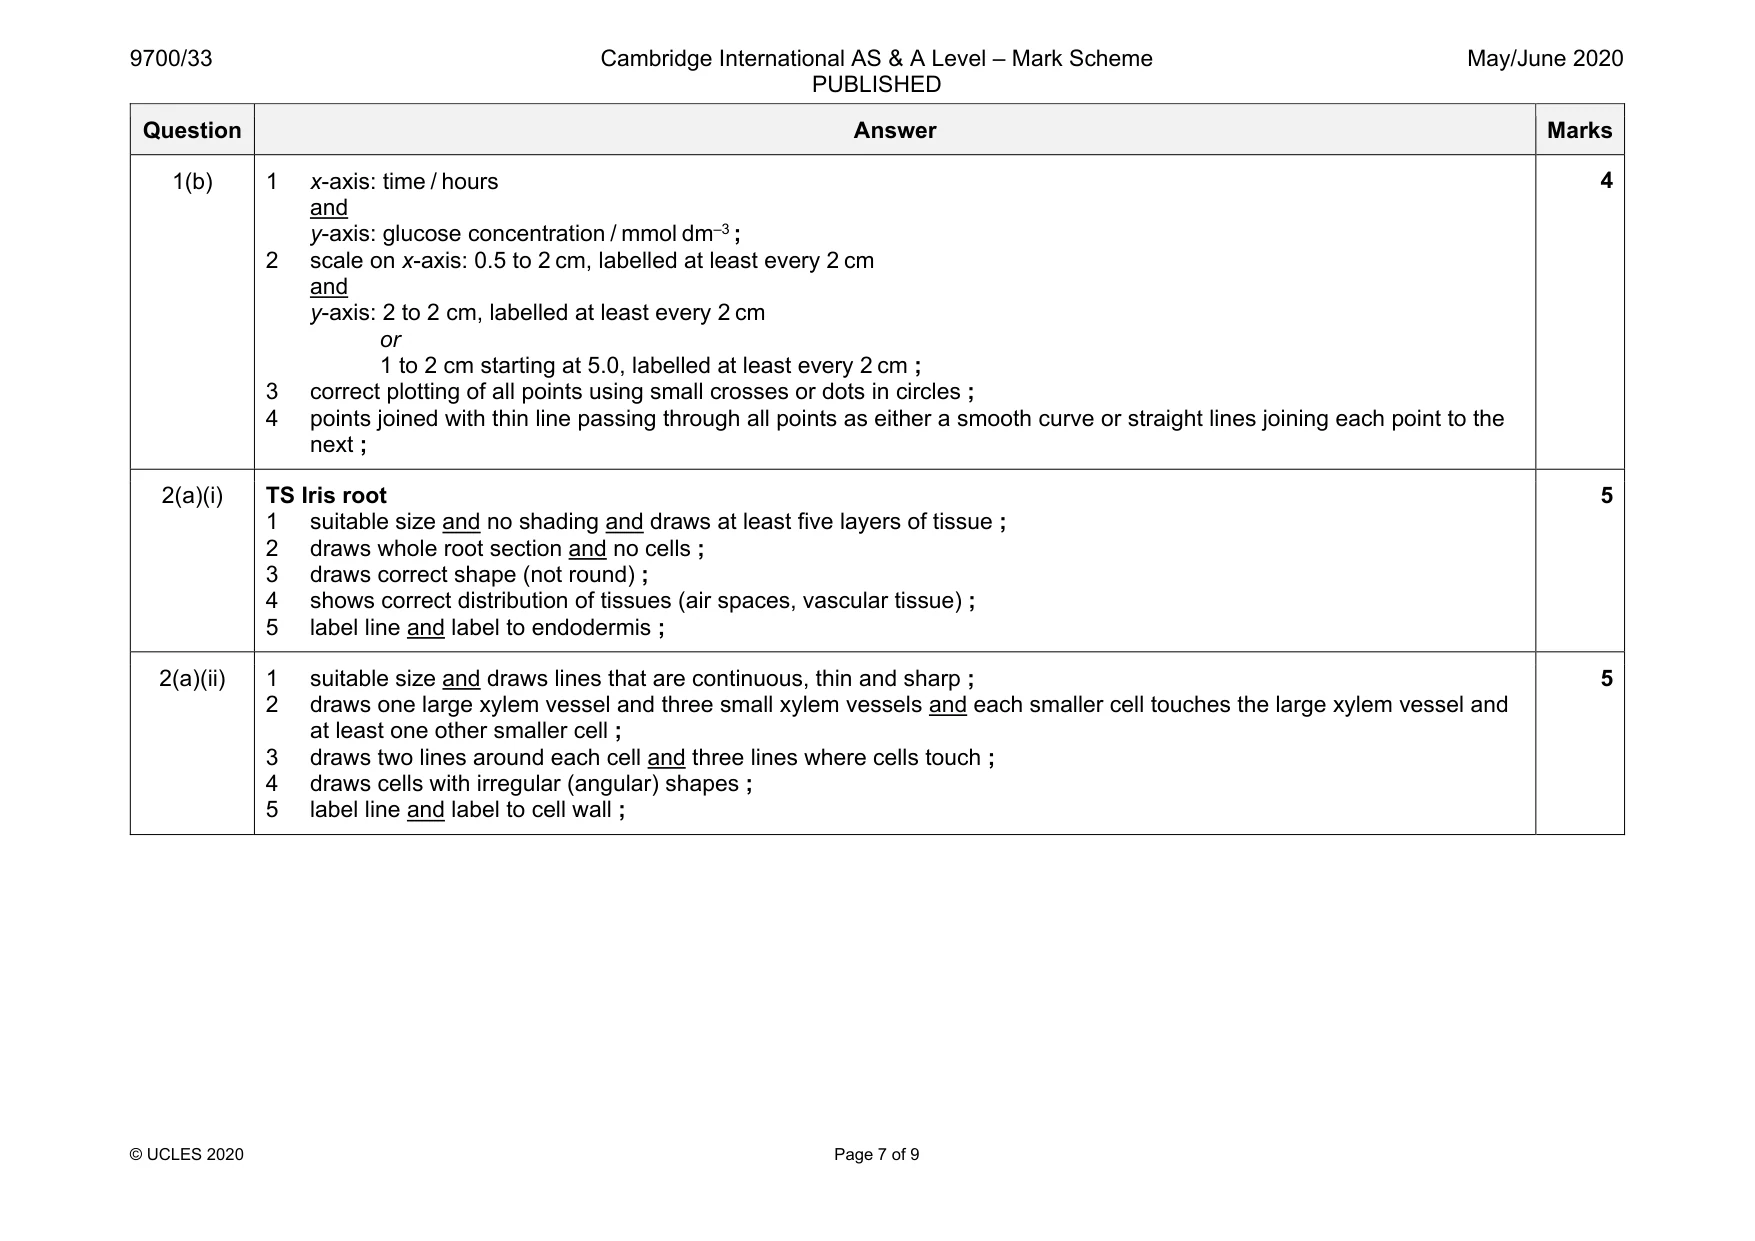
Mark scheme: 1(a)(i) at least three concentrations (between 20% and 12%) ; correct volumes of G and W to make total volumes of 10 cm3 for each concentration ; 2 1(a)(ii) 1 heading for independent variable: percentage concentration of glucose and to left of dependent variable ; 2 heading for dependent variable: time and units ; 3 records results for at least four concentrations ; 4 expected trend: highest percentage concentration of glucose has the shortest time to end-point ; 5 records time as whole seconds ; 5 1(a)(iii) time for U is closest to the result for 20% glucose ; 1 1(a)(iv) correct estimate for U according to results ; 1 1(a)(v) 1 use a narrower range of concentrations centred around the estimate of U ; 2 use at least five more concentrations ; 3 plot a graph for the standards and read off the result for U ; 4 repeat measurements for all standard concentrations and for U and calculate means ; 5 method to measure time to end-point more accurately ; e.g. use of colorimeter described record video of reaction including timer use several independent observers 6 run experiments one at a time / stagger the start times ; 3 1(a)(vi) 1 idea that starting reactions with all concentrations at the same time makes it difficult to accurately record all end-points at the moment each is reached ; 2 difficult to judge the end-point ; 2 1(a)(vii) any one from: 1 time each concentration separately ; 2 use a colorimeter qualified ; 3 AVP ; e.g. record video of reaction including timer use several independent observers 1 Question Answer Marks 1(b) 1 x-axis: time / hours and y-axis: glucose concentration / mmol dm–3 ; 2 scale on x-axis: 0.5 to 2 cm, labelled at least every 2 cm and y-axis: 2 to 2 cm, labelled at least every 2 cm or 1 to 2 cm starting at 5.0, labelled at least every 2 cm ; 3 correct plotting of all points using small crosses or dots in circles ; 4 points joined with thin line passing through all points as either a smooth curve or straight lines joining each point to the next ; 4
Q2 · K1 is a slide of a stained transverse section through a plant root
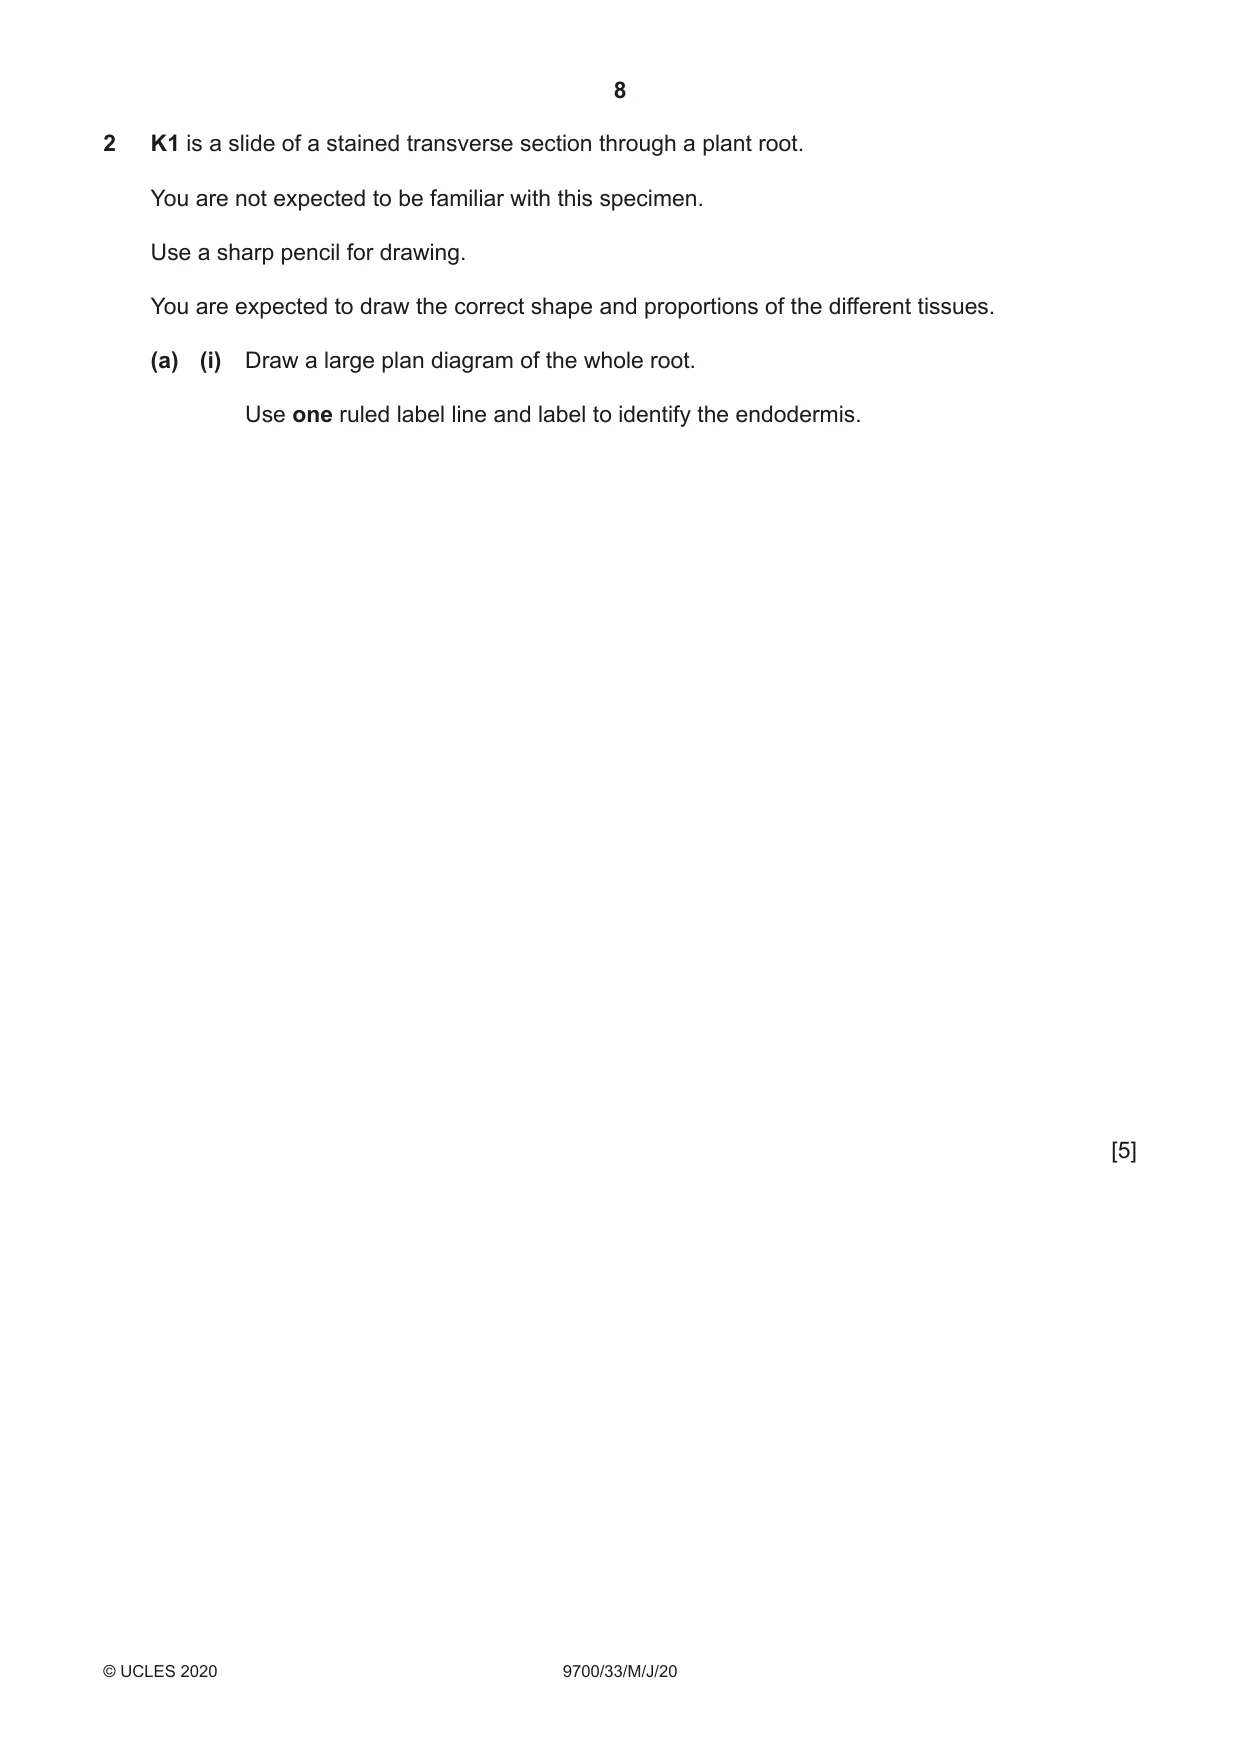
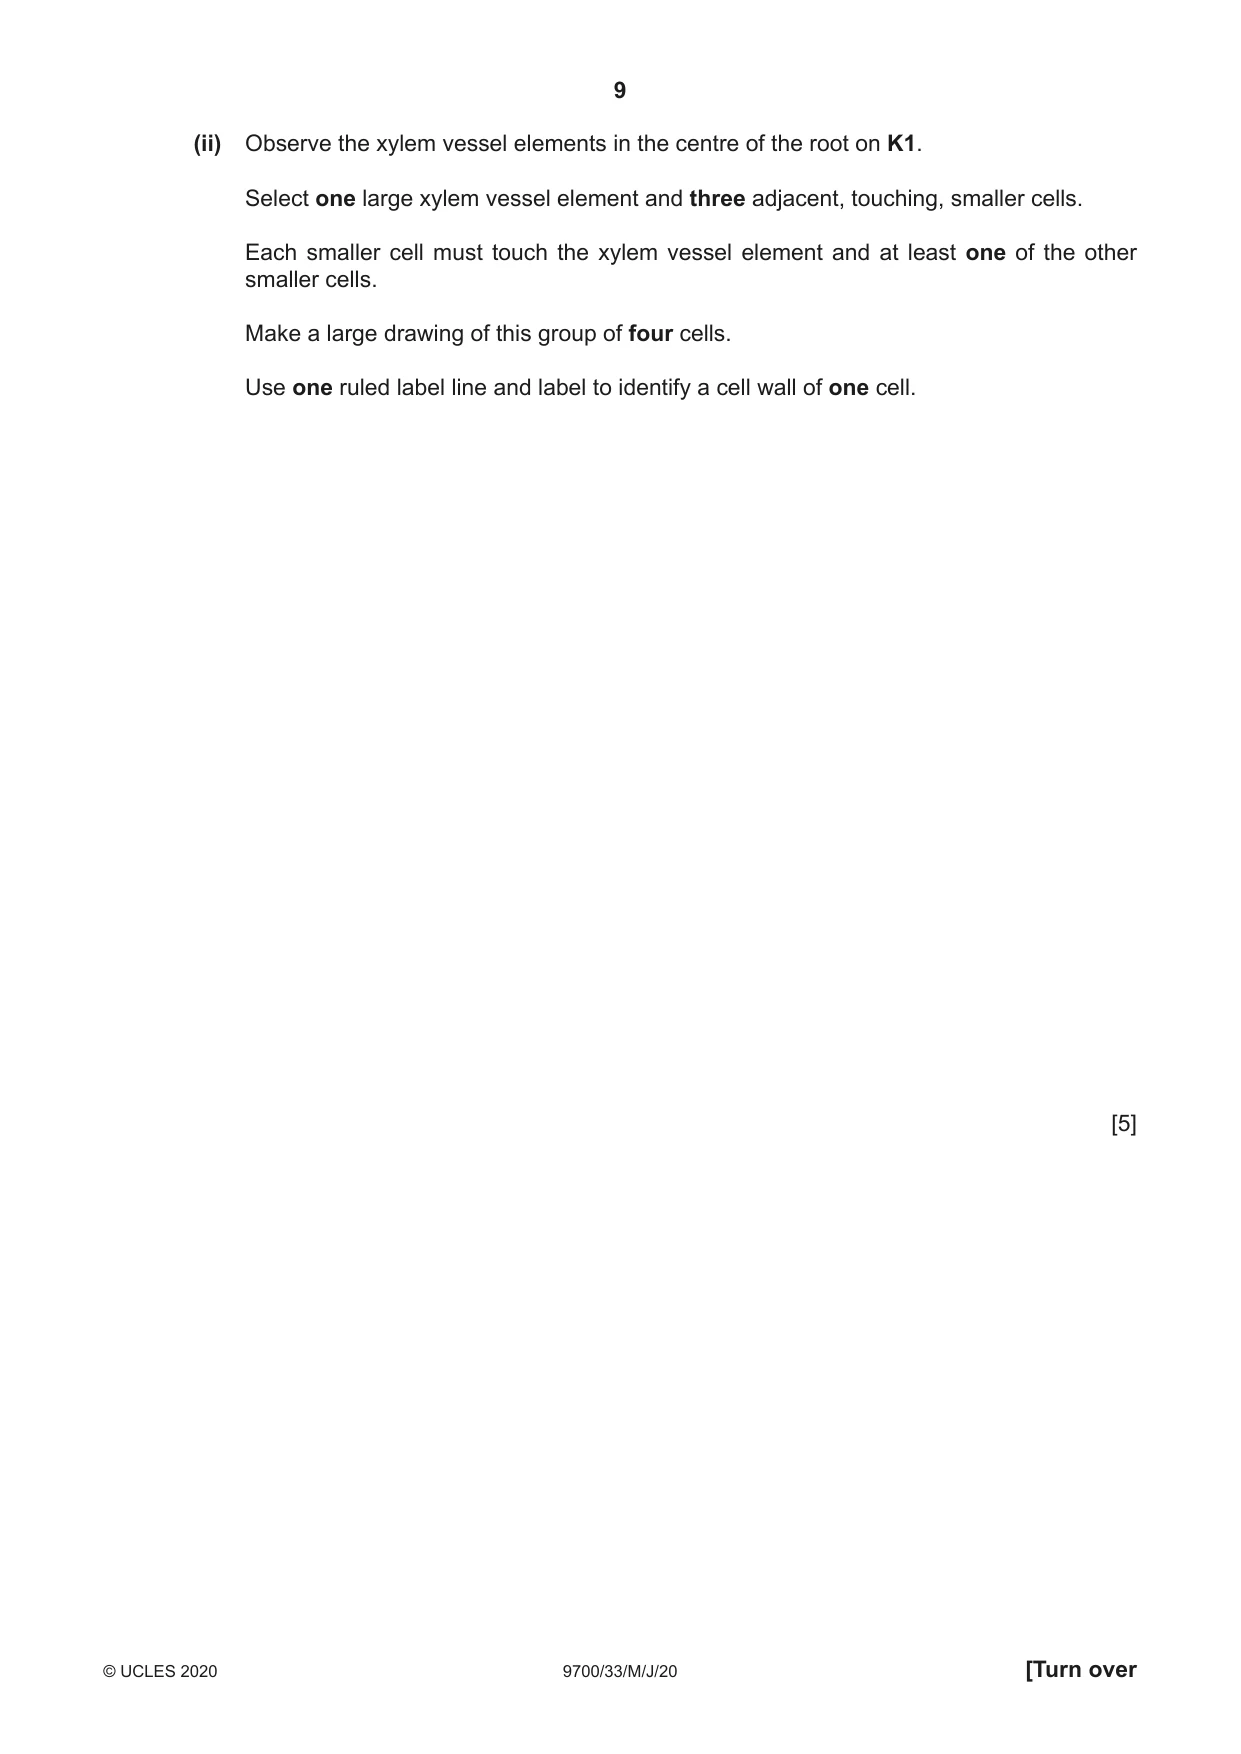
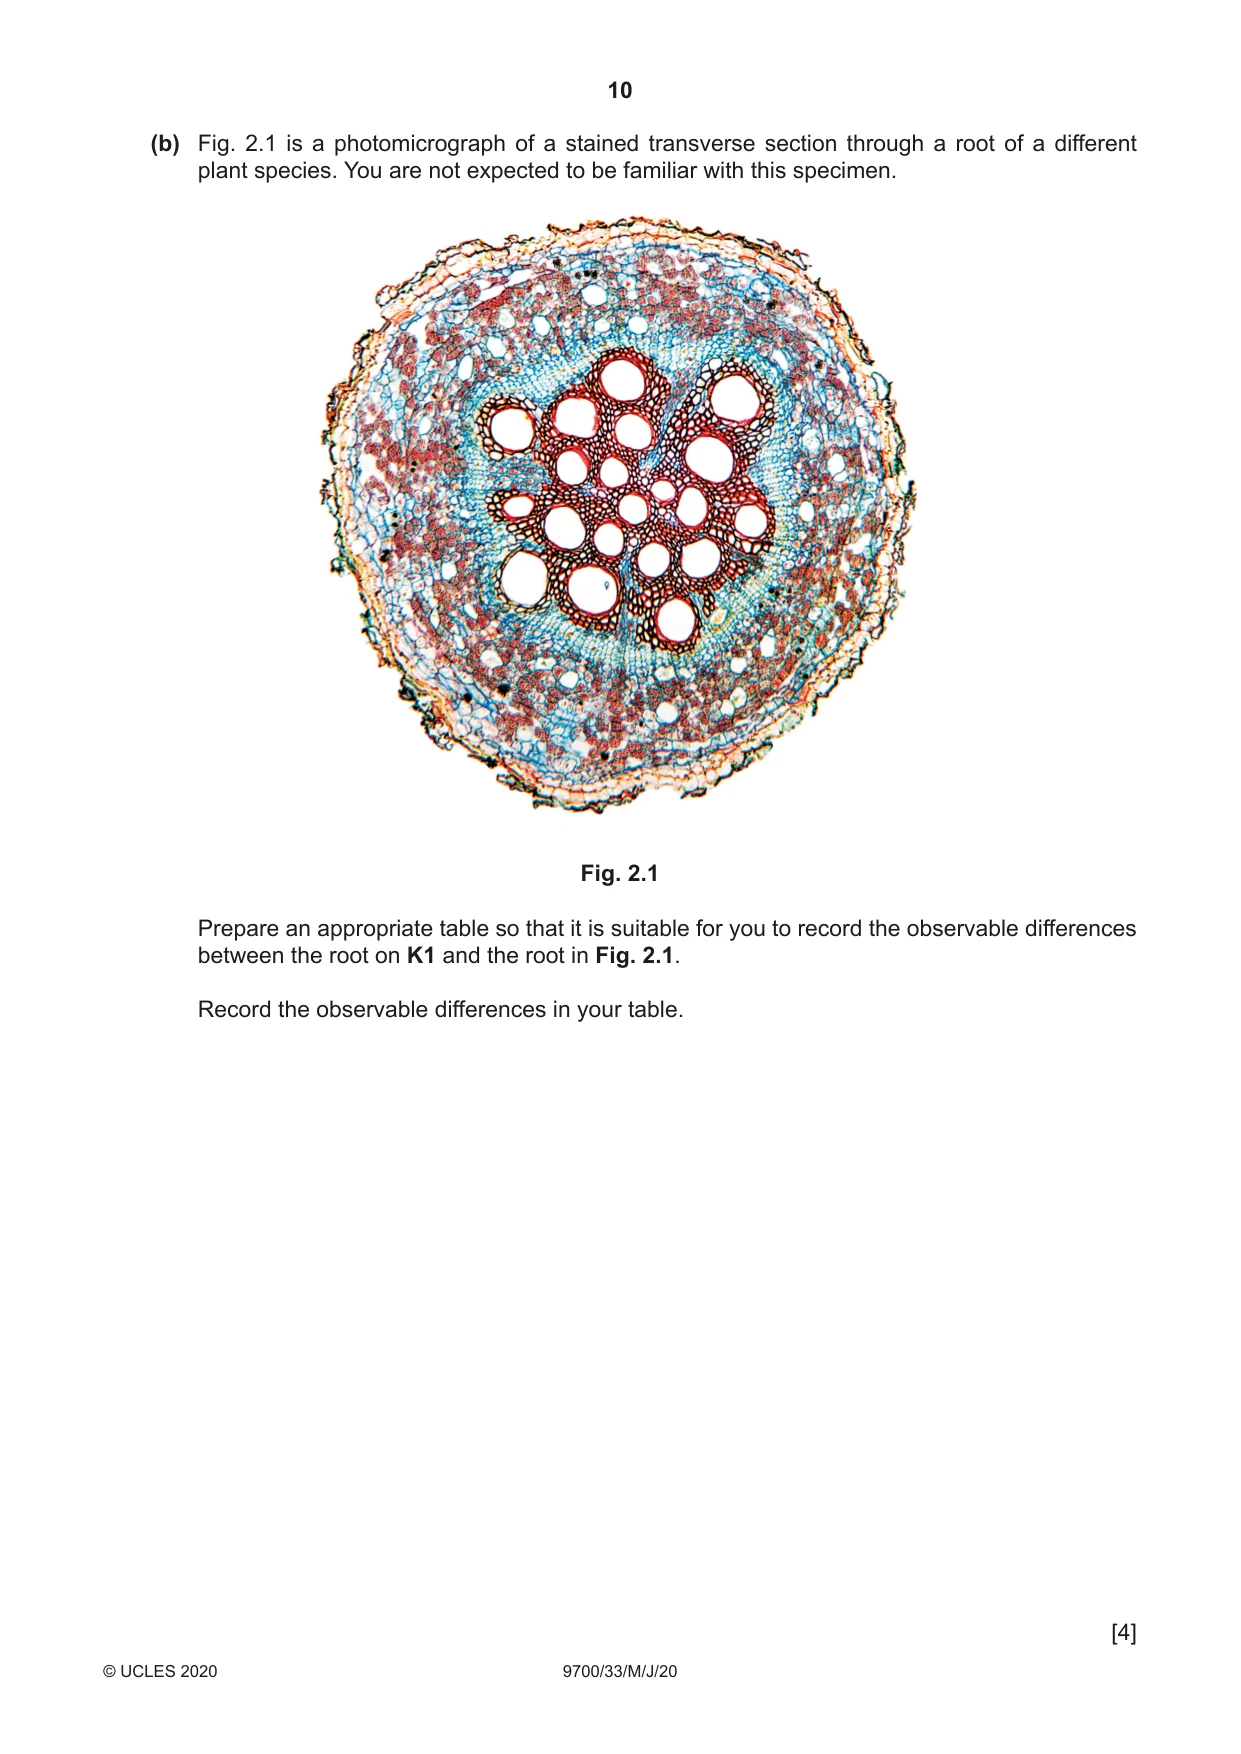
2 K1 is a slide of a stained transverse section through a plant root. You are not expected to be familiar with this specimen. Use a sharp pencil for drawing. You are expected to draw the correct shape and proportions of the different tissues. (a) (i) Draw a large plan diagram of the whole root. Use one ruled label line and label to identify the endodermis. [5] (ii) Observe the xylem vessel elements in the centre of the root on K1. Select one large xylem vessel element and three adjacent, touching, smaller cells. Each smaller cell must touch the xylem vessel element and at least one of the other smaller cells. Make a large drawing of this group of four cells. Use one ruled label line and label to identify a cell wall of one cell. [5] (b) Fig. 2.1 is a photomicrograph of a stained transverse section through a root of a different plant species. You are not expected to be familiar with this specimen. Fig. 2.1 Prepare an appropriate table so that it is suitable for you to record the observable differences between the root on K1 and the root in Fig. 2.1. Record the observable differences in your table.
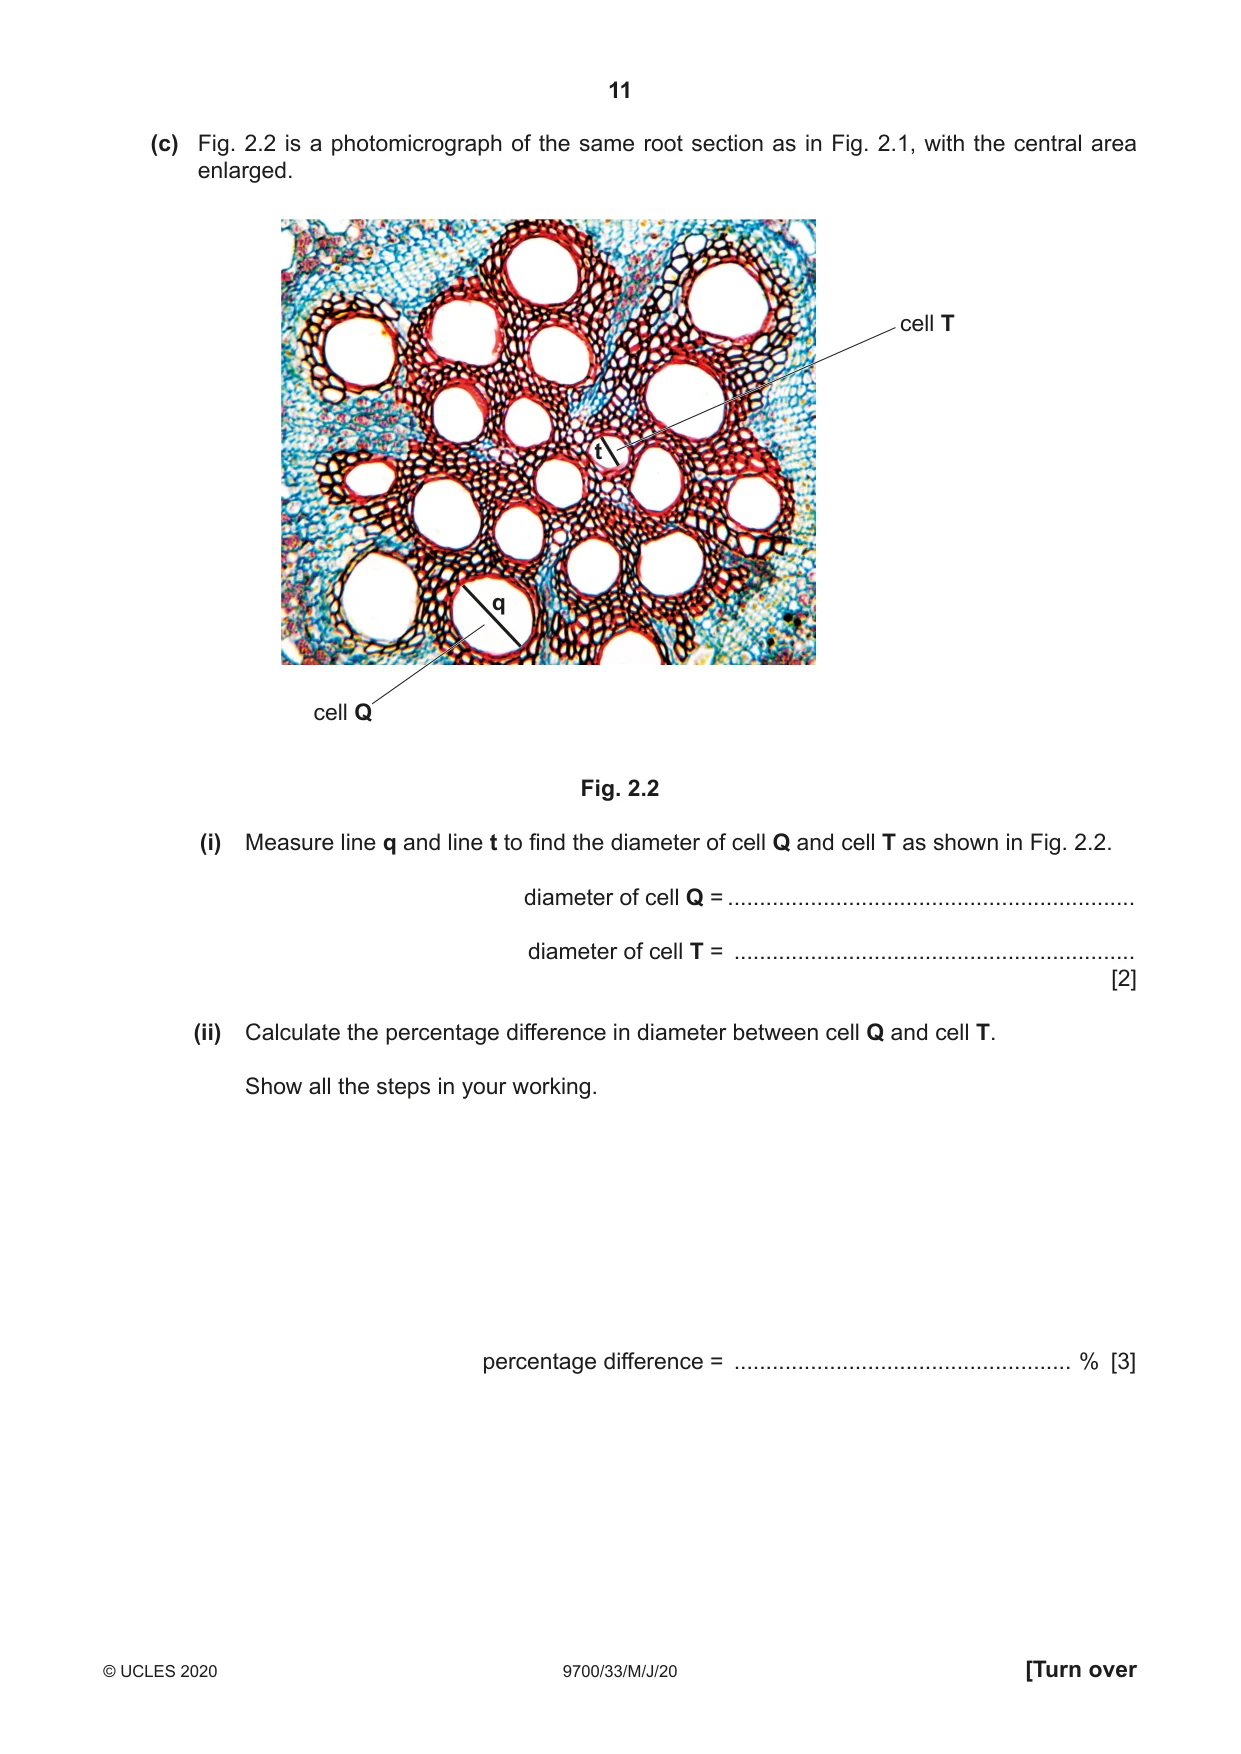
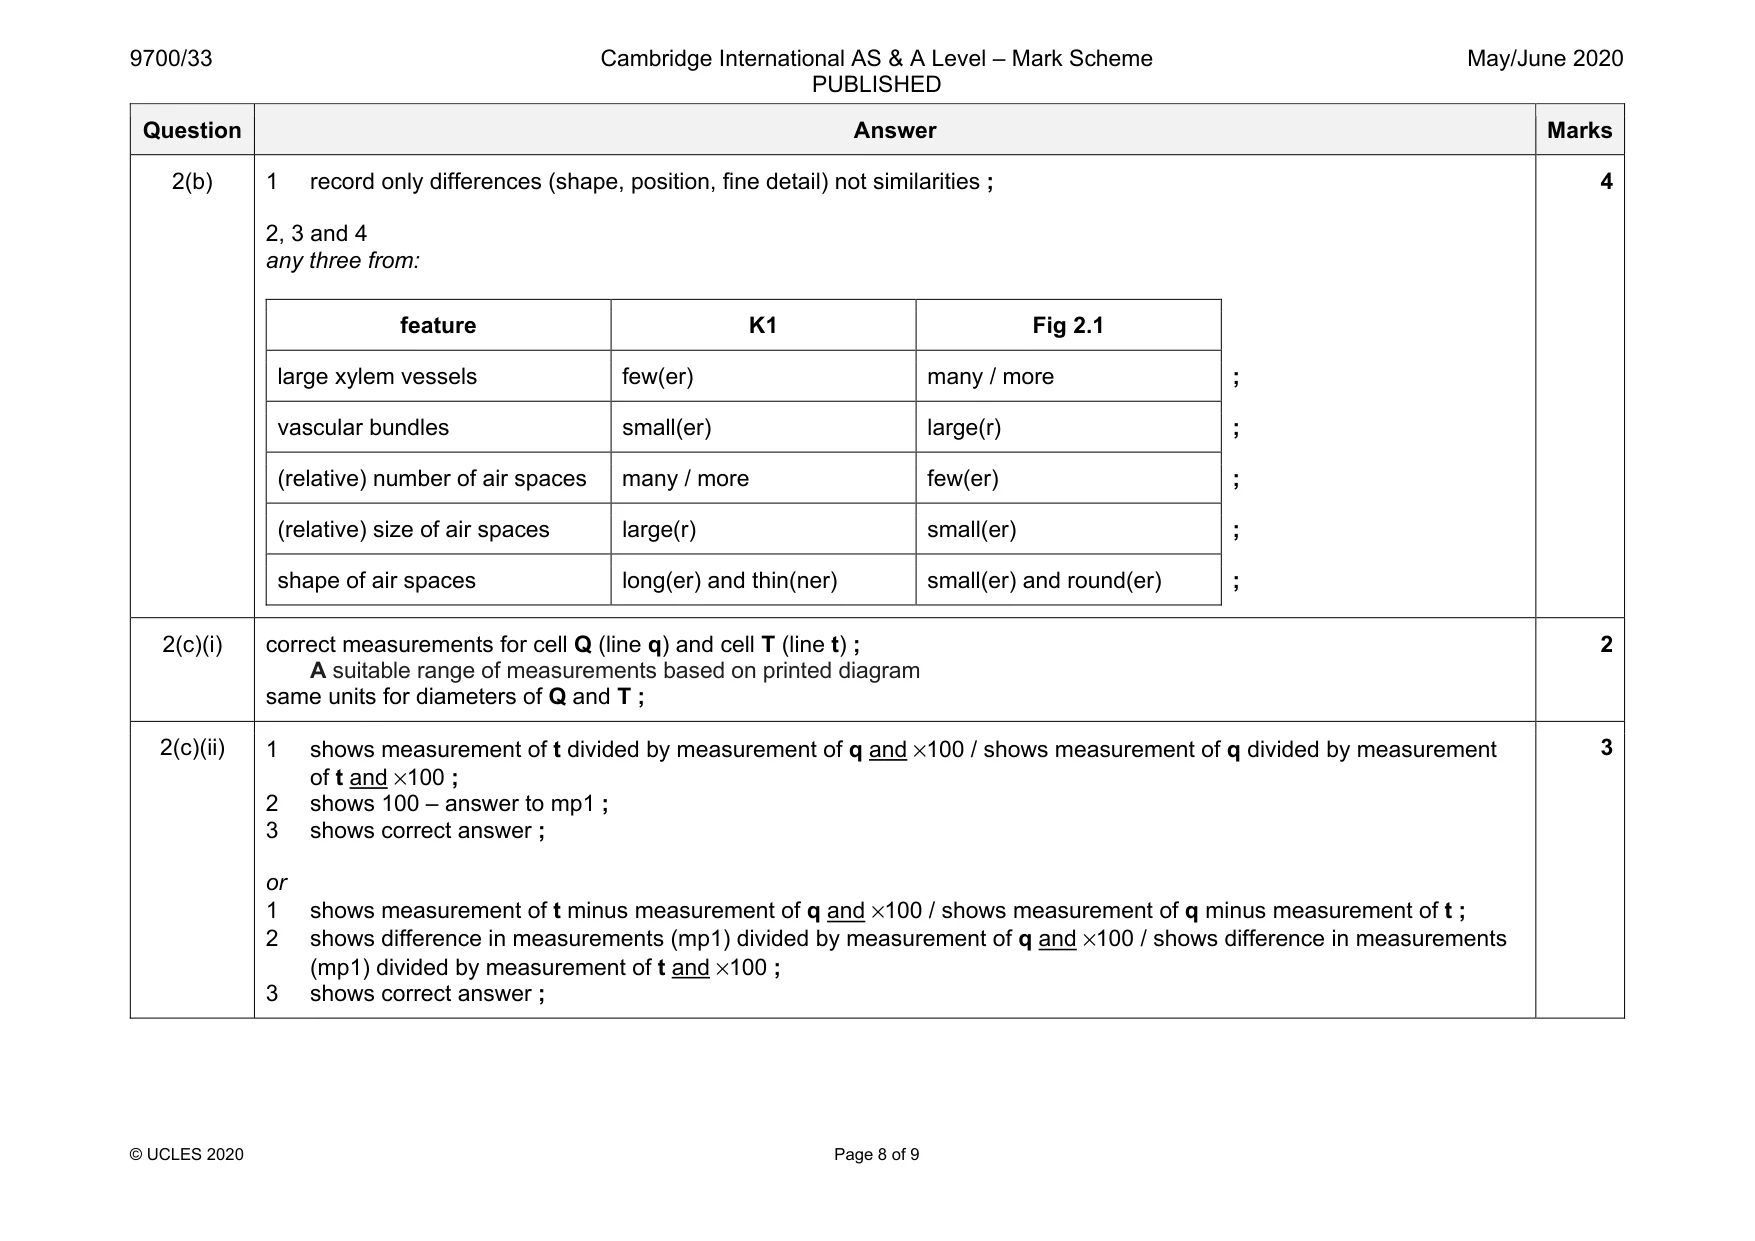
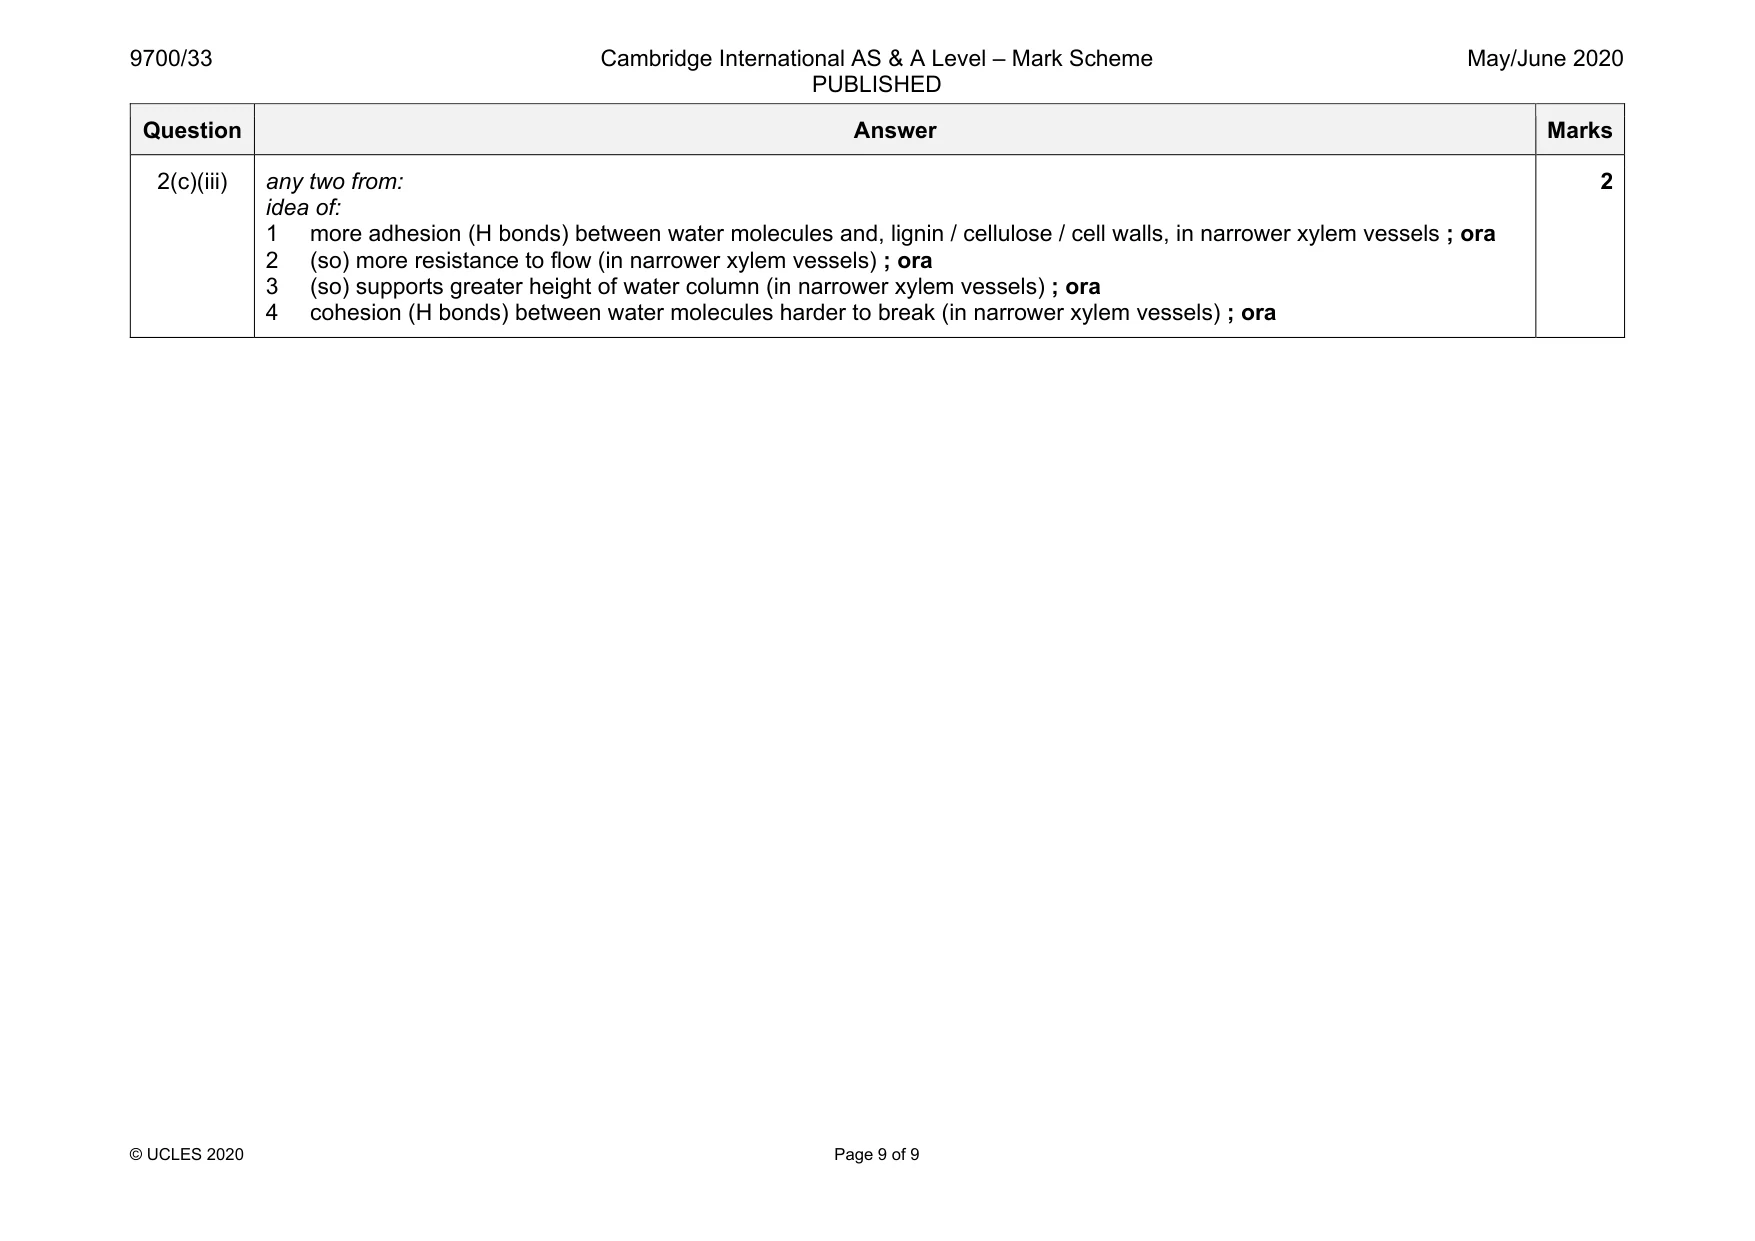
Mark scheme: 2(a)(i) TS Iris root 1 suitable size and no shading and draws at least five layers of tissue ; 2 draws whole root section and no cells ; 3 draws correct shape (not round) ; 4 shows correct distribution of tissues (air spaces, vascular tissue) ; 5 label line and label to endodermis ; 5 2(a)(ii) 1 suitable size and draws lines that are continuous, thin and sharp ; 2 draws one large xylem vessel and three small xylem vessels and each smaller cell touches the large xylem vessel and at least one other smaller cell ; 3 draws two lines around each cell and three lines where cells touch ; 4 draws cells with irregular (angular) shapes ; 5 label line and label to cell wall ; 5 Question Answer Marks 2(b) 1 record only differences (shape, position, fine detail) not similarities ; 2, 3 and 4 any three from: feature K1 Fig 2.1 large xylem vessels few(er) many / more ; vascular bundles small(er) large(r) ; (relative) number of air spaces many / more few(er) ; (relative) size of air spaces large(r) small(er) ; shape of air spaces long(er) and thin(ner) small(er) and round(er) ; 4 2(c)(i) correct measurements for cell Q (line q) and cell T (line t) ; A suitable range of measurements based on printed diagram same units for diameters of Q and T ; 2 2(c)(ii) 1 shows measurement of t divided by measurement of q and ×100 / shows measurement of q divided by measurement of t and ×100 ; 2 shows 100 – answer to mp1 ; 3 shows correct answer ; or 1 shows measurement of t minus measurement of q and ×100 / shows measurement of q minus measurement of t ; 2 shows difference in measurements (mp1) divided by measurement of q and ×100 / shows difference in measurements (mp1) divided by measurement of t and ×100 ; 3 shows correct answer ; 3 Question Answer Marks 2(c)(iii) any two from: idea of: 1 more adhesion (H bonds) between water molecules and, lignin / cellulose / cell walls, in narrower xylem vessels ; ora 2 (so) more resistance to flow (in narrower xylem vessels) ; ora 3 (so) supports greater height of water column (in narrower xylem vessels) ; ora 4 cohesion (H bonds) between water molecules harder to break (in narrower xylem vessels) ; ora 2
What was in this paper
The subtopics covered by these 2 questions, and how many questions each got. Open one in a new tab to see every Cambridge question on it.