Cambridge A Level Biology 9700 — 2020 May/June Paper 3 · Variant 5
9700/35/M/J/20 · 2 questions · 31 marks · ≈35 min
The question paper and its mark scheme, free to read here and free to download. This is Cambridge’s own paper, exactly as it was sat.
Question paper16 pages

Mark scheme8 pages
Answers below. Sit the paper first if you are practising.
Questions as text
Q1 · Yeast contains an enzyme that will break down hydrogen peroxide into oxygen and water
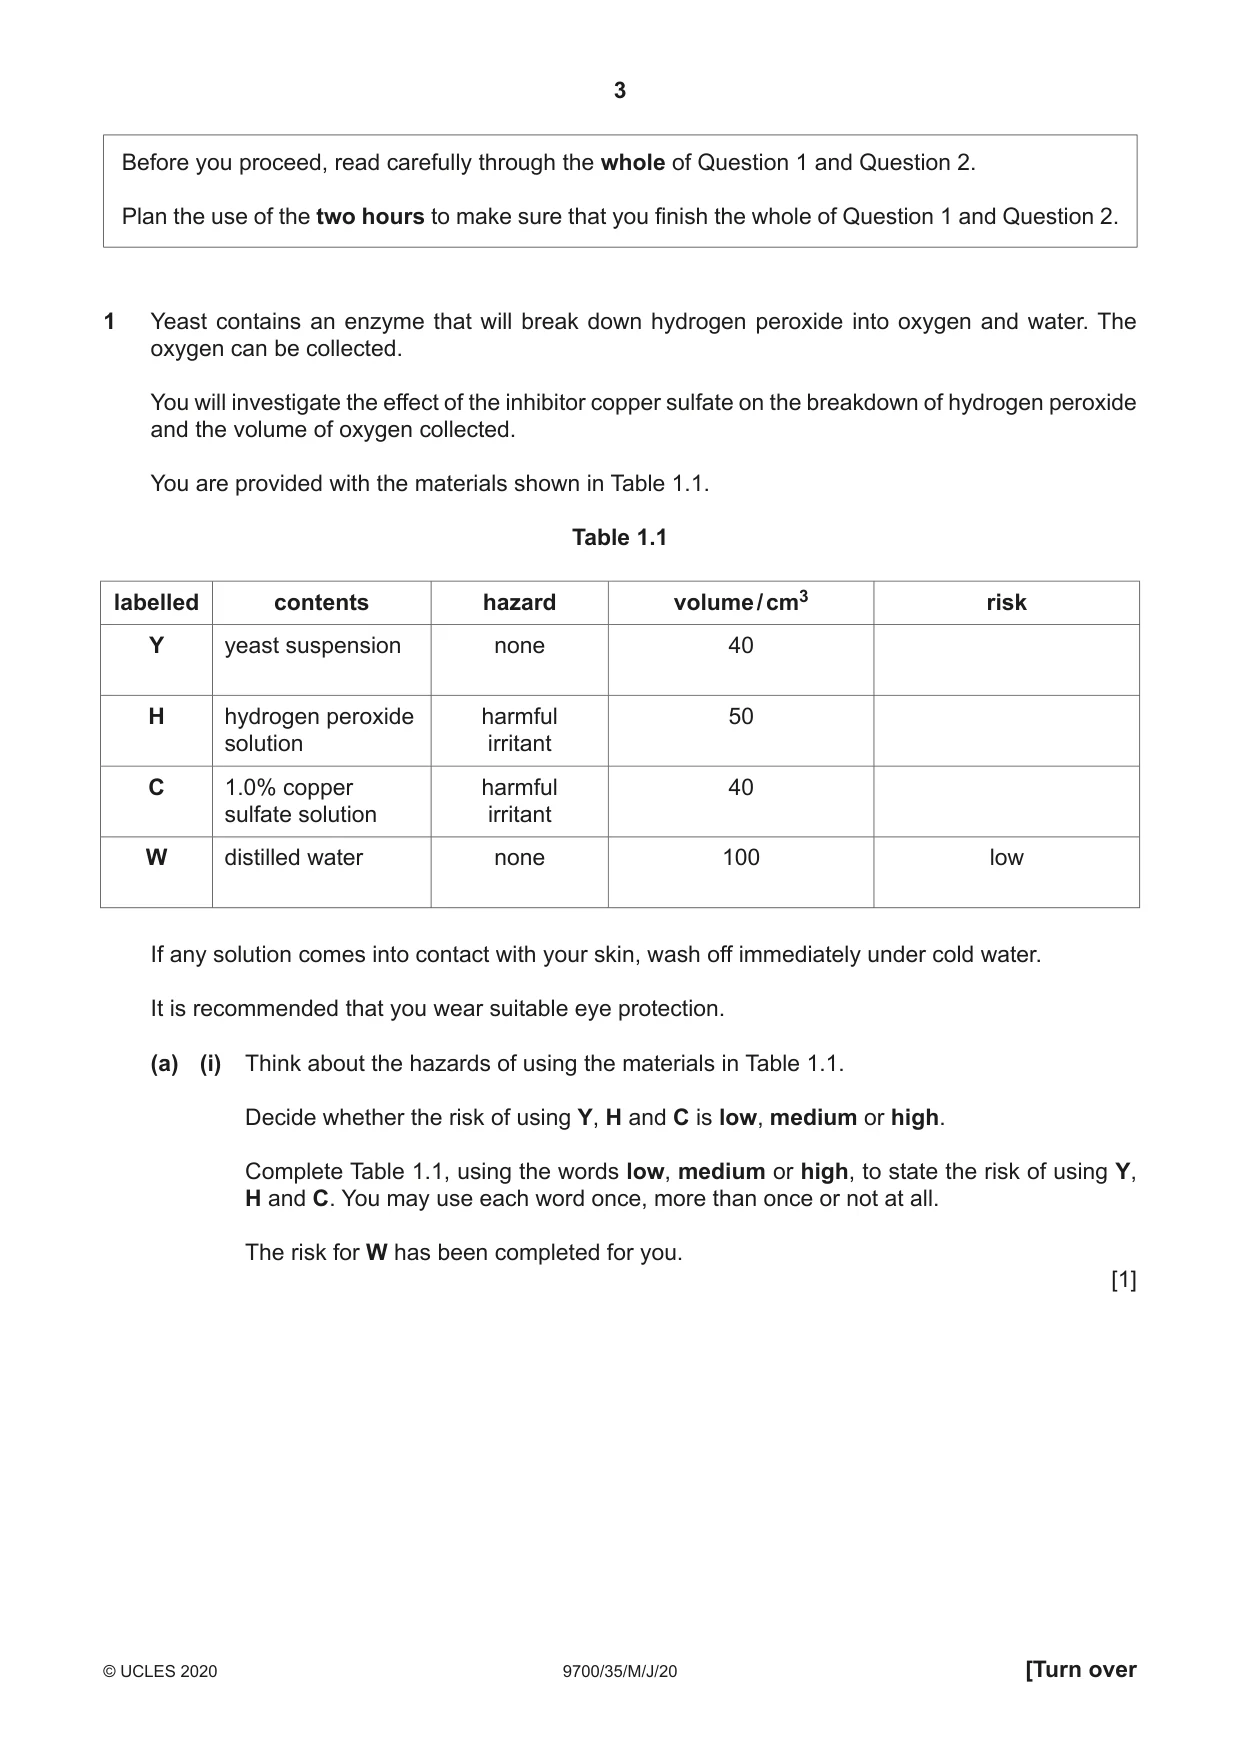
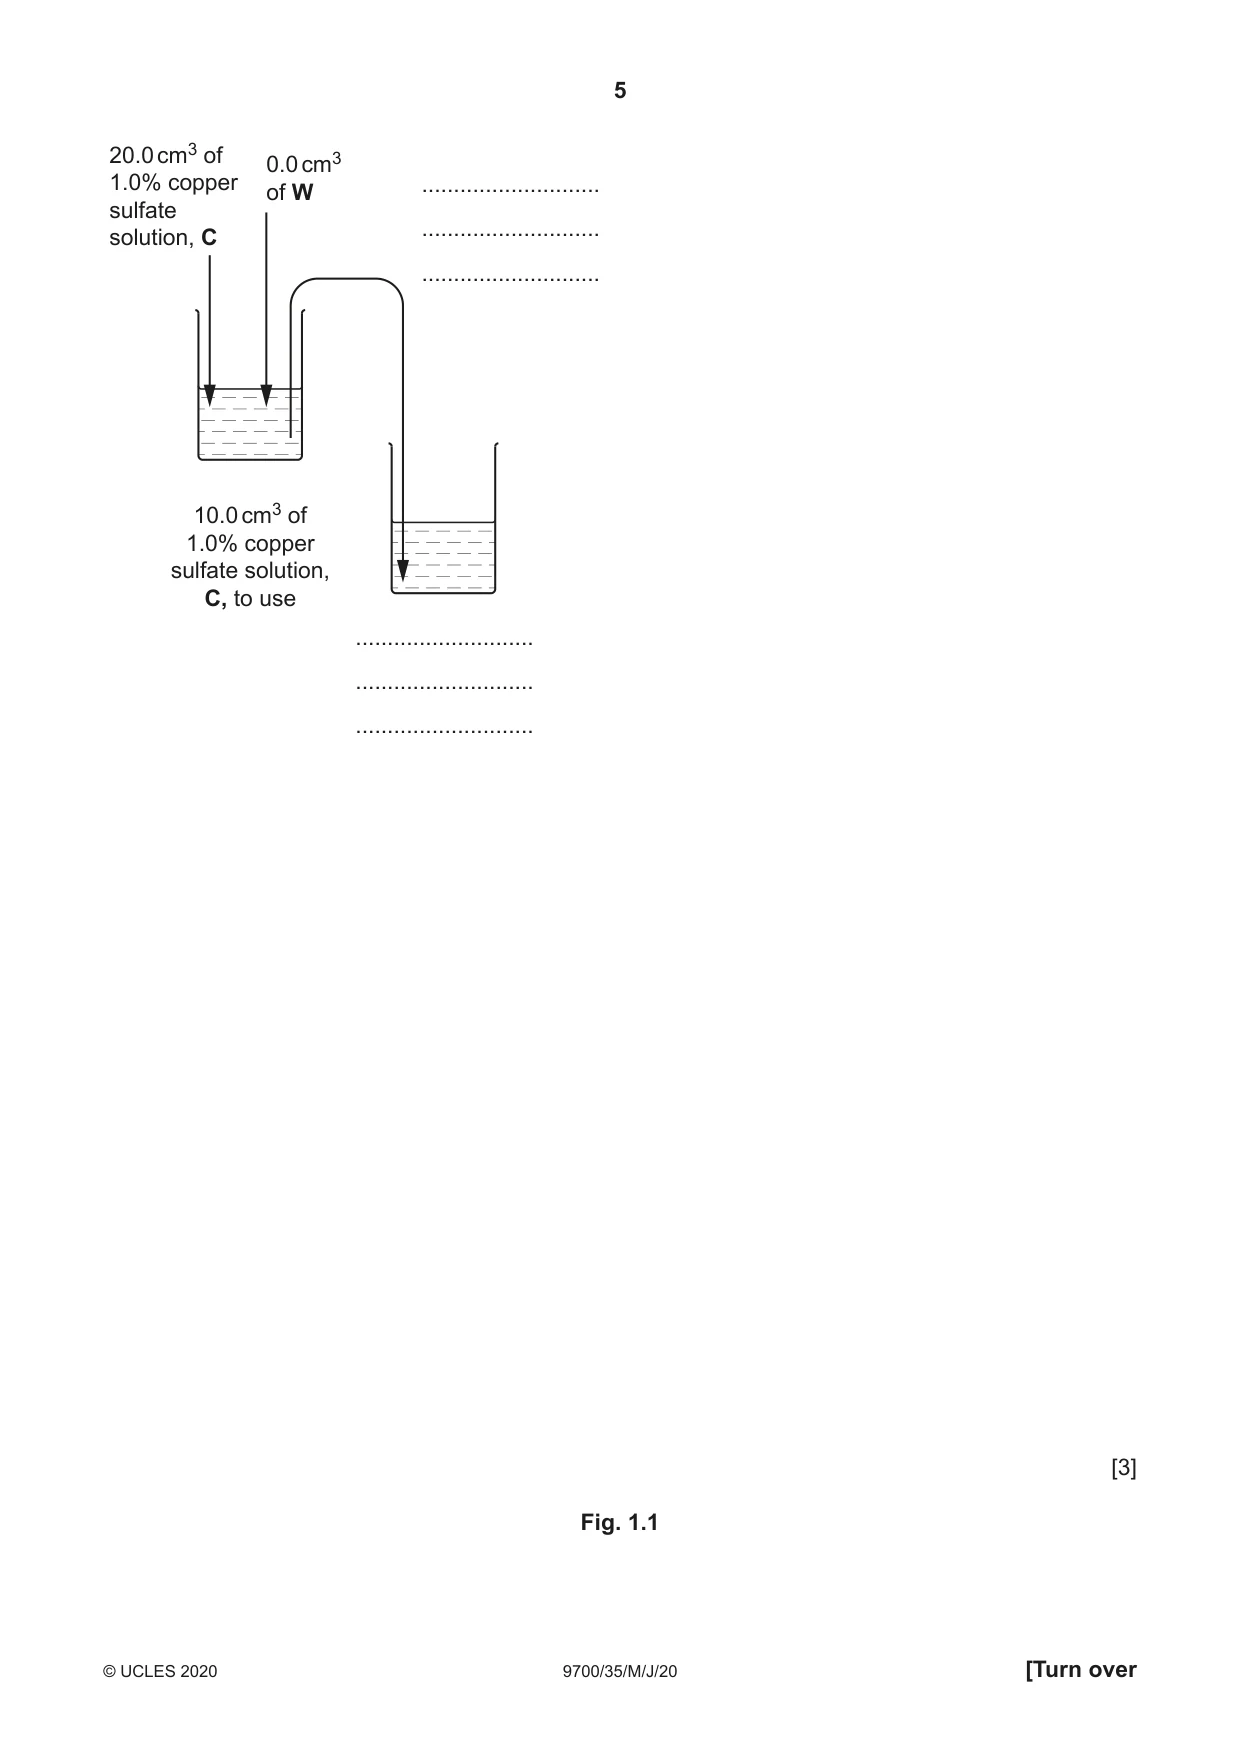
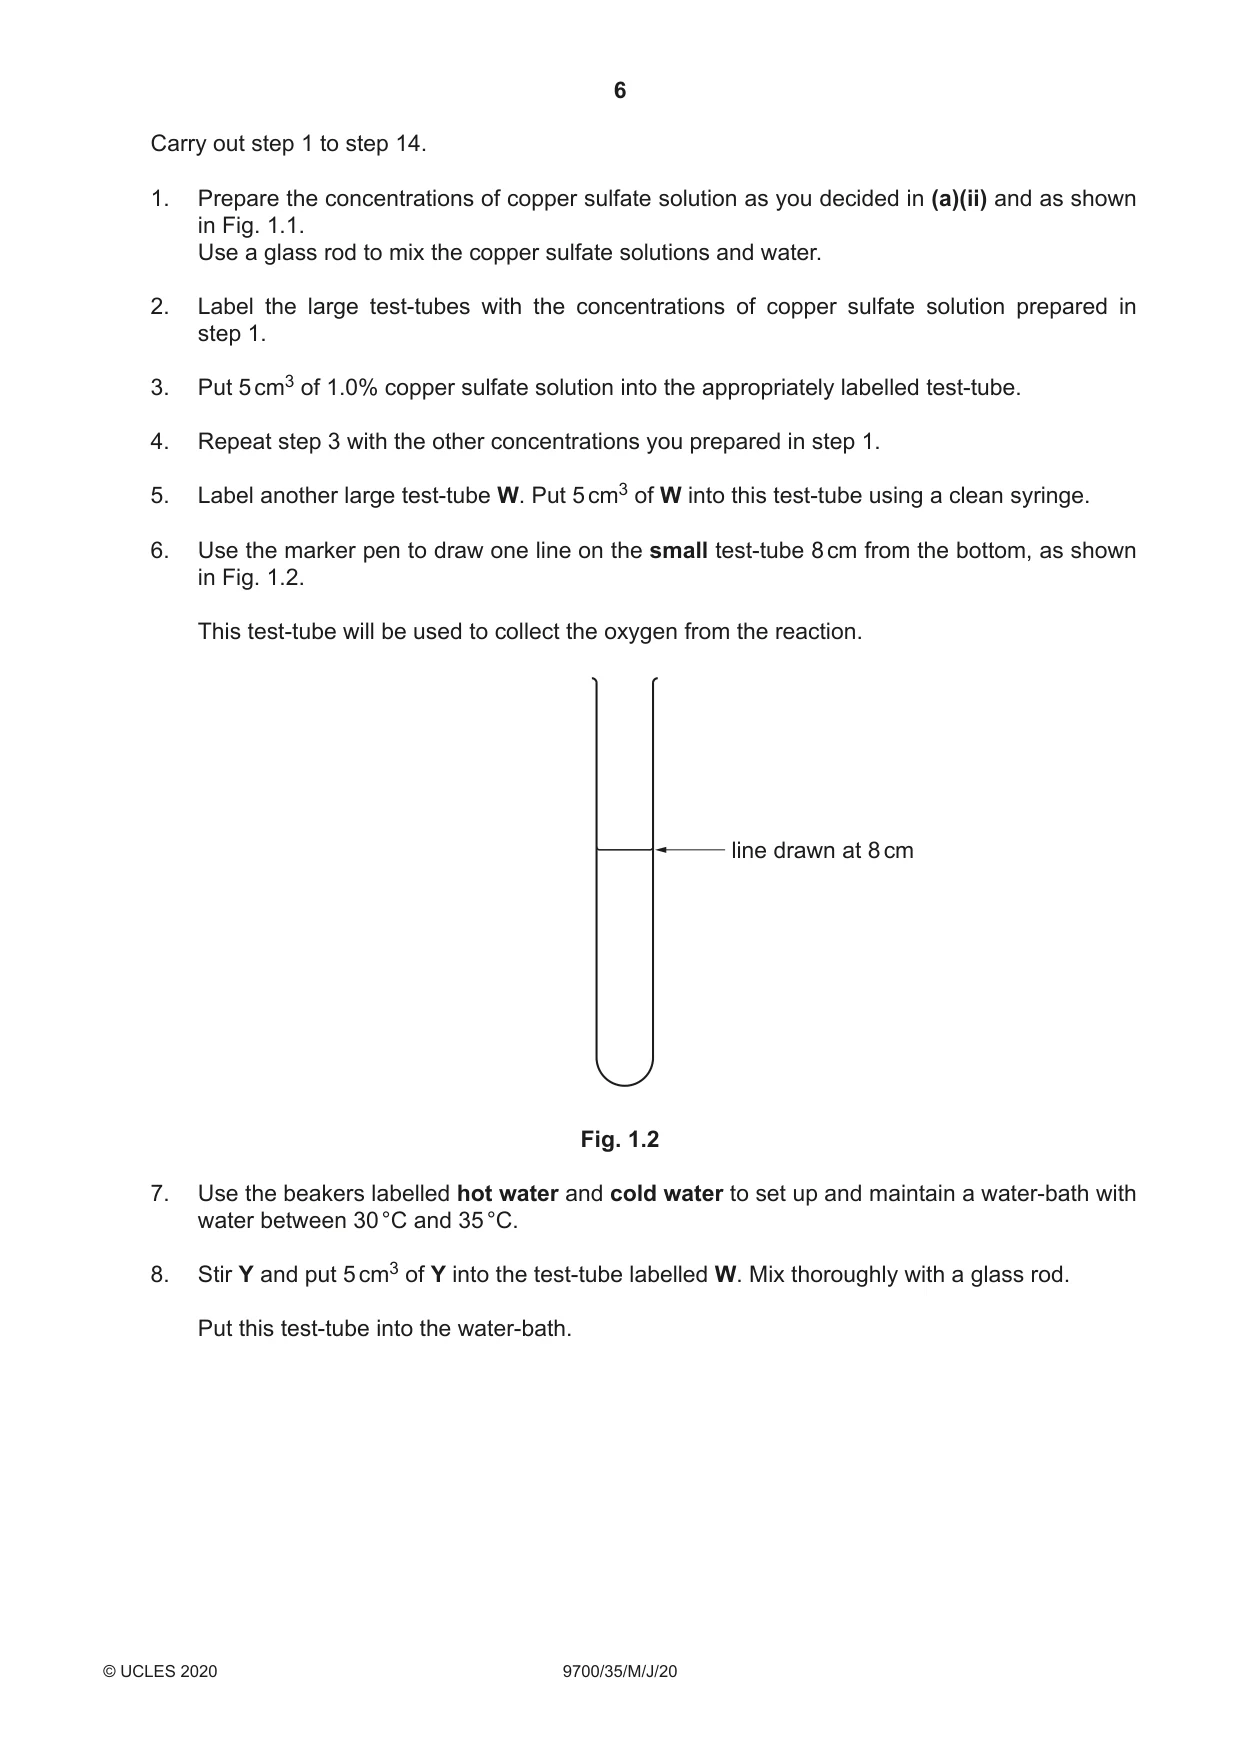
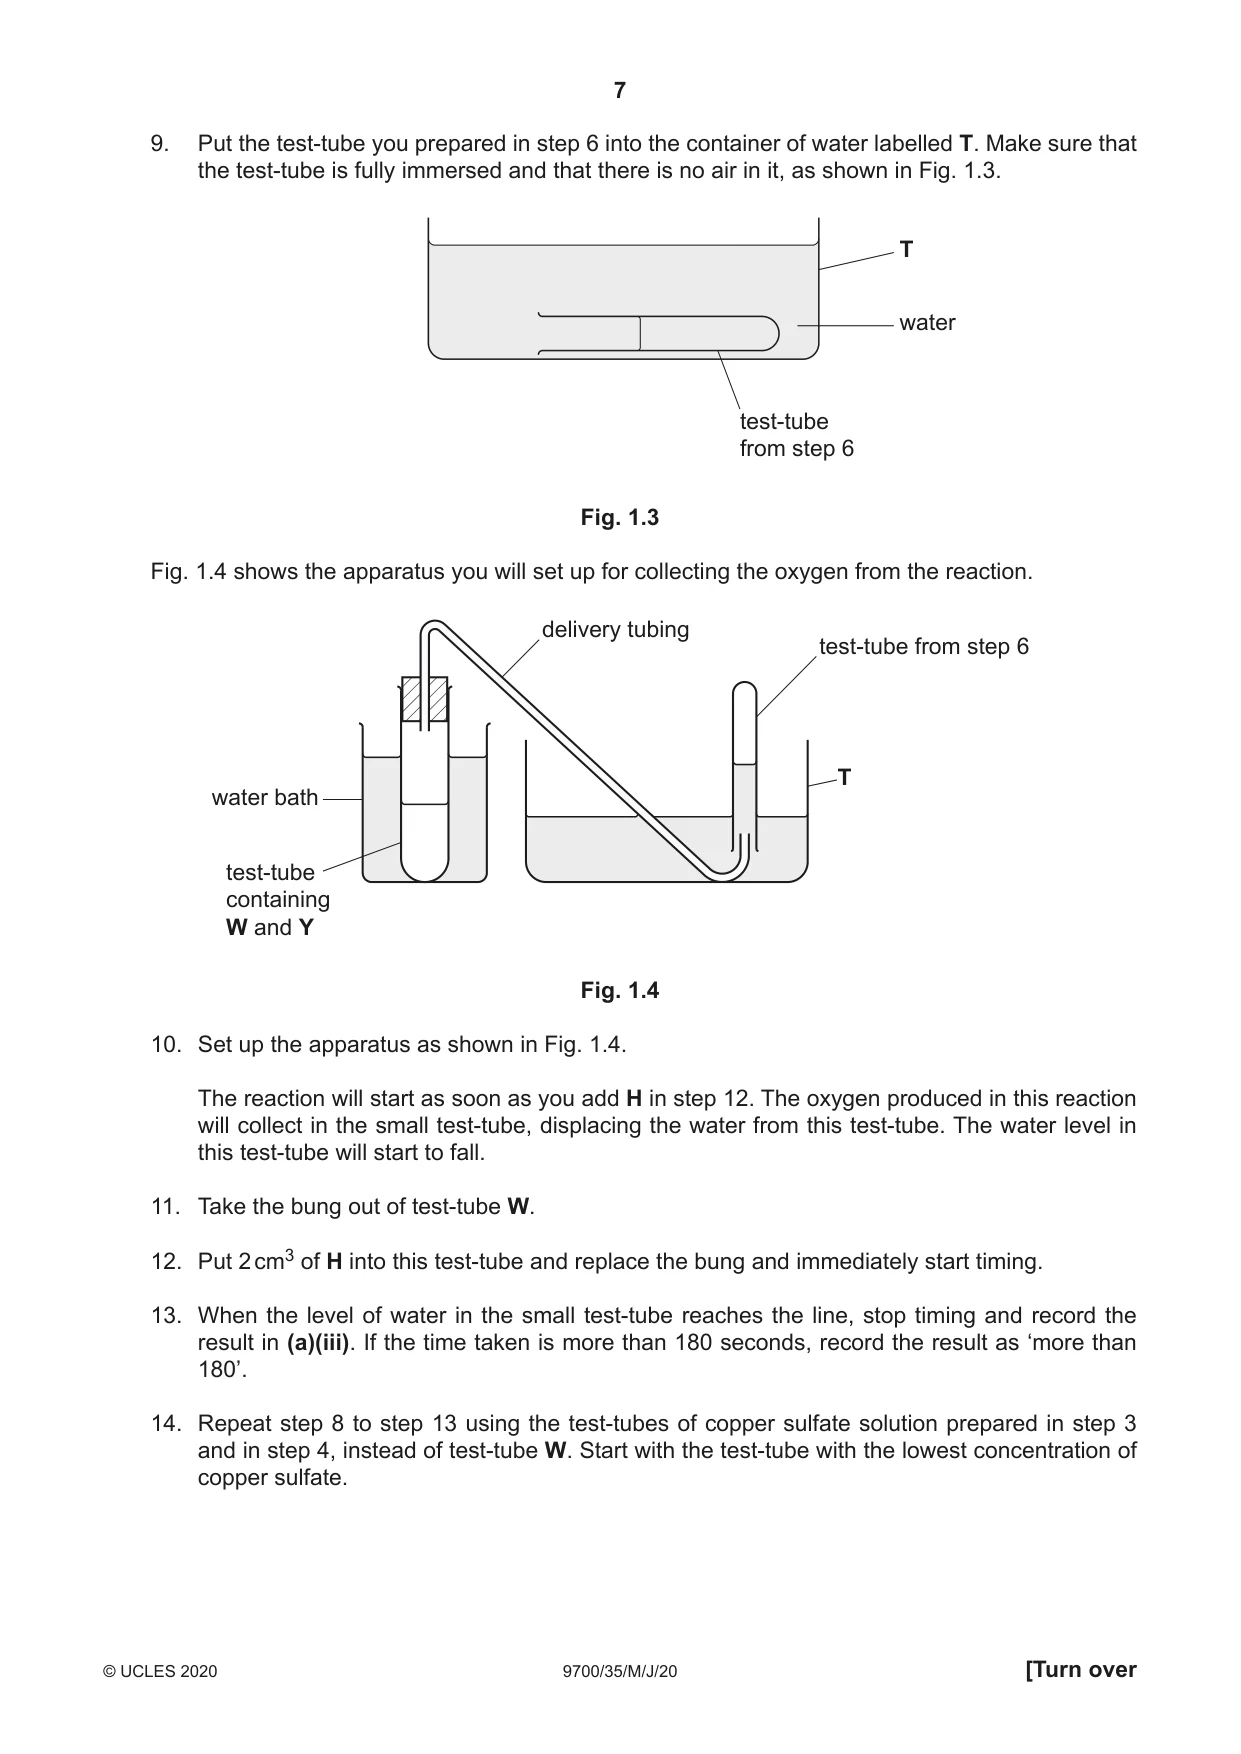
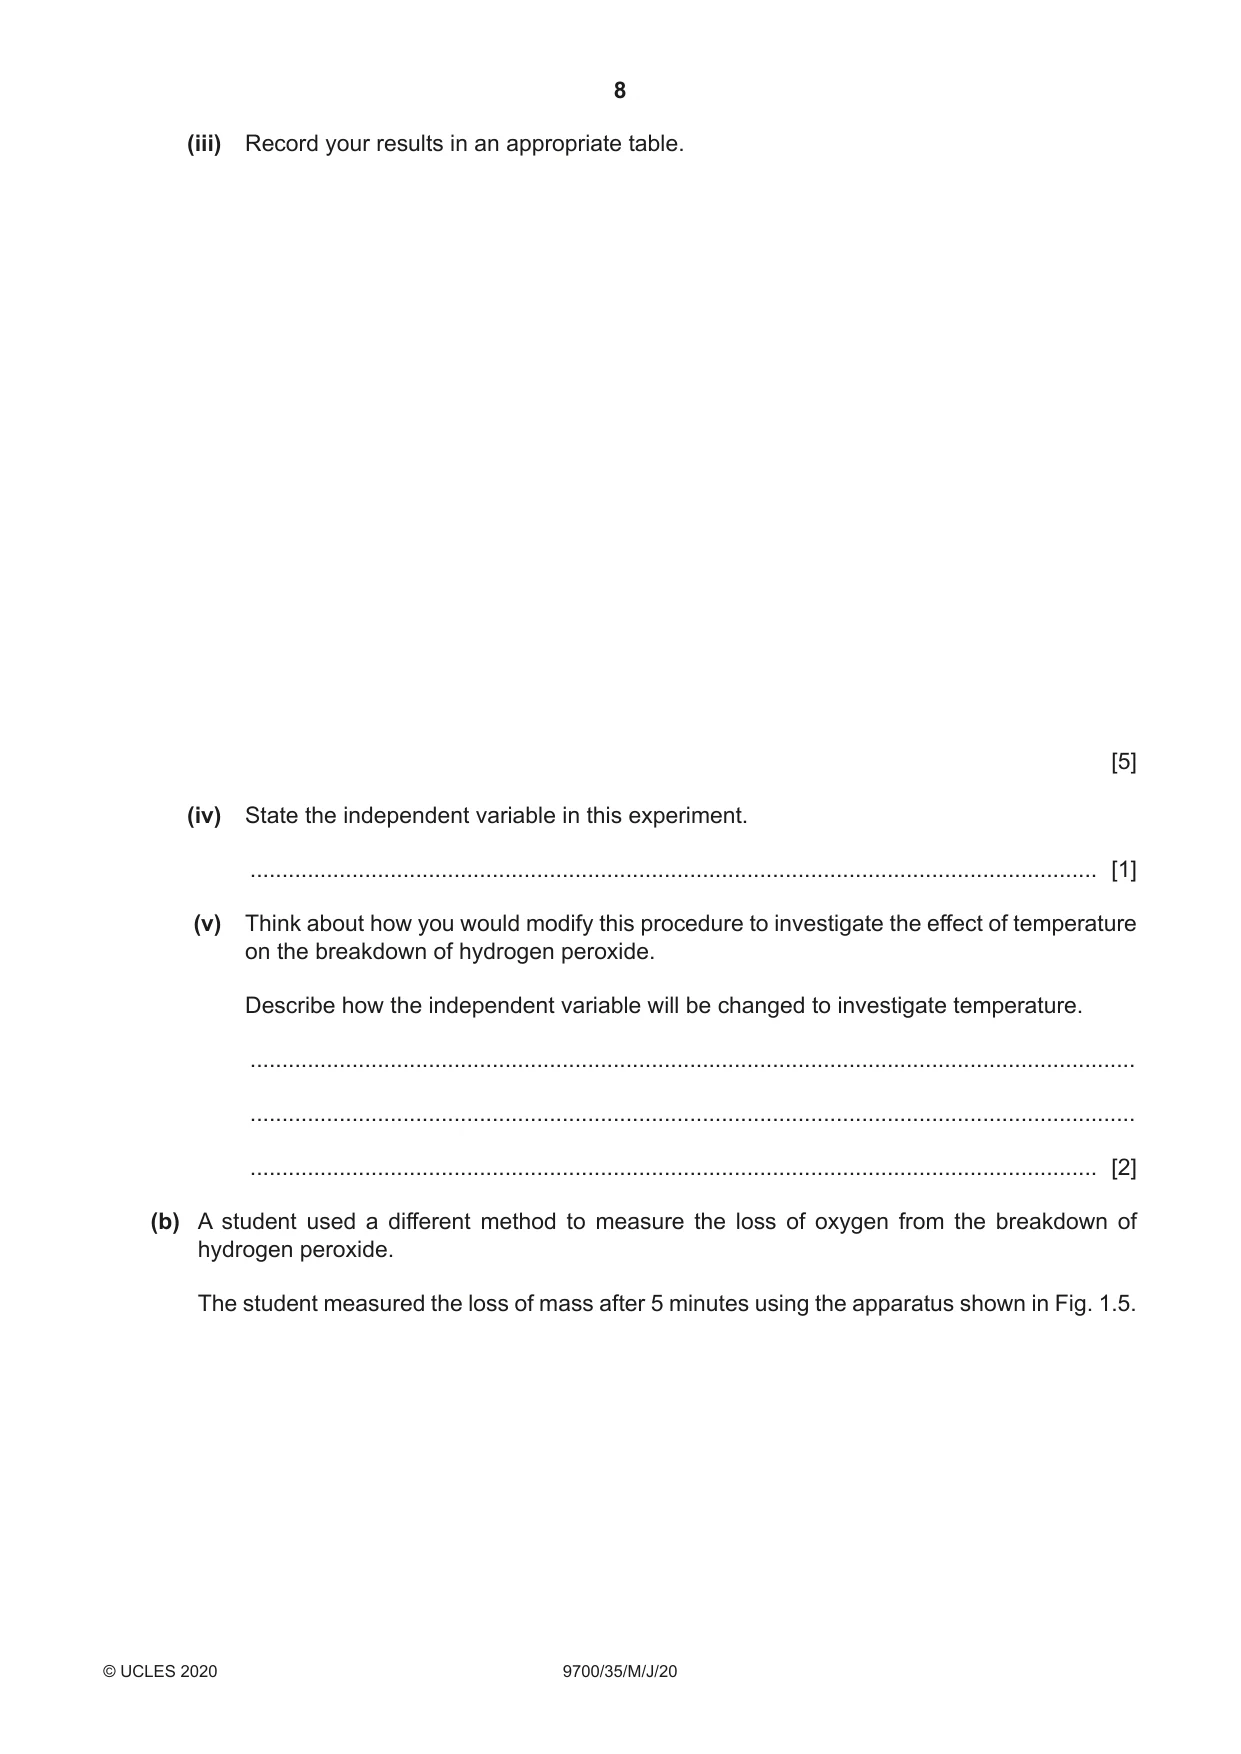
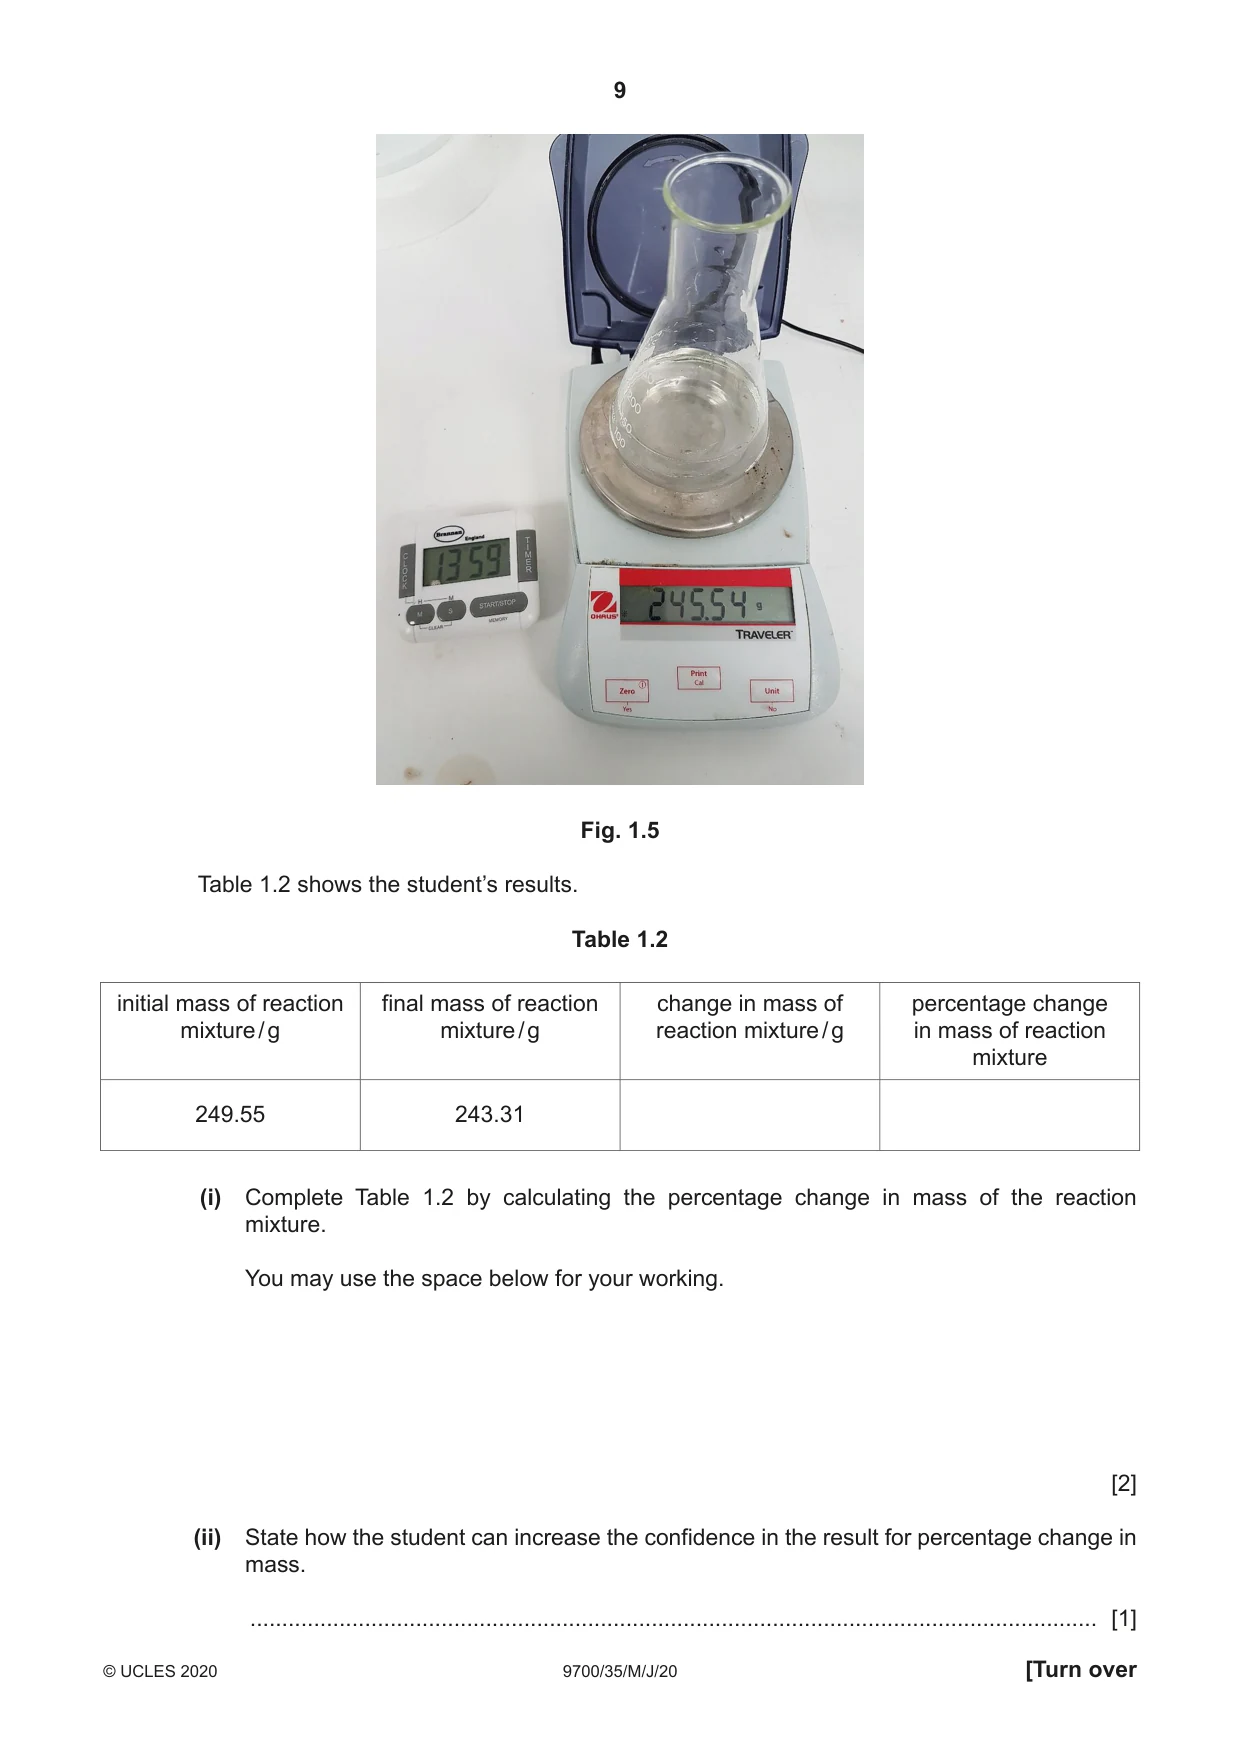
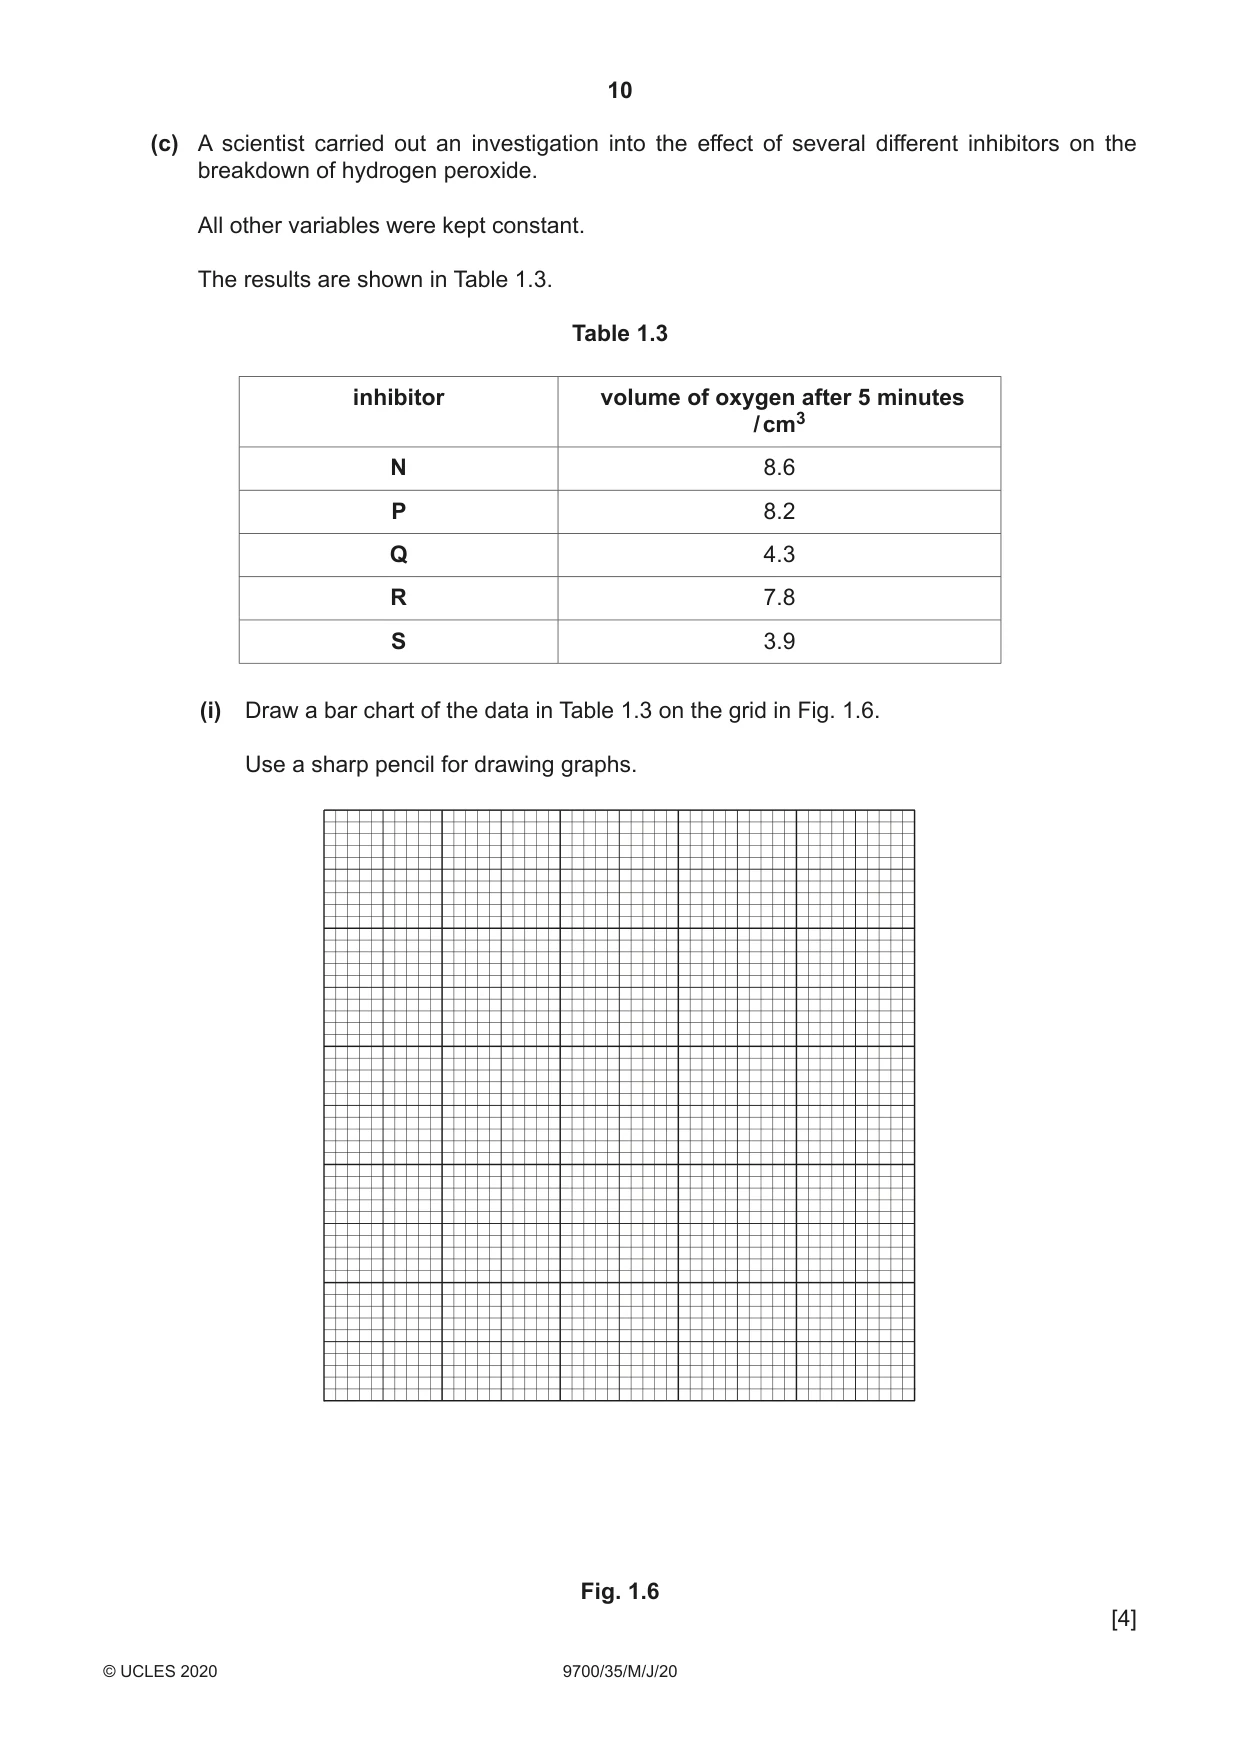
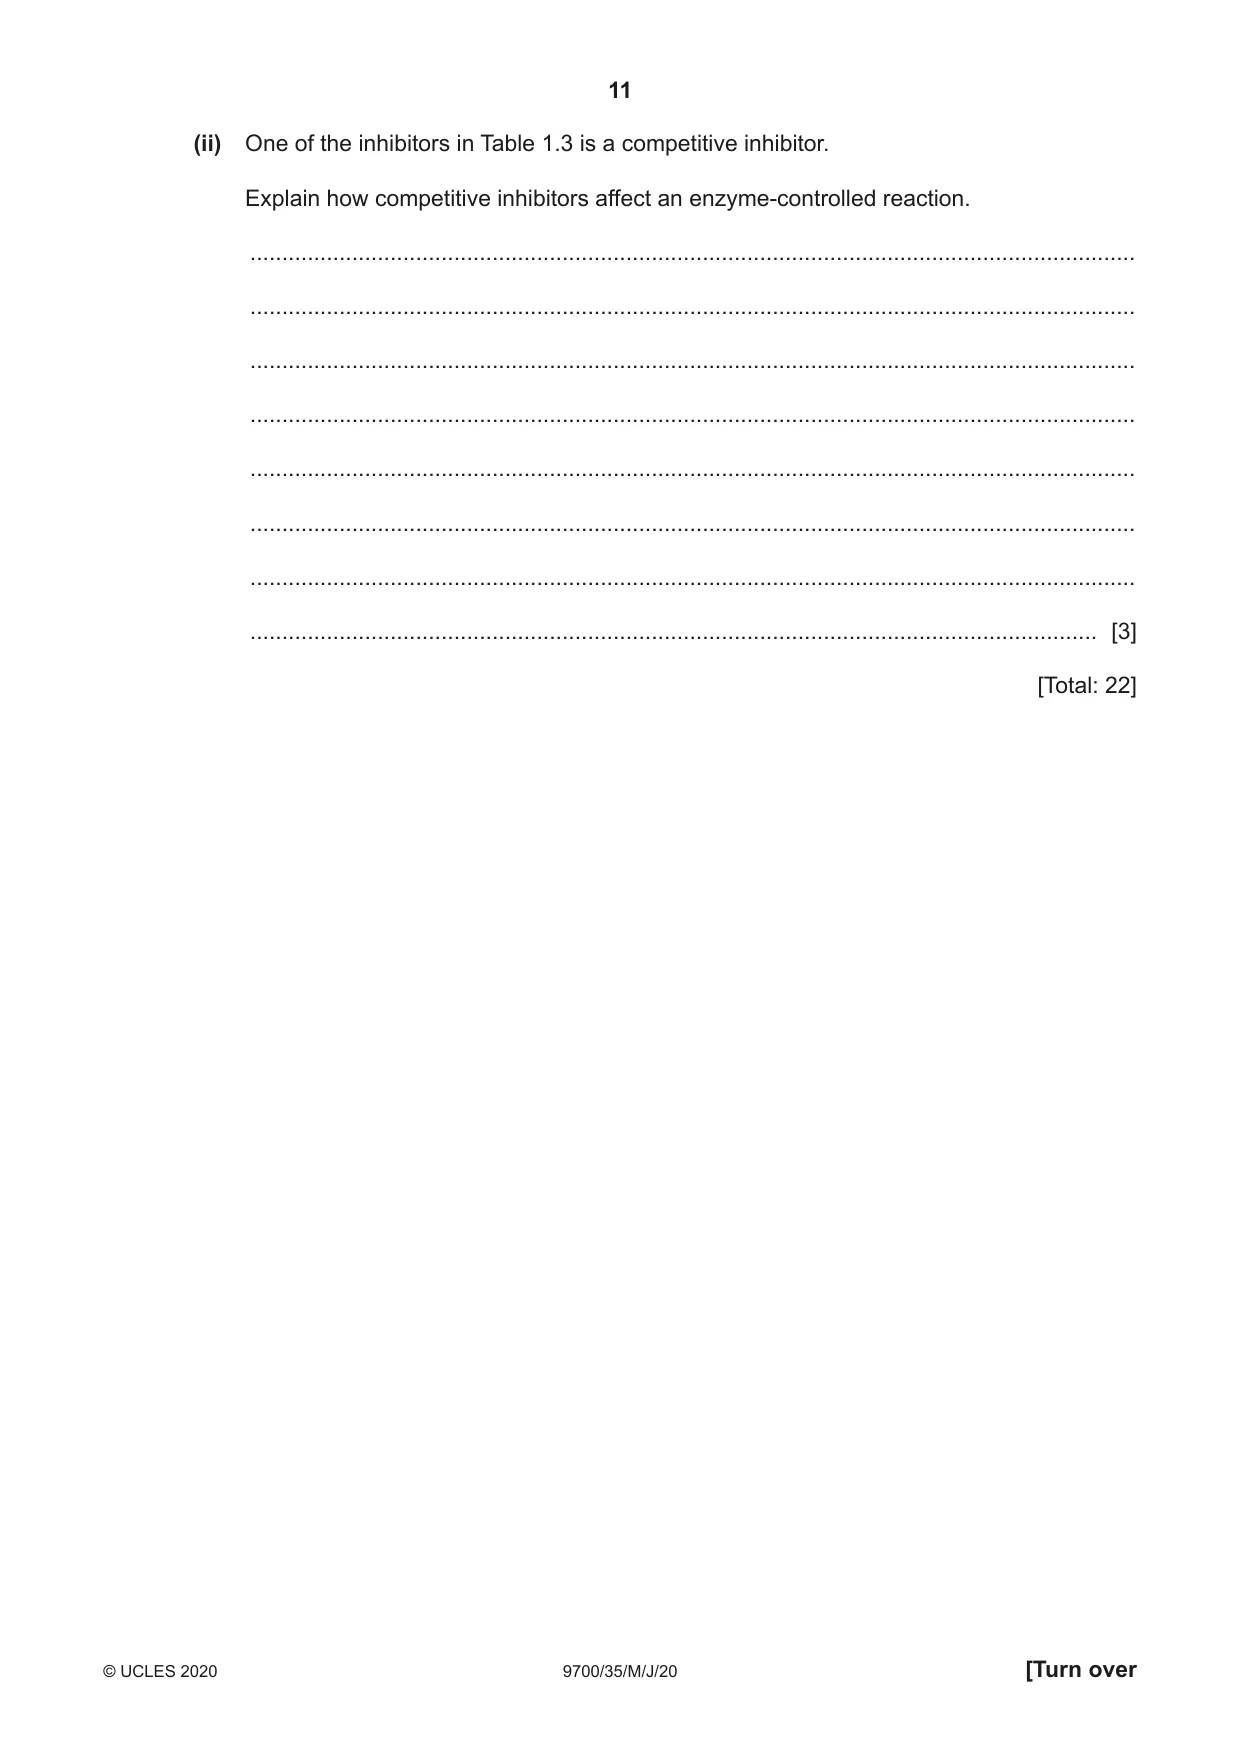
1 Yeast contains an enzyme that will break down hydrogen peroxide into oxygen and water. The oxygen can be collected. You will investigate the effect of the inhibitor copper sulfate on the breakdown of hydrogen peroxide and the volume of oxygen collected. You are provided with the materials shown in Table 1.1. Table 1.1 labelled contents hazard volume / cm3 risk Y yeast suspension none 40 H hydrogen peroxide harmful 50 solution irritant C 1.0% copper harmful 40 sulfate solution irritant W distilled water none 100 low If any solution comes into contact with your skin, wash off immediately under cold water. It is recommended that you wear suitable eye protection. (a) (i) Think about the hazards of using the materials in Table 1.1. Decide whether the risk of using Y, H and C is low, medium or high. Complete Table 1.1, using the words low, medium or high, to state the risk of using Y, H and C. You may use each word once, more than once or not at all. The risk for W has been completed for you. [1] You will need to make a serial dilution of 1.0% copper sulfate solution, C, which reduces the concentration by half between each successive dilution. Fig. 1.1 shows the first two beakers you will use to make your serial dilution. (ii) Complete Fig. 1.1 by drawing as many extra beakers as you need for your serial dilution. For each beaker: • state, under the beaker, the volume and concentration of copper sulfate solution available for use in the investigation • use one arrow with a label, above the beaker, to show the volume and concentration of copper sulfate solution added to prepare the concentration • use another arrow with a label, above the beaker, to show the volume of W added to prepare the concentration. 20.0 cm3 of 0.0 cm3 1.0% copper ............................ of W sulfate ............................solution, C ............................ 10.0 cm3 of 1.0% copper sulfate solution, C, to use ............................ ............................ ............................ [3] Fig. 1.1 Carry out step 1 to step 14. 1. Prepare the concentrations of copper sulfate solution as you decided in (a)(ii) and as shown in Fig. 1.1. Use a glass rod to mix the copper sulfate solutions and water. 2. Label the large test-tubes with the concentrations of copper sulfate solution prepared in step 1. 3. Put 5 cm3 of 1.0% copper sulfate solution into the appropriately labelled test-tube. 4. Repeat step 3 with the other concentrations you prepared in step 1. 5. Label another large test-tube W. Put 5 cm3 of W into this test-tube using a clean syringe. 6. Use the marker pen to draw one line on the small test-tube 8 cm from the bottom, as shown in Fig. 1.2. This test-tube will be used to collect the oxygen from the reaction. line drawn at 8 cm Fig. 1.2 7. Use the beakers labelled hot water and cold water to set up and maintain a water-bath with water between 30 °C and 35 °C. 8. Stir Y and put 5 cm3 of Y into the test-tube labelled W. Mix thoroughly with a glass rod. Put this test-tube into the water-bath. 9. Put the test-tube you prepared in step 6 into the container of water labelled T. Make sure that the test-tube is fully immersed and that there is no air in it, as shown in Fig. 1.3. T water test-tube from step 6 Fig. 1.3 Fig. 1.4 shows the apparatus you will set up for collecting the oxygen from the reaction. delivery tubing test-tube from step 6 T water bath test-tube containing W and Y Fig. 1.4 10. Set up the apparatus as shown in Fig. 1.4. The reaction will start as soon as you add H in step 12. The oxygen produced in this reaction will collect in the small test-tube, displacing the water from this test-tube. The water level in this test-tube will start to fall. 11. Take the bung out of test-tube W. 12. Put 2 cm3 of H into this test-tube and replace the bung and immediately start timing. 13. When the level of water in the small test-tube reaches the line, stop timing and record the result in (a)(iii). If the time taken is more than 180 seconds, record the result as ‘more than 180’. 14. Repeat step 8 to step 13 using the test-tubes of copper sulfate solution prepared in step 3 and in step 4, instead of test-tube W. Start with the test-tube with the lowest concentration of copper sulfate. (iii) Record your results in an appropriate table. [5] (iv) State the independent variable in this experiment. ..................................................................................................................................... [1] (v) Think about how you would modify this procedure to investigate the effect of temperature on the breakdown of hydrogen peroxide. Describe how the independent variable will be changed to investigate temperature. ........................................................................................................................................... ........................................................................................................................................... ..................................................................................................................................... [2] (b) A student used a different method to measure the loss of oxygen from the breakdown of hydrogen peroxide. The student measured the loss of mass after 5 minutes using the apparatus shown in Fig. 1.5. Fig. 1.5 Table 1.2 shows the student’s results. Table 1.2 initial mass of reaction final mass of reaction change in mass of percentage change mixture / g mixture / g reaction mixture / g in mass of reaction mixture 249.55 243.31 (i) Complete Table 1.2 by calculating the percentage change in mass of the reaction mixture. You may use the space below for your working. [2] (ii) State how the student can increase the confidence in the result for percentage change in mass. ..................................................................................................................................... [1] (c) A scientist carried out an investigation into the effect of several different inhibitors on the breakdown of hydrogen peroxide. All other variables were kept constant. The results are shown in Table 1.3. Table 1.3 inhibitor volume of oxygen after 5 minutes / cm3 N 8.6 P 8.2 Q 4.3 R 7.8 S 3.9 (i) Draw a bar chart of the data in Table 1.3 on the grid in Fig. 1.6. Use a sharp pencil for drawing graphs. Fig. 1.6 [4] (ii) One of the inhibitors in Table 1.3 is a competitive inhibitor. Explain how competitive inhibitors affect an enzyme-controlled reaction. ........................................................................................................................................... ........................................................................................................................................... ........................................................................................................................................... ........................................................................................................................................... ........................................................................................................................................... ........................................................................................................................................... ........................................................................................................................................... ..................................................................................................................................... [3] [Total: 22]
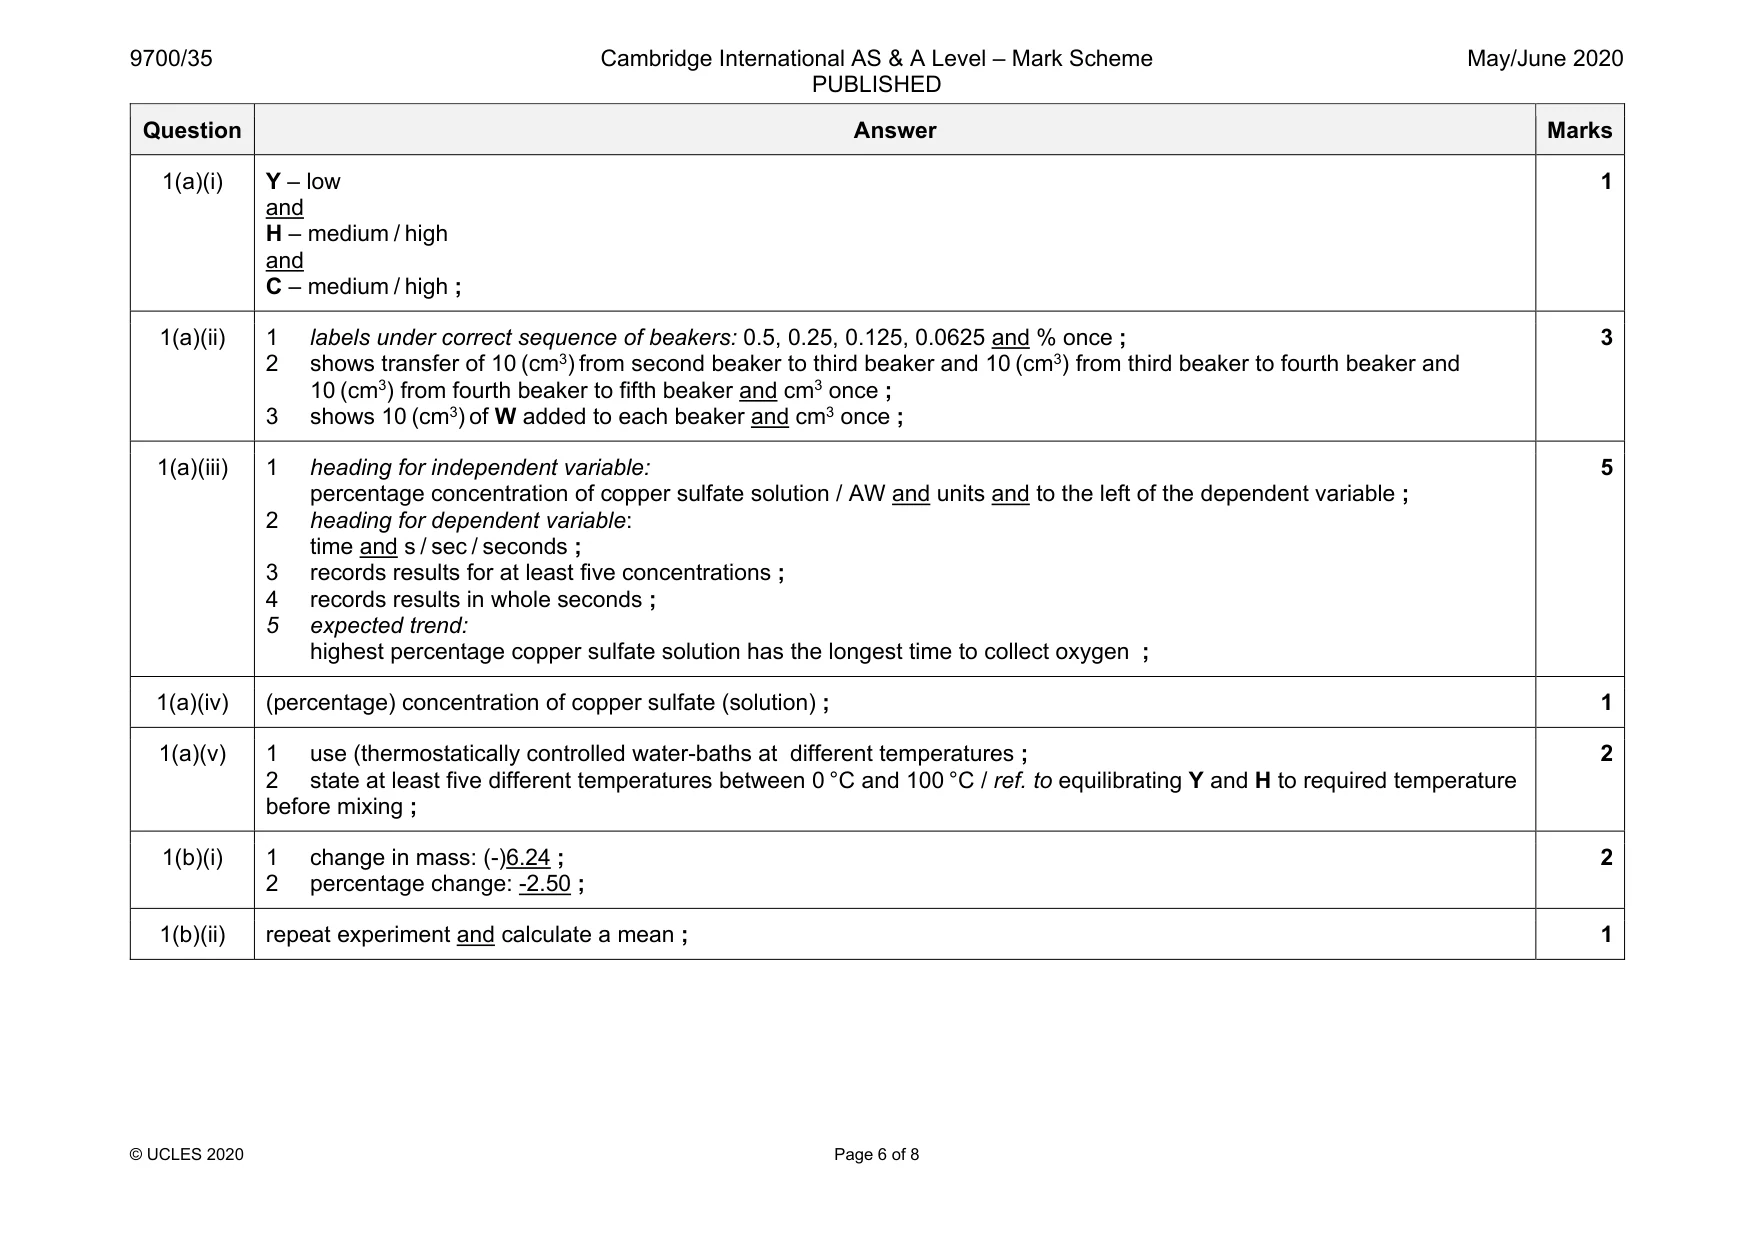
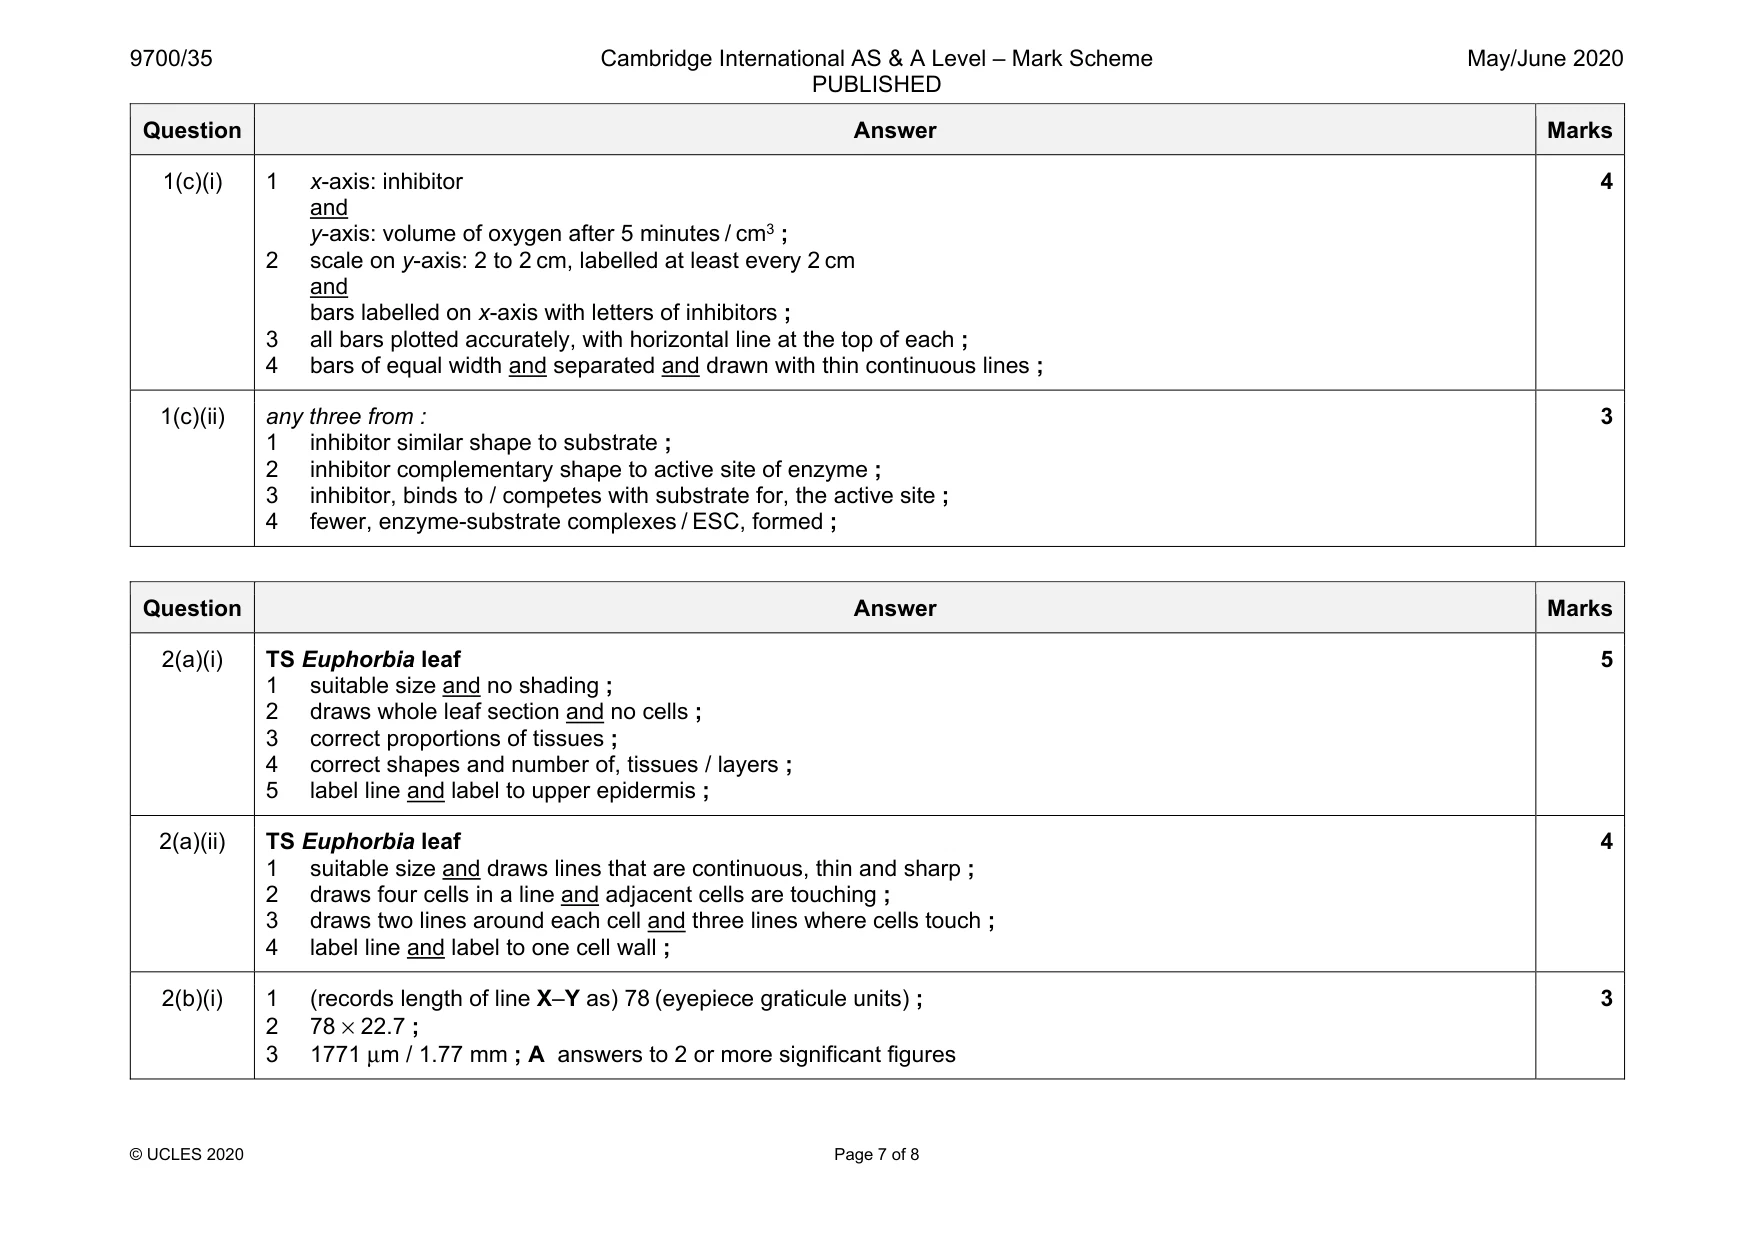
Mark scheme: 1(a)(i) Y – low and H – medium / high and C – medium / high ; 1 1(a)(ii) 1 labels under correct sequence of beakers: 0.5, 0.25, 0.125, 0.0625 and % once ; 2 shows transfer of 10 (cm3) from second beaker to third beaker and 10 (cm3) from third beaker to fourth beaker and 10 (cm3) from fourth beaker to fifth beaker and cm3 once ; 3 shows 10 (cm3) of W added to each beaker and cm3 once ; 3 1(a)(iii) 1 heading for independent variable: percentage concentration of copper sulfate solution / AW and units and to the left of the dependent variable ; 2 heading for dependent variable: time and s / sec / seconds ; 3 records results for at least five concentrations ; 4 records results in whole seconds ; 5 expected trend: highest percentage copper sulfate solution has the longest time to collect oxygen ; 5 1(a)(iv) (percentage) concentration of copper sulfate (solution) ; 1 1(a)(v) 1 use (thermostatically controlled water-baths at different temperatures ; 2 state at least five different temperatures between 0 °C and 100 °C / ref. to equilibrating Y and H to required temperature before mixing ; 2 1(b)(i) 1 change in mass: (-)6.24 ; 2 percentage change: -2.50 ; 2 1(b)(ii) repeat experiment and calculate a mean ; 1 Question Answer Marks 1(c)(i) 1 x-axis: inhibitor and y-axis: volume of oxygen after 5 minutes / cm3 ; 2 scale on y-axis: 2 to 2 cm, labelled at least every 2 cm and bars labelled on x-axis with letters of inhibitors ; 3 all bars plotted accurately, with horizontal line at the top of each ; 4 bars of equal width and separated and drawn with thin continuous lines ; 4 1(c)(ii) any three from : 1 inhibitor similar shape to substrate ; 2 inhibitor complementary shape to active site of enzyme ; 3 inhibitor, binds to / competes with substrate for, the active site ; 4 fewer, enzyme-substrate complexes / ESC, formed ; 3
Q2 · L1 is a slide of a stained transverse section through a plant leaf
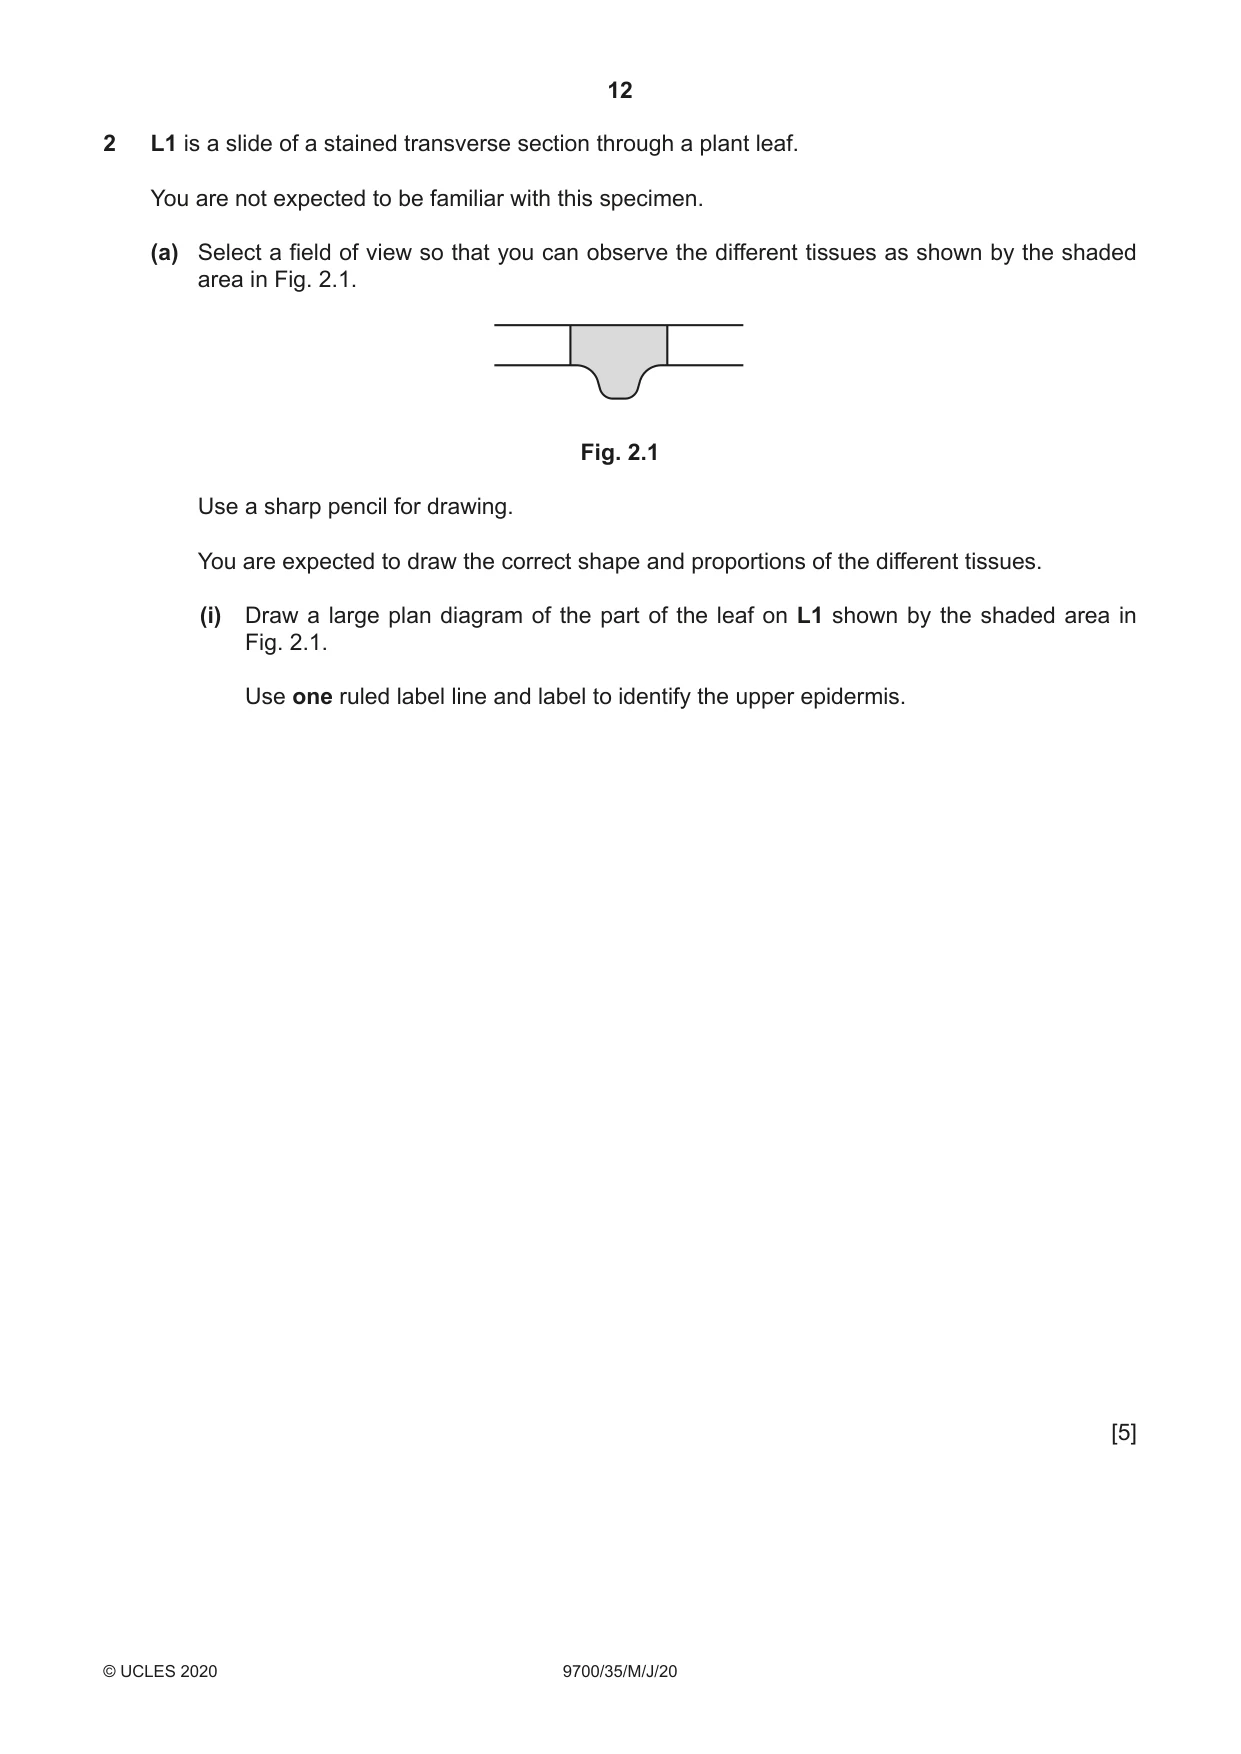
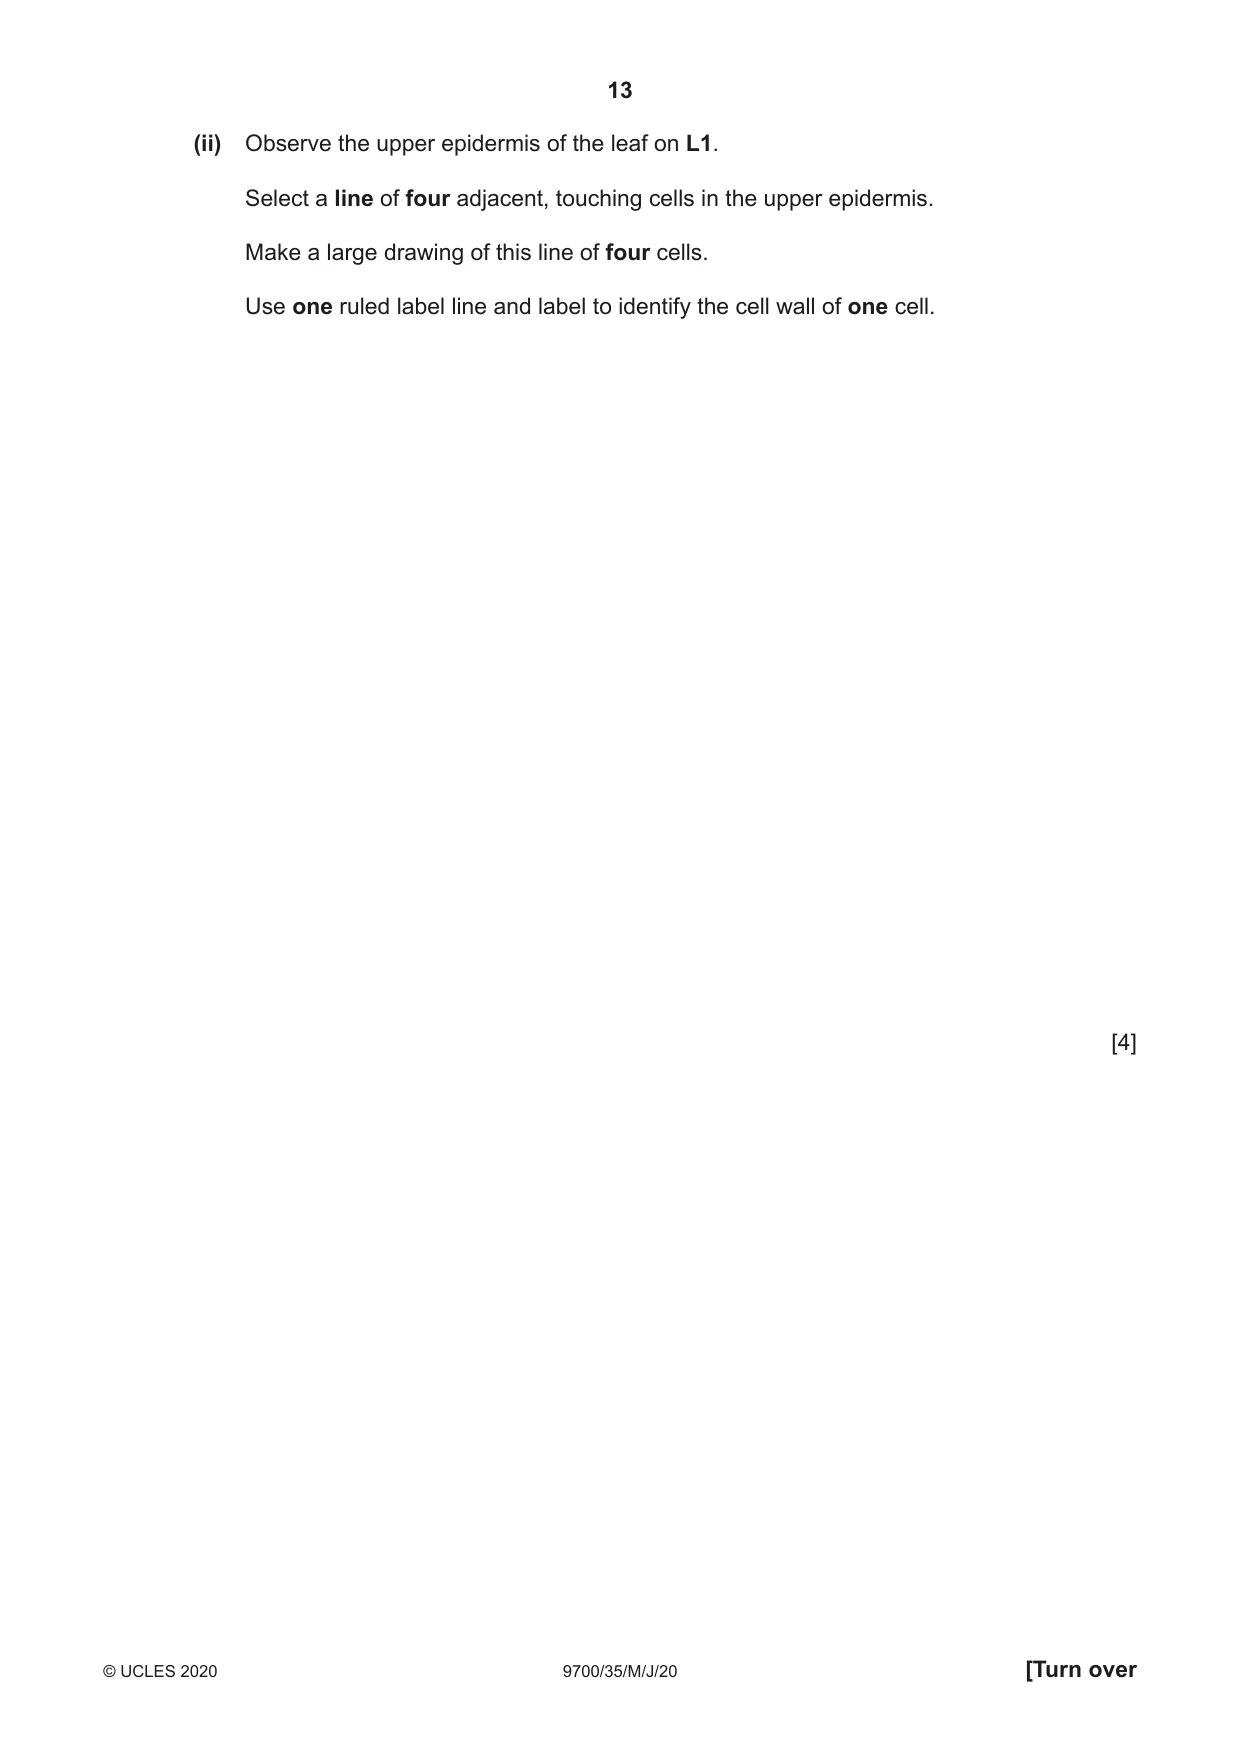
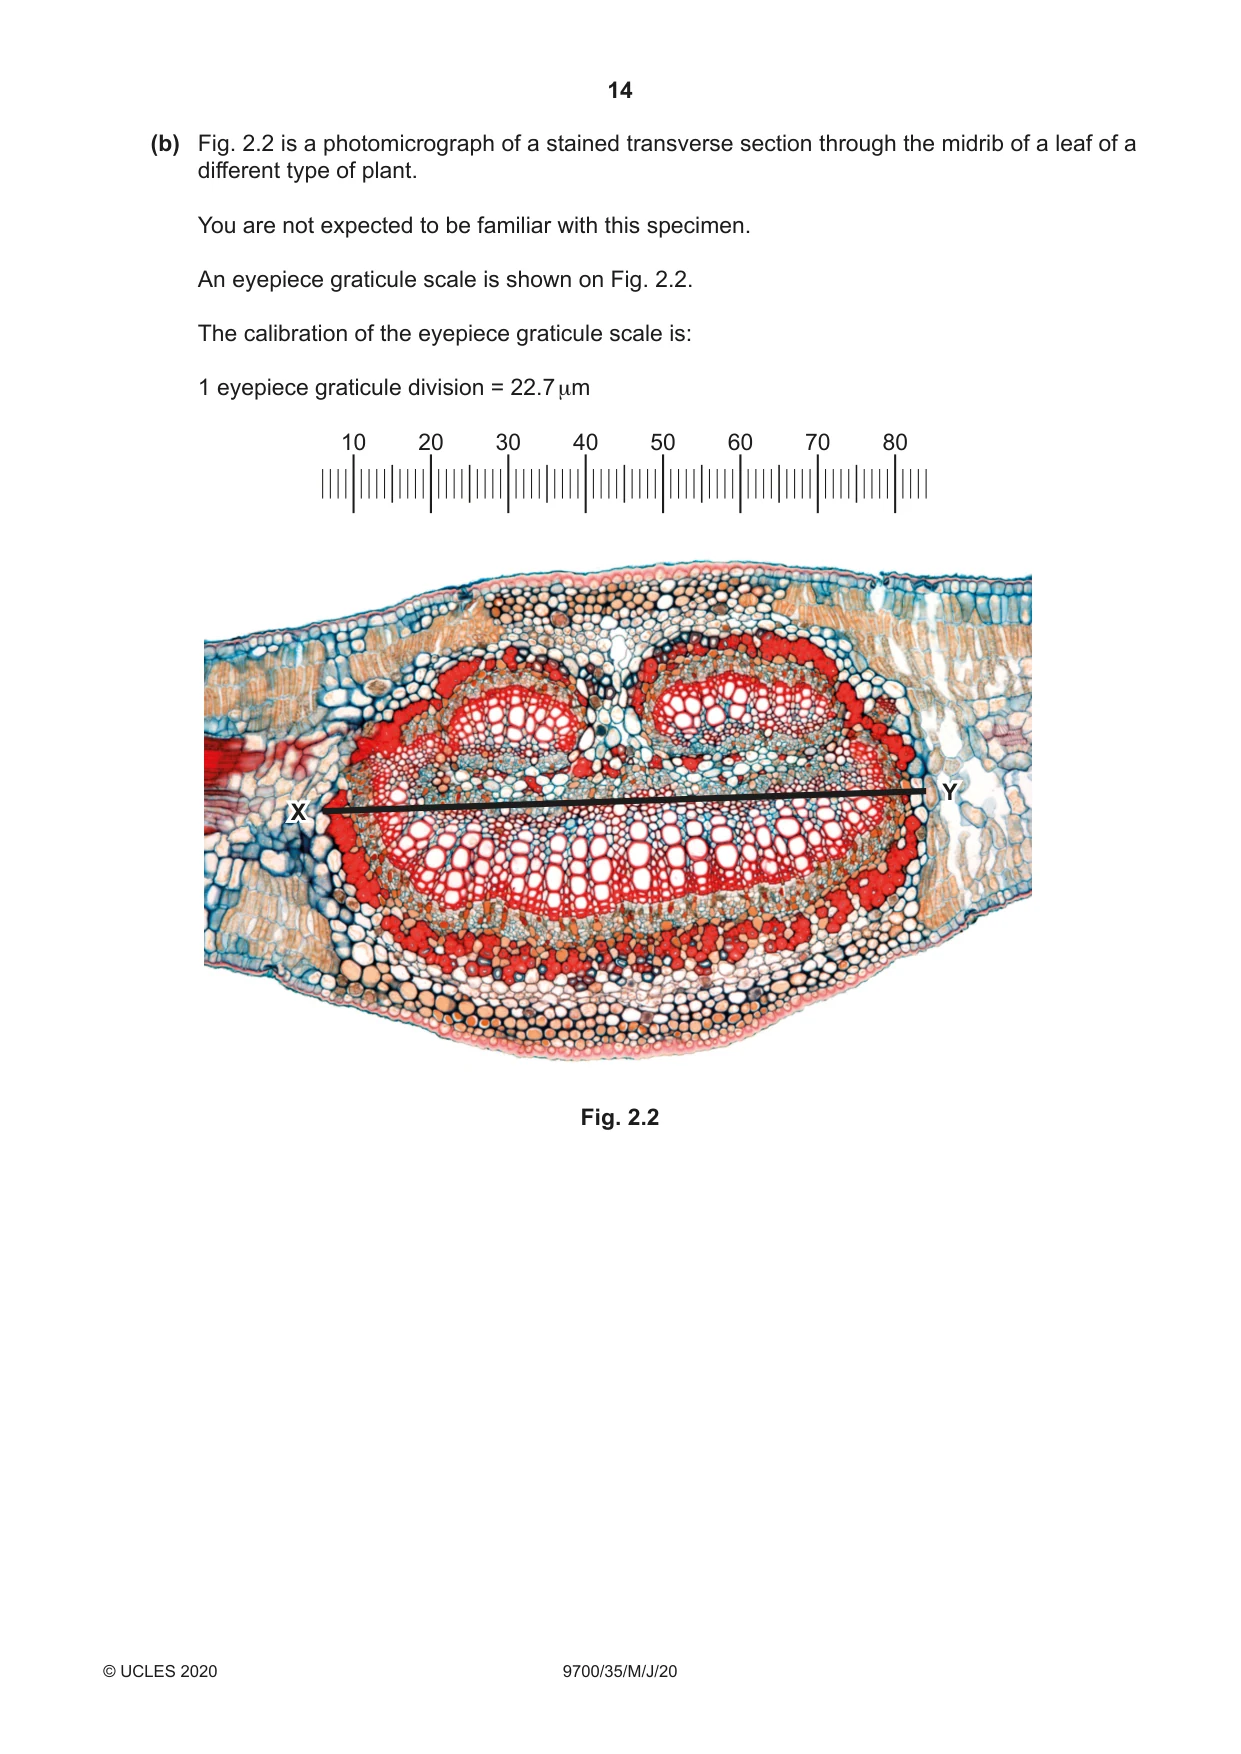
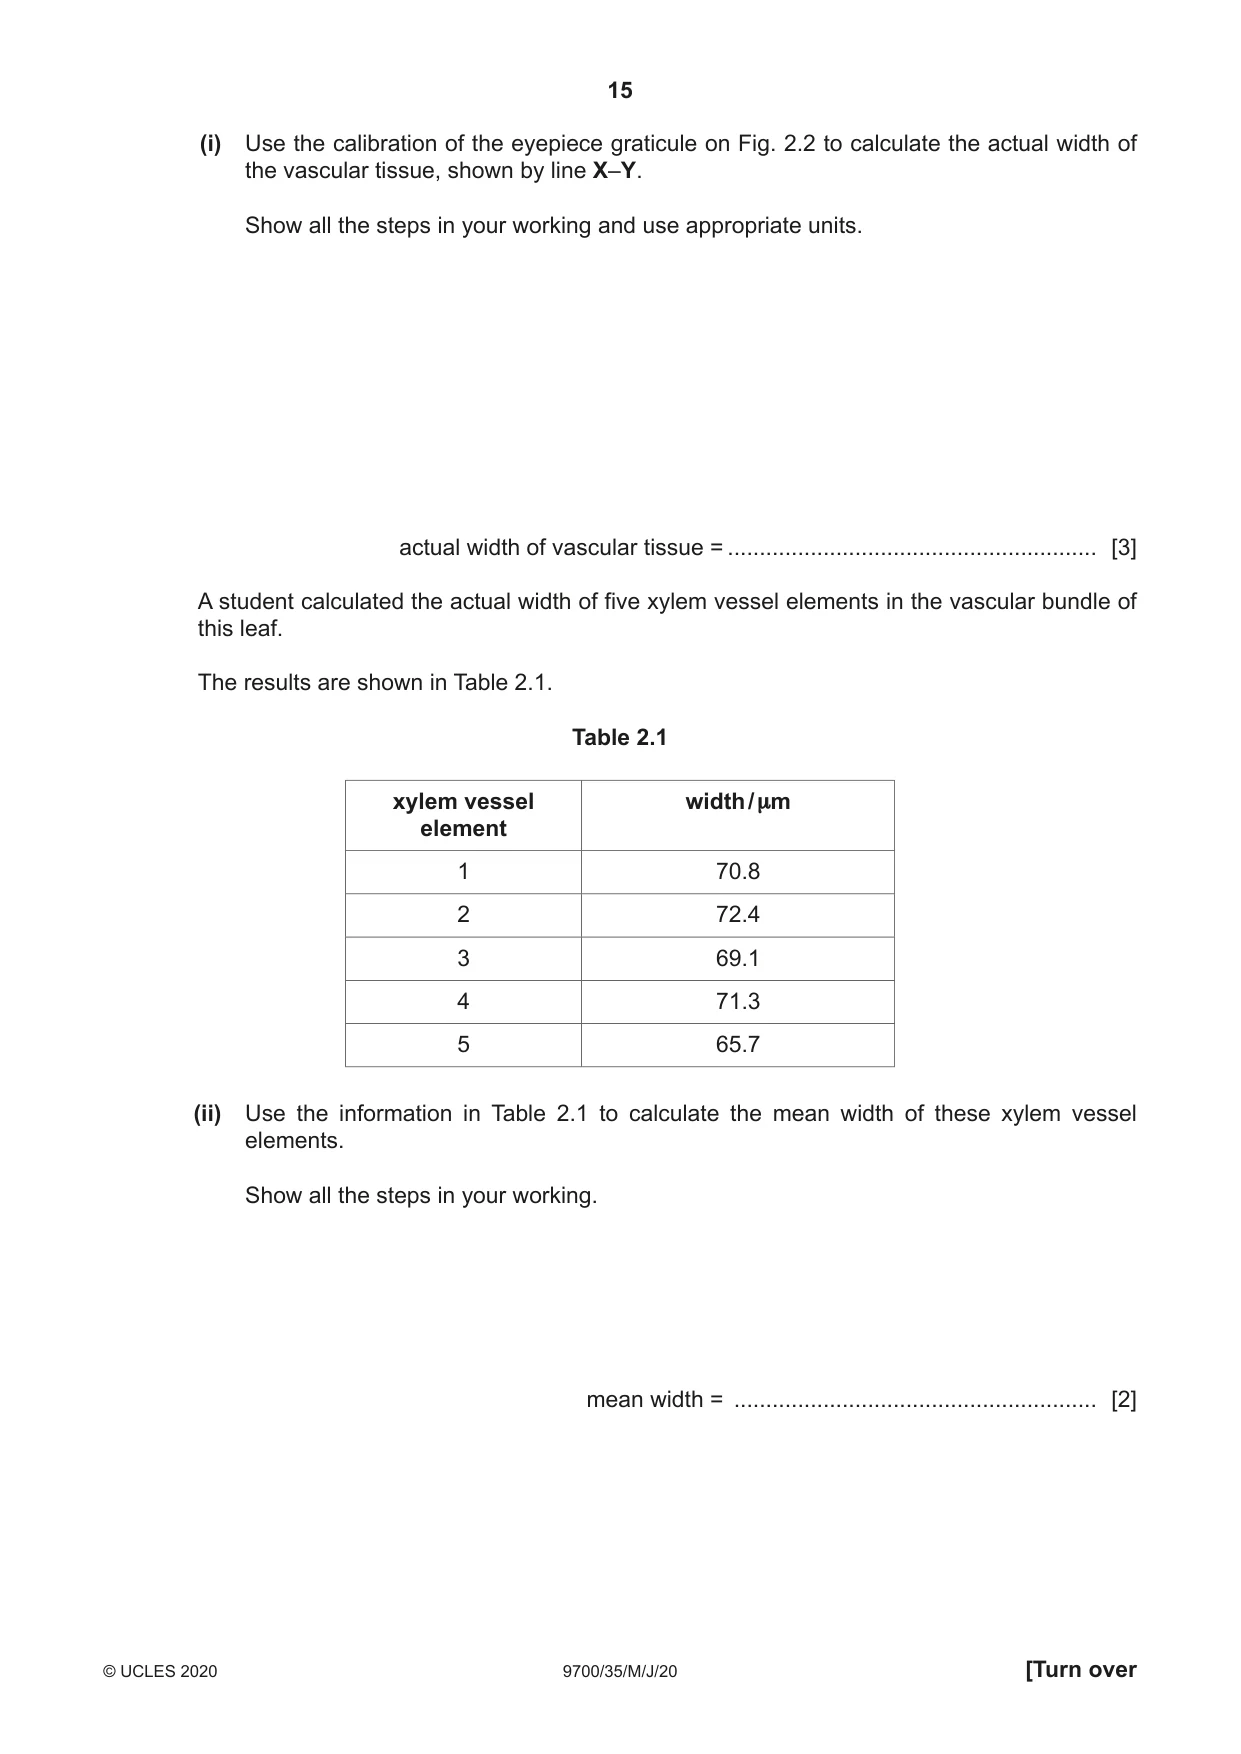
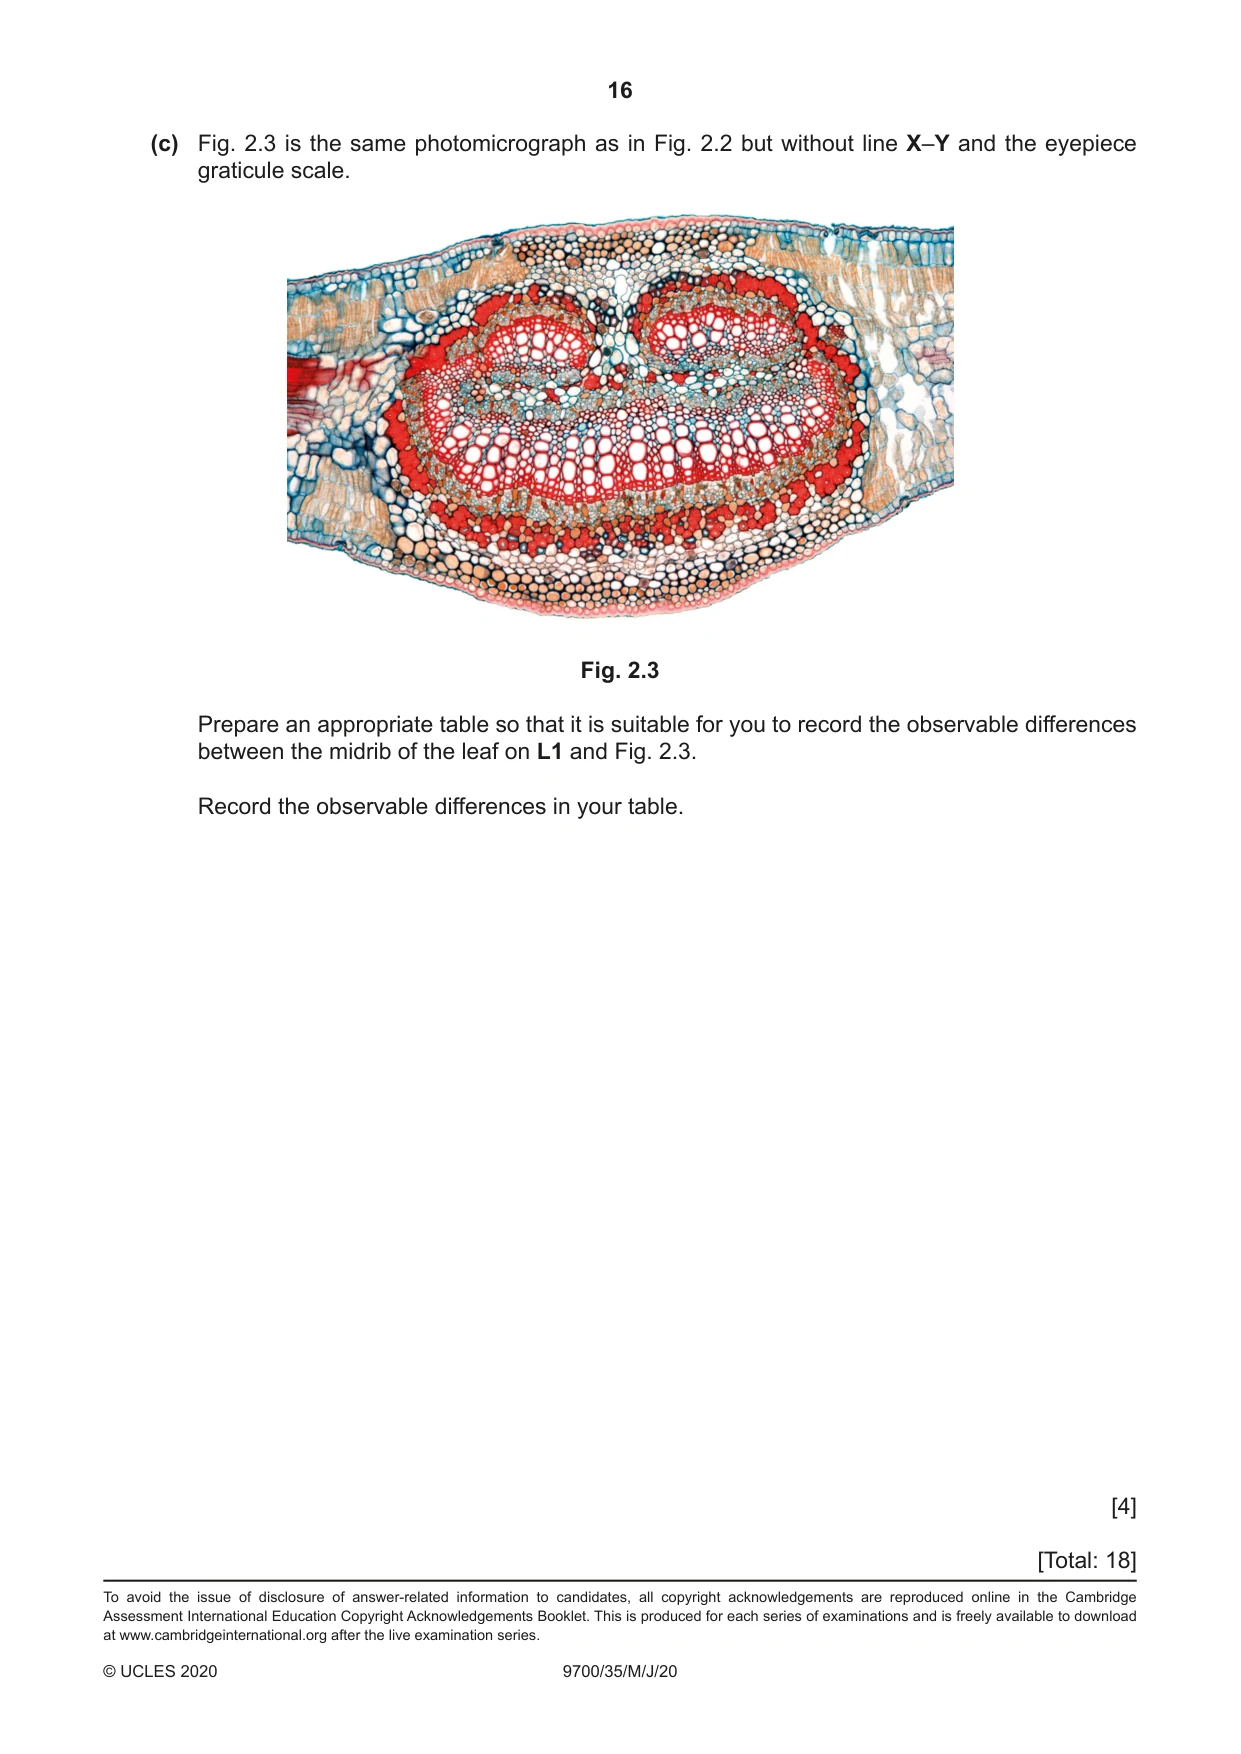
2 L1 is a slide of a stained transverse section through a plant leaf. You are not expected to be familiar with this specimen. (a) Select a field of view so that you can observe the different tissues as shown by the shaded area in Fig. 2.1. Fig. 2.1 Use a sharp pencil for drawing. You are expected to draw the correct shape and proportions of the different tissues. (i) Draw a large plan diagram of the part of the leaf on L1 shown by the shaded area in Fig. 2.1. Use one ruled label line and label to identify the upper epidermis. [5] (ii) Observe the upper epidermis of the leaf on L1. Select a line of four adjacent, touching cells in the upper epidermis. Make a large drawing of this line of four cells. Use one ruled label line and label to identify the cell wall of one cell. [4] (b) Fig. 2.2 is a photomicrograph of a stained transverse section through the midrib of a leaf of a different type of plant. You are not expected to be familiar with this specimen. An eyepiece graticule scale is shown on Fig. 2.2. The calibration of the eyepiece graticule scale is: 1 eyepiece graticule division = 22.7 μm 10 20 30 40 50 60 70 80 YY XX Fig. 2.2
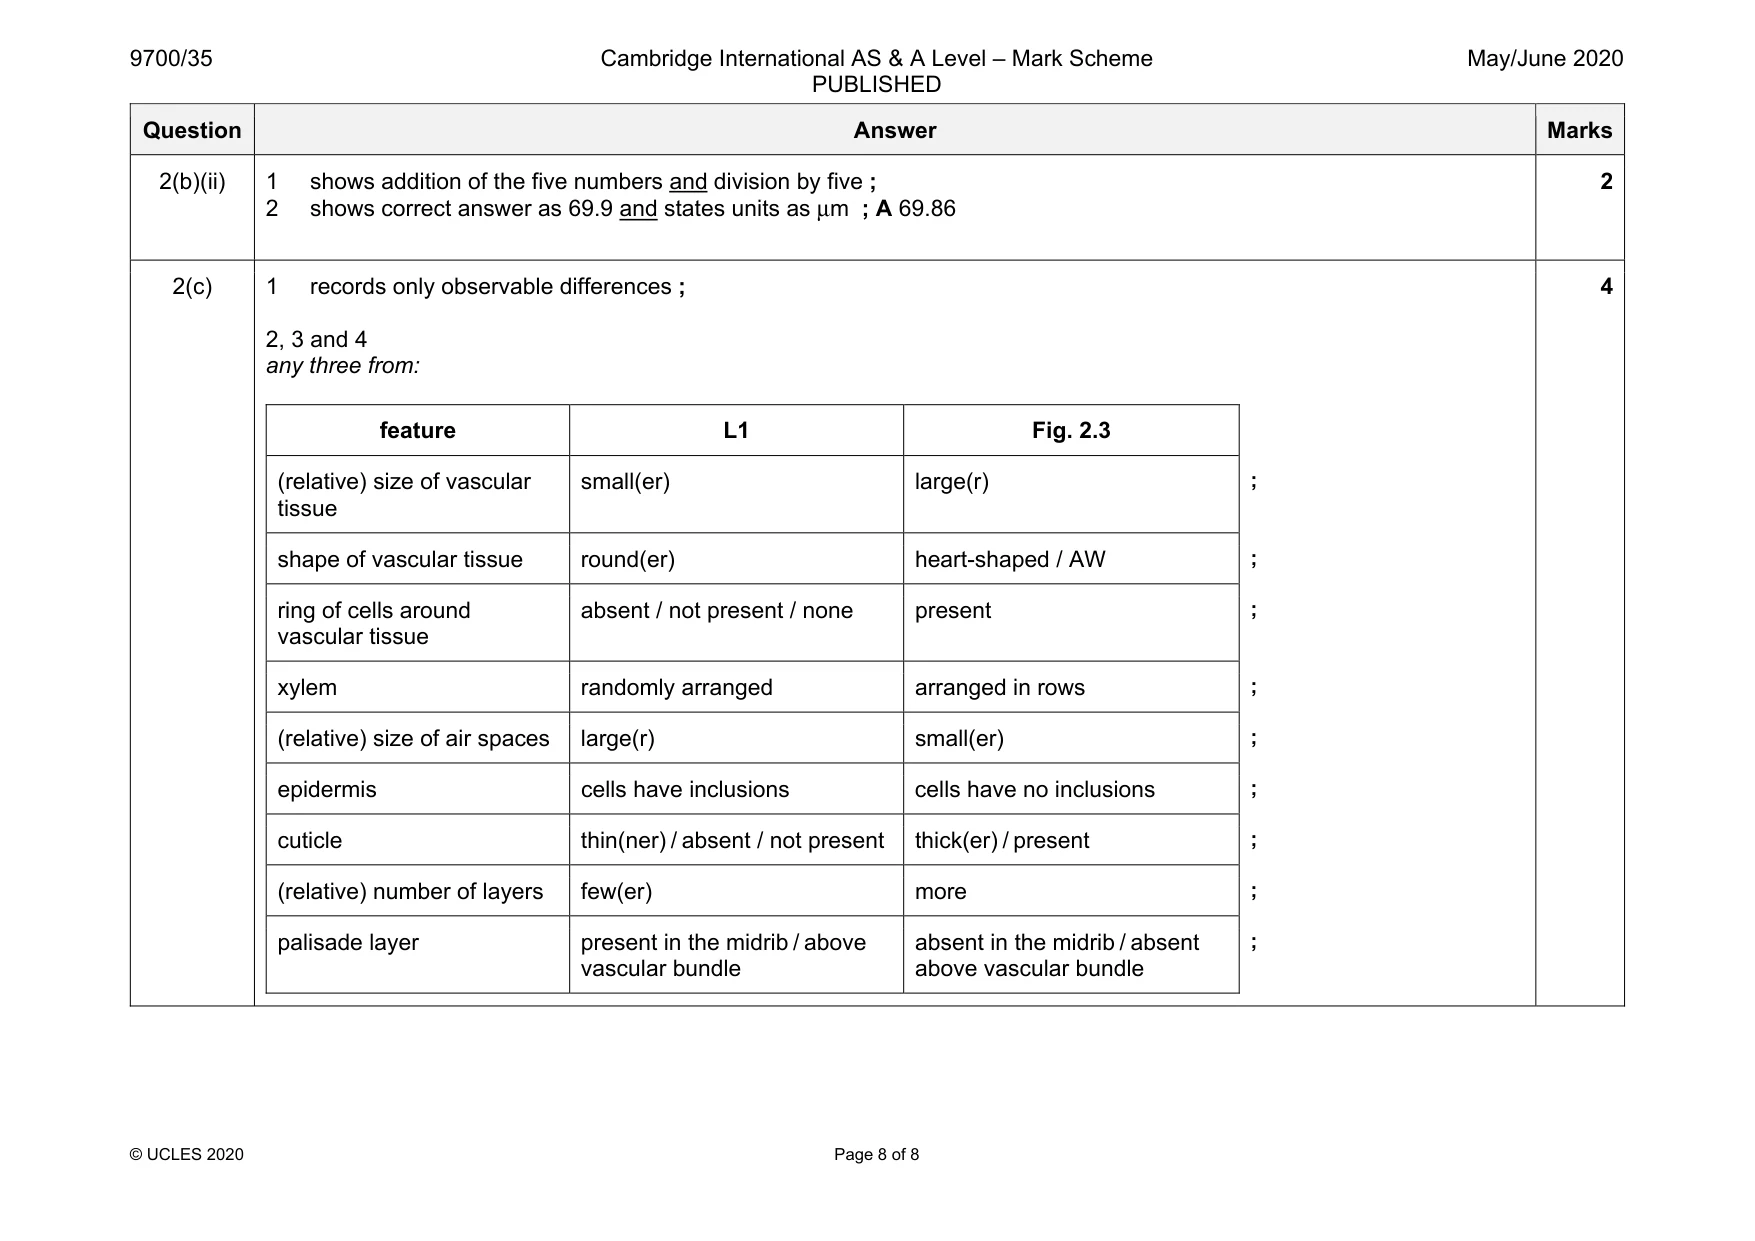
Mark scheme: 2(a)(i) TS Euphorbia leaf 1 suitable size and no shading ; 2 draws whole leaf section and no cells ; 3 correct proportions of tissues ; 4 correct shapes and number of, tissues / layers ; 5 label line and label to upper epidermis ; 5 2(a)(ii) TS Euphorbia leaf 1 suitable size and draws lines that are continuous, thin and sharp ; 2 draws four cells in a line and adjacent cells are touching ; 3 draws two lines around each cell and three lines where cells touch ; 4 label line and label to one cell wall ; 4 2(b)(i) 1 (records length of line X–Y as) 78 (eyepiece graticule units) ; 2 78 × 22.7 ; 3 1771 μm / 1.77 mm ; A answers to 2 or more significant figures 3 Question Answer Marks 2(b)(ii) 1 shows addition of the five numbers and division by five ; 2 shows correct answer as 69.9 and states units as μm ; A 69.86 2 2(c) 1 records only observable differences ; 2, 3 and 4 any three from: feature L1 Fig. 2.3 (relative) size of vascular tissue small(er) large(r) ; shape of vascular tissue round(er) heart-shaped / AW ; ring of cells around vascular tissue absent / not present / none present ; xylem randomly arranged arranged in rows ; (relative) size of air spaces large(r) small(er) ; epidermis cells have inclusions cells have no inclusions ; cuticle thin(ner) / absent / not present thick(er) / present ; (relative) number of layers few(er) more ; palisade layer present in the midrib / above vascular bundle absent in the midrib / absent above vascular bundle ; 4
What was in this paper
The subtopics covered by these 2 questions, and how many questions each got. Open one in a new tab to see every Cambridge question on it.