Cambridge A Level Biology 9700 — 2018 May/June Paper 5 · Variant 2
9700/52/M/J/18 · 2 questions · 30 marks · ≈34 min
The question paper and its mark scheme, free to read here and free to download. This is Cambridge’s own paper, exactly as it was sat.
Question paper12 pages


Mark scheme11 pages
Answers below. Sit the paper first if you are practising.
Questions as text
Q1 · During the light dependent stage of photosynthesis, hydrogen ions and electrons are…
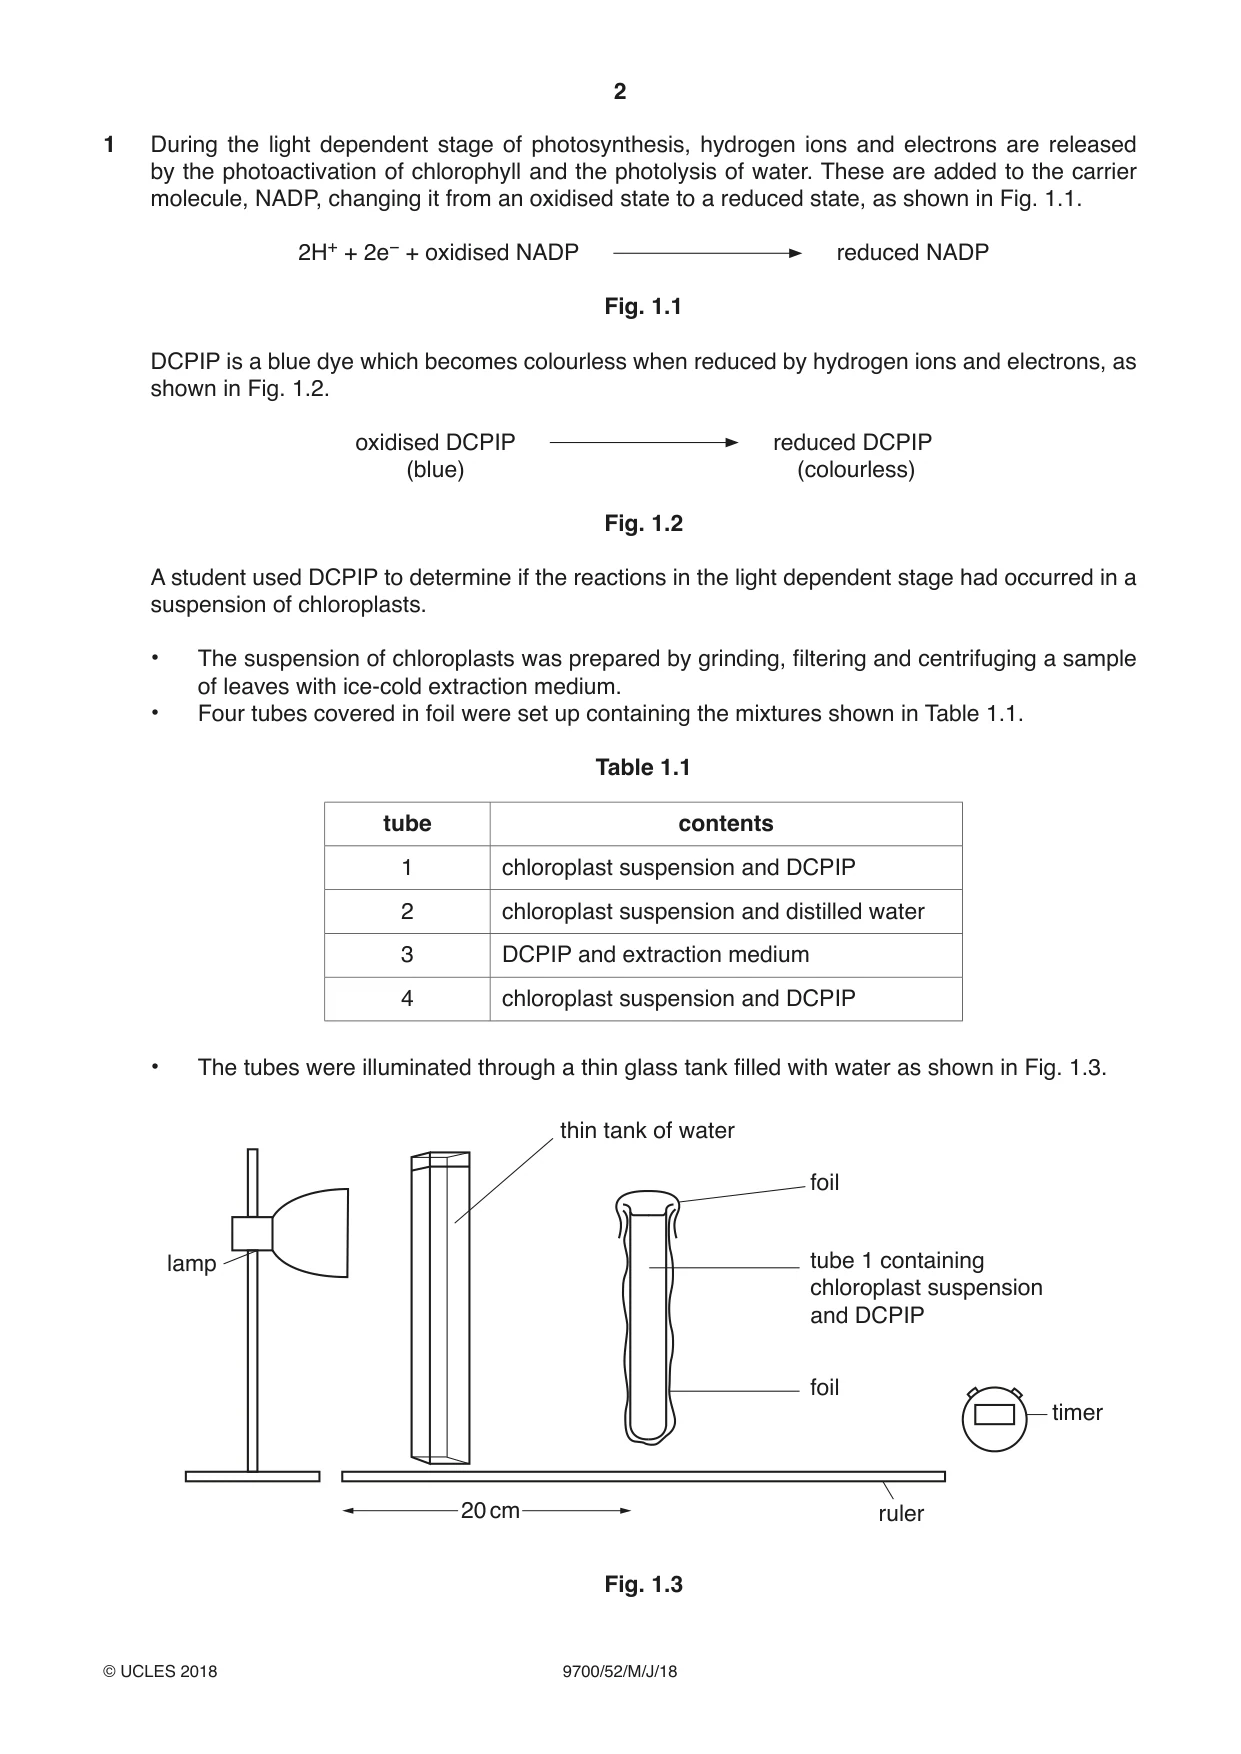
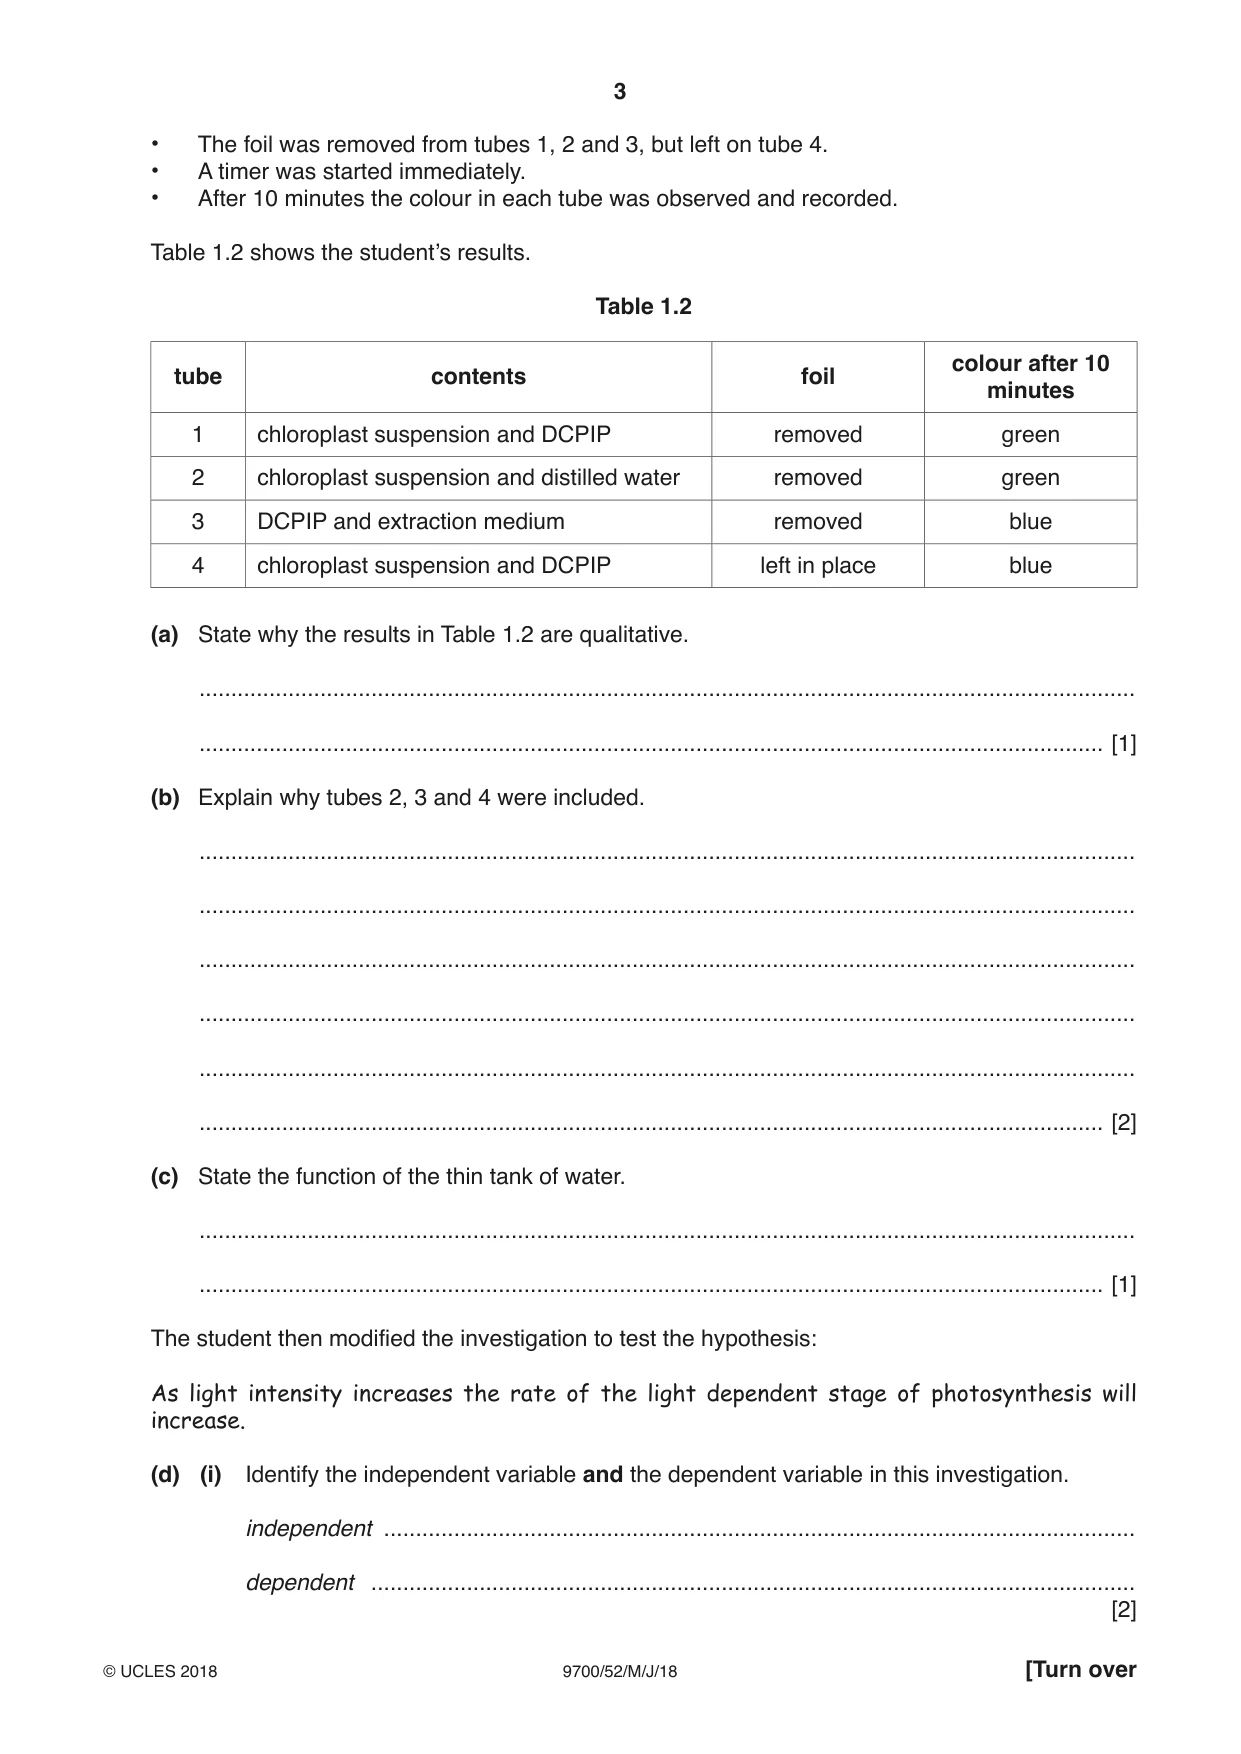
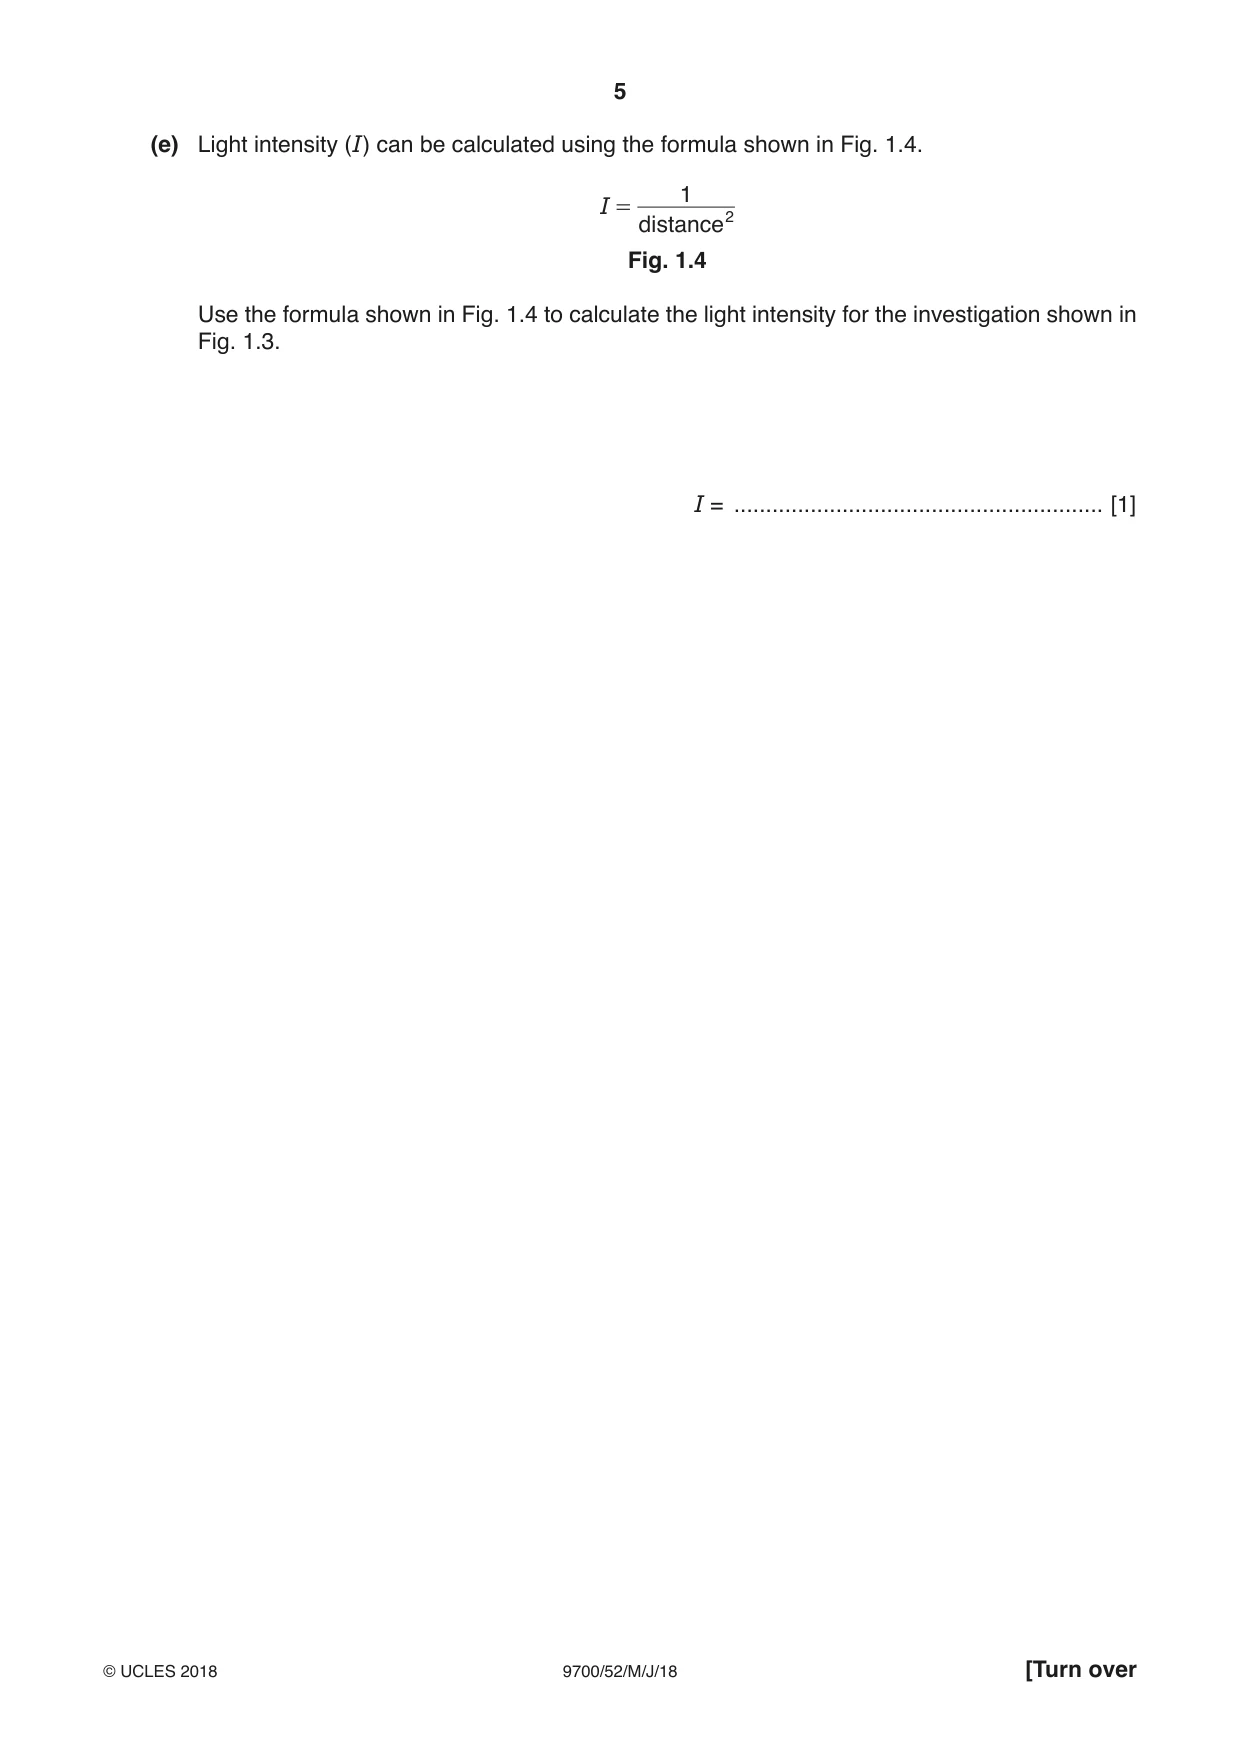
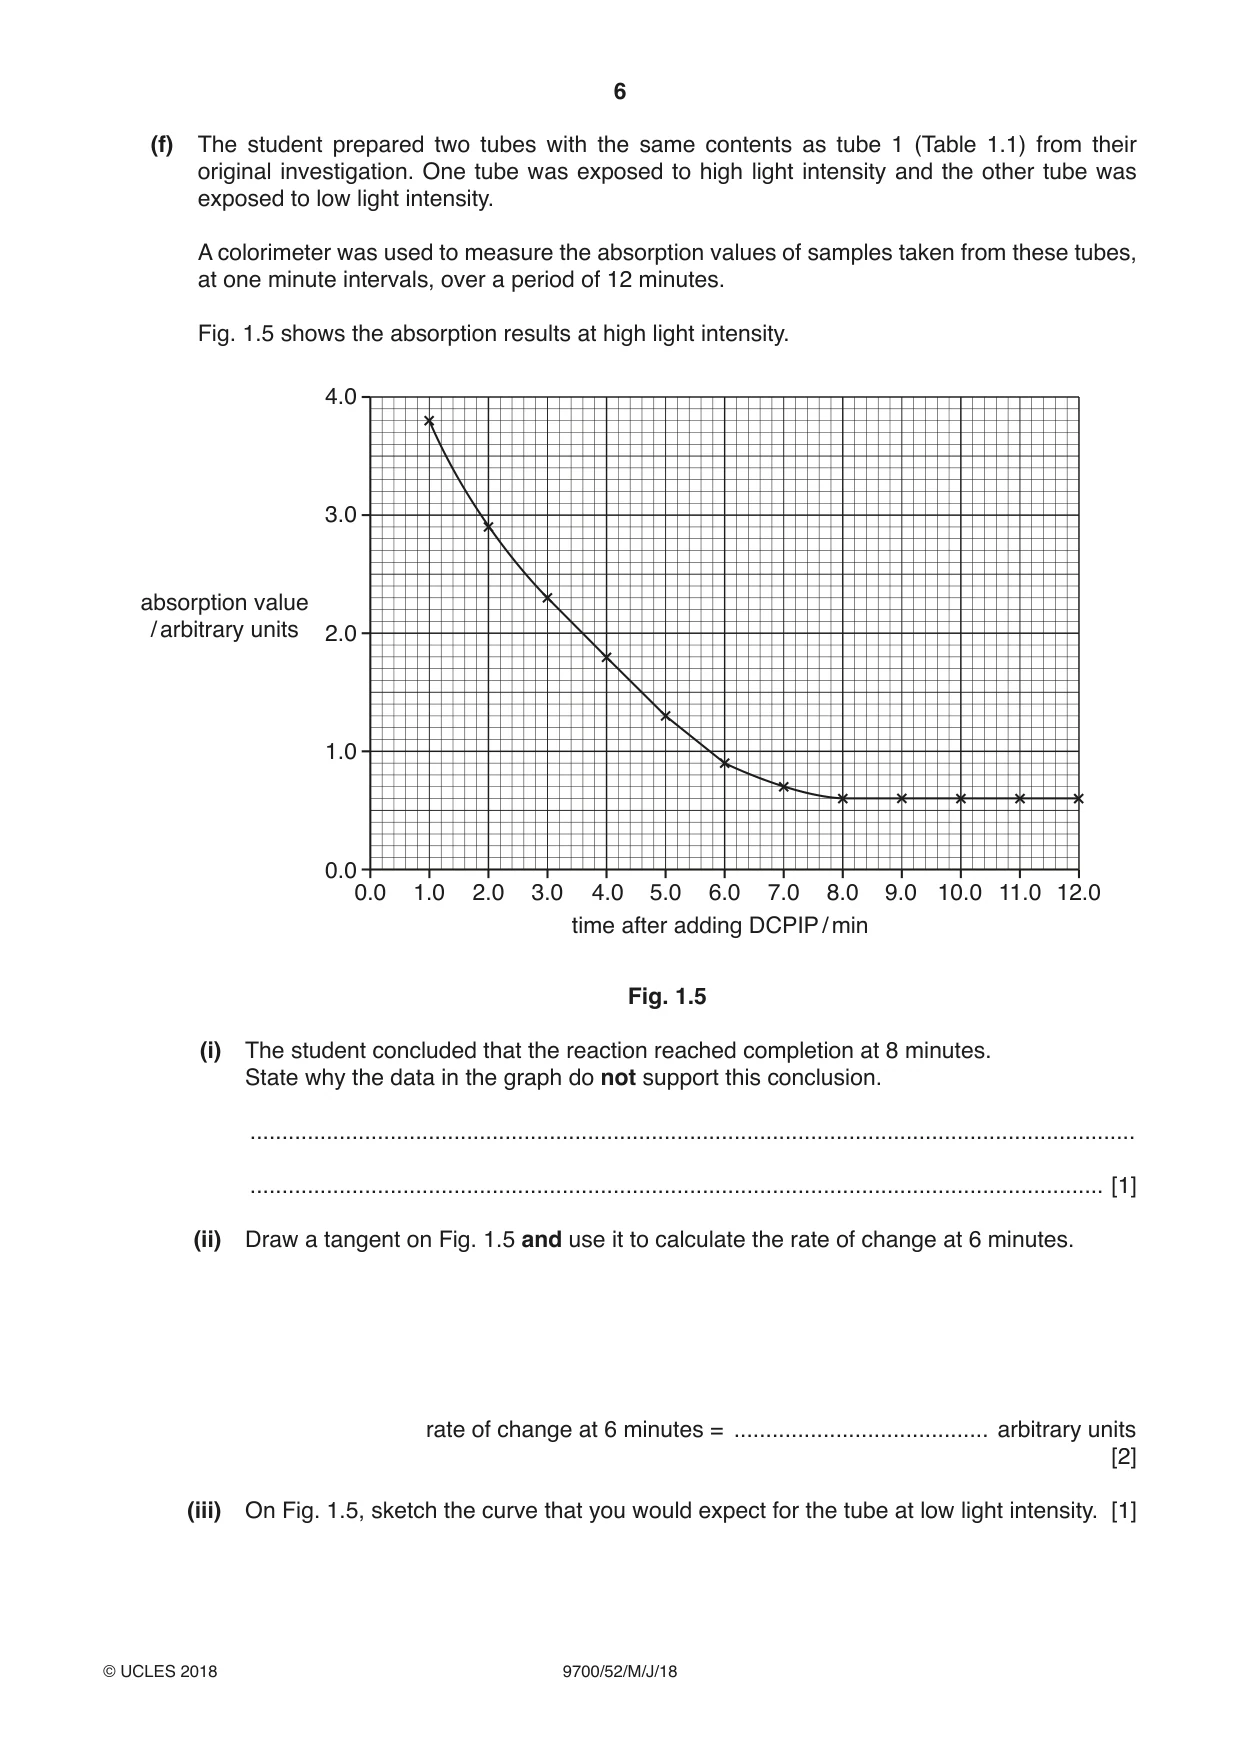
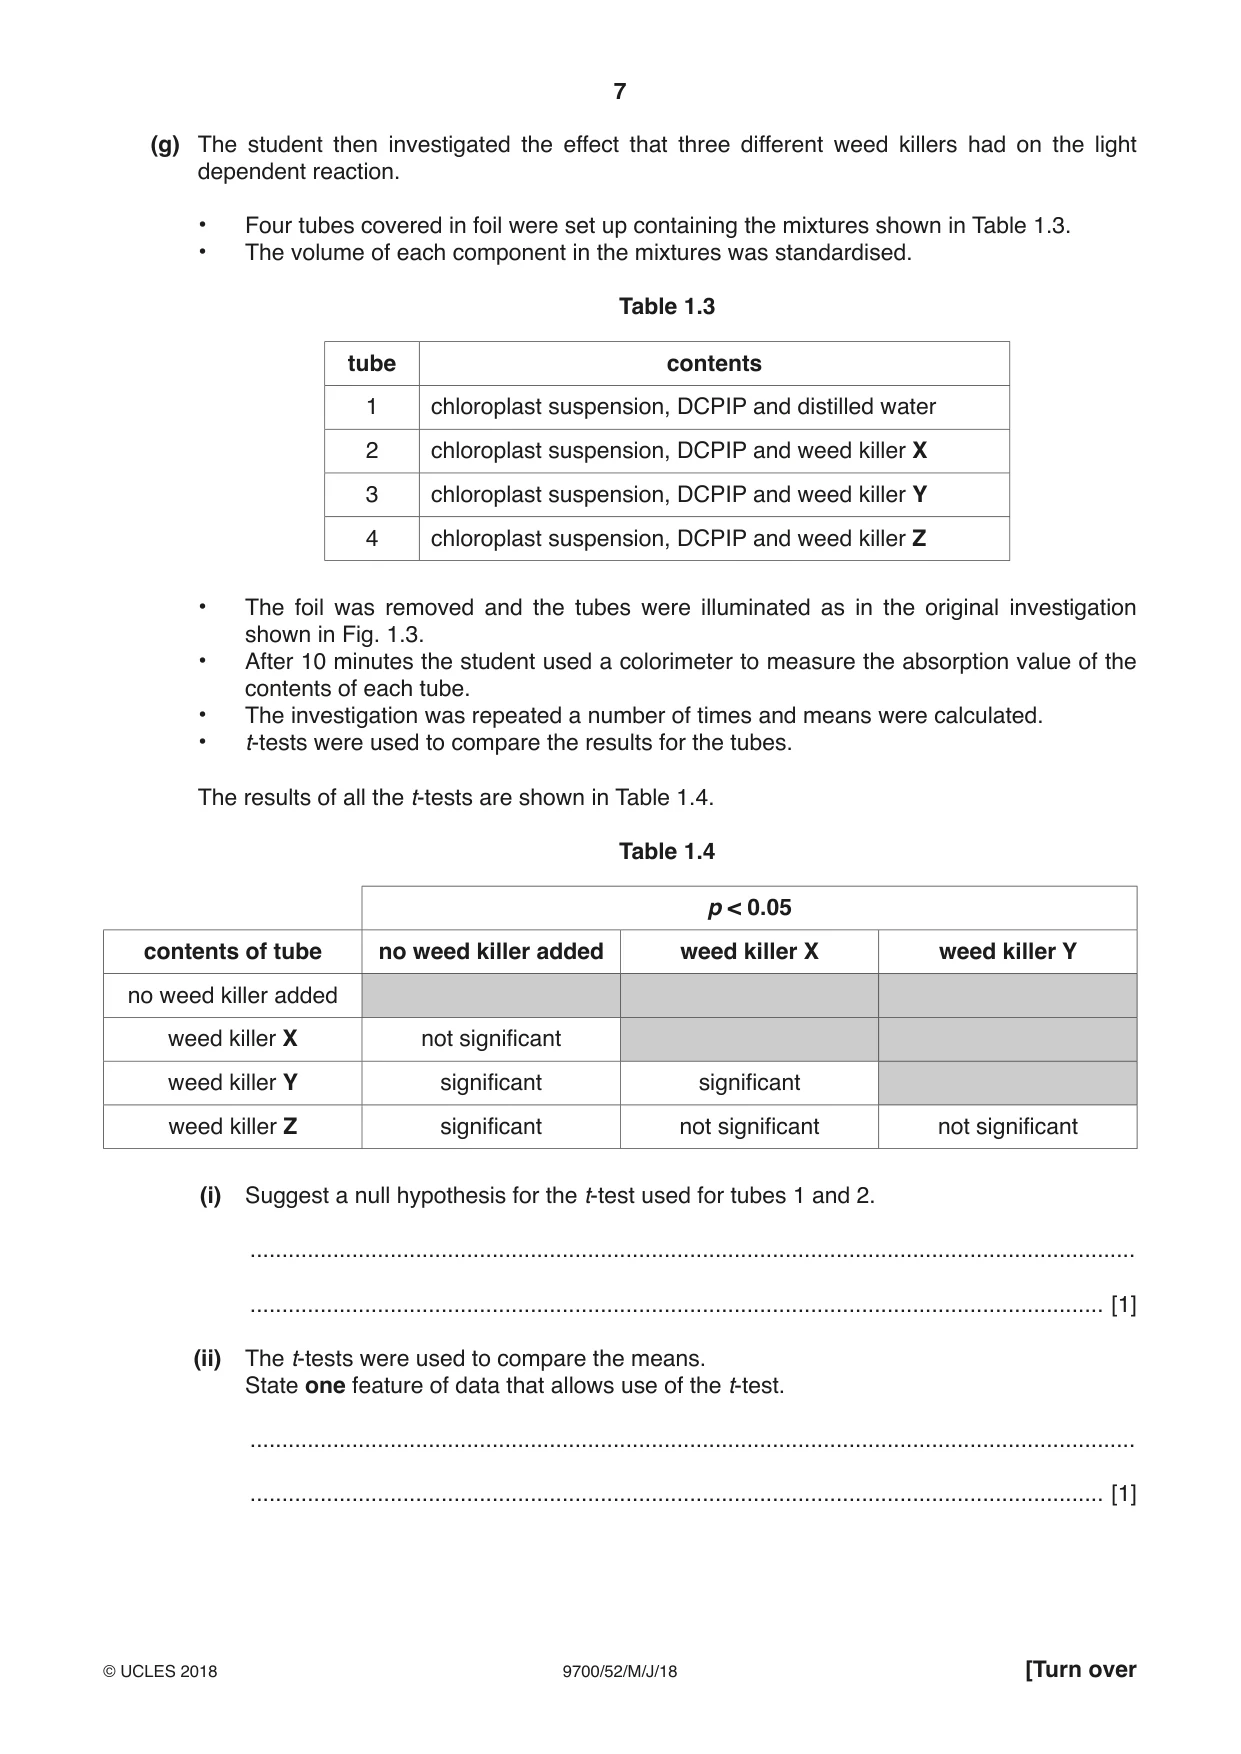
1 During the light dependent stage of photosynthesis, hydrogen ions and electrons are released by the photoactivation of chlorophyll and the photolysis of water. These are added to the carrier molecule, NADP, changing it from an oxidised state to a reduced state, as shown in Fig. 1.1. 2H+ + 2e− + oxidised NADP reduced NADP Fig. 1.1 DCPIP is a blue dye which becomes colourless when reduced by hydrogen ions and electrons, as shown in Fig. 1.2. oxidised DCPIP reduced DCPIP (blue) (colourless) Fig. 1.2 A student used DCPIP to determine if the reactions in the light dependent stage had occurred in a suspension of chloroplasts. • The suspension of chloroplasts was prepared by grinding, filtering and centrifuging a sample of leaves with ice-cold extraction medium. • Four tubes covered in foil were set up containing the mixtures shown in Table 1.1. Table 1.1 tube contents 1 chloroplast suspension and DCPIP 2 chloroplast suspension and distilled water 3 DCPIP and extraction medium 4 chloroplast suspension and DCPIP • The tubes were illuminated through a thin glass tank filled with water as shown in Fig. 1.3. thin tank of water foil lamp tube 1 containing chloroplast suspension and DCPIP foil timer 20 cm ruler Fig. 1.3 • The foil was removed from tubes 1, 2 and 3, but left on tube 4. • A timer was started immediately. • After 10 minutes the colour in each tube was observed and recorded. Table 1.2 shows the student’s results. Table 1.2 colour after 10 tube contents foil minutes 1 chloroplast suspension and DCPIP removed green 2 chloroplast suspension and distilled water removed green 3 DCPIP and extraction medium removed blue 4 chloroplast suspension and DCPIP left in place blue (a) State why the results in Table 1.2 are qualitative. ................................................................................................................................................... .............................................................................................................................................. [1] (b) Explain why tubes 2, 3 and 4 were included. ................................................................................................................................................... ................................................................................................................................................... ................................................................................................................................................... ................................................................................................................................................... ................................................................................................................................................... .............................................................................................................................................. [2] (c) State the function of the thin tank of water. ................................................................................................................................................... .............................................................................................................................................. [1] The student then modified the investigation to test the hypothesis: As light intensity increases the rate of the light dependent stage of photosynthesis will increase. (d) (i) Identify the independent variable and the dependent variable in this investigation. independent ...................................................................................................................... dependent ........................................................................................................................ [2] (ii) Using the apparatus shown in Fig. 1.3, describe a method the student could use to collect the data needed to test their hypothesis. Your method should be set out in a logical way and be detailed enough to let another person follow it. ........................................................................................................................................... ........................................................................................................................................... ........................................................................................................................................... ........................................................................................................................................... ........................................................................................................................................... ........................................................................................................................................... ........................................................................................................................................... ........................................................................................................................................... ........................................................................................................................................... ........................................................................................................................................... ........................................................................................................................................... ........................................................................................................................................... ........................................................................................................................................... ........................................................................................................................................... ........................................................................................................................................... ........................................................................................................................................... ........................................................................................................................................... ........................................................................................................................................... ........................................................................................................................................... ........................................................................................................................................... ........................................................................................................................................... ........................................................................................................................................... ........................................................................................................................................... ........................................................................................................................................... ...................................................................................................................................... [7] (e) Light intensity (I ) can be calculated using the formula shown in Fig. 1.4. 1 I = distance 2 Fig. 1.4 Use the formula shown in Fig. 1.4 to calculate the light intensity for the investigation shown in Fig. 1.3. I = .......................................................... [1] (f) The student prepared two tubes with the same contents as tube 1 (Table 1.1) from their original investigation. One tube was exposed to high light intensity and the other tube was exposed to low light intensity. A colorimeter was used to measure the absorption values of samples taken from these tubes, at one minute intervals, over a period of 12 minutes. Fig. 1.5 shows the absorption results at high light intensity. 4.0 3.0 absorption value / arbitrary units 2.0 1.0 0.0 0.0 1.0 2.0 3.0 4.0 5.0 6.0 7.0 8.0 9.0 10.0 11.0 12.0 time after adding DCPIP / min Fig. 1.5 (i) The student concluded that the reaction reached completion at 8 minutes. State why the data in the graph do not support this conclusion. ........................................................................................................................................... ...................................................................................................................................... [1] (ii) Draw a tangent on Fig. 1.5 and use it to calculate the rate of change at 6 minutes. rate of change at 6 minutes = ........................................ arbitrary units [2] (iii) On Fig. 1.5, sketch the curve that you would expect for the tube at low light intensity. [1] (g) The student then investigated the effect that three different weed killers had on the light dependent reaction. • Four tubes covered in foil were set up containing the mixtures shown in Table 1.3. • The volume of each component in the mixtures was standardised. Table 1.3 tube contents 1 chloroplast suspension, DCPIP and distilled water 2 chloroplast suspension, DCPIP and weed killer X 3 chloroplast suspension, DCPIP and weed killer Y 4 chloroplast suspension, DCPIP and weed killer Z • The foil was removed and the tubes were illuminated as in the original investigation shown in Fig. 1.3. • After 10 minutes the student used a colorimeter to measure the absorption value of the contents of each tube. • The investigation was repeated a number of times and means were calculated. • t-tests were used to compare the results for the tubes. The results of all the t-tests are shown in Table 1.4. Table 1.4 p < 0.05 contents of tube no weed killer added weed killer X weed killer Y no weed killer added weed killer X not significant weed killer Y significant significant weed killer Z significant not significant not significant (i) Suggest a null hypothesis for the t-test used for tubes 1 and 2. ........................................................................................................................................... ...................................................................................................................................... [1] (ii) The t-tests were used to compare the means. State one feature of data that allows use of the t-test. ........................................................................................................................................... ...................................................................................................................................... [1] (iii) The student calculated that there were 22 degrees of freedom in each of these t-tests. An equal number of replicates for each tube was carried out. State the number of replicates of each tube that were carried out. ........................................................................................................................................... ...................................................................................................................................... [1] (iv) The critical value for t at p < 0.05 in this investigation was 2.07. State what the results in Table 1.4 tell you about the student’s calculated value of t when comparing the effect between weed killers X and Y. ...................................................................................................................................... [1] [Total: 22]
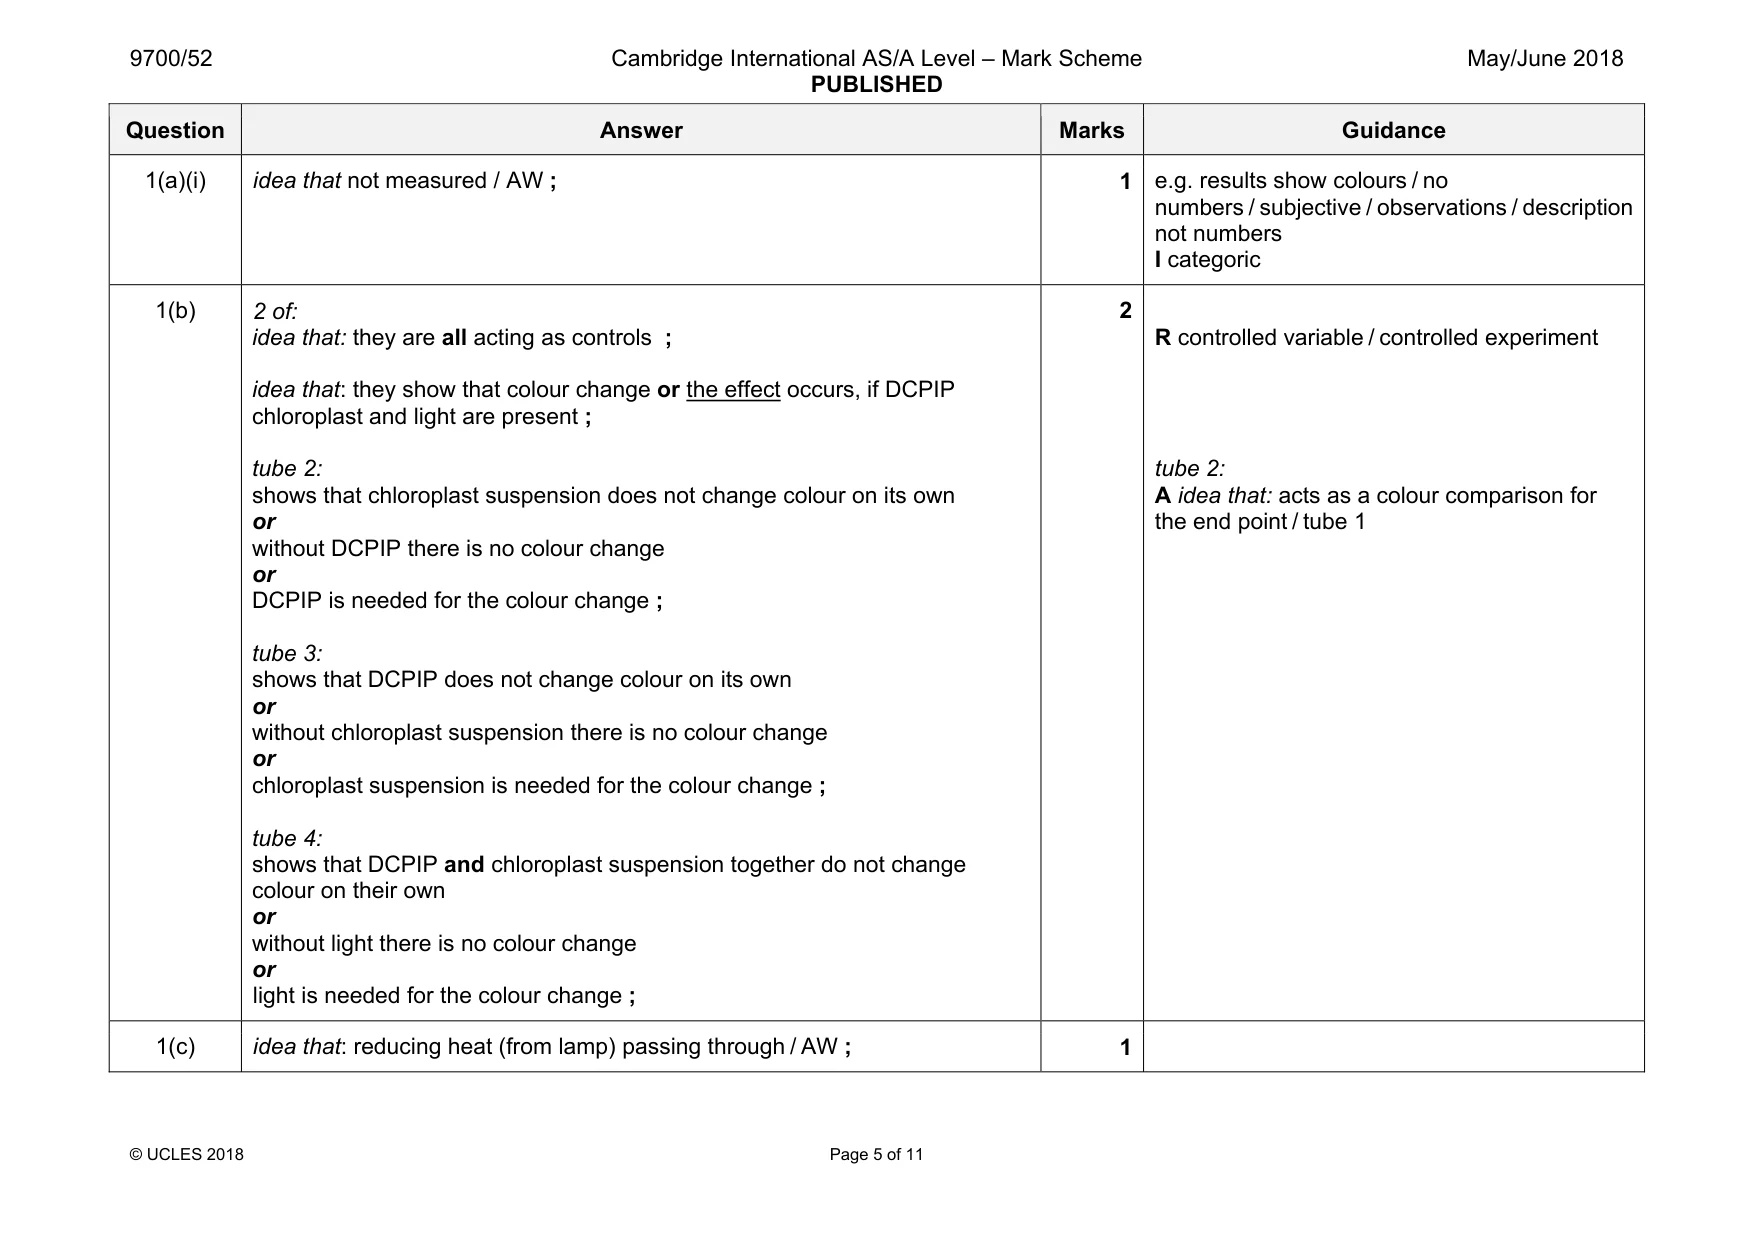
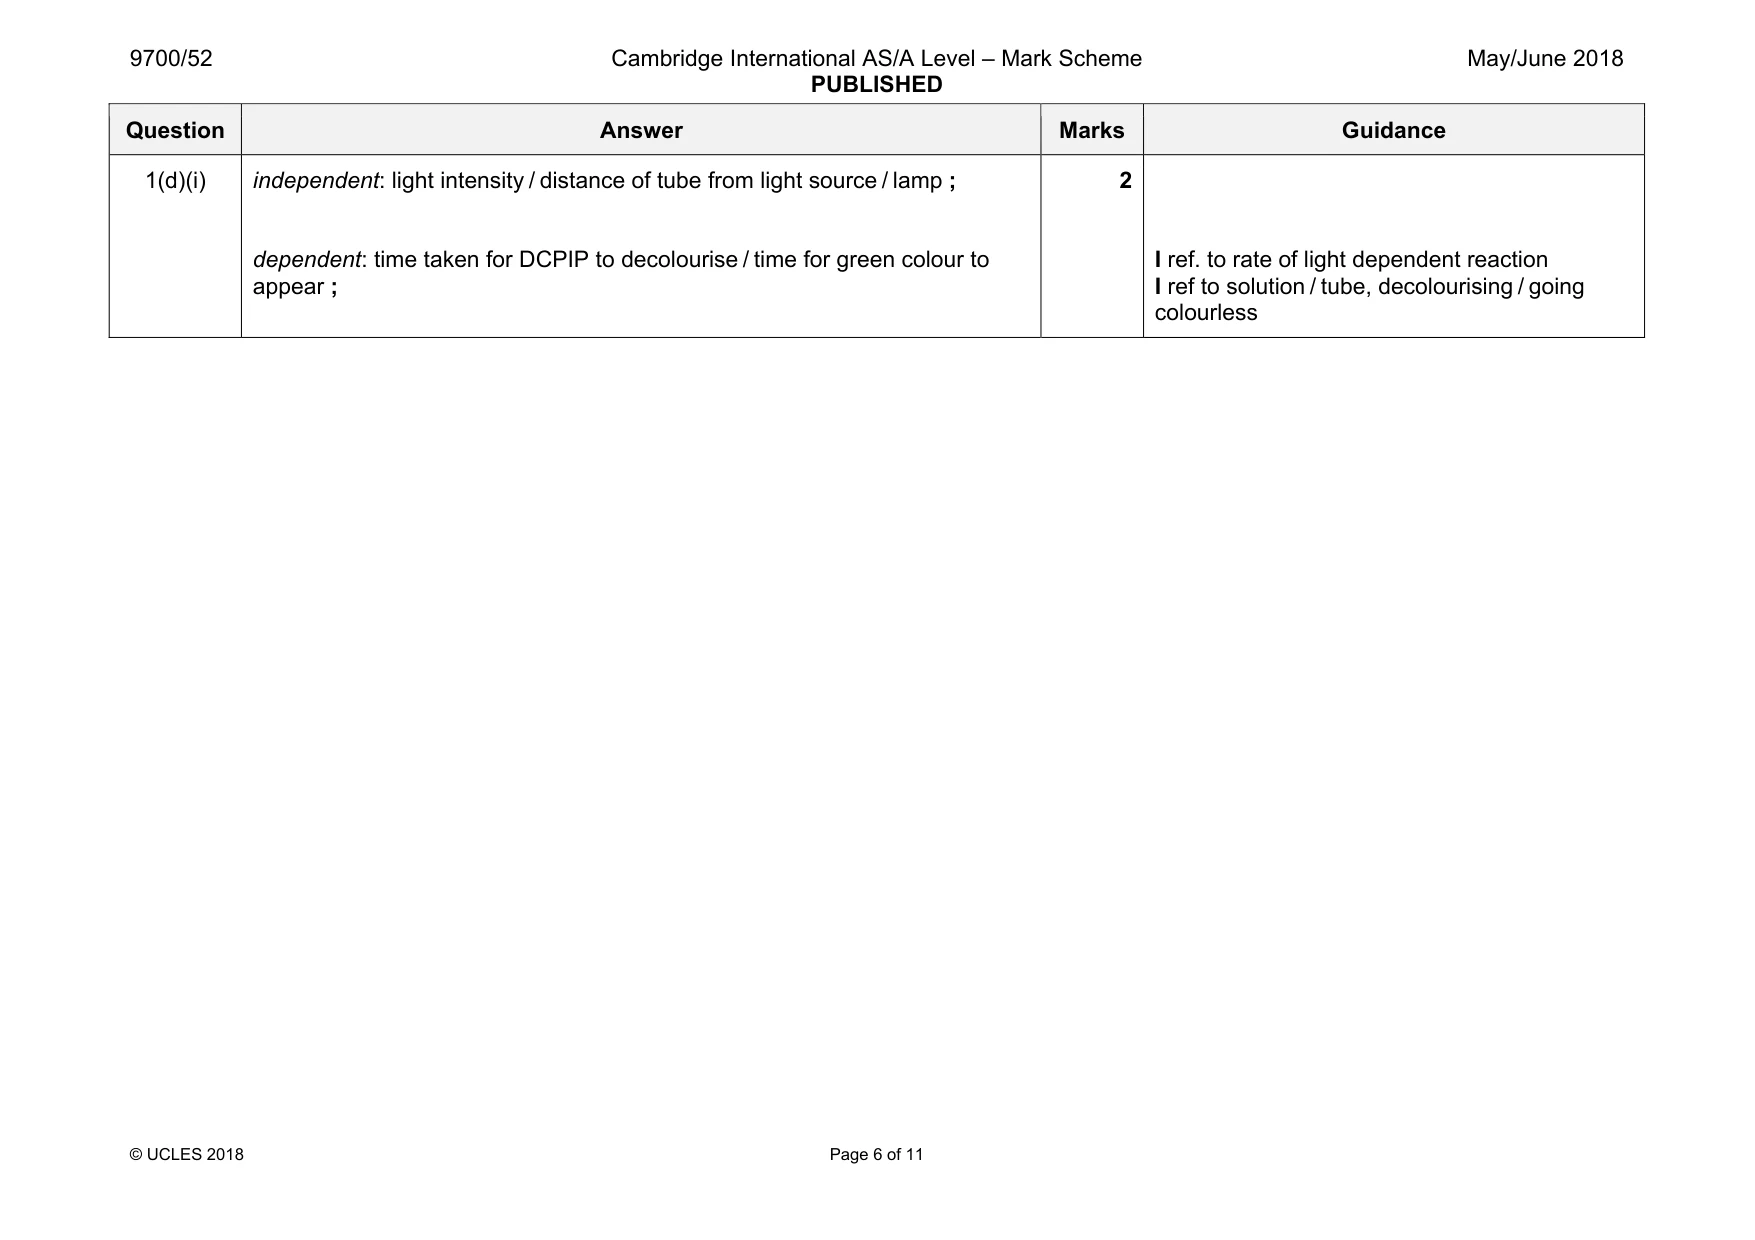
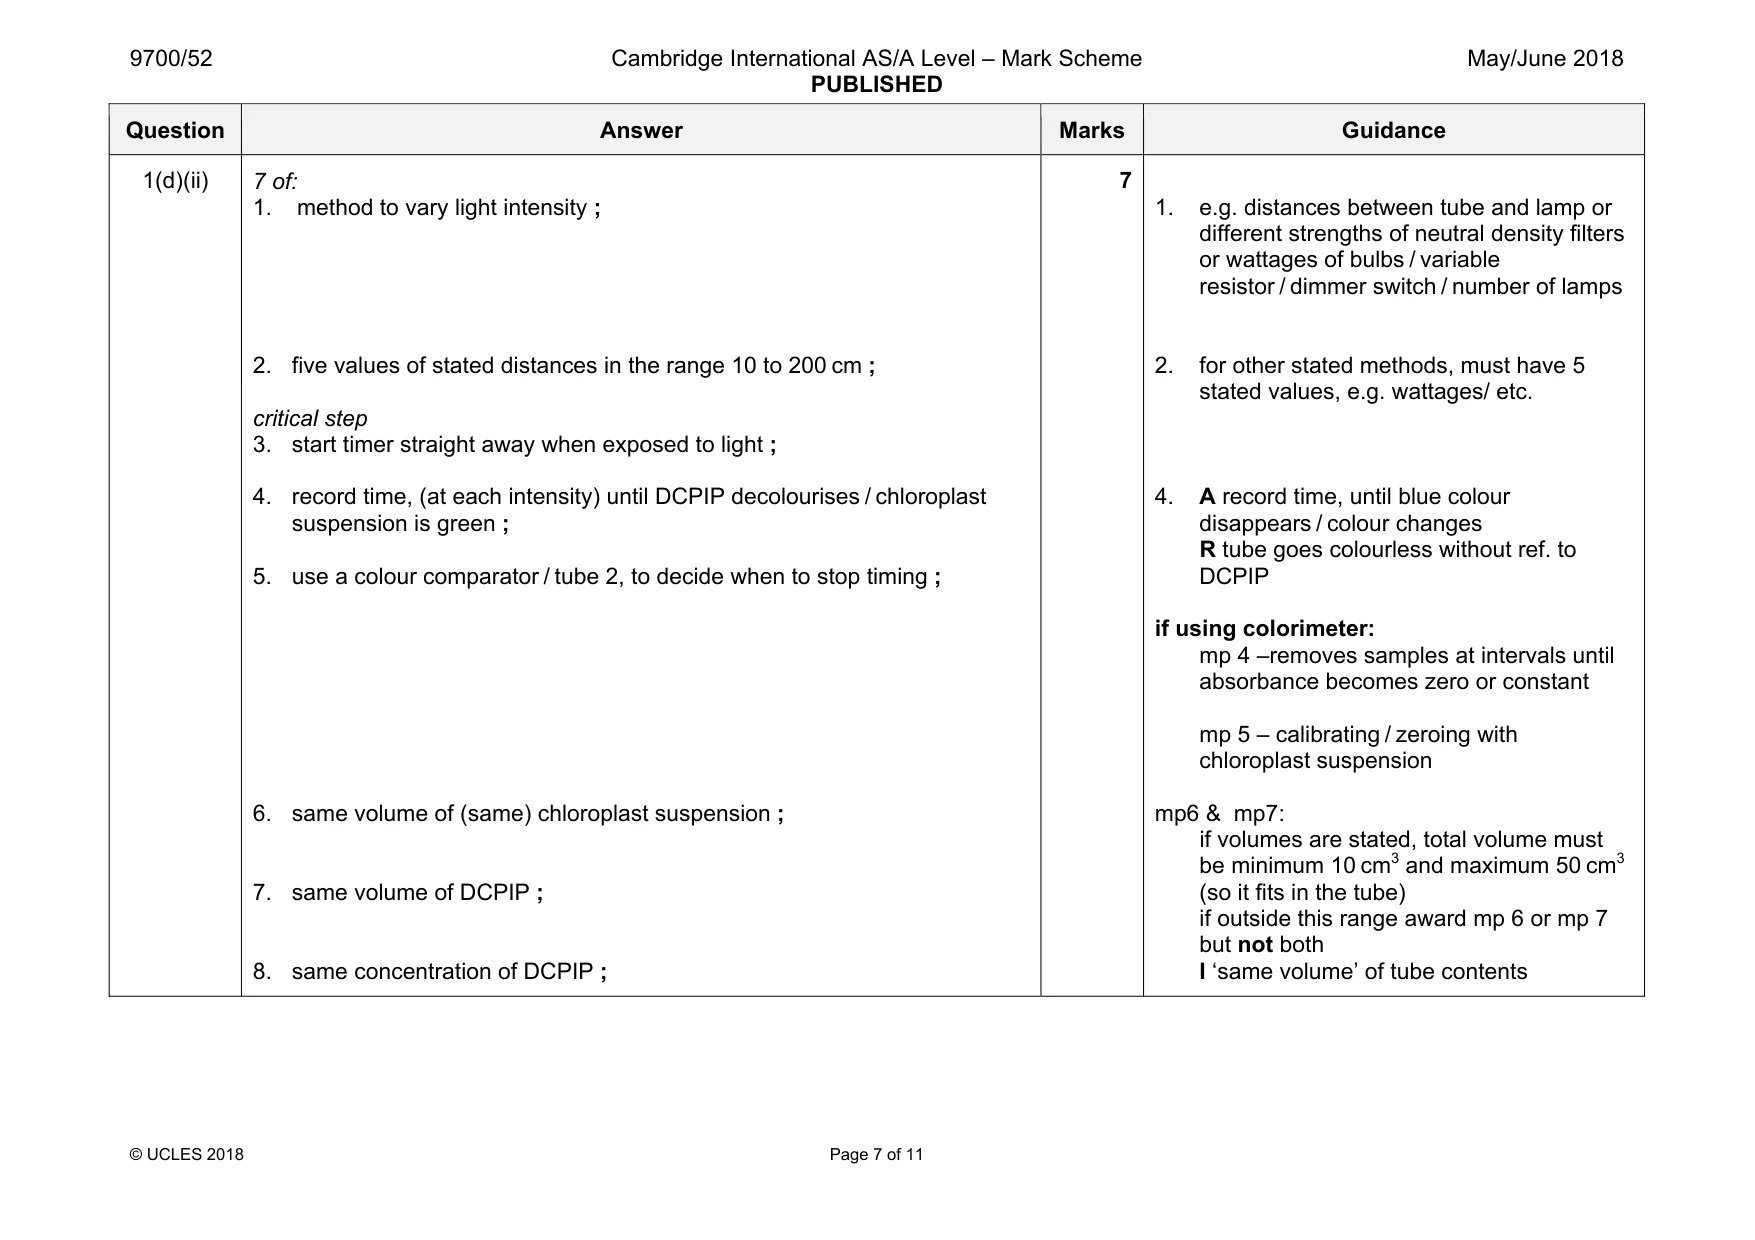
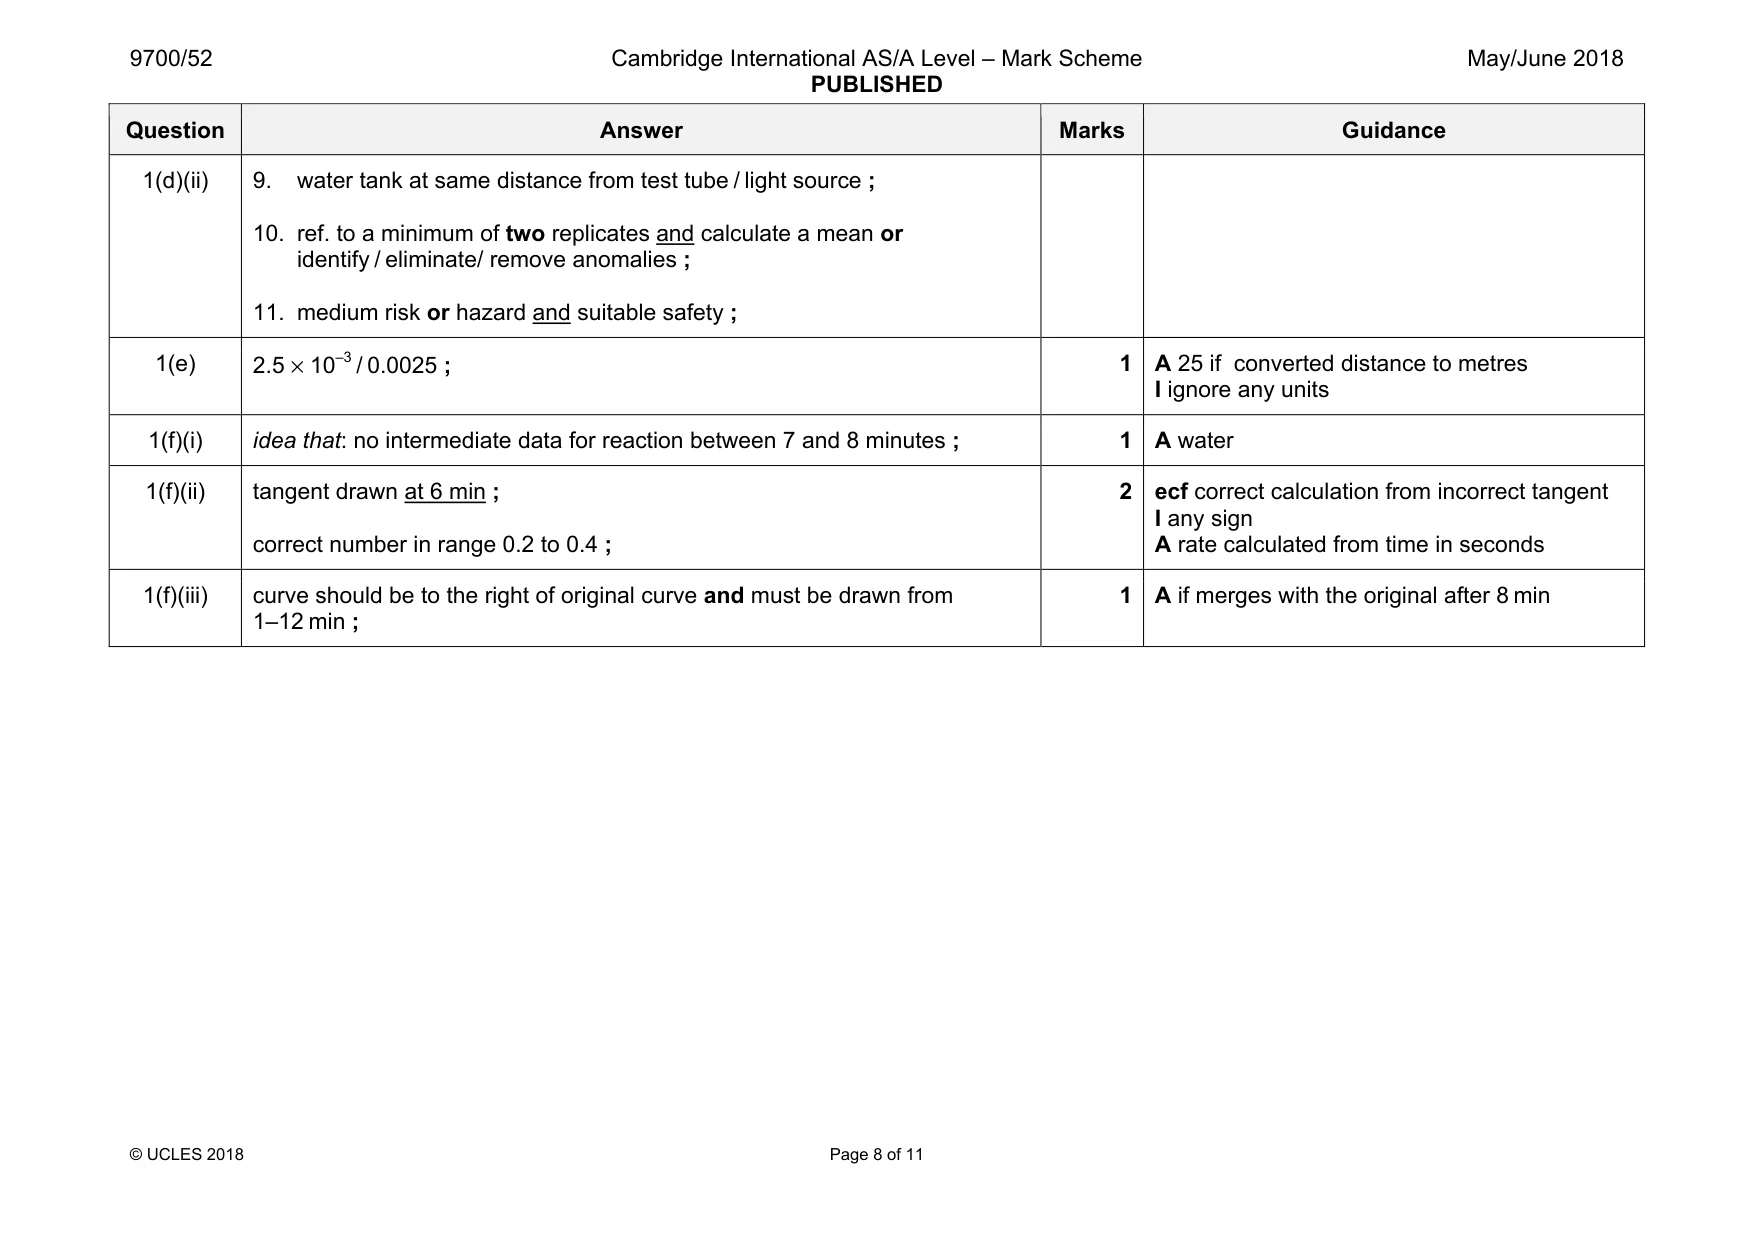
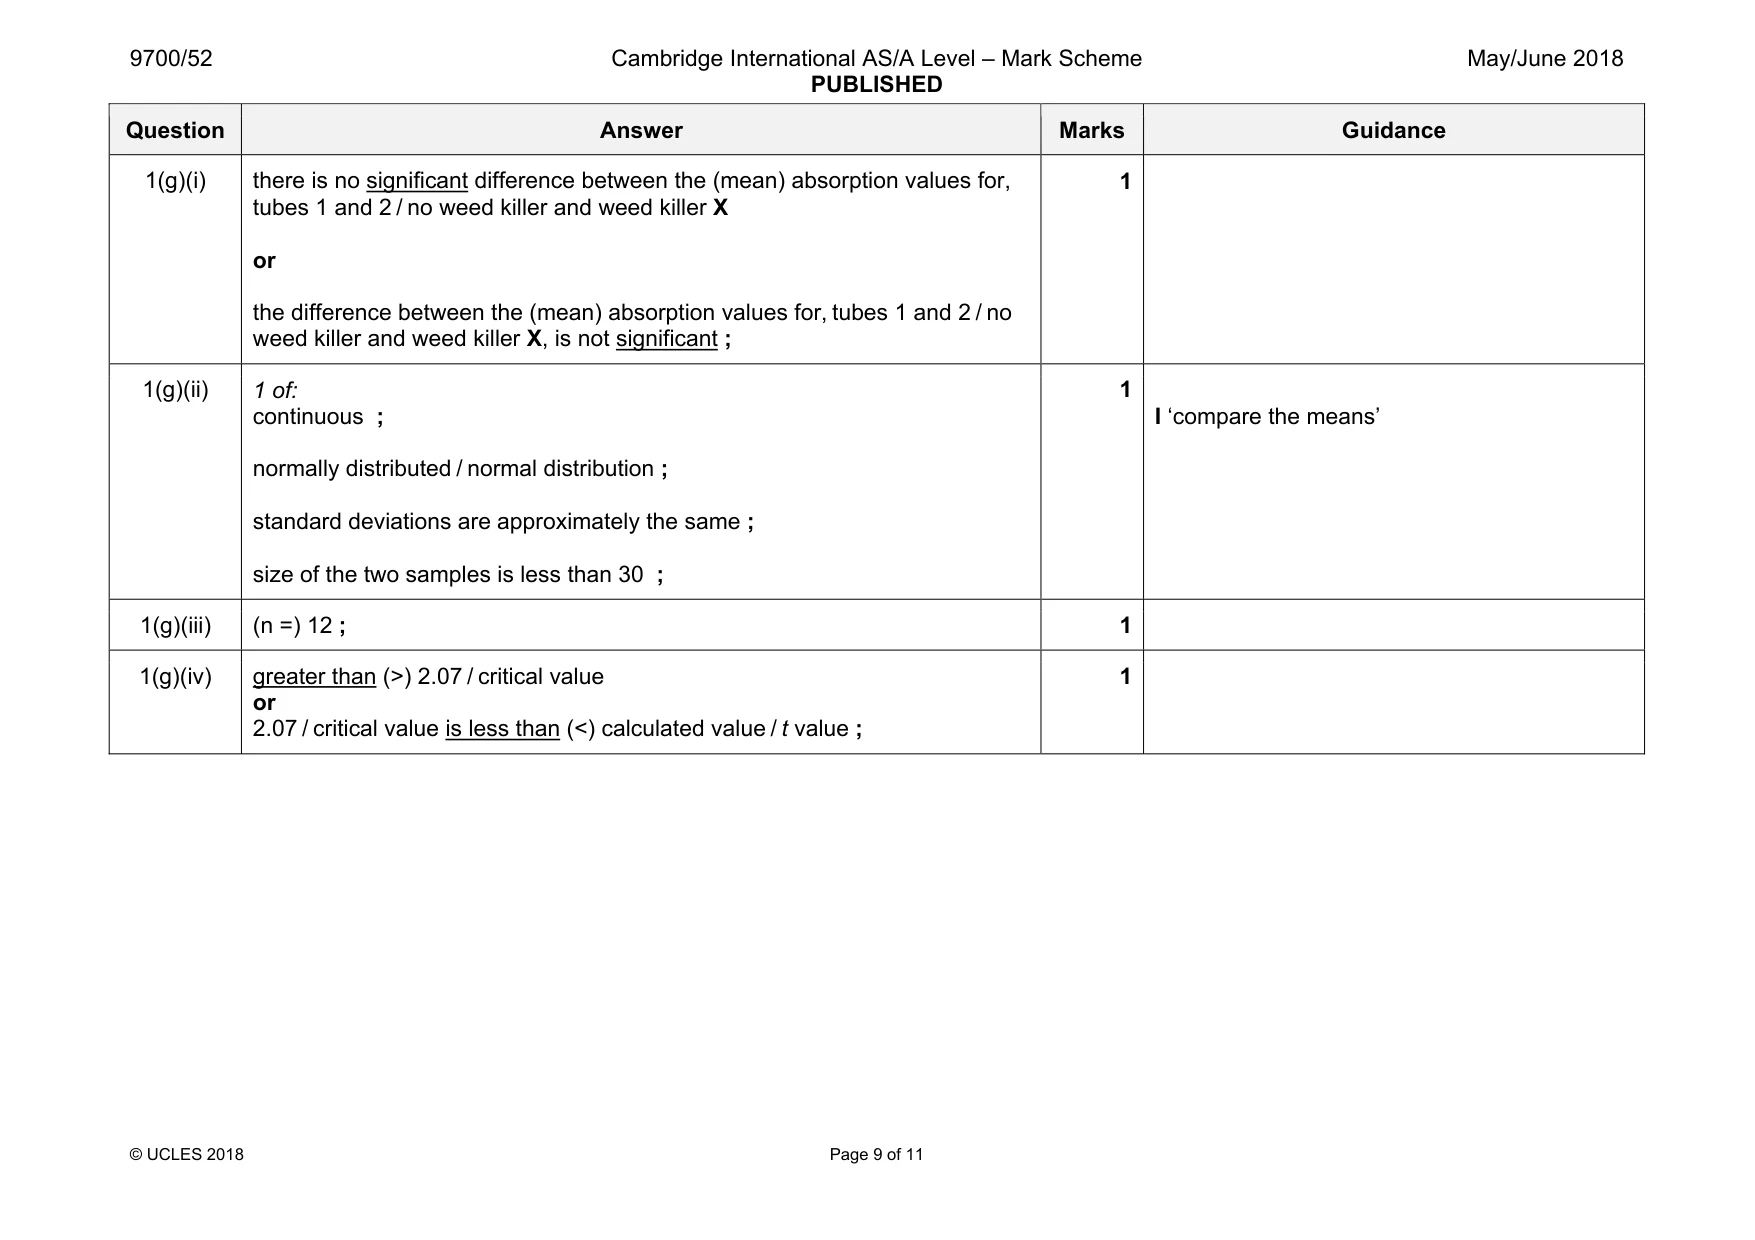
Mark scheme: 1(a)(i) idea that not measured / AW ; 1 e.g. results show colours / no numbers / subjective / observations / description not numbers I categoric 1(b) 2 of: idea that: they are all acting as controls ; idea that: they show that colour change or the effect occurs, if DCPIP chloroplast and light are present ; tube 2: shows that chloroplast suspension does not change colour on its own or without DCPIP there is no colour change or DCPIP is needed for the colour change ; tube 3: shows that DCPIP does not change colour on its own or without chloroplast suspension there is no colour change or chloroplast suspension is needed for the colour change ; tube 4: shows that DCPIP and chloroplast suspension together do not change colour on their own or without light there is no colour change or light is needed for the colour change ; 2 R controlled variable / controlled experiment tube 2: A idea that: acts as a colour comparison for the end point / tube 1 1(c) idea that: reducing heat (from lamp) passing through / AW ; 1 Question Answer Marks Guidance 1(d)(i) independent: light intensity / distance of tube from light source / lamp ; dependent: time taken for DCPIP to decolourise / time for green colour to appear ; 2 I ref. to rate of light dependent reaction I ref to solution / tube, decolourising / going colourless Question Answer Marks Guidance 1(d)(ii) 7 of: 1. method to vary light intensity ; 2. five values of stated distances in the range 10 to 200 cm ; critical step 3. start timer straight away when exposed to light ; 4. record time, (at each intensity) until DCPIP decolourises / chloroplast suspension is green ; 5. use a colour comparator / tube 2, to decide when to stop timing ; 6. same volume of (same) chloroplast suspension ; 7. same volume of DCPIP ; 8. same concentration of DCPIP ; 7 1. e.g. distances between tube and lamp or different strengths of neutral density filters or wattages of bulbs / variable resistor / dimmer switch / number of lamps 2. for other stated methods, must have 5 stated values, e.g. wattages/ etc. 4. A record time, until blue colour disappears / colour changes R tube goes colourless without ref. to DCPIP if using colorimeter: mp 4 –removes samples at intervals until absorbance becomes zero or constant mp 5 – calibrating / zeroing with chloroplast suspension mp6 & mp7: if volumes are stated, total volume must be minimum 10 cm3 and maximum 50 cm3 (so it fits in the tube) if outside this range award mp 6 or mp 7 but not both I ‘same volume’ of tube contents Question Answer Marks Guidance 1(d)(ii) 9. water tank at same distance from test tube / light source ; 10. ref. to a minimum of two replicates and calculate a mean or identify / eliminate/ remove anomalies ; 11. medium risk or hazard and suitable safety ; 1(e) 2.5 × 10⁻³ / 0.0025 ; 1 A 25 if converted distance to metres I ignore any units 1(f)(i) idea that: no intermediate data for reaction between 7 and 8 minutes ; 1 A water 1(f)(ii) tangent drawn at 6 min ; correct number in range 0.2 to 0.4 ; 2 ecf correct calculation from incorrect tangent I any sign A rate calculated from time in seconds 1(f)(iii) curve should be to the right of original curve and must be drawn from 1–12 min ; 1 A if merges with the original after 8 min Question Answer Marks Guidance 1(g)(i) there is no significant difference between the (mean) absorption values for, tubes 1 and 2 / no weed killer and weed killer X or the difference between the (mean) absorption values for, tubes 1 and 2 / no weed killer and weed killer X, is not significant ; 1 1(g)(ii) 1 of: continuous ; normally distributed / normal distribution ; standard deviations are approximately the same ; size of the two samples is less than 30 ; 1 I ‘compare the means’ 1(g)(iii) (n =) 12 ; 1 1(g)(iv) greater than (>) 2.07 / critical value or 2.07 / critical value is less than (<) calculated value / t value ; 1
Q2 · Red deer are herbivores common in the highlands of Scotland
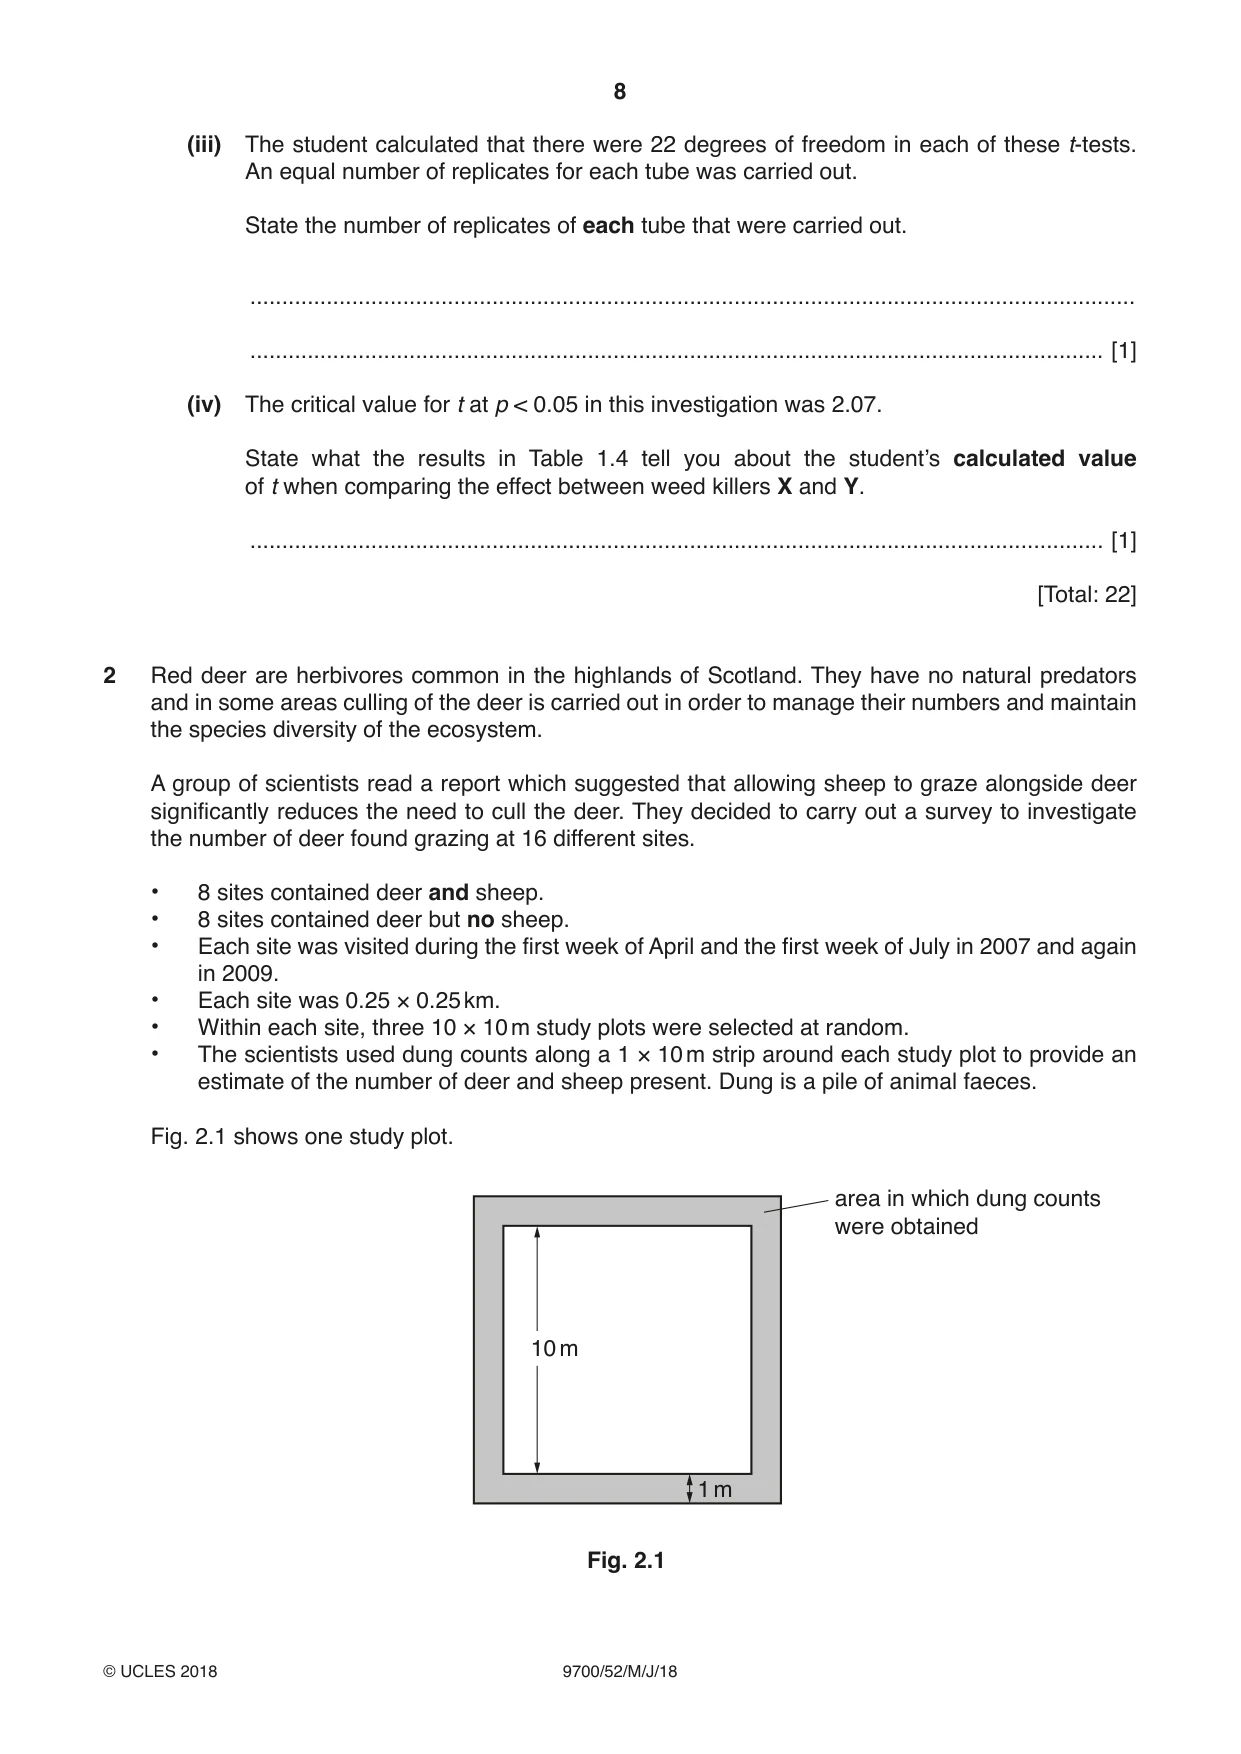
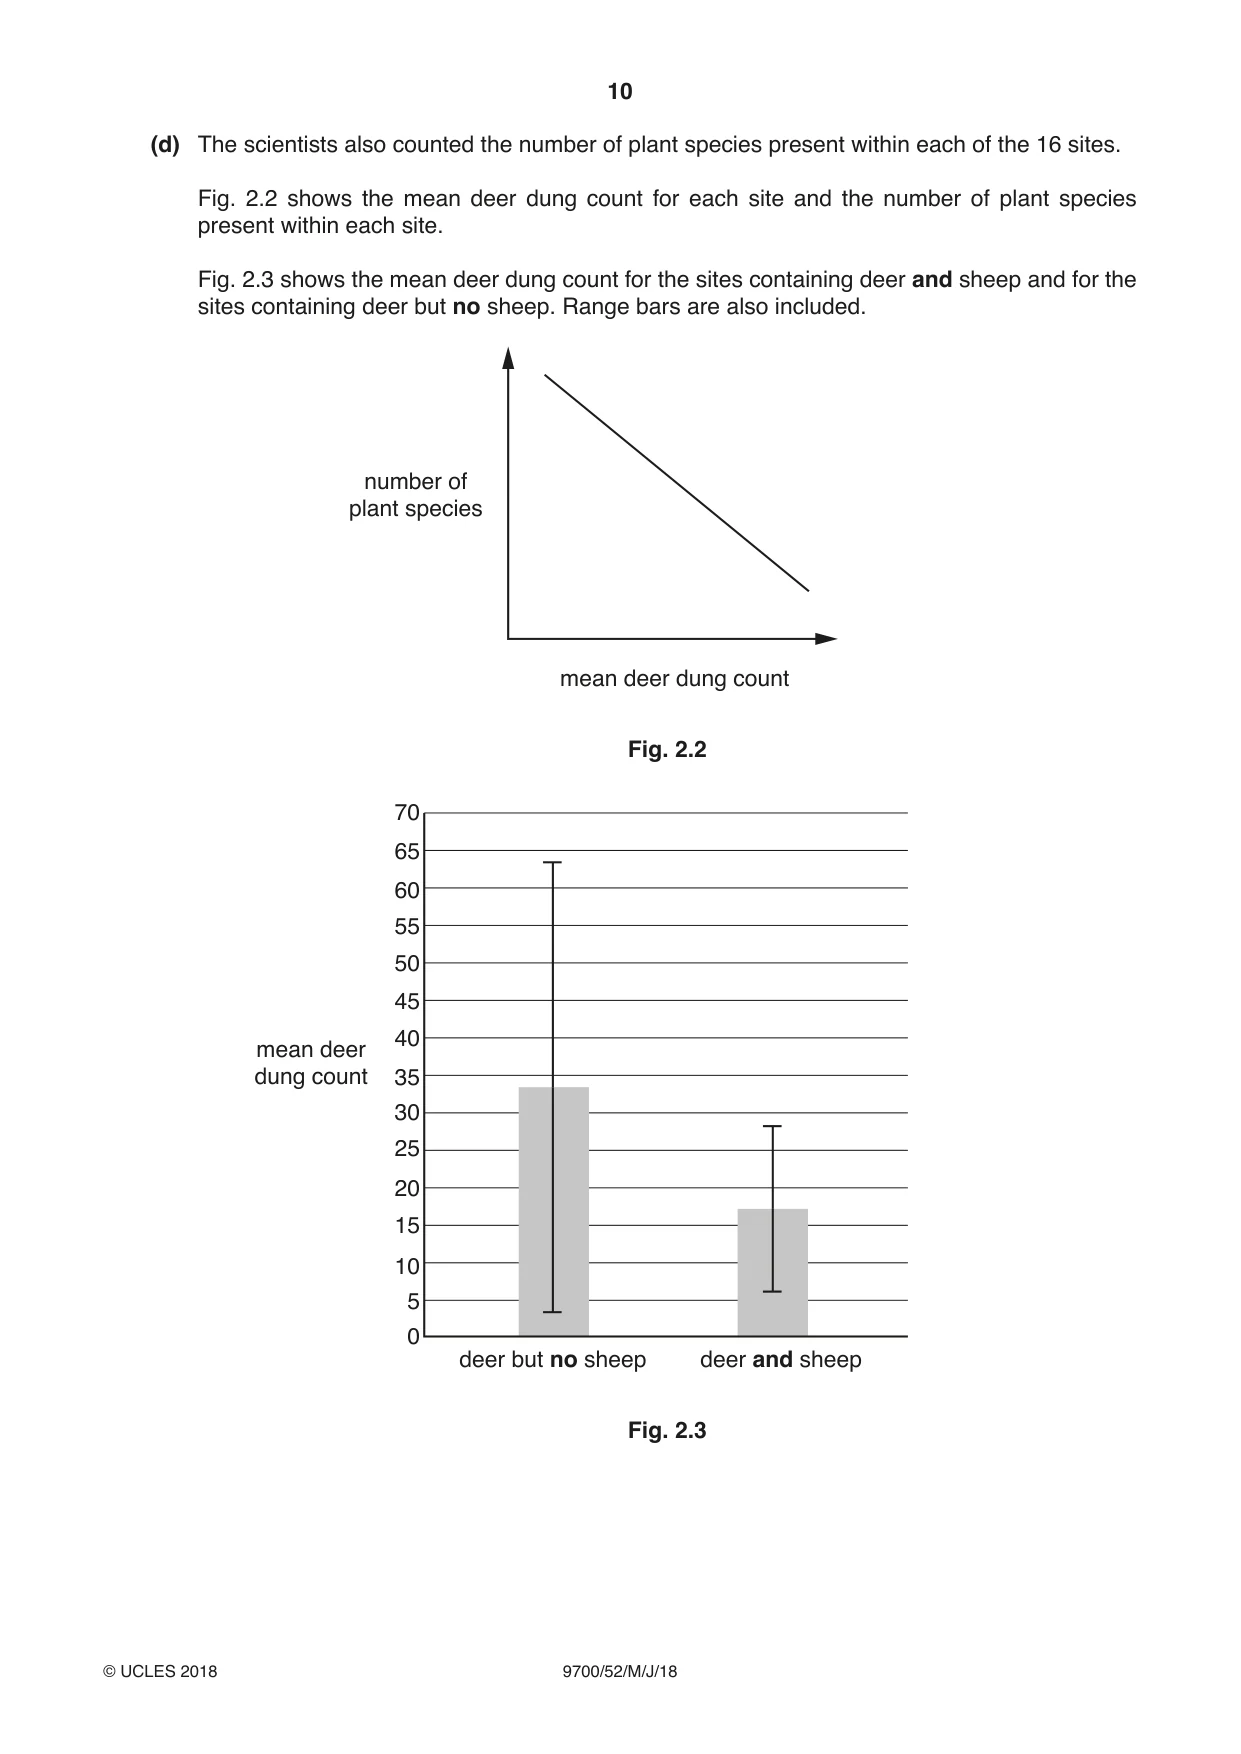
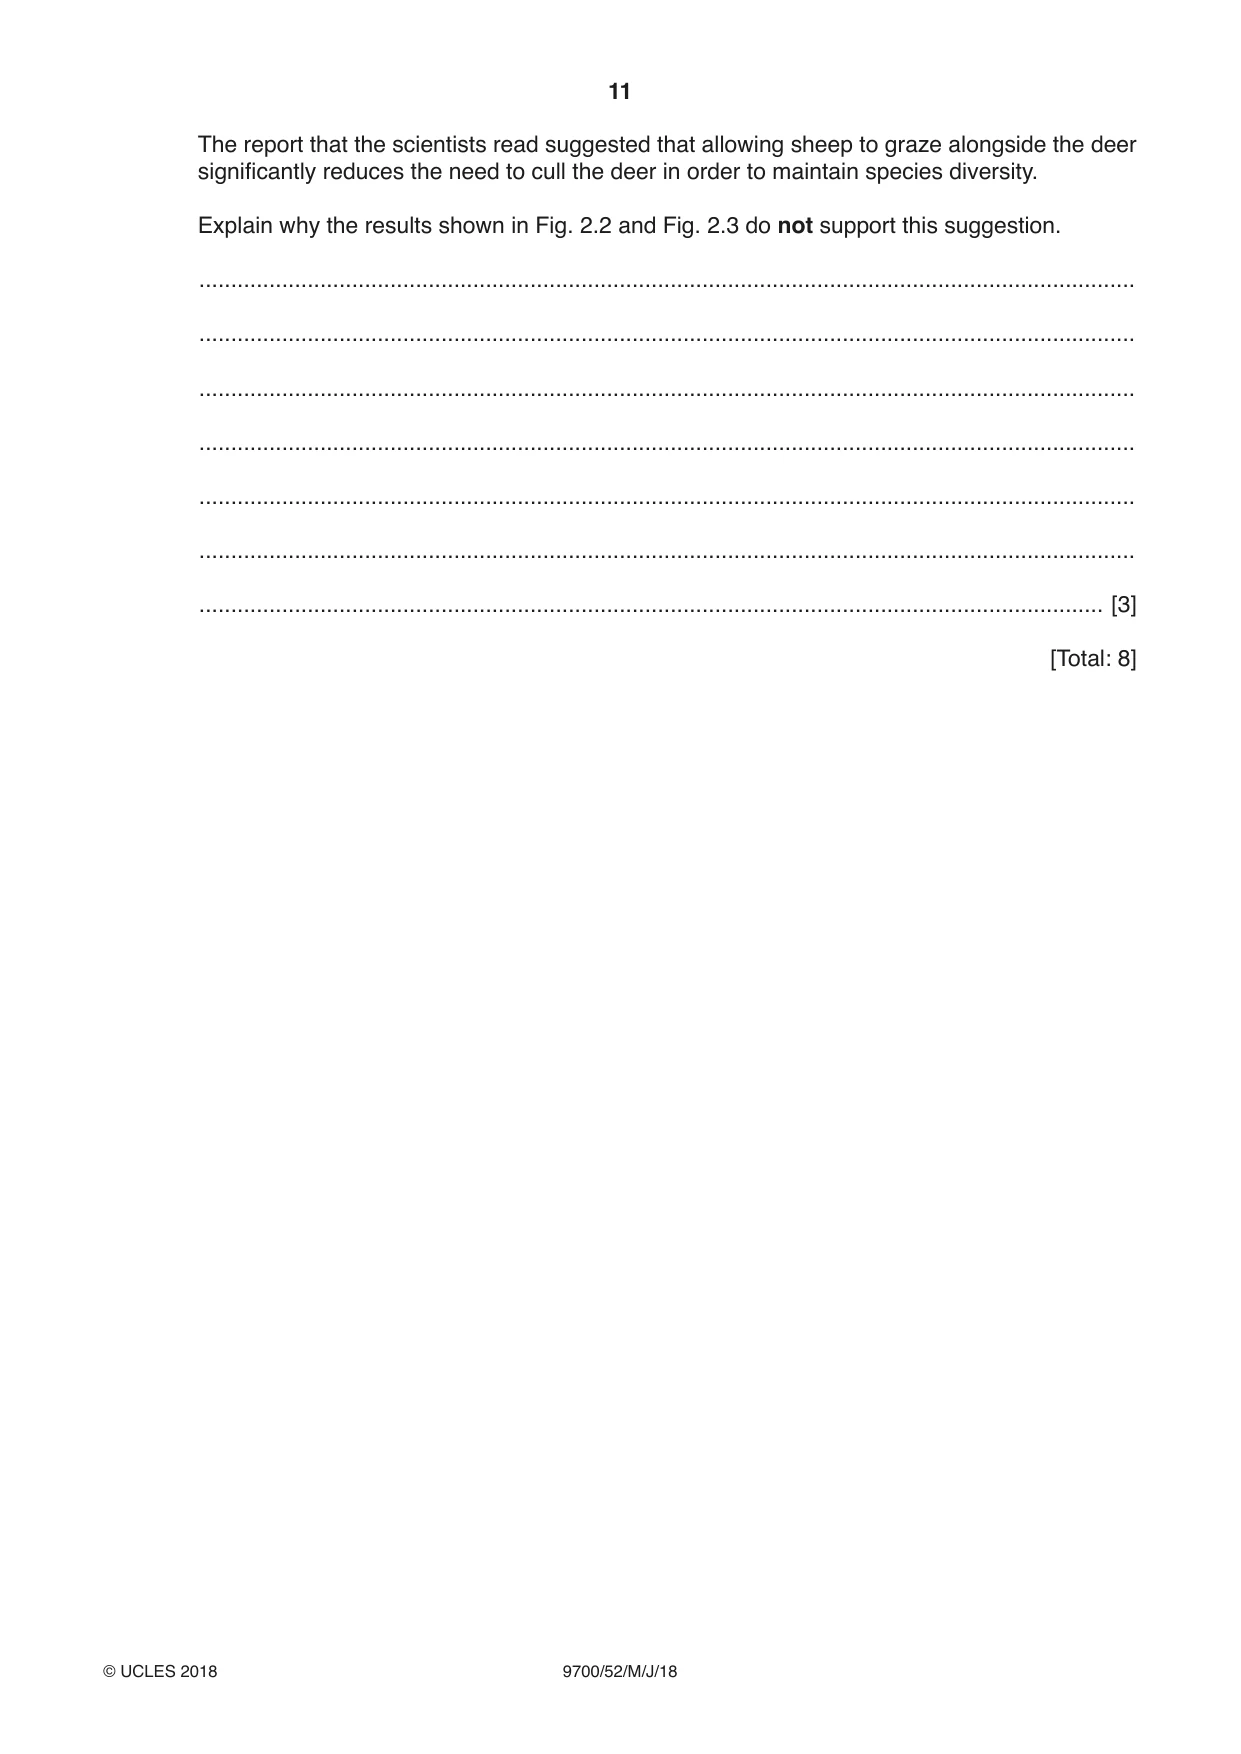
2 Red deer are herbivores common in the highlands of Scotland. They have no natural predators and in some areas culling of the deer is carried out in order to manage their numbers and maintain the species diversity of the ecosystem. A group of scientists read a report which suggested that allowing sheep to graze alongside deer significantly reduces the need to cull the deer. They decided to carry out a survey to investigate the number of deer found grazing at 16 different sites. • 8 sites contained deer and sheep. • 8 sites contained deer but no sheep. • Each site was visited during the first week of April and the first week of July in 2007 and again in 2009. • Each site was 0.25 × 0.25 km. • Within each site, three 10 × 10 m study plots were selected at random. • The scientists used dung counts along a 1 × 10 m strip around each study plot to provide an estimate of the number of deer and sheep present. Dung is a pile of animal faeces. Fig. 2.1 shows one study plot. area in which dung counts were obtained 10 m 1 m Fig. 2.1 (a) Describe a method that the scientists could have used to select the study plots randomly. ................................................................................................................................................... ................................................................................................................................................... ................................................................................................................................................... .............................................................................................................................................. [2] (b) Suggest why counting the dung may not provide an accurate estimate of deer or sheep numbers. ................................................................................................................................................... .............................................................................................................................................. [1] (c) State two variables that were standardised by the scientists. 1 ................................................................................................................................................ ................................................................................................................................................... 2 ................................................................................................................................................ .............................................................................................................................................. [2] (d) The scientists also counted the number of plant species present within each of the 16 sites. Fig. 2.2 shows the mean deer dung count for each site and the number of plant species present within each site. Fig. 2.3 shows the mean deer dung count for the sites containing deer and sheep and for the sites containing deer but no sheep. Range bars are also included. number of plant species mean deer dung count Fig. 2.2 70 65 60 55 50 45 40 mean deer dung count 35 30 25 20 15 10 5 0 deer but no sheep deer and sheep Fig. 2.3
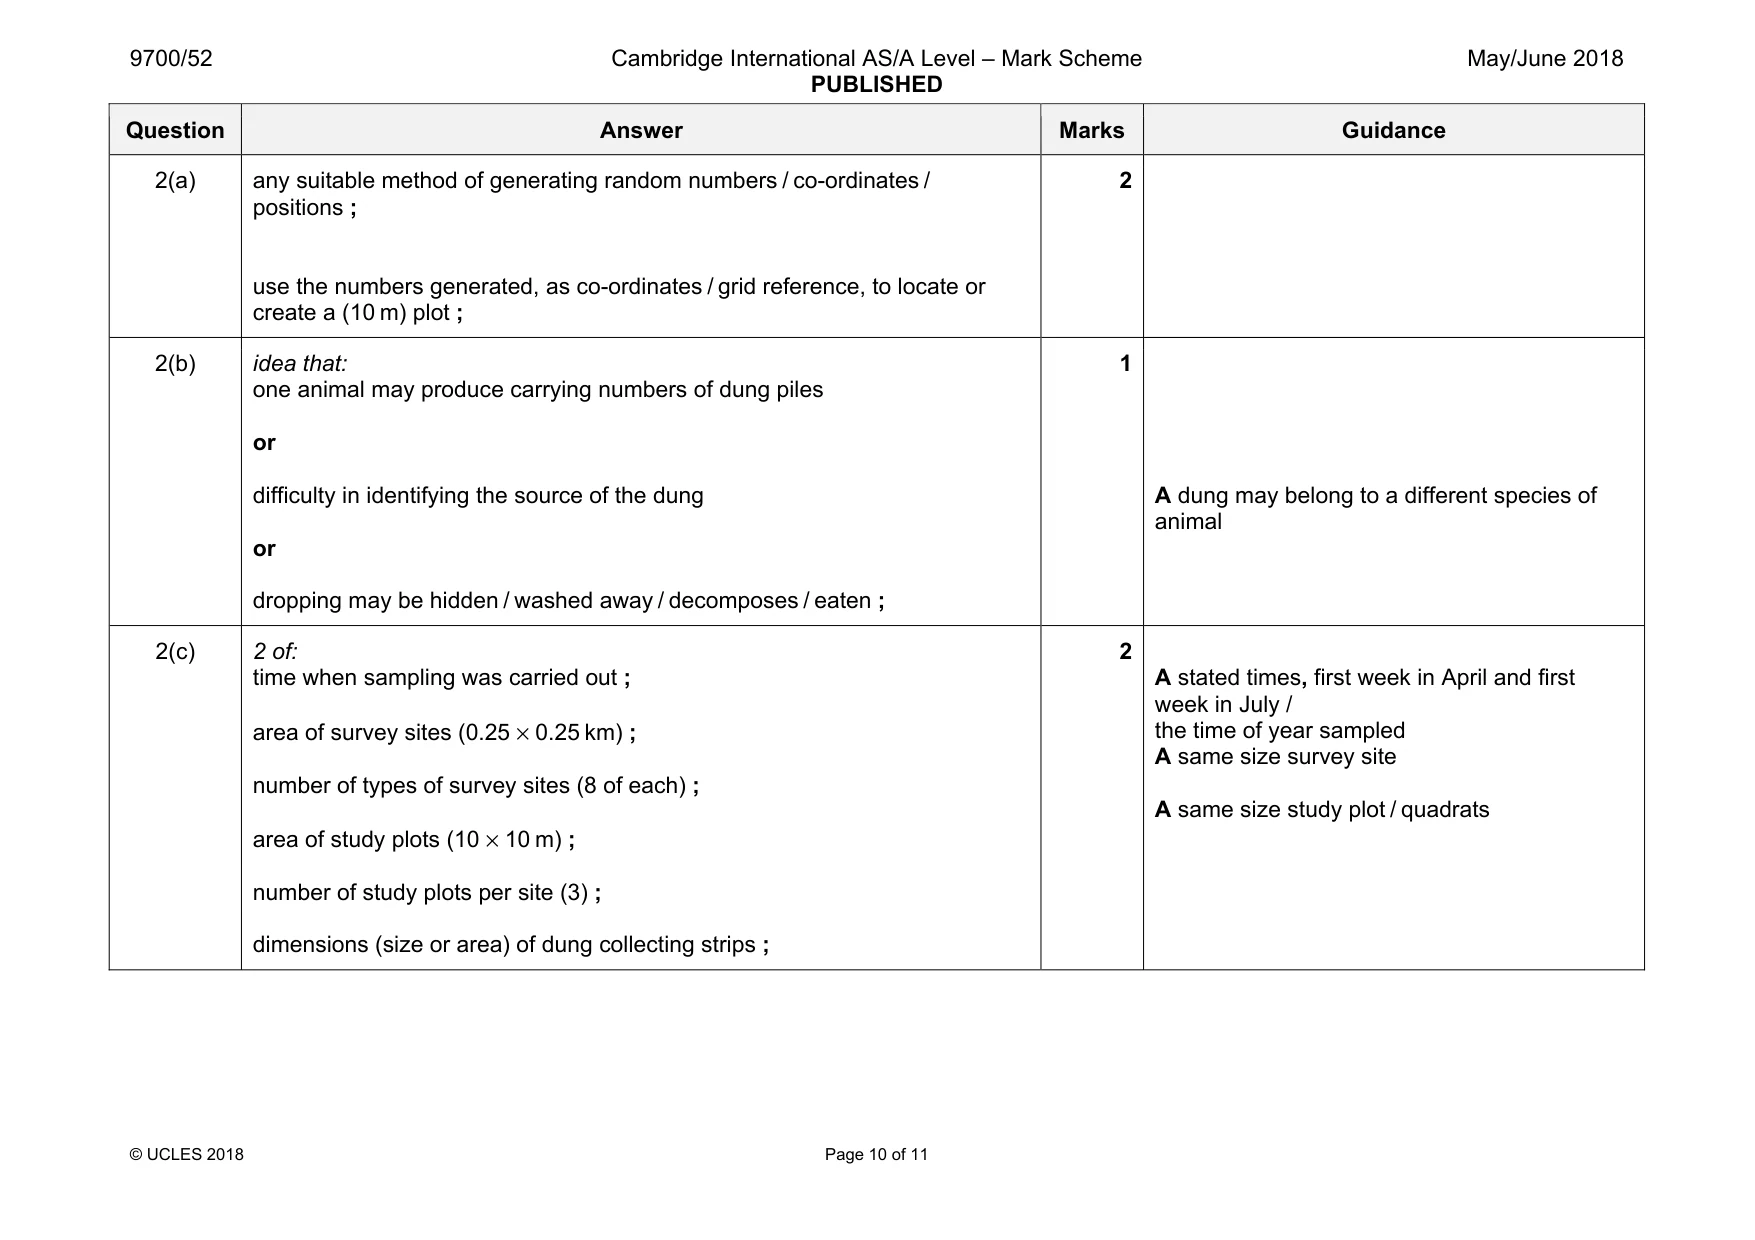
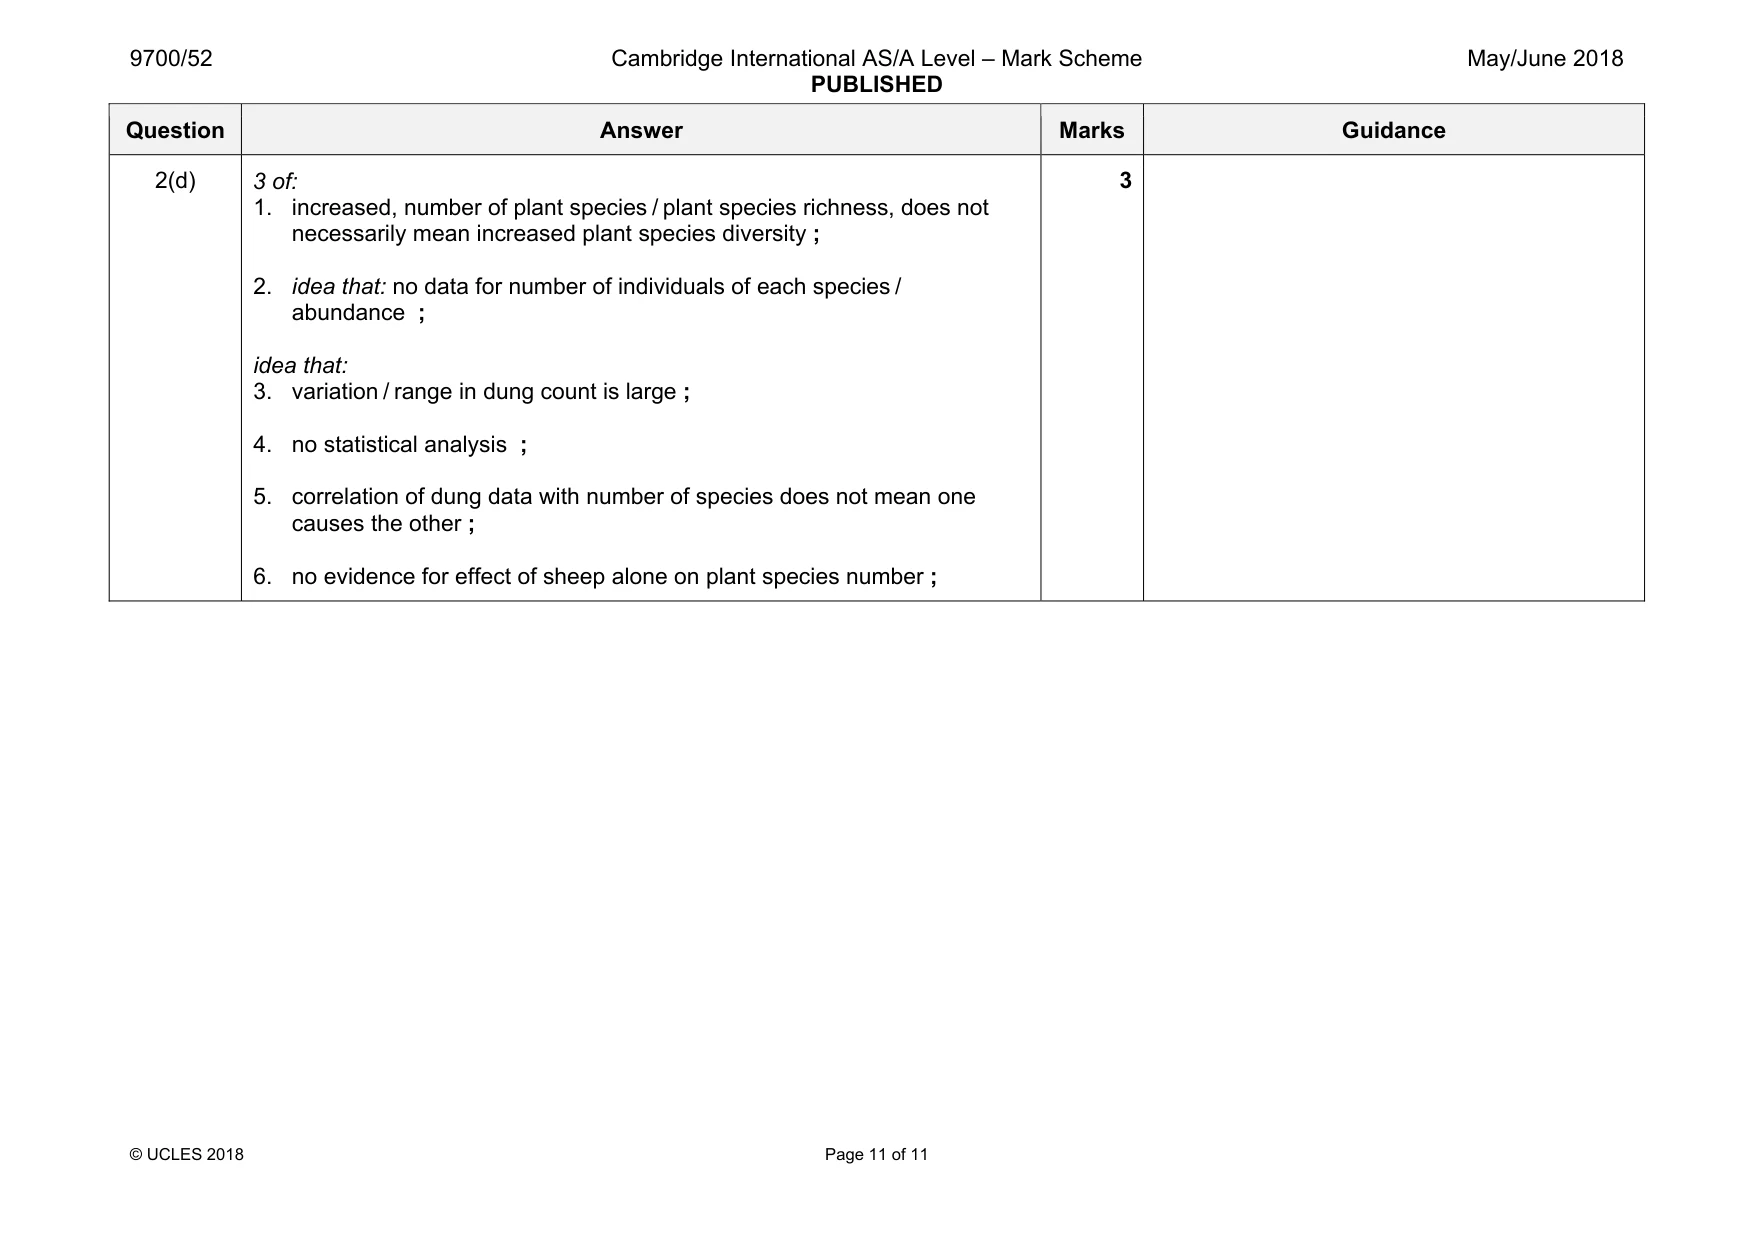
Mark scheme: 2(a) any suitable method of generating random numbers / co-ordinates / positions ; use the numbers generated, as co-ordinates / grid reference, to locate or create a (10 m) plot ; 2 2(b) idea that: one animal may produce carrying numbers of dung piles or difficulty in identifying the source of the dung or dropping may be hidden / washed away / decomposes / eaten ; 1 A dung may belong to a different species of animal 2(c) 2 of: time when sampling was carried out ; area of survey sites (0.25 × 0.25 km) ; number of types of survey sites (8 of each) ; area of study plots (10 × 10 m) ; number of study plots per site (3) ; dimensions (size or area) of dung collecting strips ; 2 A stated times, first week in April and first week in July / the time of year sampled A same size survey site A same size study plot / quadrats Question Answer Marks Guidance 2(d) 3 of: 1. increased, number of plant species / plant species richness, does not necessarily mean increased plant species diversity ; 2. idea that: no data for number of individuals of each species / abundance ; idea that: 3. variation / range in dung count is large ; 4. no statistical analysis ; 5. correlation of dung data with number of species does not mean one causes the other ; 6. no evidence for effect of sheep alone on plant species number ; 3
What was in this paper
The subtopics covered by these 2 questions, and how many questions each got. Open one in a new tab to see every Cambridge question on it.
What you needed in this session
Cambridge’s own grade thresholds for 2018 May/June, Paper 5 · Variant 2. A higher threshold means an easier paper — the bar moves with how the cohort did.