Cambridge A Level Biology 9700 — 2018 May/June Paper 5 · Variant 3
9700/53/M/J/18 · 2 questions · 30 marks · ≈34 min
The question paper and its mark scheme, free to read here and free to download. This is Cambridge’s own paper, exactly as it was sat.
Question paper12 pages



Mark scheme9 pages
Answers below. Sit the paper first if you are practising.
Questions as text
Q1 · Sodium hydrogencarbonate indicator solution contains sodium hydrogencarbonate
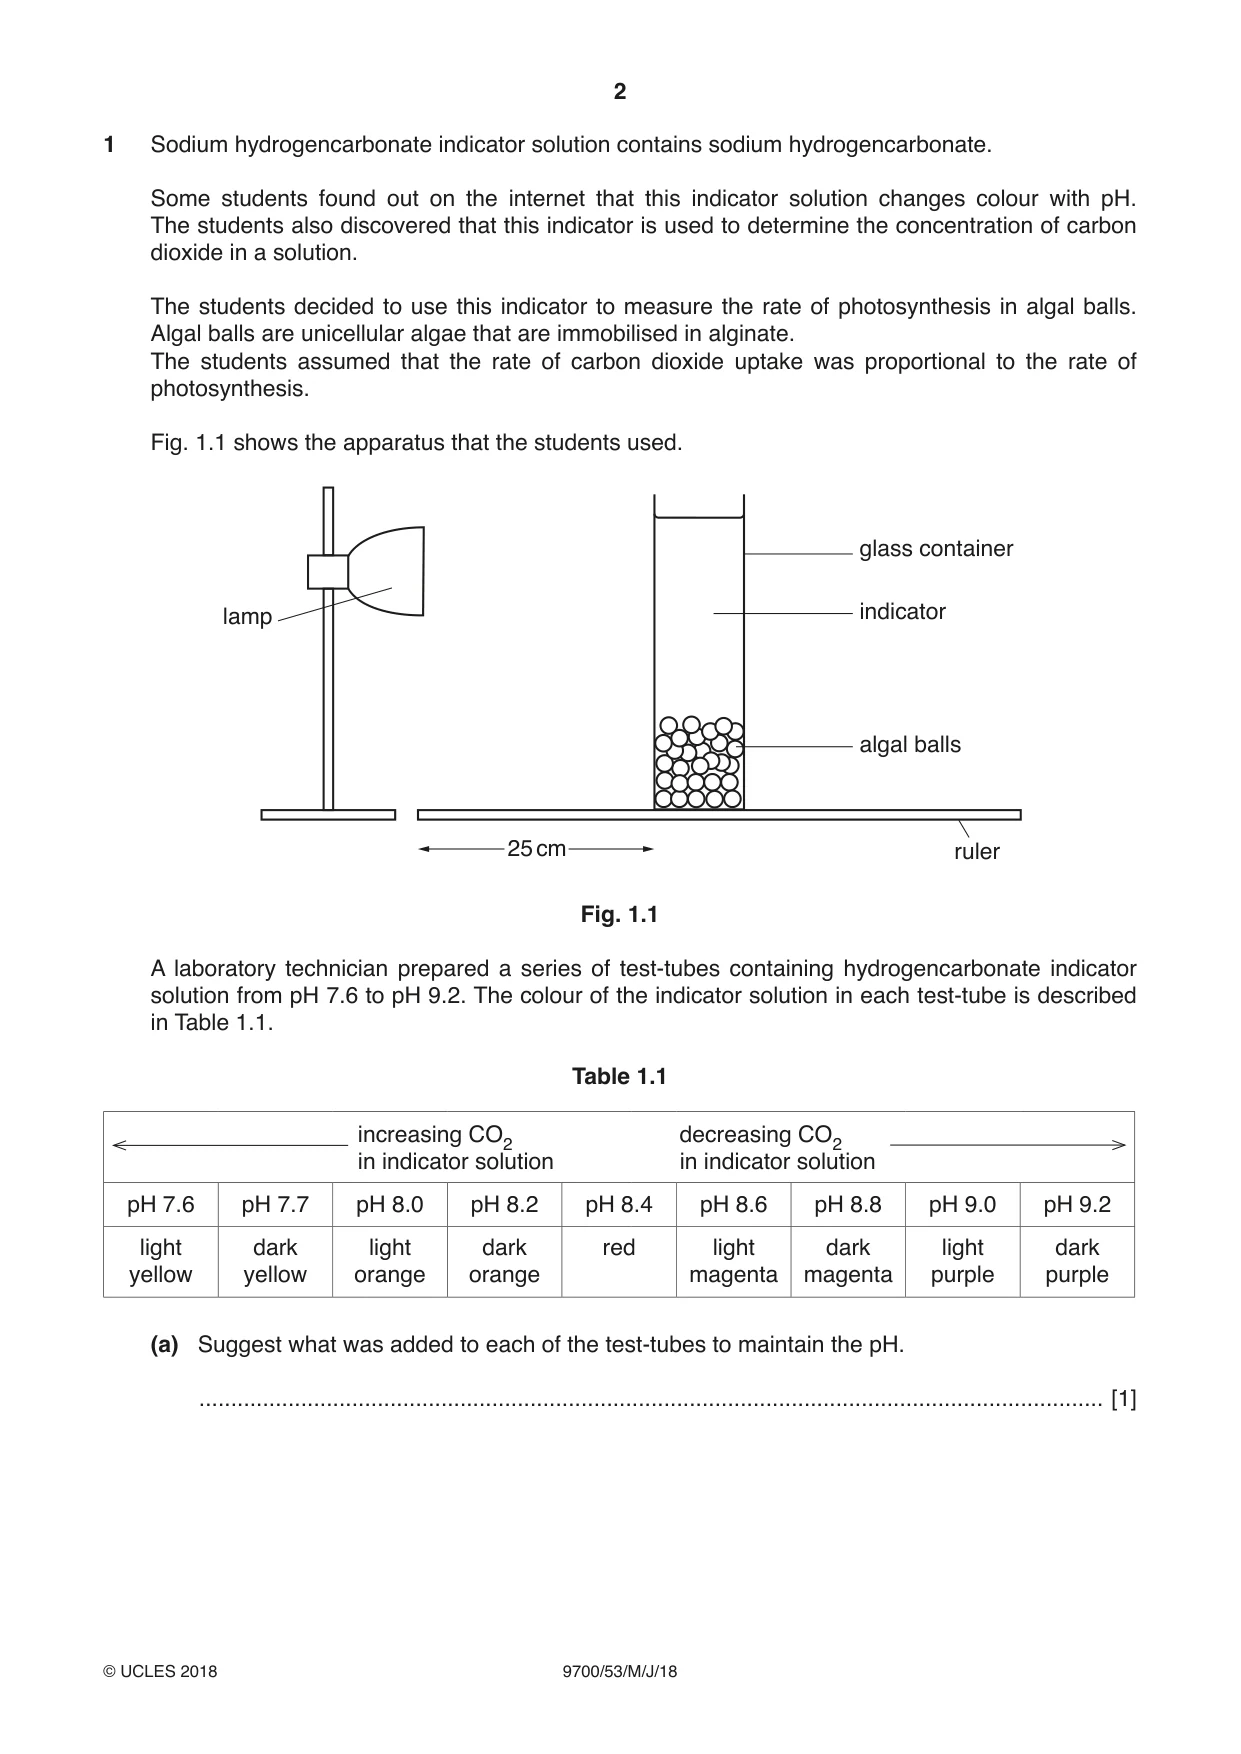
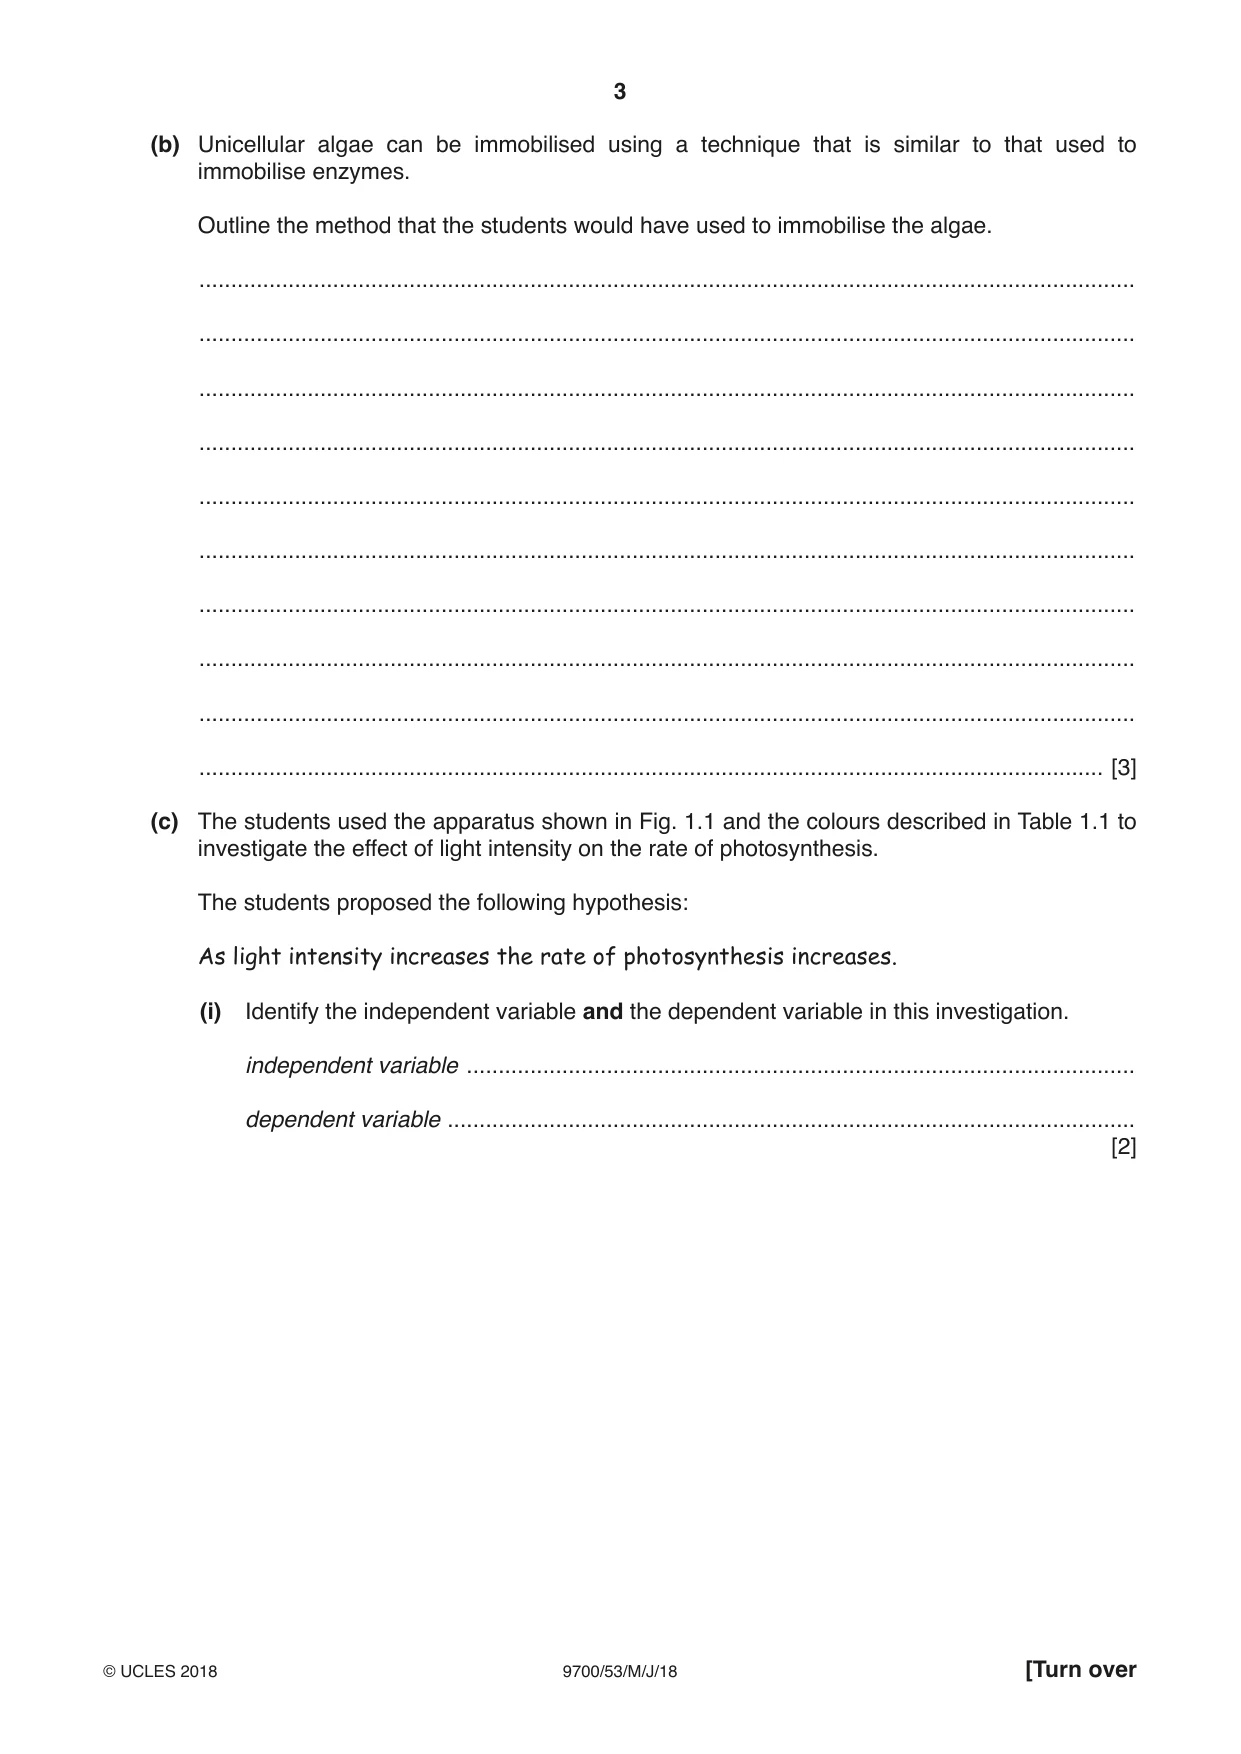
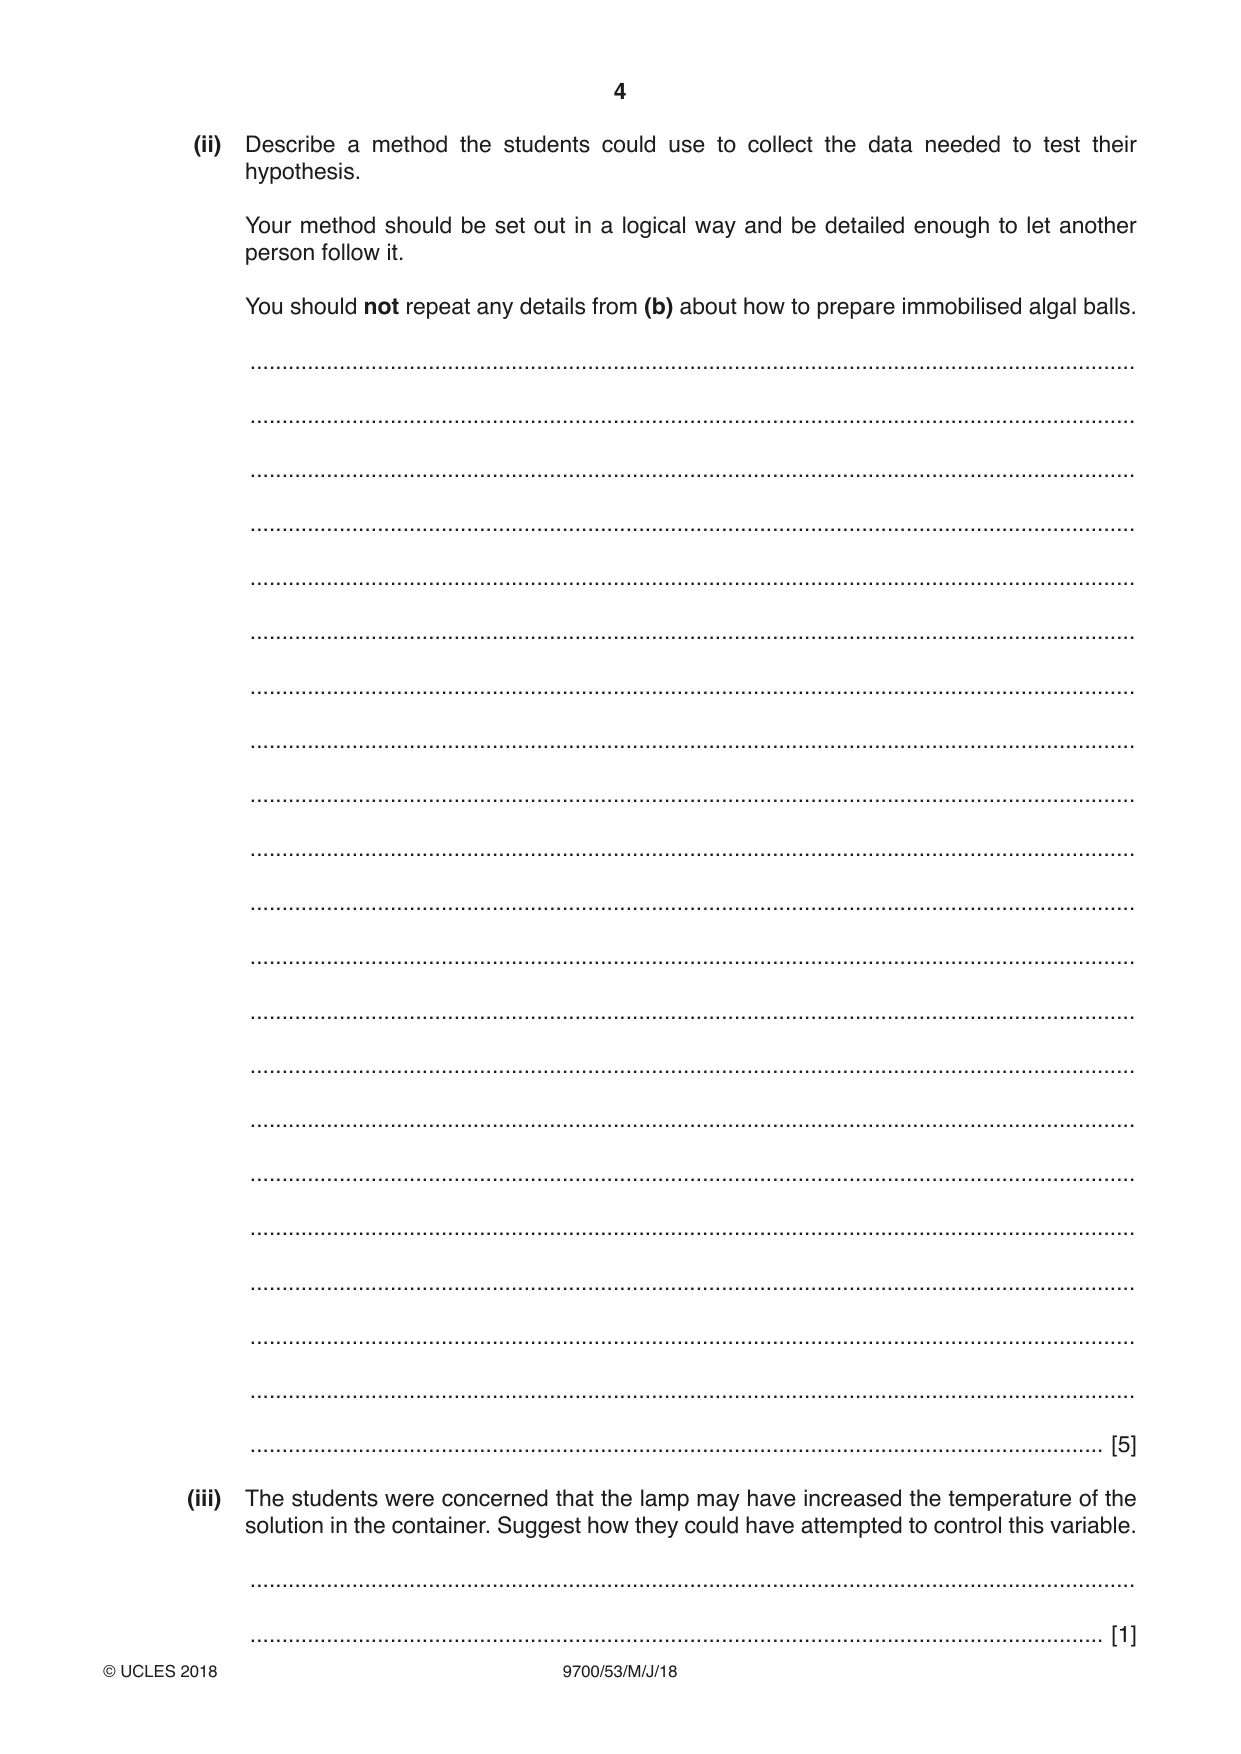
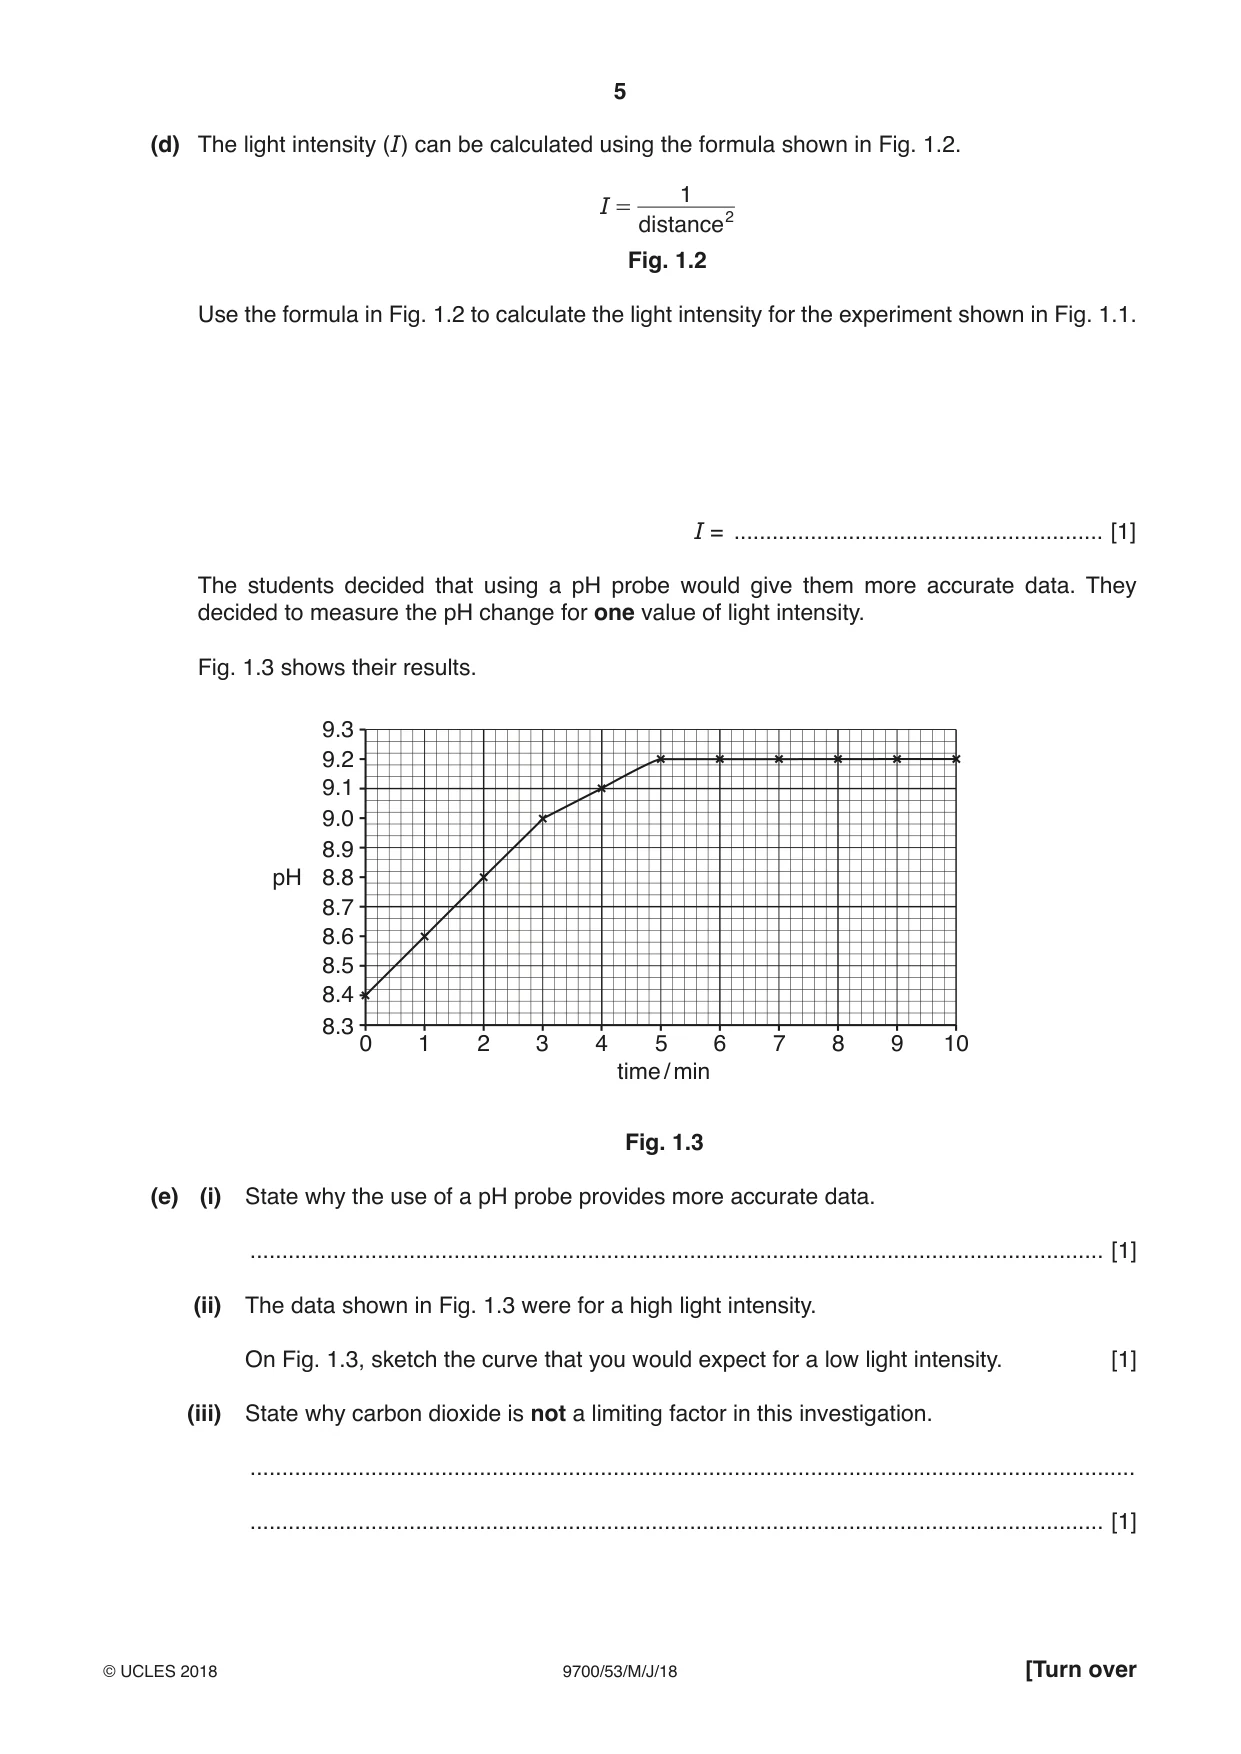
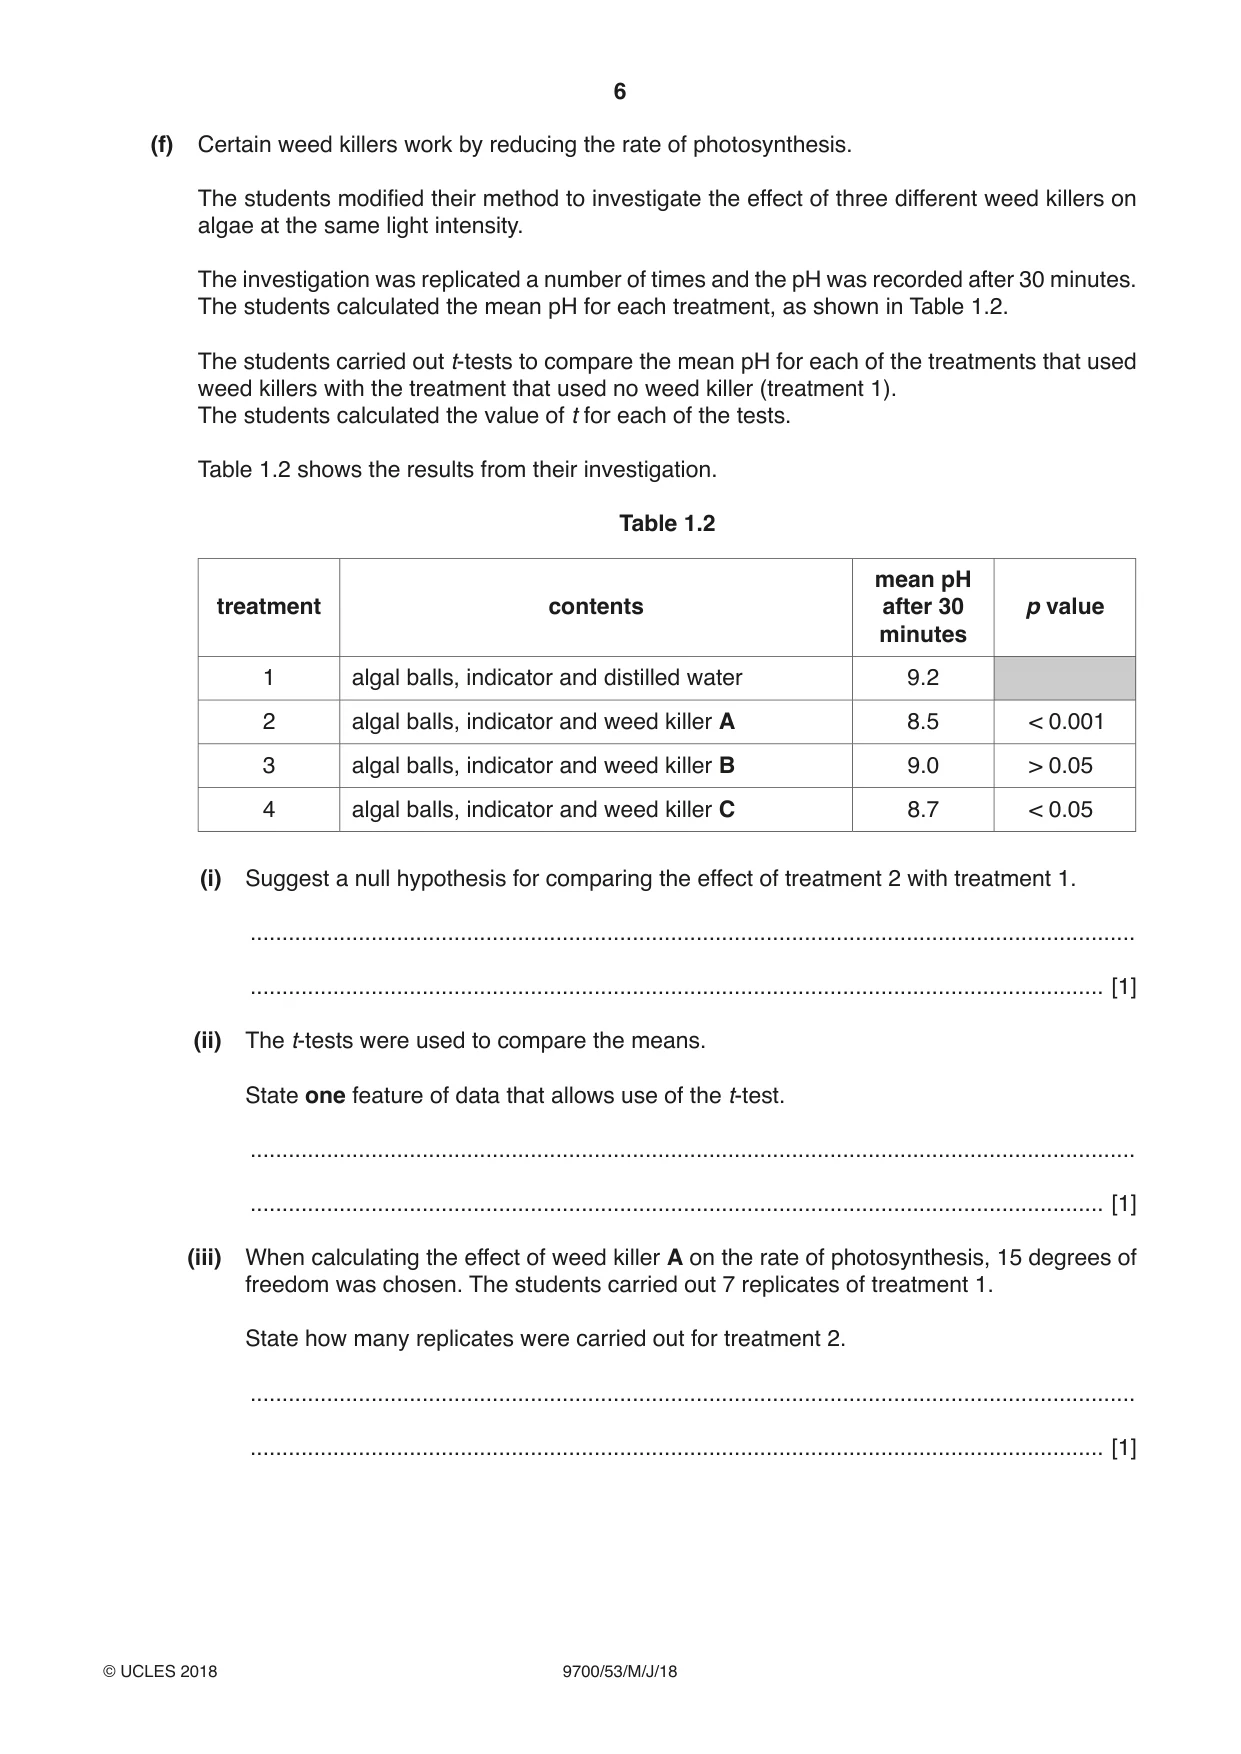
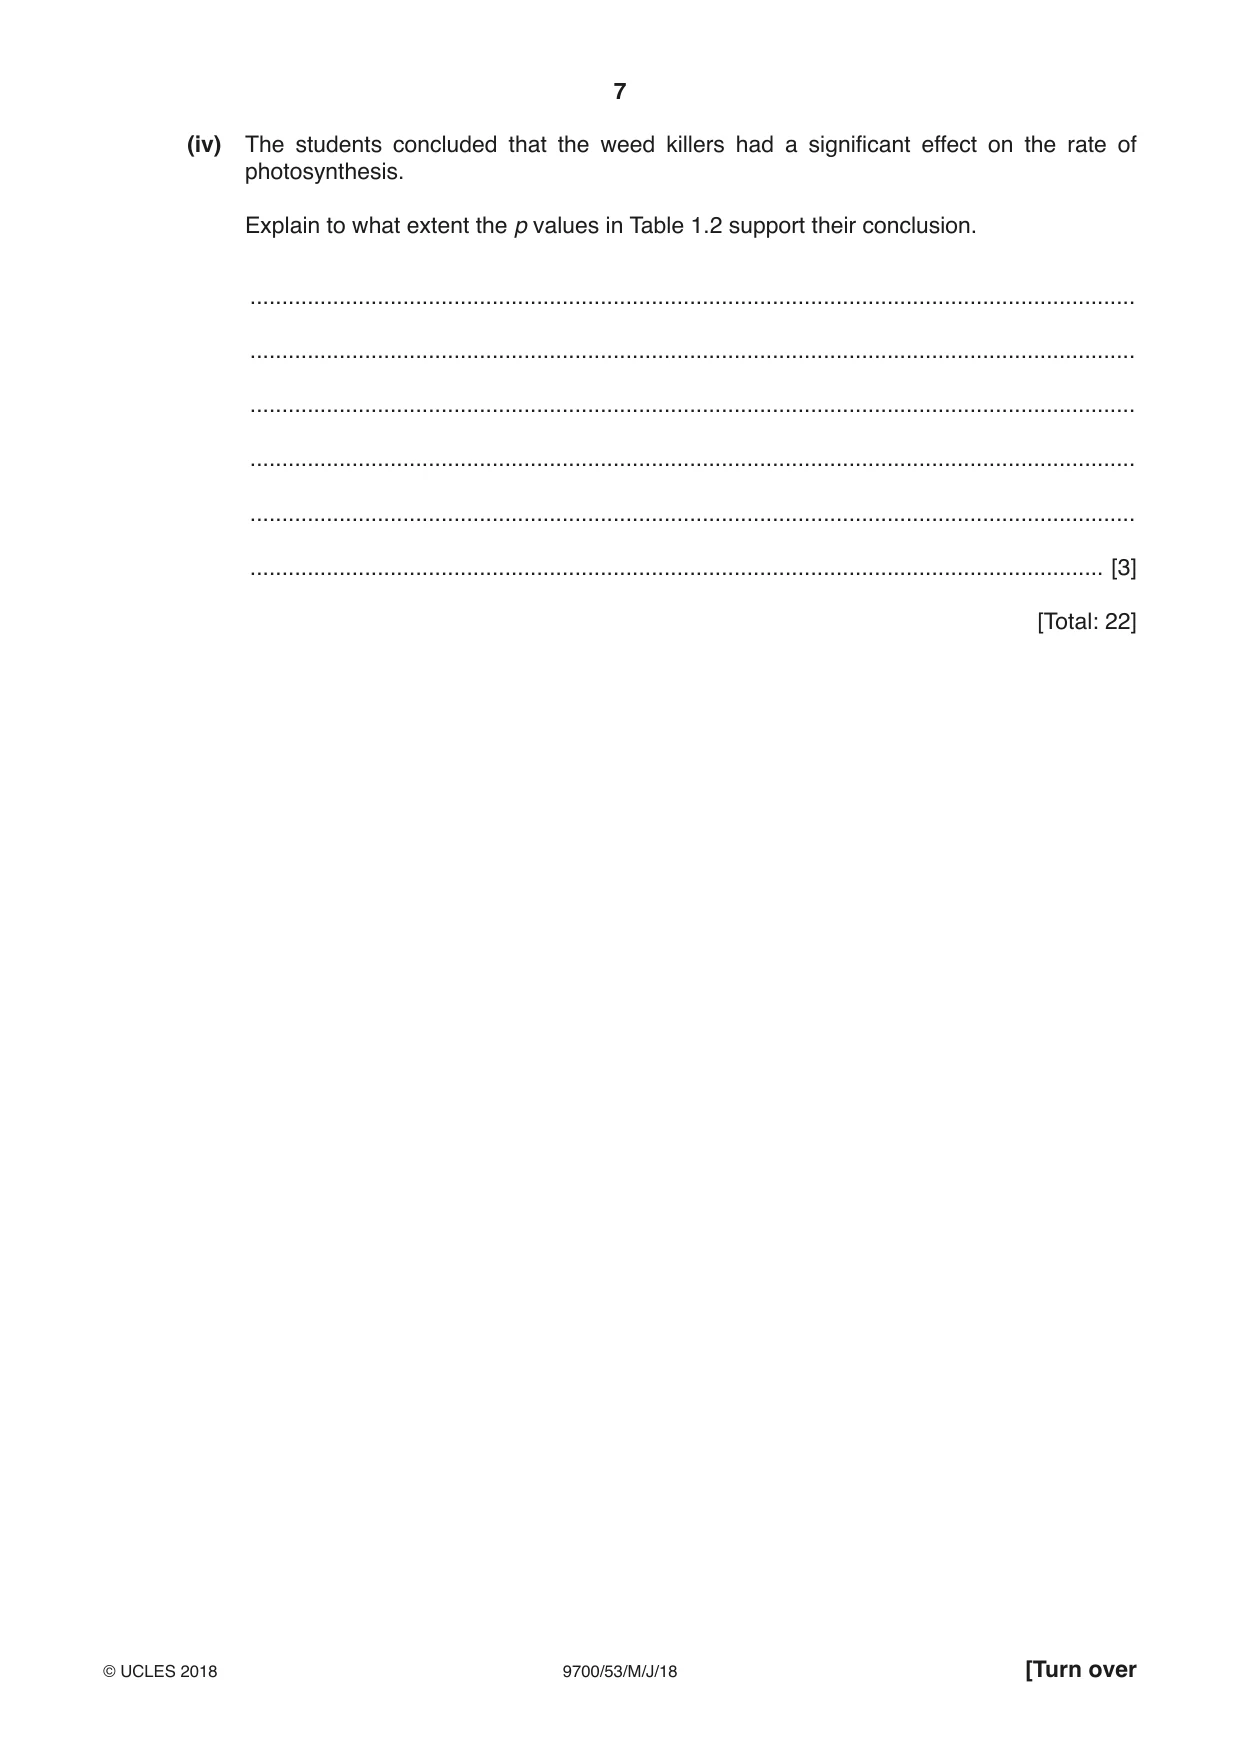
1 Sodium hydrogencarbonate indicator solution contains sodium hydrogencarbonate. Some students found out on the internet that this indicator solution changes colour with pH. The students also discovered that this indicator is used to determine the concentration of carbon dioxide in a solution. The students decided to use this indicator to measure the rate of photosynthesis in algal balls. Algal balls are unicellular algae that are immobilised in alginate. The students assumed that the rate of carbon dioxide uptake was proportional to the rate of photosynthesis. Fig. 1.1 shows the apparatus that the students used. glass container lamp indicator algal balls 25 cm ruler Fig. 1.1 A laboratory technician prepared a series of test-tubes containing hydrogencarbonate indicator solution from pH 7.6 to pH 9.2. The colour of the indicator solution in each test-tube is described in Table 1.1. Table 1.1 increasing CO2 decreasing CO2 in indicator solution in indicator solution pH 7.6 pH 7.7 pH 8.0 pH 8.2 pH 8.4 pH 8.6 pH 8.8 pH 9.0 pH 9.2 light dark light dark red light dark light dark yellow yellow orange orange magenta magenta purple purple (a) Suggest what was added to each of the test-tubes to maintain the pH. .............................................................................................................................................. [1] (b) Unicellular algae can be immobilised using a technique that is similar to that used to immobilise enzymes. Outline the method that the students would have used to immobilise the algae. ................................................................................................................................................... ................................................................................................................................................... ................................................................................................................................................... ................................................................................................................................................... ................................................................................................................................................... ................................................................................................................................................... ................................................................................................................................................... ................................................................................................................................................... ................................................................................................................................................... .............................................................................................................................................. [3] (c) The students used the apparatus shown in Fig. 1.1 and the colours described in Table 1.1 to investigate the effect of light intensity on the rate of photosynthesis. The students proposed the following hypothesis: As light intensity increases the rate of photosynthesis increases. (i) Identify the independent variable and the dependent variable in this investigation. independent variable ......................................................................................................... dependent variable ............................................................................................................ [2] (ii) Describe a method the students could use to collect the data needed to test their hypothesis. Your method should be set out in a logical way and be detailed enough to let another person follow it. You should not repeat any details from (b) about how to prepare immobilised algal balls. ........................................................................................................................................... ........................................................................................................................................... ........................................................................................................................................... ........................................................................................................................................... ........................................................................................................................................... ........................................................................................................................................... ........................................................................................................................................... ........................................................................................................................................... ........................................................................................................................................... ........................................................................................................................................... ........................................................................................................................................... ........................................................................................................................................... ........................................................................................................................................... ........................................................................................................................................... ........................................................................................................................................... ........................................................................................................................................... ........................................................................................................................................... ........................................................................................................................................... ........................................................................................................................................... ........................................................................................................................................... ...................................................................................................................................... [5] (iii) The students were concerned that the lamp may have increased the temperature of the solution in the container. Suggest how they could have attempted to control this variable. ........................................................................................................................................... ...................................................................................................................................... [1] (d) The light intensity (I ) can be calculated using the formula shown in Fig. 1.2. 1 I = distance 2 Fig. 1.2 Use the formula in Fig. 1.2 to calculate the light intensity for the experiment shown in Fig. 1.1. I = .......................................................... [1] The students decided that using a pH probe would give them more accurate data. They decided to measure the pH change for one value of light intensity. Fig. 1.3 shows their results. 9.3 9.2 9.1 9.0 8.9 pH 8.8 8.7 8.6 8.5 8.4 8.3 0 1 2 3 4 5 6 7 8 9 10 time / min Fig. 1.3 (e) (i) State why the use of a pH probe provides more accurate data. ...................................................................................................................................... [1] (ii) The data shown in Fig. 1.3 were for a high light intensity. On Fig. 1.3, sketch the curve that you would expect for a low light intensity. [1] (iii) State why carbon dioxide is not a limiting factor in this investigation. ........................................................................................................................................... ...................................................................................................................................... [1] (f) Certain weed killers work by reducing the rate of photosynthesis. The students modified their method to investigate the effect of three different weed killers on algae at the same light intensity. The investigation was replicated a number of times and the pH was recorded after 30 minutes. The students calculated the mean pH for each treatment, as shown in Table 1.2. The students carried out t-tests to compare the mean pH for each of the treatments that used weed killers with the treatment that used no weed killer (treatment 1). The students calculated the value of t for each of the tests. Table 1.2 shows the results from their investigation. Table 1.2 mean pH treatment contents after 30 p value minutes 1 algal balls, indicator and distilled water 9.2 2 algal balls, indicator and weed killer A 8.5 < 0.001 3 algal balls, indicator and weed killer B 9.0 > 0.05 4 algal balls, indicator and weed killer C 8.7 < 0.05 (i) Suggest a null hypothesis for comparing the effect of treatment 2 with treatment 1. ........................................................................................................................................... ...................................................................................................................................... [1] (ii) The t-tests were used to compare the means. State one feature of data that allows use of the t-test. ........................................................................................................................................... ...................................................................................................................................... [1] (iii) When calculating the effect of weed killer A on the rate of photosynthesis, 15 degrees of freedom was chosen. The students carried out 7 replicates of treatment 1. State how many replicates were carried out for treatment 2. ........................................................................................................................................... ...................................................................................................................................... [1] (iv) The students concluded that the weed killers had a significant effect on the rate of photosynthesis. Explain to what extent the p values in Table 1.2 support their conclusion. ........................................................................................................................................... ........................................................................................................................................... ........................................................................................................................................... ........................................................................................................................................... ........................................................................................................................................... ...................................................................................................................................... [3] [Total: 22]
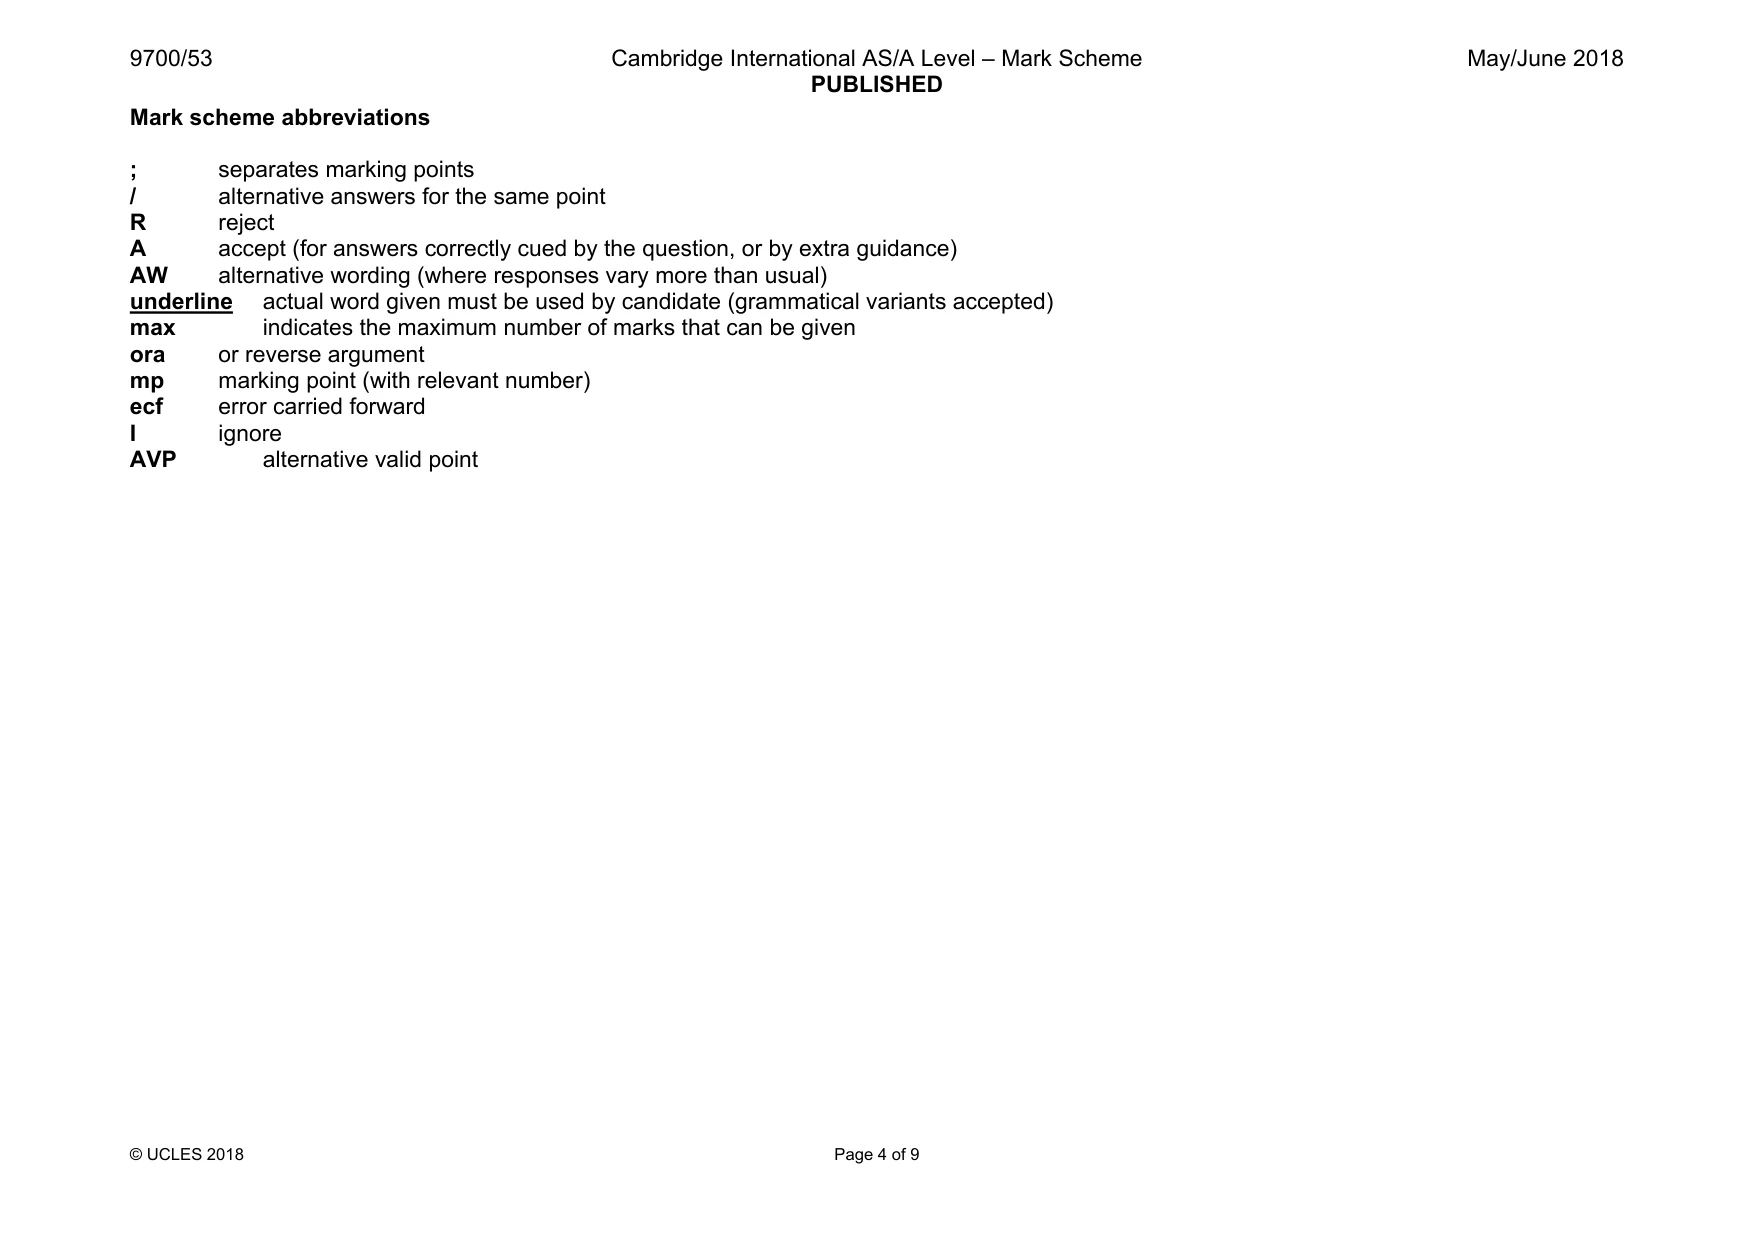
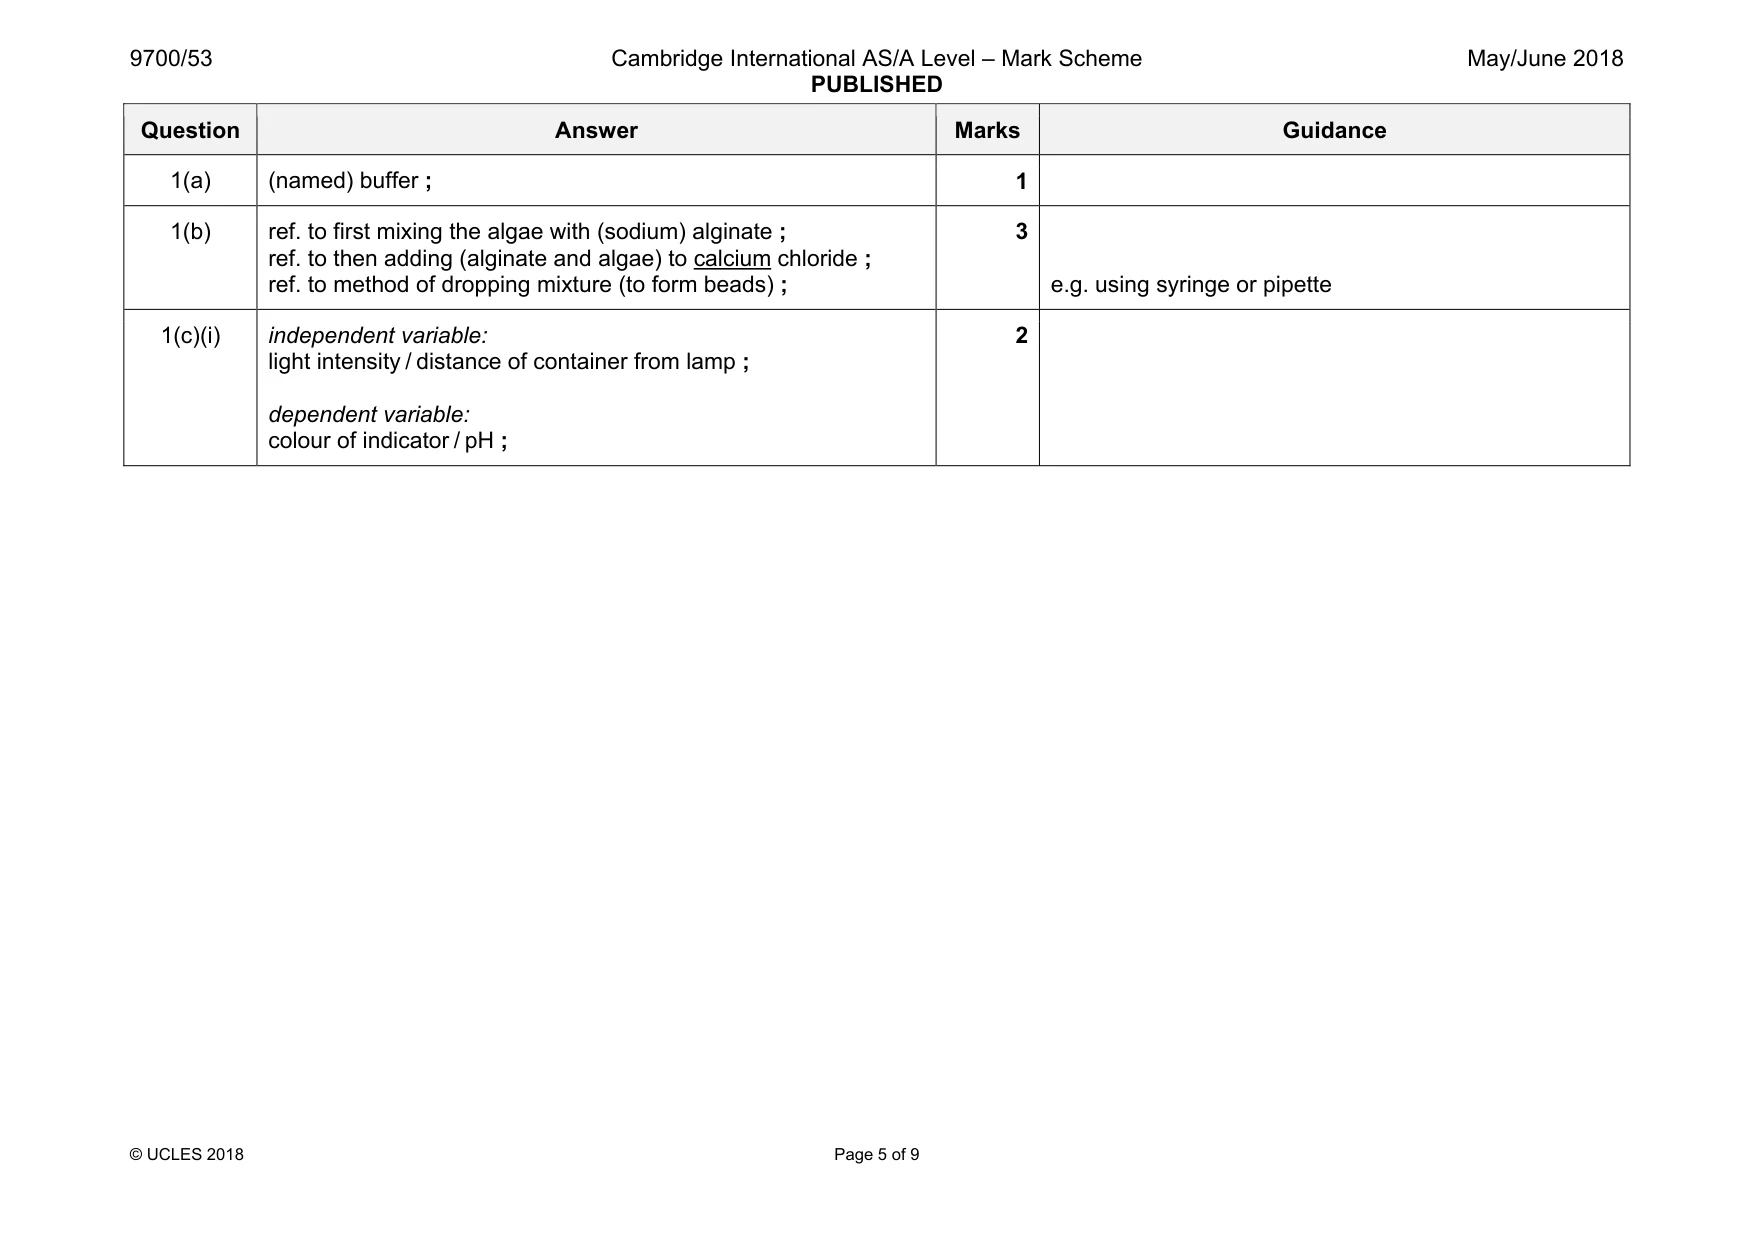
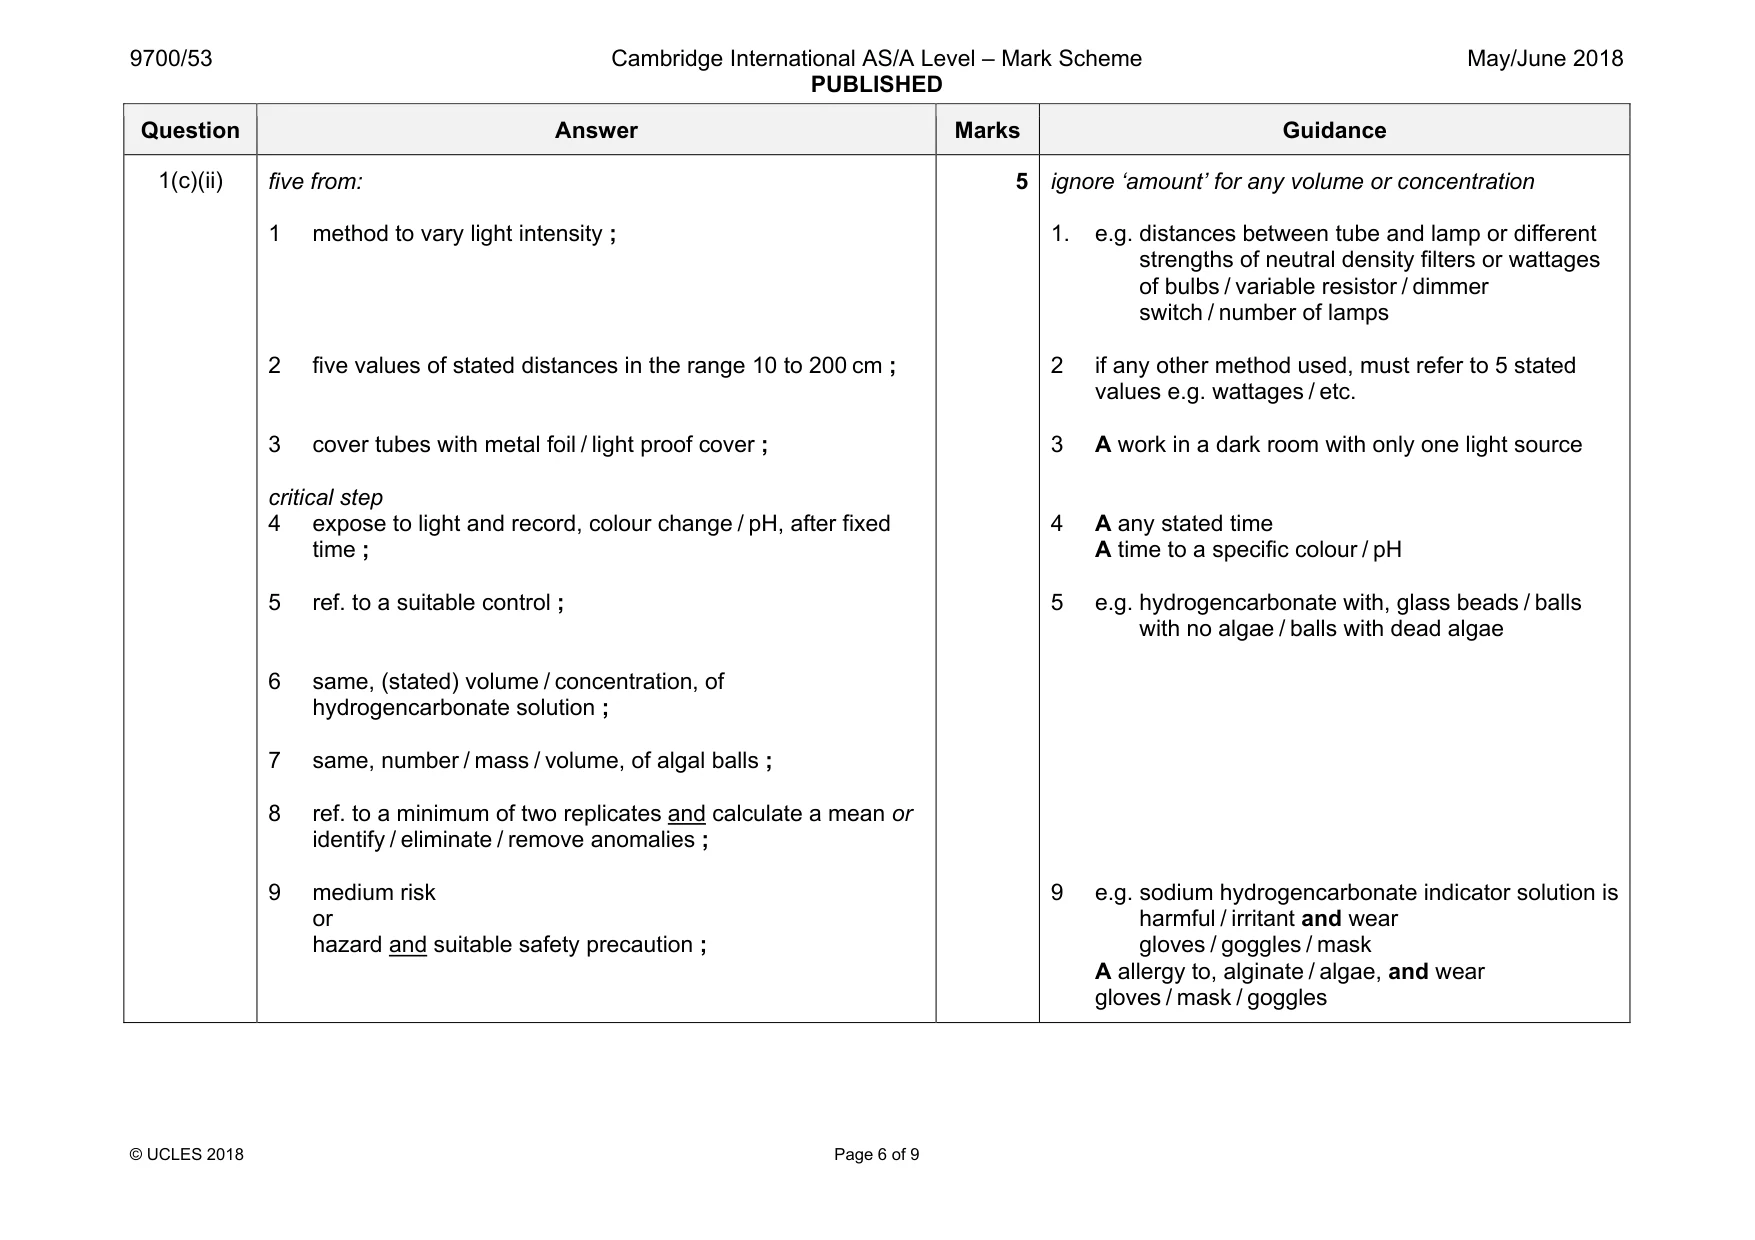
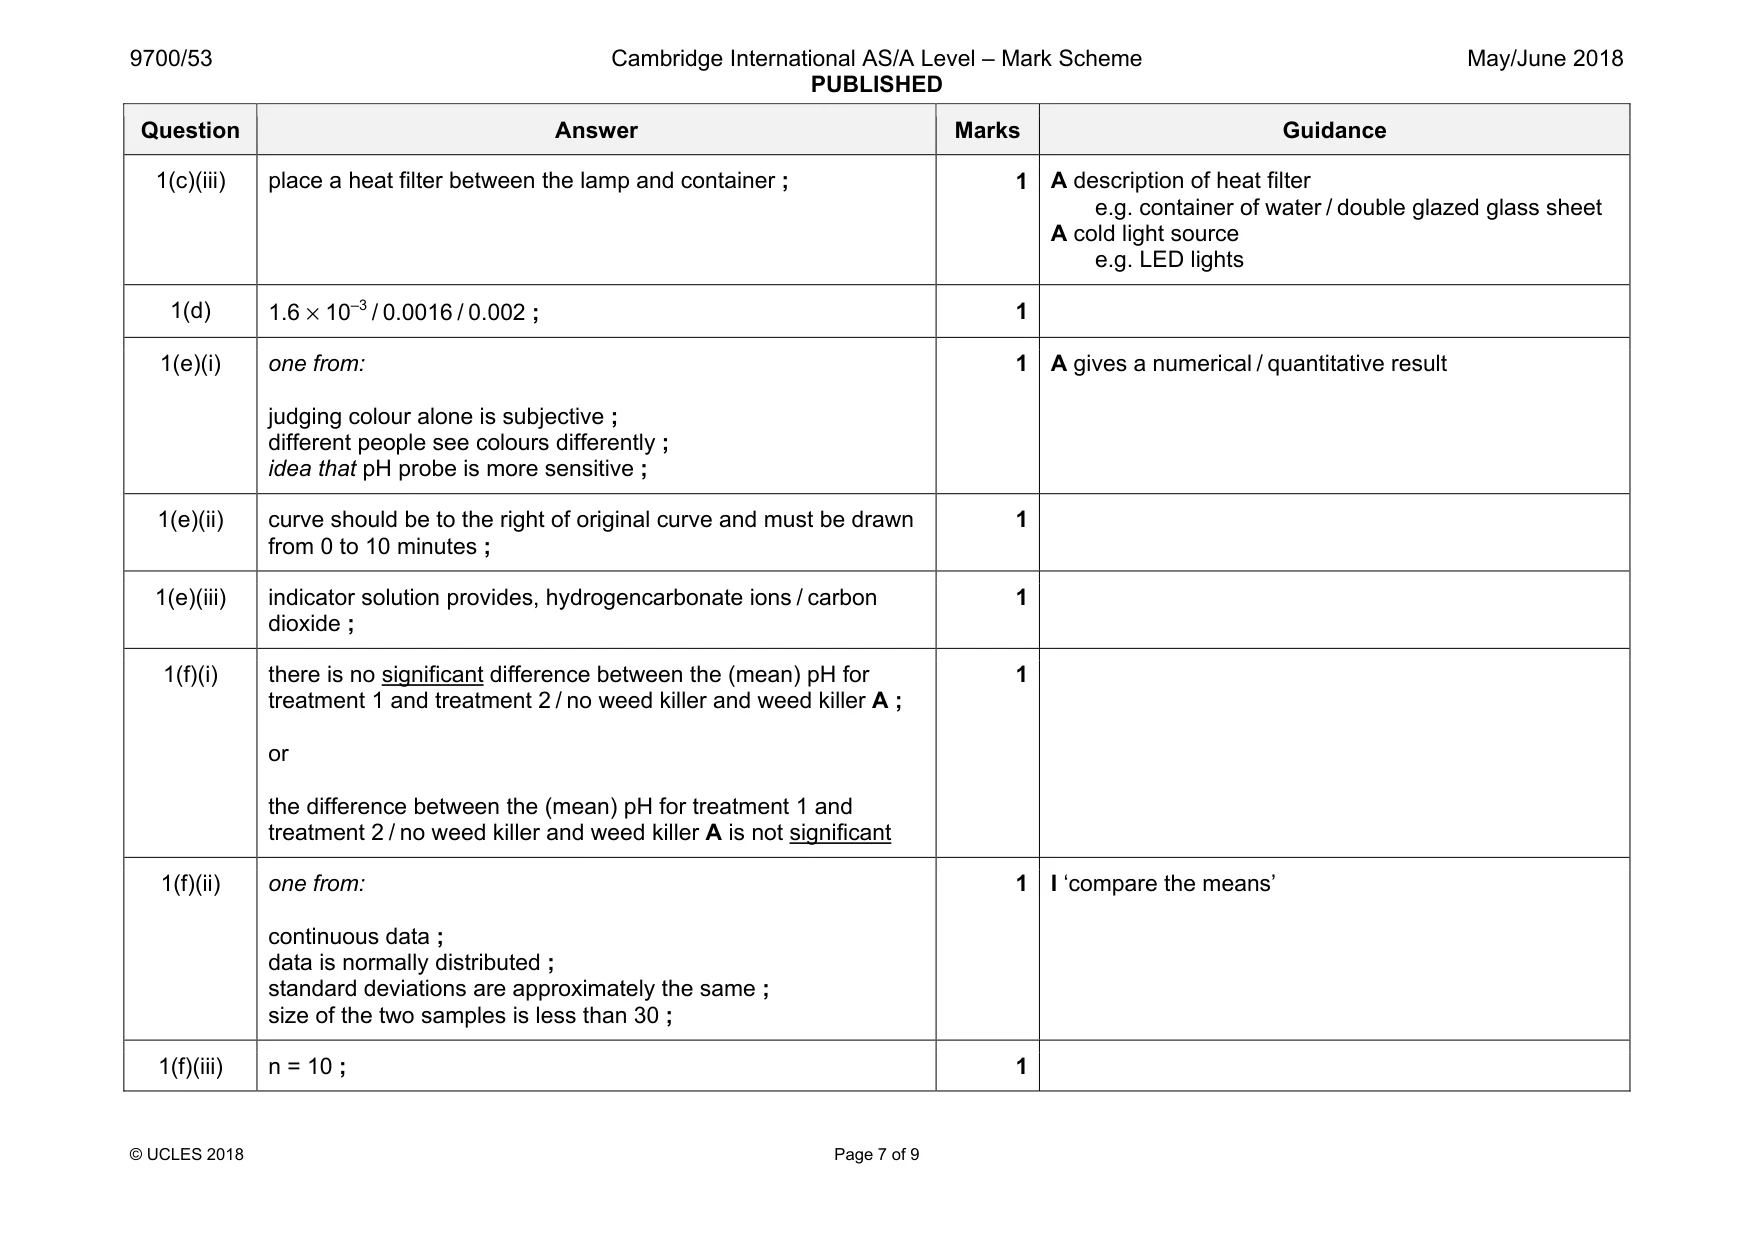
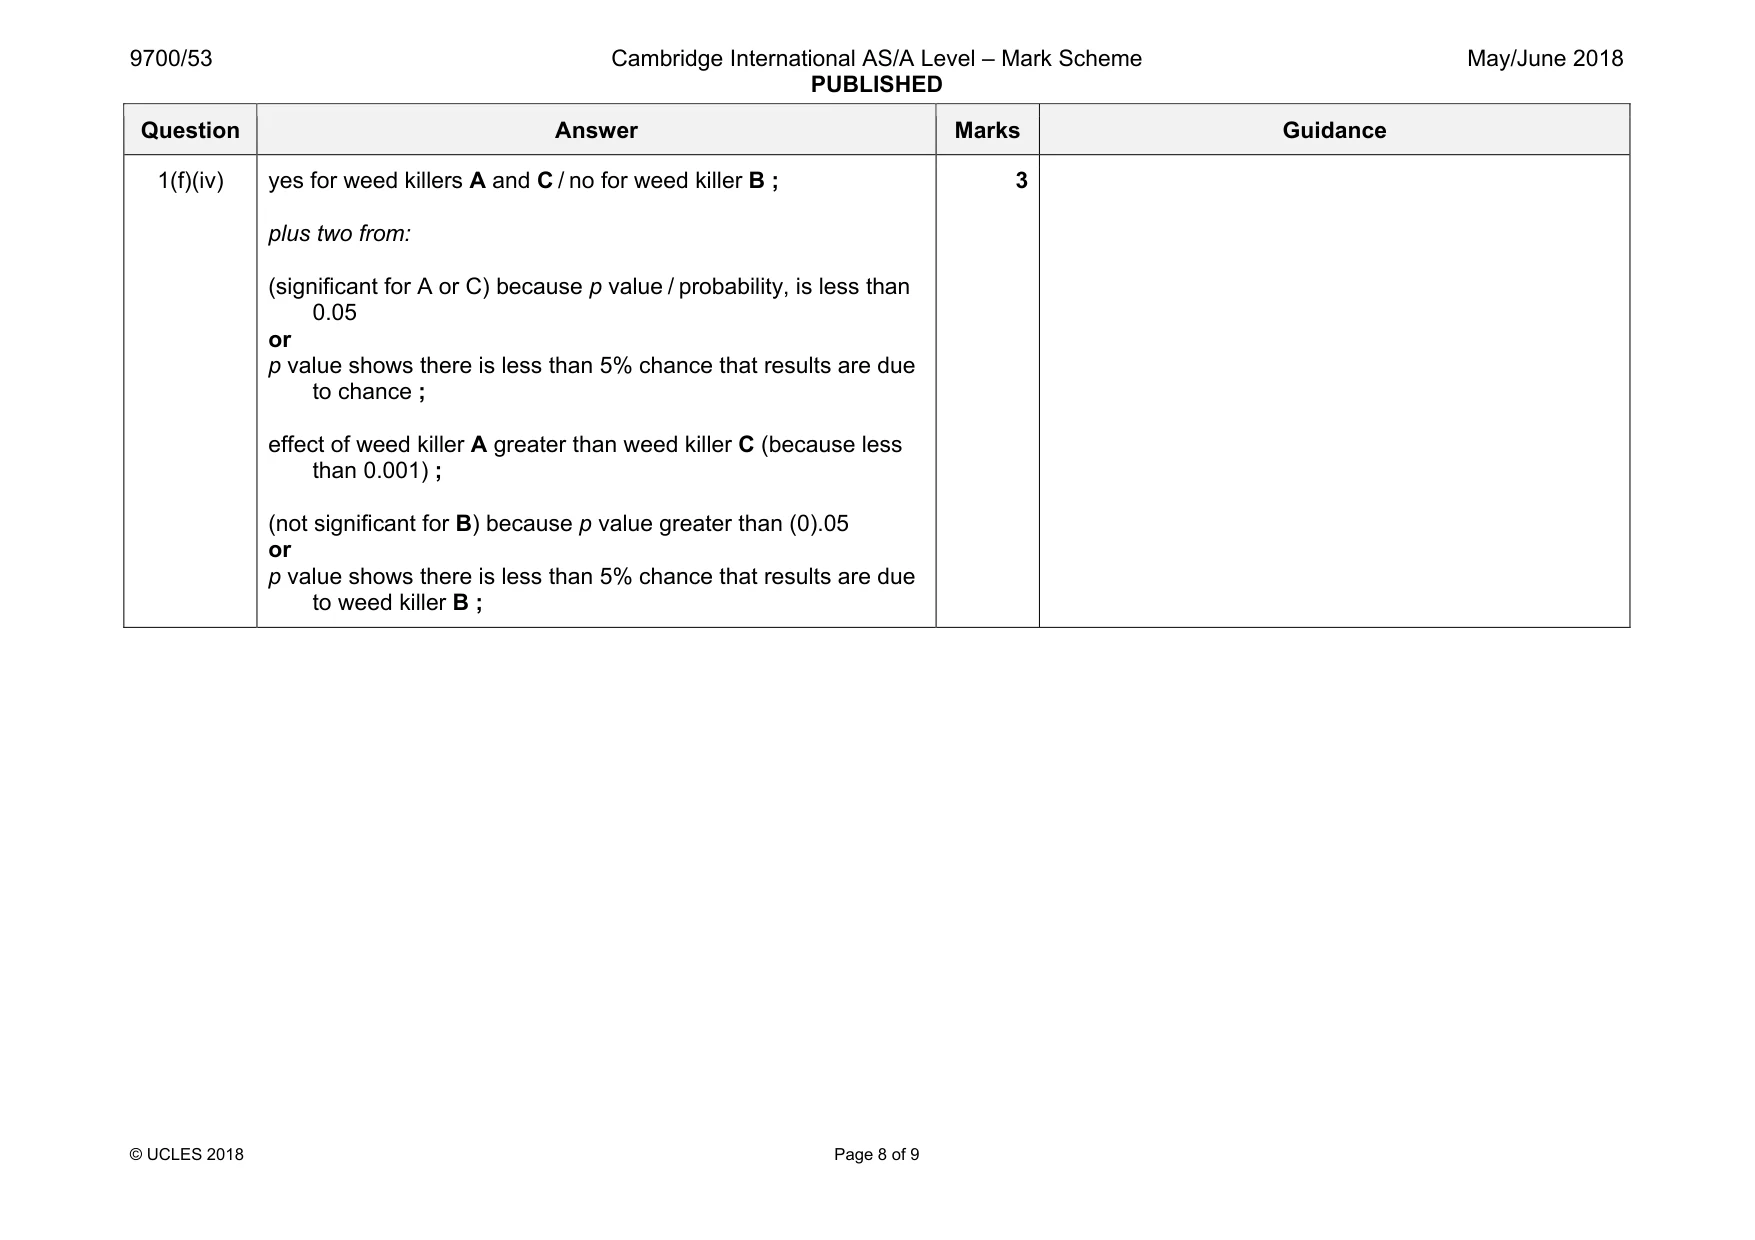
Mark scheme: 1(a) (named) buffer ; 1 1(b) ref. to first mixing the algae with (sodium) alginate ; ref. to then adding (alginate and algae) to calcium chloride ; ref. to method of dropping mixture (to form beads) ; 3 e.g. using syringe or pipette 1(c)(i) independent variable: light intensity / distance of container from lamp ; dependent variable: colour of indicator / pH ; 2 Question Answer Marks Guidance 1(c)(ii) five from: 1 method to vary light intensity ; 2 five values of stated distances in the range 10 to 200 cm ; 3 cover tubes with metal foil / light proof cover ; critical step 4 expose to light and record, colour change / pH, after fixed time ; 5 ref. to a suitable control ; 6 same, (stated) volume / concentration, of hydrogencarbonate solution ; 7 same, number / mass / volume, of algal balls ; 8 ref. to a minimum of two replicates and calculate a mean or identify / eliminate / remove anomalies ; 9 medium risk or hazard and suitable safety precaution ; 5 ignore ‘amount’ for any volume or concentration 1. e.g. distances between tube and lamp or different strengths of neutral density filters or wattages of bulbs / variable resistor / dimmer switch / number of lamps 2 if any other method used, must refer to 5 stated values e.g. wattages / etc. 3 A work in a dark room with only one light source 4 A any stated time A time to a specific colour / pH 5 e.g. hydrogencarbonate with, glass beads / balls with no algae / balls with dead algae 9 e.g. sodium hydrogencarbonate indicator solution is harmful / irritant and wear gloves / goggles / mask A allergy to, alginate / algae, and wear gloves / mask / goggles Question Answer Marks Guidance 1(c)(iii) place a heat filter between the lamp and container ; 1 A description of heat filter e.g. container of water / double glazed glass sheet A cold light source e.g. LED lights 1(d) 1.6 × 10⁻³ / 0.0016 / 0.002 ; 1 1(e)(i) one from: judging colour alone is subjective ; different people see colours differently ; idea that pH probe is more sensitive ; 1 A gives a numerical / quantitative result 1(e)(ii) curve should be to the right of original curve and must be drawn from 0 to 10 minutes ; 1 1(e)(iii) indicator solution provides, hydrogencarbonate ions / carbon dioxide ; 1 1(f)(i) there is no significant difference between the (mean) pH for treatment 1 and treatment 2 / no weed killer and weed killer A ; or the difference between the (mean) pH for treatment 1 and treatment 2 / no weed killer and weed killer A is not significant 1 1(f)(ii) one from: continuous data ; data is normally distributed ; standard deviations are approximately the same ; size of the two samples is less than 30 ; 1 I ‘compare the means’ 1(f)(iii) n = 10 ; 1 Question Answer Marks Guidance 1(f)(iv) yes for weed killers A and C / no for weed killer B ; plus two from: (significant for A or C) because p value / probability, is less than 0.05 or p value shows there is less than 5% chance that results are due to chance ; effect of weed killer A greater than weed killer C (because less than 0.001) ; (not significant for B) because p value greater than (0).05 or p value shows there is less than 5% chance that results are due to weed killer B ; 3
Q2 · Lionfish are a type of fish native to the tropical waters of the Indian Ocean and Pacific…
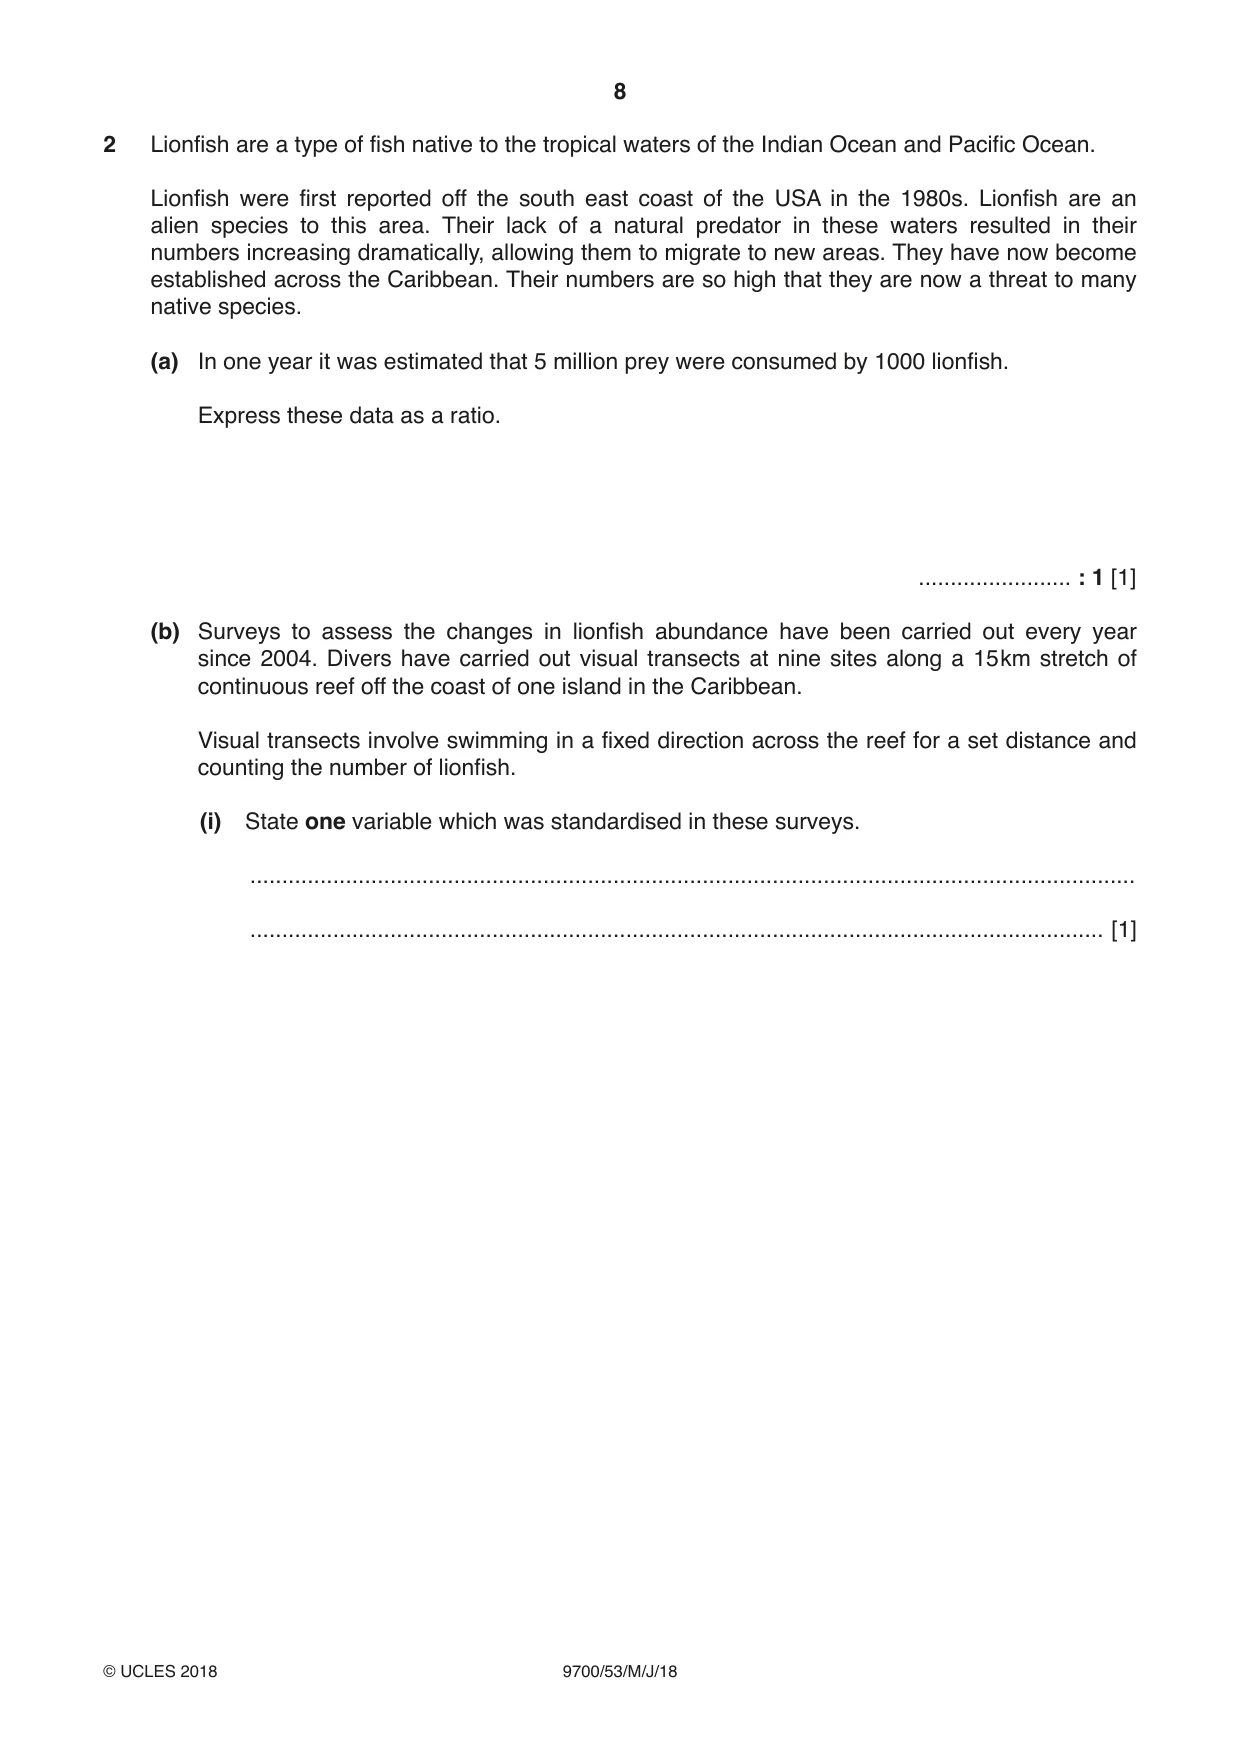
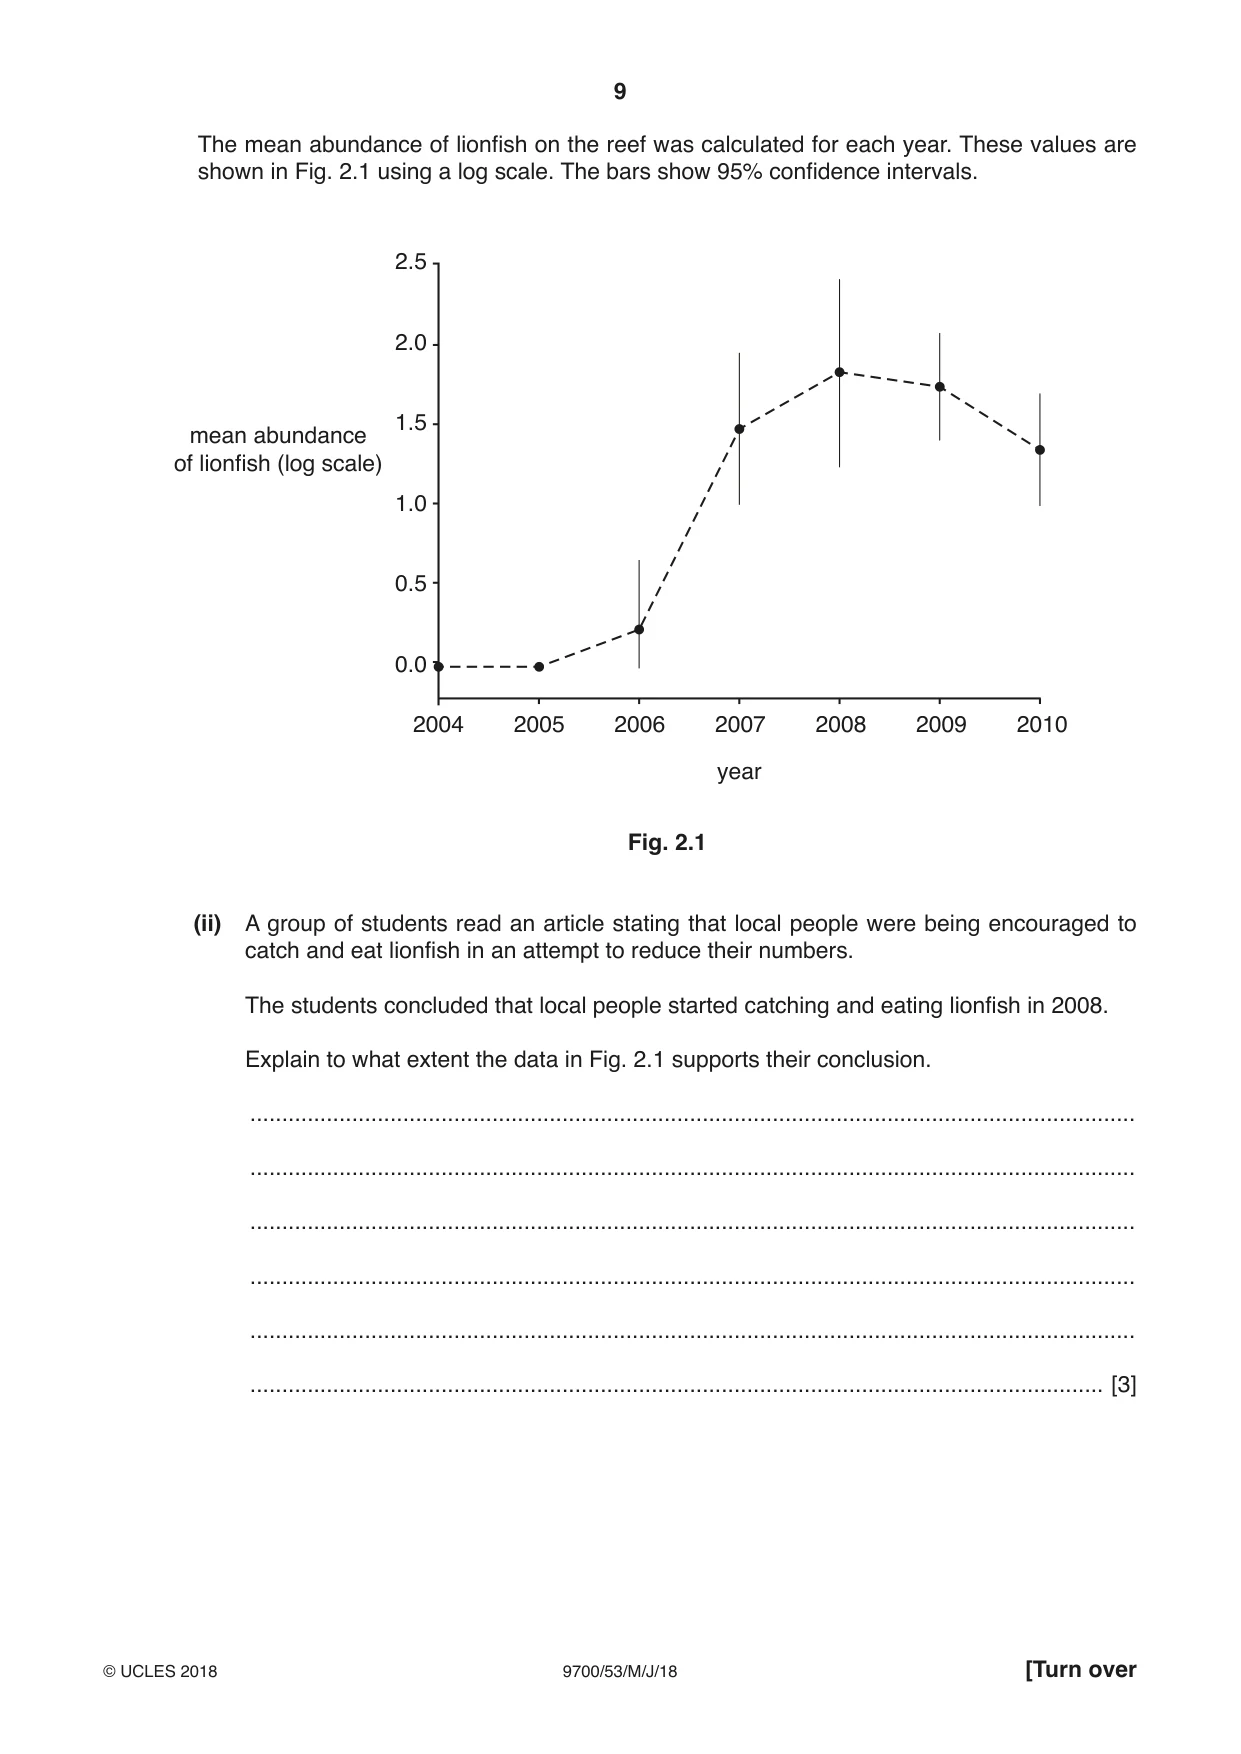
2 Lionfish are a type of fish native to the tropical waters of the Indian Ocean and Pacific Ocean. Lionfish were first reported off the south east coast of the USA in the 1980s. Lionfish are an alien species to this area. Their lack of a natural predator in these waters resulted in their numbers increasing dramatically, allowing them to migrate to new areas. They have now become established across the Caribbean. Their numbers are so high that they are now a threat to many native species. (a) In one year it was estimated that 5 million prey were consumed by 1000 lionfish. Express these data as a ratio. ........................ : 1 [1] (b) Surveys to assess the changes in lionfish abundance have been carried out every year since 2004. Divers have carried out visual transects at nine sites along a 15 km stretch of continuous reef off the coast of one island in the Caribbean. Visual transects involve swimming in a fixed direction across the reef for a set distance and counting the number of lionfish. (i) State one variable which was standardised in these surveys. ........................................................................................................................................... ...................................................................................................................................... [1] The mean abundance of lionfish on the reef was calculated for each year. These values are shown in Fig. 2.1 using a log scale. The bars show 95% confidence intervals. 2.5 2.0 1.5 mean abundance of lionfish (log scale) 1.0 0.5 0.0 2004 2005 2006 2007 2008 2009 2010 year Fig. 2.1 (ii) A group of students read an article stating that local people were being encouraged to catch and eat lionfish in an attempt to reduce their numbers. The students concluded that local people started catching and eating lionfish in 2008. Explain to what extent the data in Fig. 2.1 supports their conclusion. ........................................................................................................................................... ........................................................................................................................................... ........................................................................................................................................... ........................................................................................................................................... ........................................................................................................................................... ...................................................................................................................................... [3] (c) Some local communities hold annual fishing trips where they are encouraged to catch as many lionfish as possible. In 2010 and 2011, 16 boats took part in these fishing trips. The mean number of lionfish per boat and the 95% confidence intervals were calculated. Fig. 2.2 shows the results. 300 250 200 mean number of lionfish caught per boat 150 100 50 0 2010 2011 year of catch Fig. 2.2 The 95% confidence intervals are calculated from 2 × SM . Standard deviation can be calculated by rearranging the equation for standard error shown in Fig. 2.3. s S M = n = standard error where S M s = standard deviation n = number of boats Fig. 2.3
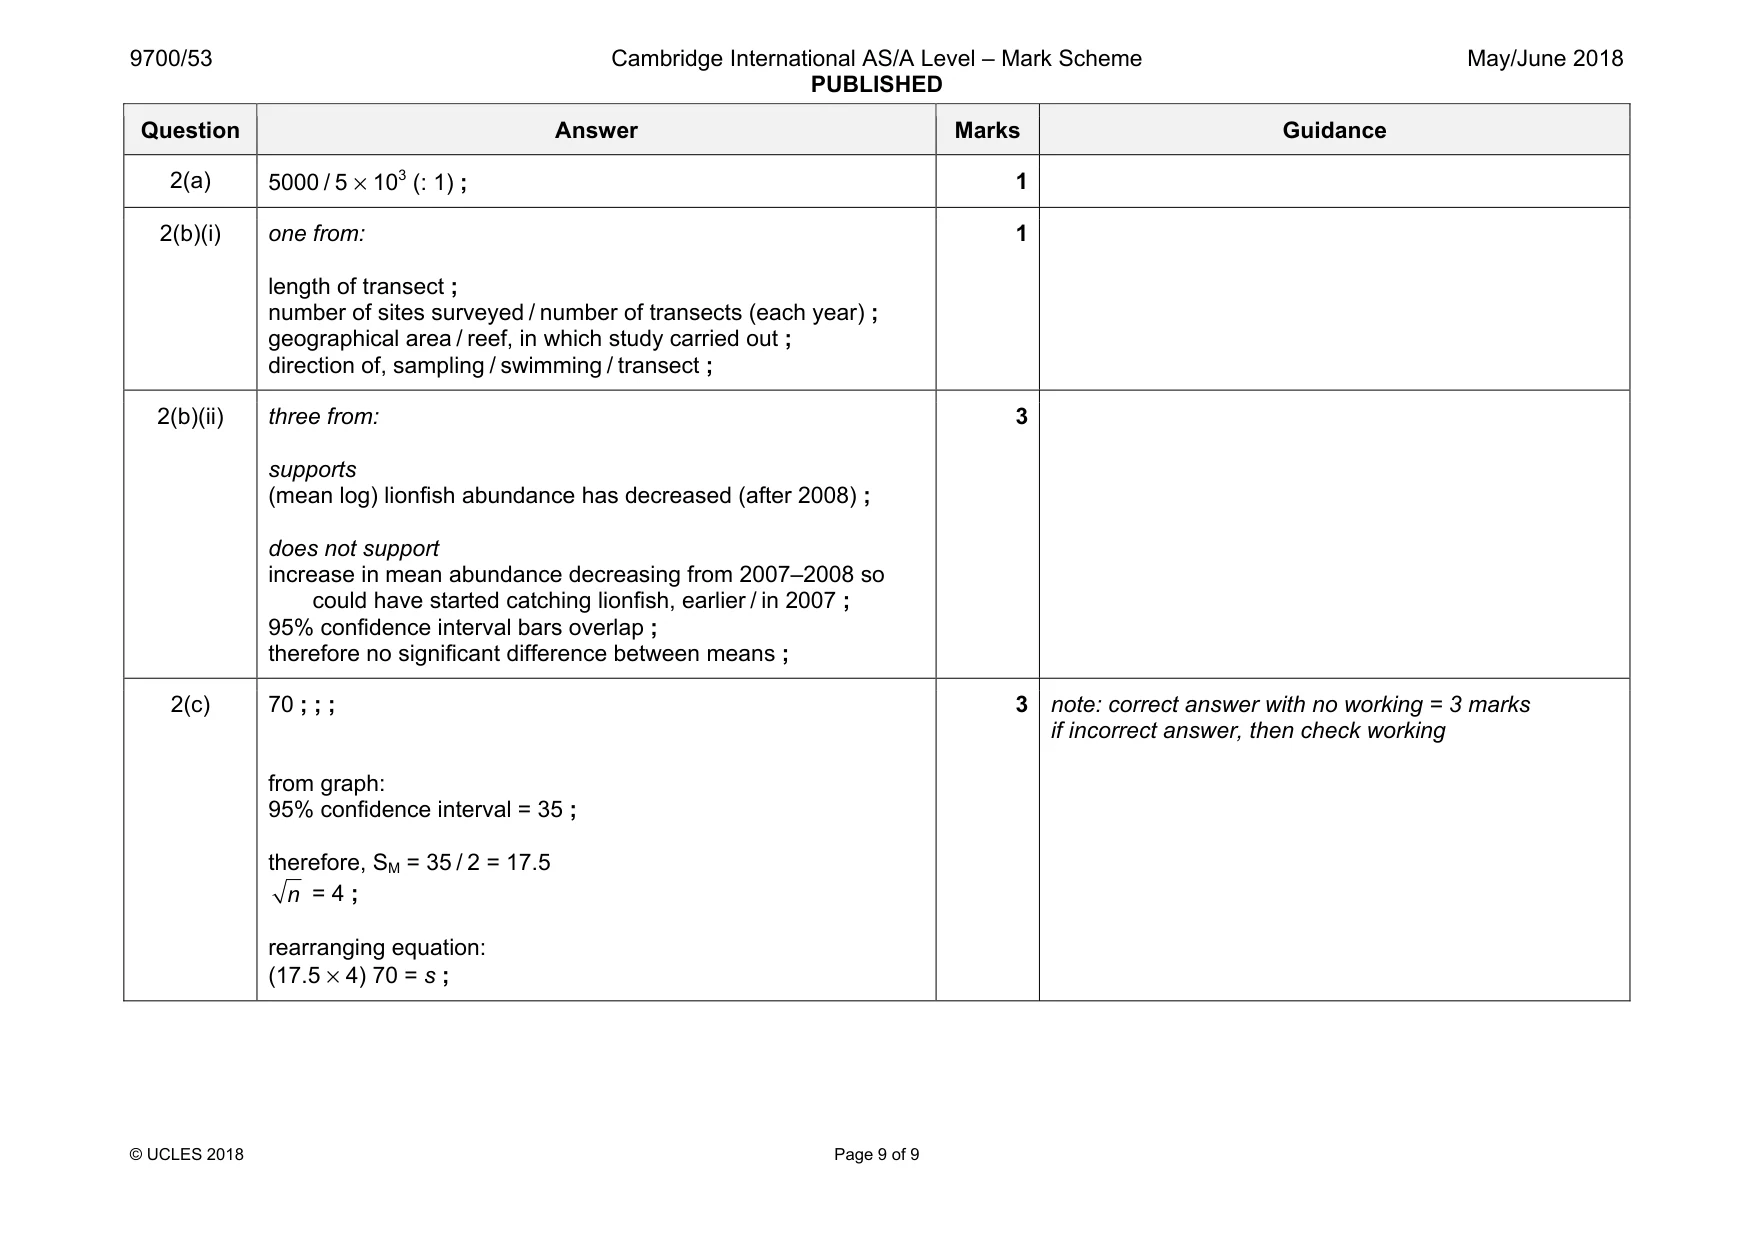
Mark scheme: 2(a) 1 2(b)(i) one from: length of transect ; number of sites surveyed / number of transects (each year) ; geographical area / reef, in which study carried out ; direction of, sampling / swimming / transect ; 1 2(b)(ii) three from: supports (mean log) lionfish abundance has decreased (after 2008) ; does not support increase in mean abundance decreasing from 2007–2008 so could have started catching lionfish, earlier / in 2007 ; 95% confidence interval bars overlap ; therefore no significant difference between means ; 3 2(c) 70 ; ; ; from graph: 95% confidence interval = 35 ; therefore, SM = 35 / 2 = 17.5 n = 4 ; rearranging equation: (17.5 × 4) 70 = s ; 3 note: correct answer with no working = 3 marks if incorrect answer, then check working
What was in this paper
The subtopics covered by these 2 questions, and how many questions each got. Open one in a new tab to see every Cambridge question on it.
What you needed in this session
Cambridge’s own grade thresholds for 2018 May/June, Paper 5 · Variant 3. A higher threshold means an easier paper — the bar moves with how the cohort did.