Cambridge A Level Biology 9700 — 2018 May/June Paper 5 · Variant 1
9700/51/M/J/18 · 2 questions · 30 marks · ≈34 min
The question paper and its mark scheme, free to read here and free to download. This is Cambridge’s own paper, exactly as it was sat.
Question paper12 pages




Mark scheme12 pages
Answers below. Sit the paper first if you are practising.


Questions as text
Q1 · Some students were asked to use leaf discs to investigate photosynthesis in leaves of…
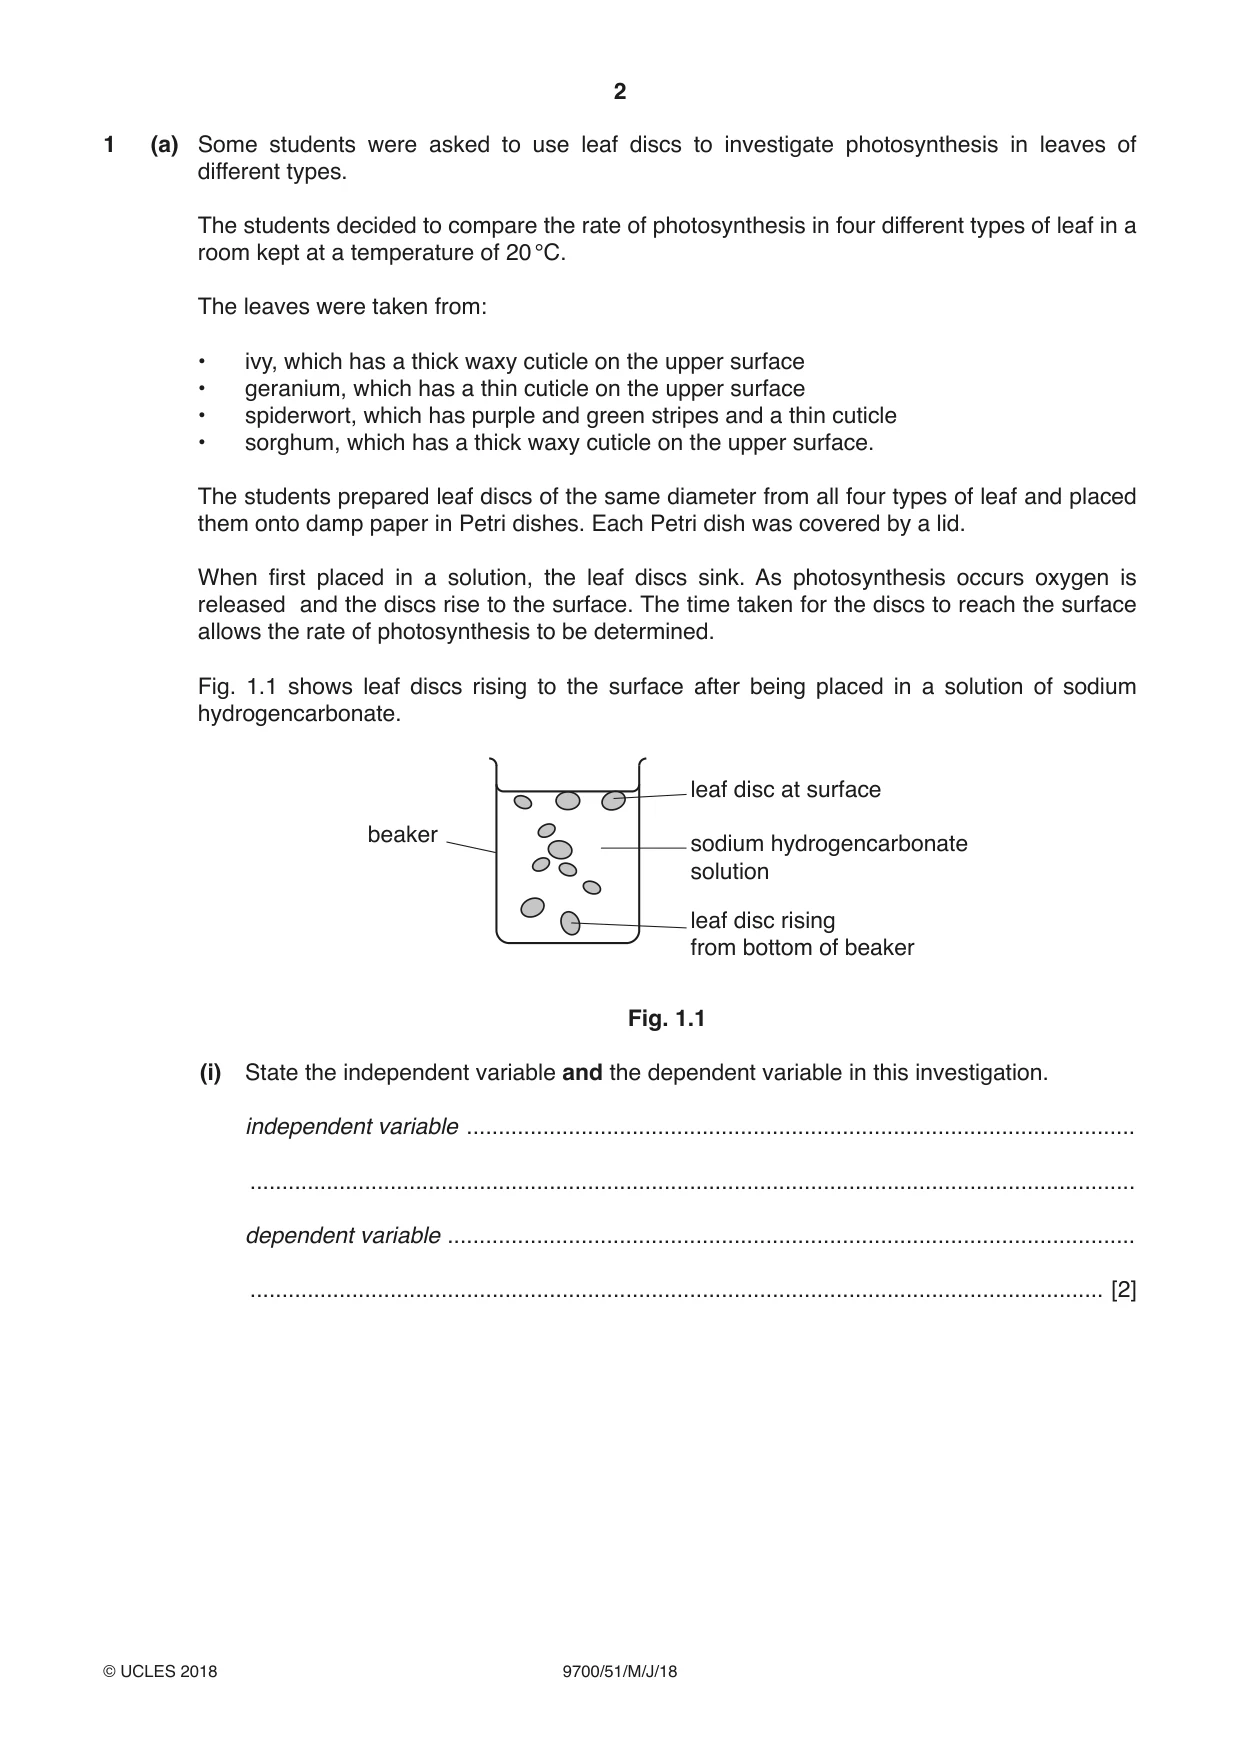
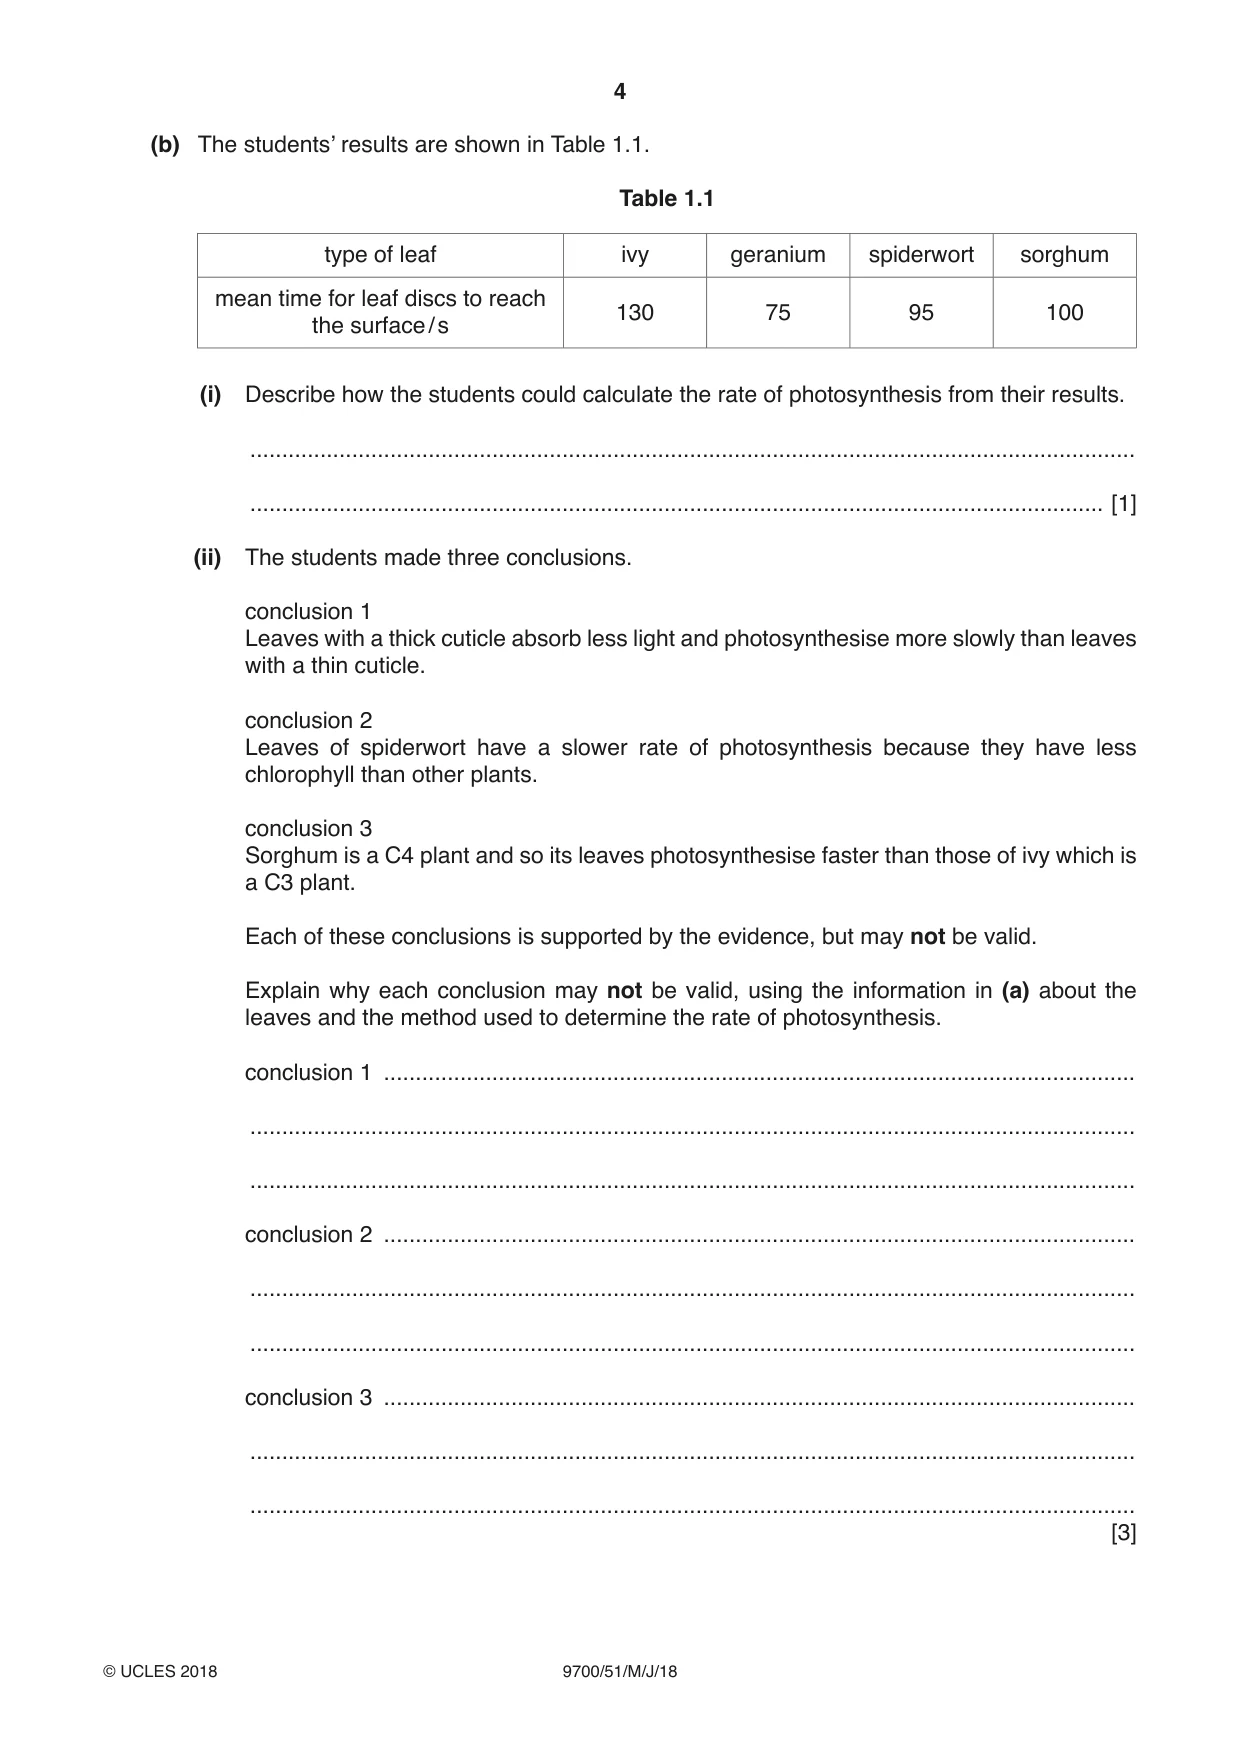
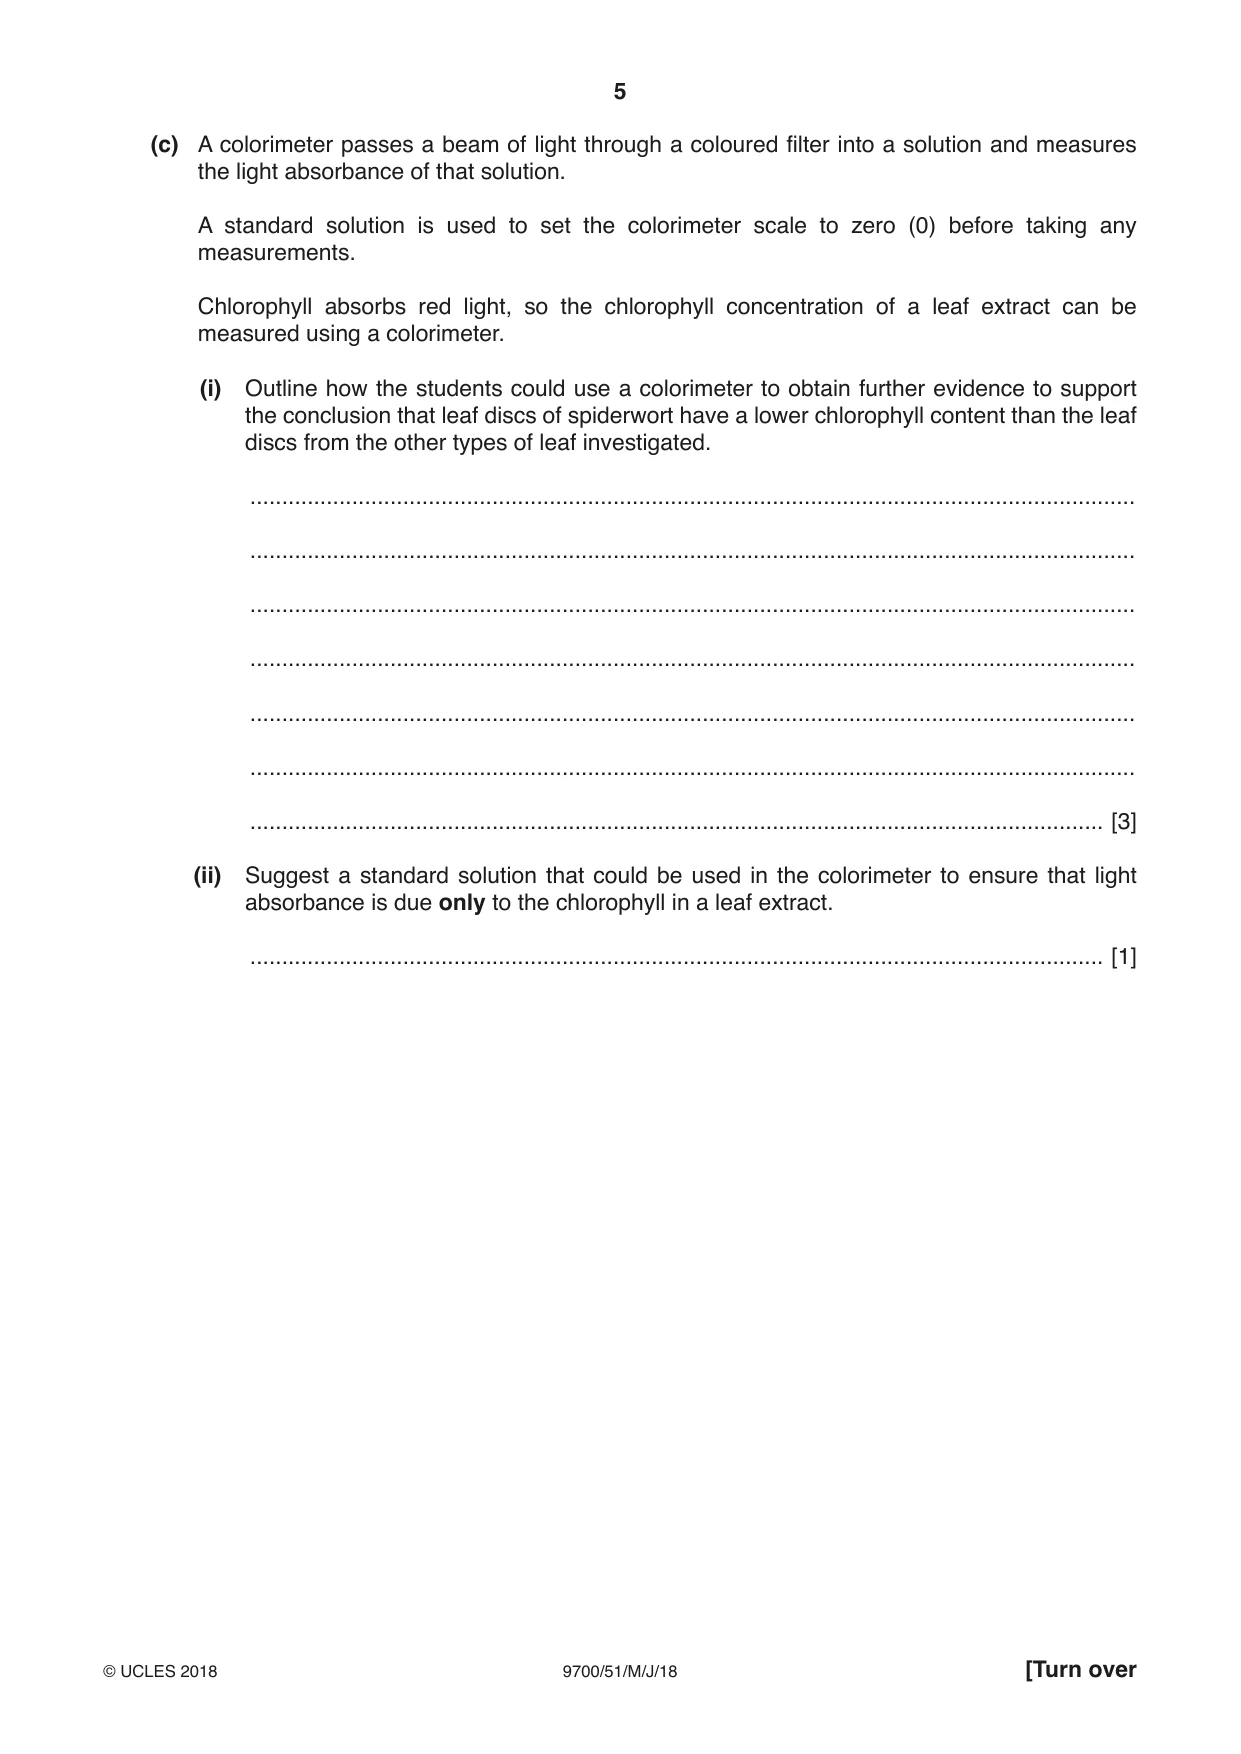
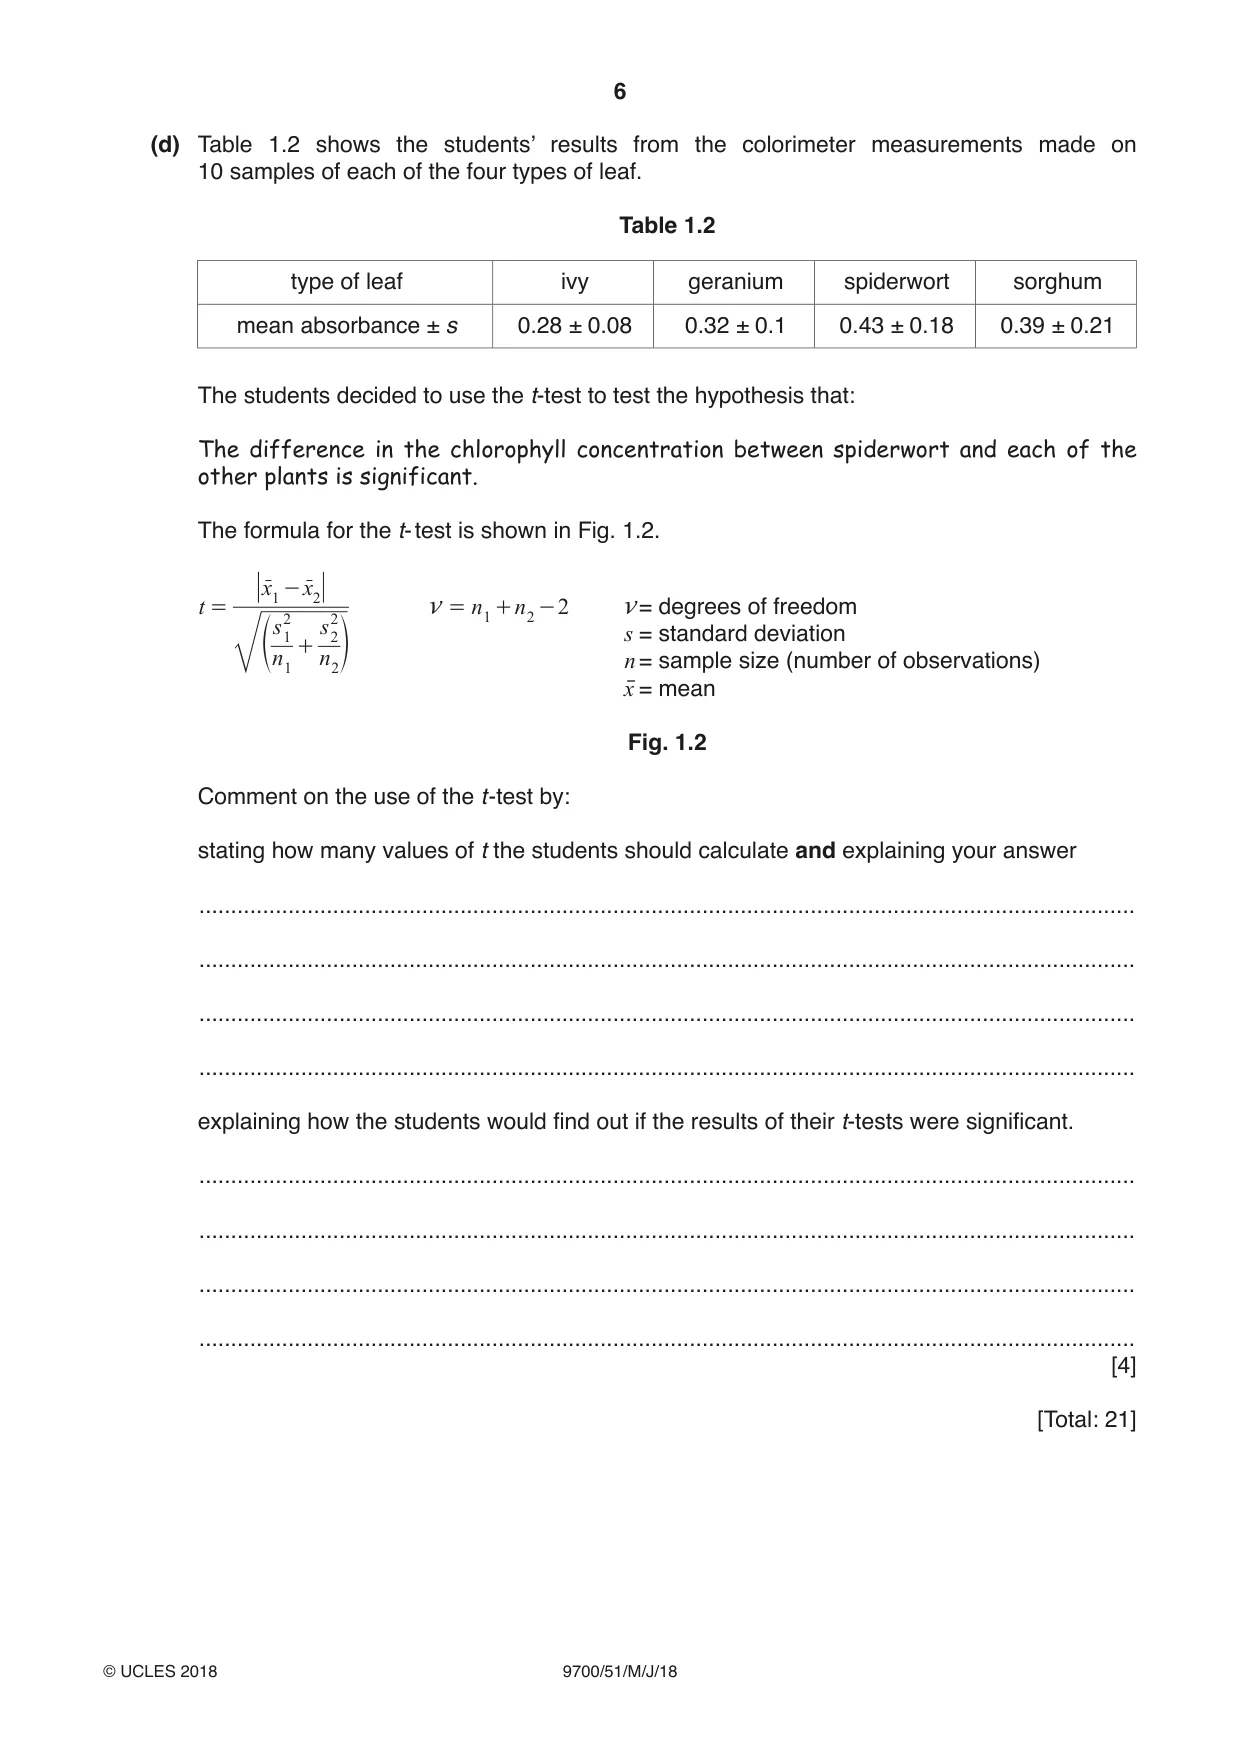
1 (a) Some students were asked to use leaf discs to investigate photosynthesis in leaves of different types. The students decided to compare the rate of photosynthesis in four different types of leaf in a room kept at a temperature of 20 °C. The leaves were taken from: • ivy, which has a thick waxy cuticle on the upper surface • geranium, which has a thin cuticle on the upper surface • spiderwort, which has purple and green stripes and a thin cuticle • sorghum, which has a thick waxy cuticle on the upper surface. The students prepared leaf discs of the same diameter from all four types of leaf and placed them onto damp paper in Petri dishes. Each Petri dish was covered by a lid. When first placed in a solution, the leaf discs sink. As photosynthesis occurs oxygen is released and the discs rise to the surface. The time taken for the discs to reach the surface allows the rate of photosynthesis to be determined. Fig. 1.1 shows leaf discs rising to the surface after being placed in a solution of sodium hydrogencarbonate. leaf disc at surface beaker sodium hydrogencarbonate solution leaf disc rising from bottom of beaker Fig. 1.1 (i) State the independent variable and the dependent variable in this investigation. independent variable ......................................................................................................... ........................................................................................................................................... dependent variable ............................................................................................................ ...................................................................................................................................... [2] (ii) Use the information provided to describe a method by which the students could compare the rate of photosynthesis in discs cut from the four types of leaf. Your method should be set out in a logical order and be detailed enough to let another person follow it. Details of the preparation of the leaf discs are not required. ........................................................................................................................................... ........................................................................................................................................... ........................................................................................................................................... ........................................................................................................................................... ........................................................................................................................................... ........................................................................................................................................... ........................................................................................................................................... ........................................................................................................................................... ........................................................................................................................................... ........................................................................................................................................... ........................................................................................................................................... ........................................................................................................................................... ........................................................................................................................................... ........................................................................................................................................... ........................................................................................................................................... ........................................................................................................................................... ........................................................................................................................................... ........................................................................................................................................... ........................................................................................................................................... ........................................................................................................................................... ........................................................................................................................................... ........................................................................................................................................... ...................................................................................................................................... [7] (b) The students’ results are shown in Table 1.1. Table 1.1 type of leaf ivy geranium spiderwort sorghum mean time for leaf discs to reach 130 75 95 100 the surface / s (i) Describe how the students could calculate the rate of photosynthesis from their results. ........................................................................................................................................... ...................................................................................................................................... [1] (ii) The students made three conclusions. conclusion 1 Leaves with a thick cuticle absorb less light and photosynthesise more slowly than leaves with a thin cuticle. conclusion 2 Leaves of spiderwort have a slower rate of photosynthesis because they have less chlorophyll than other plants. conclusion 3 Sorghum is a C4 plant and so its leaves photosynthesise faster than those of ivy which is a C3 plant. Each of these conclusions is supported by the evidence, but may not be valid. Explain why each conclusion may not be valid, using the information in (a) about the leaves and the method used to determine the rate of photosynthesis. conclusion 1 ...................................................................................................................... ........................................................................................................................................... ........................................................................................................................................... conclusion 2 ...................................................................................................................... ........................................................................................................................................... ........................................................................................................................................... conclusion 3 ...................................................................................................................... ........................................................................................................................................... ........................................................................................................................................... [3] (c) A colorimeter passes a beam of light through a coloured filter into a solution and measures the light absorbance of that solution. A standard solution is used to set the colorimeter scale to zero (0) before taking any measurements. Chlorophyll absorbs red light, so the chlorophyll concentration of a leaf extract can be measured using a colorimeter. (i) Outline how the students could use a colorimeter to obtain further evidence to support the conclusion that leaf discs of spiderwort have a lower chlorophyll content than the leaf discs from the other types of leaf investigated. ........................................................................................................................................... ........................................................................................................................................... ........................................................................................................................................... ........................................................................................................................................... ........................................................................................................................................... ........................................................................................................................................... ...................................................................................................................................... [3] (ii) Suggest a standard solution that could be used in the colorimeter to ensure that light absorbance is due only to the chlorophyll in a leaf extract. ...................................................................................................................................... [1] (d) Table 1.2 shows the students’ results from the colorimeter measurements made on 10 samples of each of the four types of leaf. Table 1.2 type of leaf ivy geranium spiderwort sorghum mean absorbance ± s 0.28 ± 0.08 0.32 ± 0.1 0.43 ± 0.18 0.39 ± 0.21 The students decided to use the t‑test to test the hypothesis that: The difference in the chlorophyll concentration between spiderwort and each of the other plants is significant. The formula for the t‑ test is shown in Fig. 1.2. xr1 - xr2 t = o = n 1 + n 2 - 2 o = degrees of freedom 2 2 s 1 + f n 1 ns 22 p ns == samplestandardsizedeviation(number of observations) x̅ = mean Fig. 1.2 Comment on the use of the t ‑test by: stating how many values of t the students should calculate and explaining your answer ................................................................................................................................................... ................................................................................................................................................... ................................................................................................................................................... ................................................................................................................................................... explaining how the students would find out if the results of their t‑tests were significant. ................................................................................................................................................... ................................................................................................................................................... ................................................................................................................................................... ................................................................................................................................................... [4] [Total: 21]
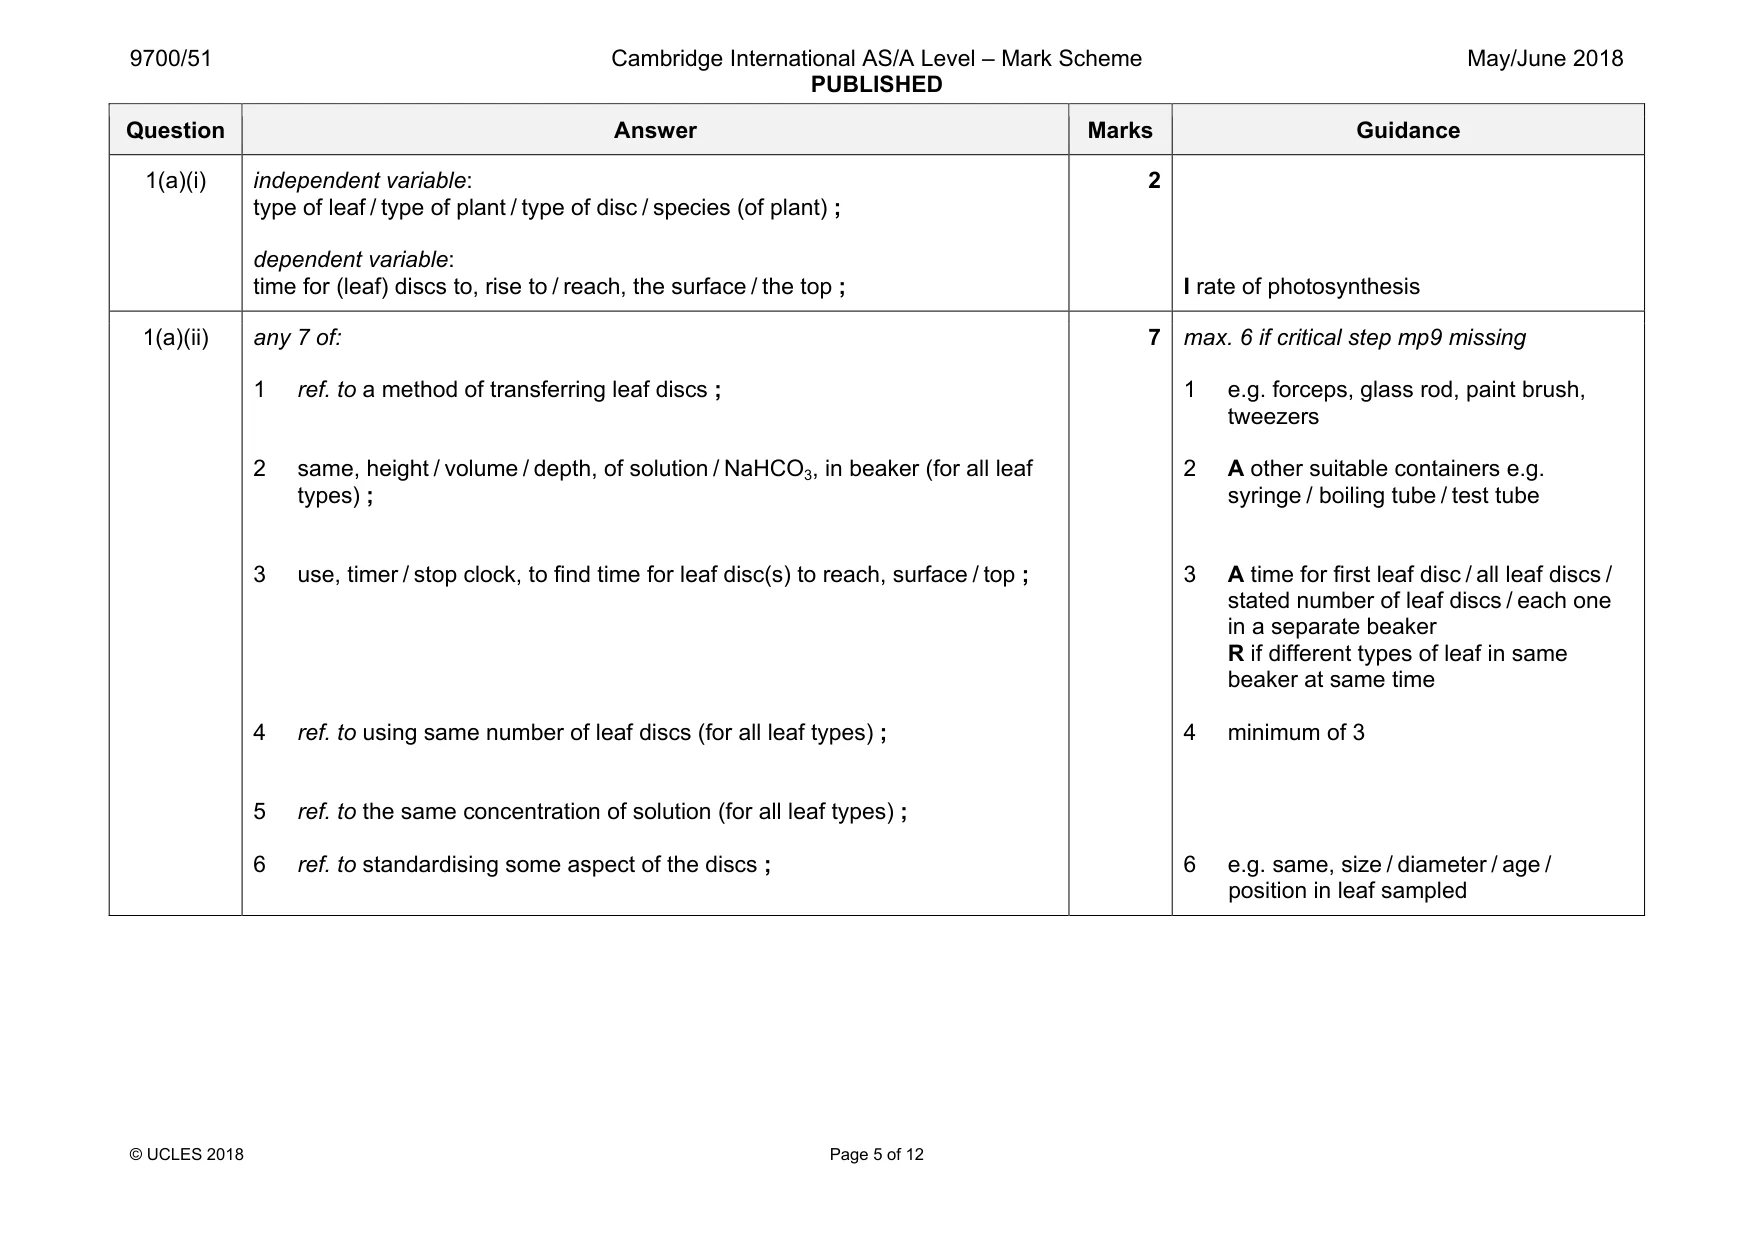
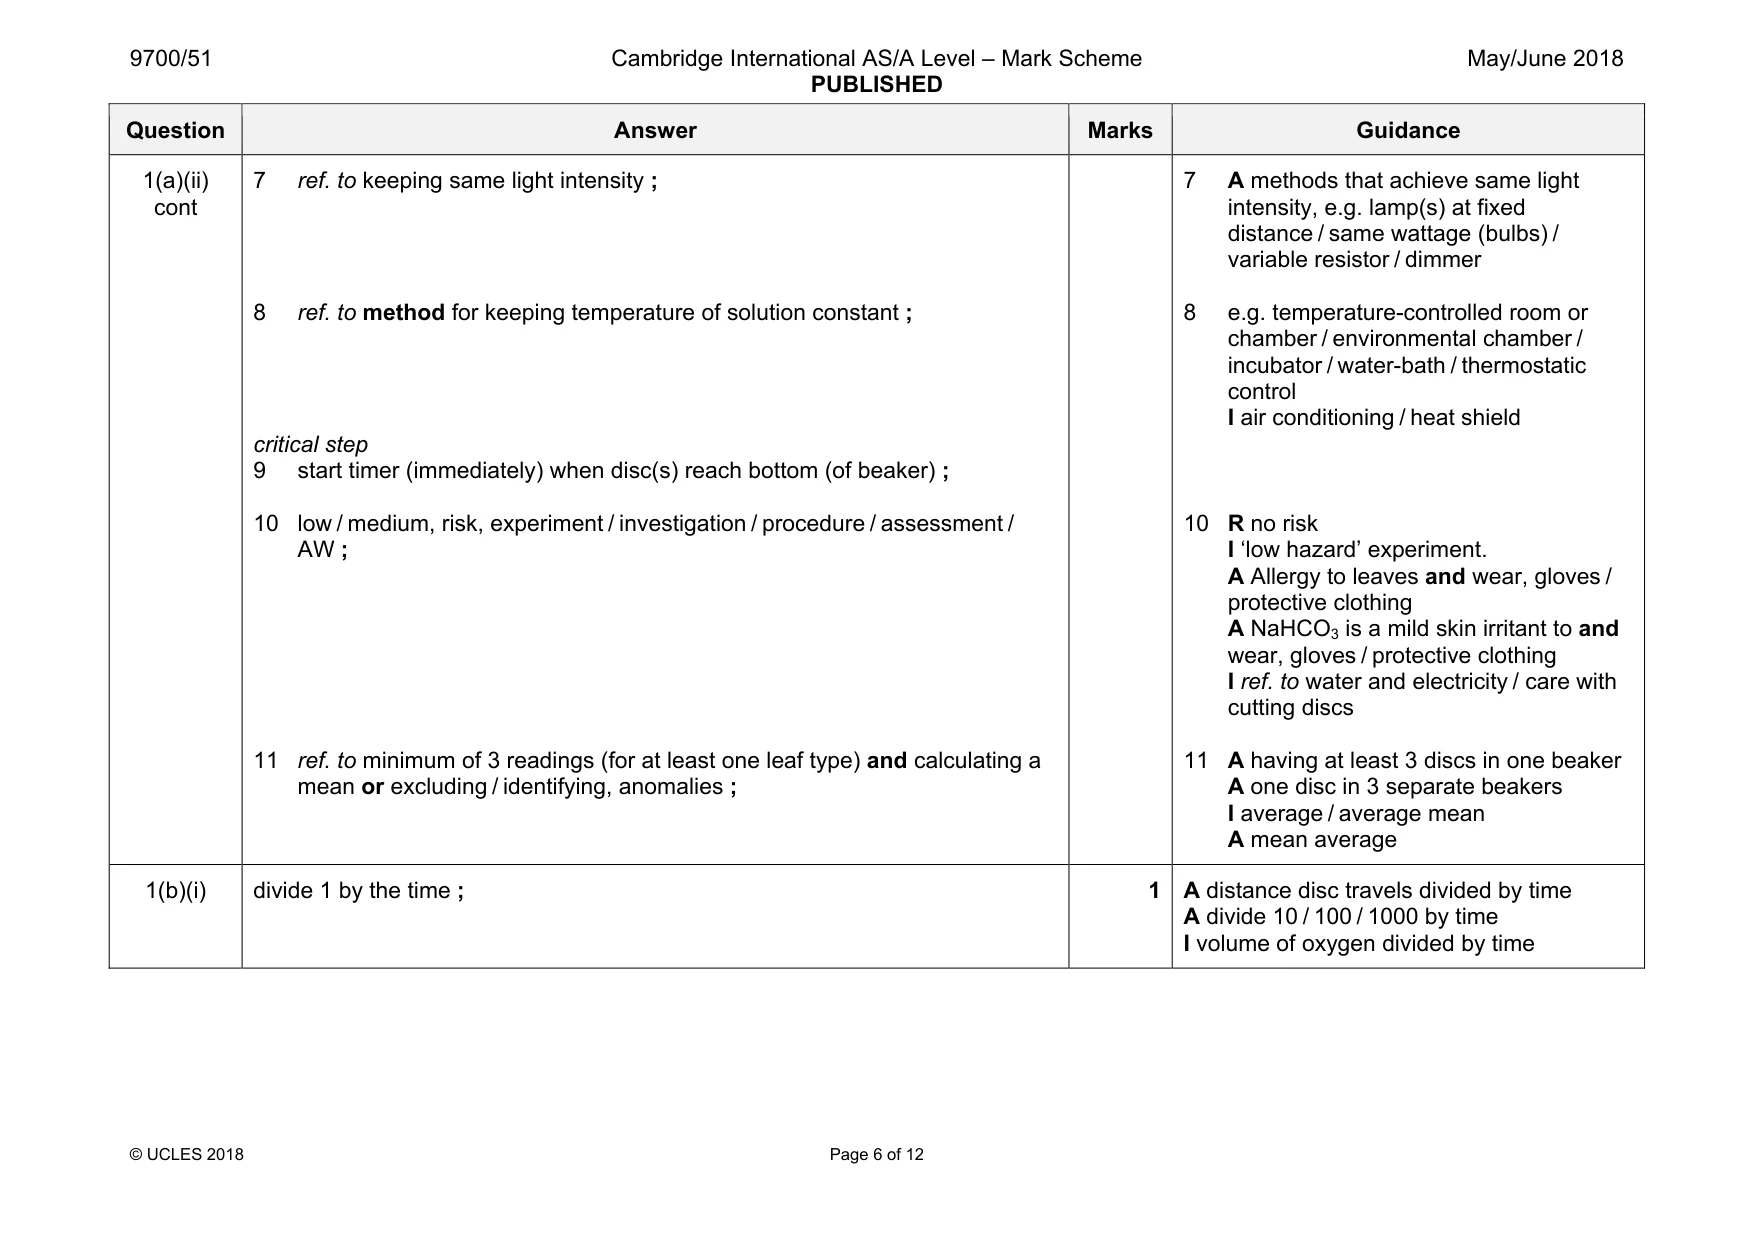
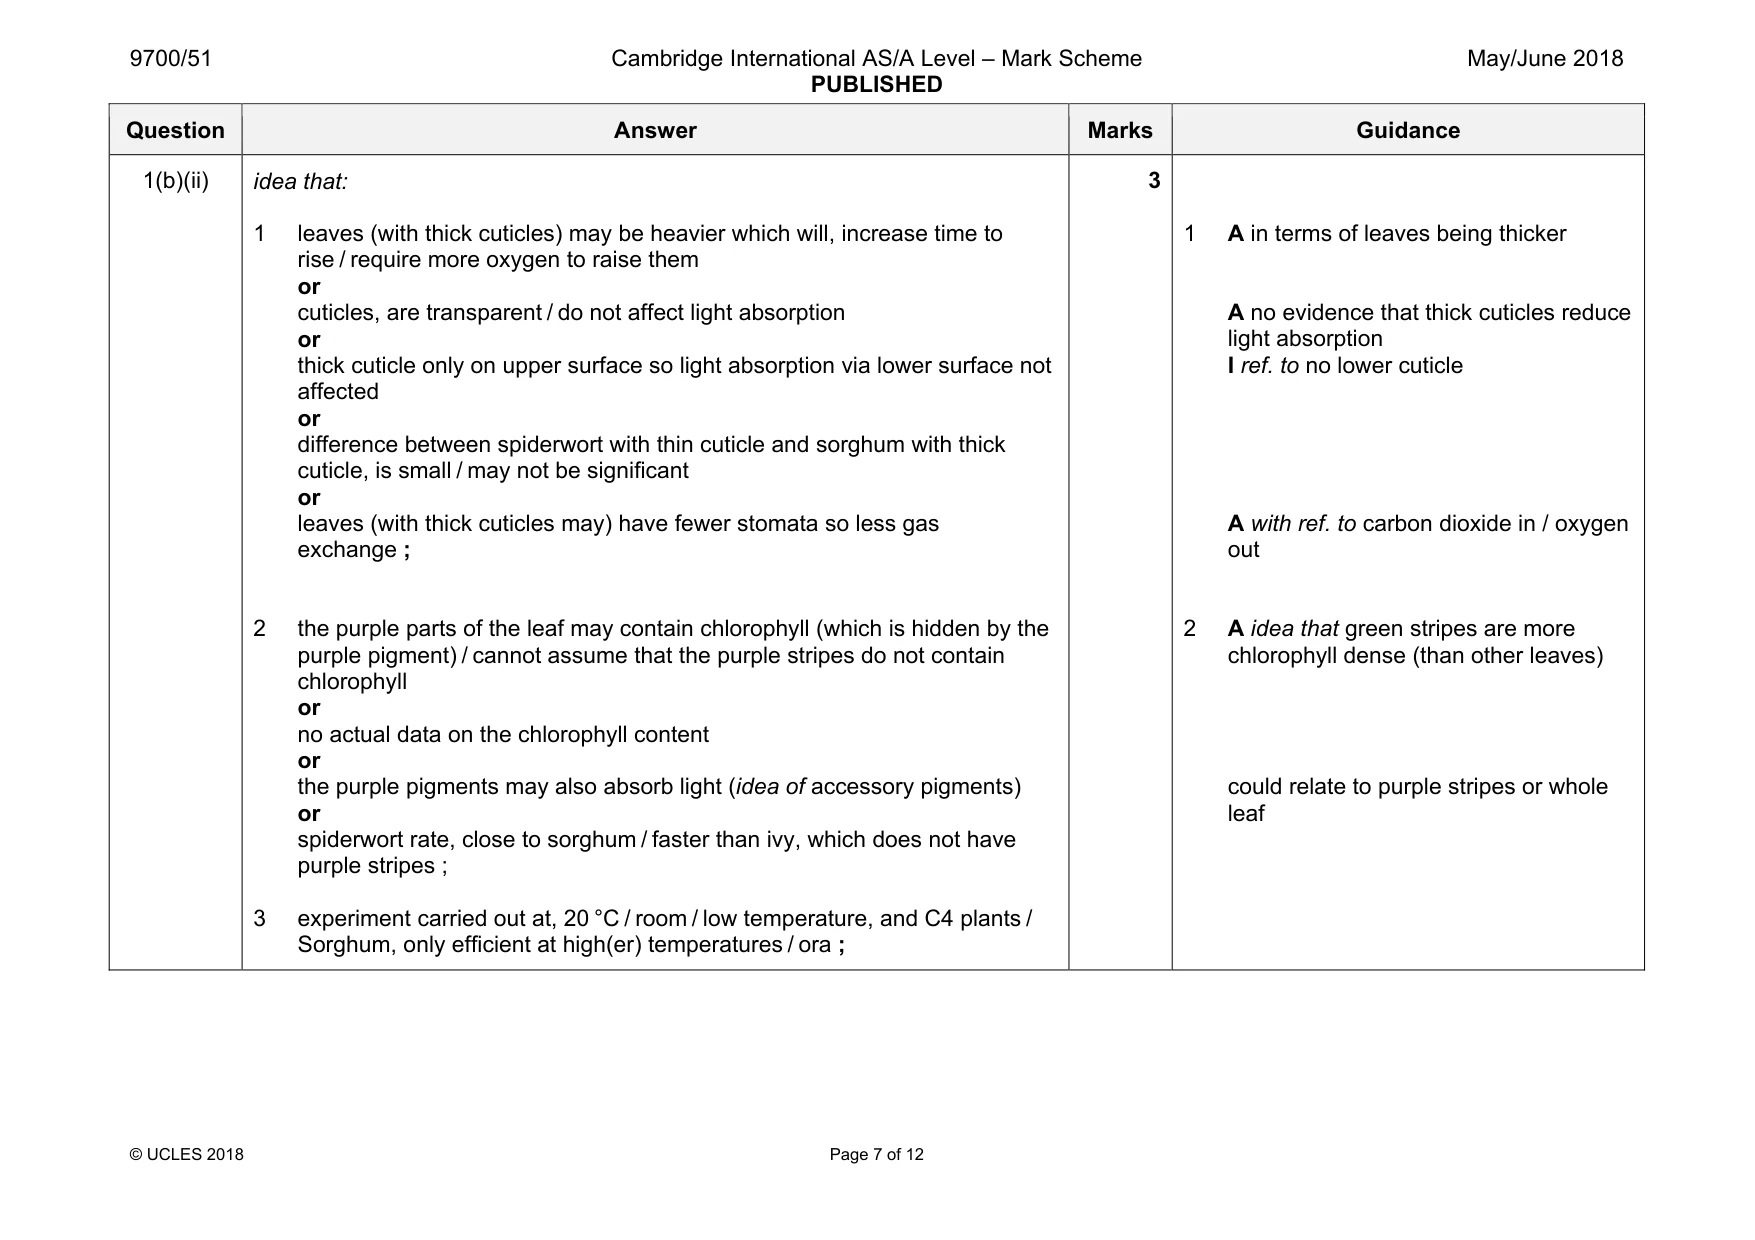
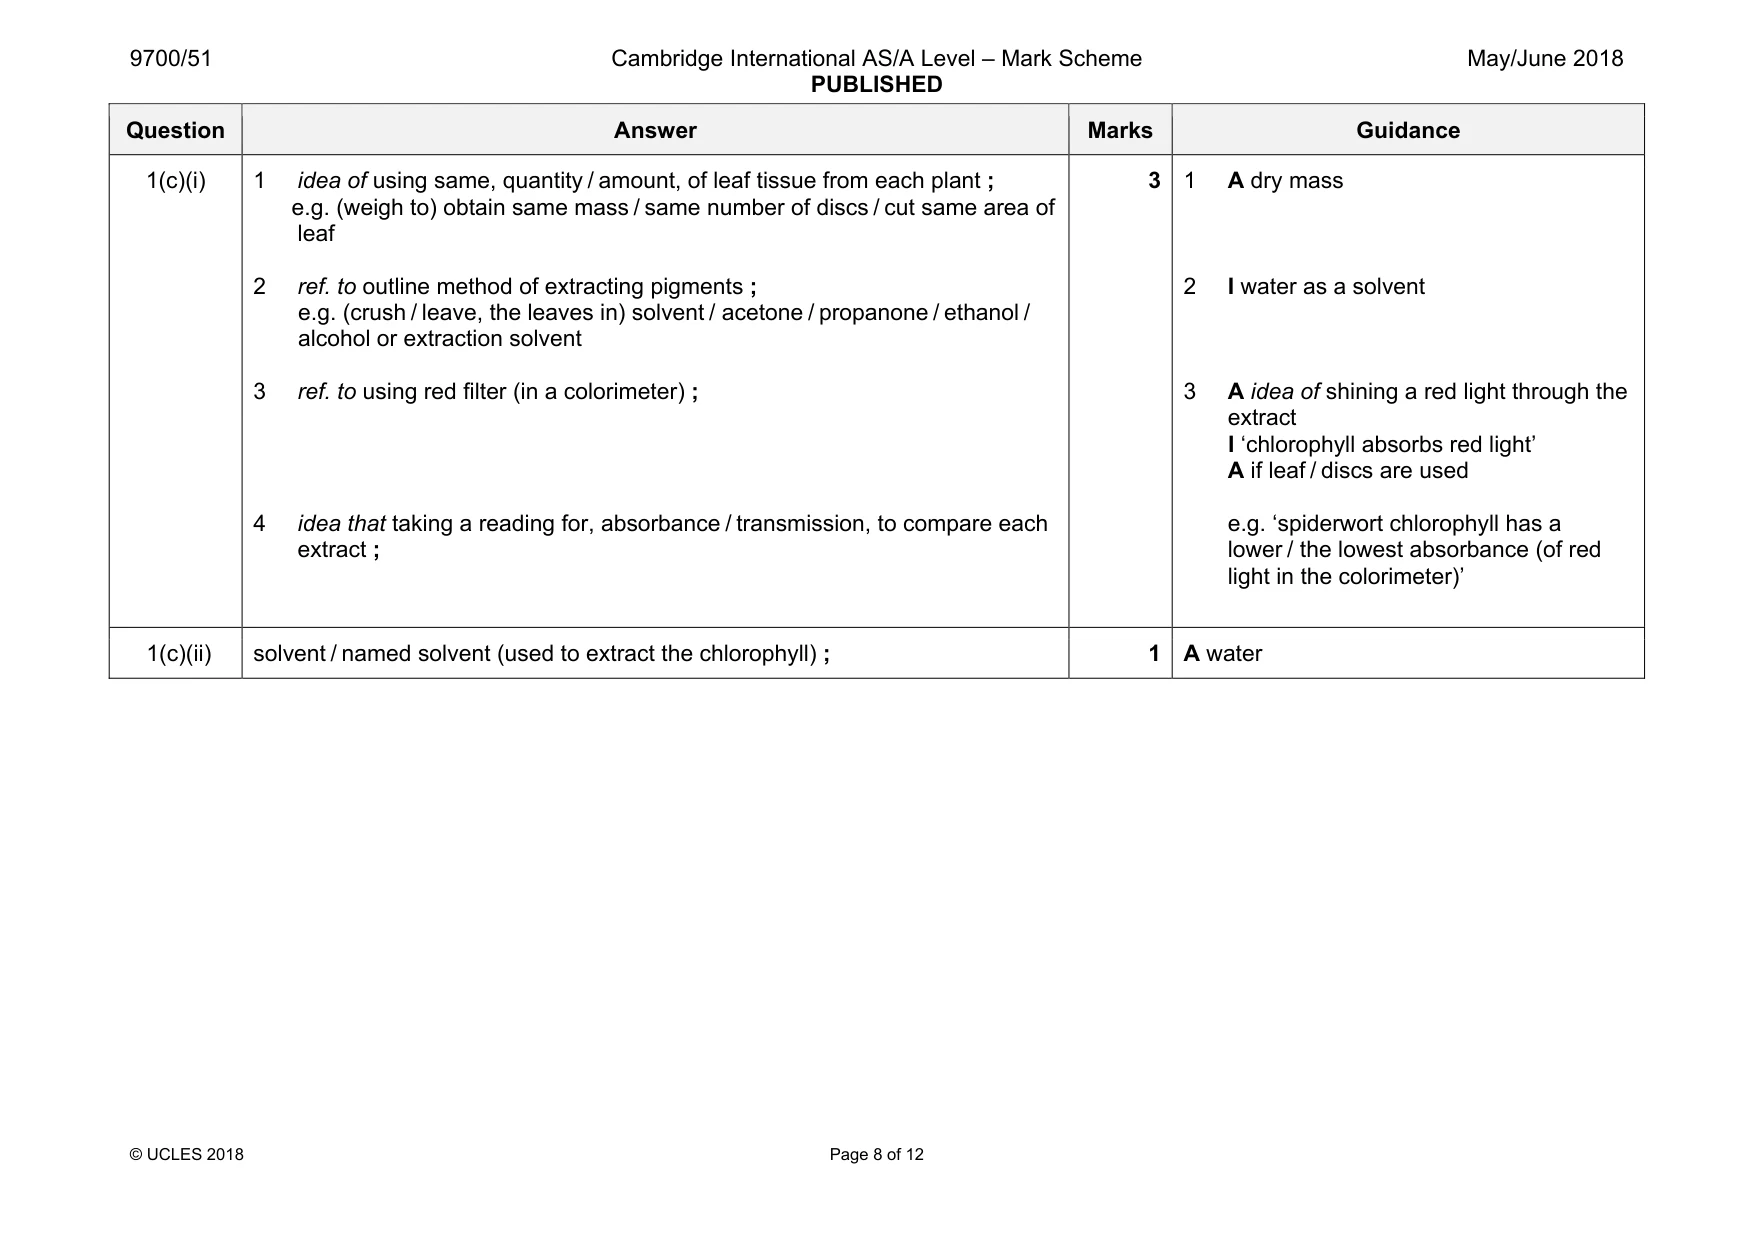
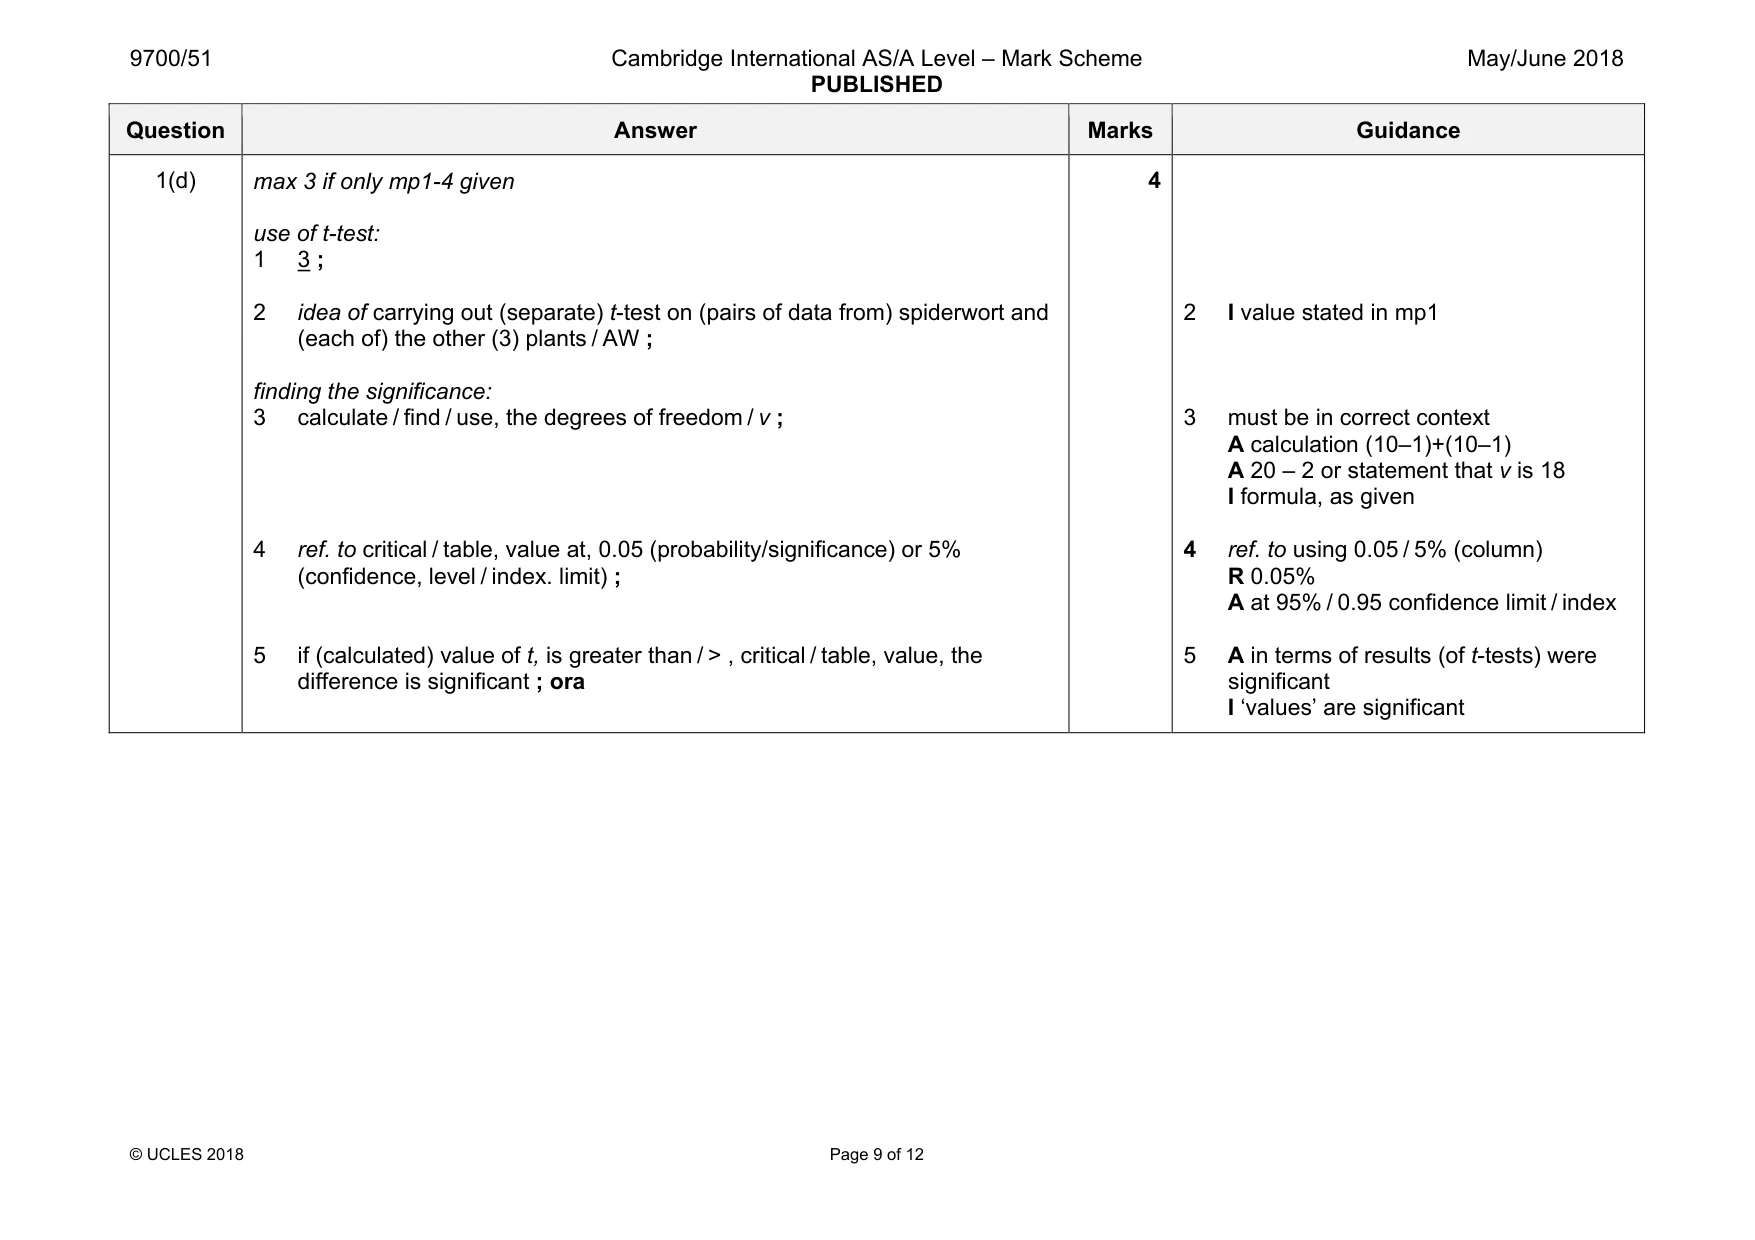
Mark scheme: 1(a)(i) independent variable: type of leaf / type of plant / type of disc / species (of plant) ; dependent variable: time for (leaf) discs to, rise to / reach, the surface / the top ; 2 I rate of photosynthesis 1(a)(ii) any 7 of: 1 ref. to a method of transferring leaf discs ; 2 same, height / volume / depth, of solution / NaHCO3, in beaker (for all leaf types) ; 3 use, timer / stop clock, to find time for leaf disc(s) to reach, surface / top ; 4 ref. to using same number of leaf discs (for all leaf types) ; 5 ref. to the same concentration of solution (for all leaf types) ; 6 ref. to standardising some aspect of the discs ; 7 max. 6 if critical step mp9 missing 1 e.g. forceps, glass rod, paint brush, tweezers 2 A other suitable containers e.g. syringe / boiling tube / test tube 3 A time for first leaf disc / all leaf discs / stated number of leaf discs / each one in a separate beaker R if different types of leaf in same beaker at same time 4 minimum of 3 6 e.g. same, size / diameter / age / position in leaf sampled Question Answer Marks Guidance 1(a)(ii) cont 7 ref. to keeping same light intensity ; 8 ref. to method for keeping temperature of solution constant ; critical step 9 start timer (immediately) when disc(s) reach bottom (of beaker) ; 10 low / medium, risk, experiment / investigation / procedure / assessment / AW ; 11 ref. to minimum of 3 readings (for at least one leaf type) and calculating a mean or excluding / identifying, anomalies ; 7 A methods that achieve same light intensity, e.g. lamp(s) at fixed distance / same wattage (bulbs) / variable resistor / dimmer 8 e.g. temperature-controlled room or chamber / environmental chamber / incubator / water-bath / thermostatic control I air conditioning / heat shield 10 R no risk I ‘low hazard’ experiment. A Allergy to leaves and wear, gloves / protective clothing A NaHCO3 is a mild skin irritant to and wear, gloves / protective clothing I ref. to water and electricity / care with cutting discs 11 A having at least 3 discs in one beaker A one disc in 3 separate beakers I average / average mean A mean average 1(b)(i) divide 1 by the time ; 1 A distance disc travels divided by time A divide 10 / 100 / 1000 by time I volume of oxygen divided by time Question Answer Marks Guidance 1(b)(ii) idea that: 1 leaves (with thick cuticles) may be heavier which will, increase time to rise / require more oxygen to raise them or cuticles, are transparent / do not affect light absorption or thick cuticle only on upper surface so light absorption via lower surface not affected or difference between spiderwort with thin cuticle and sorghum with thick cuticle, is small / may not be significant or leaves (with thick cuticles may) have fewer stomata so less gas exchange ; 2 the purple parts of the leaf may contain chlorophyll (which is hidden by the purple pigment) / cannot assume that the purple stripes do not contain chlorophyll or no actual data on the chlorophyll content or the purple pigments may also absorb light (idea of accessory pigments) or spiderwort rate, close to sorghum / faster than ivy, which does not have purple stripes ; 3 experiment carried out at, 20 °C / room / low temperature, and C4 plants / Sorghum, only efficient at high(er) temperatures / ora ; 3 1 A in terms of leaves being thicker A no evidence that thick cuticles reduce light absorption I ref. to no lower cuticle A with ref. to carbon dioxide in / oxygen out 2 A idea that green stripes are more chlorophyll dense (than other leaves) could relate to purple stripes or whole leaf Question Answer Marks Guidance 1(c)(i) 1 idea of using same, quantity / amount, of leaf tissue from each plant ; e.g. (weigh to) obtain same mass / same number of discs / cut same area of leaf 2 ref. to outline method of extracting pigments ; e.g. (crush / leave, the leaves in) solvent / acetone / propanone / ethanol / alcohol or extraction solvent 3 ref. to using red filter (in a colorimeter) ; 4 idea that taking a reading for, absorbance / transmission, to compare each extract ; 3 1 A dry mass 2 I water as a solvent 3 A idea of shining a red light through the extract I ‘chlorophyll absorbs red light’ A if leaf / discs are used e.g. ‘spiderwort chlorophyll has a lower / the lowest absorbance (of red light in the colorimeter)’ 1(c)(ii) solvent / named solvent (used to extract the chlorophyll) ; 1 A water Question Answer Marks Guidance 1(d) max 3 if only mp1-4 given use of t-test: 1 3 ; 2 idea of carrying out (separate) t-test on (pairs of data from) spiderwort and (each of) the other (3) plants / AW ; finding the significance: 3 calculate / find / use, the degrees of freedom / v ; 4 ref. to critical / table, value at, 0.05 (probability/significance) or 5% (confidence, level / index. limit) ; 5 if (calculated) value of t, is greater than / > , critical / table, value, the difference is significant ; ora 4 2 I value stated in mp1 3 must be in correct context A calculation (10–1)+(10–1) A 20 – 2 or statement that v is 18 I formula, as given 4 ref. to using 0.05 / 5% (column) R 0.05% A at 95% / 0.95 confidence limit / index 5 A in terms of results (of t-tests) were significant I ‘values’ are significant
Q2 · The red squirrel is a tree‑living mammal native to woodlands in the United Kingdom
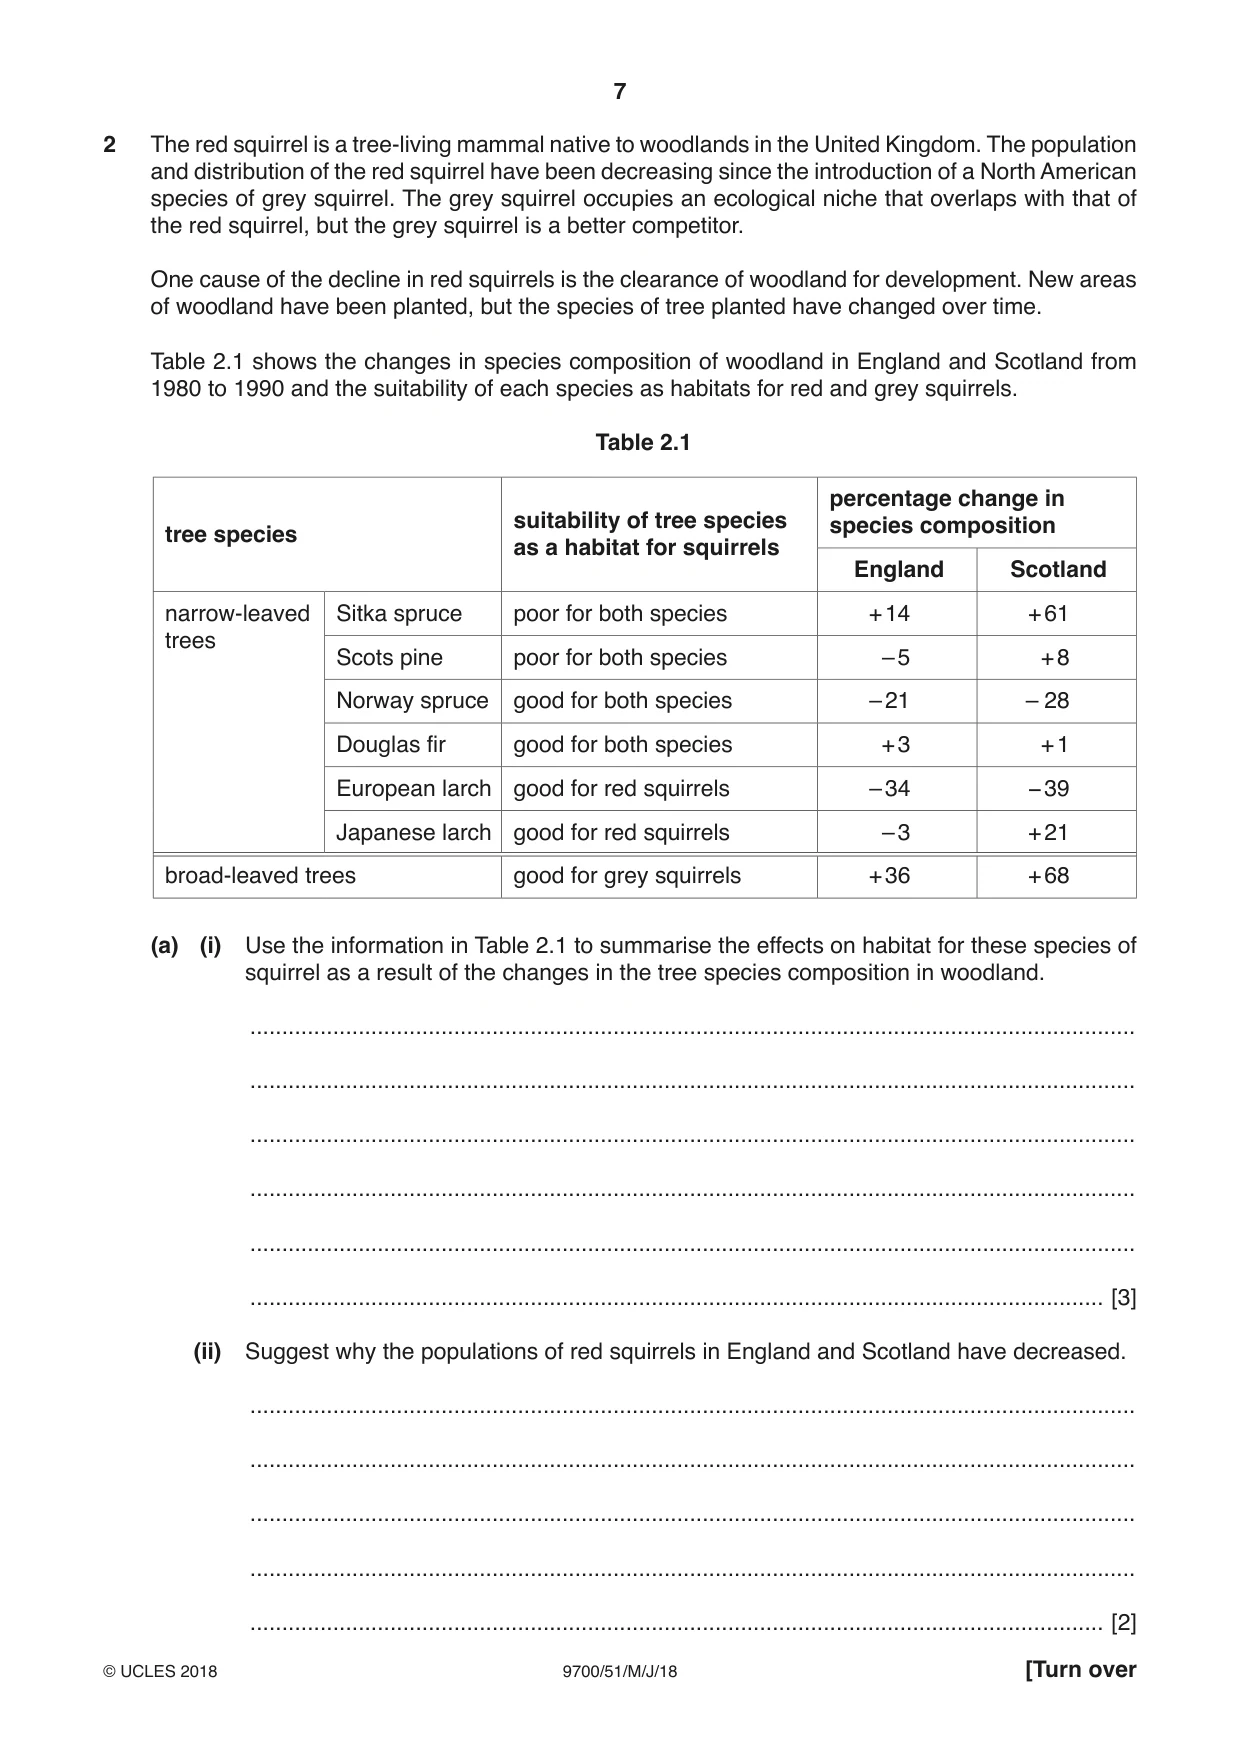
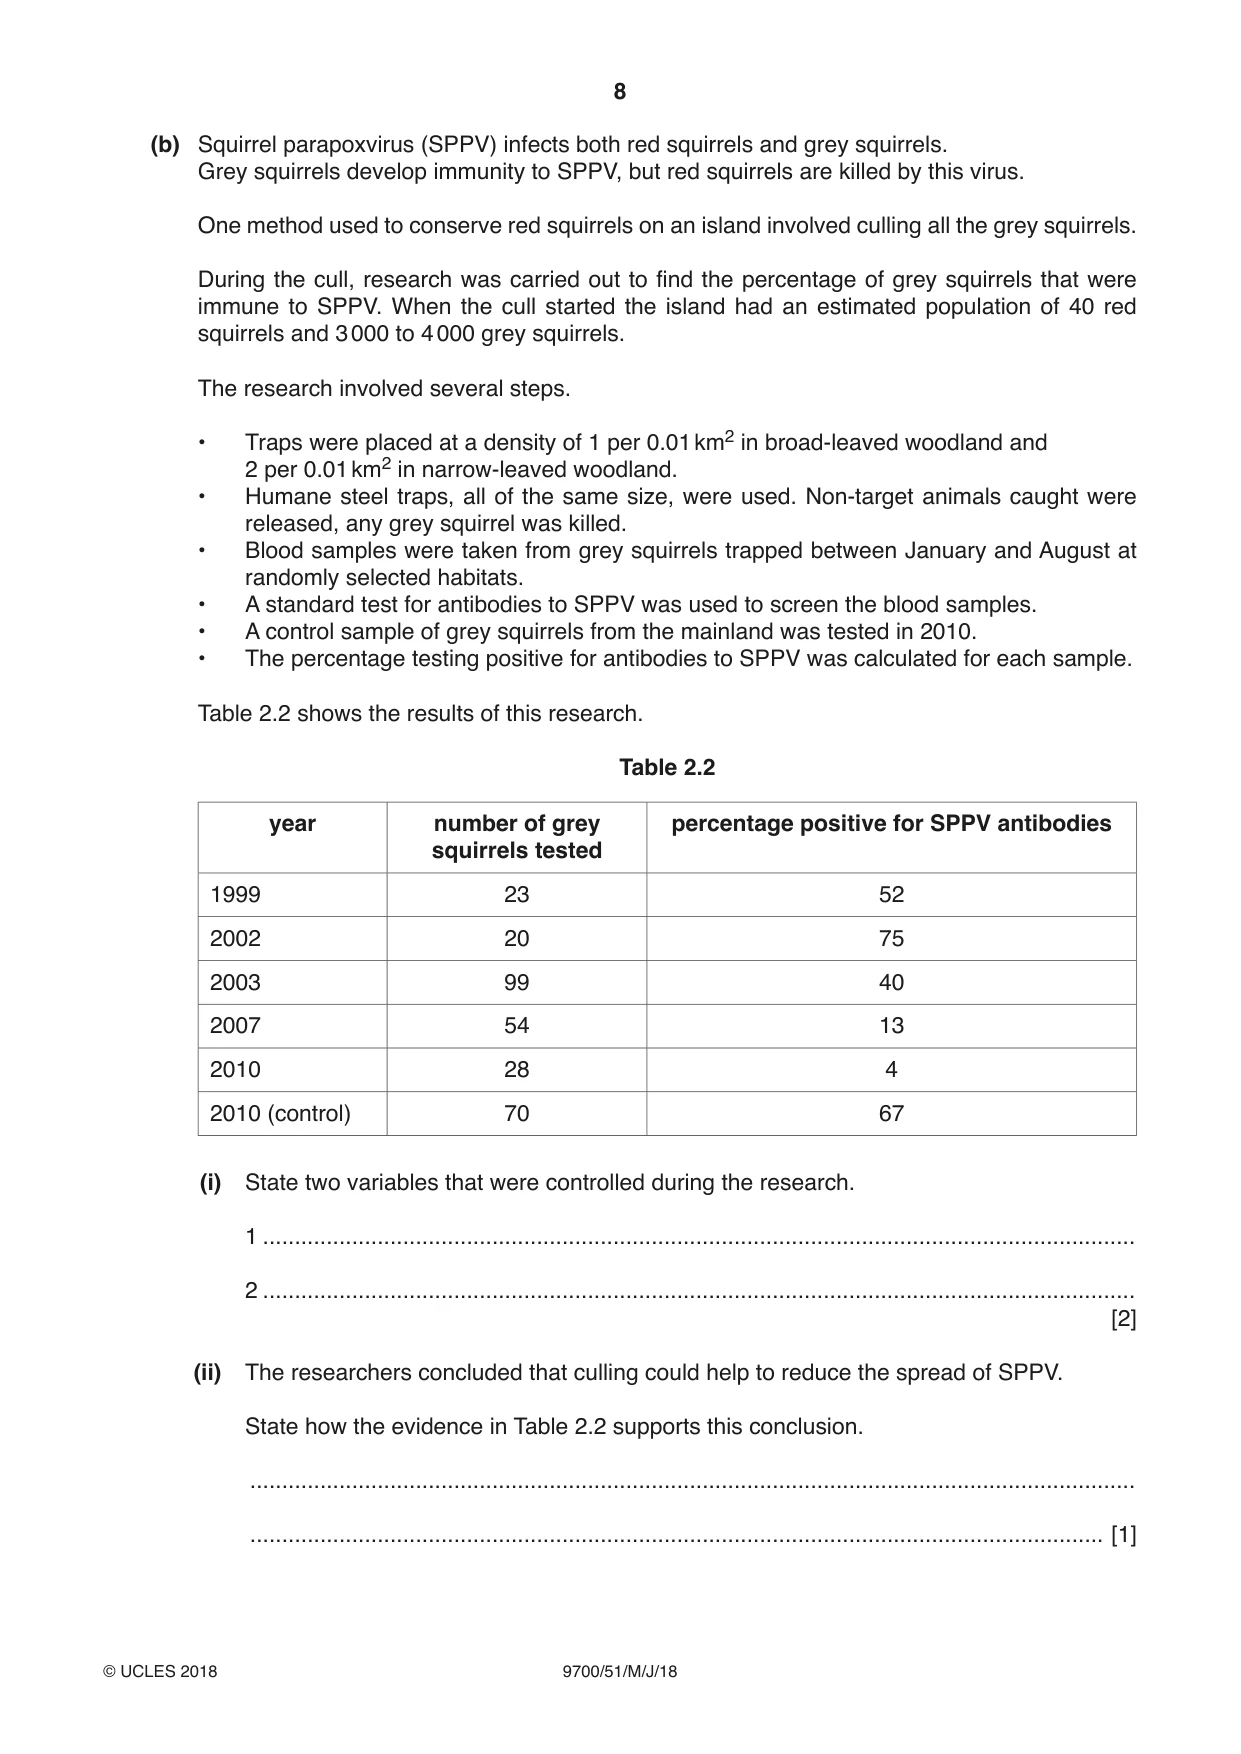
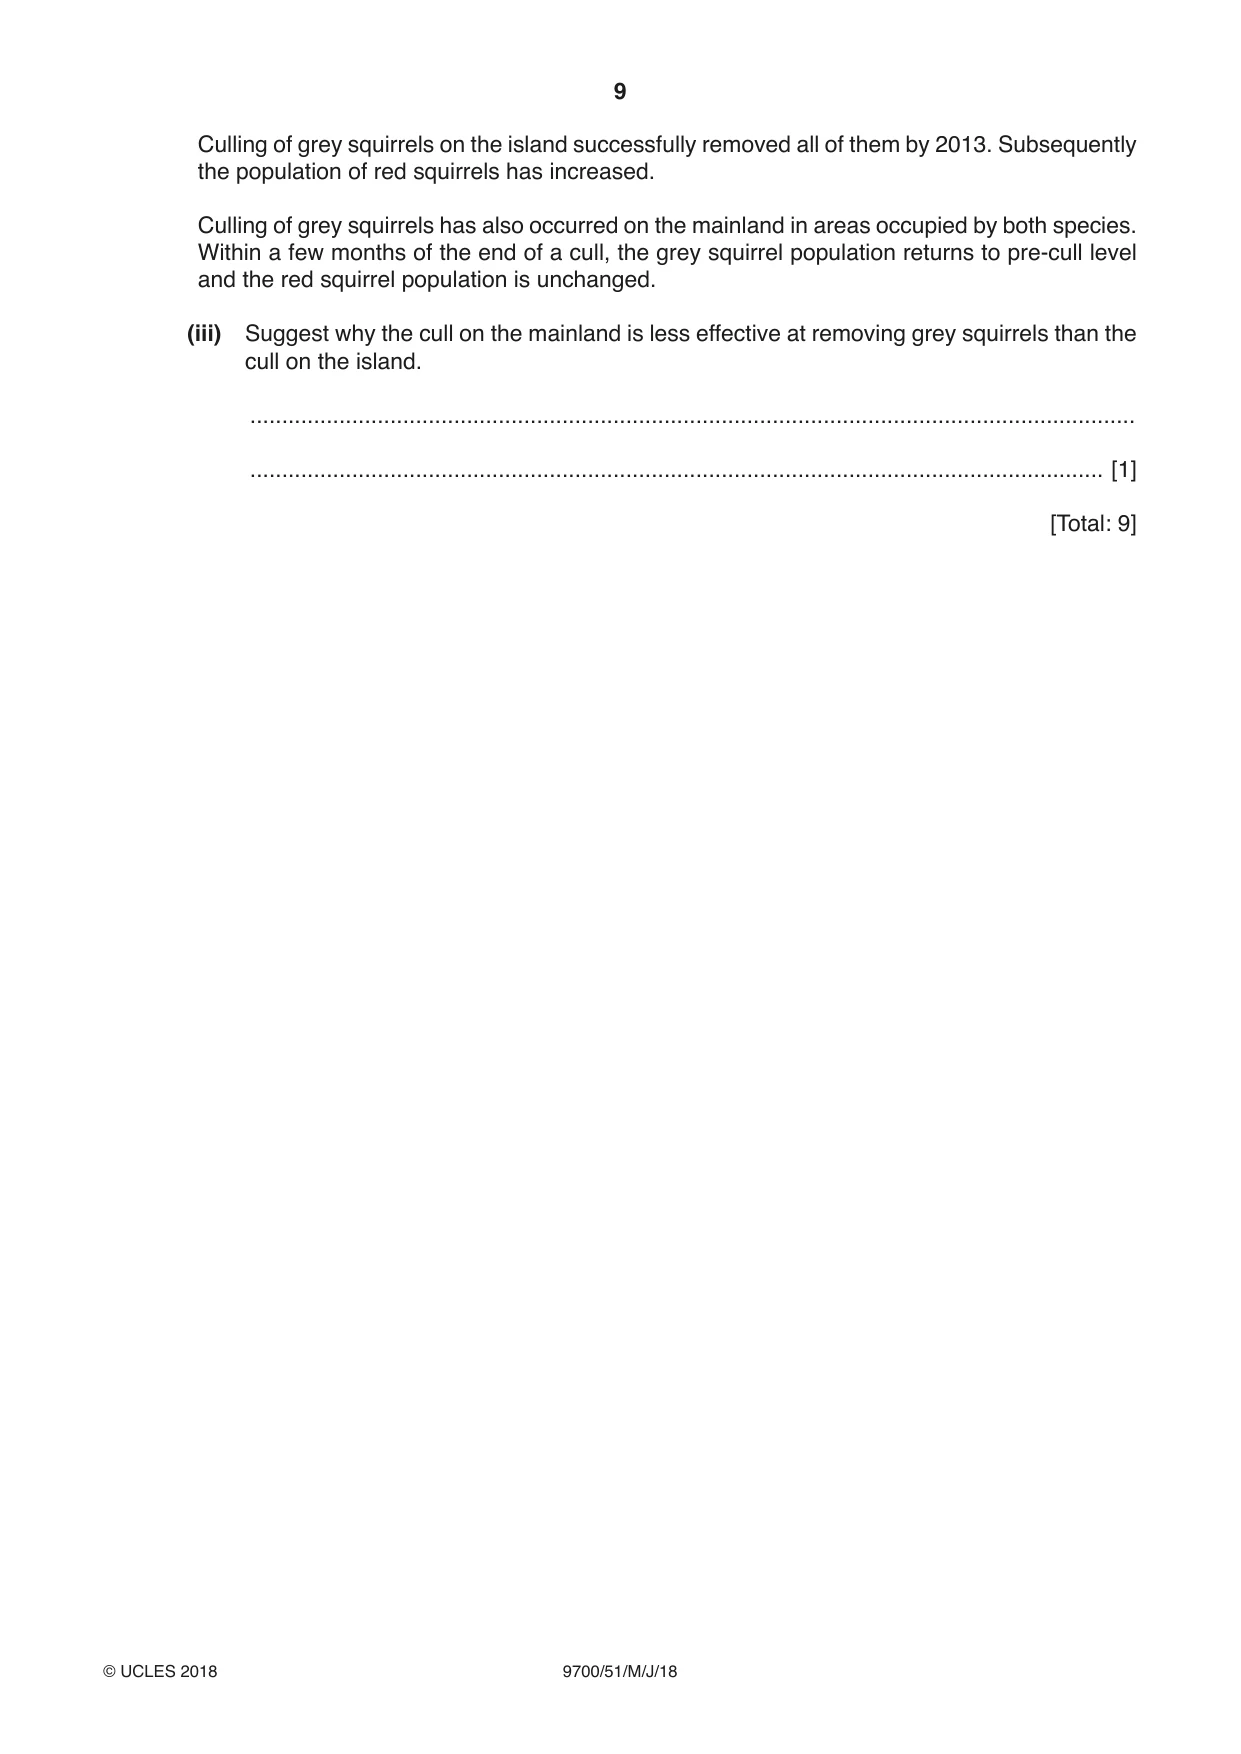
2 The red squirrel is a tree‑living mammal native to woodlands in the United Kingdom. The population and distribution of the red squirrel have been decreasing since the introduction of a North American species of grey squirrel. The grey squirrel occupies an ecological niche that overlaps with that of the red squirrel, but the grey squirrel is a better competitor. One cause of the decline in red squirrels is the clearance of woodland for development. New areas of woodland have been planted, but the species of tree planted have changed over time. Table 2.1 shows the changes in species composition of woodland in England and Scotland from 1980 to 1990 and the suitability of each species as habitats for red and grey squirrels. Table 2.1 percentage change in suitability of tree species species composition tree species as a habitat for squirrels England Scotland narrow‑leaved Sitka spruce poor for both species + 14 + 61 trees Scots pine poor for both species – 5 + 8 Norway spruce good for both species – 21 – 28 Douglas fir good for both species + 3 + 1 European larch good for red squirrels – 34 − 39 Japanese larch good for red squirrels – 3 + 21 broad‑leaved trees good for grey squirrels + 36 + 68 (a) (i) Use the information in Table 2.1 to summarise the effects on habitat for these species of squirrel as a result of the changes in the tree species composition in woodland. ........................................................................................................................................... ........................................................................................................................................... ........................................................................................................................................... ........................................................................................................................................... ........................................................................................................................................... ...................................................................................................................................... [3] (ii) Suggest why the populations of red squirrels in England and Scotland have decreased. ........................................................................................................................................... ........................................................................................................................................... ........................................................................................................................................... ........................................................................................................................................... ...................................................................................................................................... [2] (b) Squirrel parapoxvirus (SPPV) infects both red squirrels and grey squirrels. Grey squirrels develop immunity to SPPV, but red squirrels are killed by this virus. One method used to conserve red squirrels on an island involved culling all the grey squirrels. During the cull, research was carried out to find the percentage of grey squirrels that were immune to SPPV. When the cull started the island had an estimated population of 40 red squirrels and 3 000 to 4 000 grey squirrels. The research involved several steps. • Traps were placed at a density of 1 per 0.01 km2 in broad‑leaved woodland and 2 per 0.01 km2 in narrow‑leaved woodland. • Humane steel traps, all of the same size, were used. Non‑target animals caught were released, any grey squirrel was killed. • Blood samples were taken from grey squirrels trapped between January and August at randomly selected habitats. • A standard test for antibodies to SPPV was used to screen the blood samples. • A control sample of grey squirrels from the mainland was tested in 2010. • The percentage testing positive for antibodies to SPPV was calculated for each sample. Table 2.2 shows the results of this research. Table 2.2 year number of grey percentage positive for SPPV antibodies squirrels tested 1999 23 52 2002 20 75 2003 99 40 2007 54 13 2010 28 4 2010 (control) 70 67 (i) State two variables that were controlled during the research. 1 ......................................................................................................................................... 2 ......................................................................................................................................... [2] (ii) The researchers concluded that culling could help to reduce the spread of SPPV. State how the evidence in Table 2.2 supports this conclusion. ........................................................................................................................................... ...................................................................................................................................... [1] Culling of grey squirrels on the island successfully removed all of them by 2013. Subsequently the population of red squirrels has increased. Culling of grey squirrels has also occurred on the mainland in areas occupied by both species. Within a few months of the end of a cull, the grey squirrel population returns to pre‑cull level and the red squirrel population is unchanged. (iii) Suggest why the cull on the mainland is less effective at removing grey squirrels than the cull on the island. ........................................................................................................................................... ...................................................................................................................................... [1] [Total: 9]
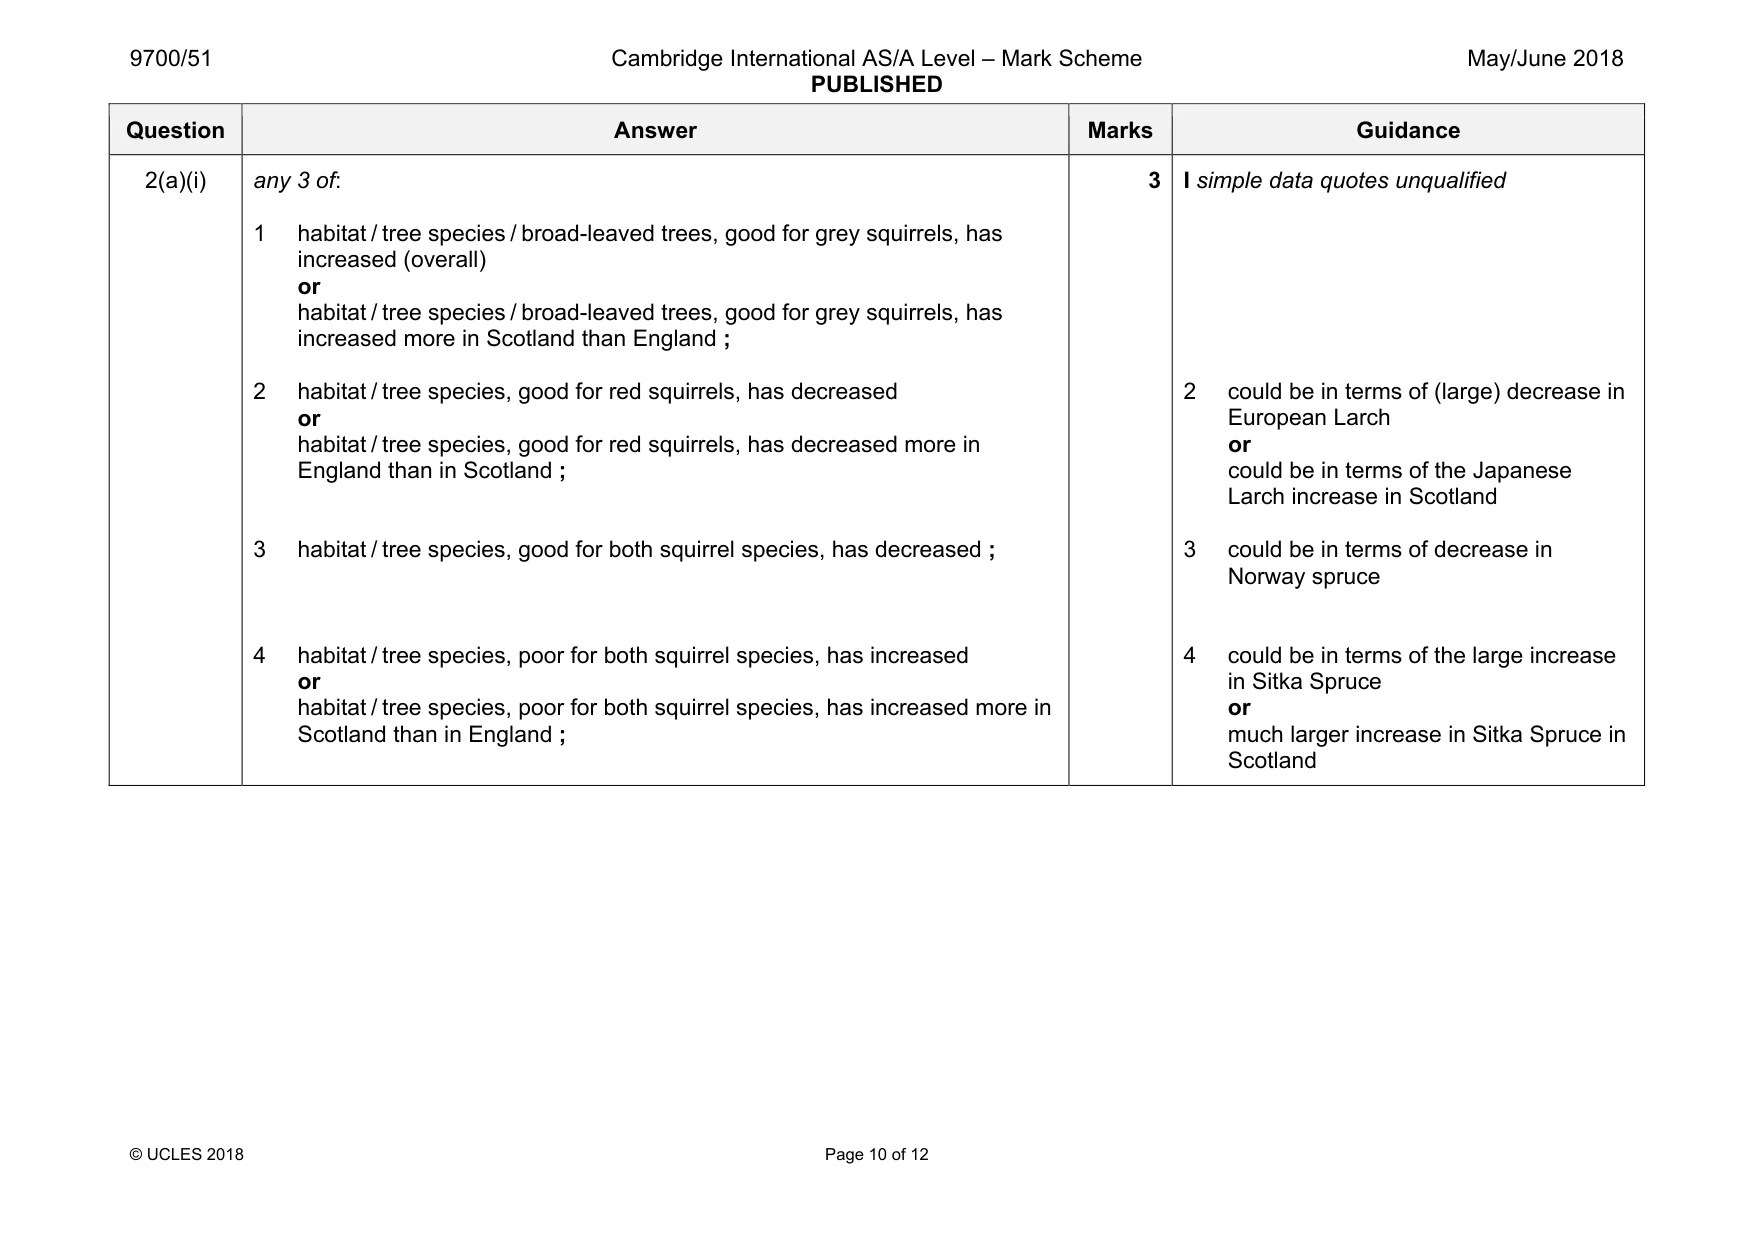
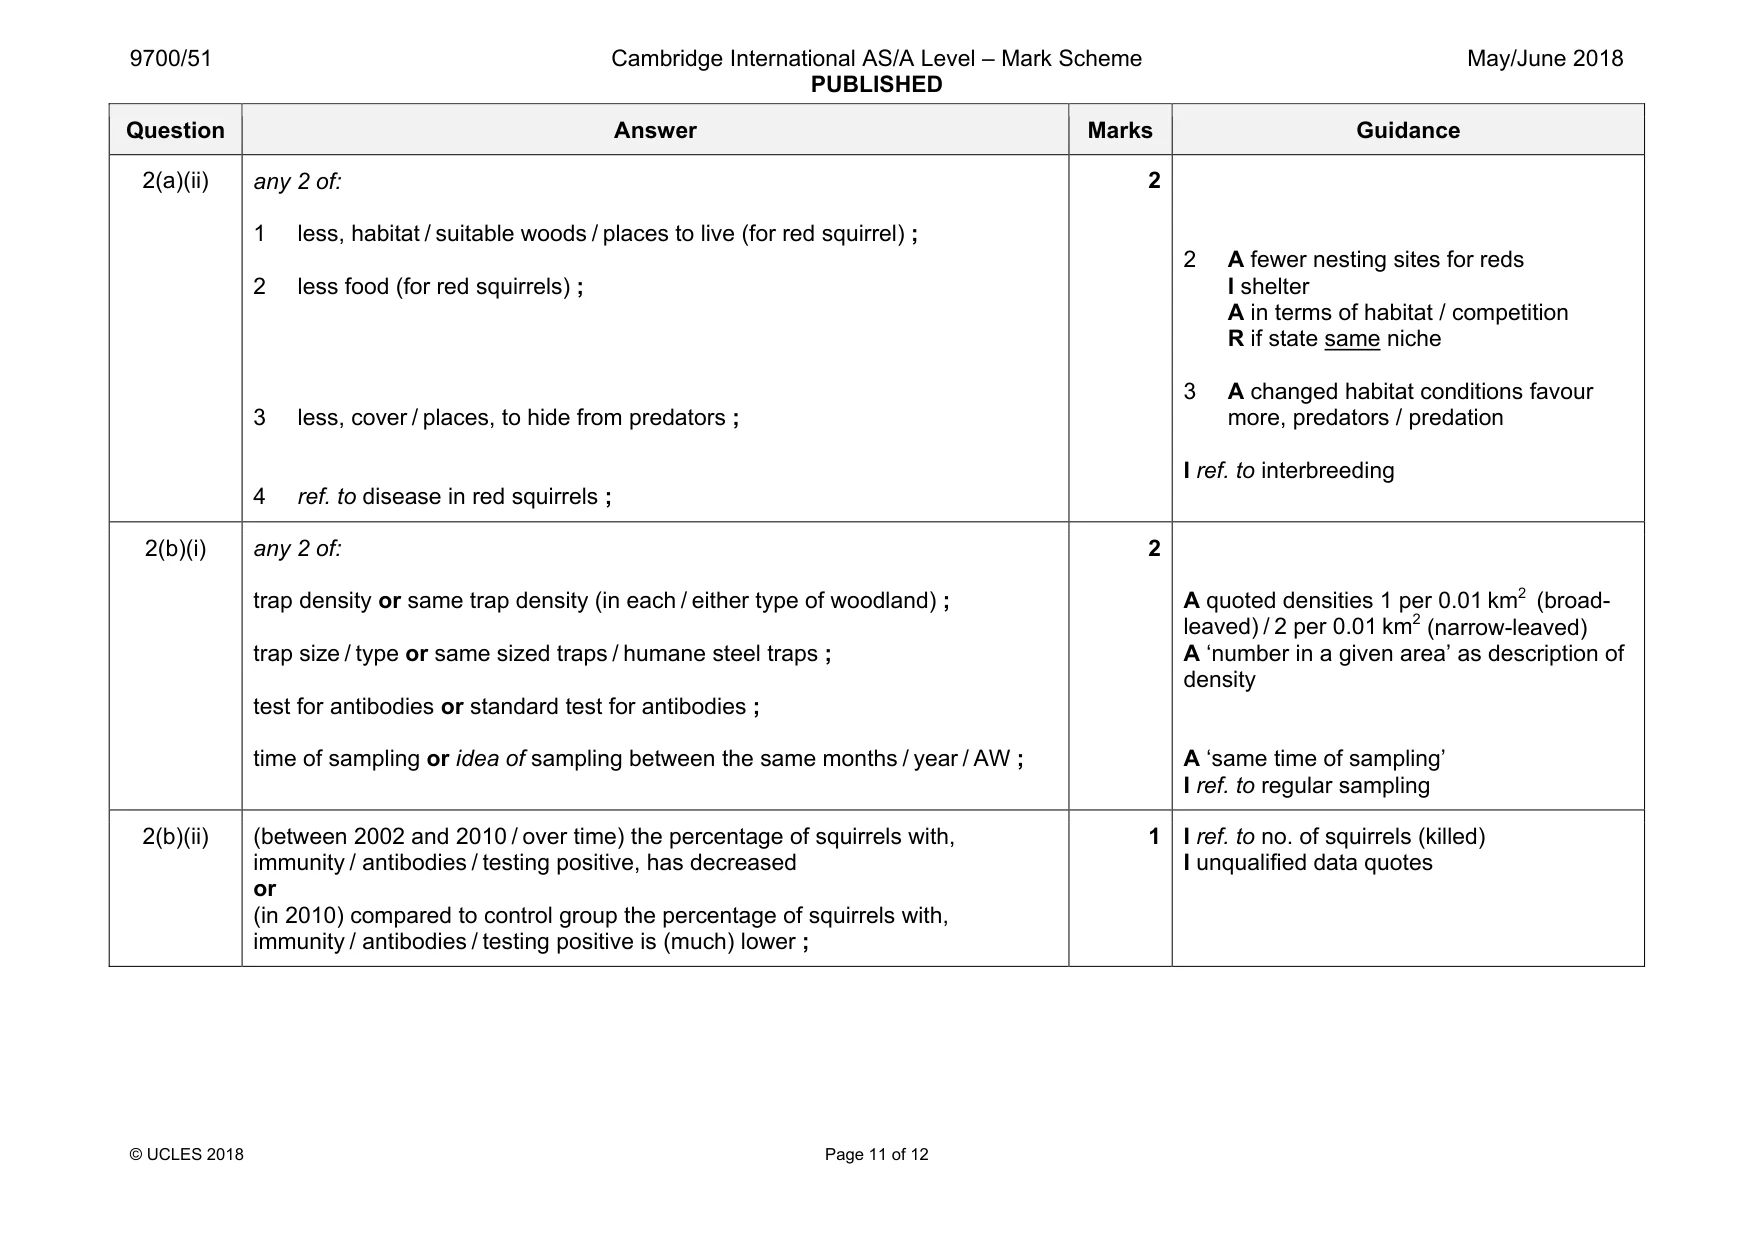
Mark scheme: 2(a)(i) any 3 of: 1 habitat / tree species / broad-leaved trees, good for grey squirrels, has increased (overall) or habitat / tree species / broad-leaved trees, good for grey squirrels, has increased more in Scotland than England ; 2 habitat / tree species, good for red squirrels, has decreased or habitat / tree species, good for red squirrels, has decreased more in England than in Scotland ; 3 habitat / tree species, good for both squirrel species, has decreased ; 4 habitat / tree species, poor for both squirrel species, has increased or habitat / tree species, poor for both squirrel species, has increased more in Scotland than in England ; 3 I simple data quotes unqualified 2 could be in terms of (large) decrease in European Larch or could be in terms of the Japanese Larch increase in Scotland 3 could be in terms of decrease in Norway spruce 4 could be in terms of the large increase in Sitka Spruce or much larger increase in Sitka Spruce in Scotland Question Answer Marks Guidance 2(a)(ii) any 2 of: 1 less, habitat / suitable woods / places to live (for red squirrel) ; 2 less food (for red squirrels) ; 3 less, cover / places, to hide from predators ; 4 ref. to disease in red squirrels ; 2 2 A fewer nesting sites for reds I shelter A in terms of habitat / competition R if state same niche 3 A changed habitat conditions favour more, predators / predation I ref. to interbreeding 2(b)(i) any 2 of: trap density or same trap density (in each / either type of woodland) ; trap size / type or same sized traps / humane steel traps ; test for antibodies or standard test for antibodies ; time of sampling or idea of sampling between the same months / year / AW ; 2 A quoted densities 1 per 0.01 km2 (broad- leaved) / 2 per 0.01 km2 (narrow-leaved) A ‘number in a given area’ as description of density A ‘same time of sampling’ I ref. to regular sampling 2(b)(ii) (between 2002 and 2010 / over time) the percentage of squirrels with, immunity / antibodies / testing positive, has decreased or (in 2010) compared to control group the percentage of squirrels with, immunity / antibodies / testing positive is (much) lower ; 1 I ref. to no. of squirrels (killed) I unqualified data quotes Question Answer Marks Guidance 2(b)(iii) idea that on the mainland the squirrels can (rapidly) re-invade or idea that the mainland area, will be larger / has more areas to ‘hide’, so less easy to remove them (all) / so more survive post cull or idea that survivors post cull provide a breeding population to build up the population (rapidly) ; 1 A ora throughout A in terms of no barrier to the migration of the grey squirrels A in terms of idea of (red) squirrels being isolated on the island
What was in this paper
The subtopics covered by these 2 questions, and how many questions each got. Open one in a new tab to see every Cambridge question on it.
What you needed in this session
Cambridge’s own grade thresholds for 2018 May/June, Paper 5 · Variant 1. A higher threshold means an easier paper — the bar moves with how the cohort did.