Cambridge A Level Biology 9700 — 2021 May/June Paper 3 · Variant 2
9700/32/M/J/21 · 2 questions · 40 marks · ≈45 min
The question paper and its mark scheme, free to read here and free to download. This is Cambridge’s own paper, exactly as it was sat.
Question paper16 pages



Mark scheme7 pages
Answers below. Sit the paper first if you are practising.
Questions as text
Q1 · The enzyme amylase breaks down starch to form reducing sugars
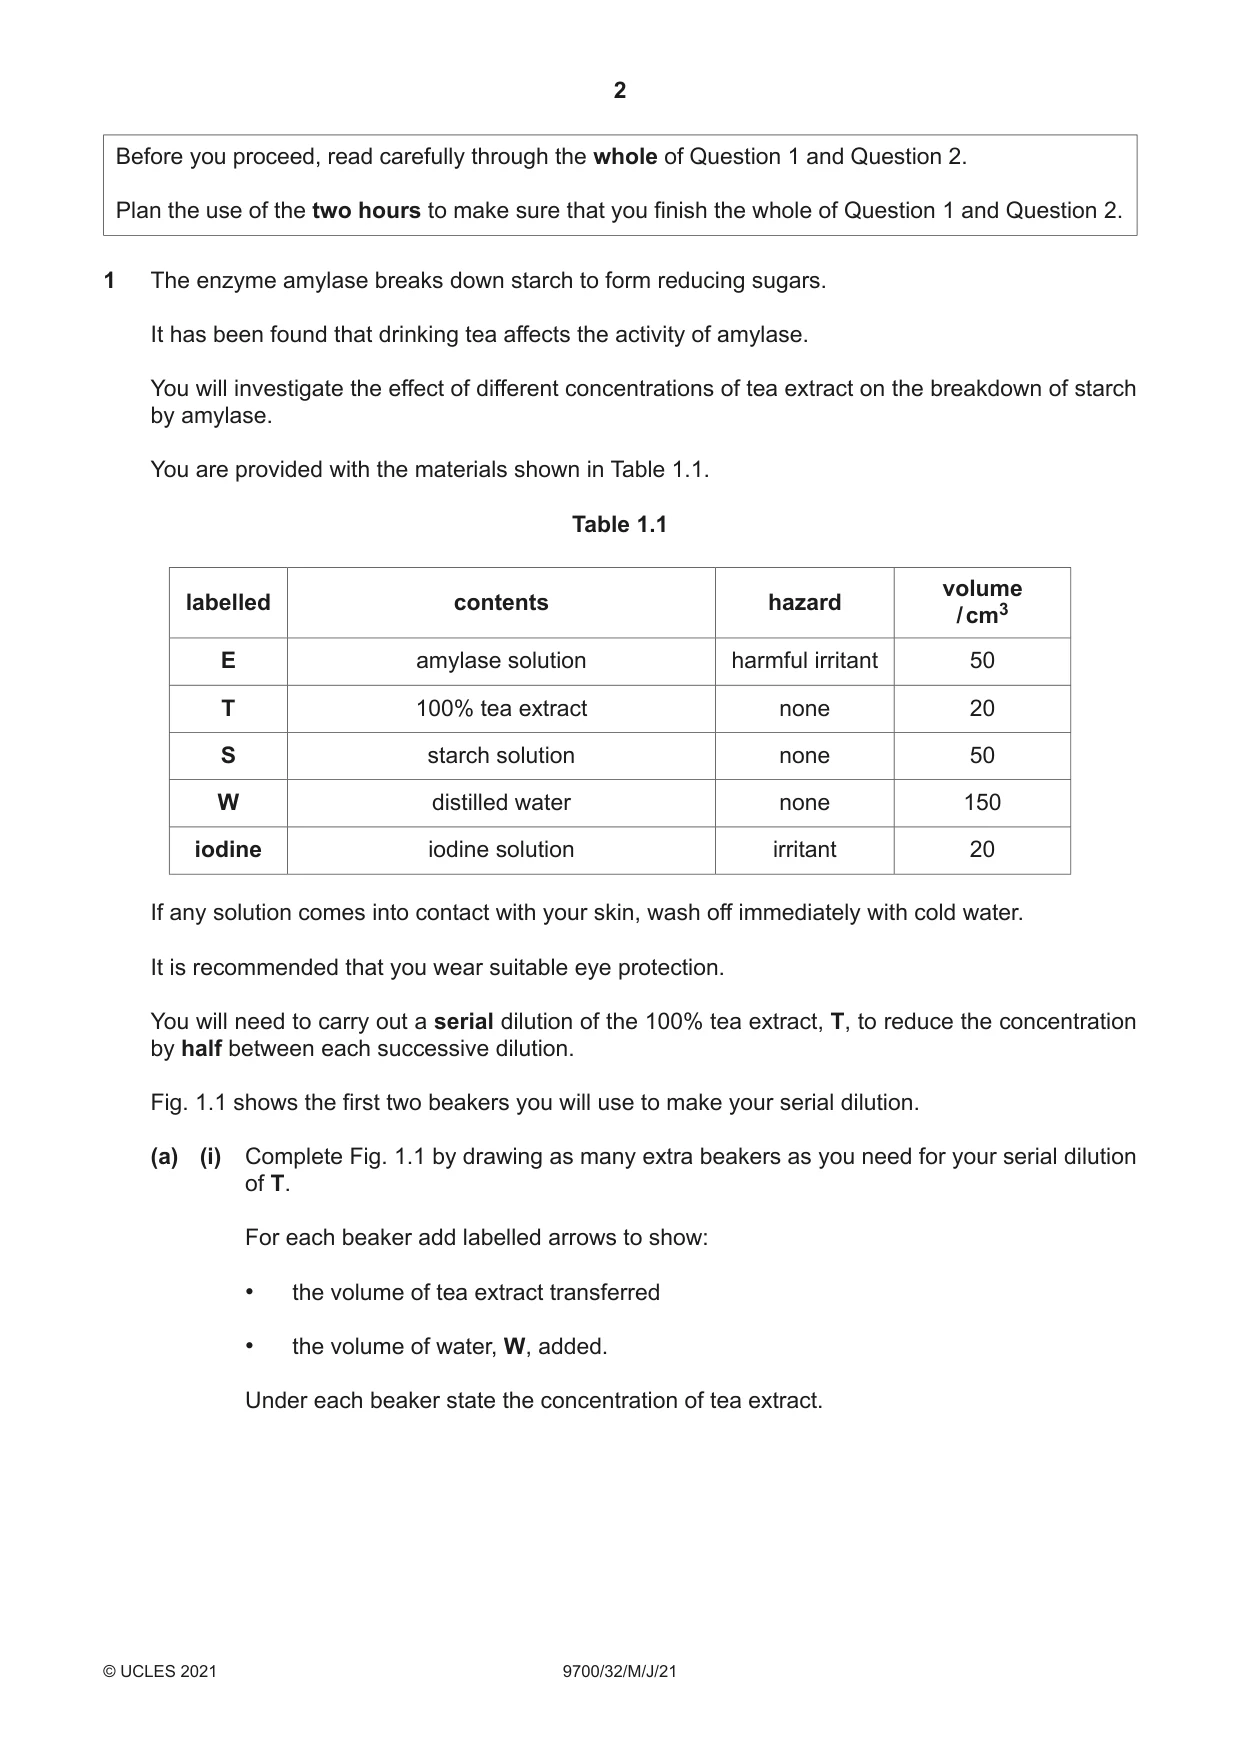
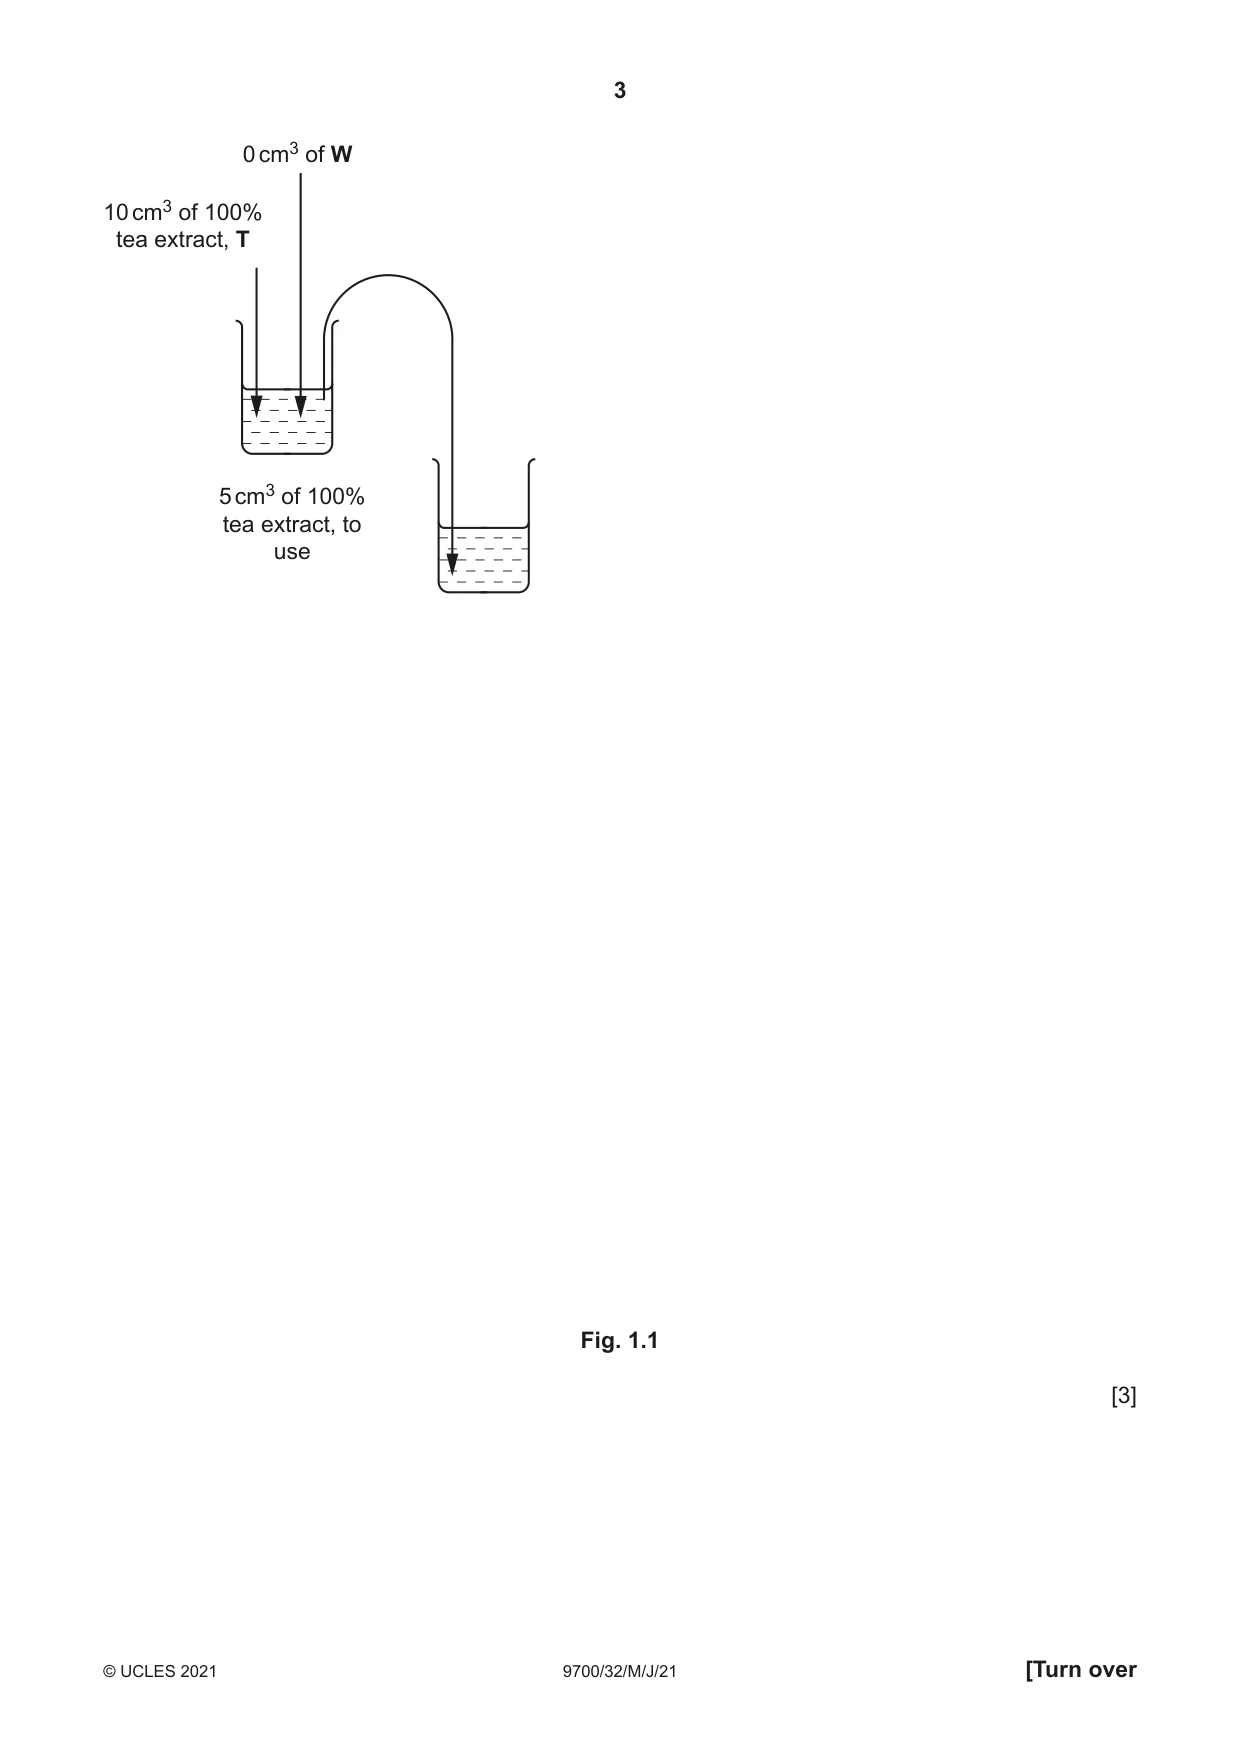
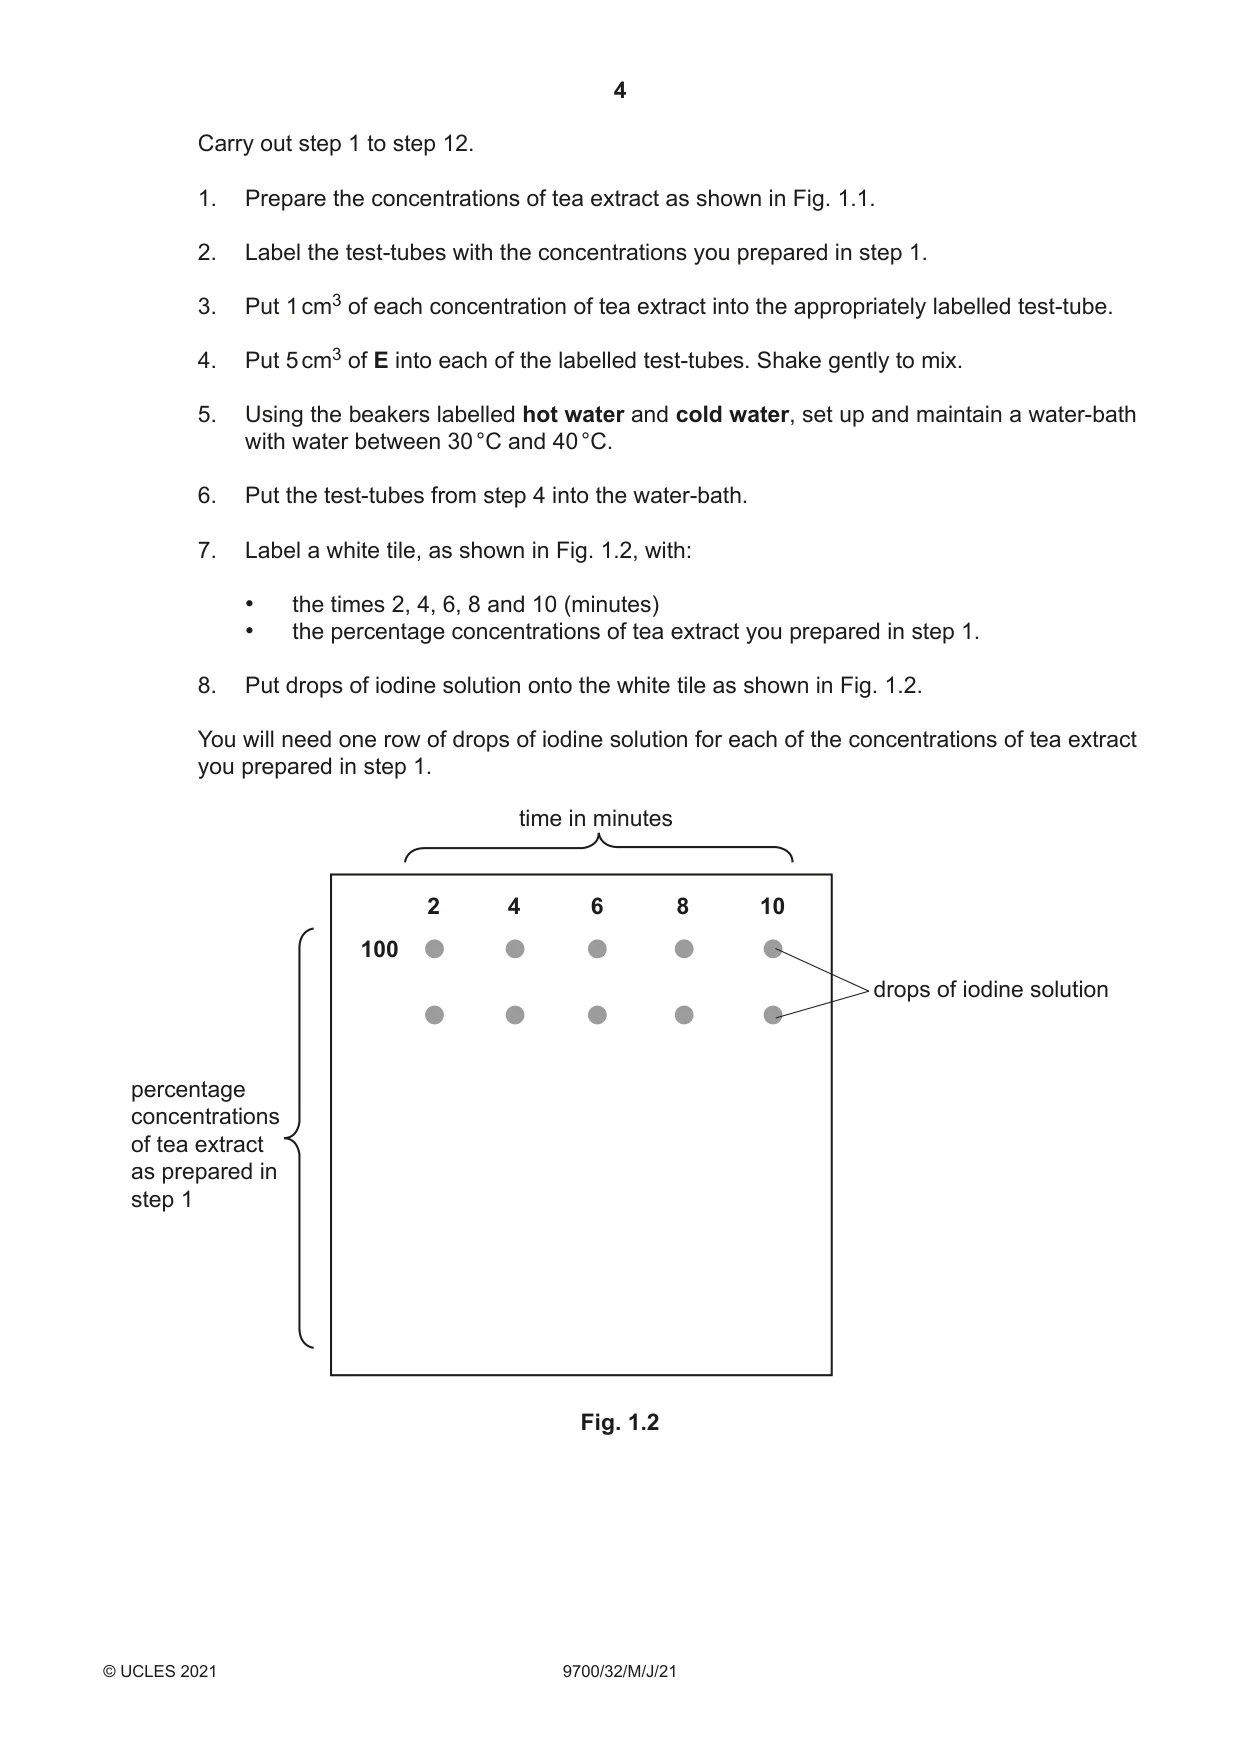
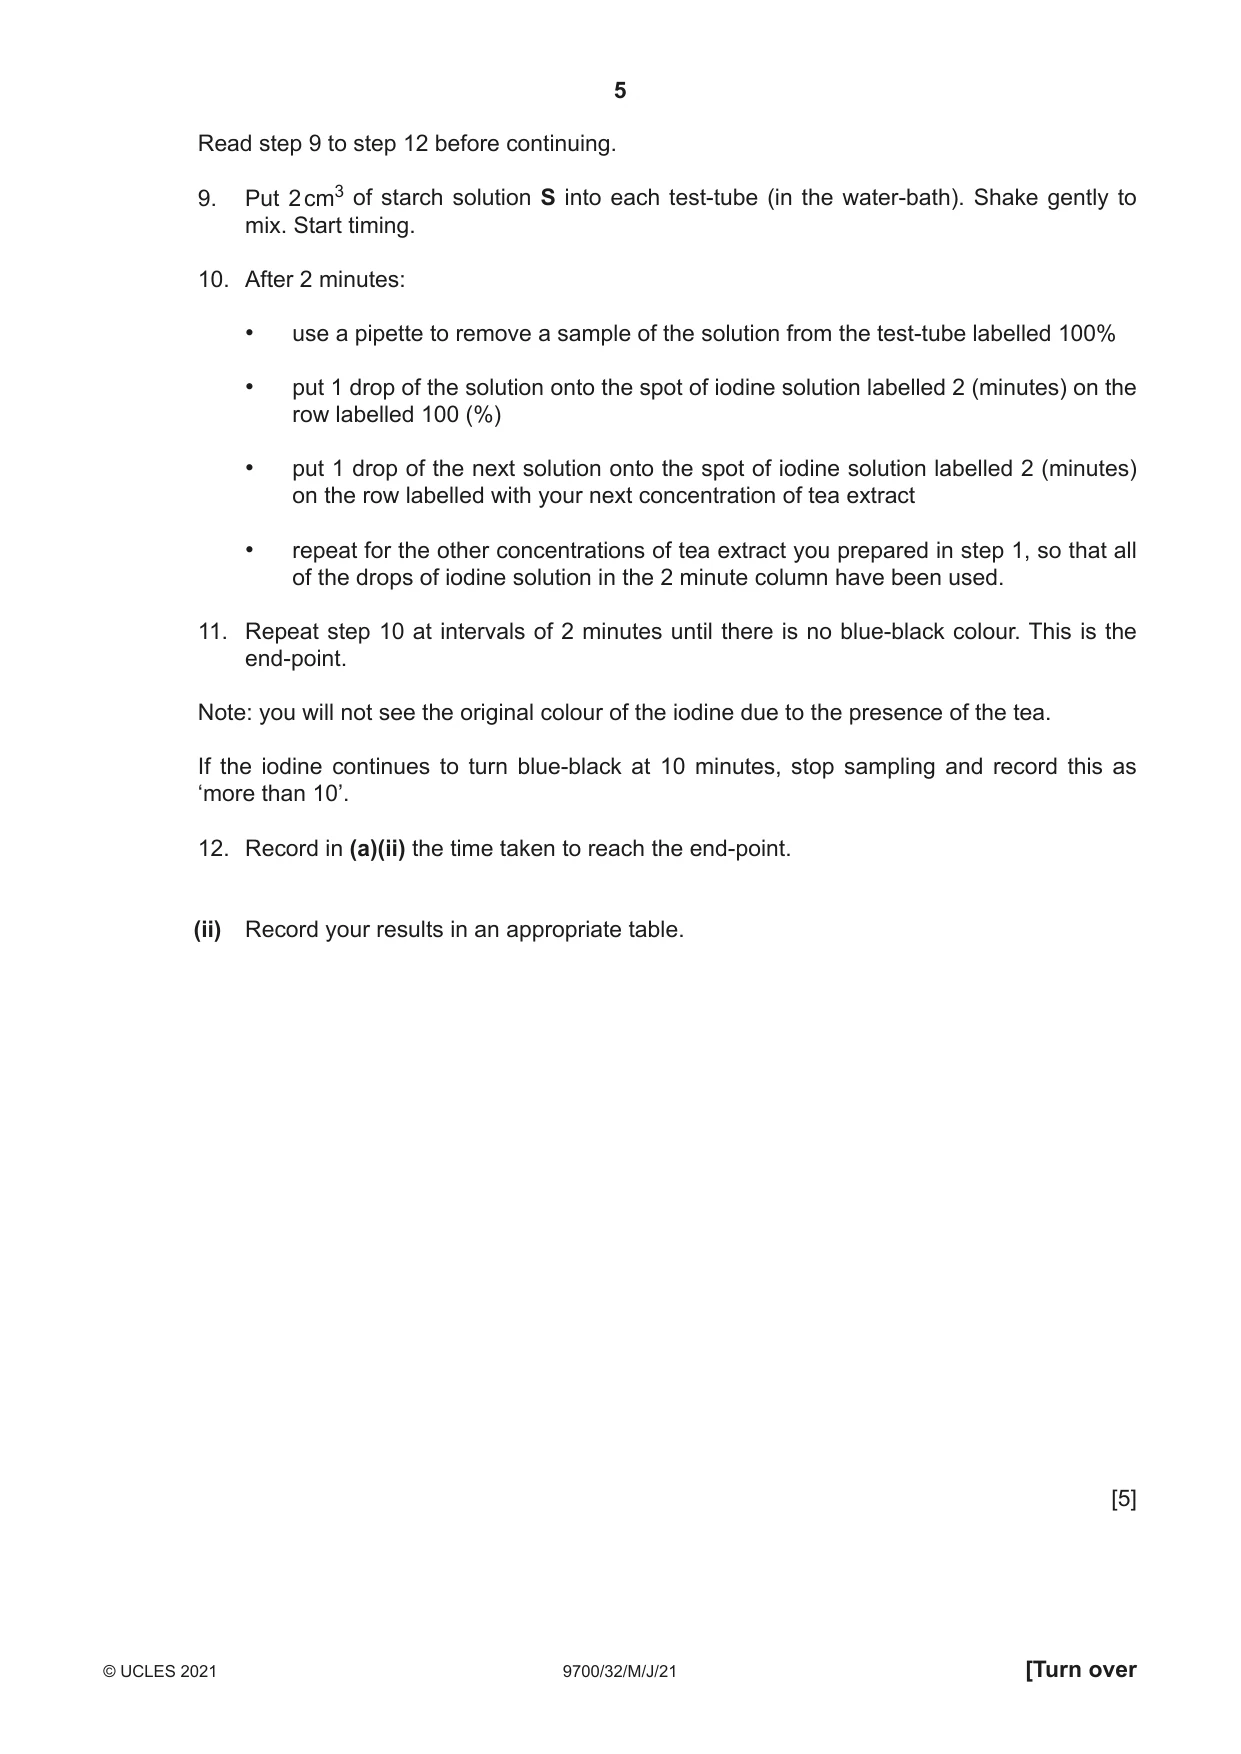
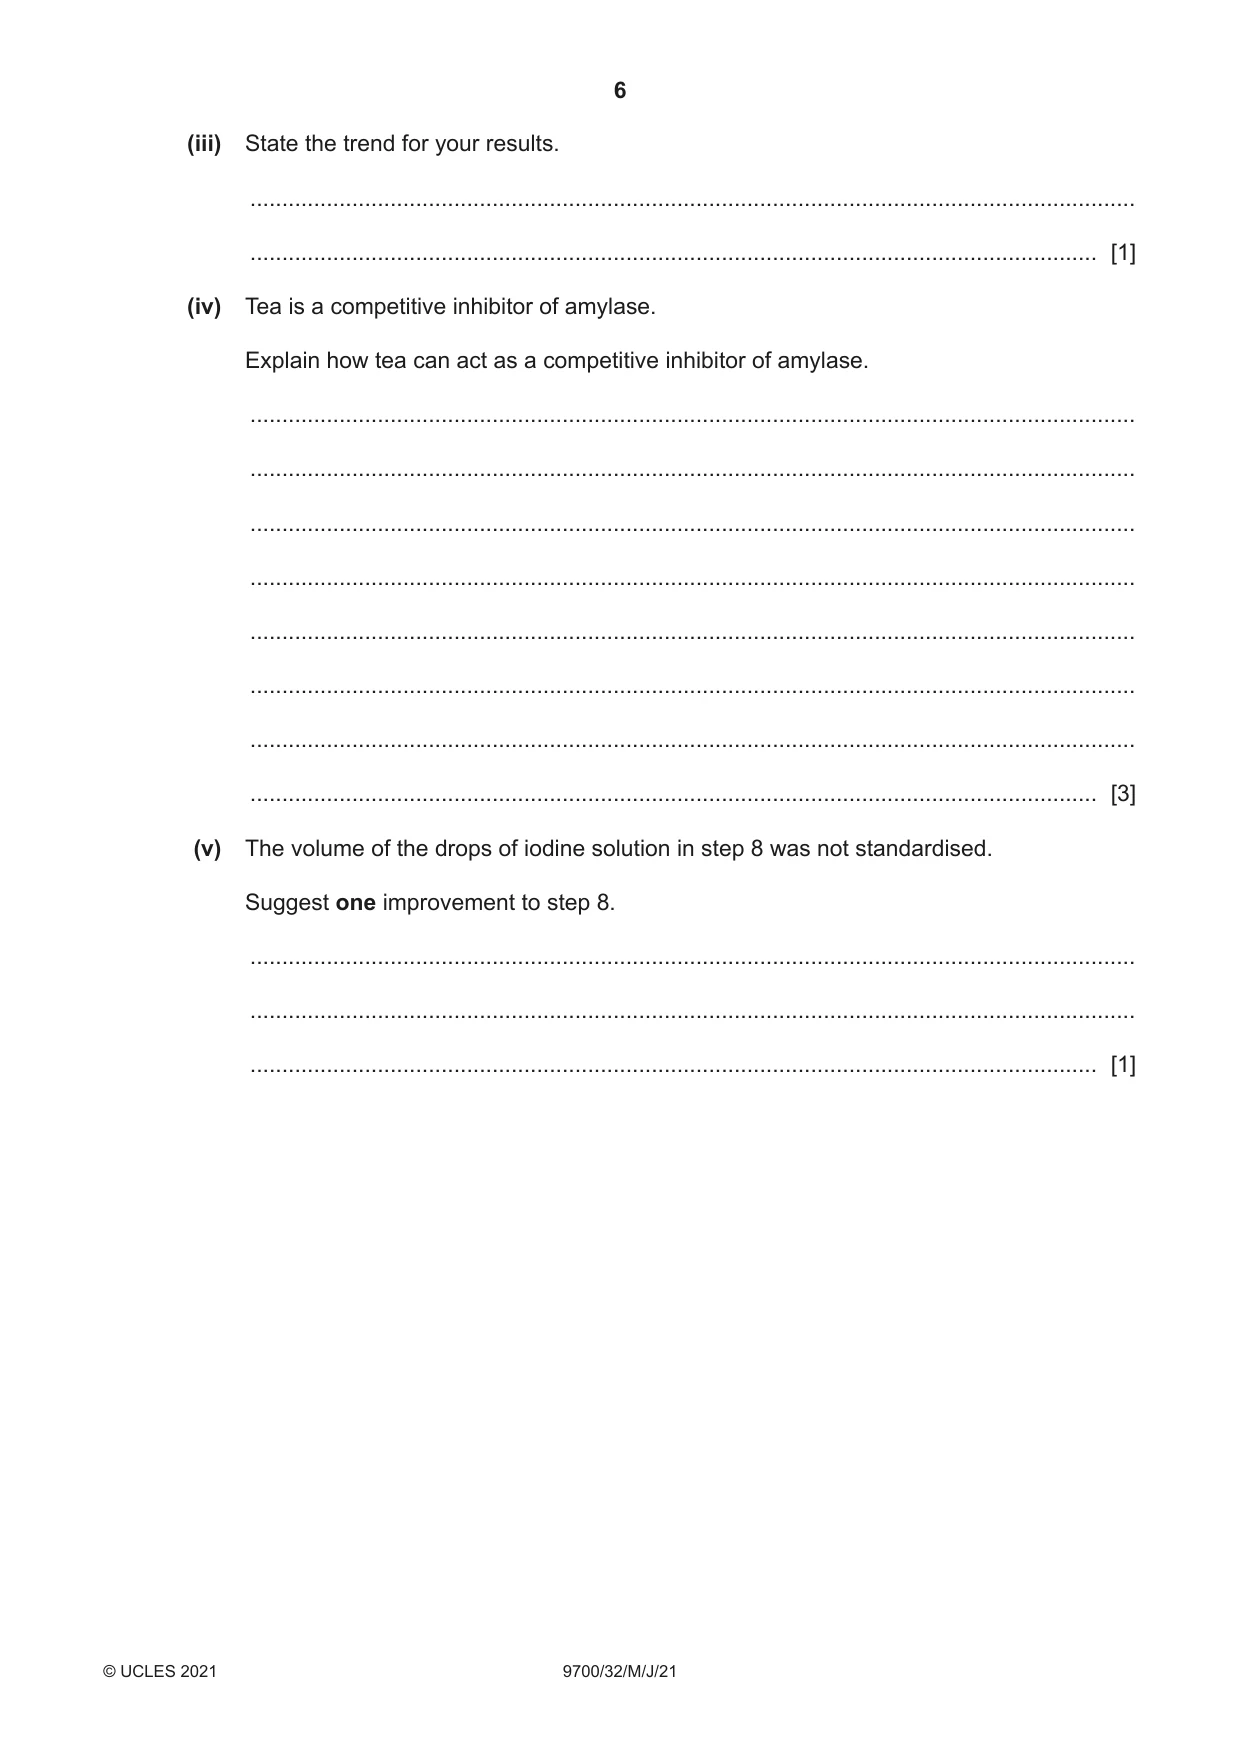
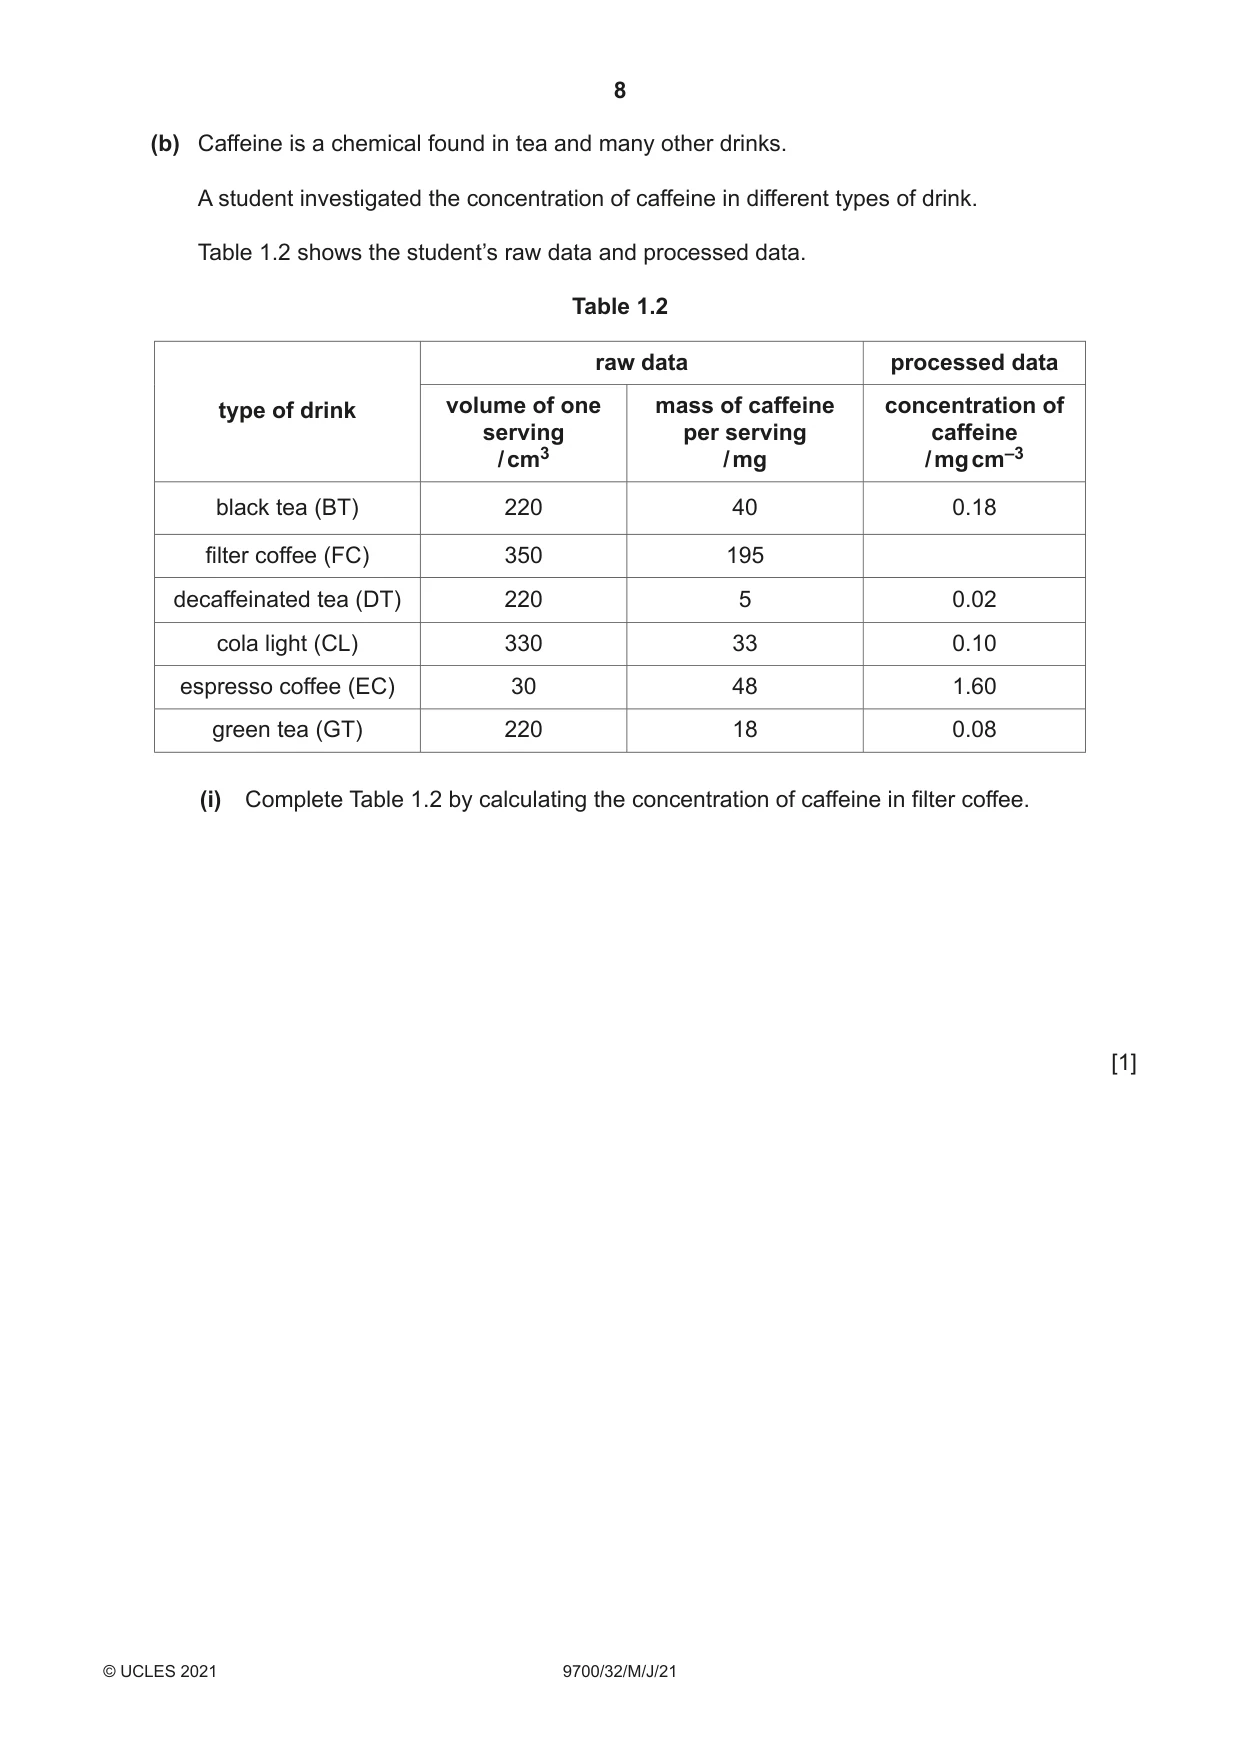
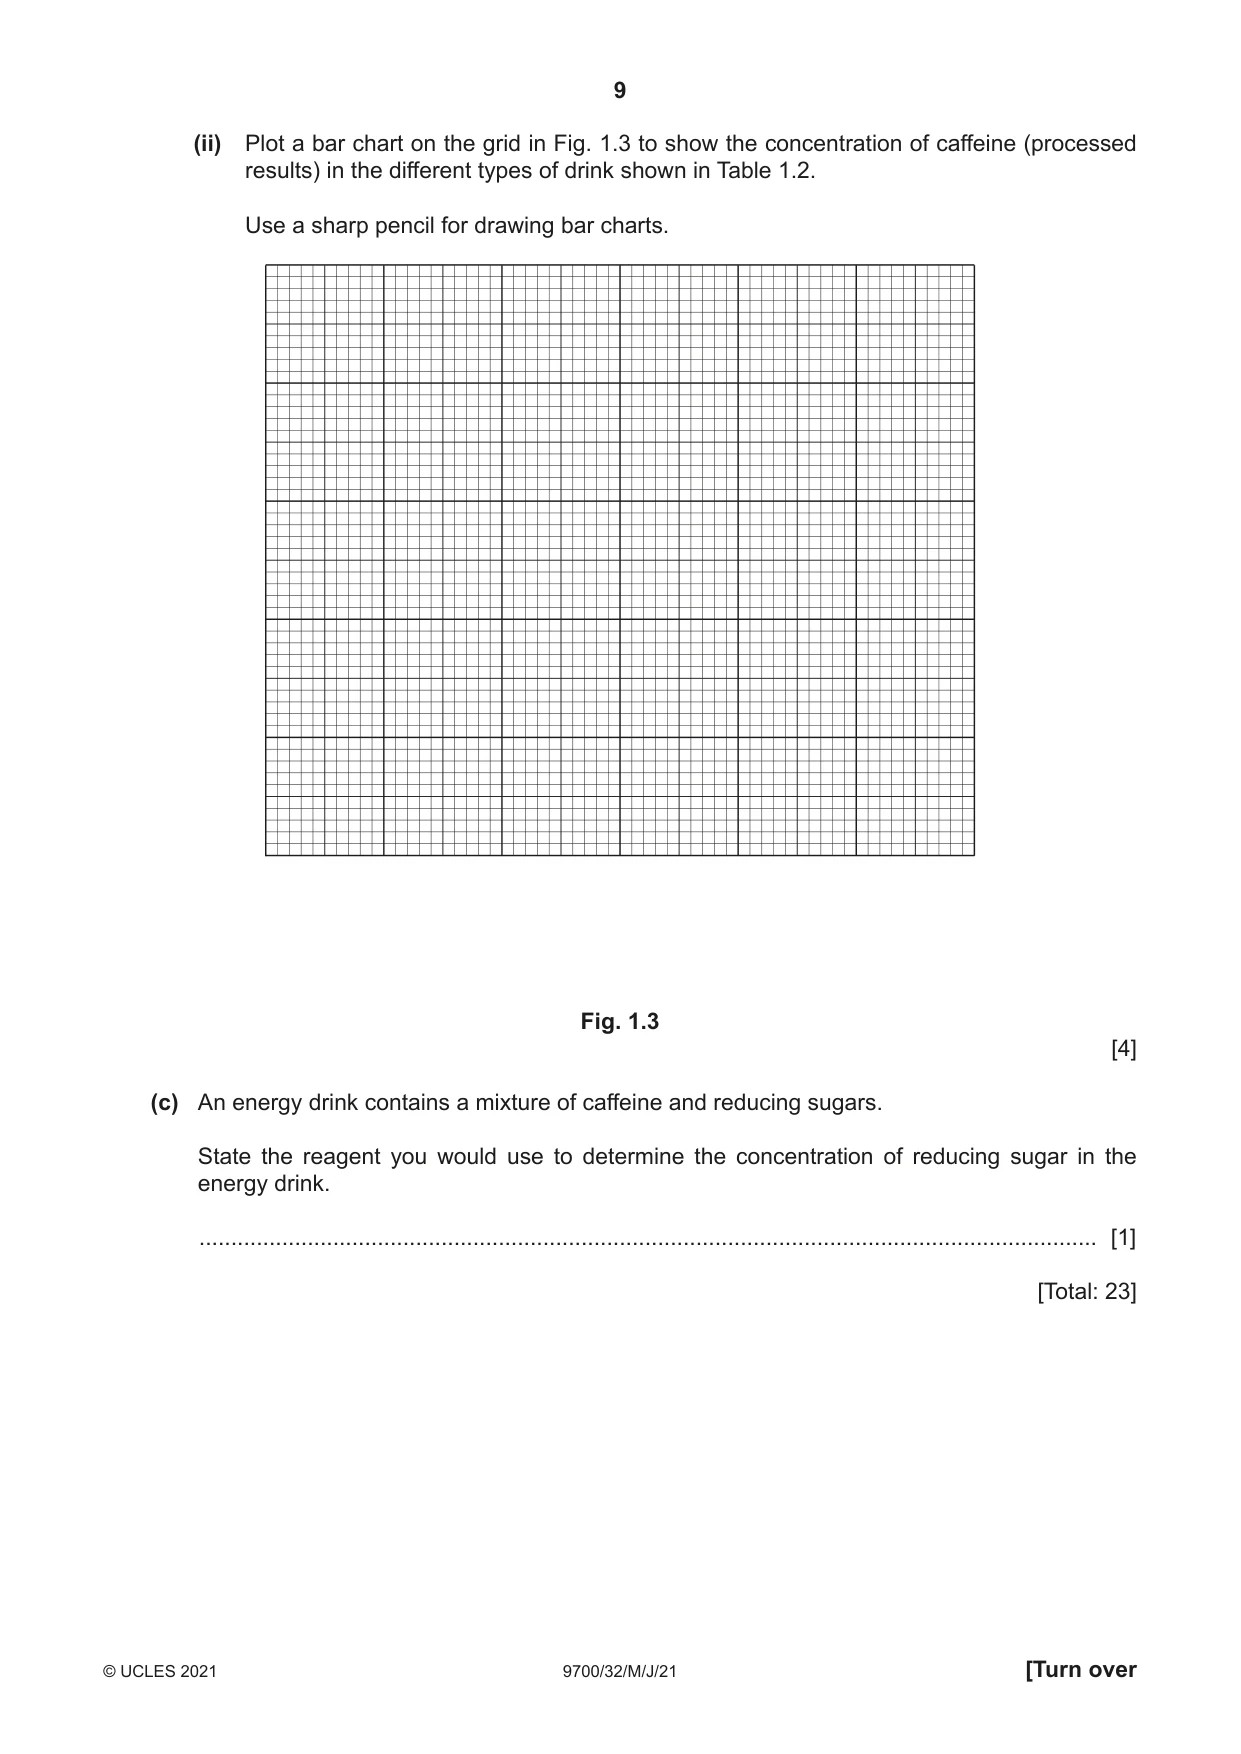
1 The enzyme amylase breaks down starch to form reducing sugars. It has been found that drinking tea affects the activity of amylase. You will investigate the effect of different concentrations of tea extract on the breakdown of starch by amylase. You are provided with the materials shown in Table 1.1. Table 1.1 volume labelled contents hazard / cm3 E amylase solution harmful irritant 50 T 100% tea extract none 20 S starch solution none 50 W distilled water none 150 iodine iodine solution irritant 20 If any solution comes into contact with your skin, wash off immediately with cold water. It is recommended that you wear suitable eye protection. You will need to carry out a serial dilution of the 100% tea extract, T, to reduce the concentration by half between each successive dilution. Fig. 1.1 shows the first two beakers you will use to make your serial dilution. (a) (i) Complete Fig. 1.1 by drawing as many extra beakers as you need for your serial dilution of T. For each beaker add labelled arrows to show: • the volume of tea extract transferred • the volume of water, W, added. Under each beaker state the concentration of tea extract. 0 cm3 of W 10 cm3 of 100% tea extract, T 5 cm3 of 100% tea extract, to use Fig. 1.1 [3] Carry out step 1 to step 12. 1. Prepare the concentrations of tea extract as shown in Fig. 1.1. 2. Label the test-tubes with the concentrations you prepared in step 1. 3. Put 1 cm3 of each concentration of tea extract into the appropriately labelled test-tube. 4. Put 5 cm3 of E into each of the labelled test-tubes. Shake gently to mix. 5. Using the beakers labelled hot water and cold water, set up and maintain a water-bath with water between 30 °C and 40 °C. 6. Put the test-tubes from step 4 into the water-bath. 7. Label a white tile, as shown in Fig. 1.2, with: • the times 2, 4, 6, 8 and 10 (minutes) • the percentage concentrations of tea extract you prepared in step 1. 8. Put drops of iodine solution onto the white tile as shown in Fig. 1.2. You will need one row of drops of iodine solution for each of the concentrations of tea extract you prepared in step 1. time in minutes 2 4 6 8 10 100 drops of iodine solution percentage concentrations of tea extract as prepared in step 1 Fig. 1.2 Read step 9 to step 12 before continuing. 9. Put 2 cm3 of starch solution S into each test-tube (in the water-bath). Shake gently to mix. Start timing. 10. After 2 minutes: • use a pipette to remove a sample of the solution from the test-tube labelled 100% • put 1 drop of the solution onto the spot of iodine solution labelled 2 (minutes) on the row labelled 100 (%) • put 1 drop of the next solution onto the spot of iodine solution labelled 2 (minutes) on the row labelled with your next concentration of tea extract • repeat for the other concentrations of tea extract you prepared in step 1, so that all of the drops of iodine solution in the 2 minute column have been used. 11. Repeat step 10 at intervals of 2 minutes until there is no blue-black colour. This is the end-point. Note: you will not see the original colour of the iodine due to the presence of the tea. If the iodine continues to turn blue-black at 10 minutes, stop sampling and record this as ‘more than 10’. 12. Record in (a)(ii) the time taken to reach the end-point. (ii) Record your results in an appropriate table. [5] (iii) State the trend for your results. ........................................................................................................................................... ..................................................................................................................................... [1] (iv) Tea is a competitive inhibitor of amylase. Explain how tea can act as a competitive inhibitor of amylase. ........................................................................................................................................... ........................................................................................................................................... ........................................................................................................................................... ........................................................................................................................................... ........................................................................................................................................... ........................................................................................................................................... ........................................................................................................................................... ..................................................................................................................................... [3] (v) The volume of the drops of iodine solution in step 8 was not standardised. Suggest one improvement to step 8. ........................................................................................................................................... ........................................................................................................................................... ..................................................................................................................................... [1] (vi) Identify two possible sources of error in step 9 and suggest improvements to reduce the effect of these errors. error ................................................................................................................................... ........................................................................................................................................... improvement ..................................................................................................................... ........................................................................................................................................... ........................................................................................................................................... error ................................................................................................................................... ........................................................................................................................................... improvement ..................................................................................................................... ........................................................................................................................................... ........................................................................................................................................... [4] (b) Caffeine is a chemical found in tea and many other drinks. A student investigated the concentration of caffeine in different types of drink. Table 1.2 shows the student’s raw data and processed data. Table 1.2 raw data processed data type of drink volume of one mass of caffeine concentration of serving per serving caffeine / cm3 / mg / mg cm–3 black tea (BT) 220 40 0.18 filter coffee (FC) 350 195 decaffeinated tea (DT) 220 5 0.02 cola light (CL) 330 33 0.10 espresso coffee (EC) 30 48 1.60 green tea (GT) 220 18 0.08 (i) Complete Table 1.2 by calculating the concentration of caffeine in filter coffee. [1] (ii) Plot a bar chart on the grid in Fig. 1.3 to show the concentration of caffeine (processed results) in the different types of drink shown in Table 1.2. Use a sharp pencil for drawing bar charts. Fig. 1.3 [4] (c) An energy drink contains a mixture of caffeine and reducing sugars. State the reagent you would use to determine the concentration of reducing sugar in the energy drink. ............................................................................................................................................. [1] [Total: 23]
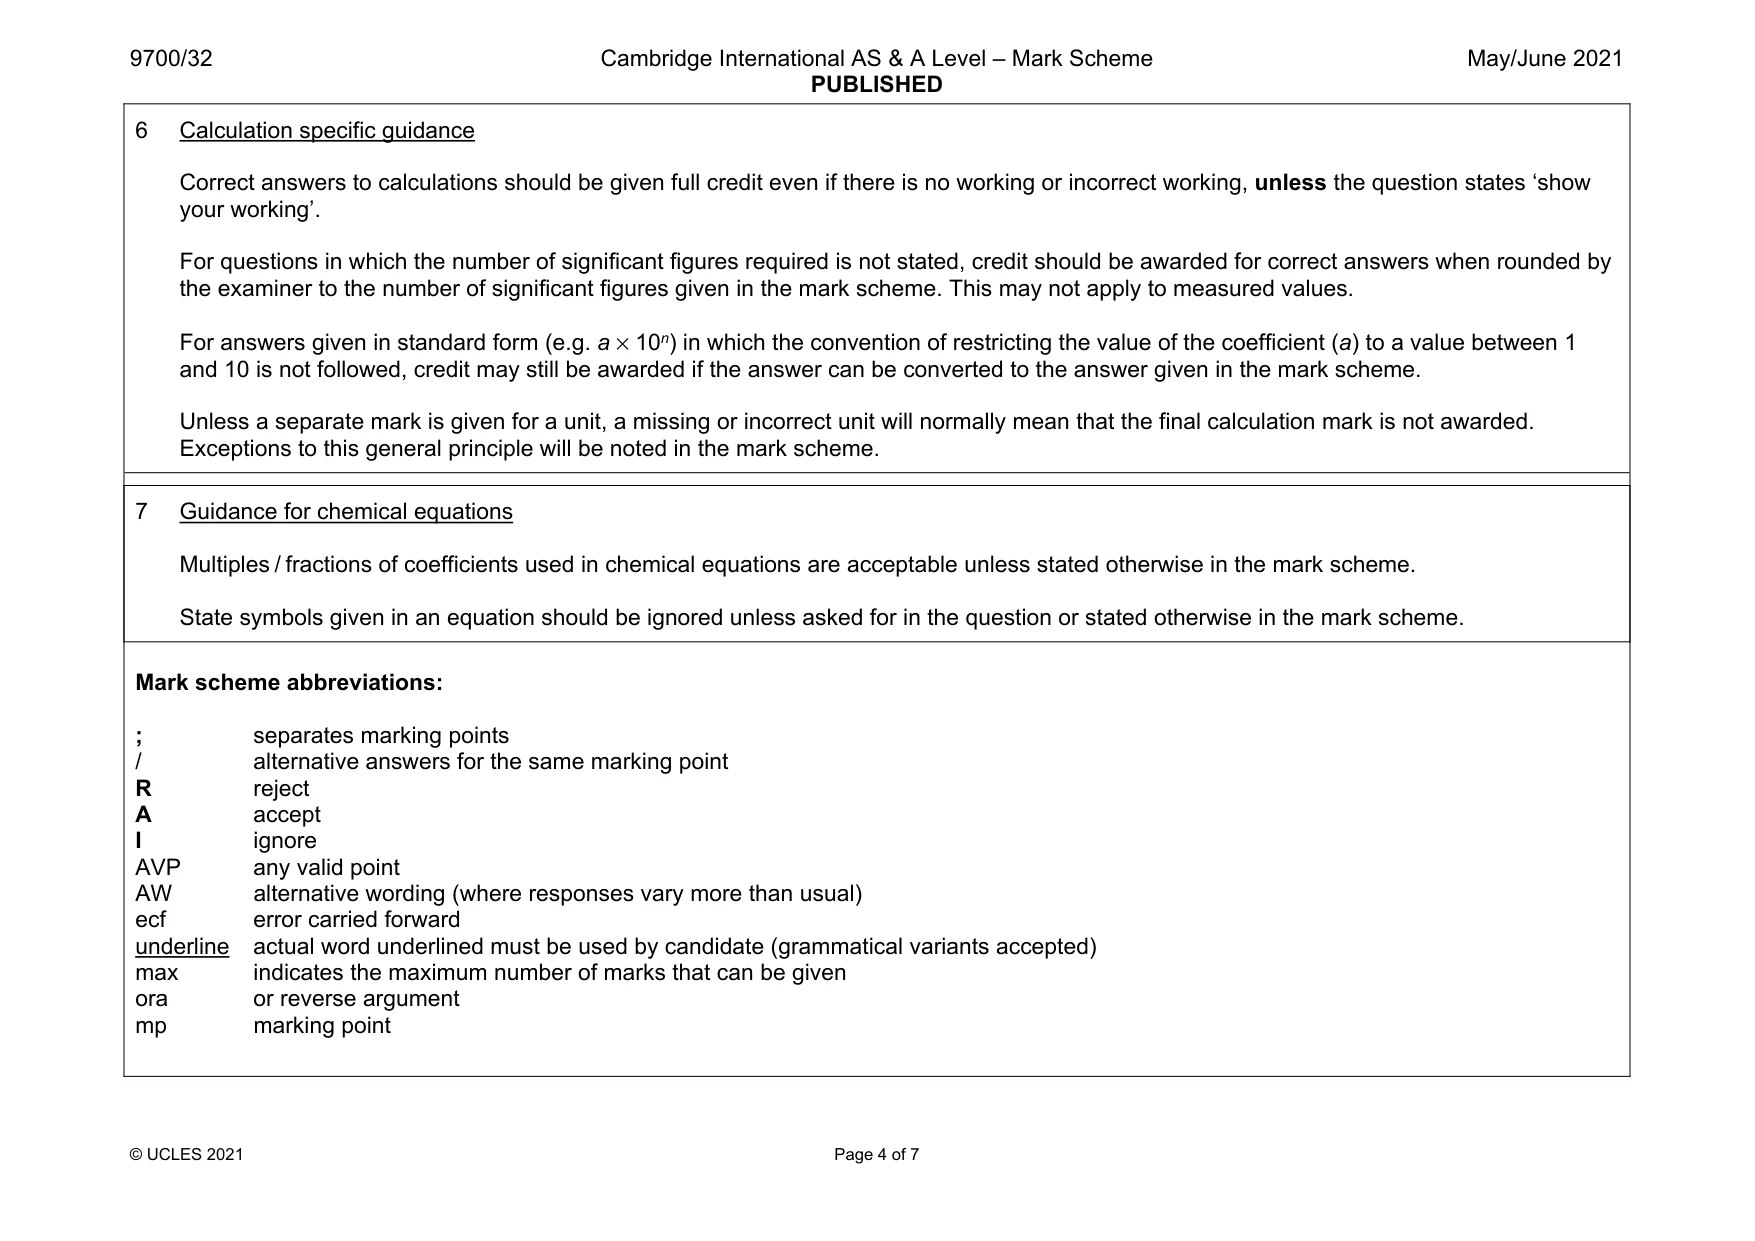
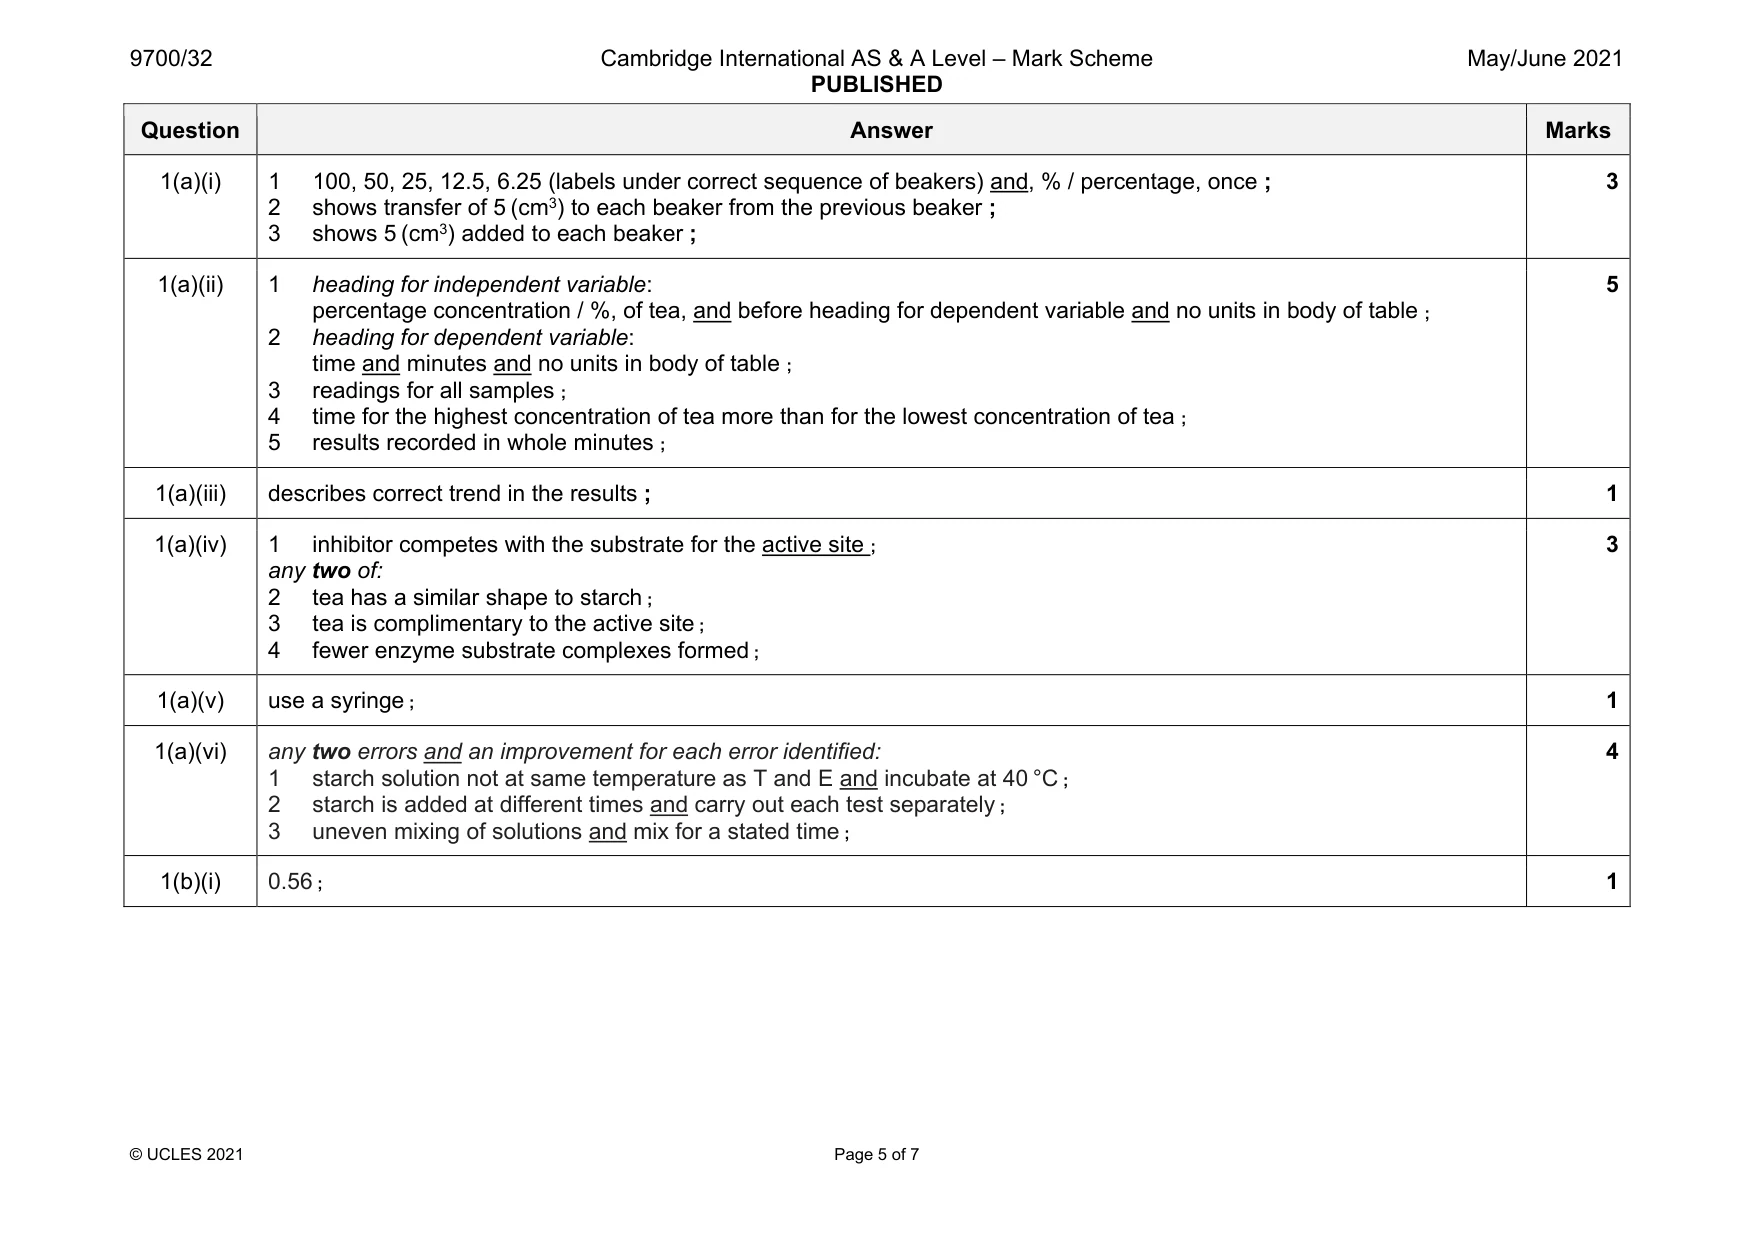
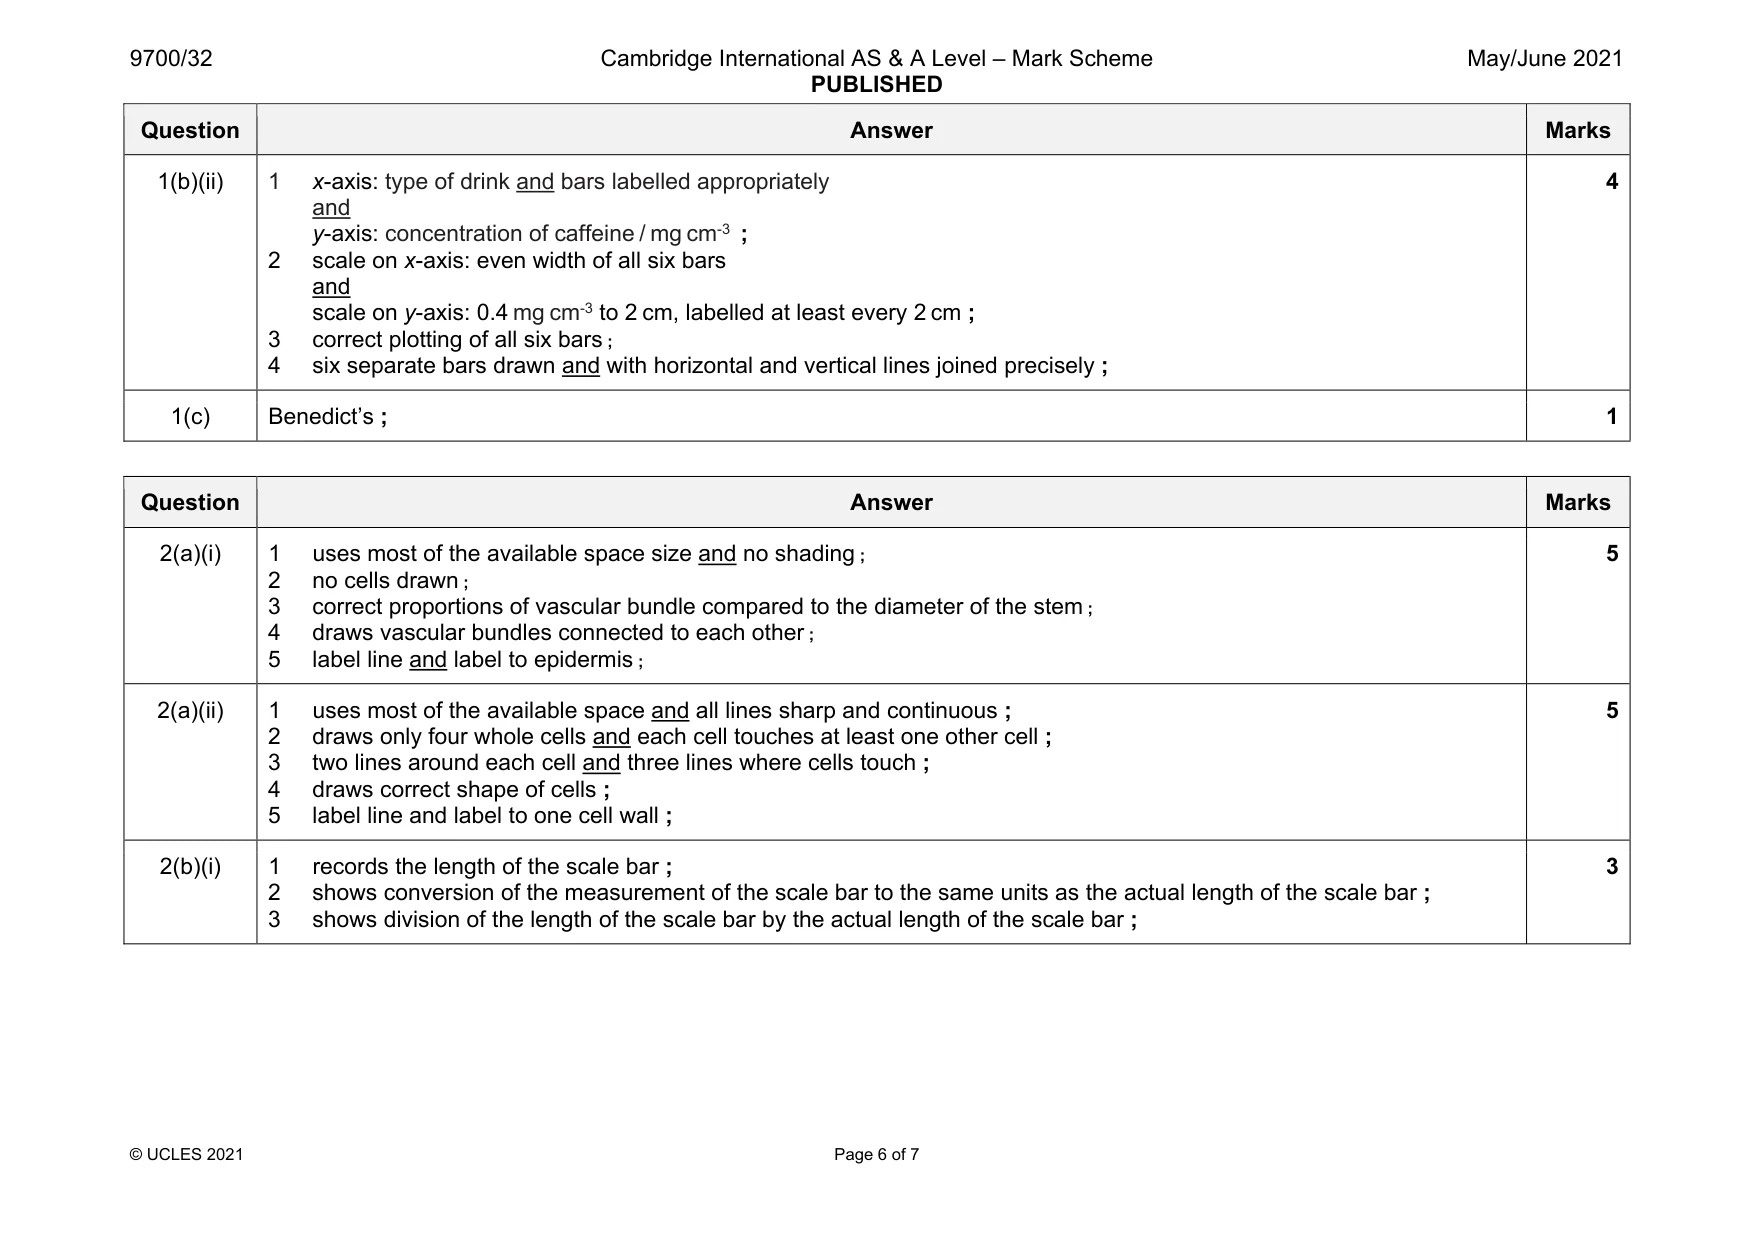
Mark scheme: 1(a)(i) 1 100, 50, 25, 12.5, 6.25 (labels under correct sequence of beakers) and, % / percentage, once ; 2 shows transfer of 5 (cm3) to each beaker from the previous beaker ; 3 shows 5 (cm3) added to each beaker ; 3 1(a)(ii) 1 heading for independent variable: percentage concentration / %, of tea, and before heading for dependent variable and no units in body of table ; 2 heading for dependent variable: time and minutes and no units in body of table ; 3 readings for all samples ; 4 time for the highest concentration of tea more than for the lowest concentration of tea ; 5 results recorded in whole minutes ; 5 1(a)(iii) describes correct trend in the results ; 1 1(a)(iv) 1 inhibitor competes with the substrate for the active site ; any two of: 2 tea has a similar shape to starch ; 3 tea is complimentary to the active site ; 4 fewer enzyme substrate complexes formed ; 3 1(a)(v) use a syringe ; 1 1(a)(vi) any two errors and an improvement for each error identified: 1 starch solution not at same temperature as T and E and incubate at 40 °C ; 2 starch is added at different times and carry out each test separately ; 3 uneven mixing of solutions and mix for a stated time ; 4 1(b)(i) 0.56 ; 1 Question Answer Marks 1(b)(ii) 1 x-axis: type of drink and bars labelled appropriately and y-axis: concentration of caffeine / mg cm-3 ; 2 scale on x-axis: even width of all six bars and scale on y-axis: 0.4 mg cm-3 to 2 cm, labelled at least every 2 cm ; 3 correct plotting of all six bars ; 4 six separate bars drawn and with horizontal and vertical lines joined precisely ; 4 1(c) Benedict’s ; 1
Q2 · K1 is a slide of a stained transverse section through a plant stem
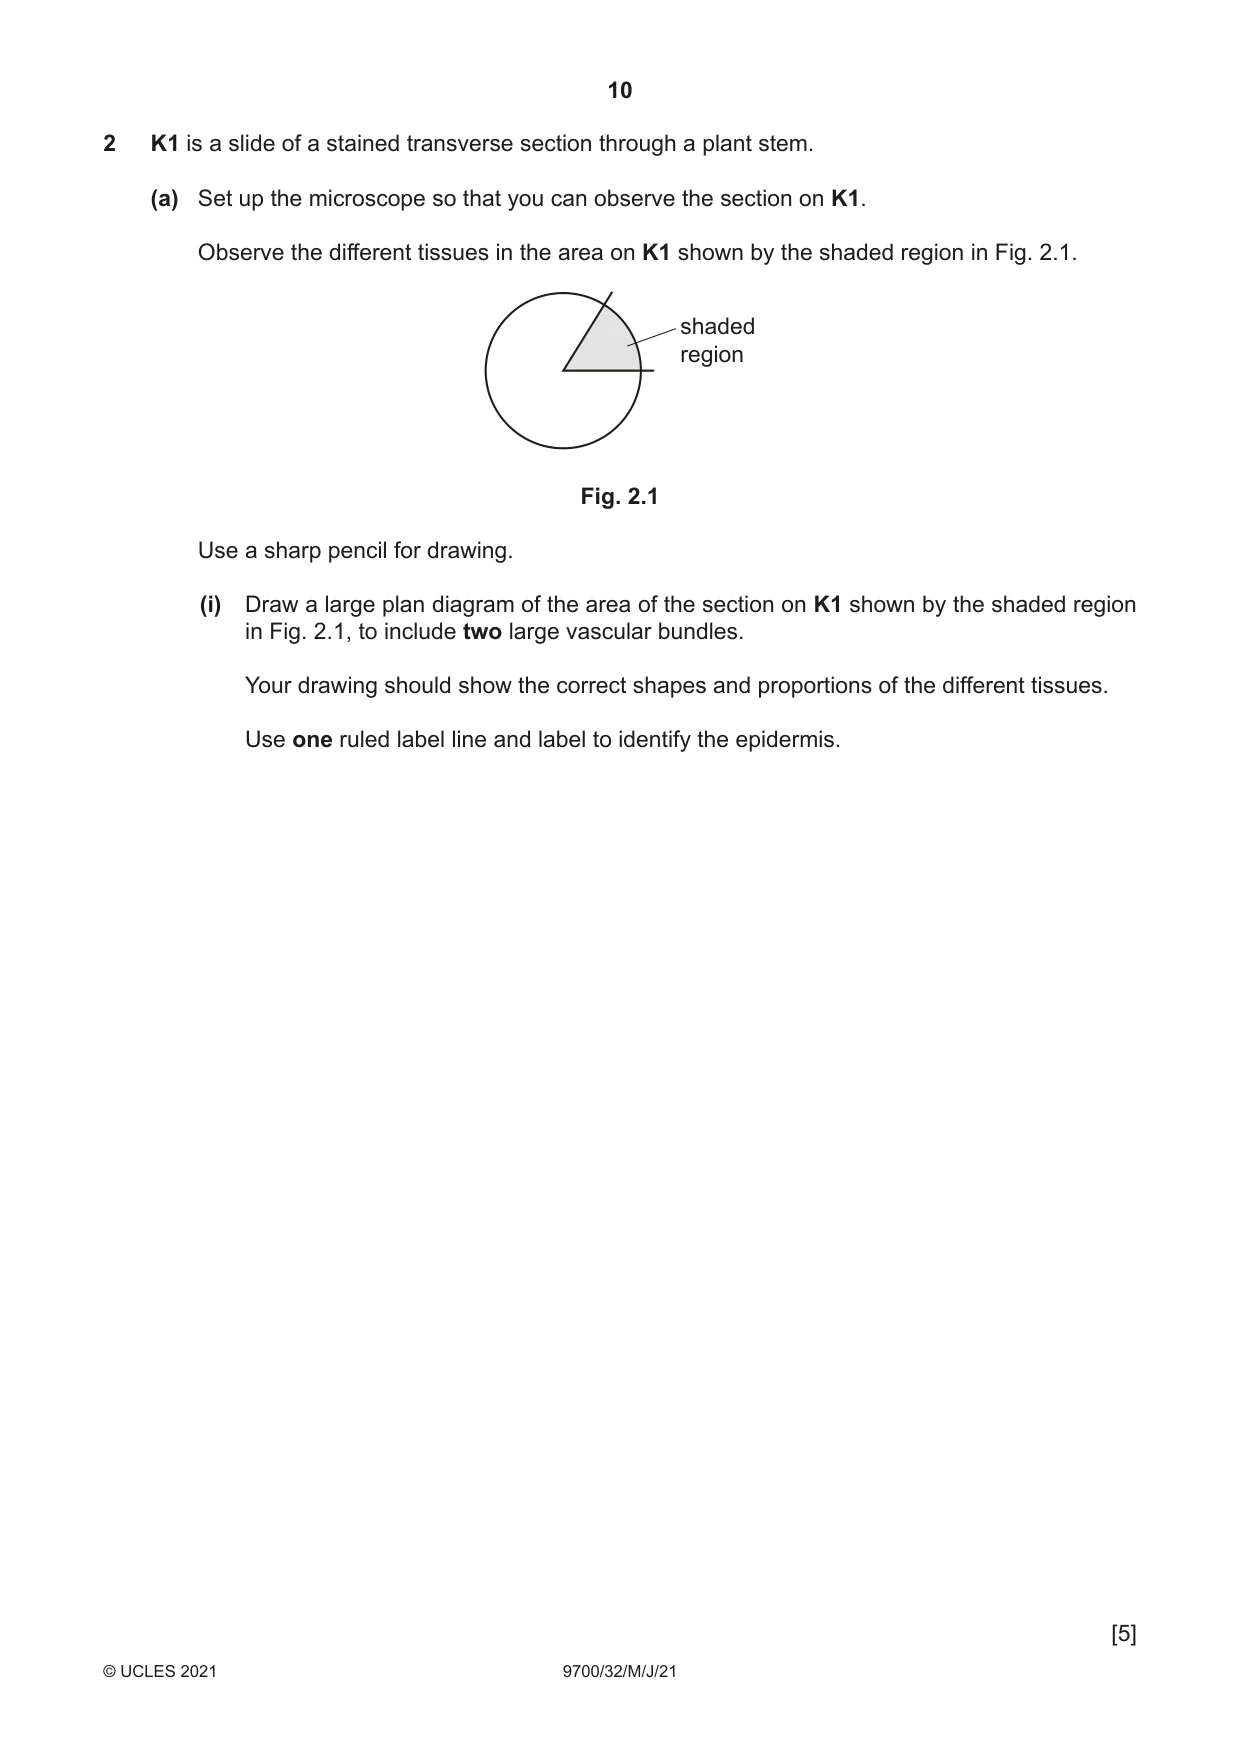
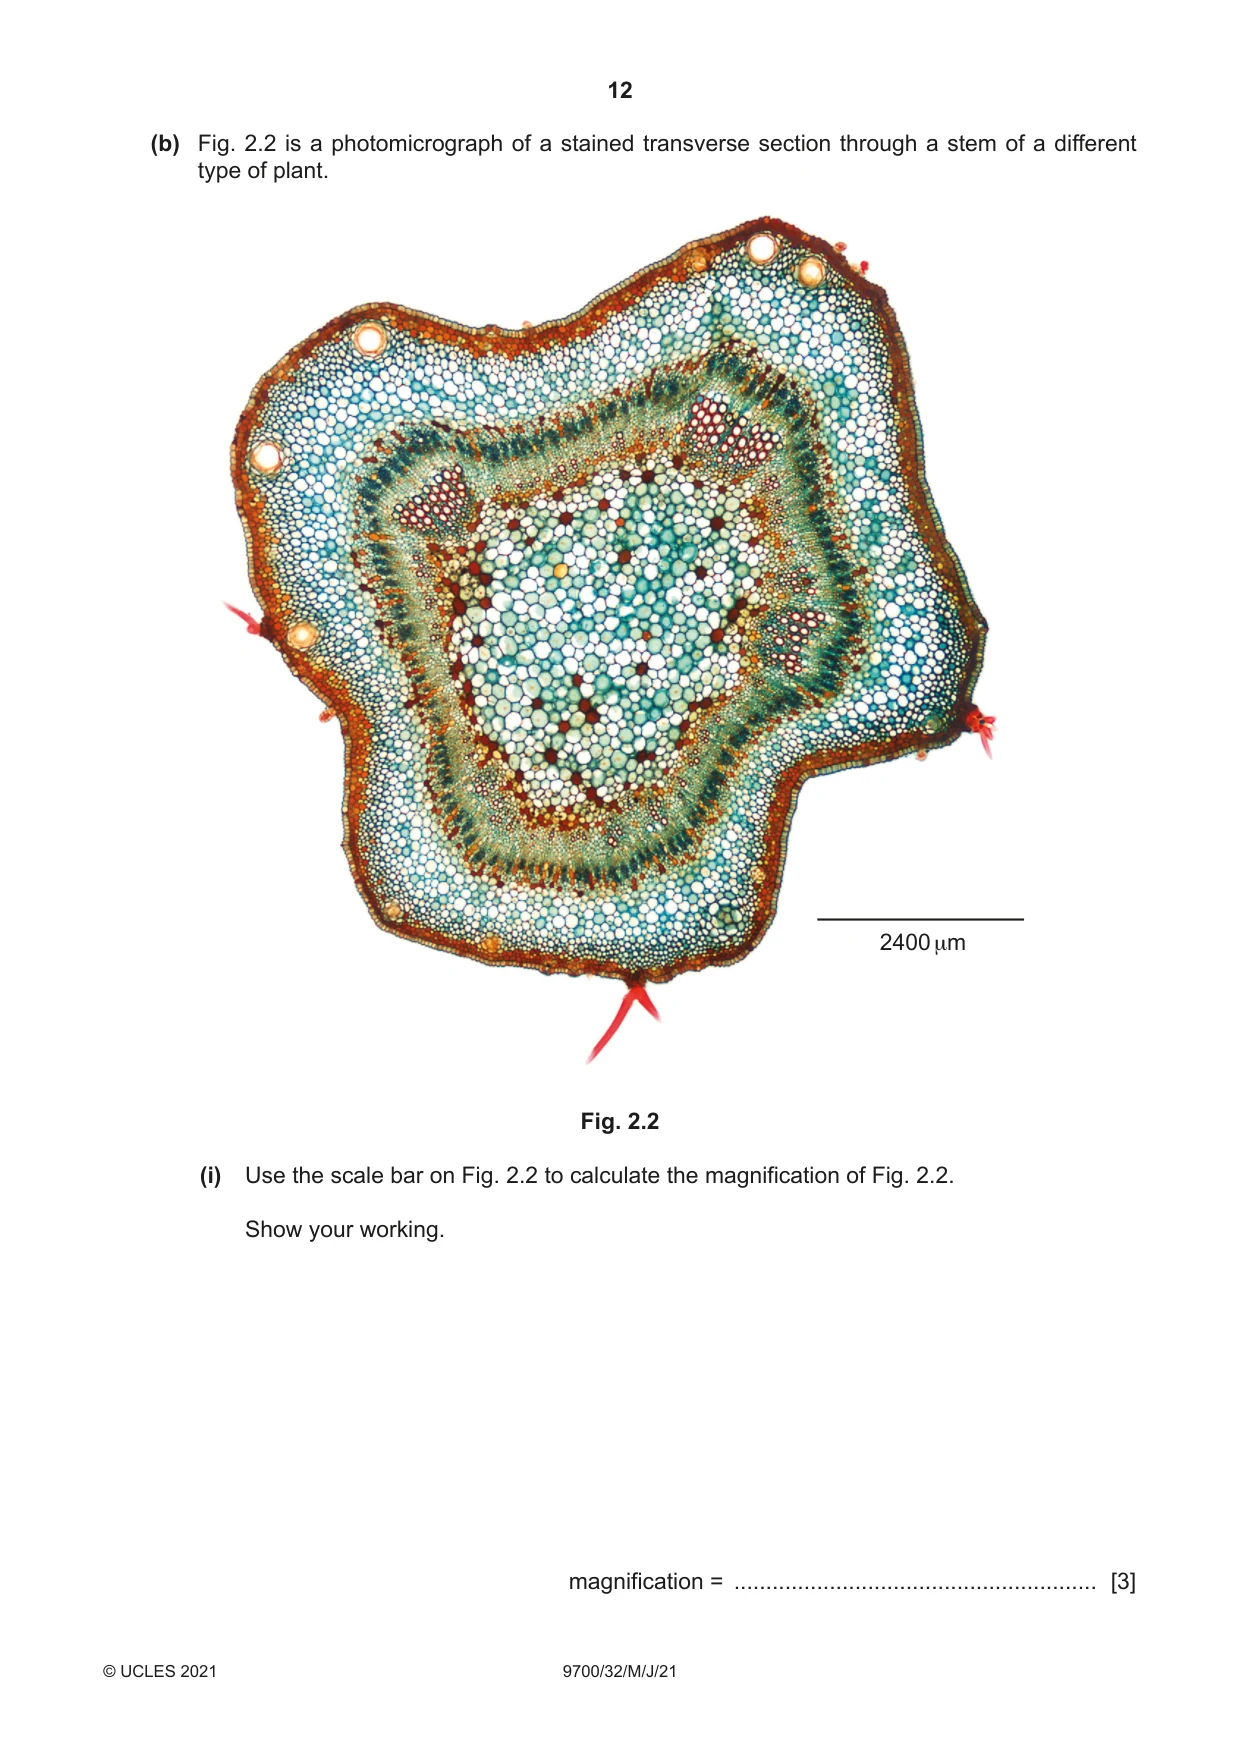
2 K1 is a slide of a stained transverse section through a plant stem. (a) Set up the microscope so that you can observe the section on K1. Observe the different tissues in the area on K1 shown by the shaded region in Fig. 2.1. shaded region Fig. 2.1 Use a sharp pencil for drawing. (i) Draw a large plan diagram of the area of the section on K1 shown by the shaded region in Fig. 2.1, to include two large vascular bundles. Your drawing should show the correct shapes and proportions of the different tissues. Use one ruled label line and label to identify the epidermis. [5] (ii) Observe the epidermis of the section on K1. Select a line of four adjacent epidermal cells. Each cell in the line must touch at least one other cell. • Make a large drawing of this line of four cells. • Use one ruled label line and label to identify the cell wall of one cell. [5] (b) Fig. 2.2 is a photomicrograph of a stained transverse section through a stem of a different type of plant. 2400 μm Fig. 2.2 (i) Use the scale bar on Fig. 2.2 to calculate the magnification of Fig. 2.2. Show your working. magnification = ......................................................... [3]
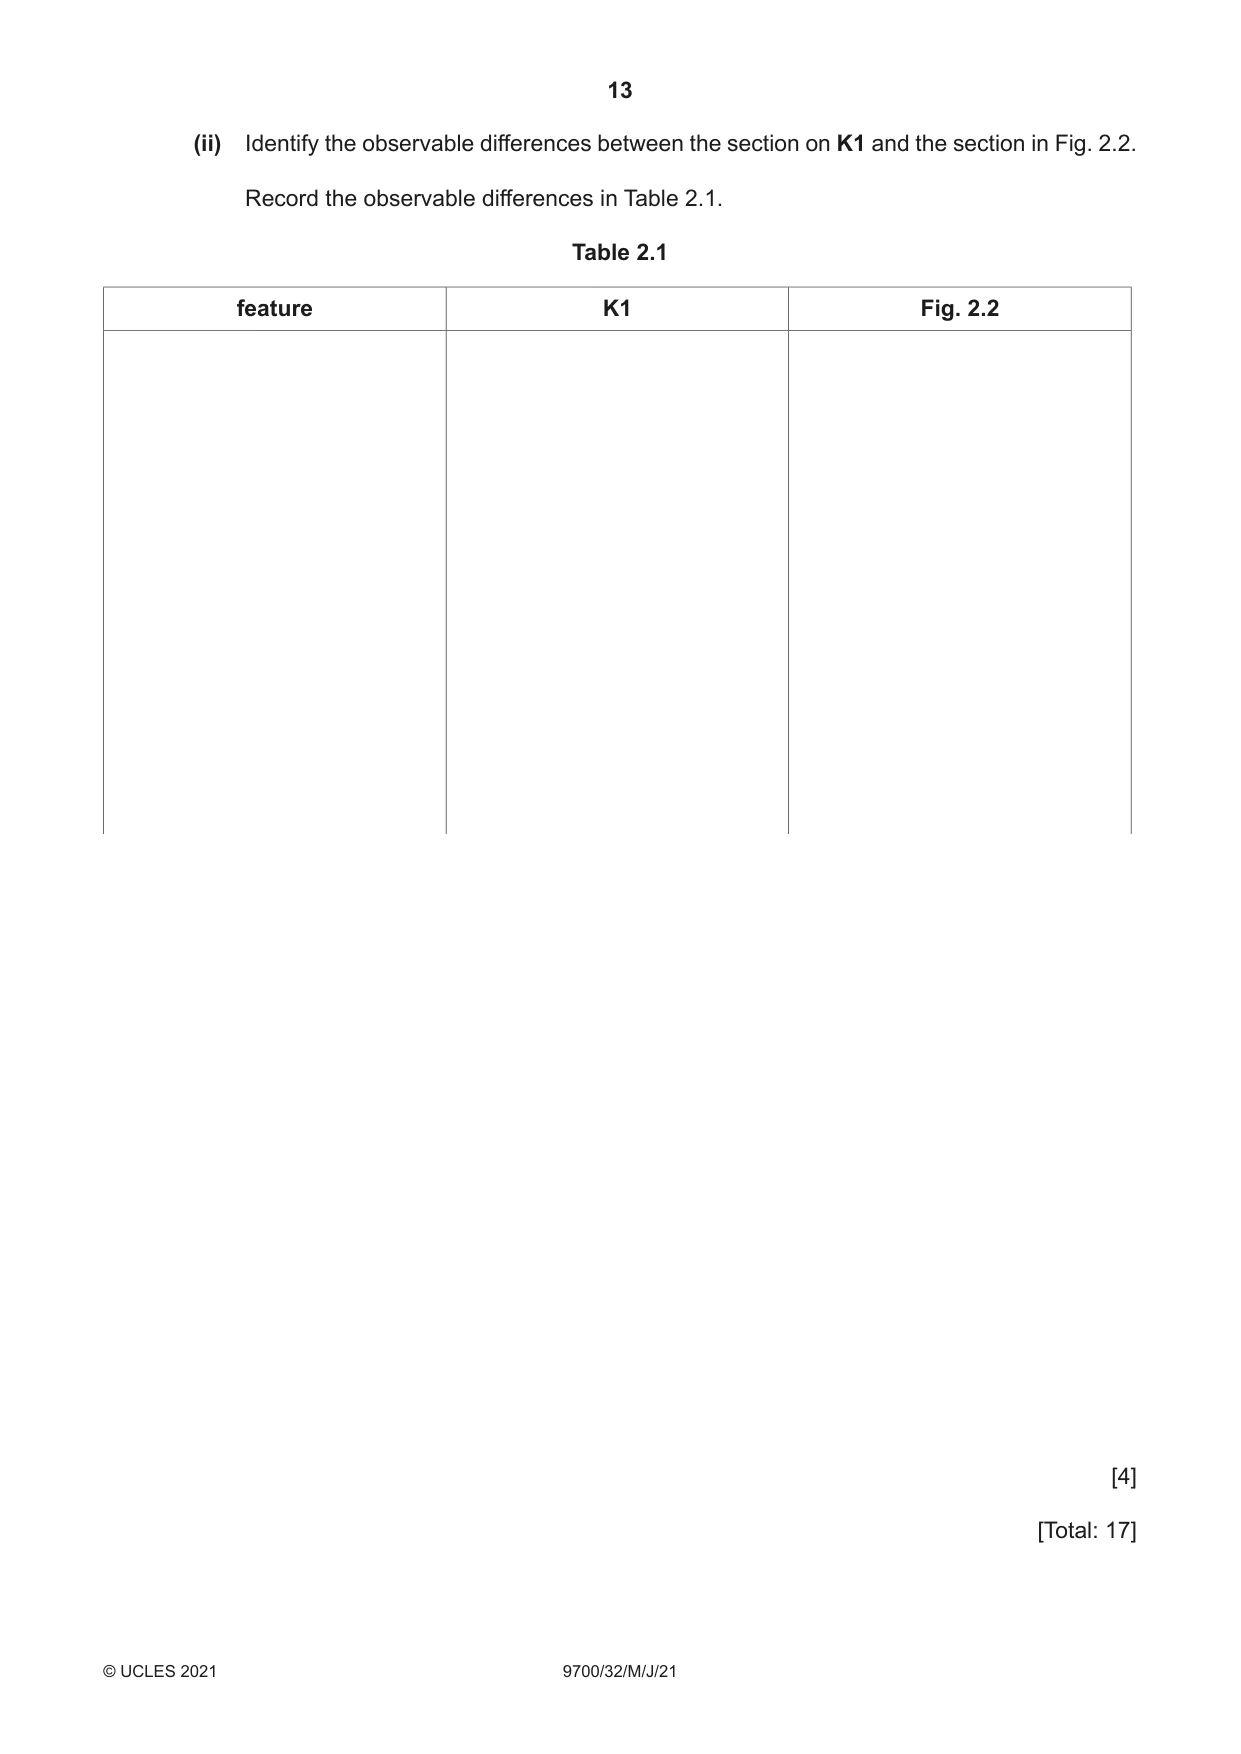
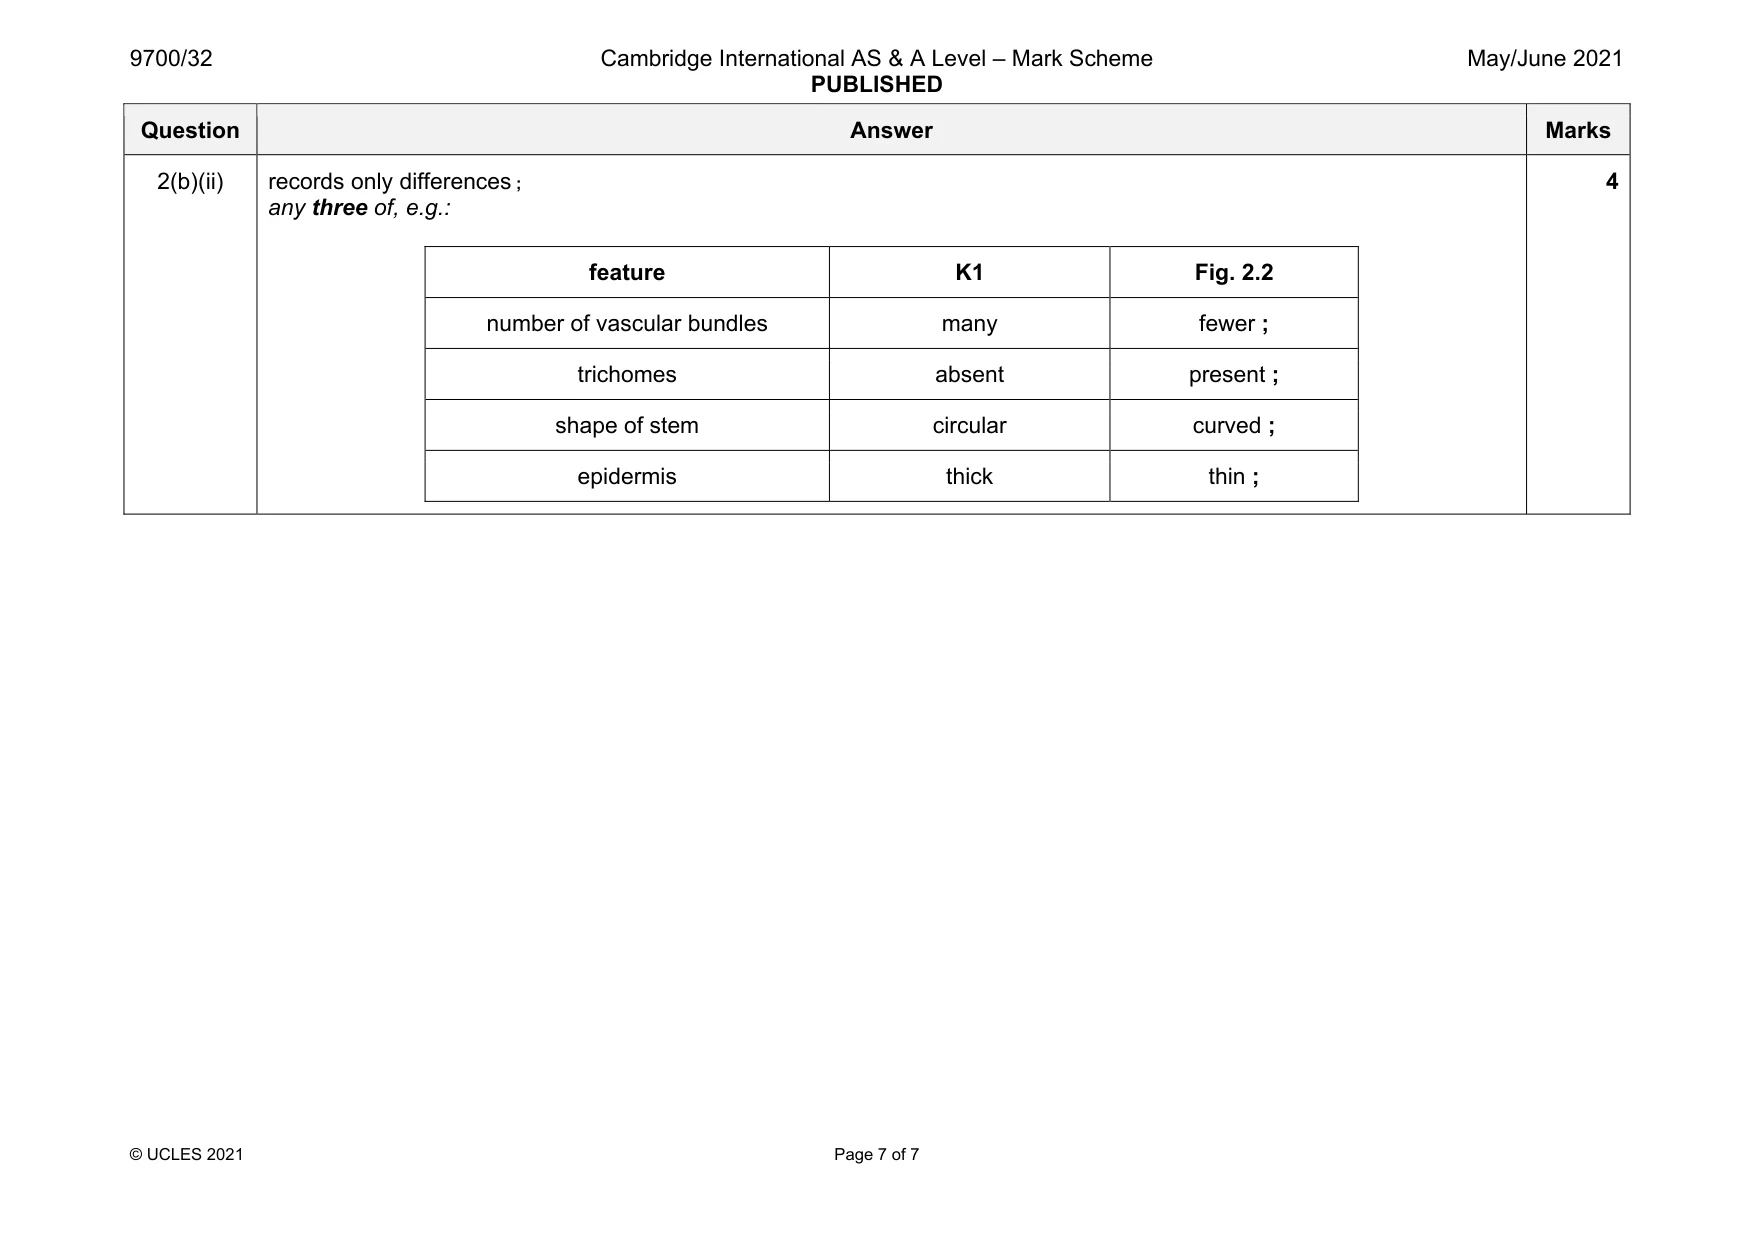
Mark scheme: 2(a)(i) 1 uses most of the available space size and no shading ; 2 no cells drawn ; 3 correct proportions of vascular bundle compared to the diameter of the stem ; 4 draws vascular bundles connected to each other ; 5 label line and label to epidermis ; 5 2(a)(ii) 1 uses most of the available space and all lines sharp and continuous ; 2 draws only four whole cells and each cell touches at least one other cell ; 3 two lines around each cell and three lines where cells touch ; 4 draws correct shape of cells ; 5 label line and label to one cell wall ; 5 2(b)(i) 1 records the length of the scale bar ; 2 shows conversion of the measurement of the scale bar to the same units as the actual length of the scale bar ; 3 shows division of the length of the scale bar by the actual length of the scale bar ; 3 Question Answer Marks 2(b)(ii) records only differences ; any three of, e.g.: feature K1 Fig. 2.2 number of vascular bundles many fewer ; trichomes absent present ; shape of stem circular curved ; epidermis thick thin ; 4
What was in this paper
The subtopics covered by these 2 questions, and how many questions each got. Open one in a new tab to see every Cambridge question on it.
What you needed in this session
Cambridge’s own grade thresholds for 2021 May/June, Paper 3 · Variant 2. A higher threshold means an easier paper — the bar moves with how the cohort did.