Cambridge A Level Biology 9700 — 2024 May/June Paper 3 · Variant 2
9700/32/M/J/24 · 2 questions · 40 marks · ≈45 min
The question paper and its mark scheme, free to read here and free to download. This is Cambridge’s own paper, exactly as it was sat.
Question paper12 pages


Mark scheme8 pages
Answers below. Sit the paper first if you are practising.
Questions as text
Q1 · Some fruits contain protease enzymes
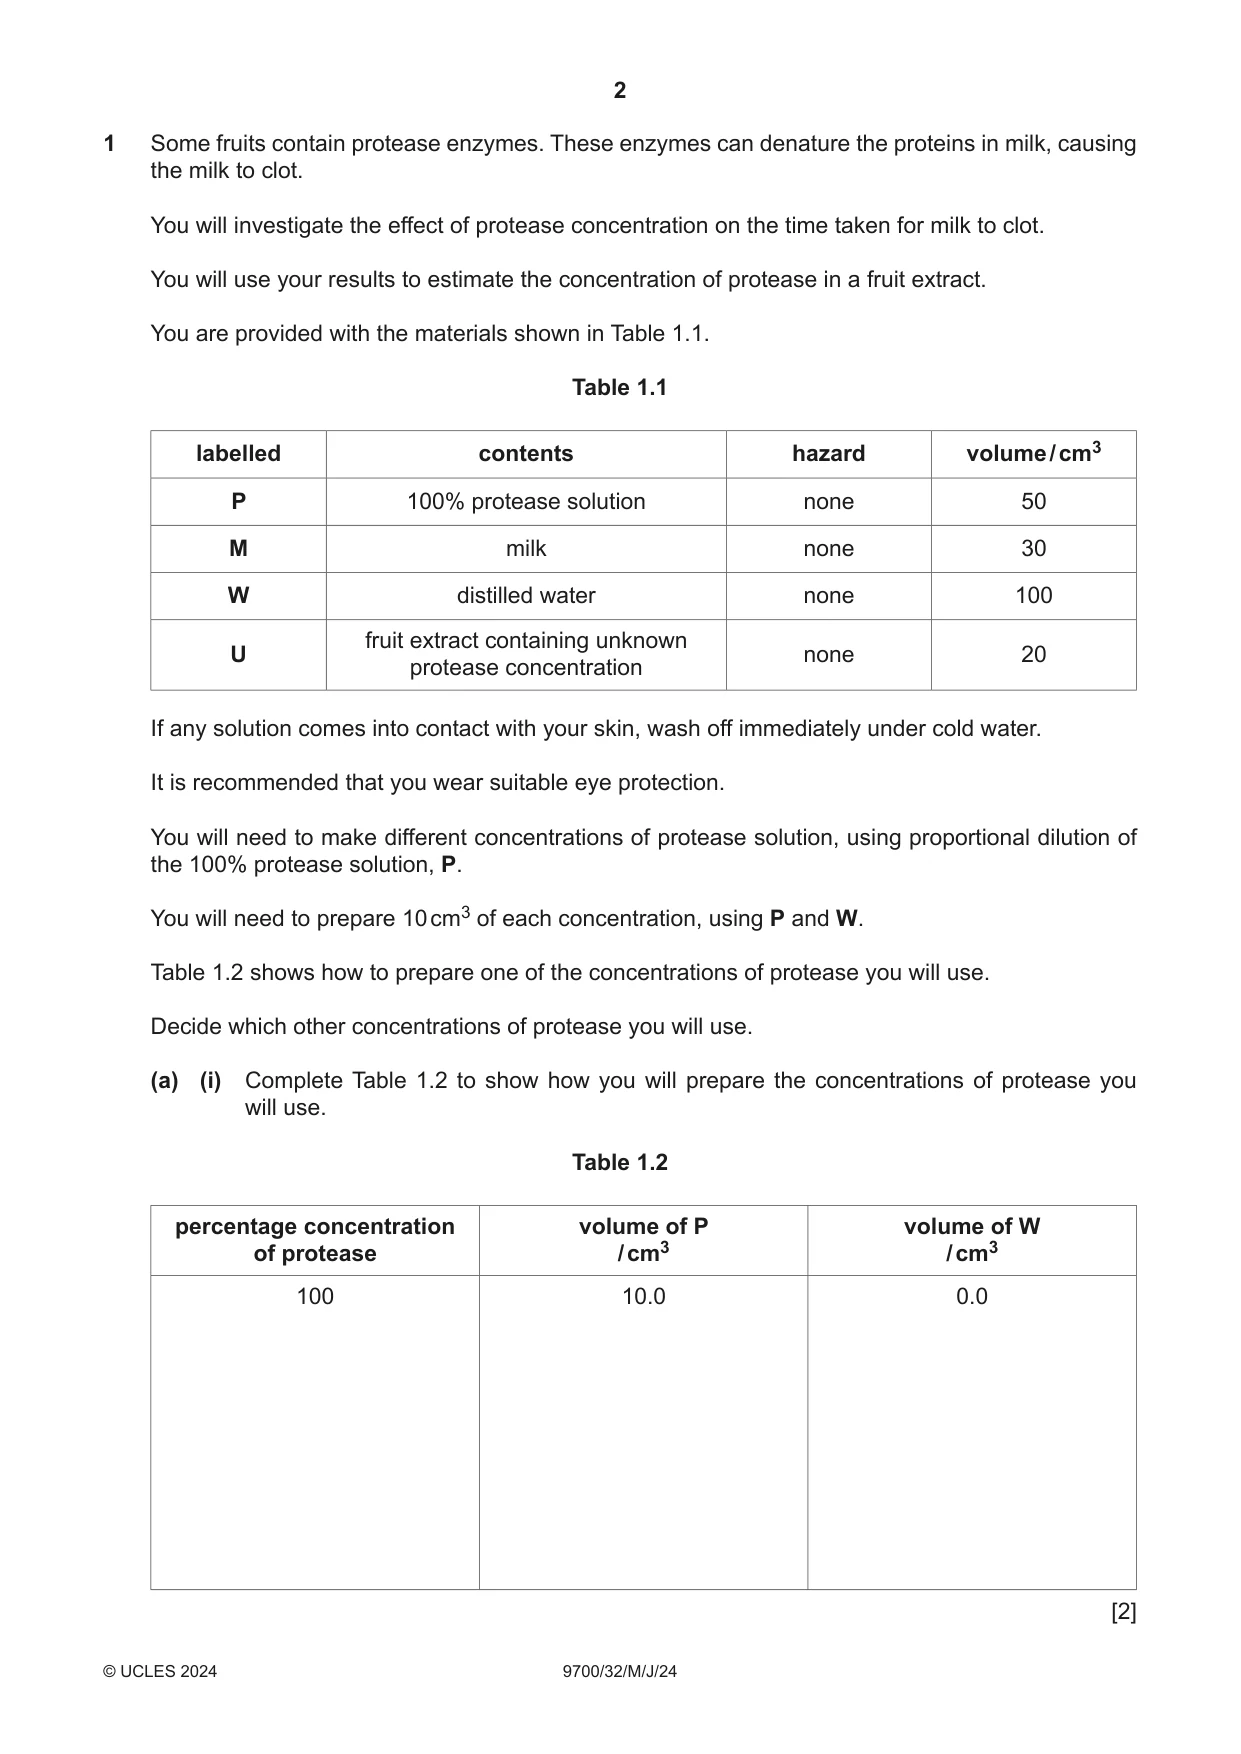
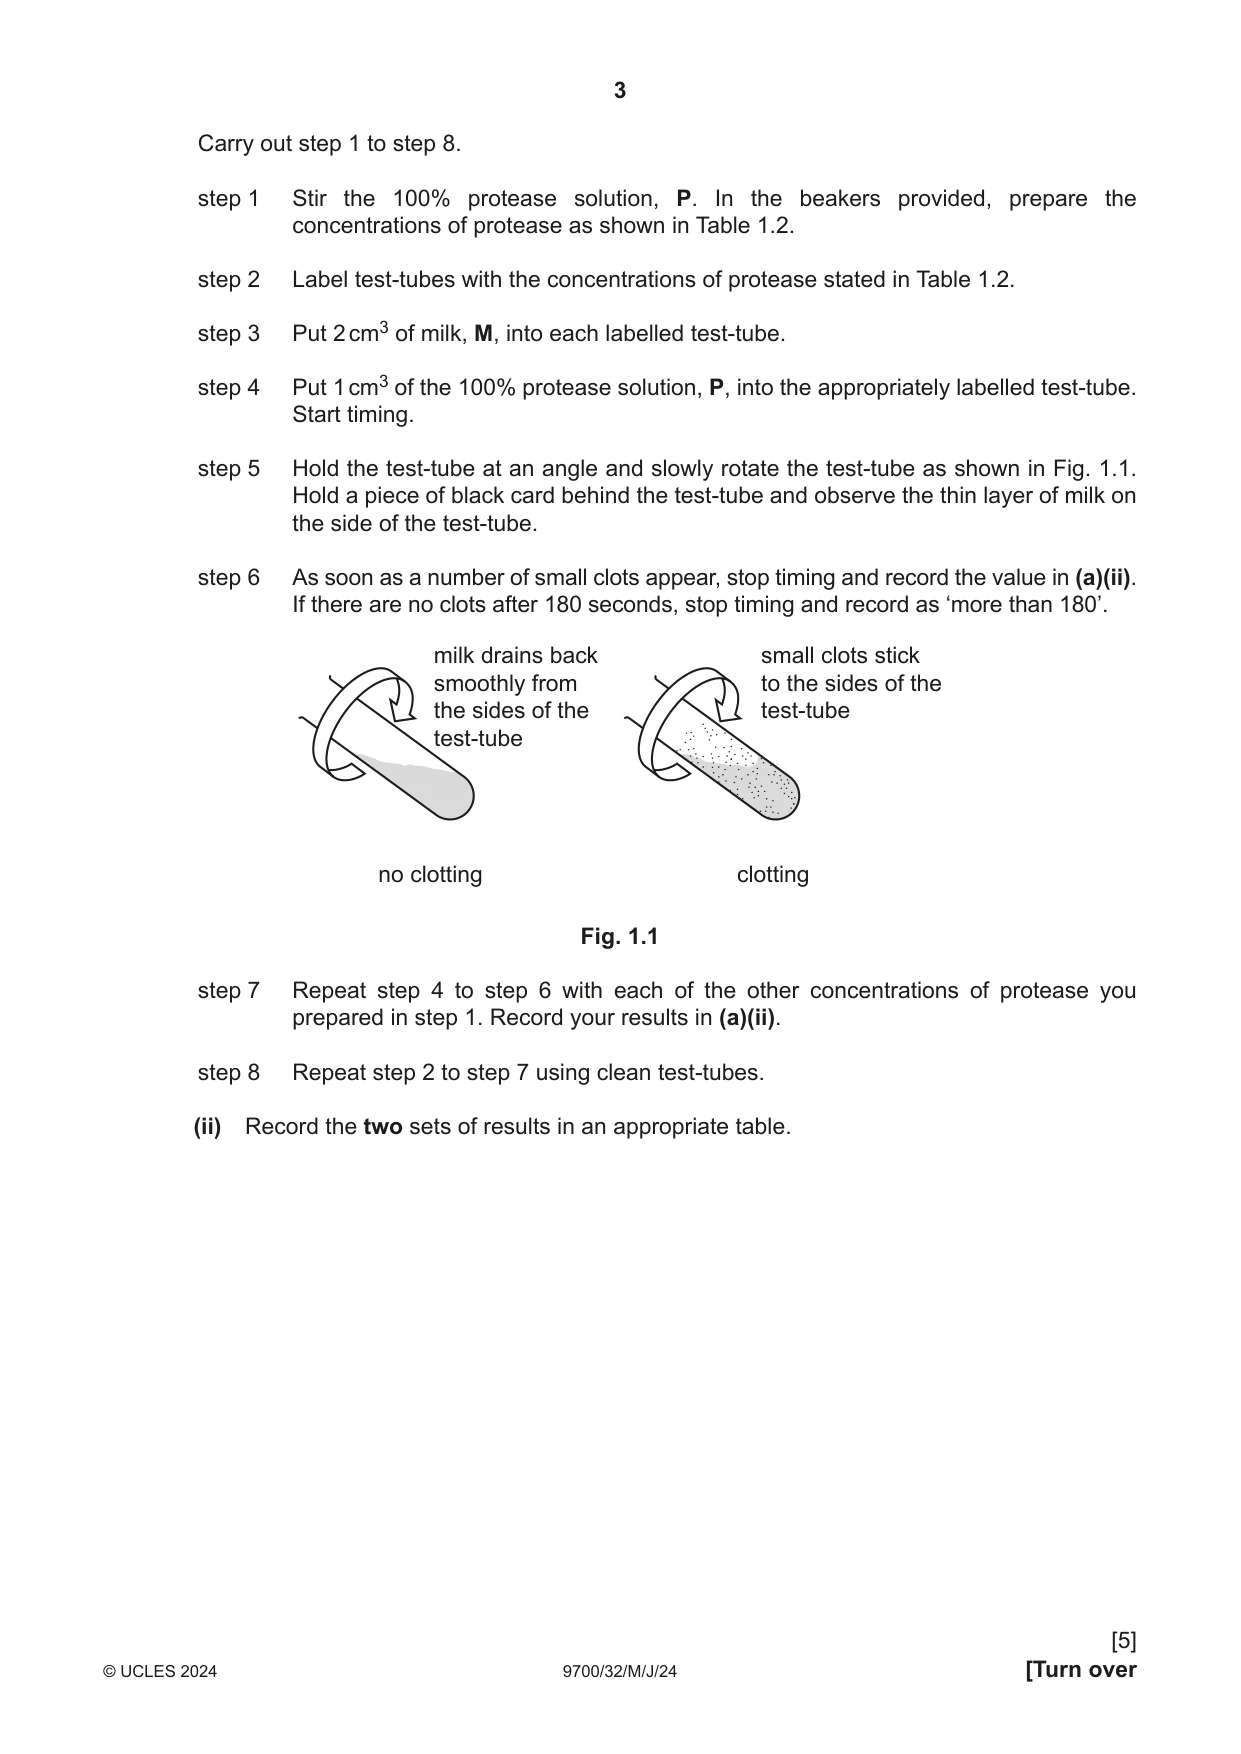
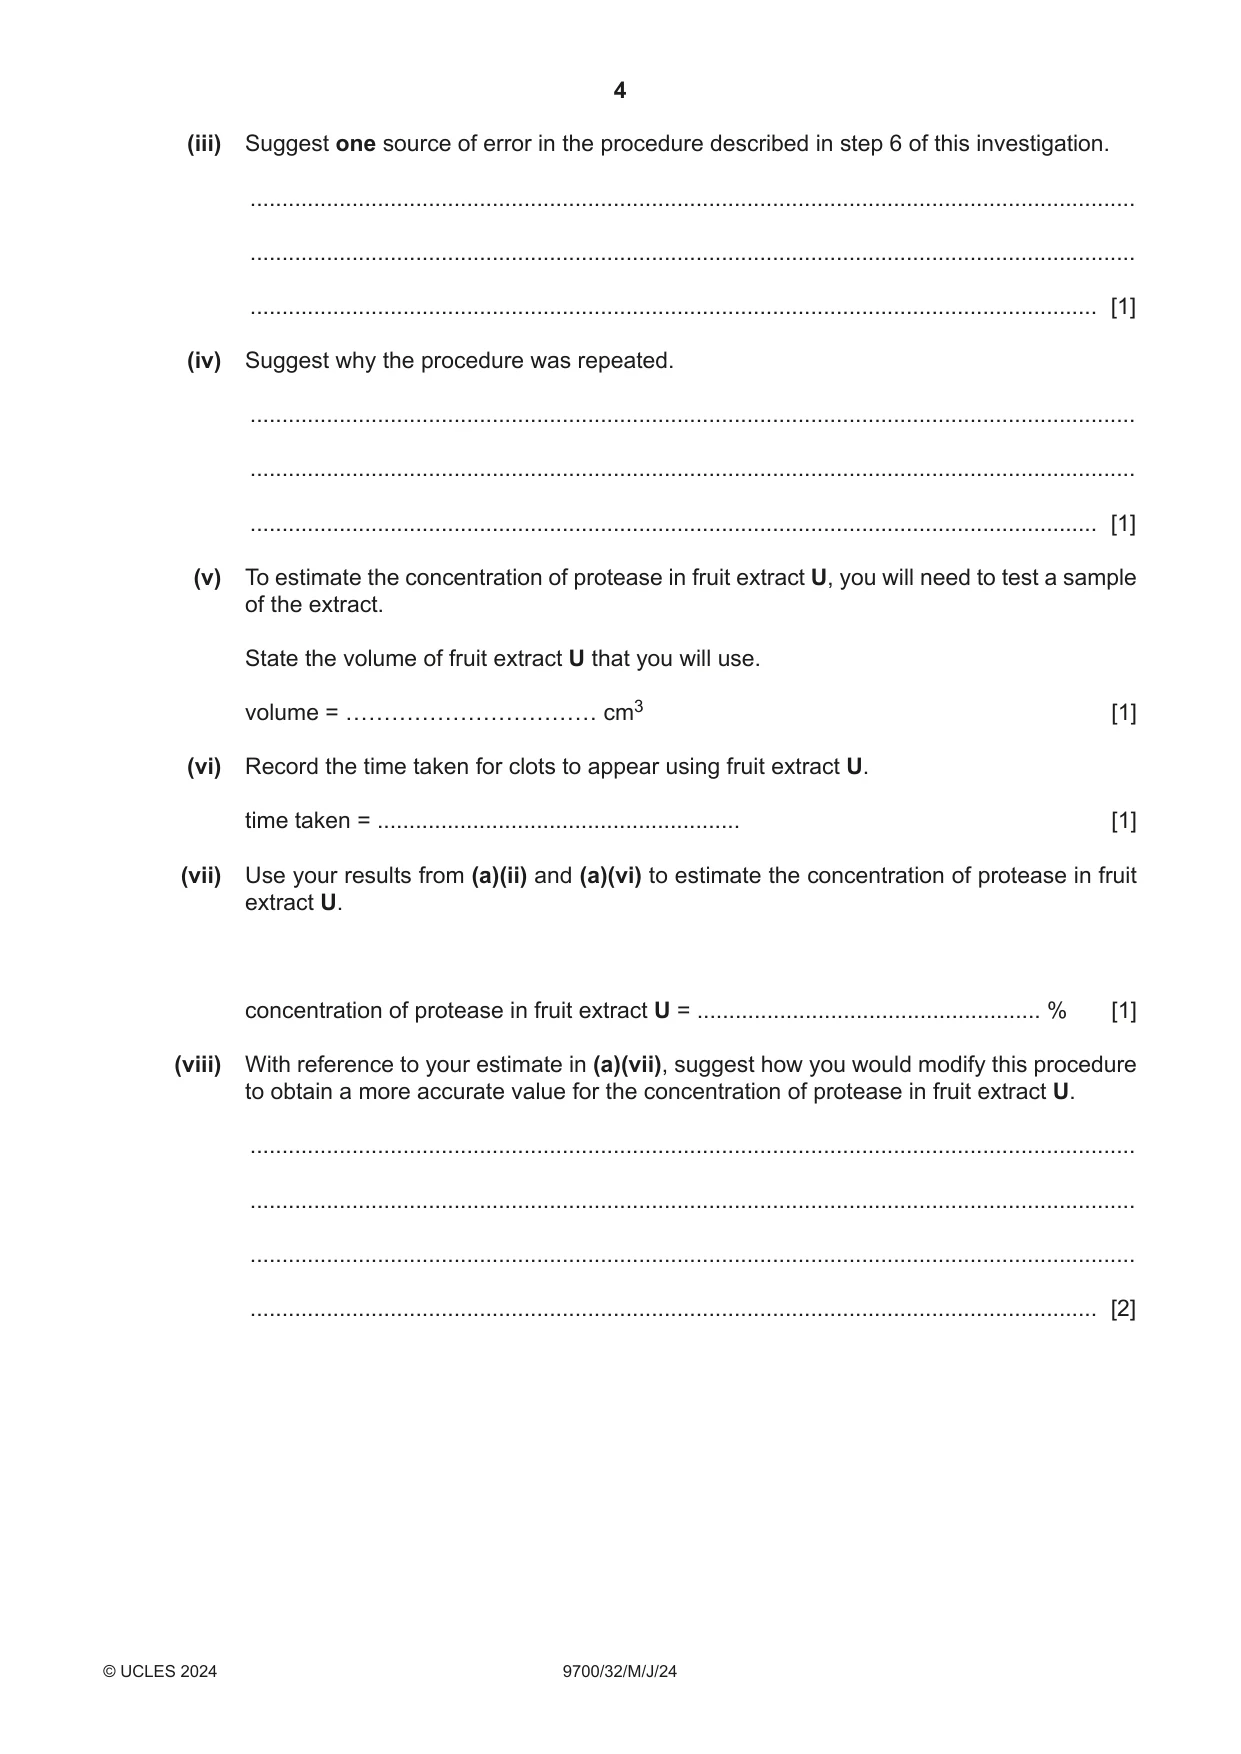
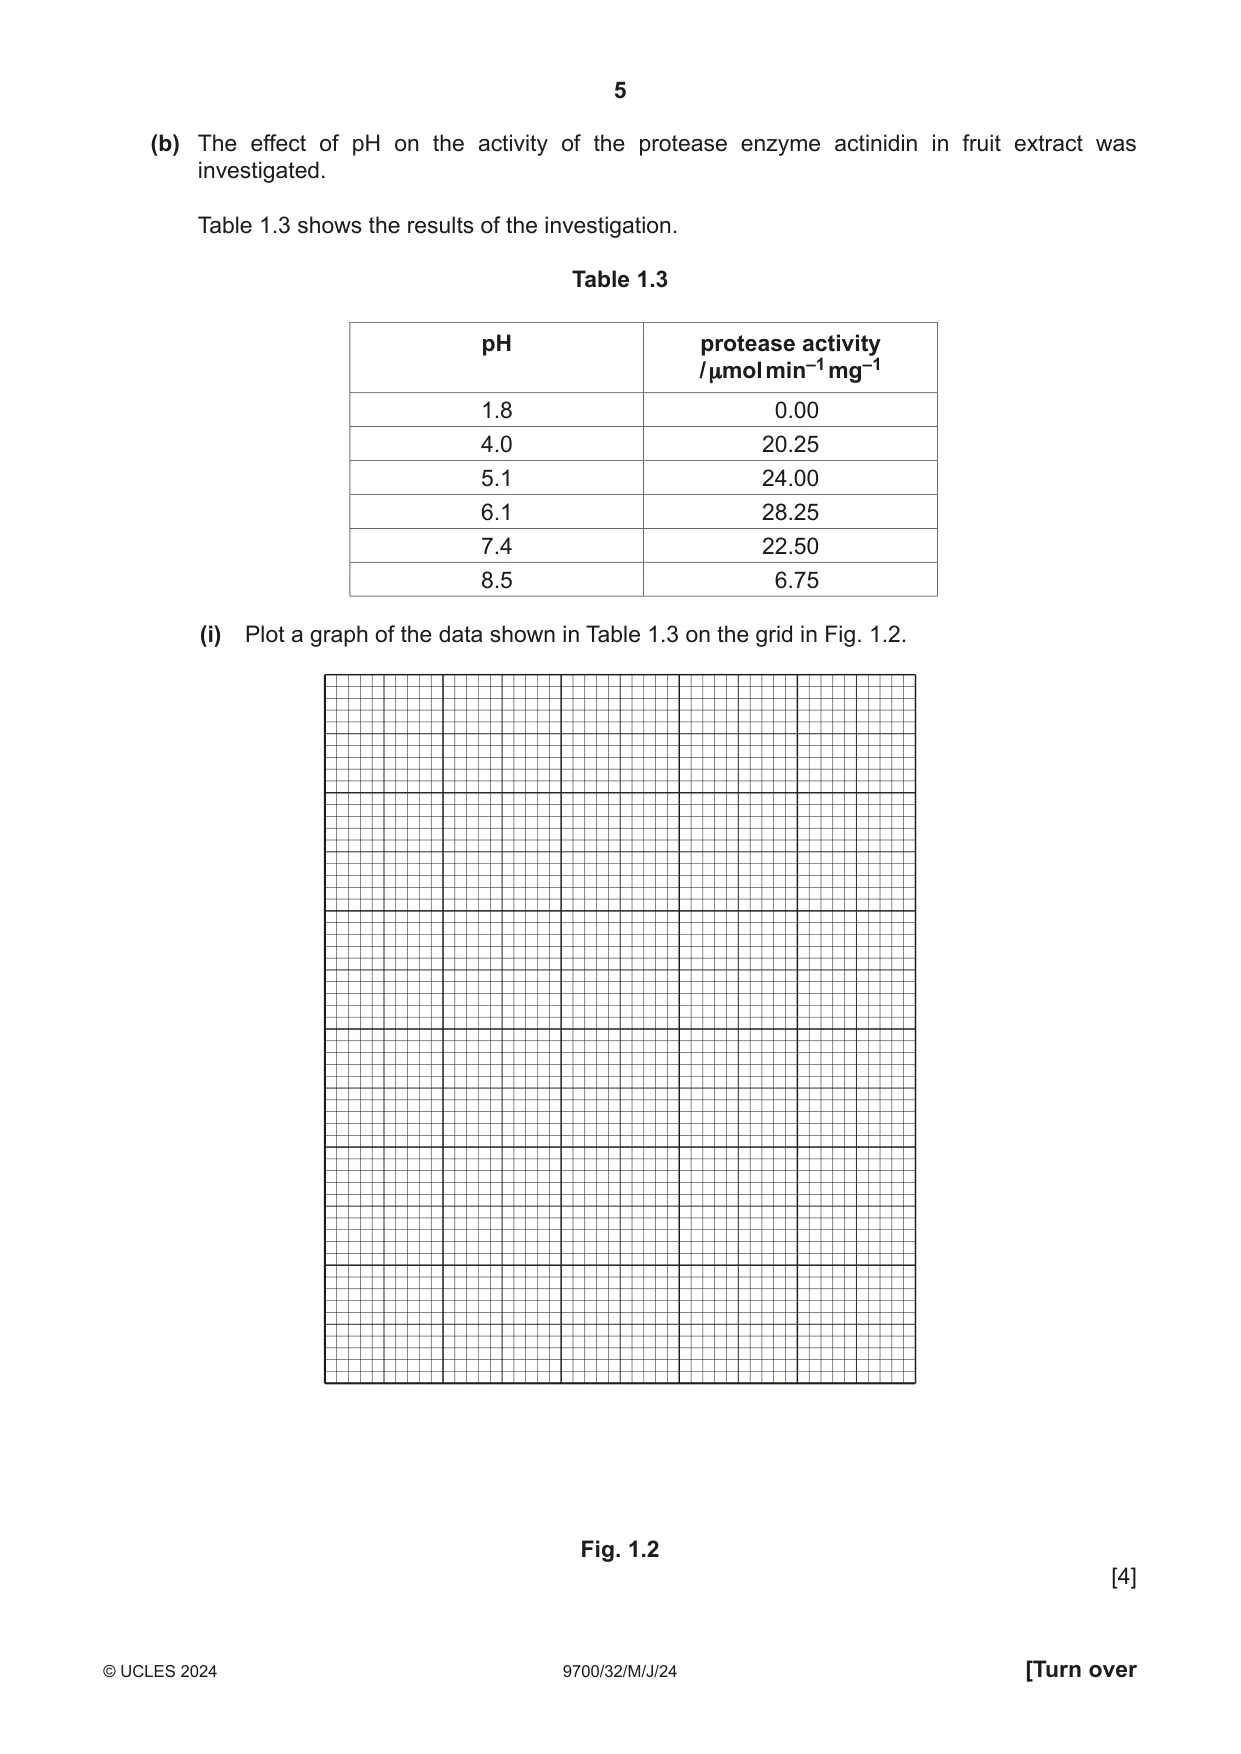
1 Some fruits contain protease enzymes. These enzymes can denature the proteins in milk, causing the milk to clot. You will investigate the effect of protease concentration on the time taken for milk to clot. You will use your results to estimate the concentration of protease in a fruit extract. You are provided with the materials shown in Table 1.1. Table 1.1 labelled contents hazard volume / cm3 P 100% protease solution none 50 M milk none 30 W distilled water none 100 fruit extract containing unknown U none 20 protease concentration If any solution comes into contact with your skin, wash off immediately under cold water. It is recommended that you wear suitable eye protection. You will need to make different concentrations of protease solution, using proportional dilution of the 100% protease solution, P. You will need to prepare 10 cm3 of each concentration, using P and W. Table 1.2 shows how to prepare one of the concentrations of protease you will use. Decide which other concentrations of protease you will use. (a) (i) Complete Table 1.2 to show how you will prepare the concentrations of protease you will use. Table 1.2 percentage concentration volume of P volume of W of protease / cm3 / cm3 100 10.0 0.0 [2] Carry out step 1 to step 8. step 1 Stir the 100% protease solution, P. In the beakers provided, prepare the concentrations of protease as shown in Table 1.2. step 2 Label test-tubes with the concentrations of protease stated in Table 1.2. step 3 Put 2 cm3 of milk, M, into each labelled test-tube. step 4 Put 1 cm3 of the 100% protease solution, P, into the appropriately labelled test-tube. Start timing. step 5 Hold the test-tube at an angle and slowly rotate the test-tube as shown in Fig. 1.1. Hold a piece of black card behind the test-tube and observe the thin layer of milk on the side of the test-tube. step 6 As soon as a number of small clots appear, stop timing and record the value in (a)(ii). If there are no clots after 180 seconds, stop timing and record as ‘more than 180’. milk drains back small clots stick smoothly from to the sides of the the sides of the test-tube test-tube no clotting clotting Fig. 1.1 step 7 Repeat step 4 to step 6 with each of the other concentrations of protease you prepared in step 1. Record your results in (a)(ii). step 8 Repeat step 2 to step 7 using clean test-tubes. (ii) Record the two sets of results in an appropriate table. [5] (iii) Suggest one source of error in the procedure described in step 6 of this investigation. ........................................................................................................................................... ........................................................................................................................................... ..................................................................................................................................... [1] (iv) Suggest why the procedure was repeated. ........................................................................................................................................... ........................................................................................................................................... ..................................................................................................................................... [1] (v) To estimate the concentration of protease in fruit extract U, you will need to test a sample of the extract. State the volume of fruit extract U that you will use. volume = …………………………… cm3 [1] (vi) Record the time taken for clots to appear using fruit extract U. time taken = ......................................................... [1] (vii) Use your results from (a)(ii) and (a)(vi) to estimate the concentration of protease in fruit extract U. concentration of protease in fruit extract U = ...................................................... % [1] (viii) With reference to your estimate in (a)(vii), suggest how you would modify this procedure to obtain a more accurate value for the concentration of protease in fruit extract U. ........................................................................................................................................... ........................................................................................................................................... ........................................................................................................................................... ..................................................................................................................................... [2] (b) The effect of pH on the activity of the protease enzyme actinidin in fruit extract was investigated. Table 1.3 shows the results of the investigation. Table 1.3 pH protease activity / μmol min–1 mg–1 1.8 0.00 4.0 20.25 5.1 24.00 6.1 28.25 7.4 22.50 8.5 6.75 (i) Plot a graph of the data shown in Table 1.3 on the grid in Fig. 1.2. Fig. 1.2 [4] (ii) Use the data in Table 1.3 and your graph in Fig. 1.2 to explain the effect of pH on the activity of protease. ........................................................................................................................................... ........................................................................................................................................... ........................................................................................................................................... ........................................................................................................................................... ........................................................................................................................................... ..................................................................................................................................... [3] [Total: 21]
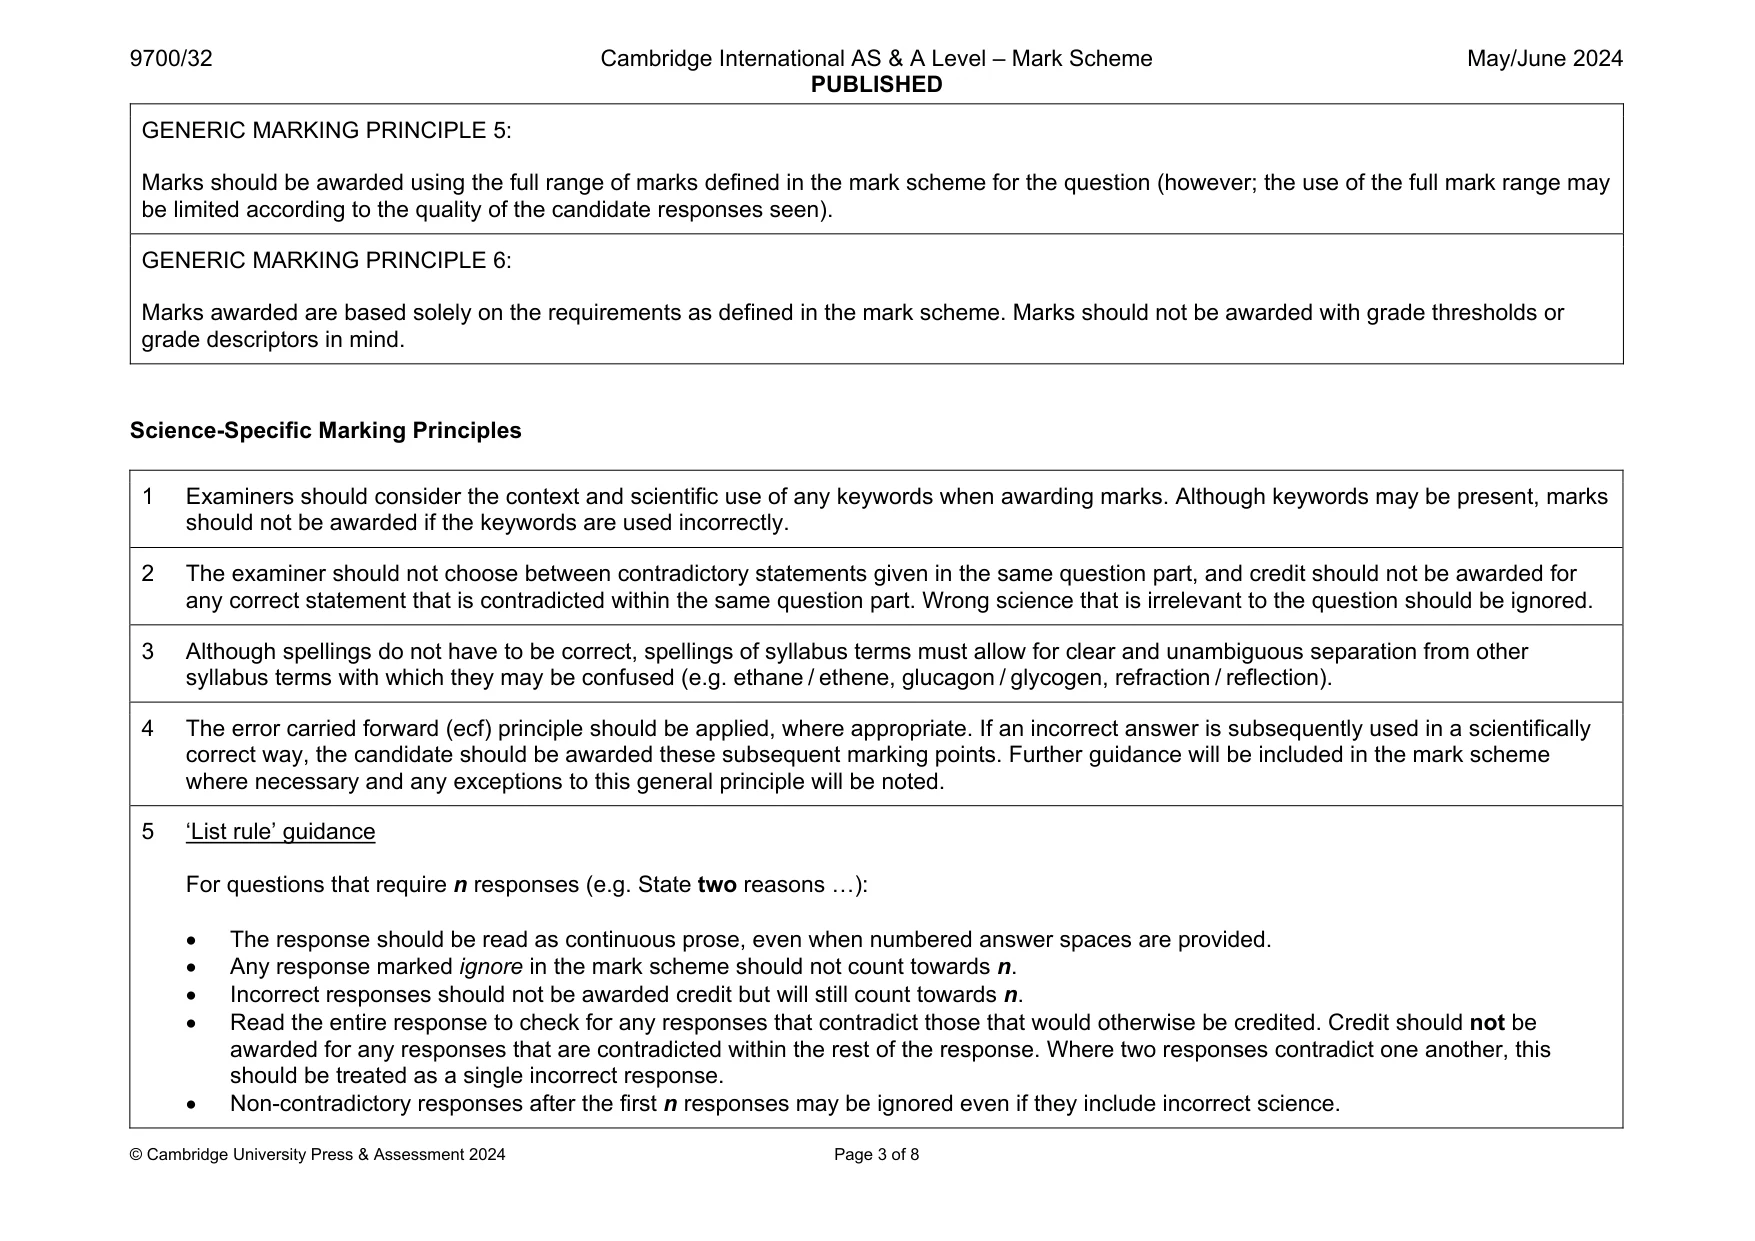
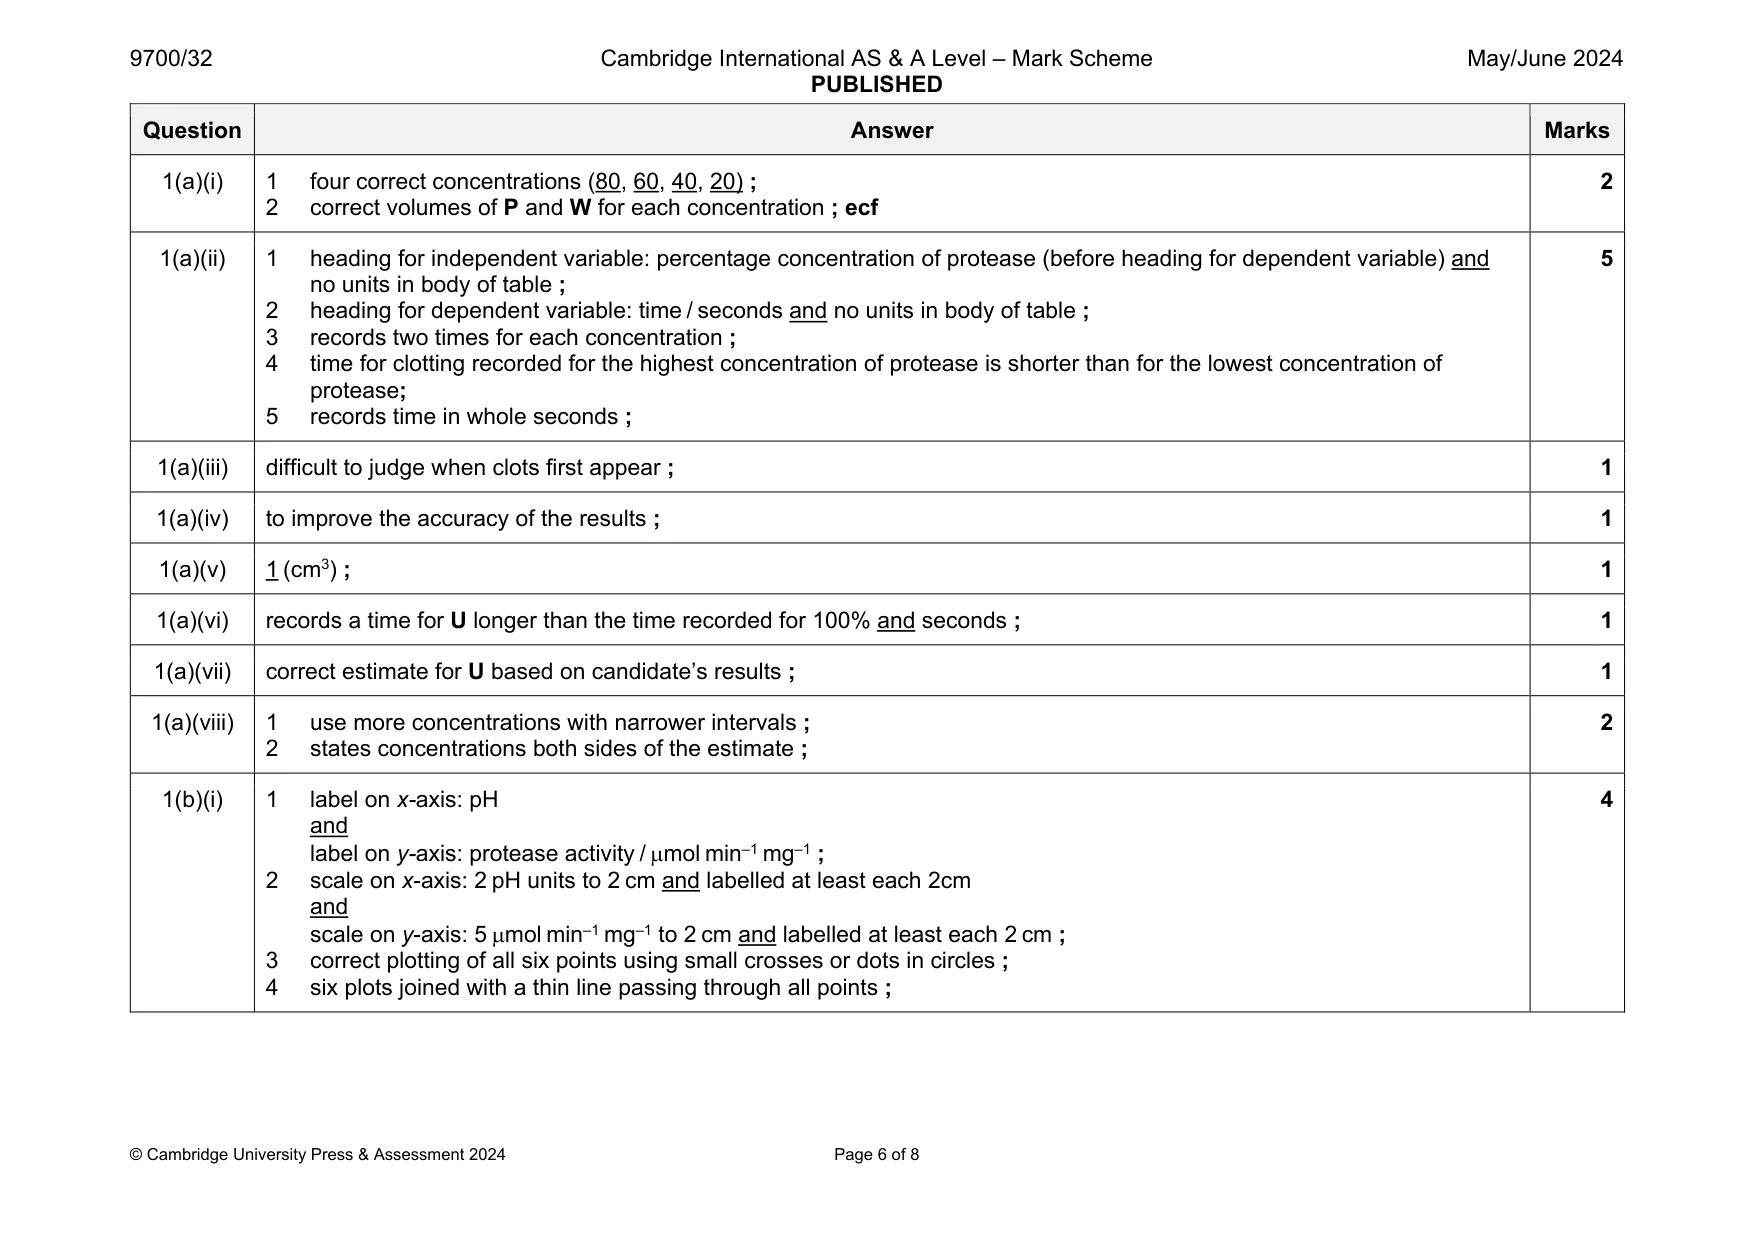
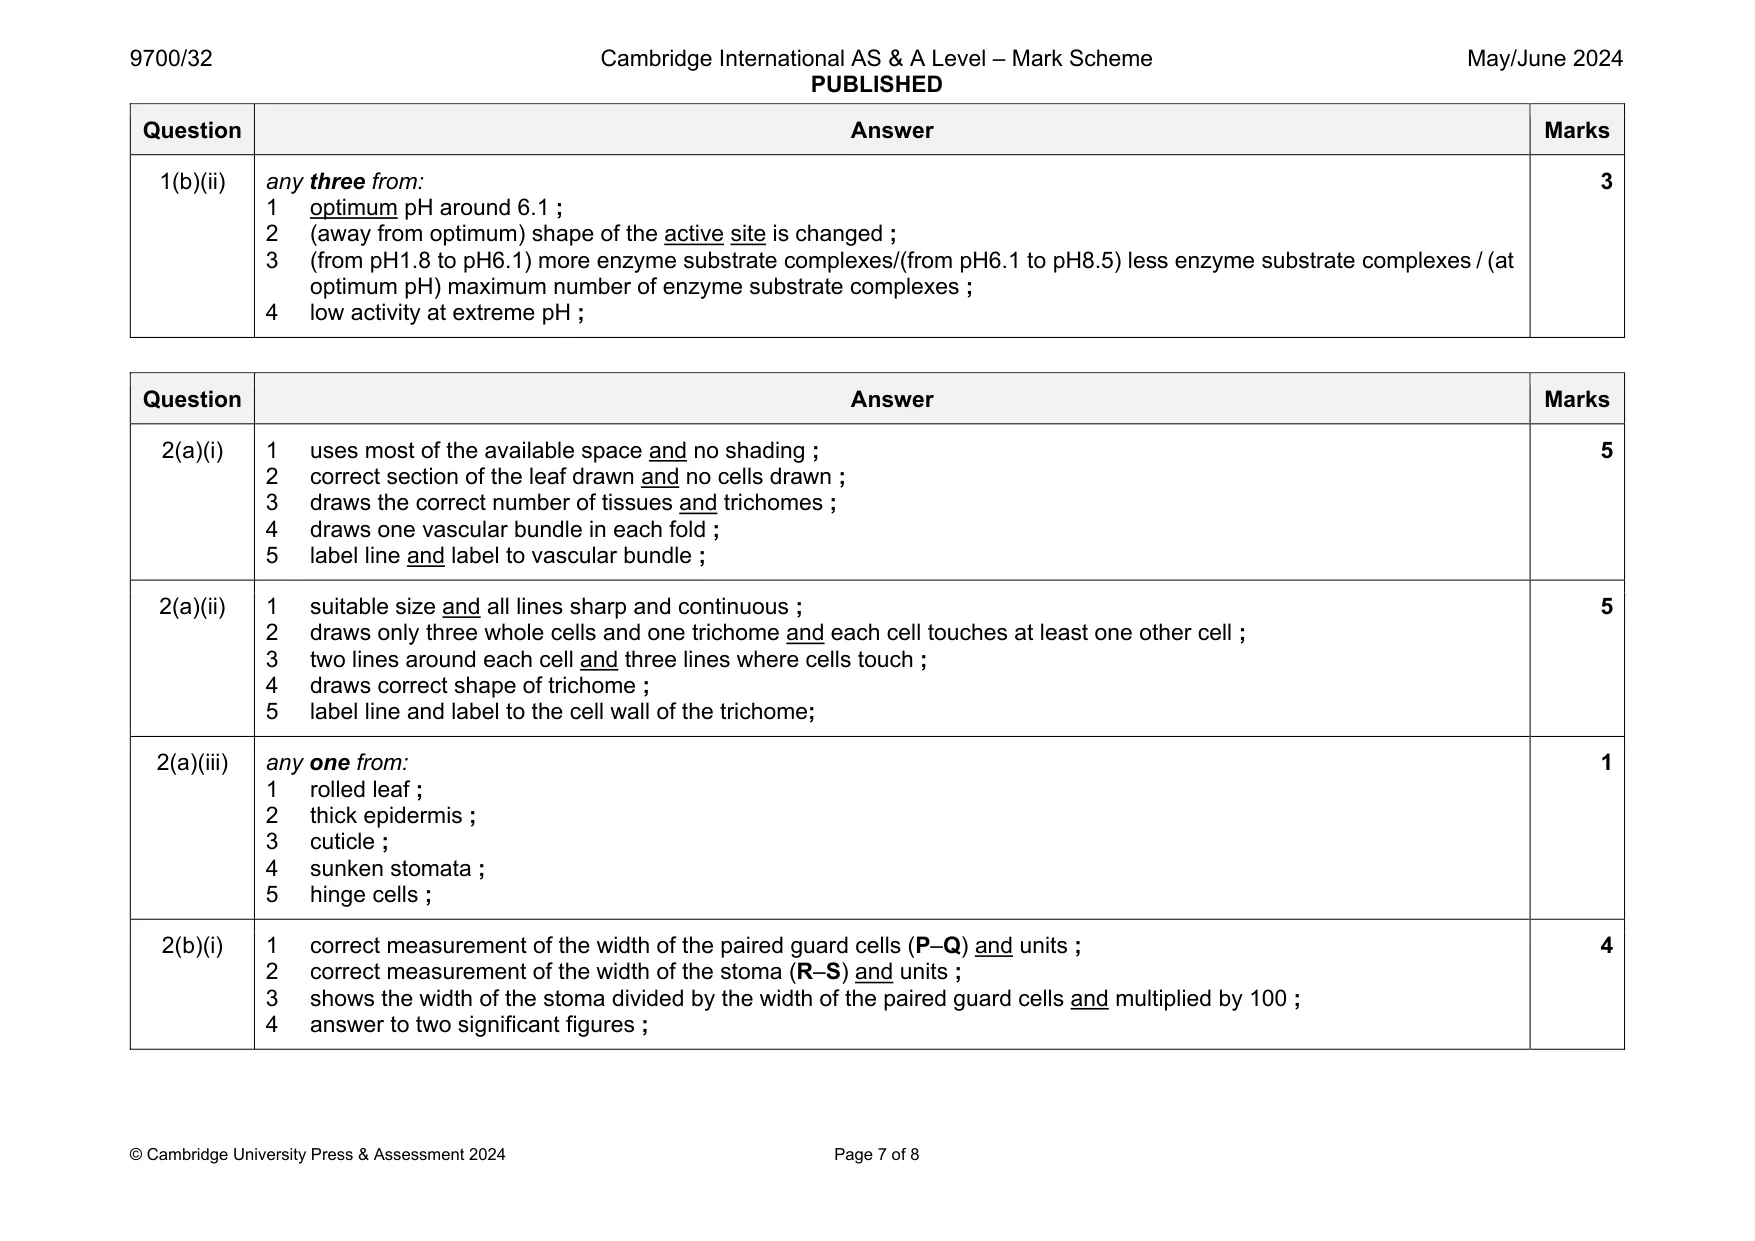
Mark scheme: 1(a)(i) 1 four correct concentrations (80, 60, 40, 20) ; 2 correct volumes of P and W for each concentration ; ecf 2 1(a)(ii) 1 heading for independent variable: percentage concentration of protease (before heading for dependent variable) and no units in body of table ; 2 heading for dependent variable: time / seconds and no units in body of table ; 3 records two times for each concentration ; 4 time for clotting recorded for the highest concentration of protease is shorter than for the lowest concentration of protease; 5 records time in whole seconds ; 5 1(a)(iii) difficult to judge when clots first appear ; 1 1(a)(iv) to improve the accuracy of the results ; 1 1(a)(v) 1 (cm3) ; 1 1(a)(vi) records a time for U longer than the time recorded for 100% and seconds ; 1 1(a)(vii) correct estimate for U based on candidate’s results ; 1 1(a)(viii) 1 use more concentrations with narrower intervals ; 2 states concentrations both sides of the estimate ; 2 1(b)(i) 1 label on x-axis: pH and label on y-axis: protease activity / mol min–1 mg–1 ; 2 scale on x-axis: 2 pH units to 2 cm and labelled at least each 2cm and scale on y-axis: 5 mol min–1 mg–1 to 2 cm and labelled at least each 2 cm ; 3 correct plotting of all six points using small crosses or dots in circles ; 4 six plots joined with a thin line passing through all points ; 4 Question Answer Marks 1(b)(ii) any three from: 1 optimum pH around 6.1 ; 2 (away from optimum) shape of the active site is changed ; 3 (from pH1.8 to pH6.1) more enzyme substrate complexes/(from pH6.1 to pH8.5) less enzyme substrate complexes / (at optimum pH) maximum number of enzyme substrate complexes ; 4 low activity at extreme pH ; 3
Q2 · K1 is a slide of a stained transverse section through a plant leaf
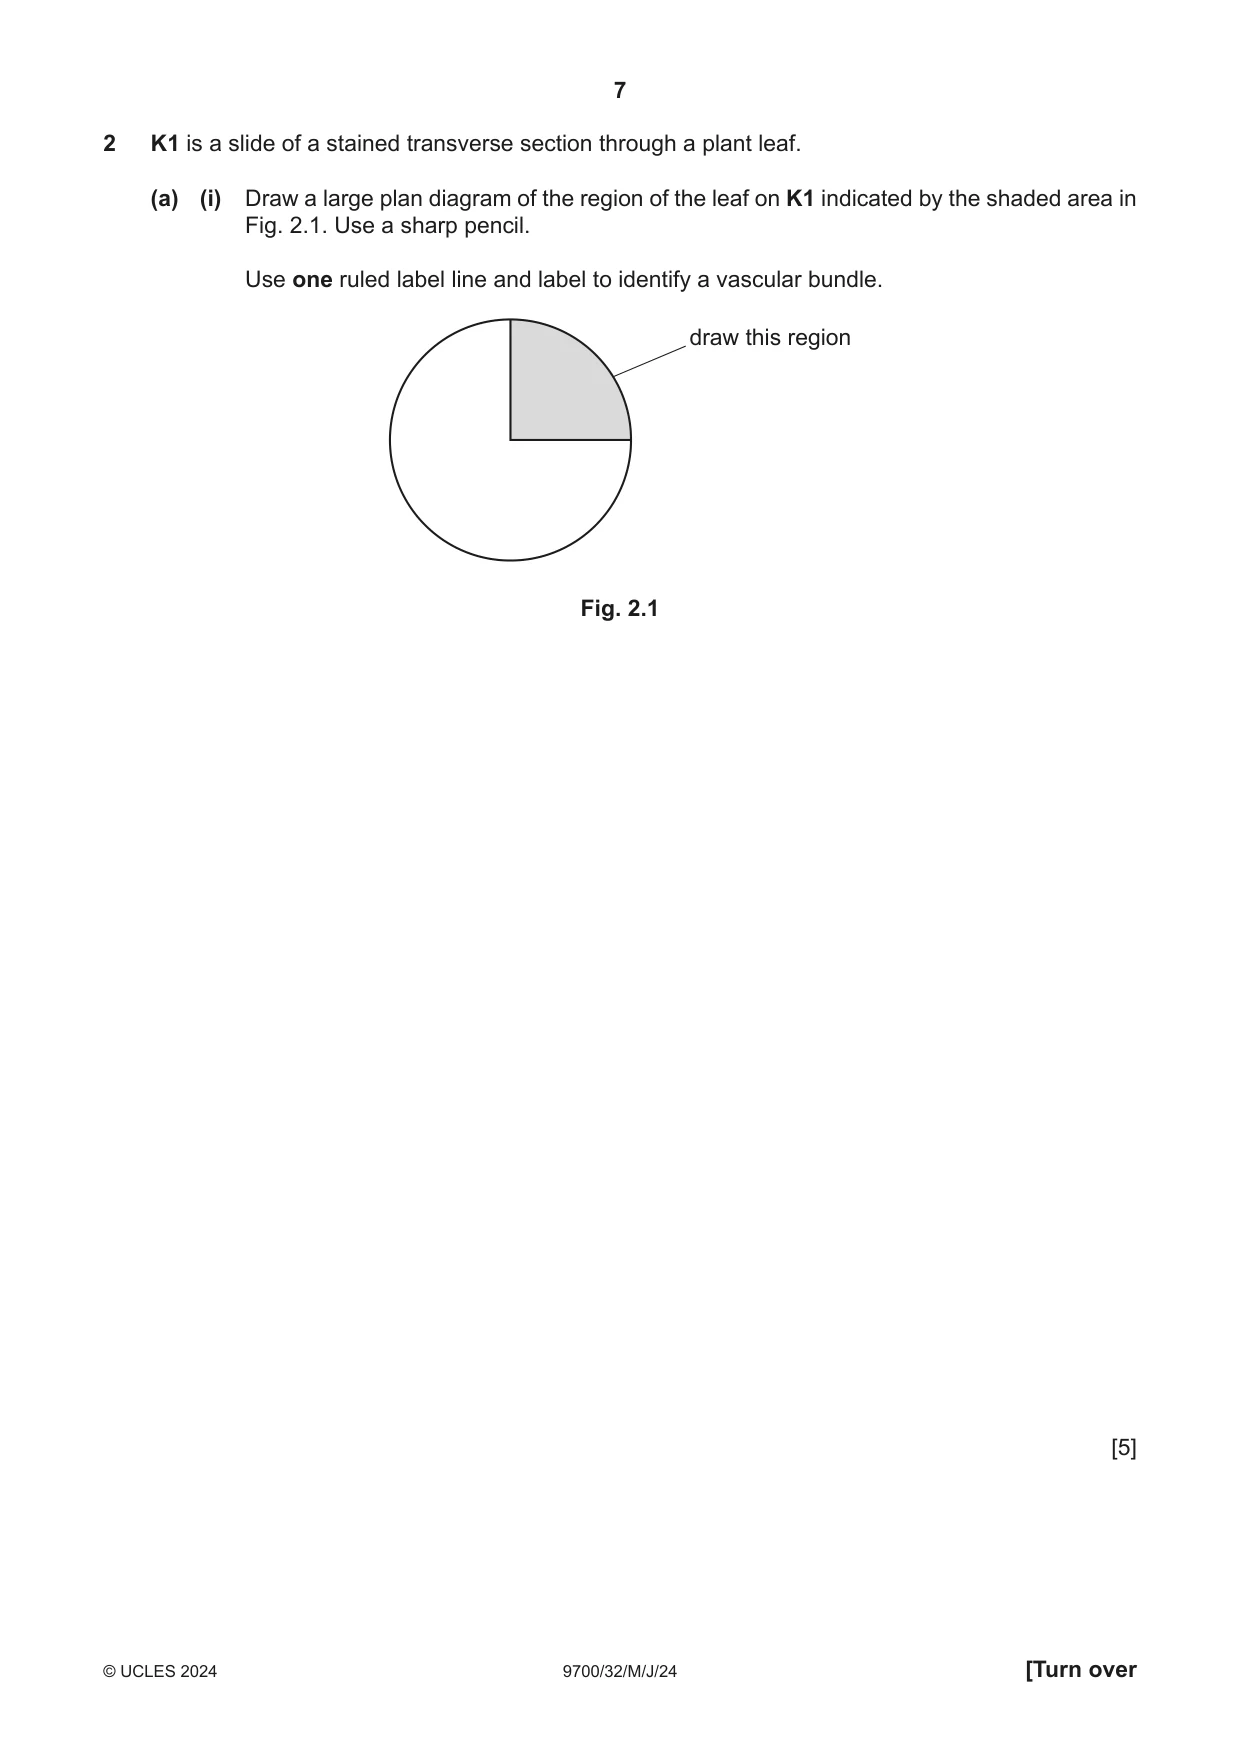
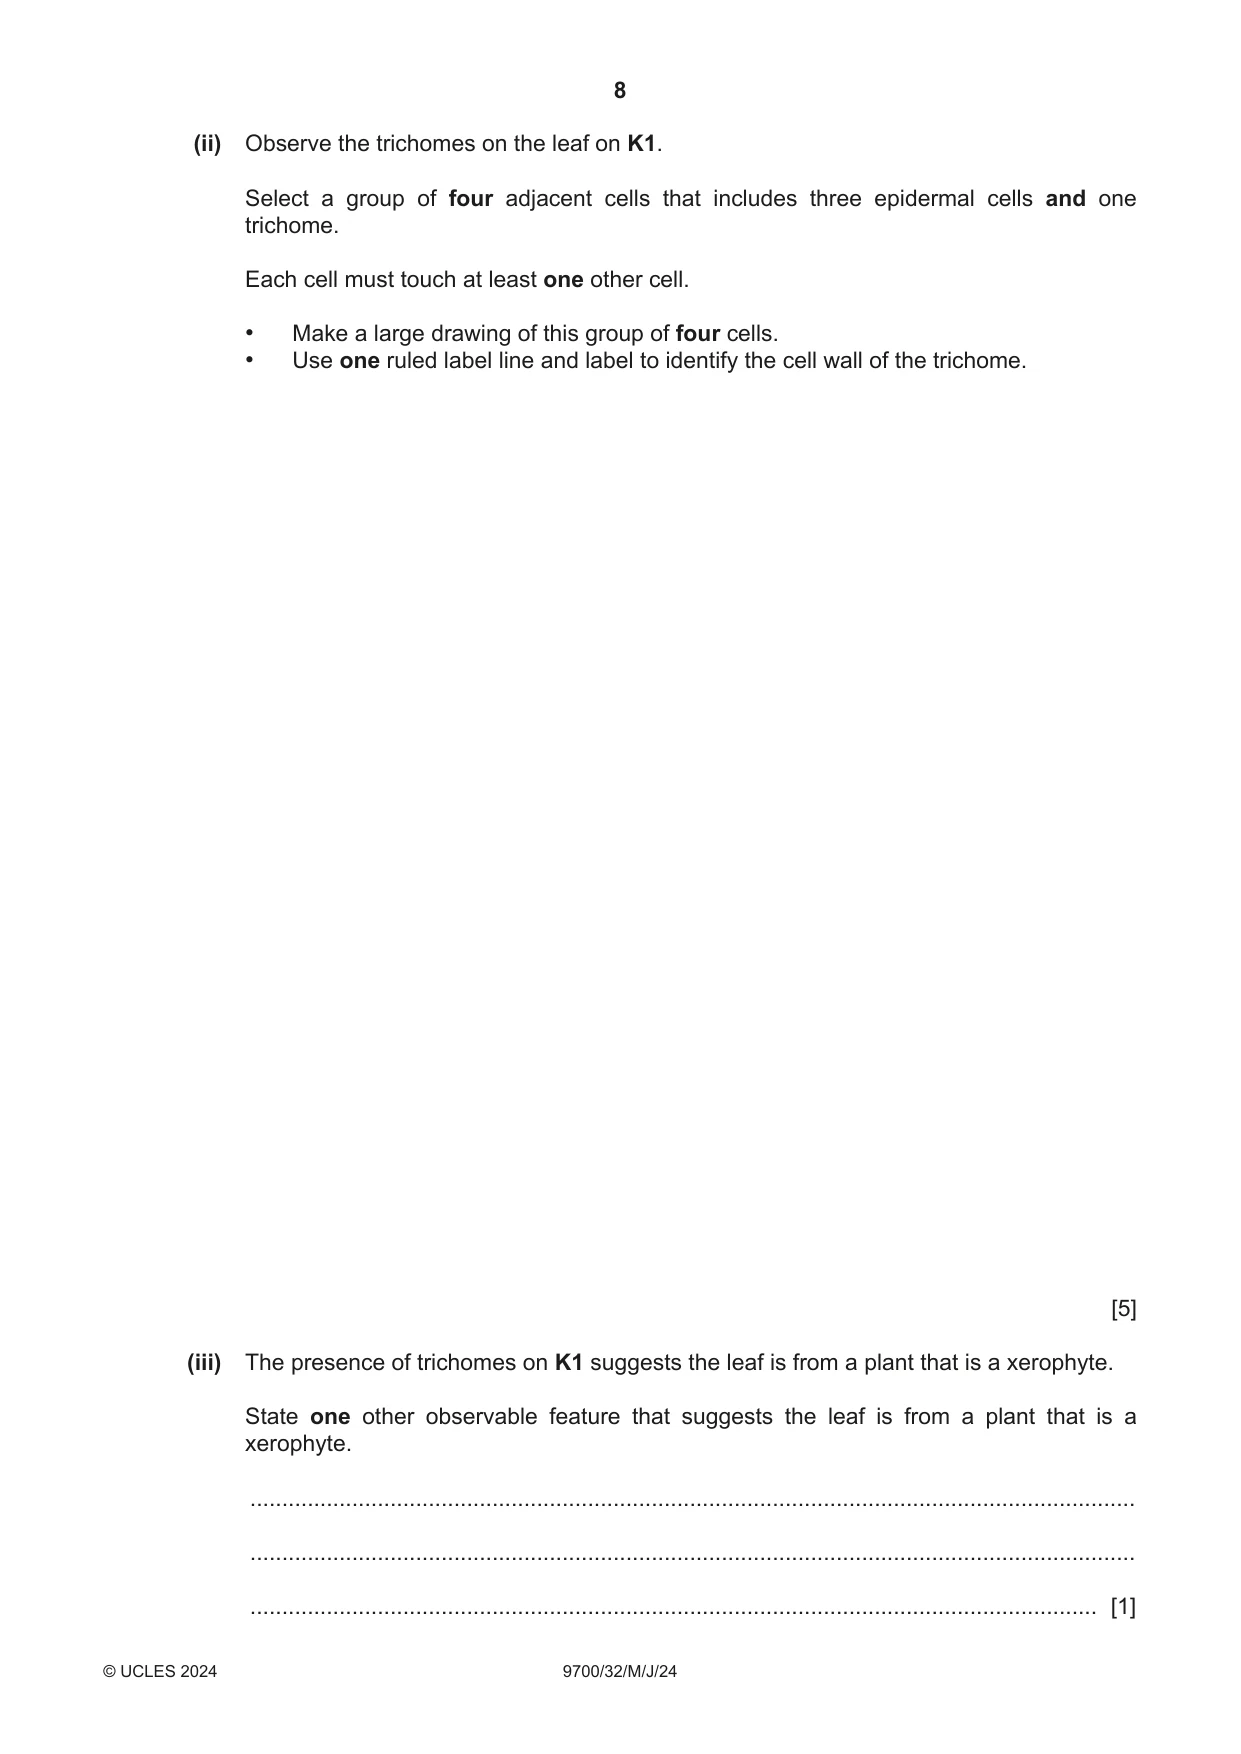
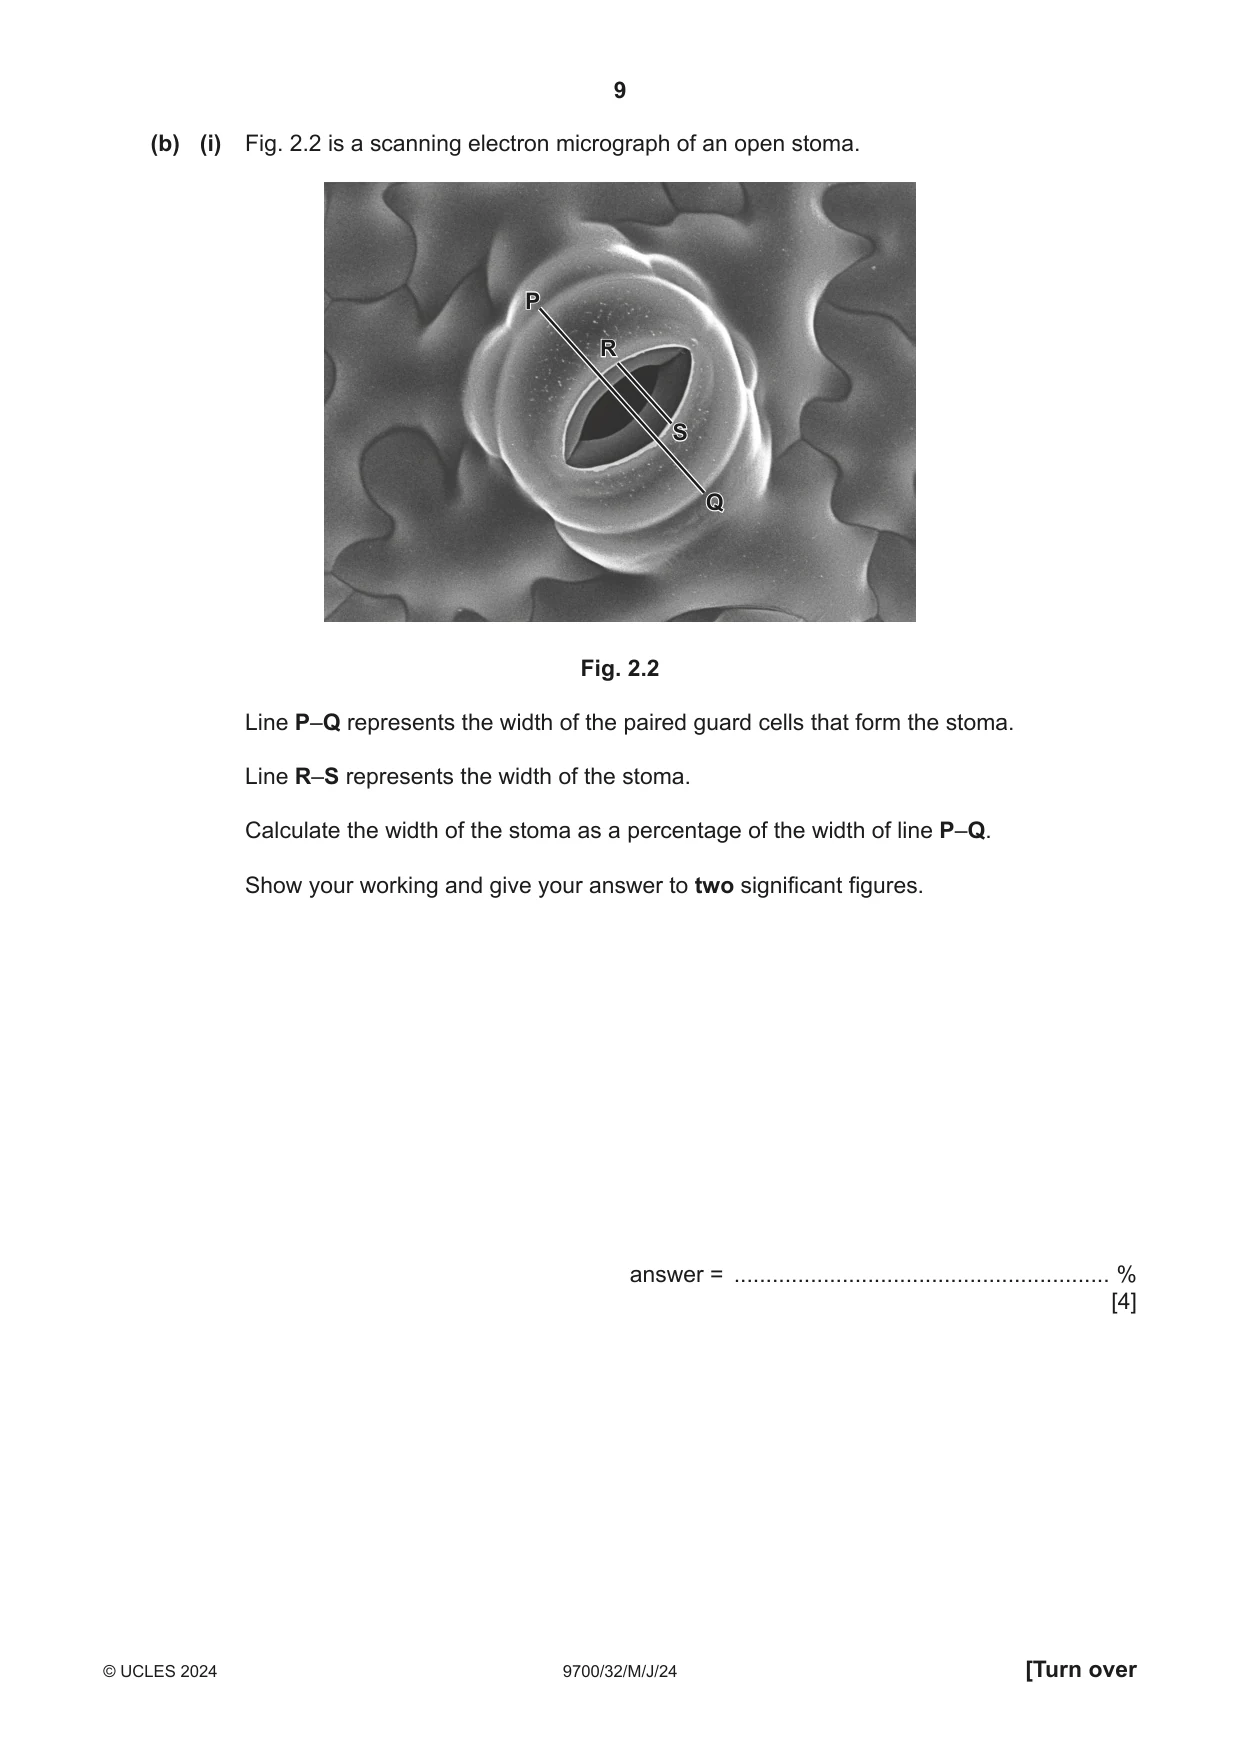
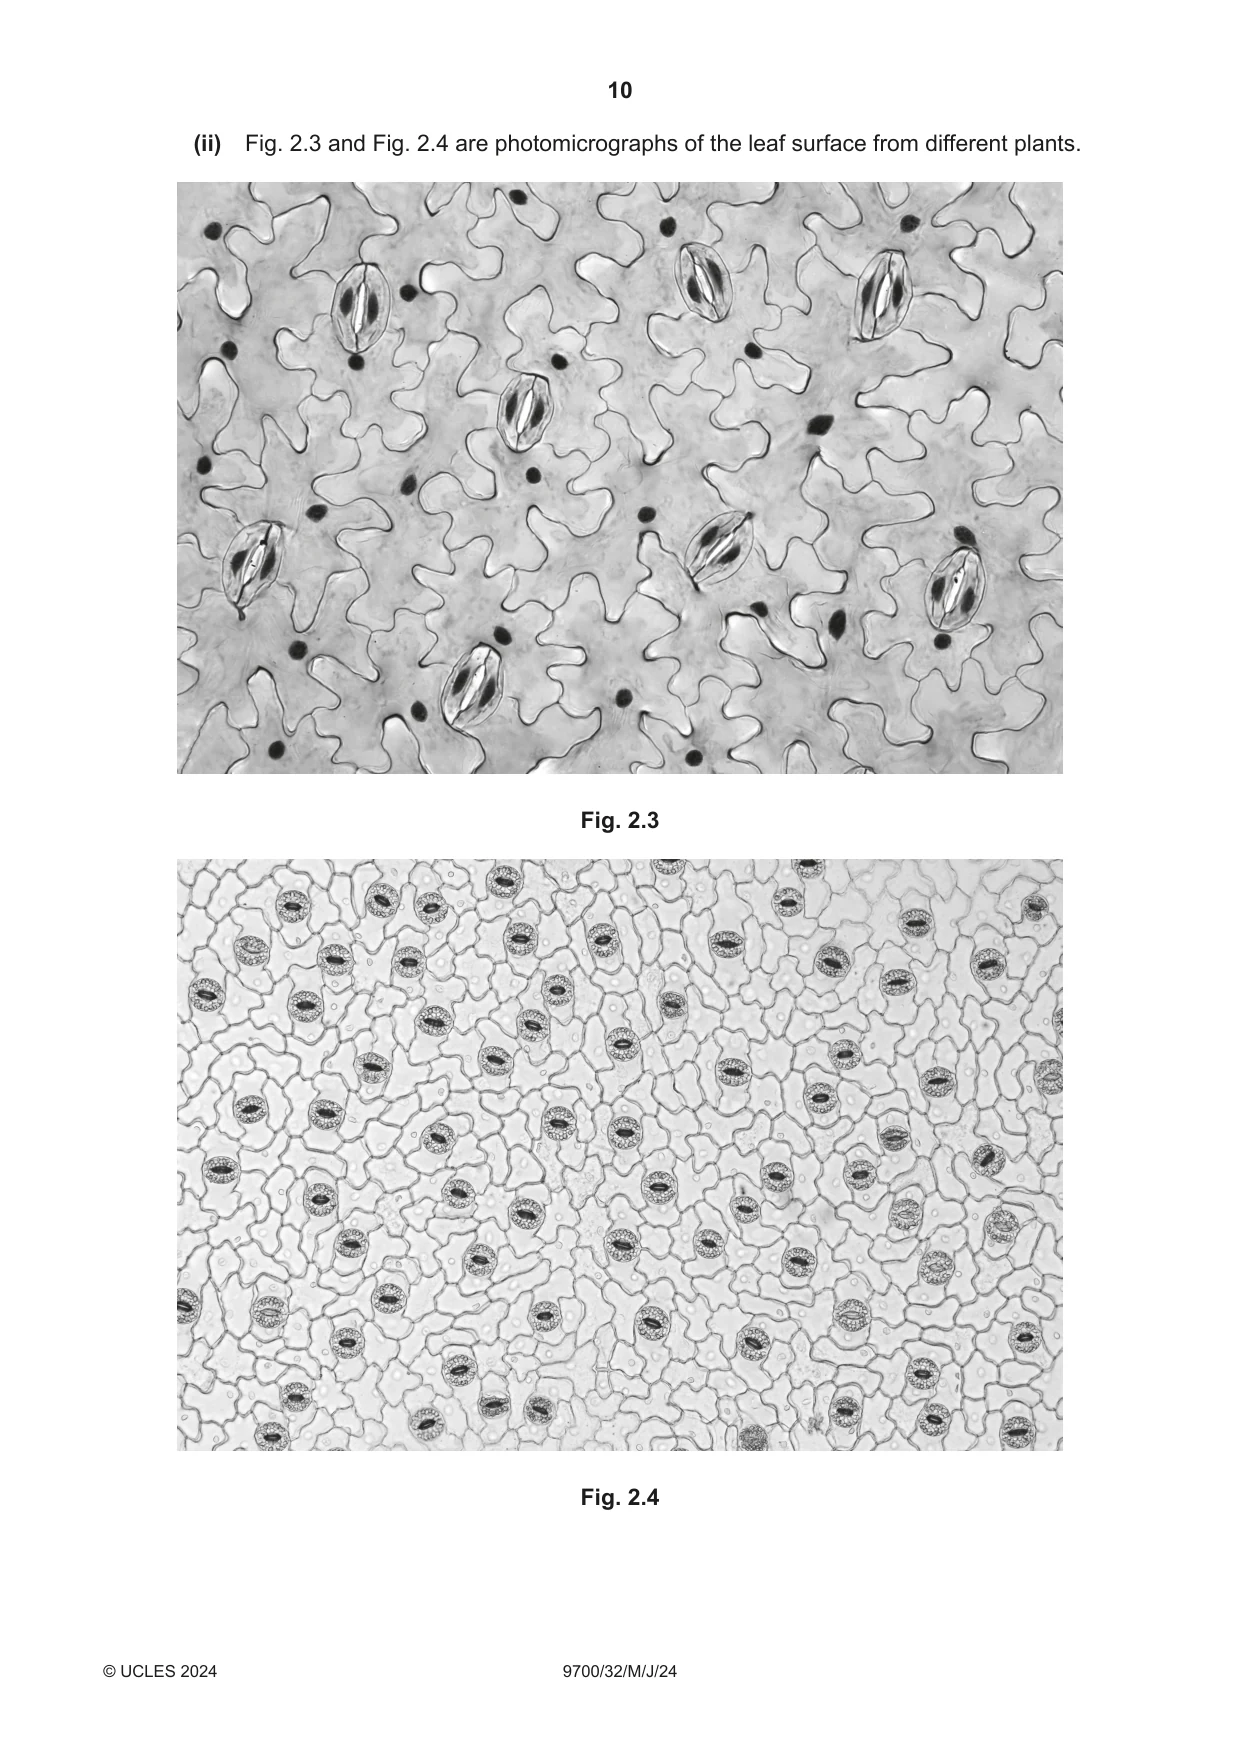
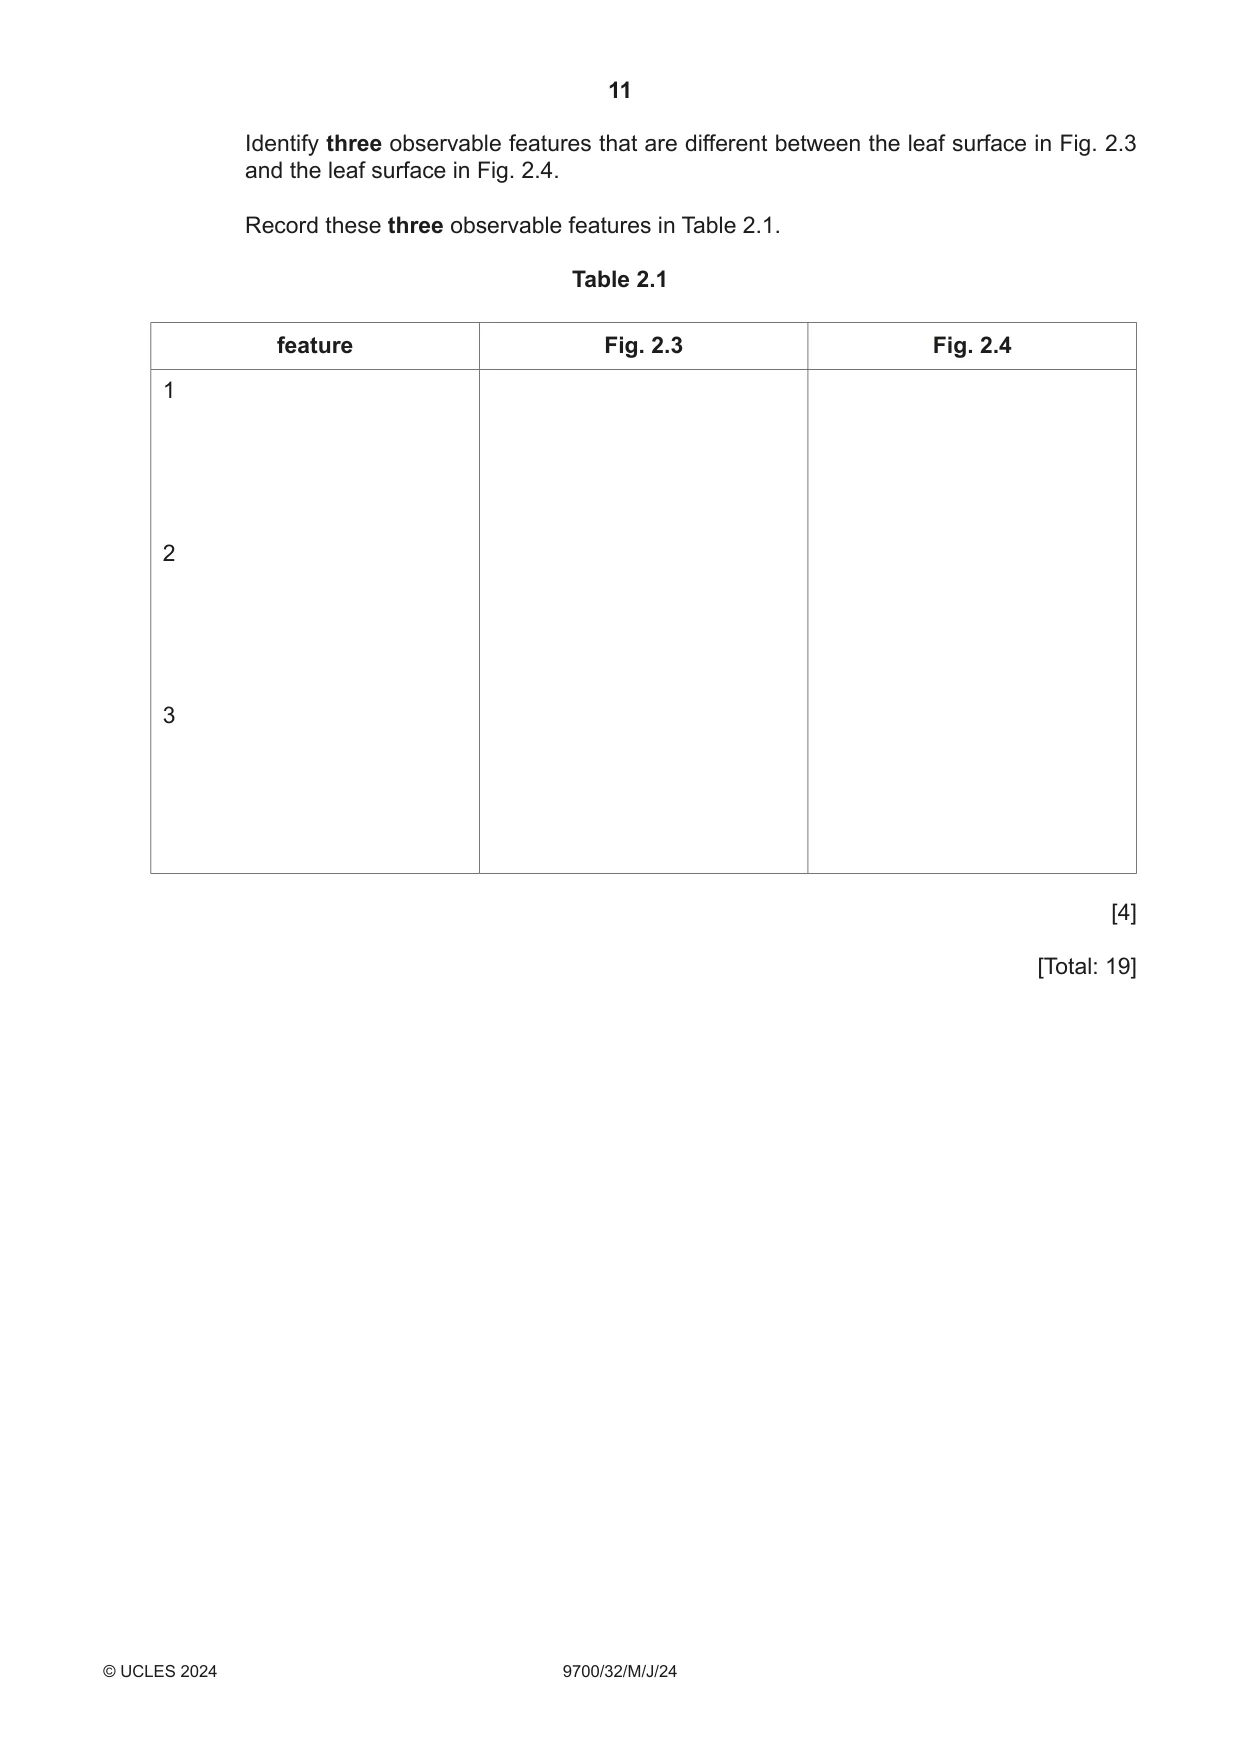
2 K1 is a slide of a stained transverse section through a plant leaf. (a) (i) Draw a large plan diagram of the region of the leaf on K1 indicated by the shaded area in Fig. 2.1. Use a sharp pencil. Use one ruled label line and label to identify a vascular bundle. draw this region Fig. 2.1 [5] (ii) Observe the trichomes on the leaf on K1. Select a group of four adjacent cells that includes three epidermal cells and one trichome. Each cell must touch at least one other cell. • Make a large drawing of this group of four cells. • Use one ruled label line and label to identify the cell wall of the trichome. [5] (iii) The presence of trichomes on K1 suggests the leaf is from a plant that is a xerophyte. State one other observable feature that suggests the leaf is from a plant that is a xerophyte. ........................................................................................................................................... ........................................................................................................................................... ..................................................................................................................................... [1] (b) (i) Fig. 2.2 is a scanning electron micrograph of an open stoma. P R S Q Fig. 2.2 Line P–Q represents the width of the paired guard cells that form the stoma. Line R–S represents the width of the stoma. Calculate the width of the stoma as a percentage of the width of line P–Q. Show your working and give your answer to two significant figures. answer = ........................................................... % [4]
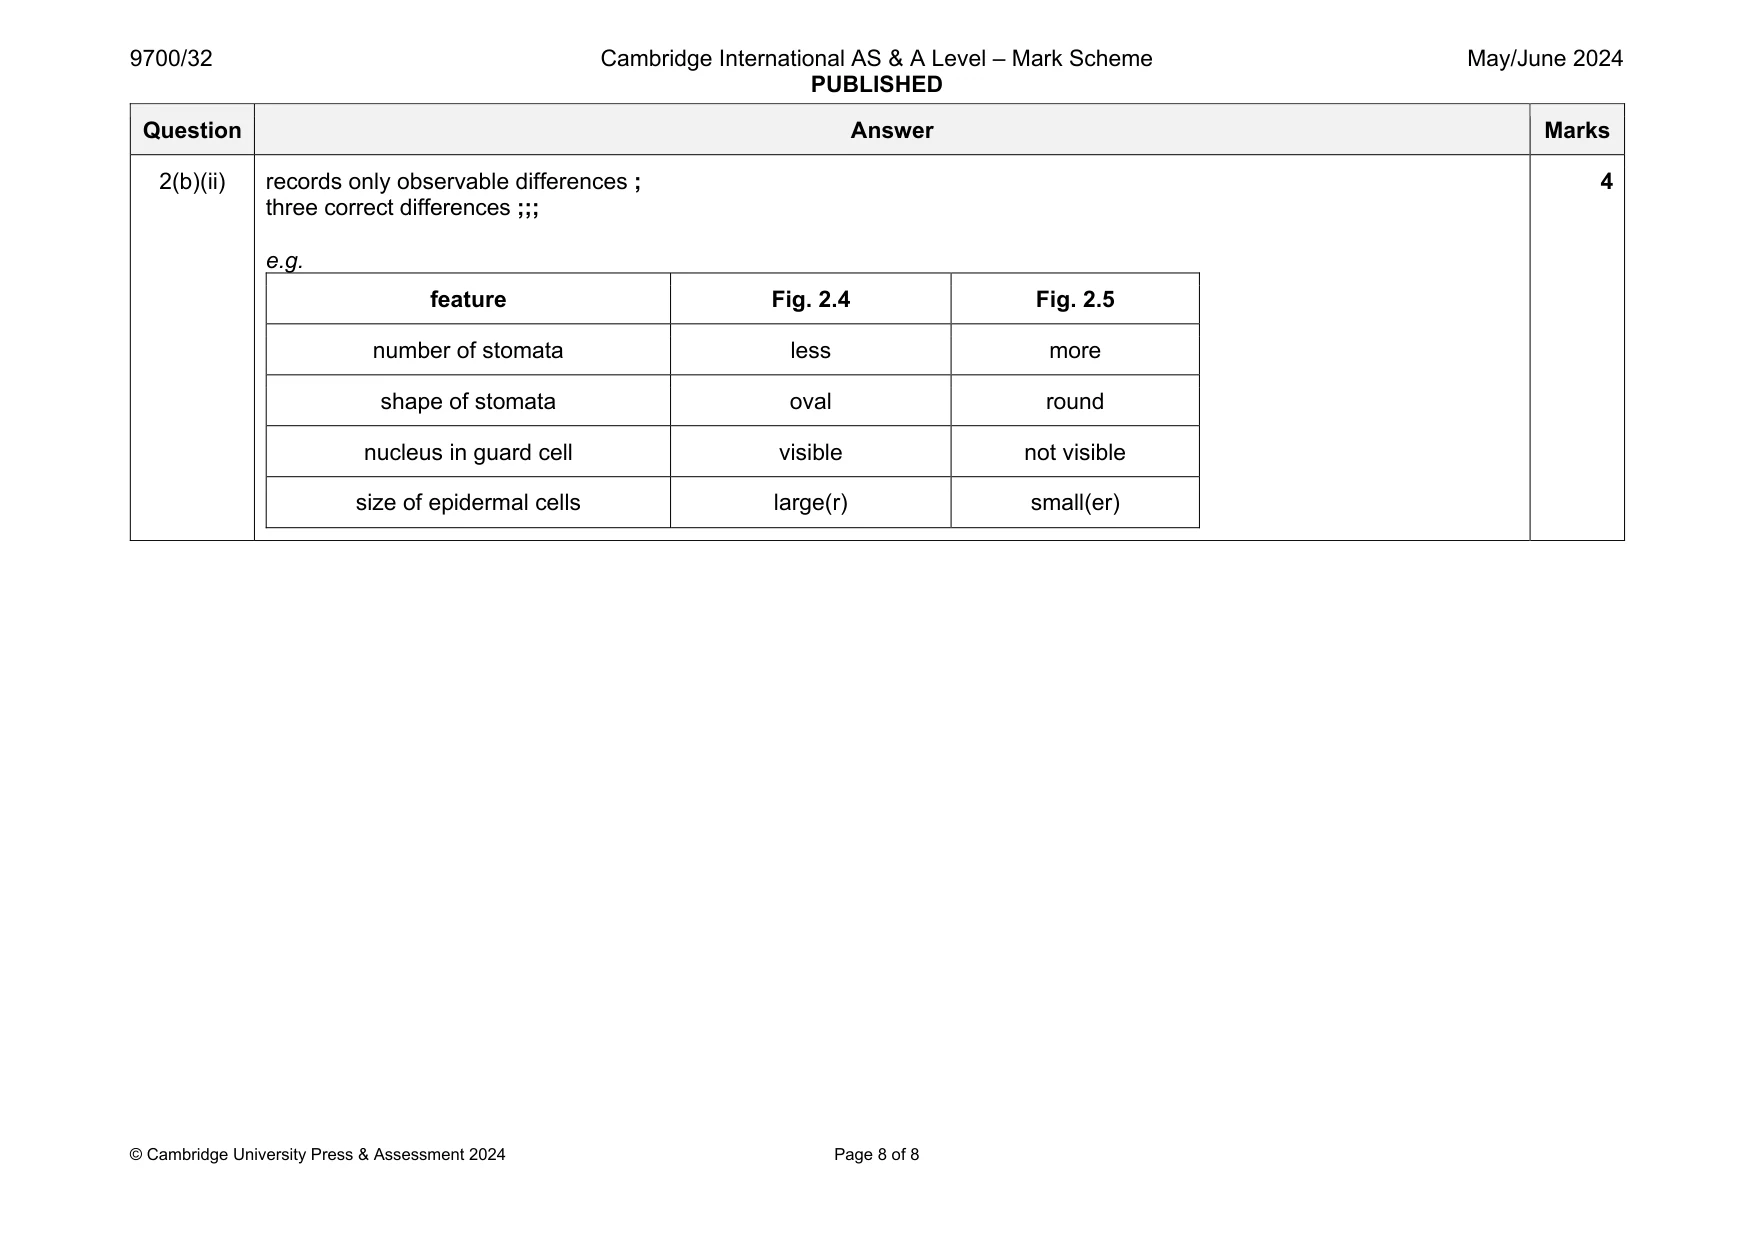
Mark scheme: 2(a)(i) 1 uses most of the available space and no shading ; 2 correct section of the leaf drawn and no cells drawn ; 3 draws the correct number of tissues and trichomes ; 4 draws one vascular bundle in each fold ; 5 label line and label to vascular bundle ; 5 2(a)(ii) 1 suitable size and all lines sharp and continuous ; 2 draws only three whole cells and one trichome and each cell touches at least one other cell ; 3 two lines around each cell and three lines where cells touch ; 4 draws correct shape of trichome ; 5 label line and label to the cell wall of the trichome; 5 2(a)(iii) any one from: 1 rolled leaf ; 2 thick epidermis ; 3 cuticle ; 4 sunken stomata ; 5 hinge cells ; 1 2(b)(i) 1 correct measurement of the width of the paired guard cells (P–Q) and units ; 2 correct measurement of the width of the stoma (R–S) and units ; 3 shows the width of the stoma divided by the width of the paired guard cells and multiplied by 100 ; 4 answer to two significant figures ; 4 Question Answer Marks 2(b)(ii) records only observable differences ; three correct differences ;;; e.g. feature Fig. 2.4 Fig. 2.5 number of stomata less more shape of stomata oval round nucleus in guard cell visible not visible size of epidermal cells large(r) small(er) 4
More questions on Cells as the basic units of living organisms
What was in this paper
The subtopics covered by these 2 questions, and how many questions each got. Open one in a new tab to see every Cambridge question on it.
What you needed in this session
Cambridge’s own grade thresholds for 2024 May/June, Paper 3 · Variant 2. A higher threshold means an easier paper — the bar moves with how the cohort did.