Cambridge A Level Biology 9700 — 2024 Oct/Nov Paper 3 · Variant 1
9700/31/O/N/24 · 2 questions · 40 marks · ≈45 min
The question paper and its mark scheme, free to read here and free to download. This is Cambridge’s own paper, exactly as it was sat.
Question paper12 pages
Mark scheme7 pages
Answers below. Sit the paper first if you are practising.
Questions as text
Q1 · Milk is sometimes contaminated with substances such as starch
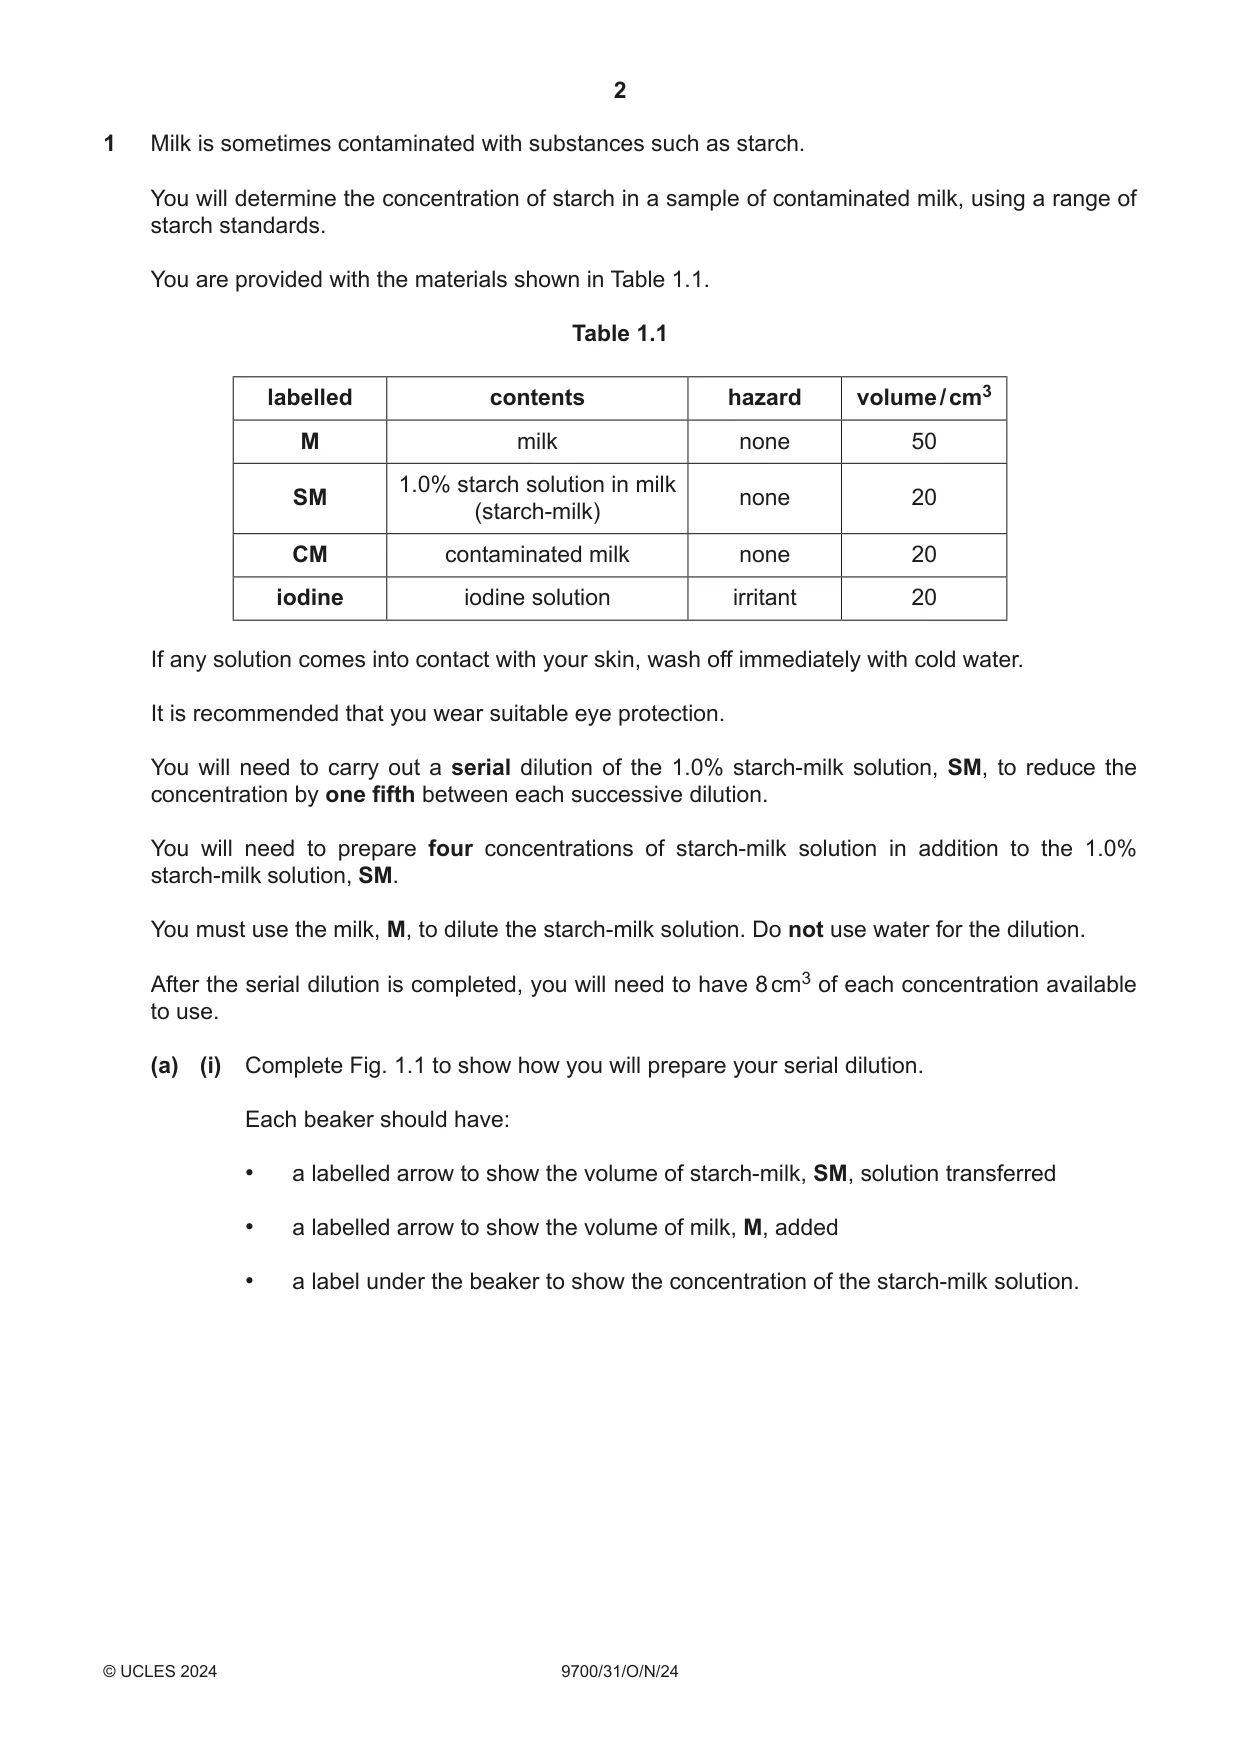
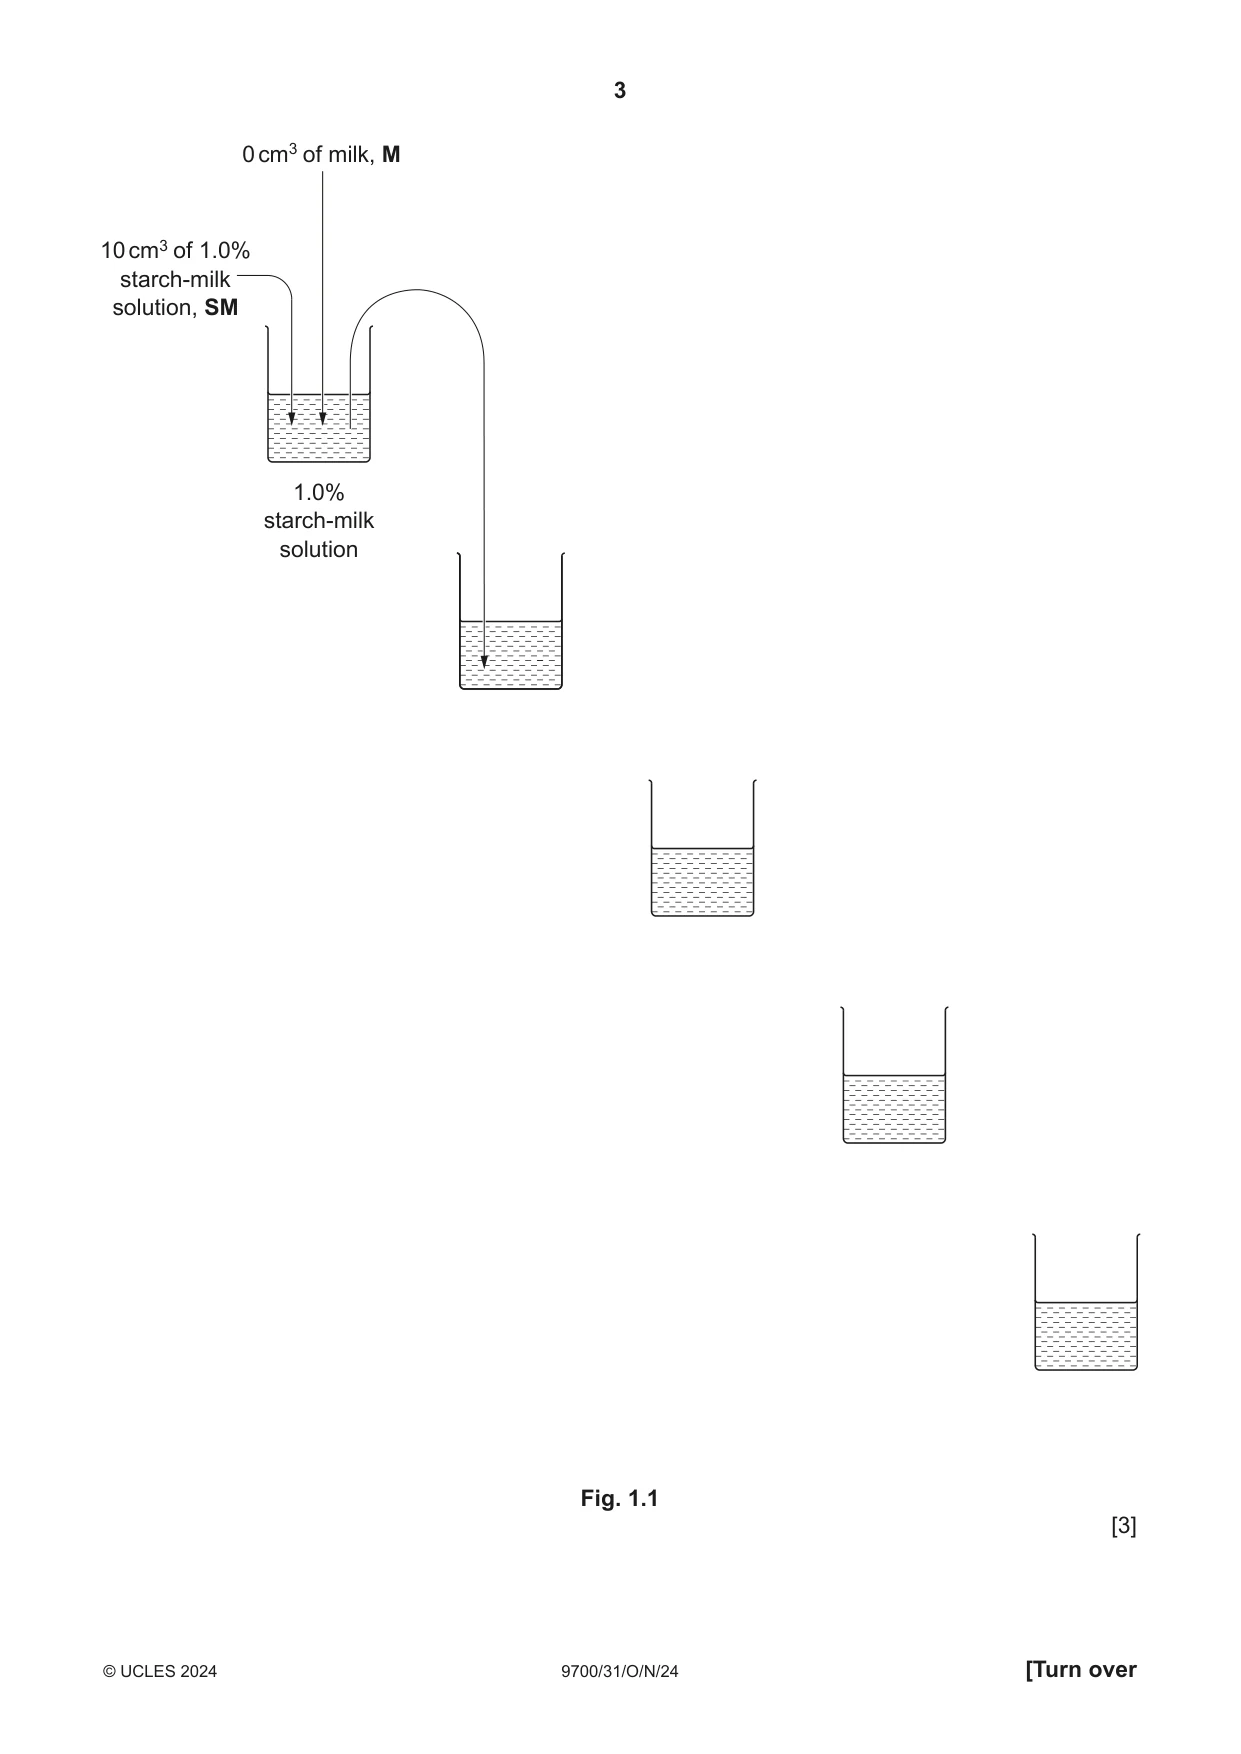
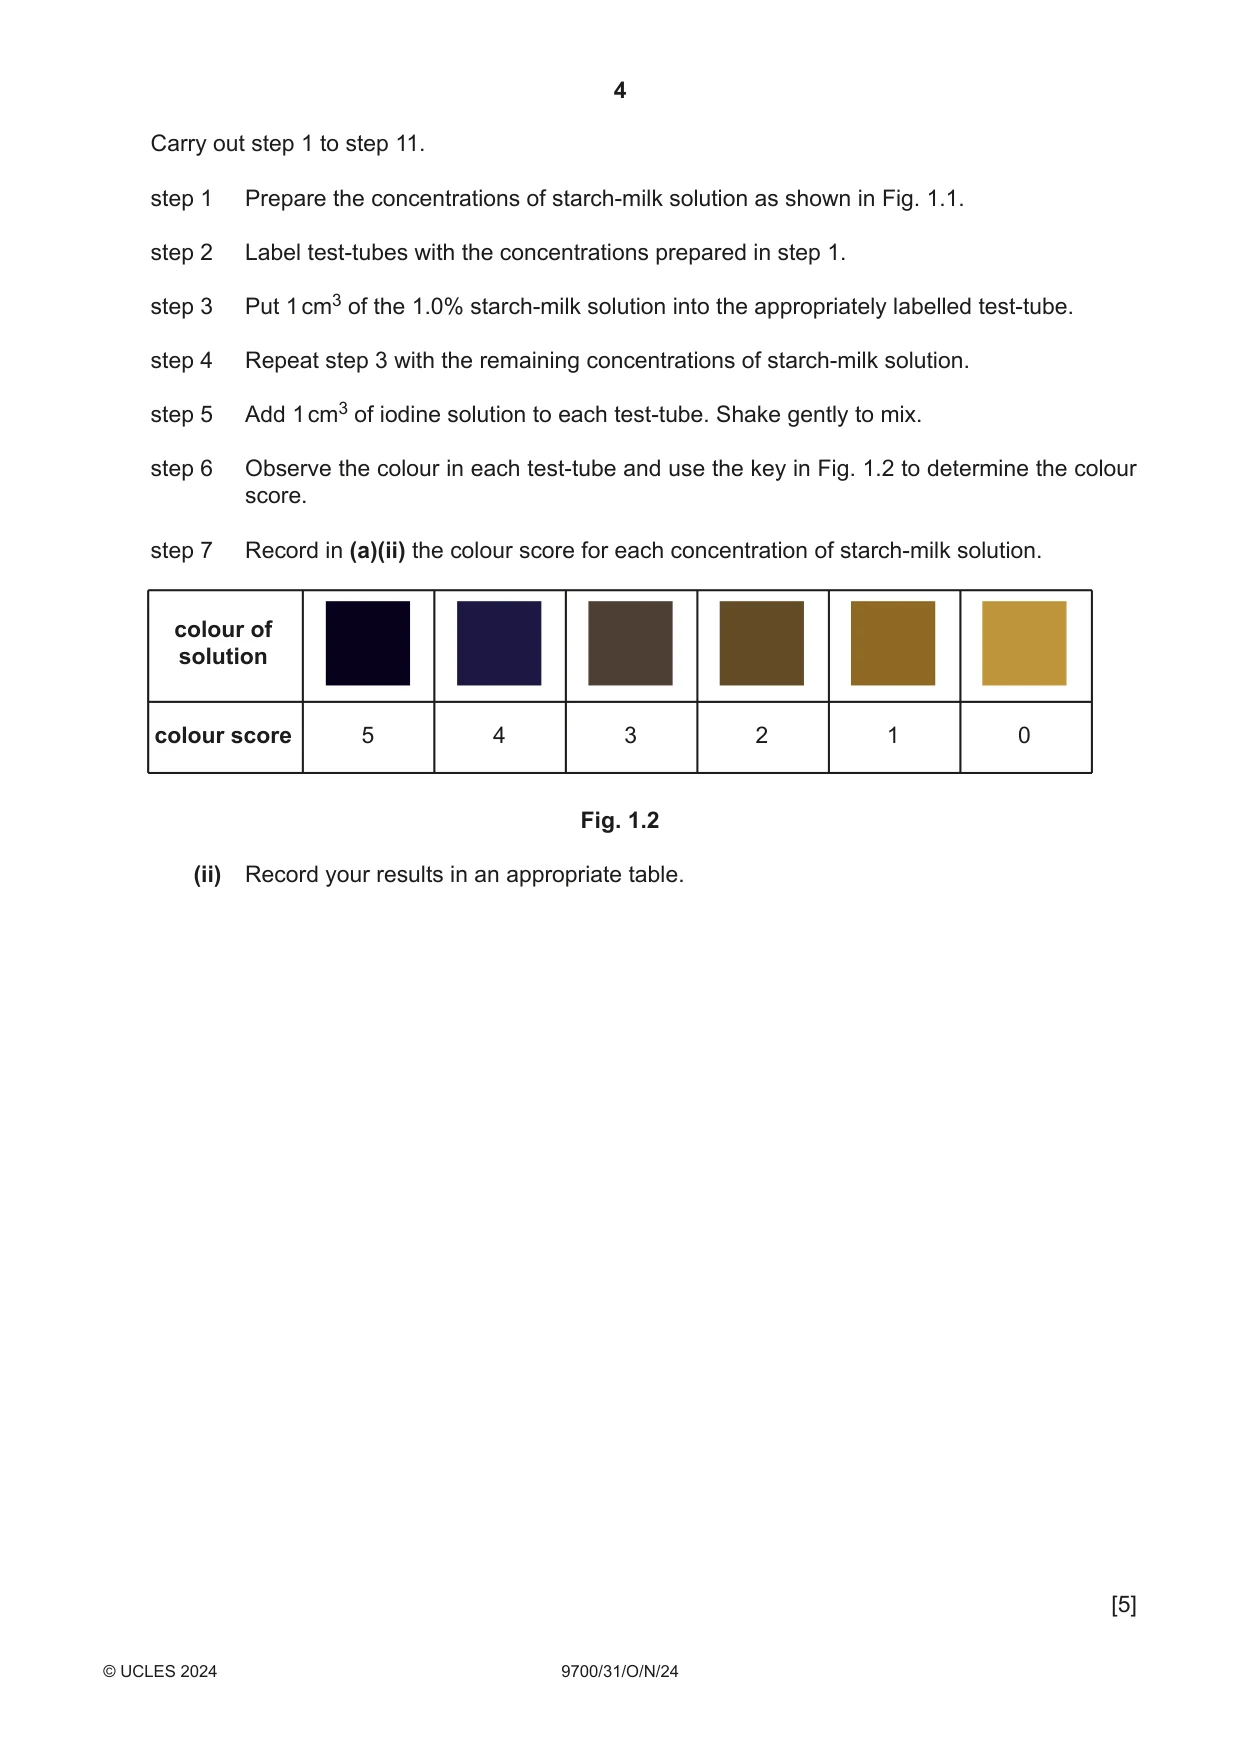
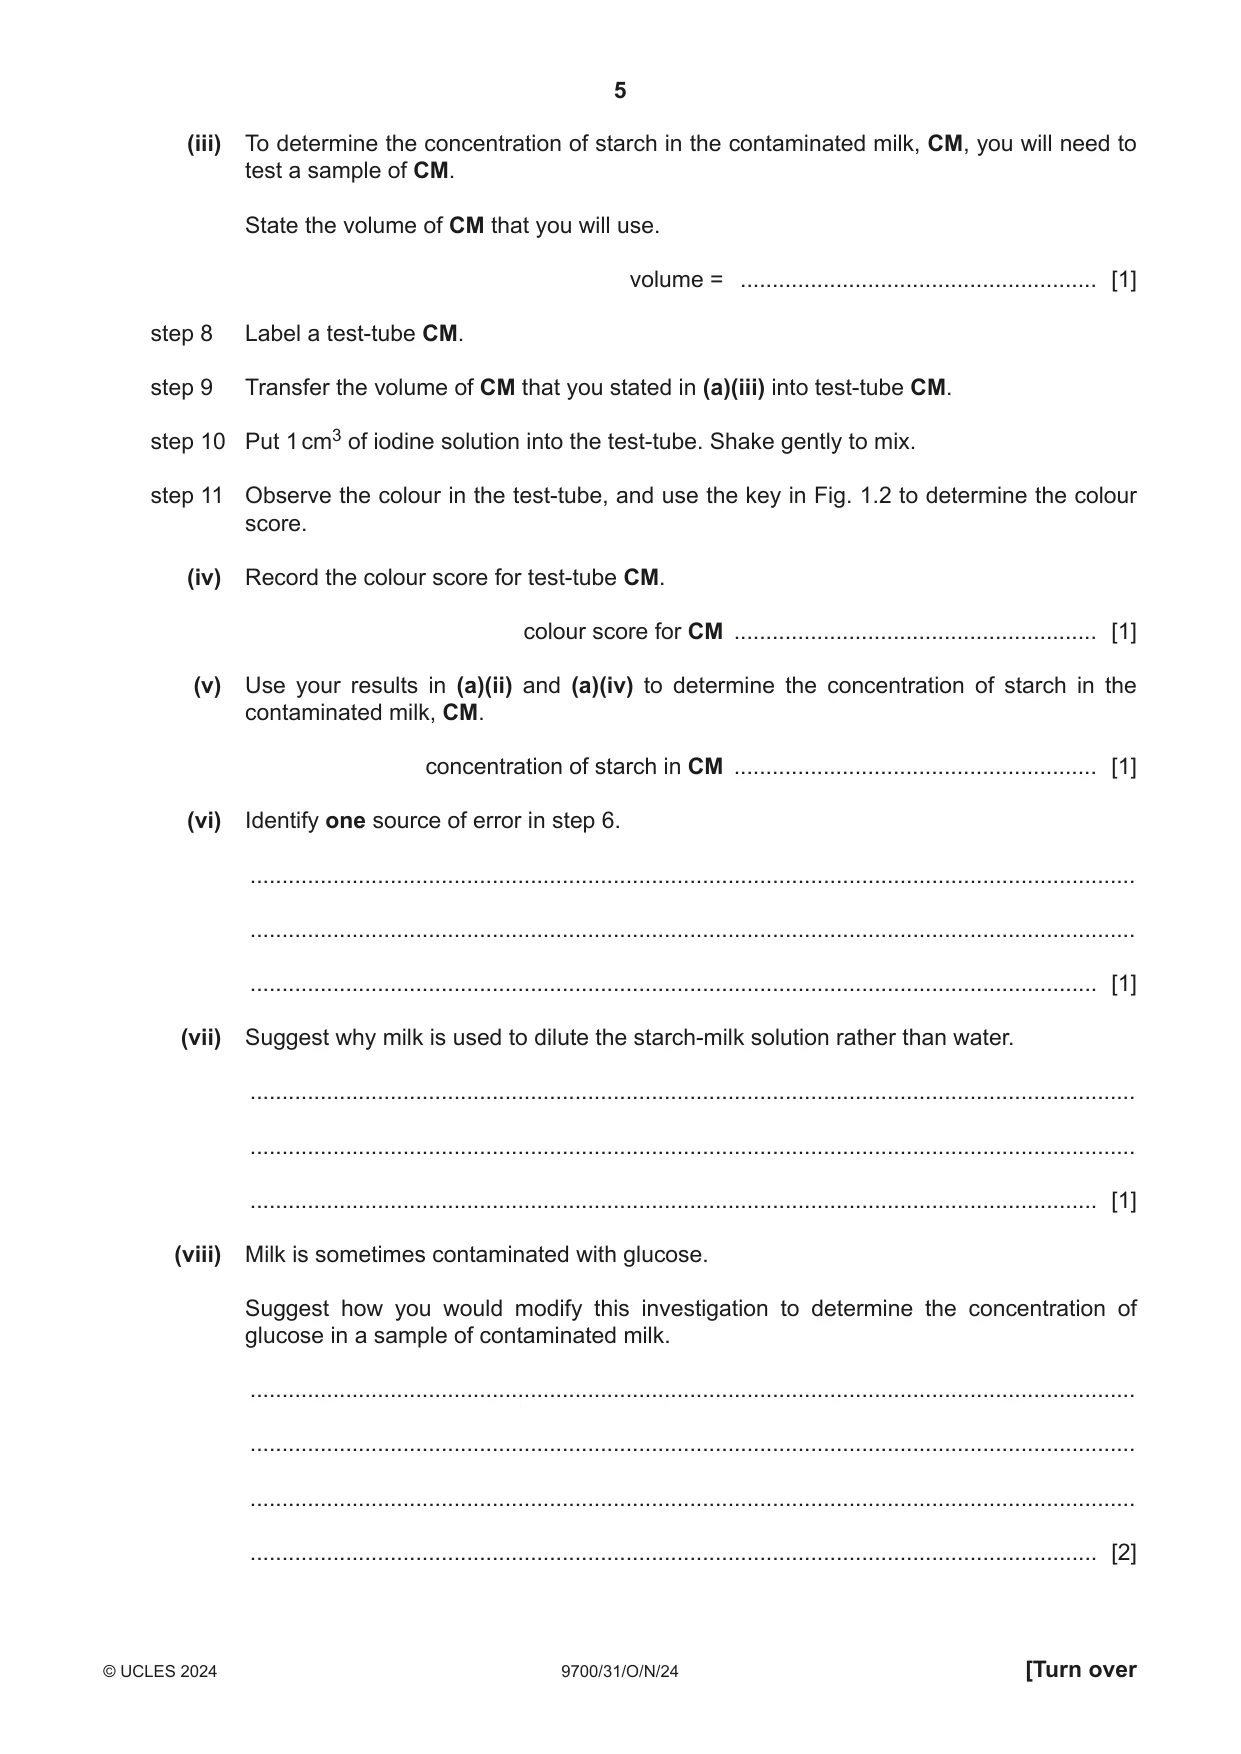
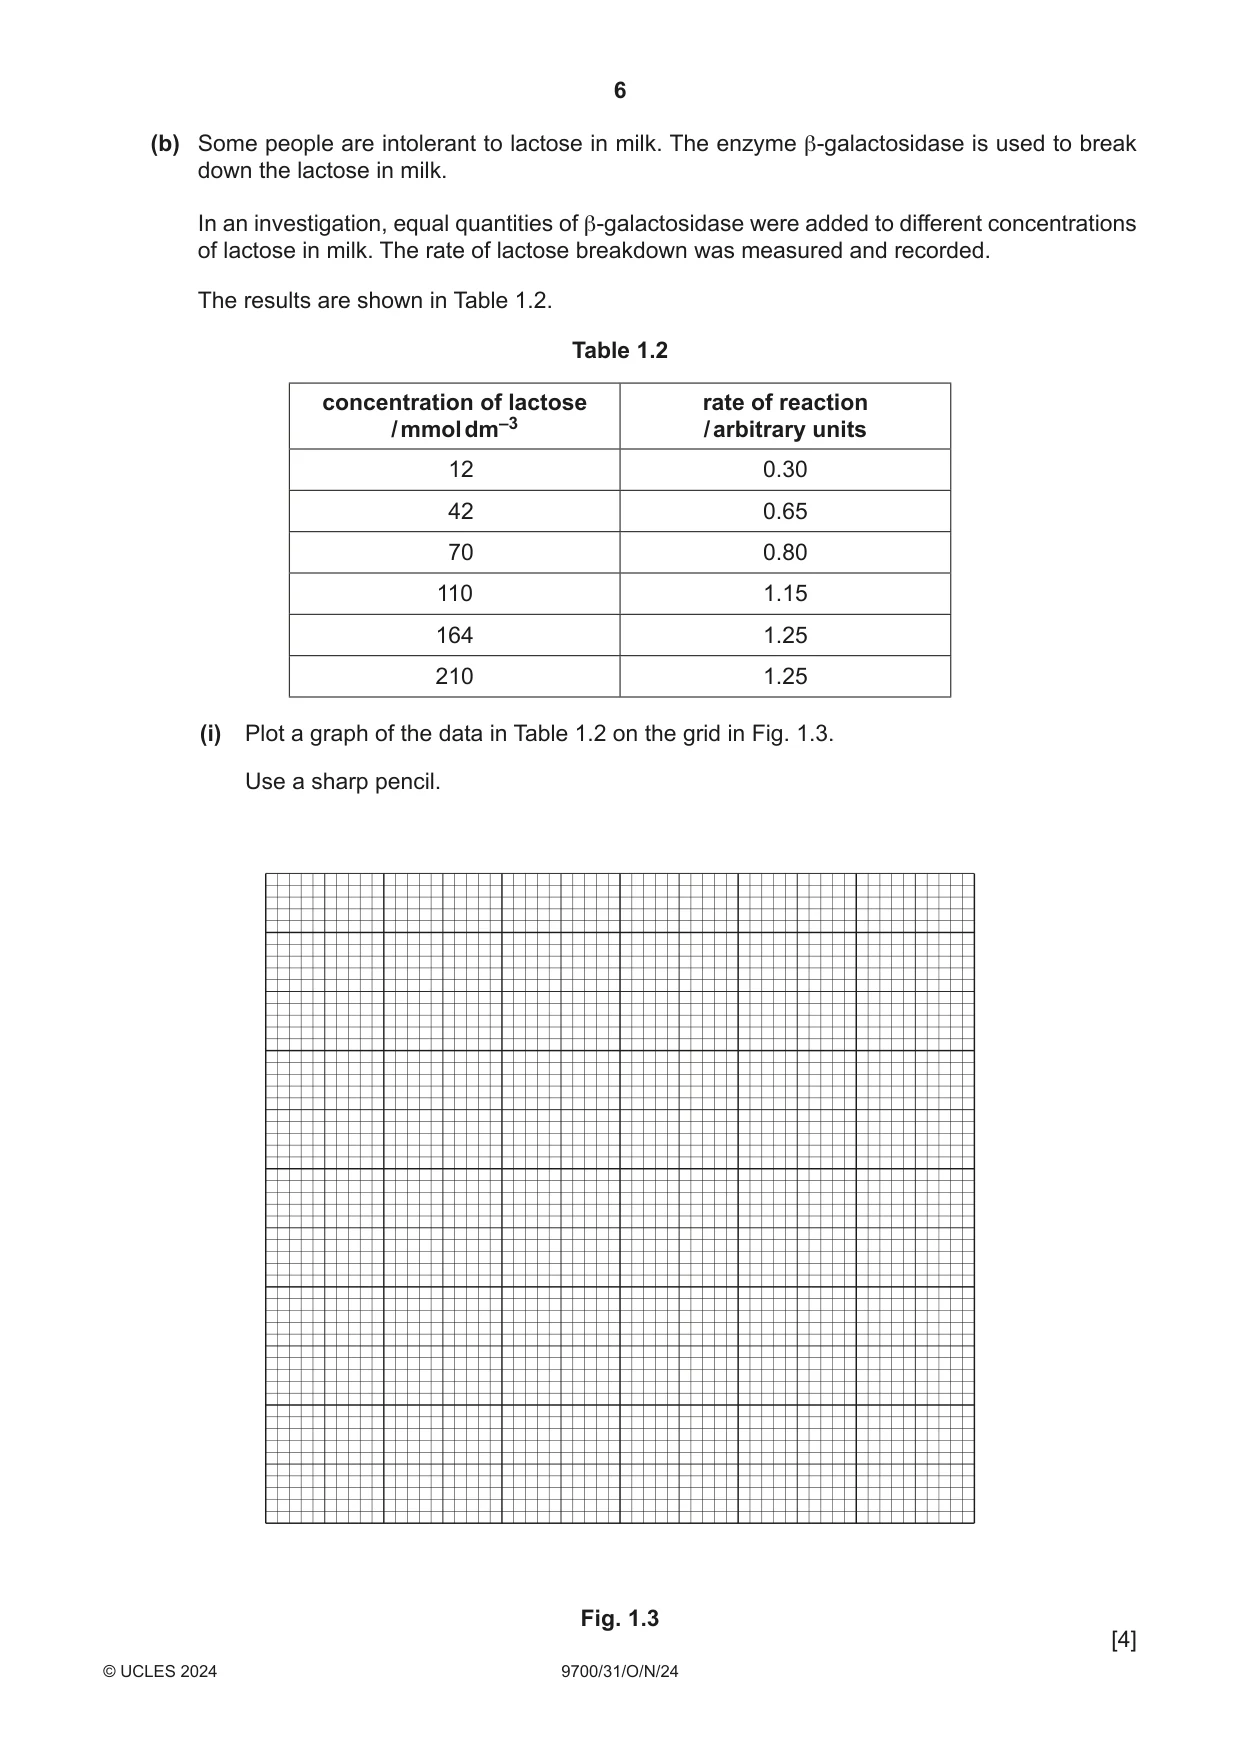
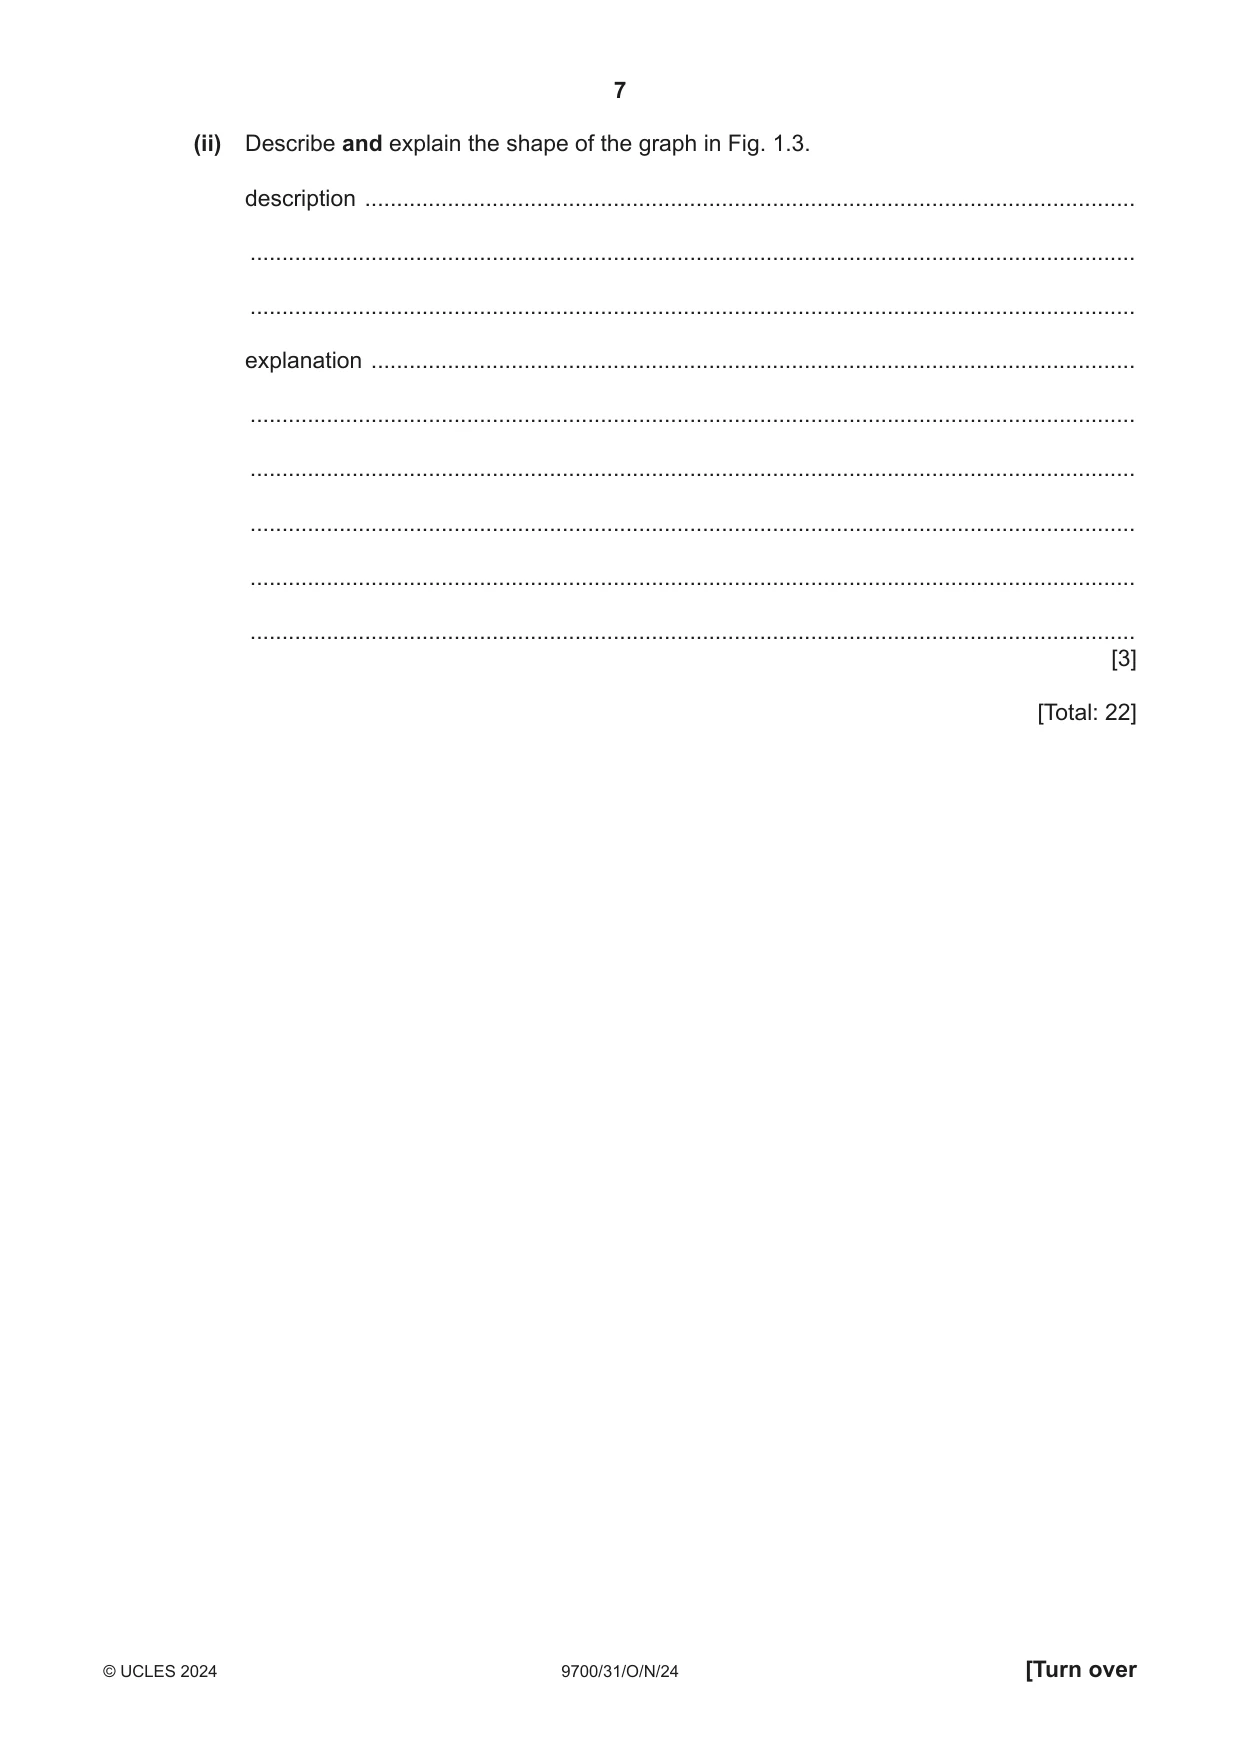
1 Milk is sometimes contaminated with substances such as starch. You will determine the concentration of starch in a sample of contaminated milk, using a range of starch standards. You are provided with the materials shown in Table 1.1. Table 1.1 labelled contents hazard volume / cm3 M milk none 50 1.0% starch solution in milk SM none 20 (starch‑milk) CM contaminated milk none 20 iodine iodine solution irritant 20 If any solution comes into contact with your skin, wash off immediately with cold water. It is recommended that you wear suitable eye protection. You will need to carry out a serial dilution of the 1.0% starch‑milk solution, SM, to reduce the concentration by one fifth between each successive dilution. You will need to prepare four concentrations of starch‑milk solution in addition to the 1.0% starch‑milk solution, SM. You must use the milk, M, to dilute the starch‑milk solution. Do not use water for the dilution. After the serial dilution is completed, you will need to have 8 cm3 of each concentration available to use. (a) (i) Complete Fig. 1.1 to show how you will prepare your serial dilution. Each beaker should have: • a labelled arrow to show the volume of starch‑milk, SM, solution transferred • a labelled arrow to show the volume of milk, M, added • a label under the beaker to show the concentration of the starch‑milk solution. 0 cm3 of milk, M 10 cm3 of 1.0% starch-milk solution, SM 1.0% starch-milk solution Fig. 1.1 [3] Carry out step 1 to step 11. step 1 Prepare the concentrations of starch‑milk solution as shown in Fig. 1.1. step 2 Label test‑tubes with the concentrations prepared in step 1. step 3 Put 1 cm3 of the 1.0% starch‑milk solution into the appropriately labelled test‑tube. step 4 Repeat step 3 with the remaining concentrations of starch‑milk solution. step 5 Add 1 cm3 of iodine solution to each test‑tube. Shake gently to mix. step 6 Observe the colour in each test‑tube and use the key in Fig. 1.2 to determine the colour score. step 7 Record in (a)(ii) the colour score for each concentration of starch‑milk solution. colour of solution colour score 5 4 3 2 1 0 Fig. 1.2 (ii) Record your results in an appropriate table. [5] (iii) To determine the concentration of starch in the contaminated milk, CM, you will need to test a sample of CM. State the volume of CM that you will use. volume = ........................................................ [1] step 8 Label a test‑tube CM. step 9 Transfer the volume of CM that you stated in (a)(iii) into test‑tube CM. step 10 Put 1 cm3 of iodine solution into the test‑tube. Shake gently to mix. step 11 Observe the colour in the test‑tube, and use the key in Fig. 1.2 to determine the colour score. (iv) Record the colour score for test‑tube CM. colour score for CM ......................................................... [1] (v) Use your results in (a)(ii) and (a)(iv) to determine the concentration of starch in the contaminated milk, CM. concentration of starch in CM ......................................................... [1] (vi) Identify one source of error in step 6. ........................................................................................................................................... ........................................................................................................................................... ..................................................................................................................................... [1] (vii) Suggest why milk is used to dilute the starch‑milk solution rather than water. ........................................................................................................................................... ........................................................................................................................................... ..................................................................................................................................... [1] (viii) Milk is sometimes contaminated with glucose. Suggest how you would modify this investigation to determine the concentration of glucose in a sample of contaminated milk. ........................................................................................................................................... ........................................................................................................................................... ........................................................................................................................................... ..................................................................................................................................... [2] (b) Some people are intolerant to lactose in milk. The enzyme β‑galactosidase is used to break down the lactose in milk. In an investigation, equal quantities of β‑galactosidase were added to different concentrations of lactose in milk. The rate of lactose breakdown was measured and recorded. The results are shown in Table 1.2. Table 1.2 concentration of lactose rate of reaction / mmol dm–3 / arbitrary units 12 0.30 42 0.65 70 0.80 110 1.15 164 1.25 210 1.25 (i) Plot a graph of the data in Table 1.2 on the grid in Fig. 1.3. Use a sharp pencil. Fig. 1.3 [4] (ii) Describe and explain the shape of the graph in Fig. 1.3. description ......................................................................................................................... ........................................................................................................................................... ........................................................................................................................................... explanation ........................................................................................................................ ........................................................................................................................................... ........................................................................................................................................... ........................................................................................................................................... ........................................................................................................................................... ........................................................................................................................................... [3] [Total: 22]
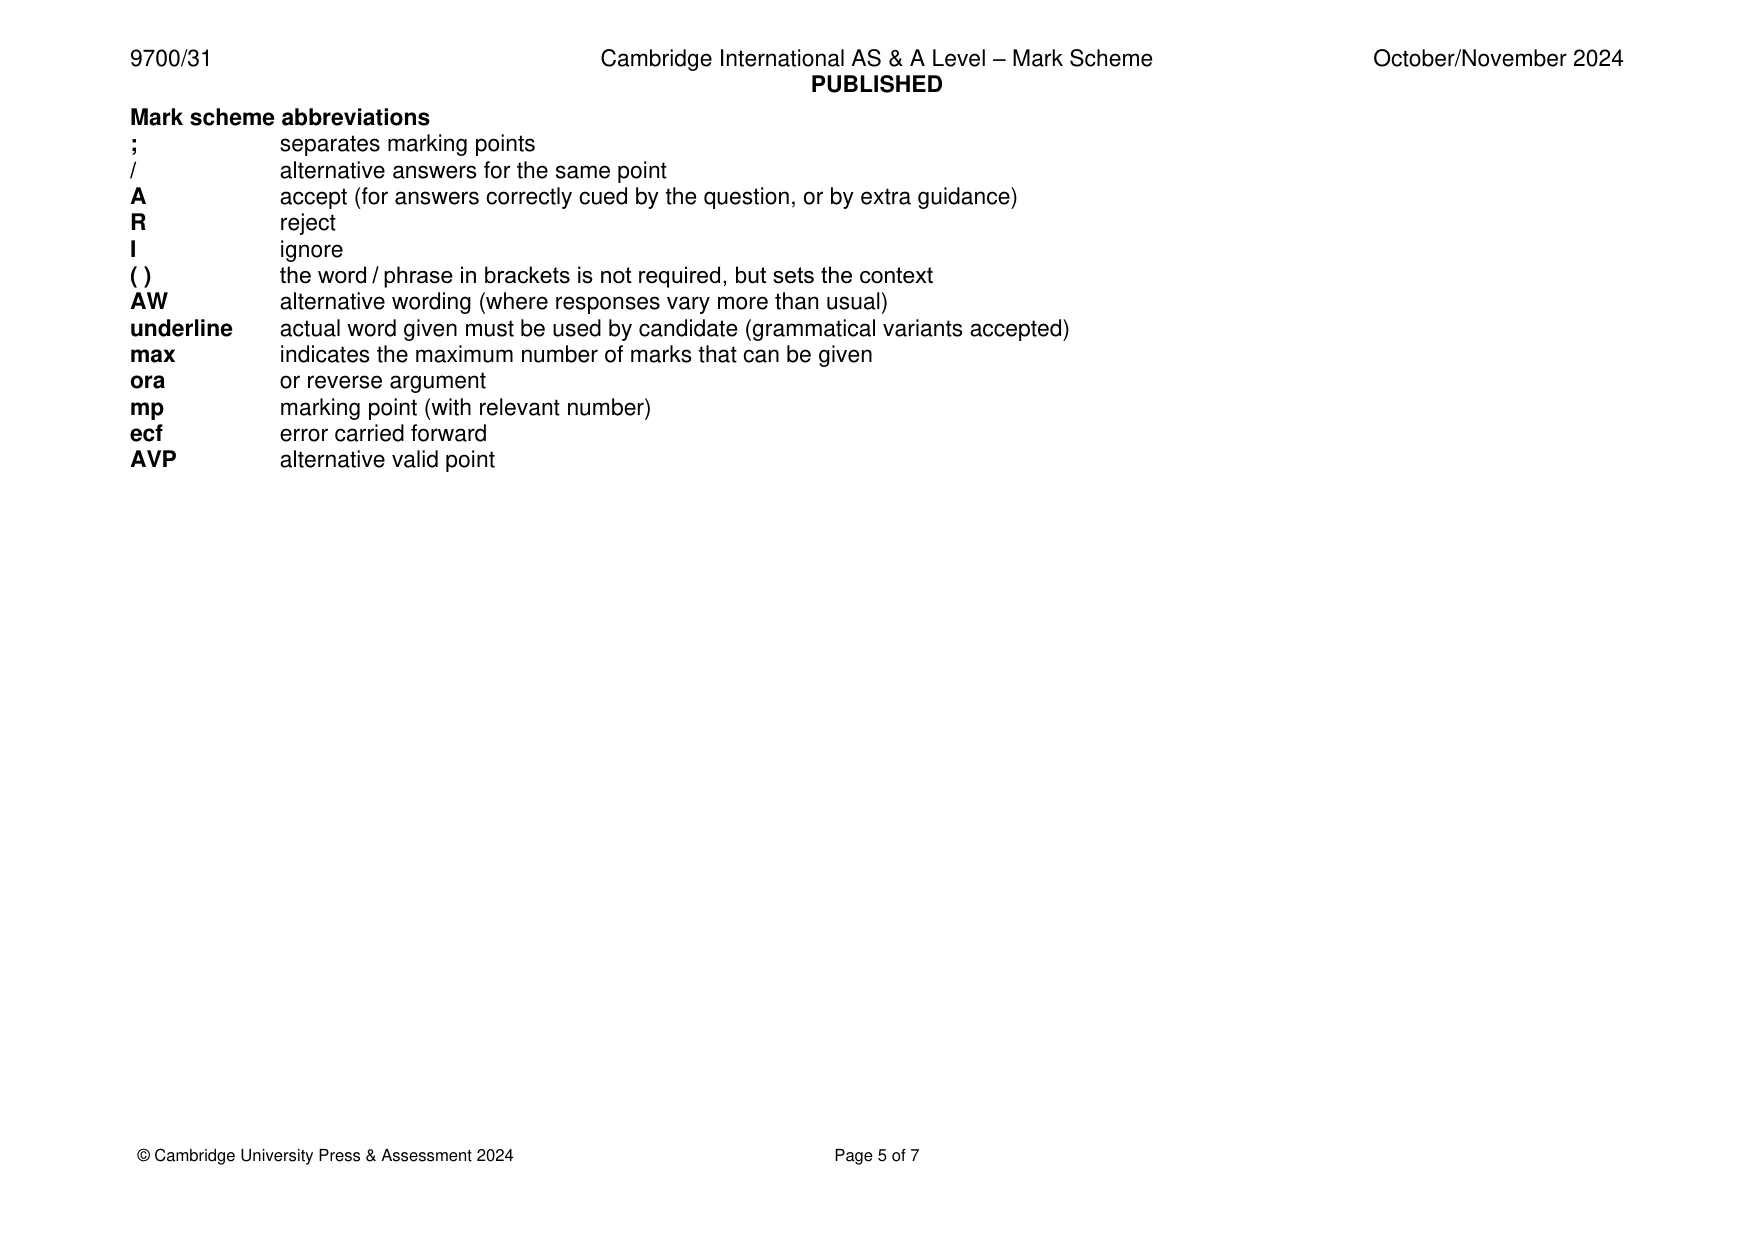
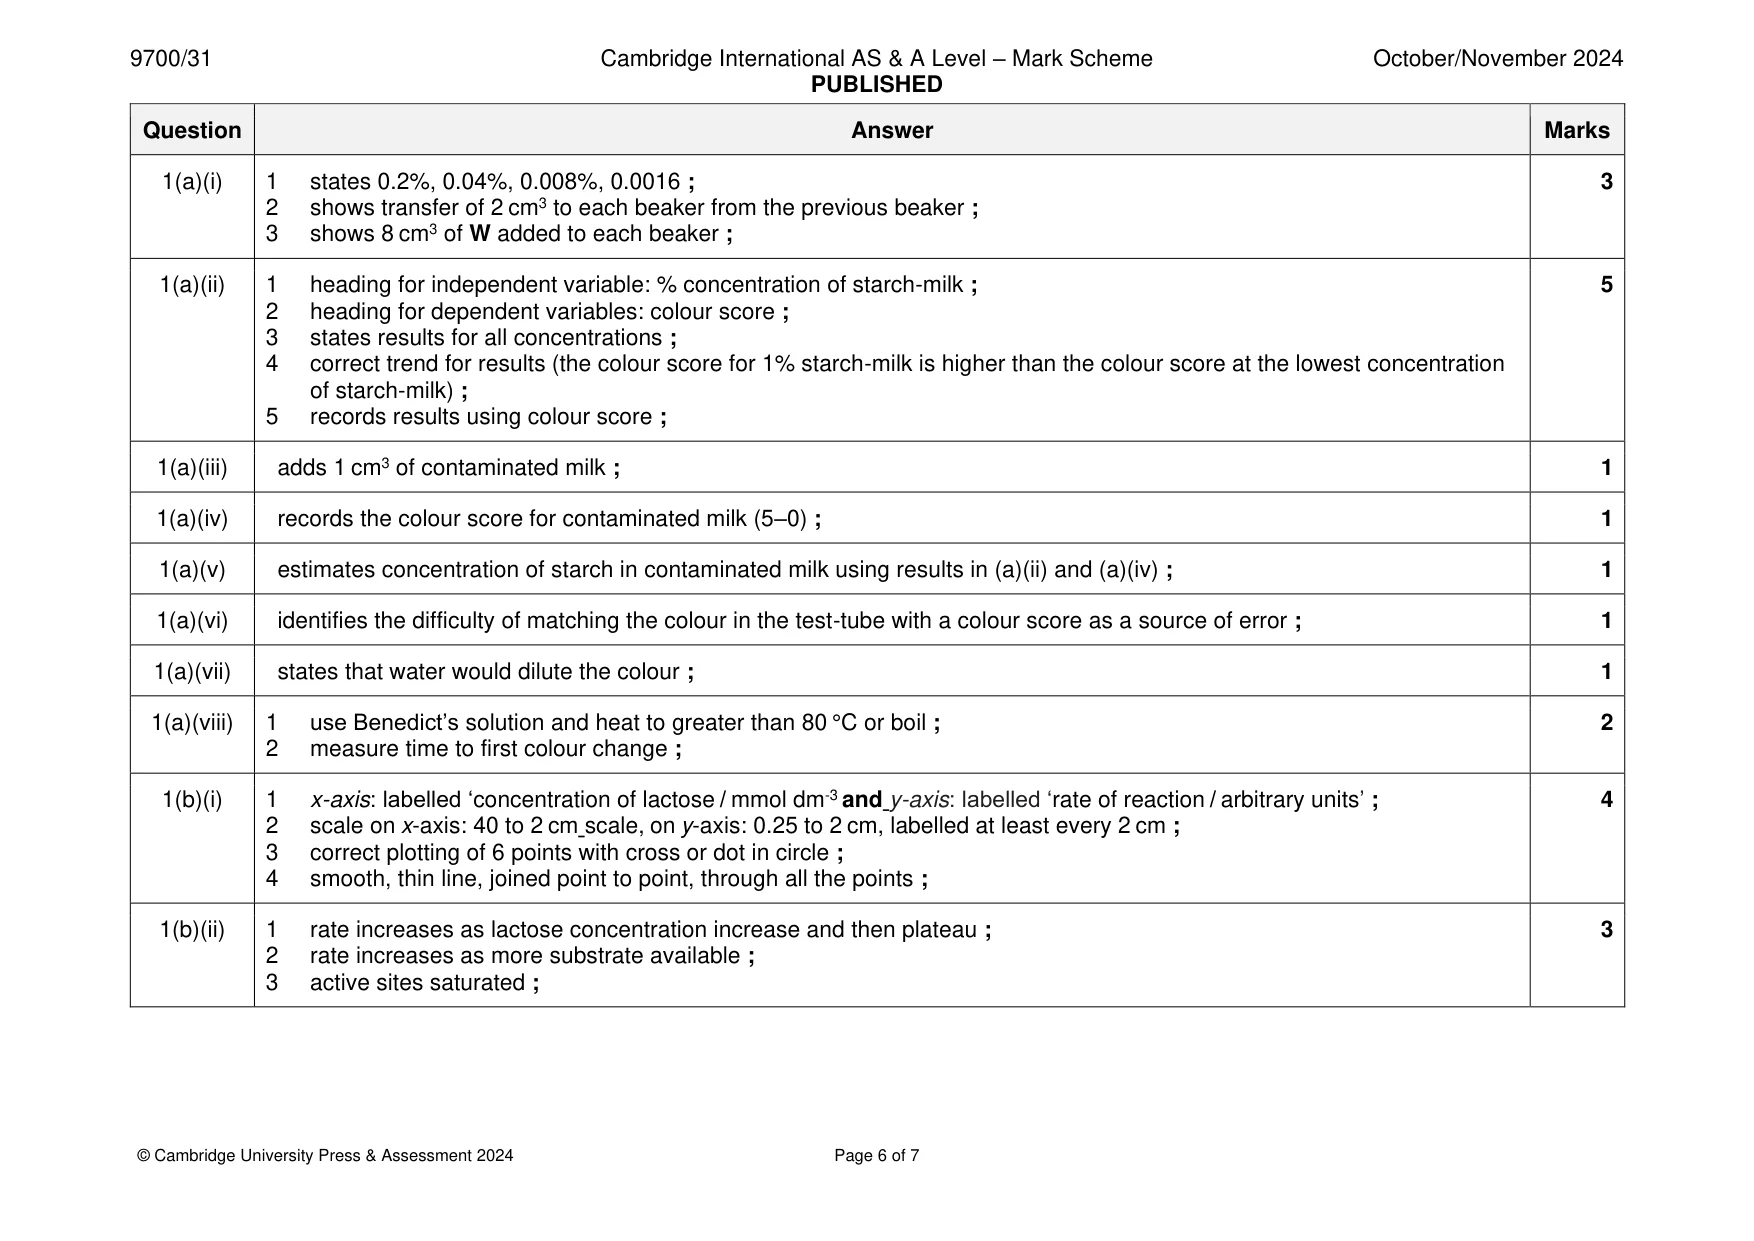
Mark scheme: Question Answer Marks 1(a)(i) 1 states 0.2%, 0.04%, 0.008%, 0.0016 ; 3 2 shows transfer of 2 cm3 to each beaker from the previous beaker ; 3 shows 8 cm3 of W added to each beaker ; 1(a)(ii) 1 heading for independent variable: % concentration of starch-milk ; 5 2 heading for dependent variables: colour score ; 3 states results for all concentrations ; 4 correct trend for results (the colour score for 1% starch-milk is higher than the colour score at the lowest concentration of starch-milk) ; 5 records results using colour score ; 1(a)(iii) adds 1 cm3 of contaminated milk ; 1 1(a)(iv) records the colour score for contaminated milk (5–0) ; 1 1(a)(v) estimates concentration of starch in contaminated milk using results in (a)(ii) and (a)(iv) ; 1 1(a)(vi) identifies the difficulty of matching the colour in the test-tube with a colour score as a source of error ; 1 1(a)(vii) states that water would dilute the colour ; 1 1(a)(viii) 1 use Benedict’s solution and heat to greater than 80 °C or boil ; 2 2 measure time to first colour change ; 1(b)(i) 1 x-axis: labelled ‘concentration of lactose / mmol dm-3 and y-axis: labelled ‘rate of reaction / arbitrary units’ ; 4 2 scale on x-axis: 40 to 2 cm scale, on y-axis: 0.25 to 2 cm, labelled at least every 2 cm ; 3 correct plotting of 6 points with cross or dot in circle ; 4 smooth, thin line, joined point to point, through all the points ; 1(b)(ii) 1 rate increases as lactose concentration increase and then plateau ; 3 2 rate increases as more substrate available ; 3 active sites saturated ;
Q2 · J1 is a slide of a stained transverse section through a leaf
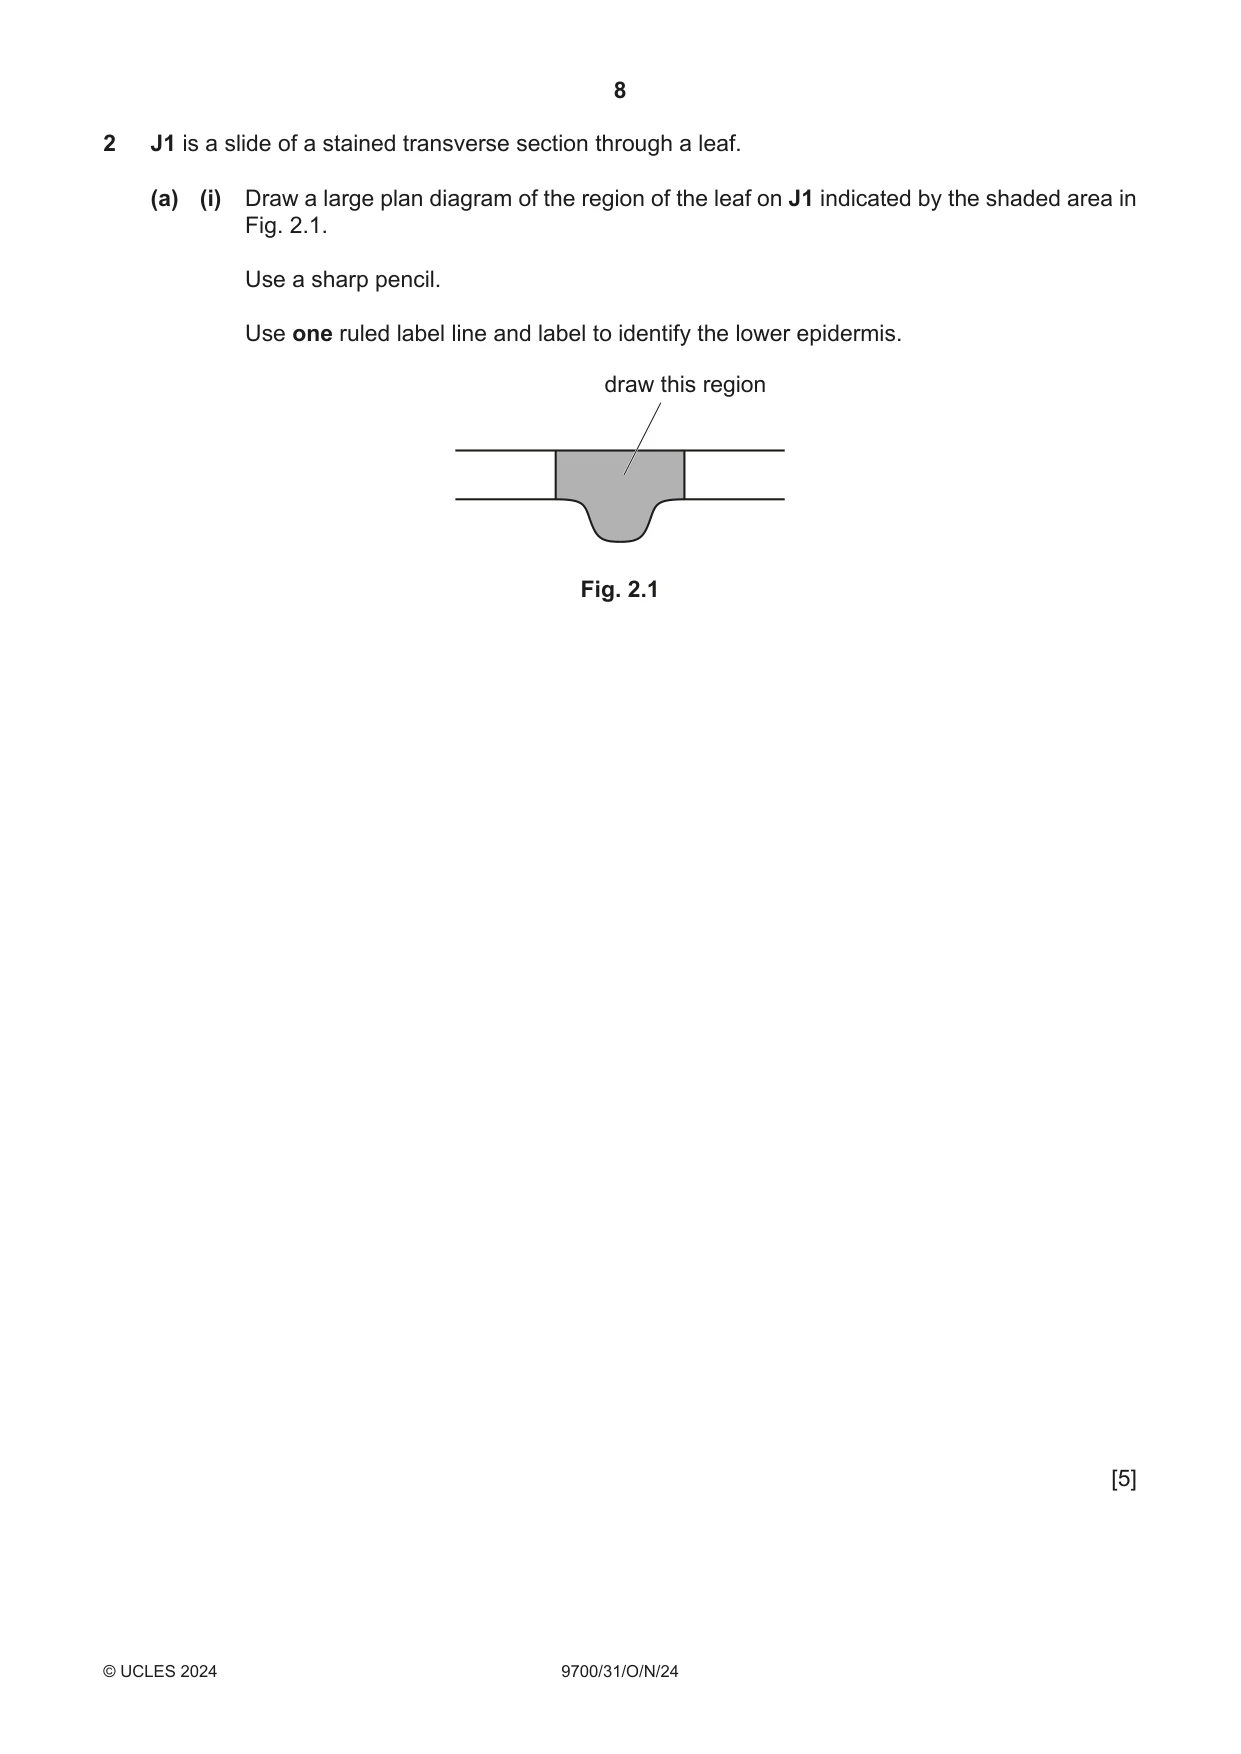
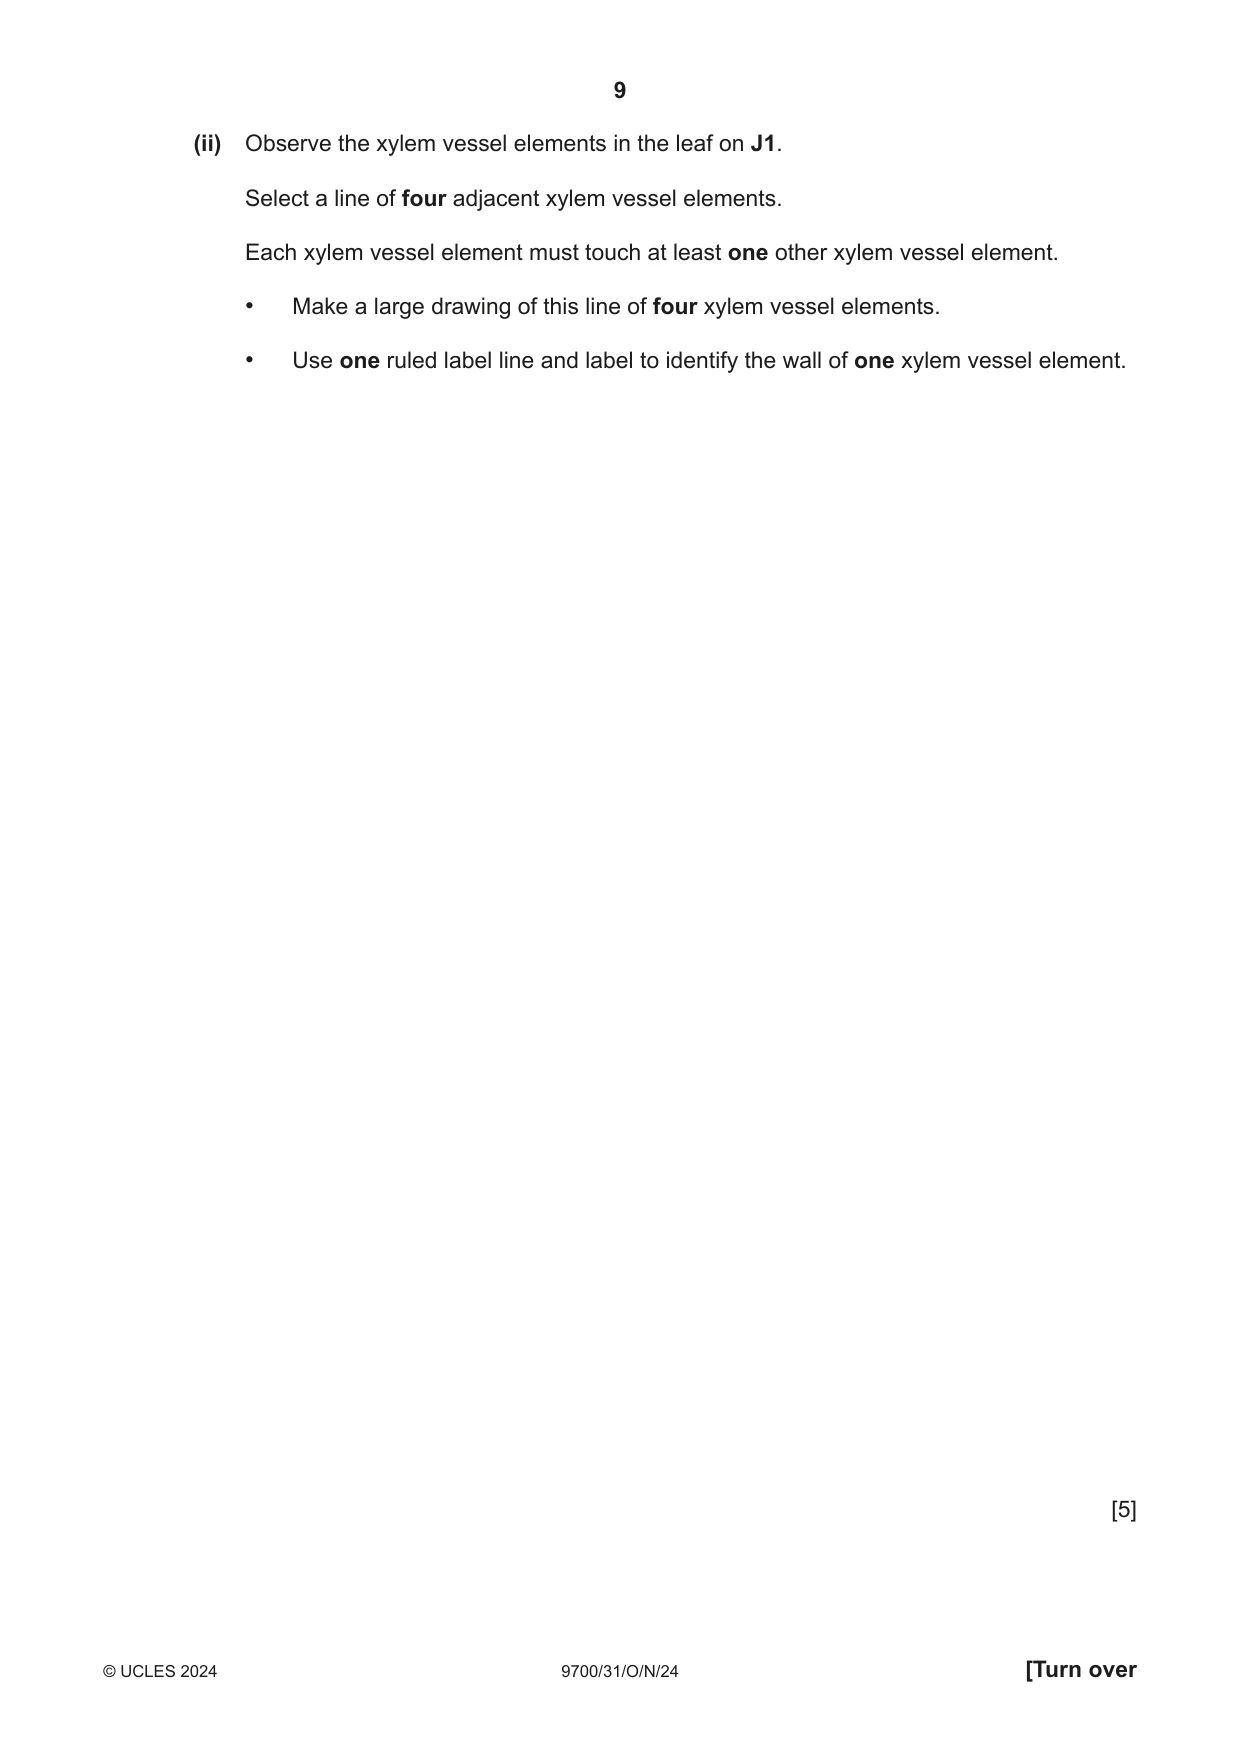
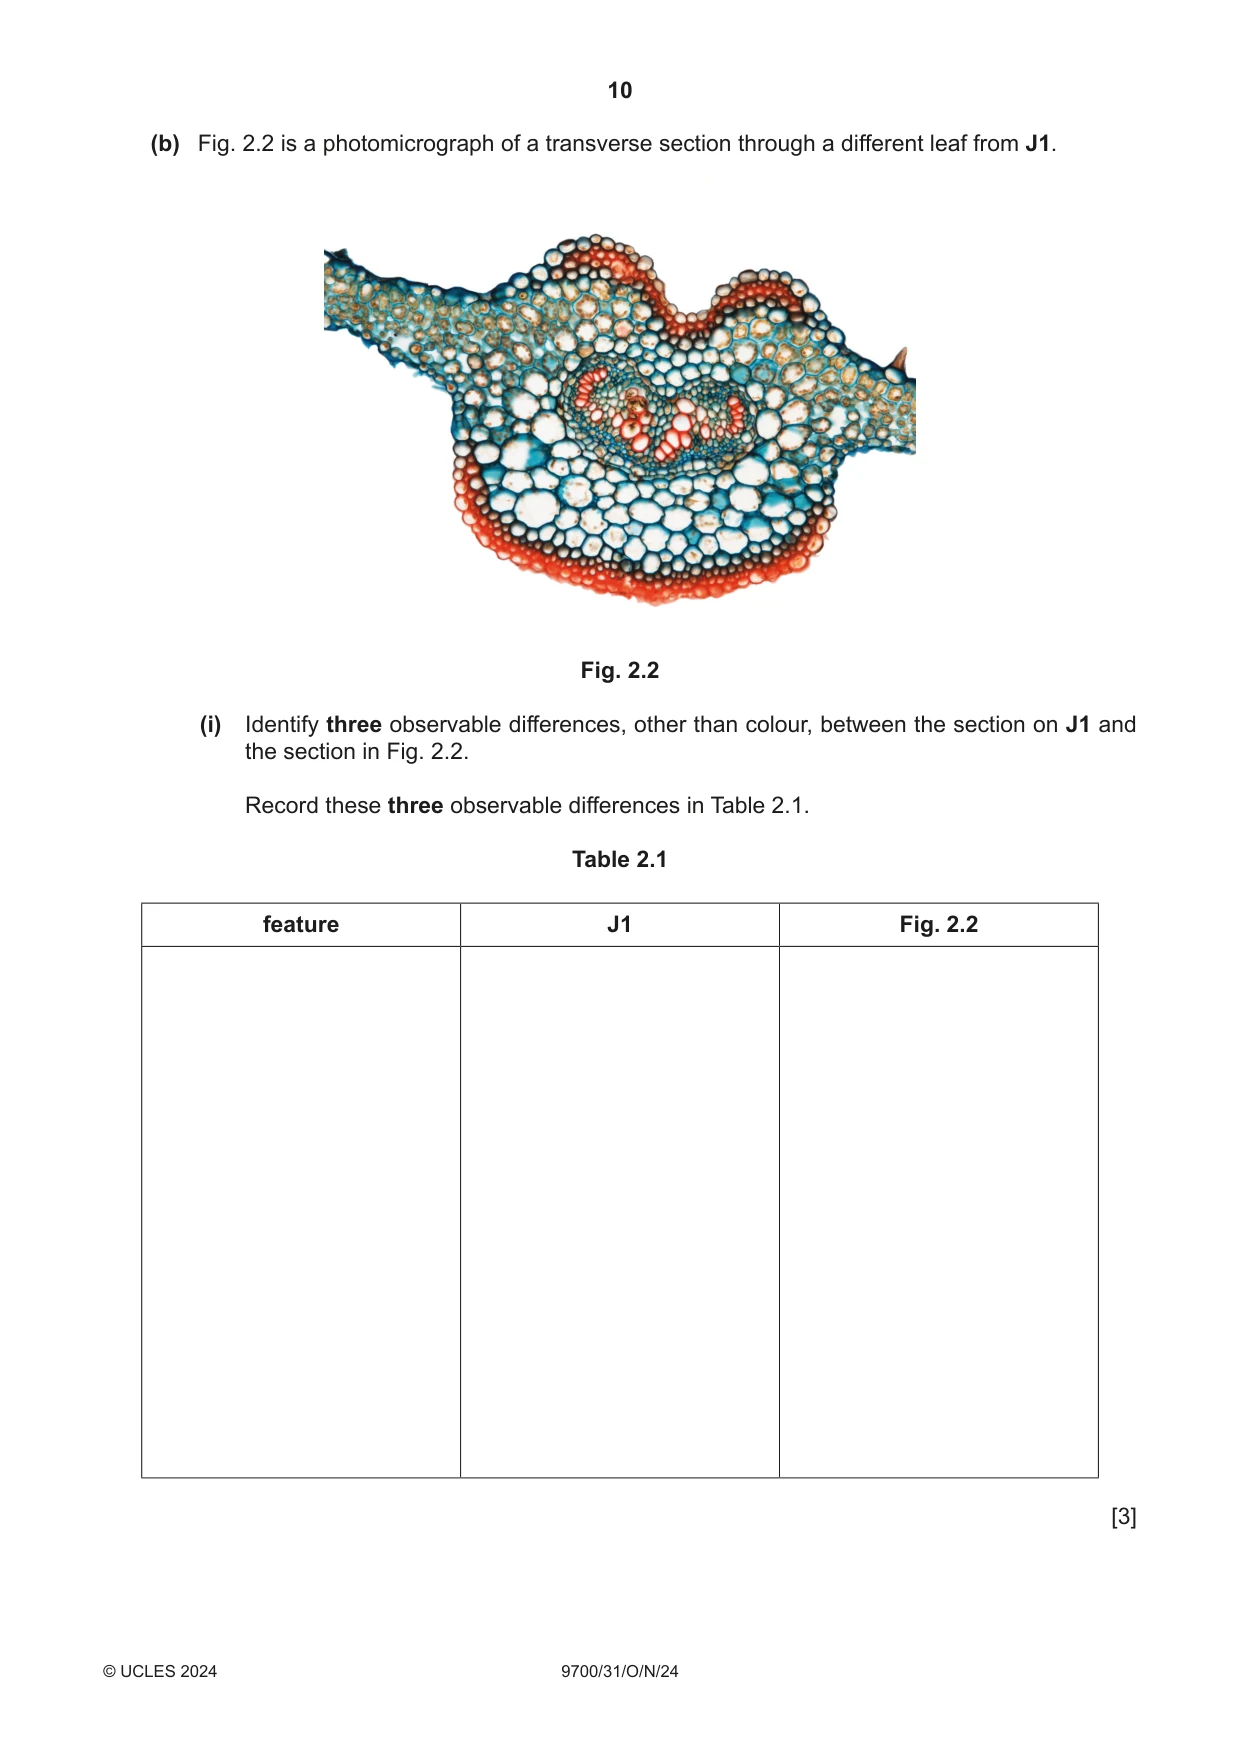
2 J1 is a slide of a stained transverse section through a leaf. (a) (i) Draw a large plan diagram of the region of the leaf on J1 indicated by the shaded area in Fig. 2.1. Use a sharp pencil. Use one ruled label line and label to identify the lower epidermis. draw this region Fig. 2.1 [5] (ii) Observe the xylem vessel elements in the leaf on J1. Select a line of four adjacent xylem vessel elements. Each xylem vessel element must touch at least one other xylem vessel element. • Make a large drawing of this line of four xylem vessel elements. • Use one ruled label line and label to identify the wall of one xylem vessel element. [5] (b) Fig. 2.2 is a photomicrograph of a transverse section through a different leaf from J1. Fig. 2.2 (i) Identify three observable differences, other than colour, between the section on J1 and the section in Fig. 2.2. Record these three observable differences in Table 2.1. Table 2.1 feature J1 Fig. 2.2 [3]
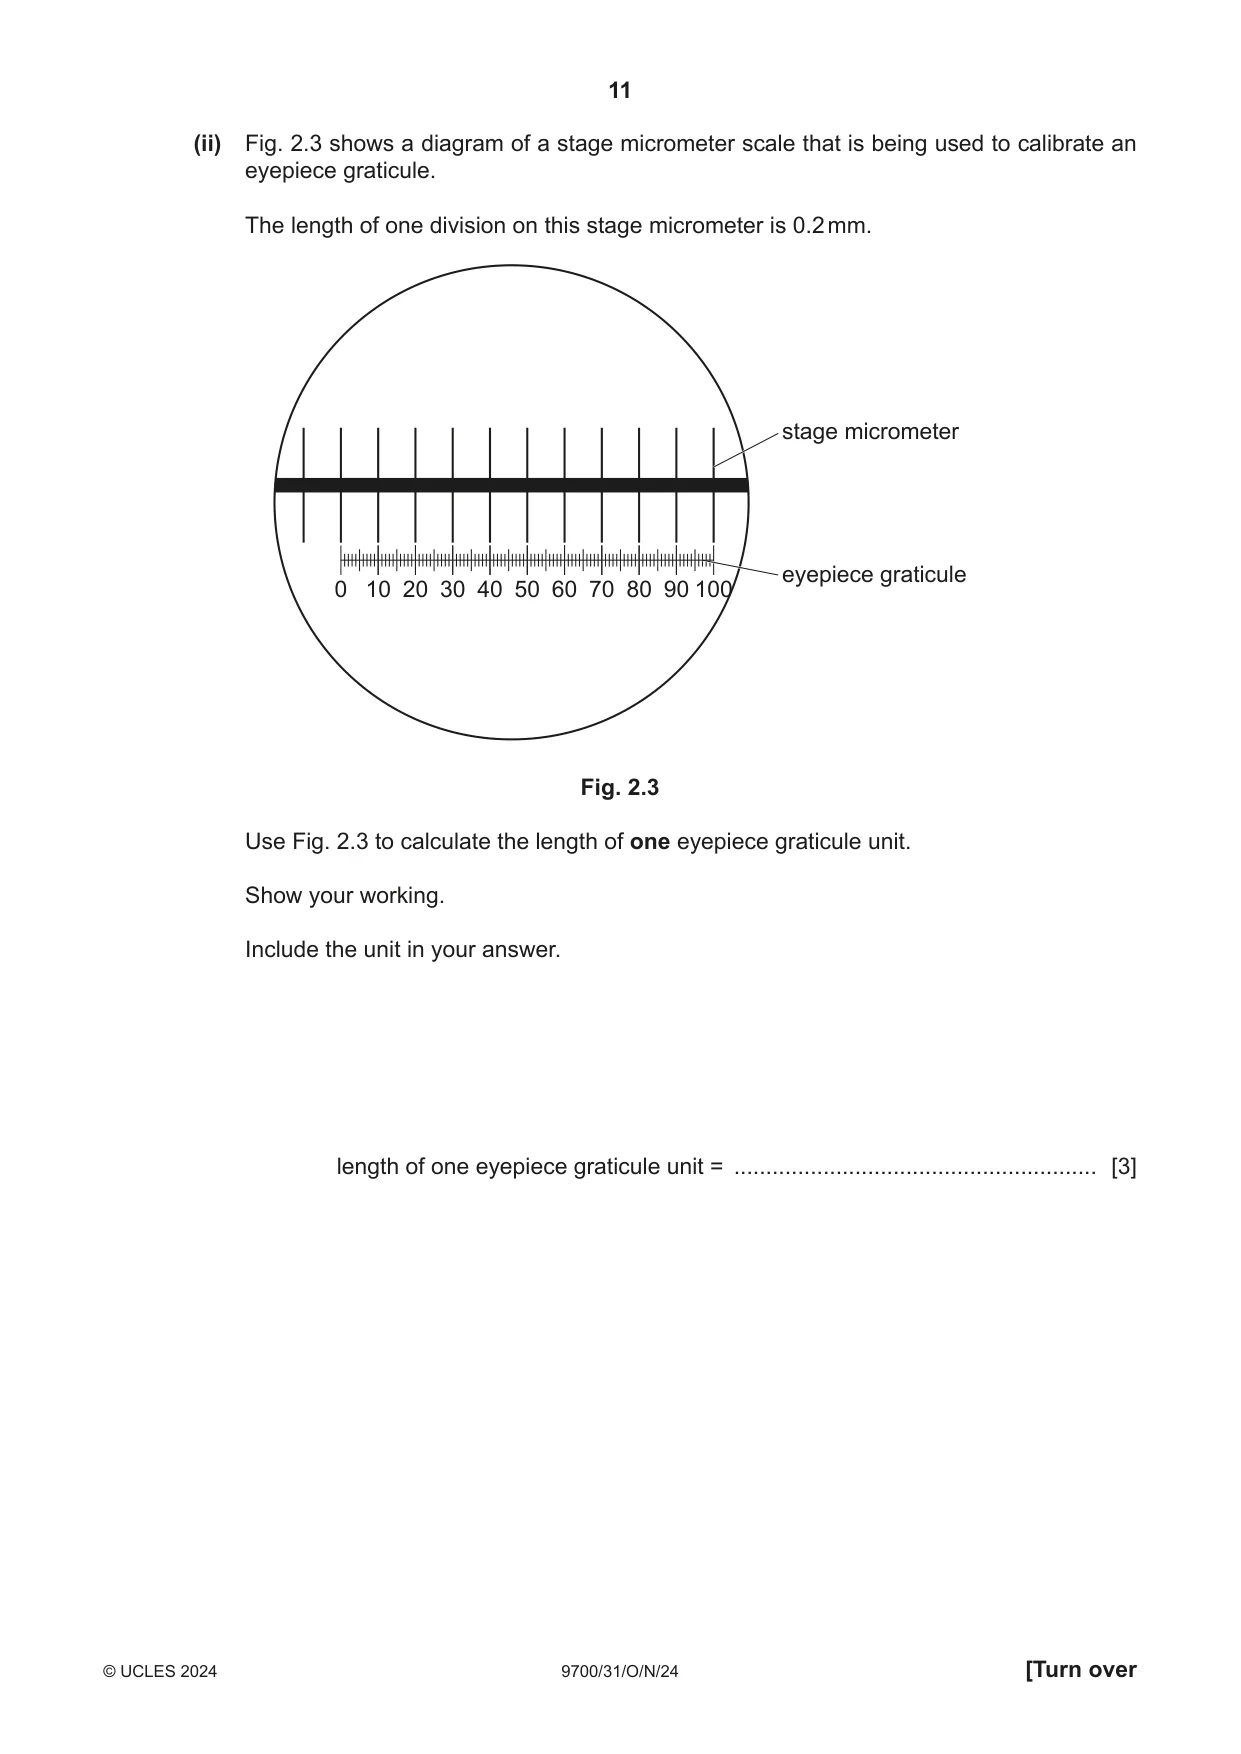
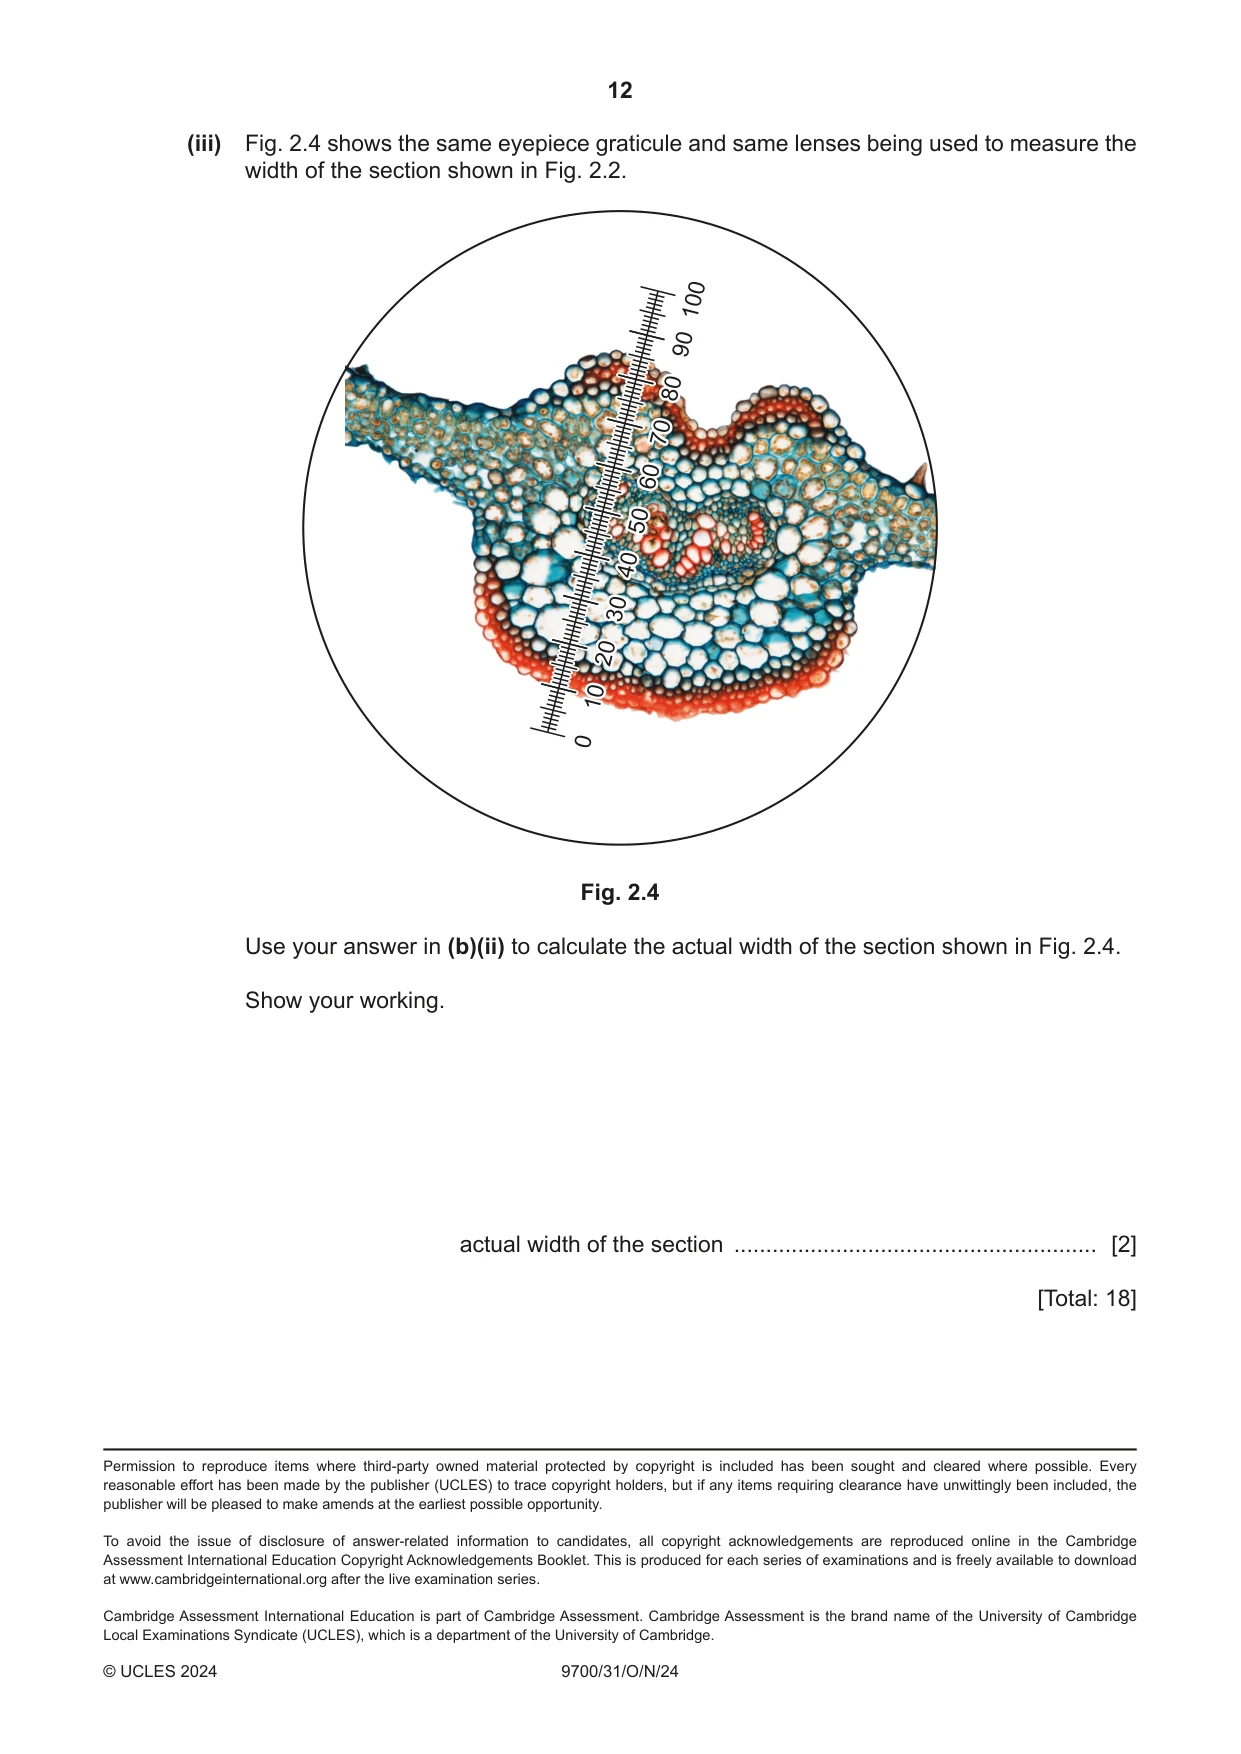
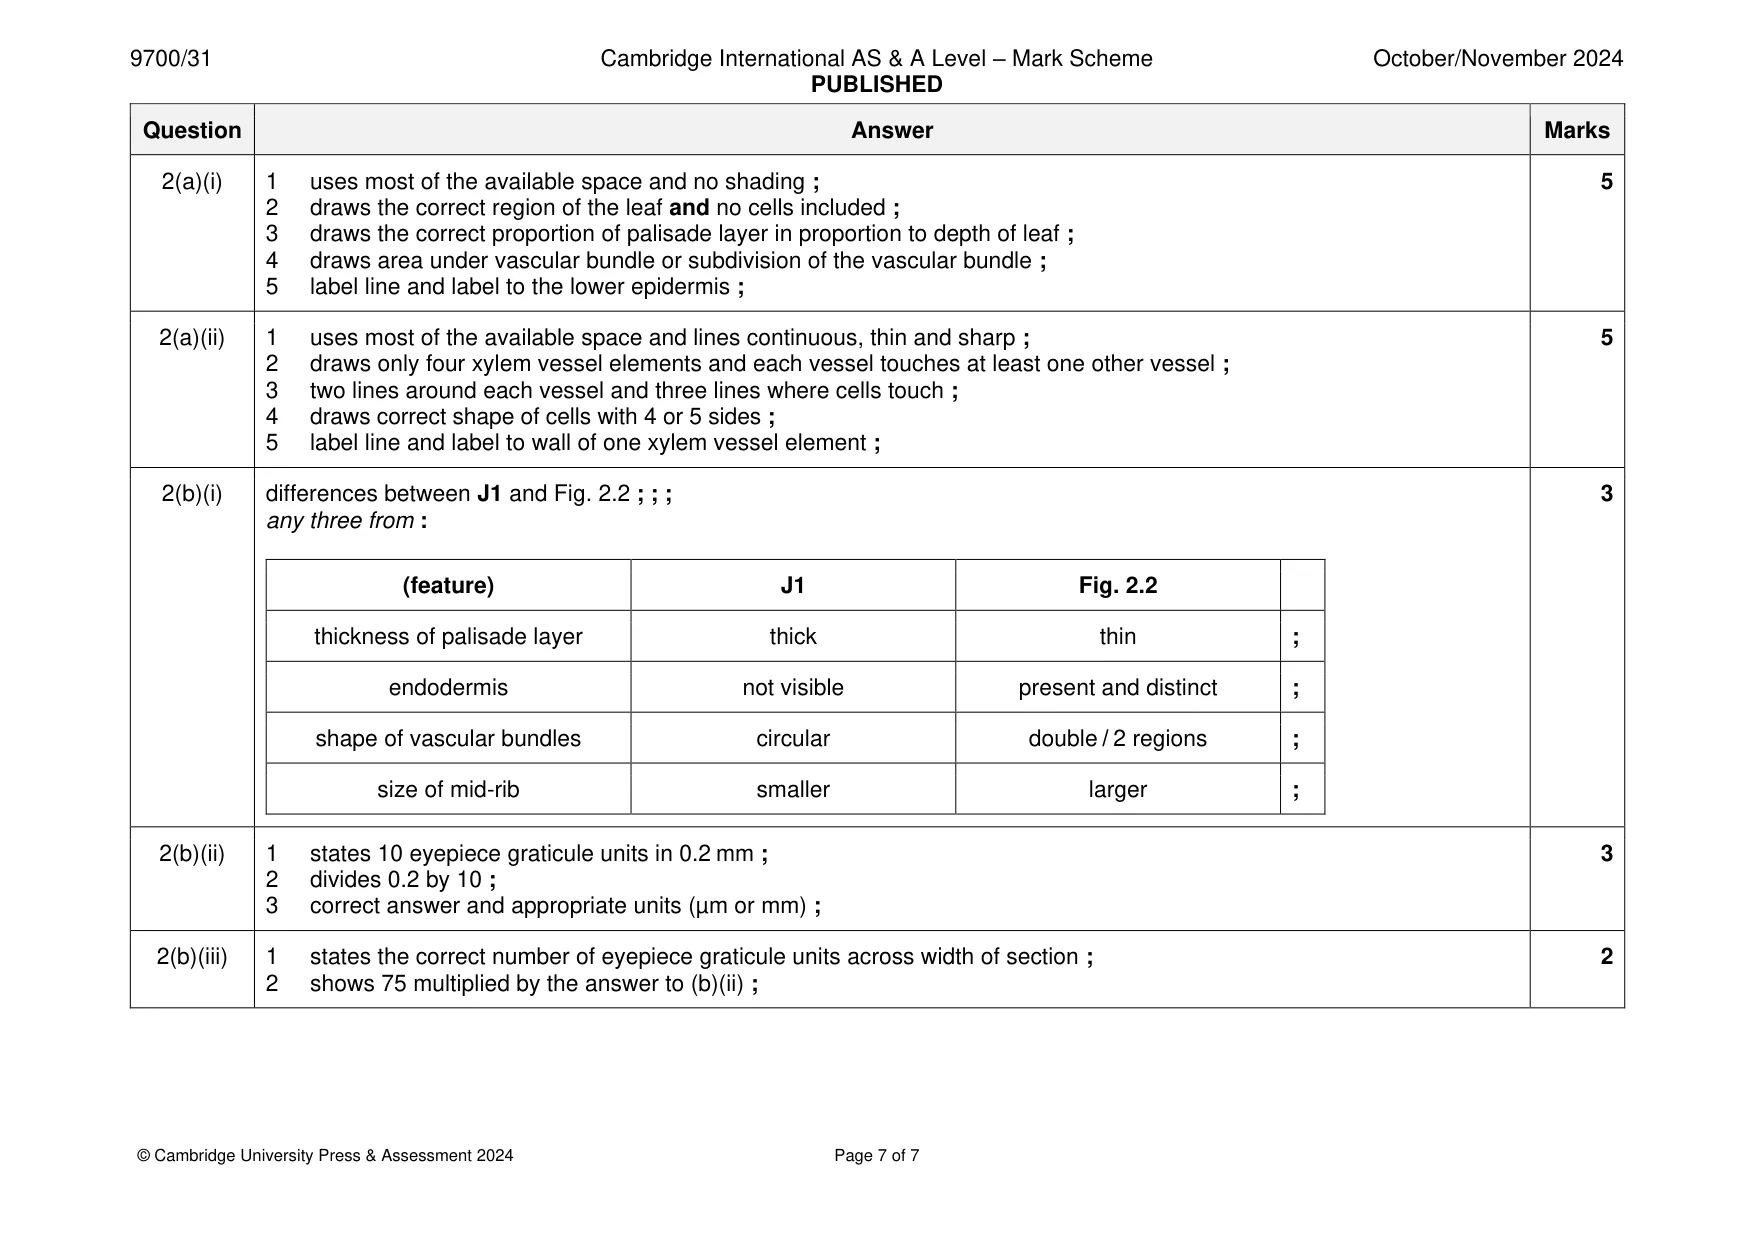
Mark scheme: 2(a)(i) 1 uses most of the available space and no shading ; 5 2 draws the correct region of the leaf and no cells included ; 3 draws the correct proportion of palisade layer in proportion to depth of leaf ; 4 draws area under vascular bundle or subdivision of the vascular bundle ; 5 label line and label to the lower epidermis ; 2(a)(ii) 1 uses most of the available space and lines continuous, thin and sharp ; 5 2 draws only four xylem vessel elements and each vessel touches at least one other vessel ; 3 two lines around each vessel and three lines where cells touch ; 4 draws correct shape of cells with 4 or 5 sides ; 5 label line and label to wall of one xylem vessel element ; 2(b)(i) differences between J1 and Fig. 2.2 ; ; ; 3 any three from : (feature) J1 Fig. 2.2 thickness of palisade layer thick thin ; endodermis not visible present and distinct ; shape of vascular bundles circular double / 2 regions ; size of mid-rib smaller larger ; 2(b)(ii) 1 states 10 eyepiece graticule units in 0.2 mm ; 3 2 divides 0.2 by 10 ; 3 correct answer and appropriate units (µm or mm) ; 2(b)(iii) 1 states the correct number of eyepiece graticule units across width of section ; 2 2 shows 75 multiplied by the answer to (b)(ii) ;
More questions on Cells as the basic units of living organisms
What was in this paper
The subtopics covered by these 2 questions, and how many questions each got. Open one in a new tab to see every Cambridge question on it.
What you needed in this session
Cambridge’s own grade thresholds for 2024 Oct/Nov, Paper 3 · Variant 1. A higher threshold means an easier paper — the bar moves with how the cohort did.