Cambridge A Level Biology 9700 — 2022 Oct/Nov Paper 3 · Variant 1
9700/31/O/N/22 · 2 questions · 40 marks · ≈45 min
The question paper and its mark scheme, free to read here and free to download. This is Cambridge’s own paper, exactly as it was sat.
Question paper16 pages



Mark scheme7 pages
Answers below. Sit the paper first if you are practising.
Questions as text
Q1 · Some fruit contains large quantities of ascorbic acid (vitamin C)
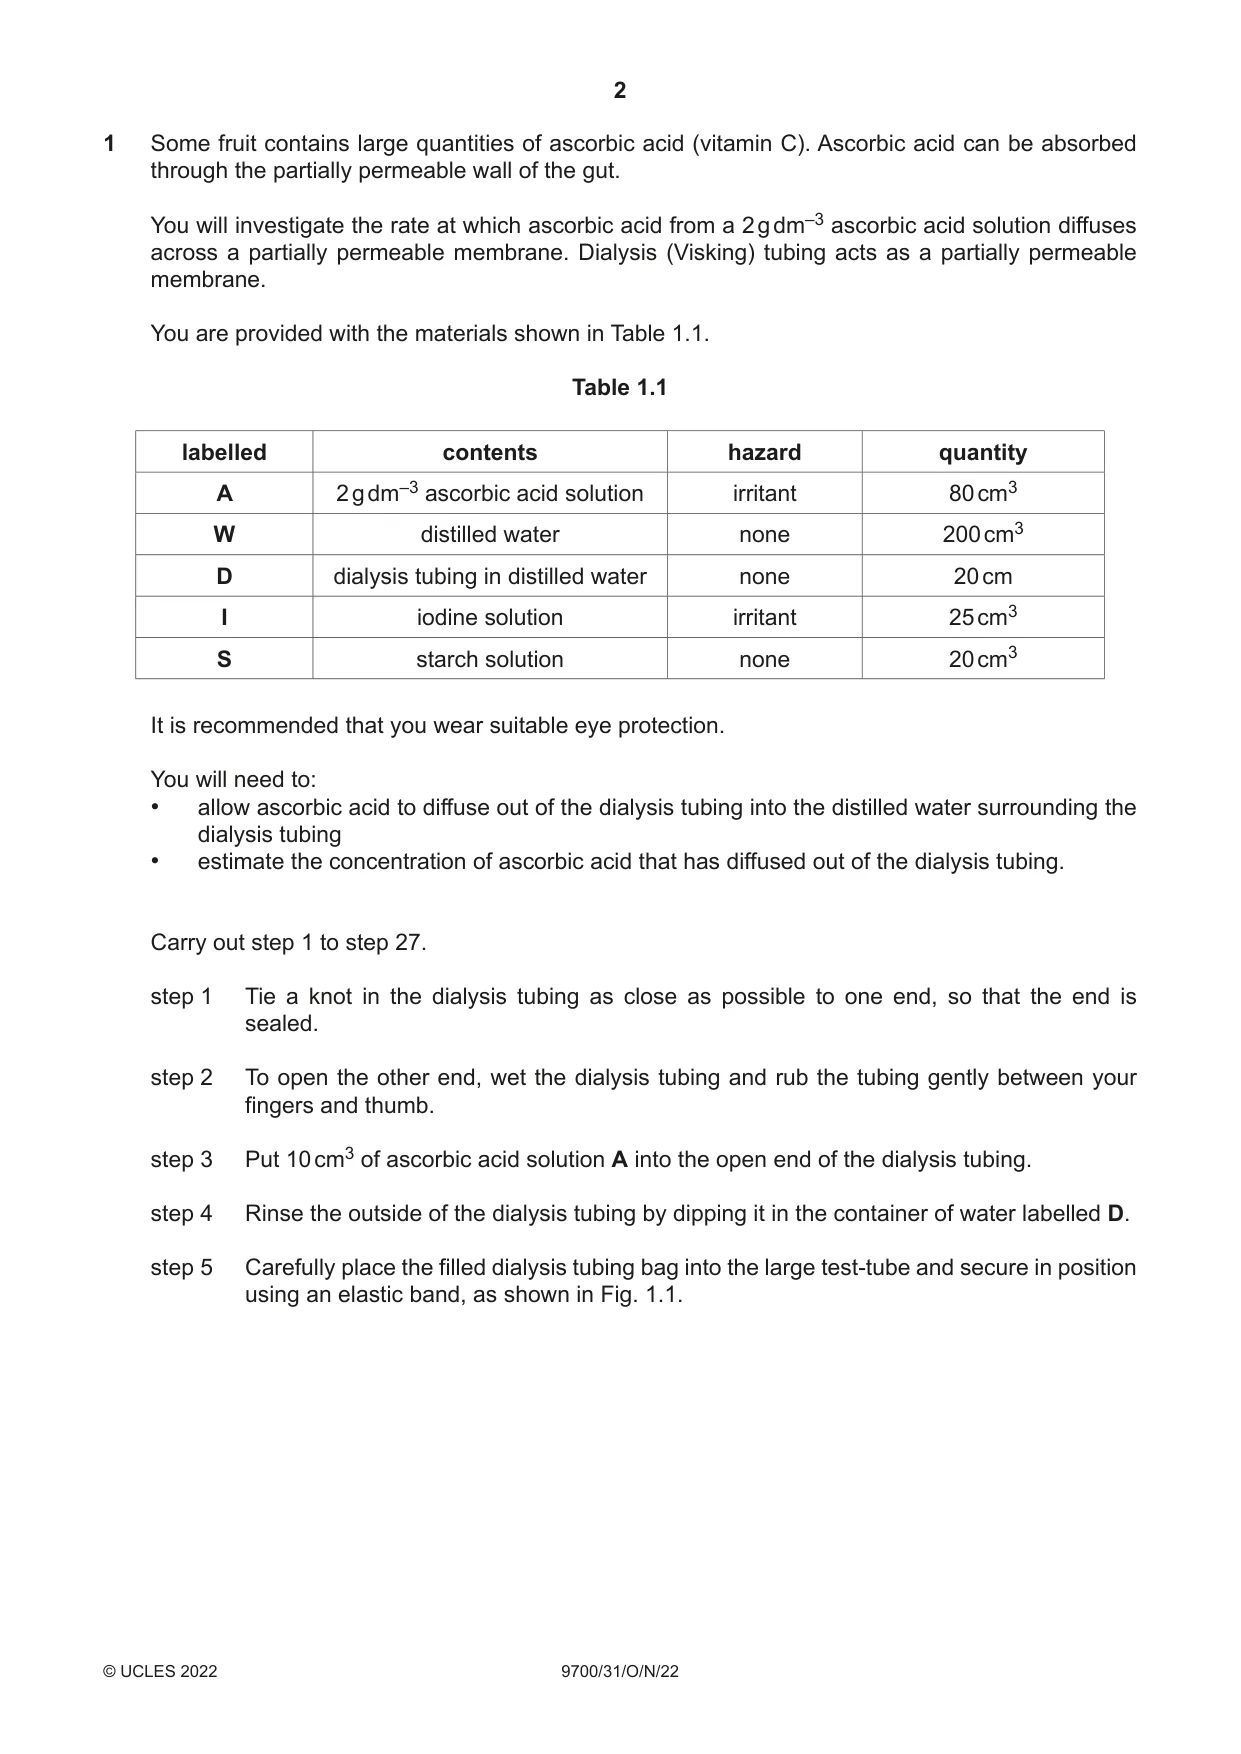
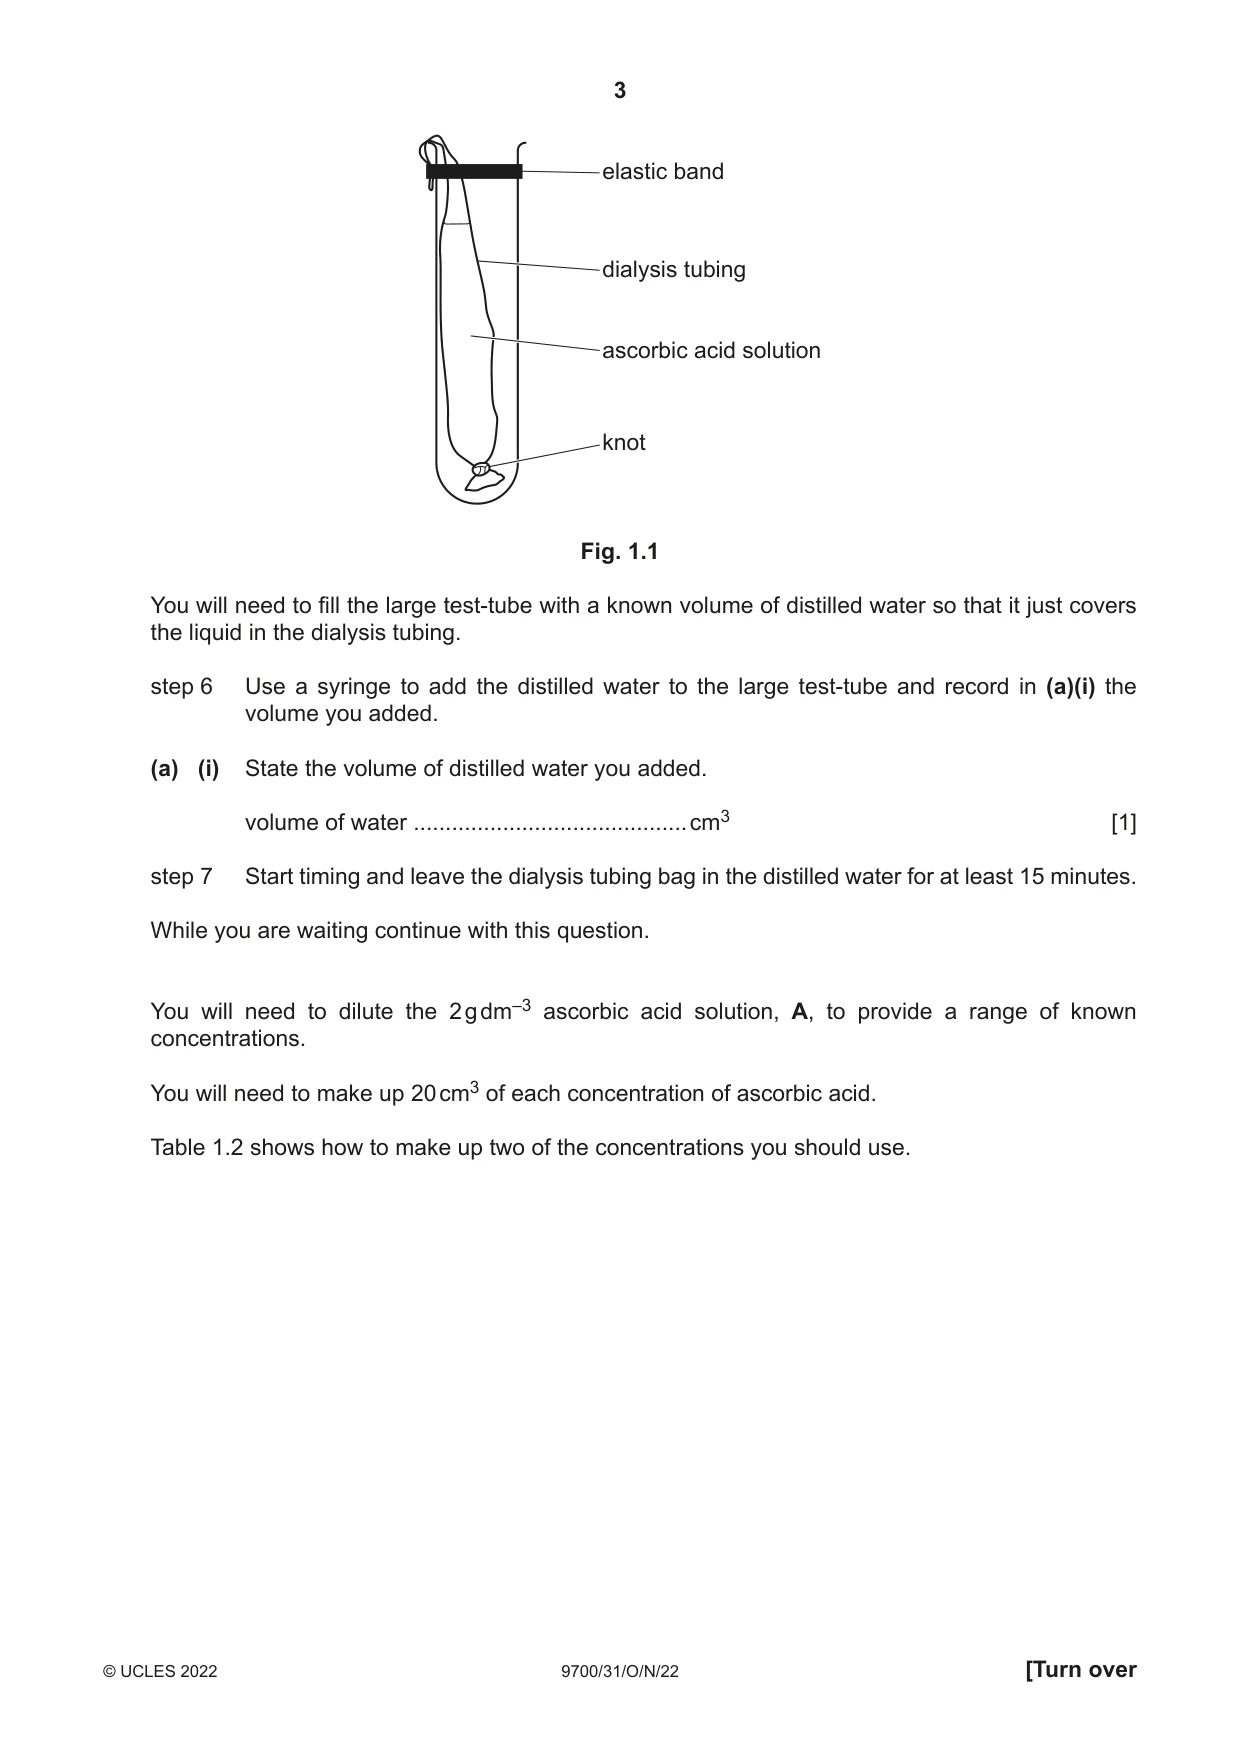
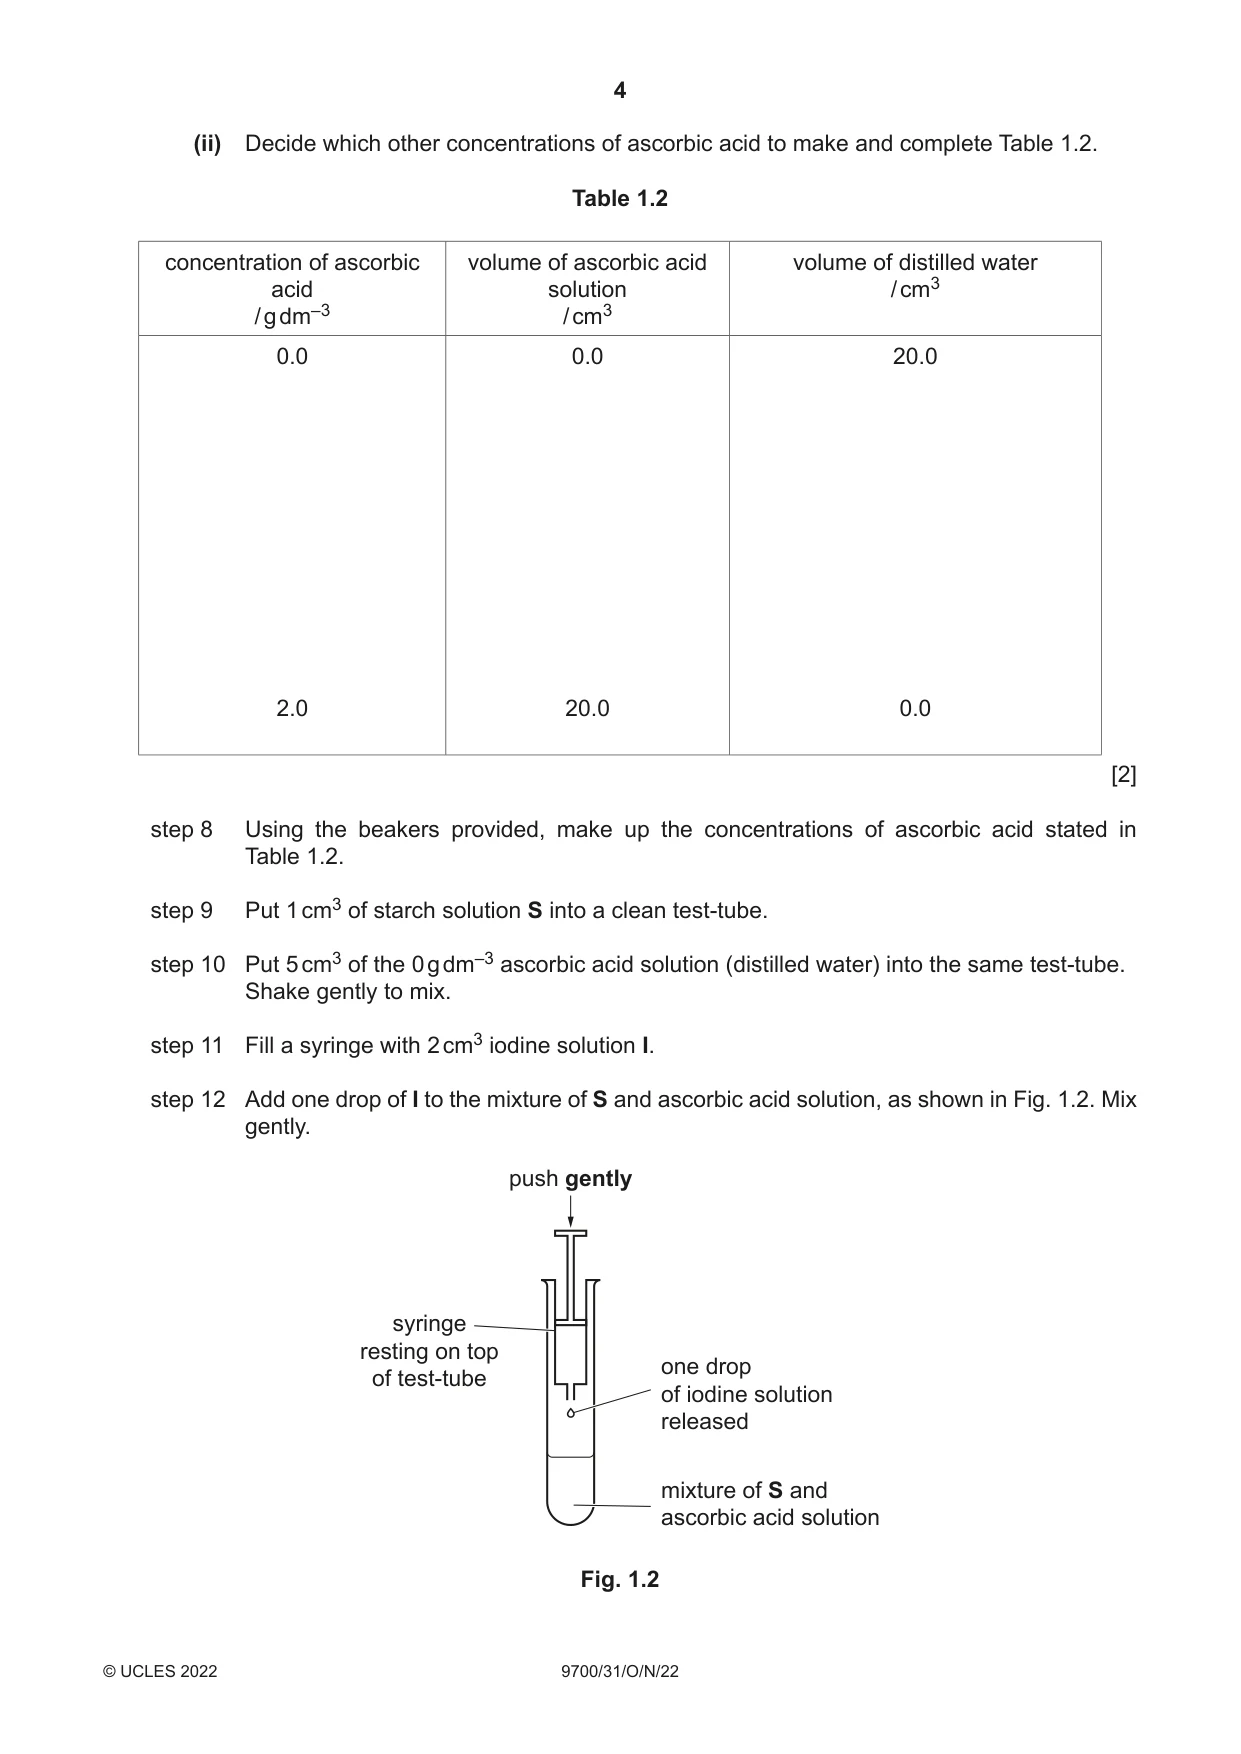
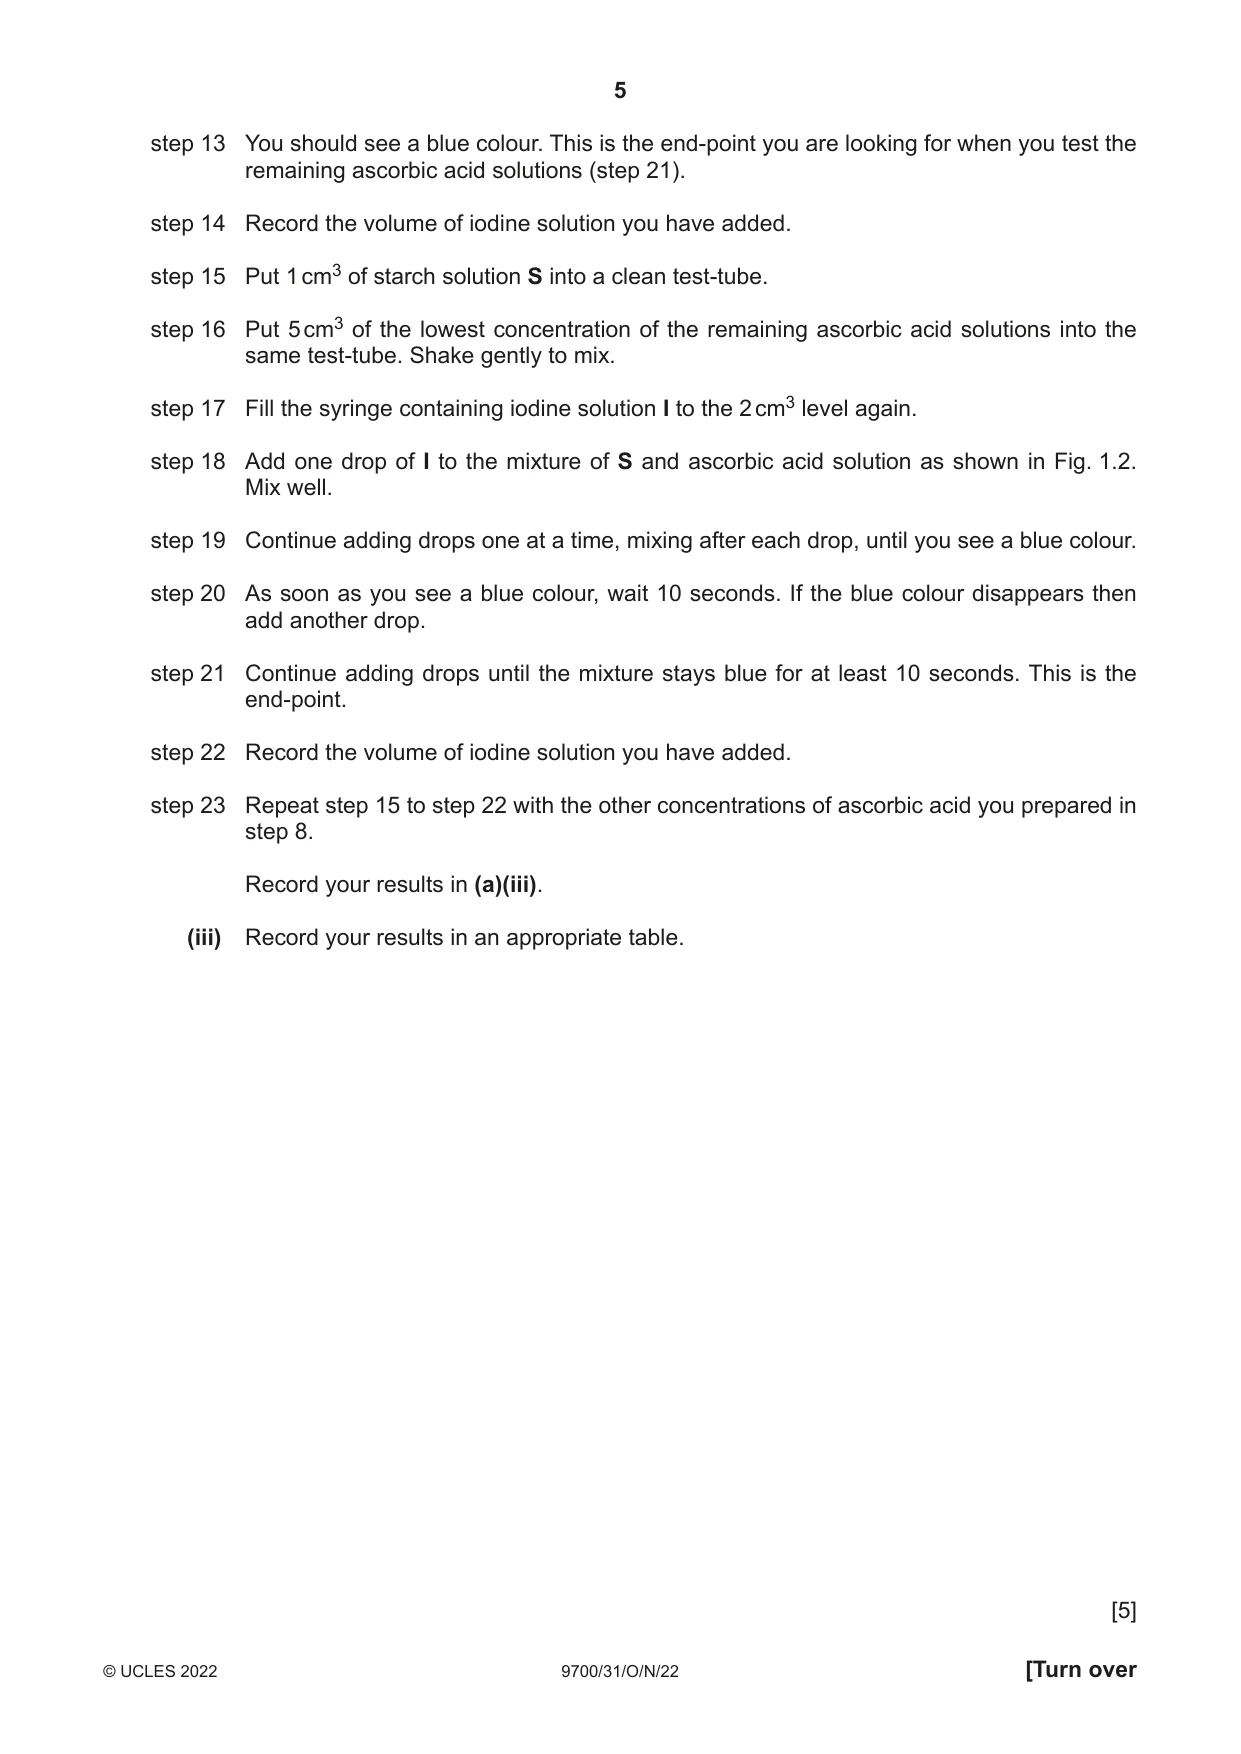
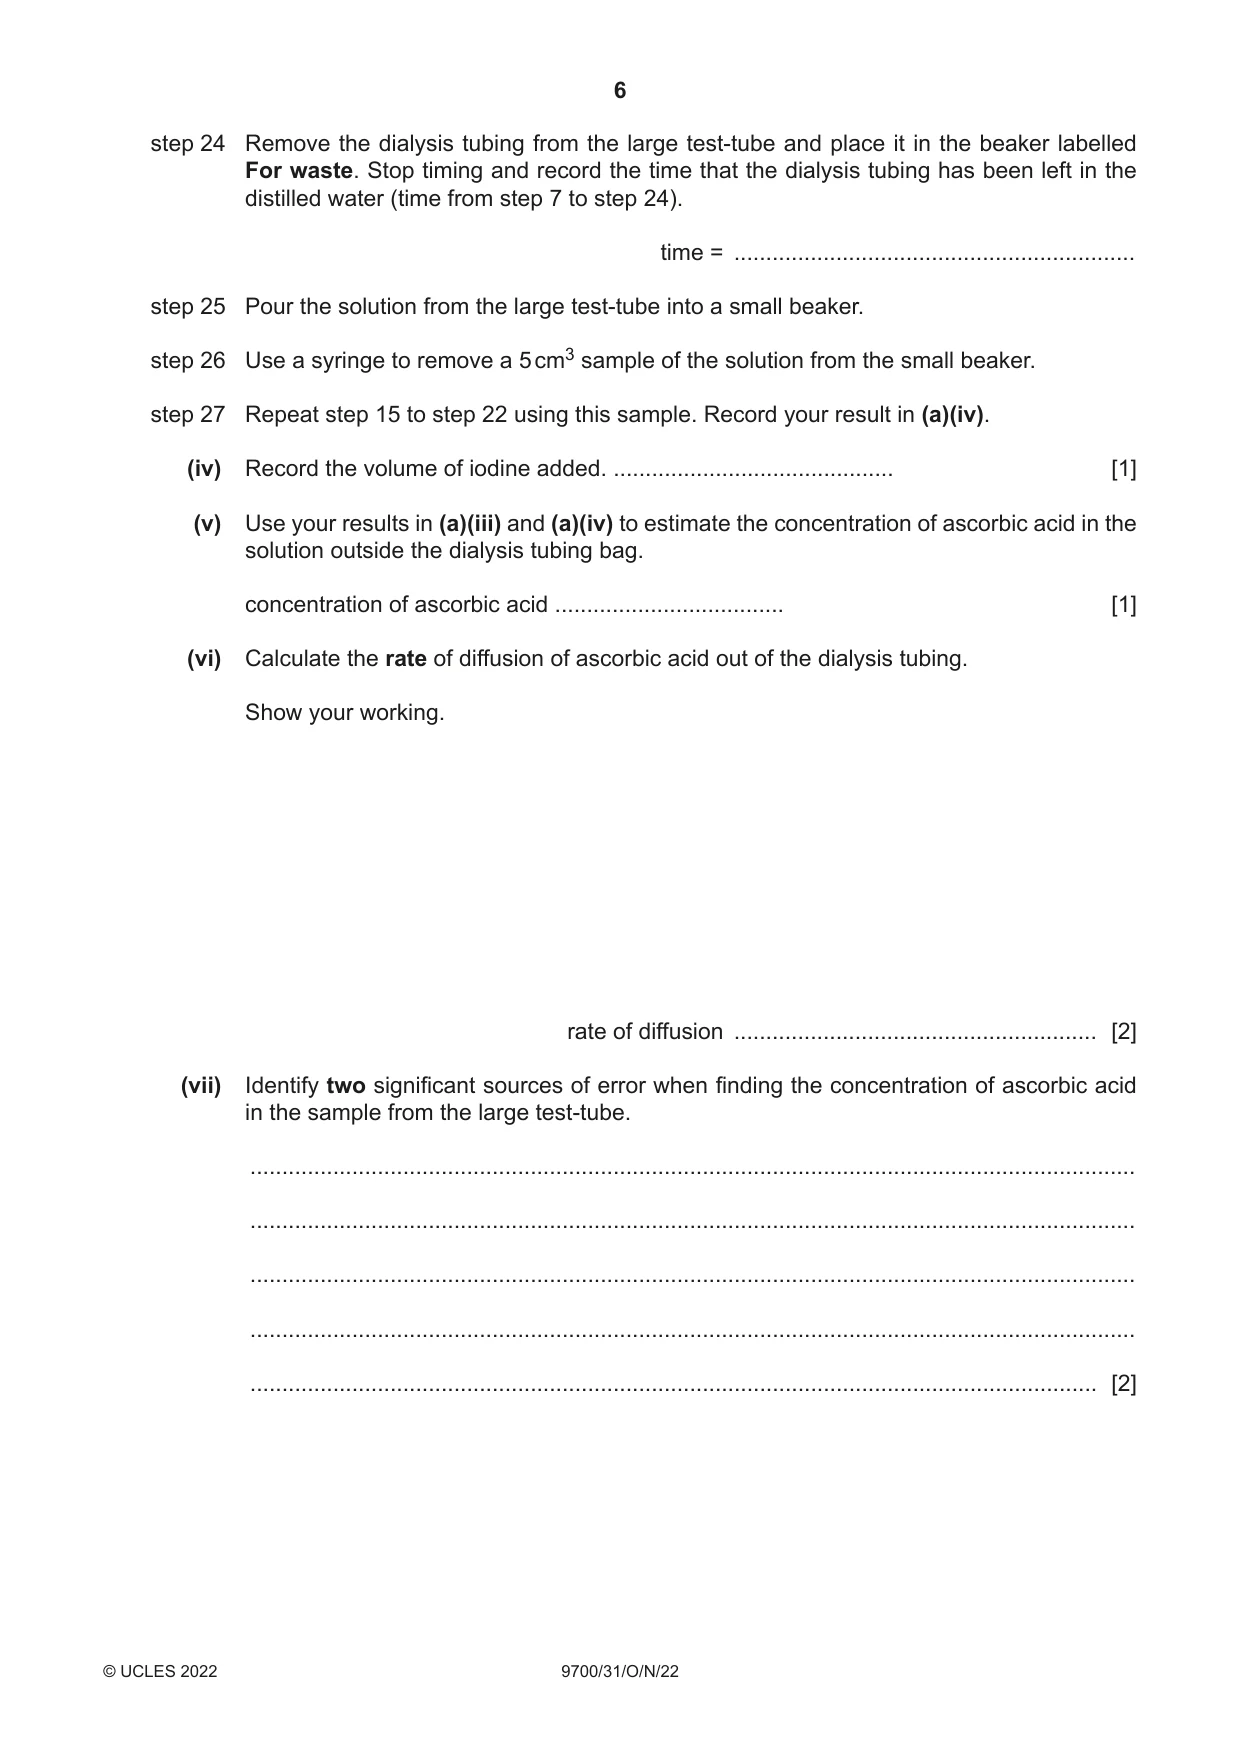
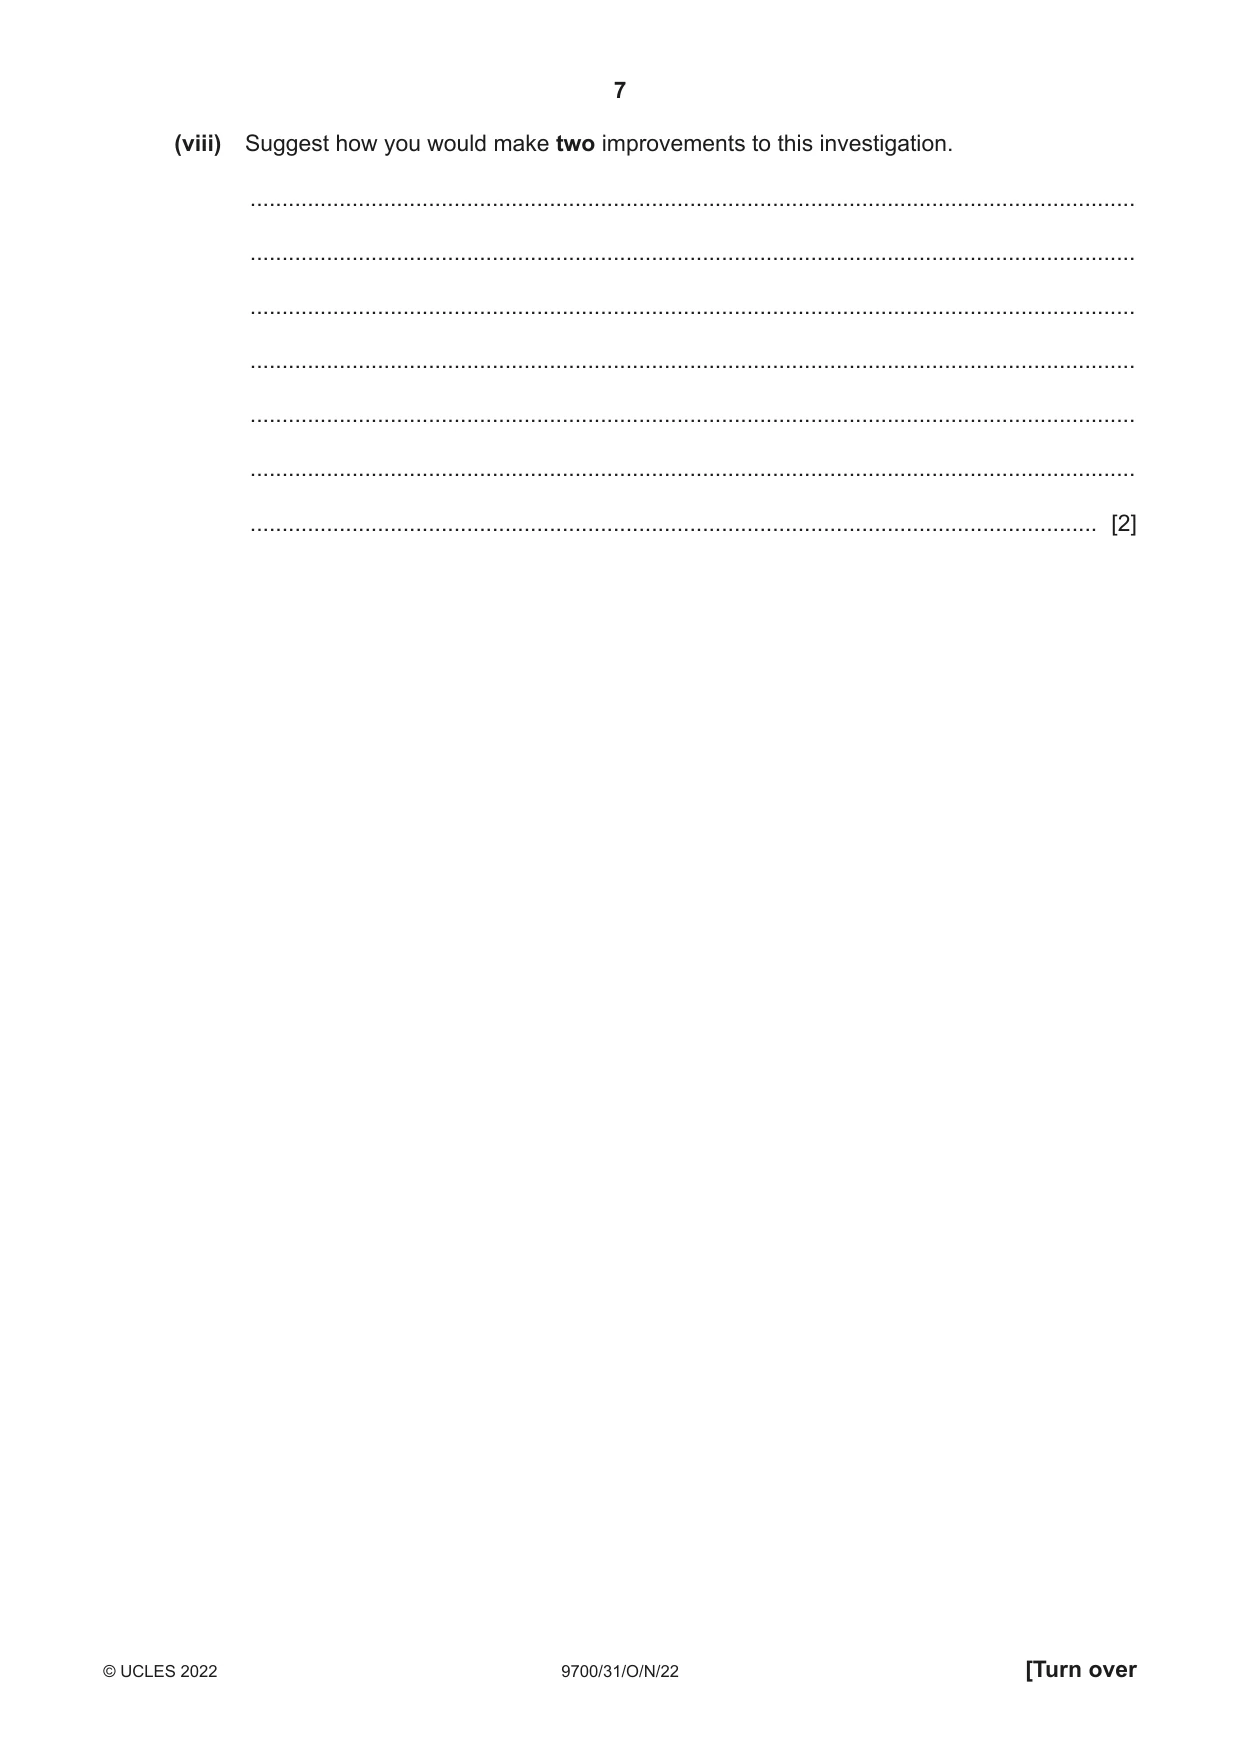
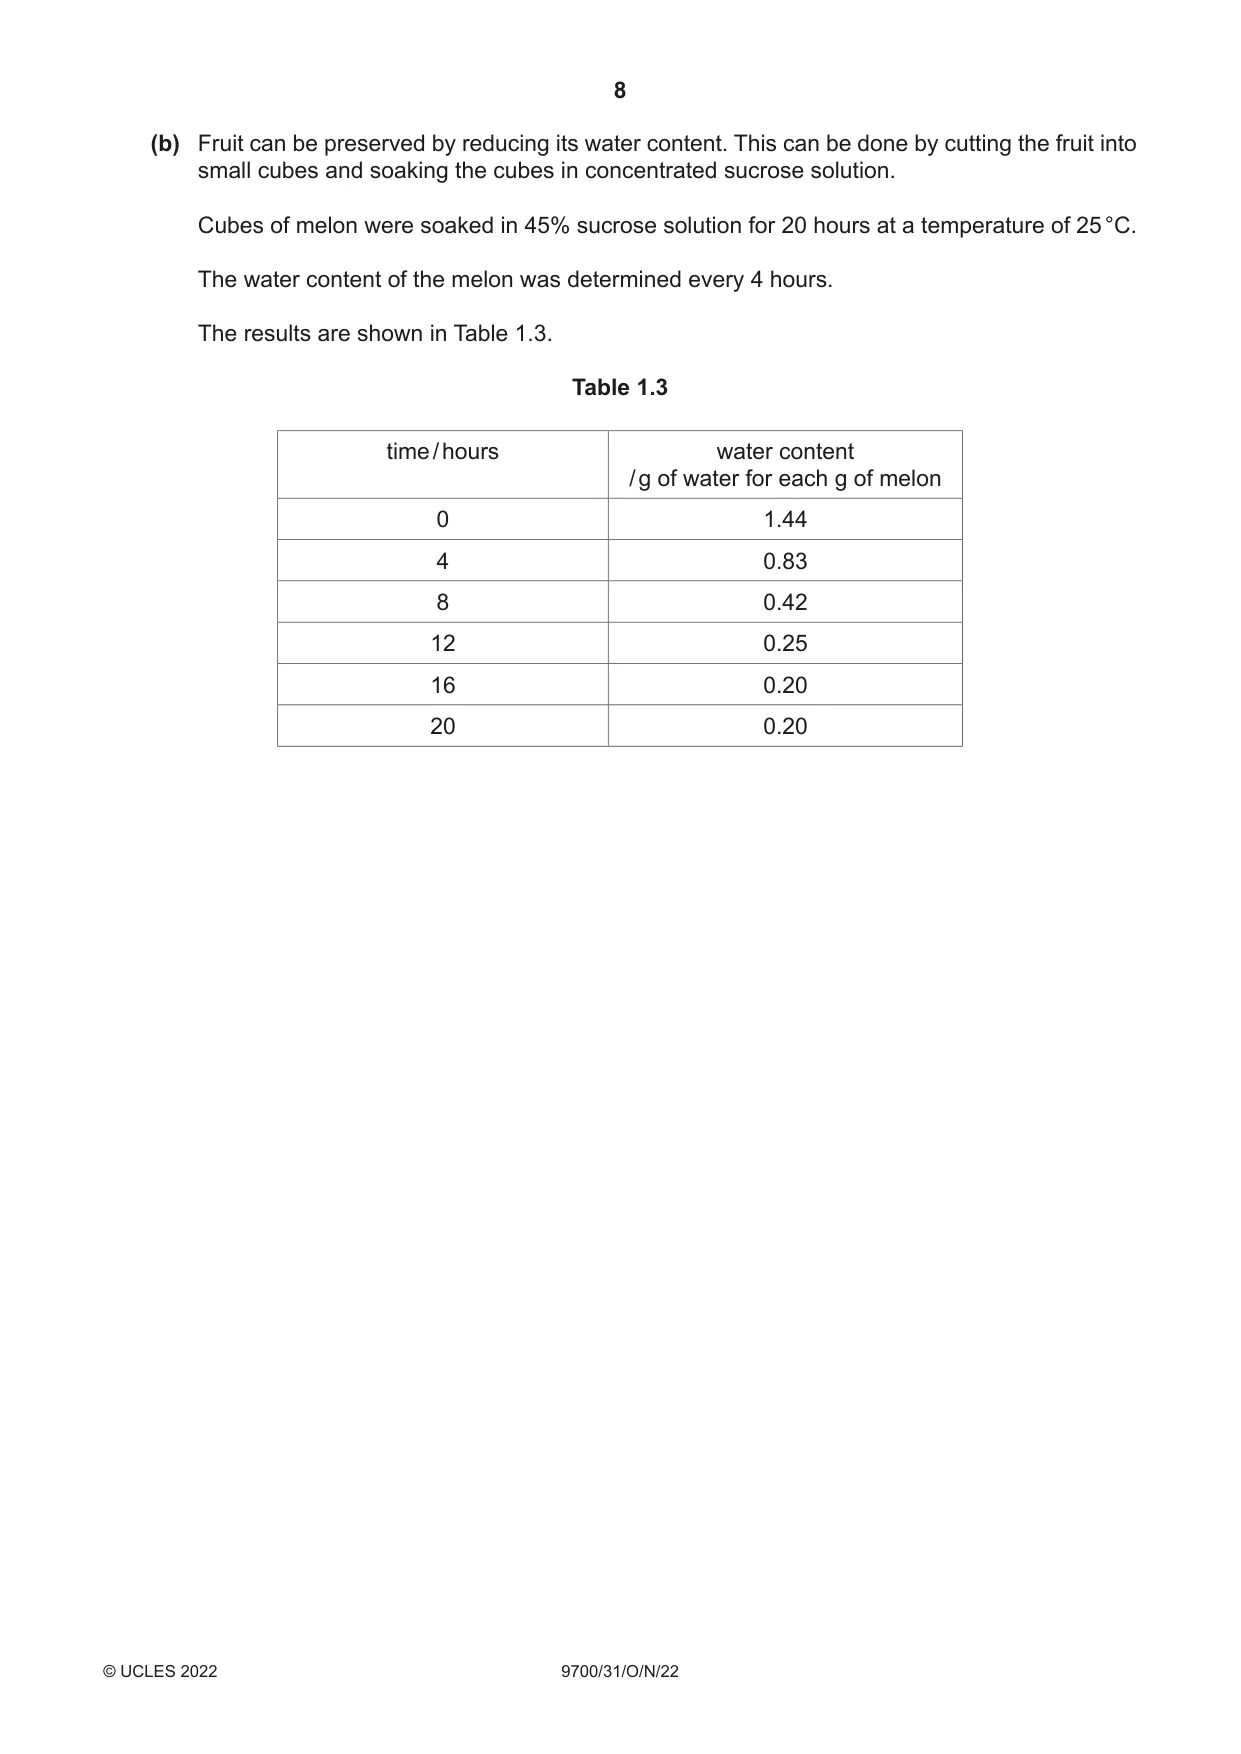
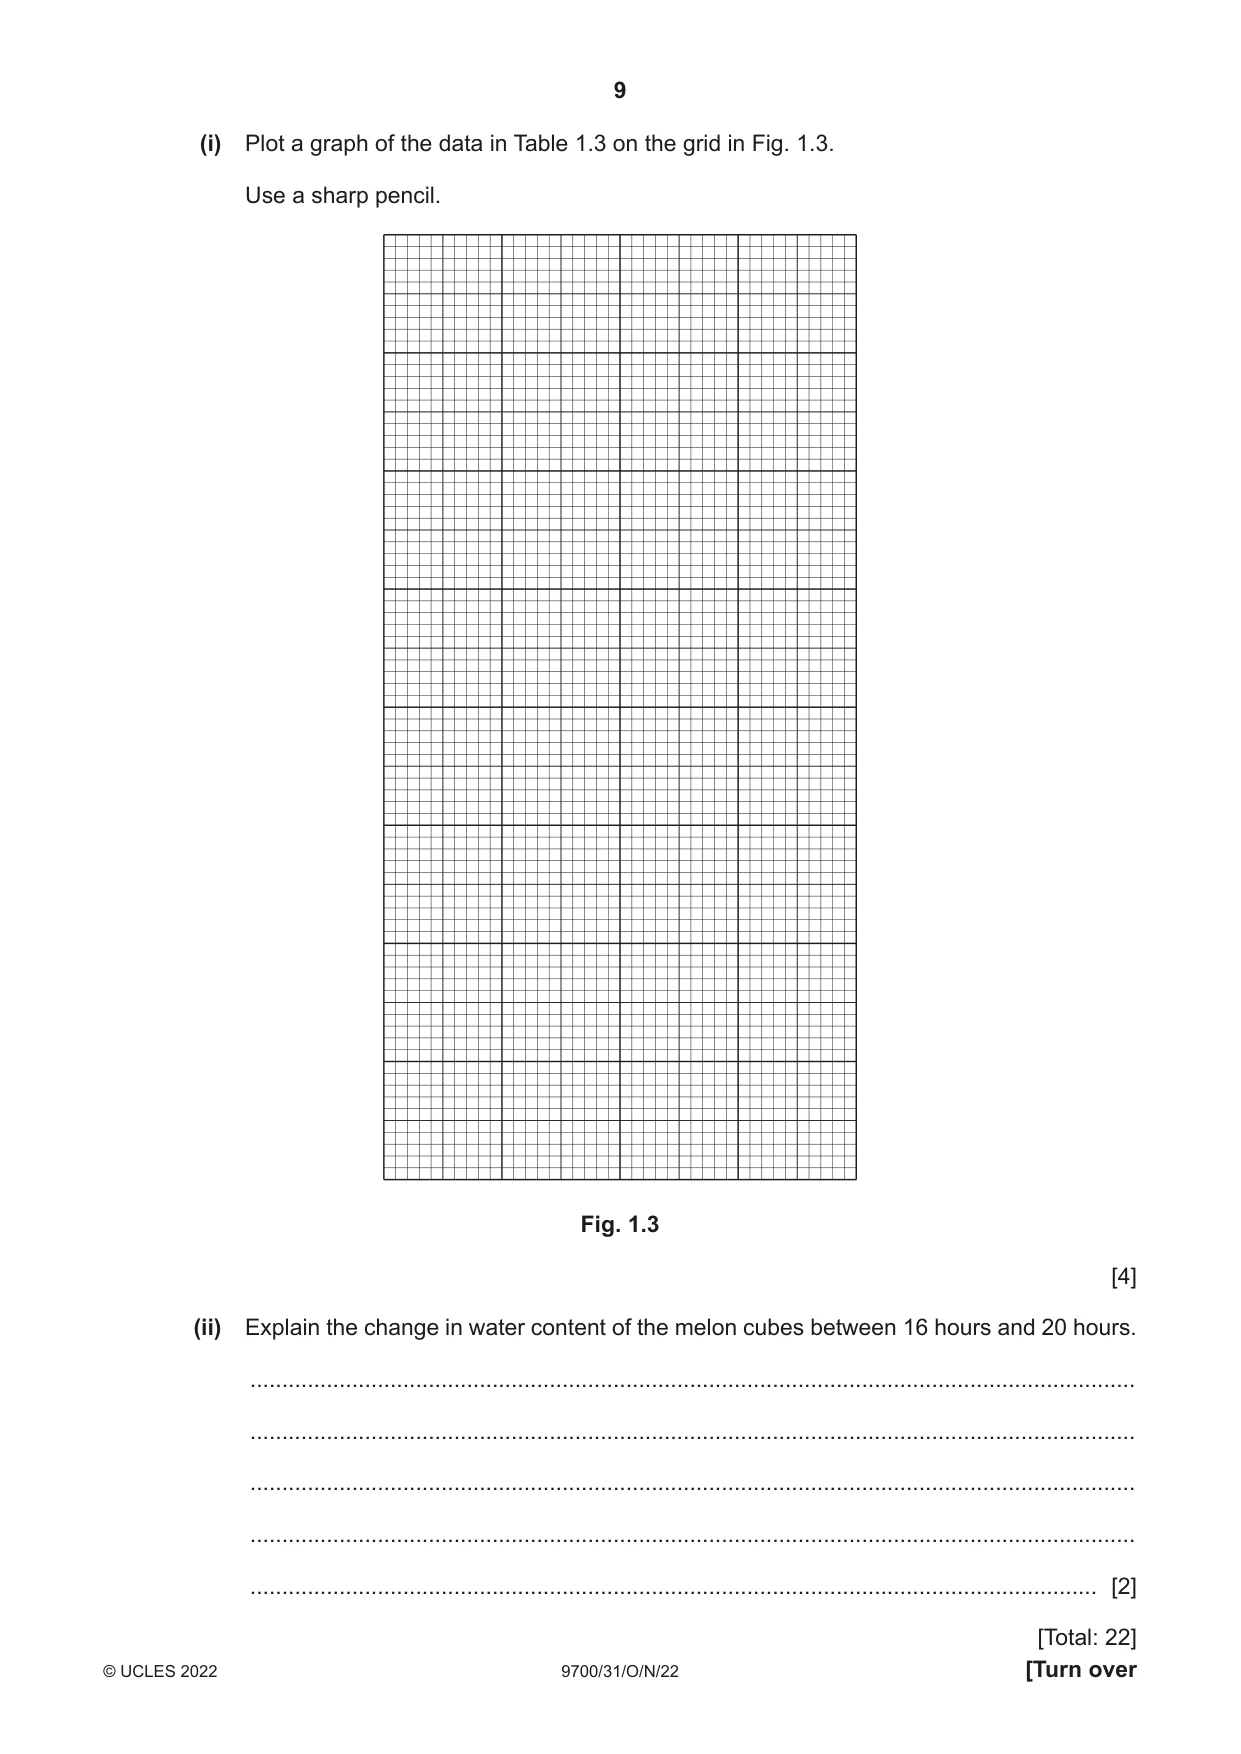
1 Some fruit contains large quantities of ascorbic acid (vitamin C). Ascorbic acid can be absorbed through the partially permeable wall of the gut. You will investigate the rate at which ascorbic acid from a 2 g dm–3 ascorbic acid solution diffuses across a partially permeable membrane. Dialysis (Visking) tubing acts as a partially permeable membrane. You are provided with the materials shown in Table 1.1. Table 1.1 labelled contents hazard quantity A 2 g dm–3 ascorbic acid solution irritant 80 cm3 W distilled water none 200 cm3 D dialysis tubing in distilled water none 20 cm I iodine solution irritant 25 cm3 S starch solution none 20 cm3 It is recommended that you wear suitable eye protection. You will need to: • allow ascorbic acid to diffuse out of the dialysis tubing into the distilled water surrounding the dialysis tubing • estimate the concentration of ascorbic acid that has diffused out of the dialysis tubing. Carry out step 1 to step 27. step 1 Tie a knot in the dialysis tubing as close as possible to one end, so that the end is sealed. step 2 To open the other end, wet the dialysis tubing and rub the tubing gently between your fingers and thumb. step 3 Put 10 cm3 of ascorbic acid solution A into the open end of the dialysis tubing. step 4 Rinse the outside of the dialysis tubing by dipping it in the container of water labelled D. step 5 Carefully place the filled dialysis tubing bag into the large test-tube and secure in position using an elastic band, as shown in Fig. 1.1. elastic band dialysis tubing ascorbic acid solution knot Fig. 1.1 You will need to fill the large test-tube with a known volume of distilled water so that it just covers the liquid in the dialysis tubing. step 6 Use a syringe to add the distilled water to the large test-tube and record in (a)(i) the volume you added. (a) (i) State the volume of distilled water you added. volume of water ........................................... cm3 [1] step 7 Start timing and leave the dialysis tubing bag in the distilled water for at least 15 minutes. While you are waiting continue with this question. You will need to dilute the 2 g dm–3 ascorbic acid solution, A, to provide a range of known concentrations. You will need to make up 20 cm3 of each concentration of ascorbic acid. Table 1.2 shows how to make up two of the concentrations you should use. (ii) Decide which other concentrations of ascorbic acid to make and complete Table 1.2. Table 1.2 concentration of ascorbic volume of ascorbic acid volume of distilled water acid solution / cm3 / g dm–3 / cm3 0.0 0.0 20.0 2.0 20.0 0.0 [2] step 8 Using the beakers provided, make up the concentrations of ascorbic acid stated in Table 1.2. step 9 Put 1 cm3 of starch solution S into a clean test-tube. step 10 Put 5 cm3 of the 0 g dm–3 ascorbic acid solution (distilled water) into the same test-tube. Shake gently to mix. step 11 Fill a syringe with 2 cm3 iodine solution I. step 12 Add one drop of I to the mixture of S and ascorbic acid solution, as shown in Fig. 1.2. Mix gently. push gently syringe resting on top one drop of test-tube of iodine solution released mixture of S and ascorbic acid solution Fig. 1.2 step 13 You should see a blue colour. This is the end-point you are looking for when you test the remaining ascorbic acid solutions (step 21). step 14 Record the volume of iodine solution you have added. step 15 Put 1 cm3 of starch solution S into a clean test-tube. step 16 Put 5 cm3 of the lowest concentration of the remaining ascorbic acid solutions into the same test-tube. Shake gently to mix. step 17 Fill the syringe containing iodine solution I to the 2 cm3 level again. step 18 Add one drop of I to the mixture of S and ascorbic acid solution as shown in Fig. 1.2. Mix well. step 19 Continue adding drops one at a time, mixing after each drop, until you see a blue colour. step 20 As soon as you see a blue colour, wait 10 seconds. If the blue colour disappears then add another drop. step 21 Continue adding drops until the mixture stays blue for at least 10 seconds. This is the end-point. step 22 Record the volume of iodine solution you have added. step 23 Repeat step 15 to step 22 with the other concentrations of ascorbic acid you prepared in step 8. Record your results in (a)(iii). (iii) Record your results in an appropriate table. [5] step 24 Remove the dialysis tubing from the large test-tube and place it in the beaker labelled For waste. Stop timing and record the time that the dialysis tubing has been left in the distilled water (time from step 7 to step 24). time = ............................................................... step 25 Pour the solution from the large test-tube into a small beaker. step 26 Use a syringe to remove a 5 cm3 sample of the solution from the small beaker. step 27 Repeat step 15 to step 22 using this sample. Record your result in (a)(iv). (iv) Record the volume of iodine added. ............................................ [1] (v) Use your results in (a)(iii) and (a)(iv) to estimate the concentration of ascorbic acid in the solution outside the dialysis tubing bag. concentration of ascorbic acid .................................... [1] (vi) Calculate the rate of diffusion of ascorbic acid out of the dialysis tubing. Show your working. rate of diffusion ......................................................... [2] (vii) Identify two significant sources of error when finding the concentration of ascorbic acid in the sample from the large test-tube. ........................................................................................................................................... ........................................................................................................................................... ........................................................................................................................................... ........................................................................................................................................... ..................................................................................................................................... [2] (viii) Suggest how you would make two improvements to this investigation. ........................................................................................................................................... ........................................................................................................................................... ........................................................................................................................................... ........................................................................................................................................... ........................................................................................................................................... ........................................................................................................................................... ..................................................................................................................................... [2] (b) Fruit can be preserved by reducing its water content. This can be done by cutting the fruit into small cubes and soaking the cubes in concentrated sucrose solution. Cubes of melon were soaked in 45% sucrose solution for 20 hours at a temperature of 25 °C. The water content of the melon was determined every 4 hours. The results are shown in Table 1.3. Table 1.3 time / hours water content / g of water for each g of melon 0 1.44 4 0.83 8 0.42 12 0.25 16 0.20 20 0.20 (i) Plot a graph of the data in Table 1.3 on the grid in Fig. 1.3. Use a sharp pencil. Fig. 1.3 [4] (ii) Explain the change in water content of the melon cubes between 16 hours and 20 hours. ........................................................................................................................................... ........................................................................................................................................... ........................................................................................................................................... ........................................................................................................................................... ..................................................................................................................................... [2] [Total: 22]
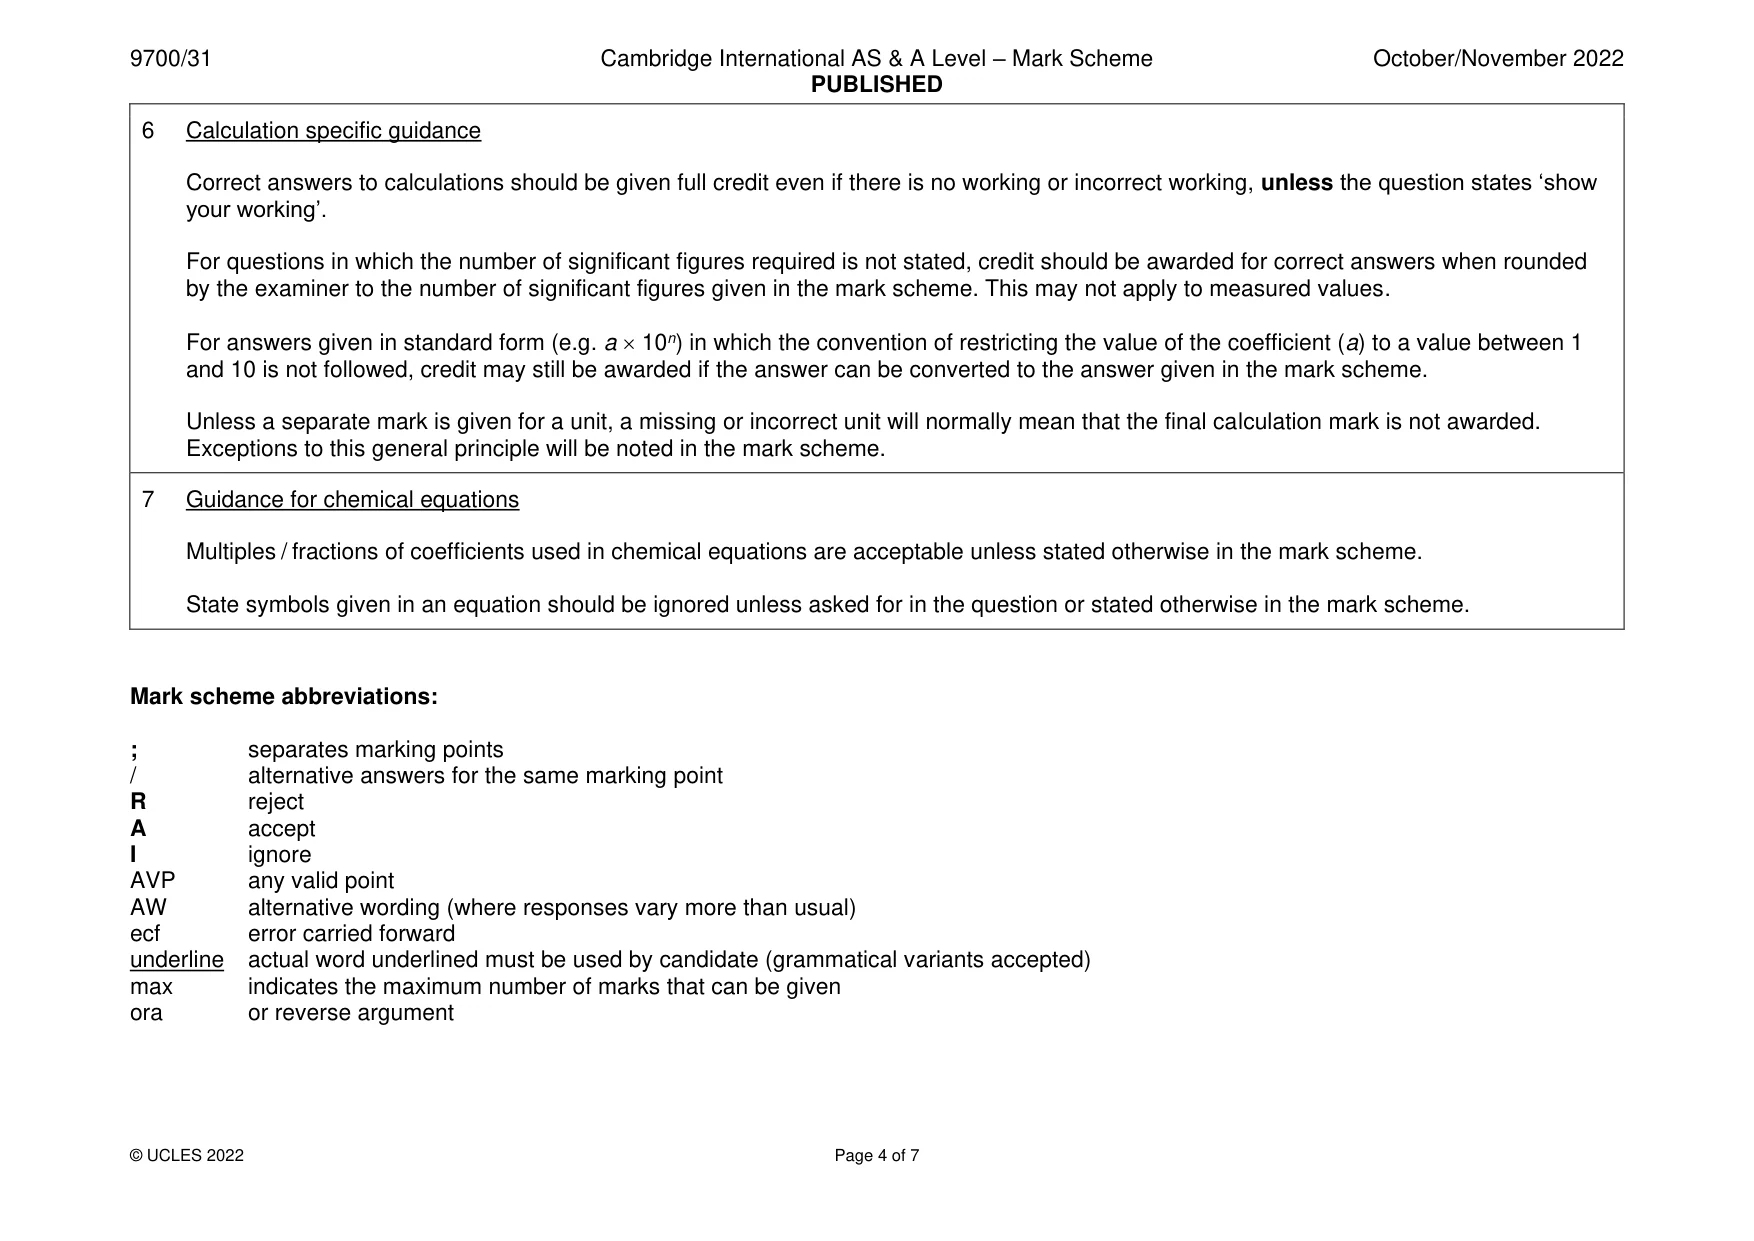
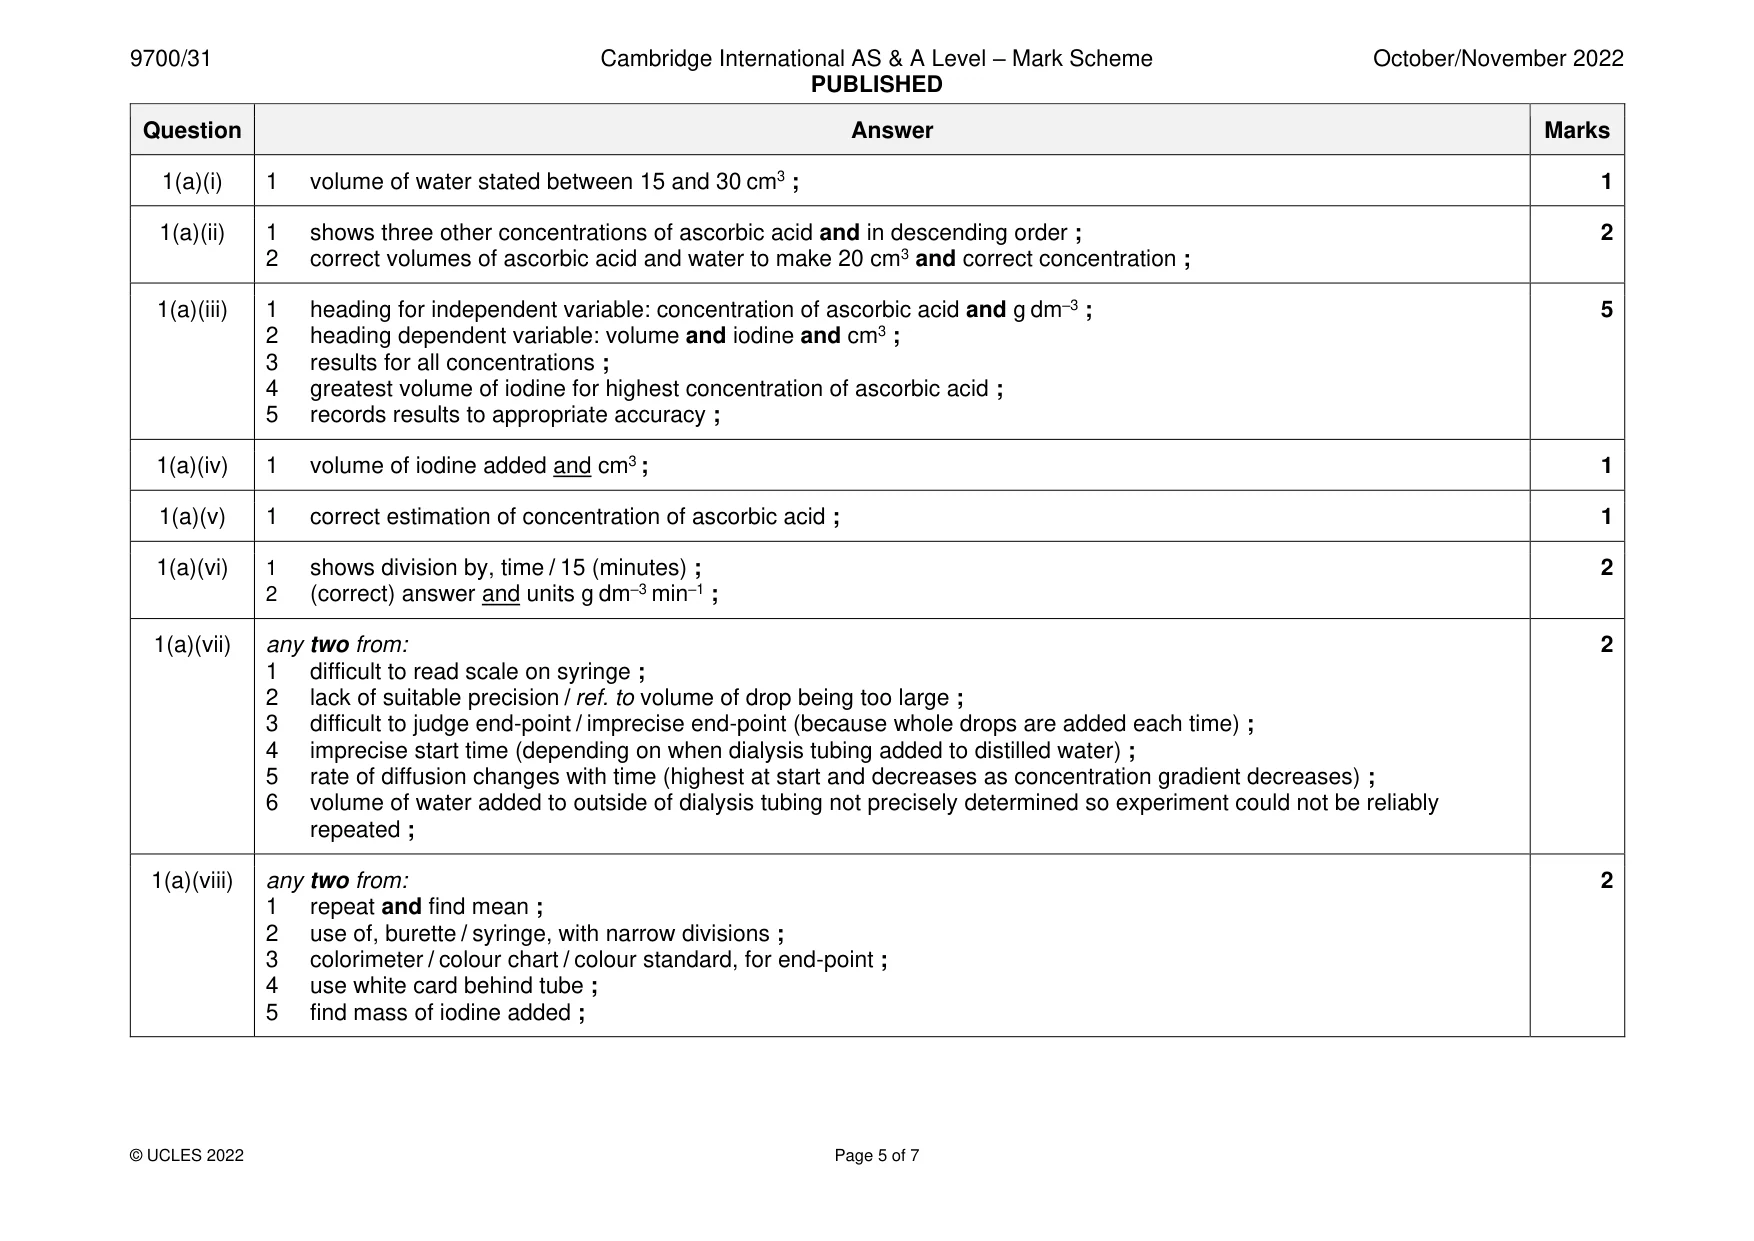
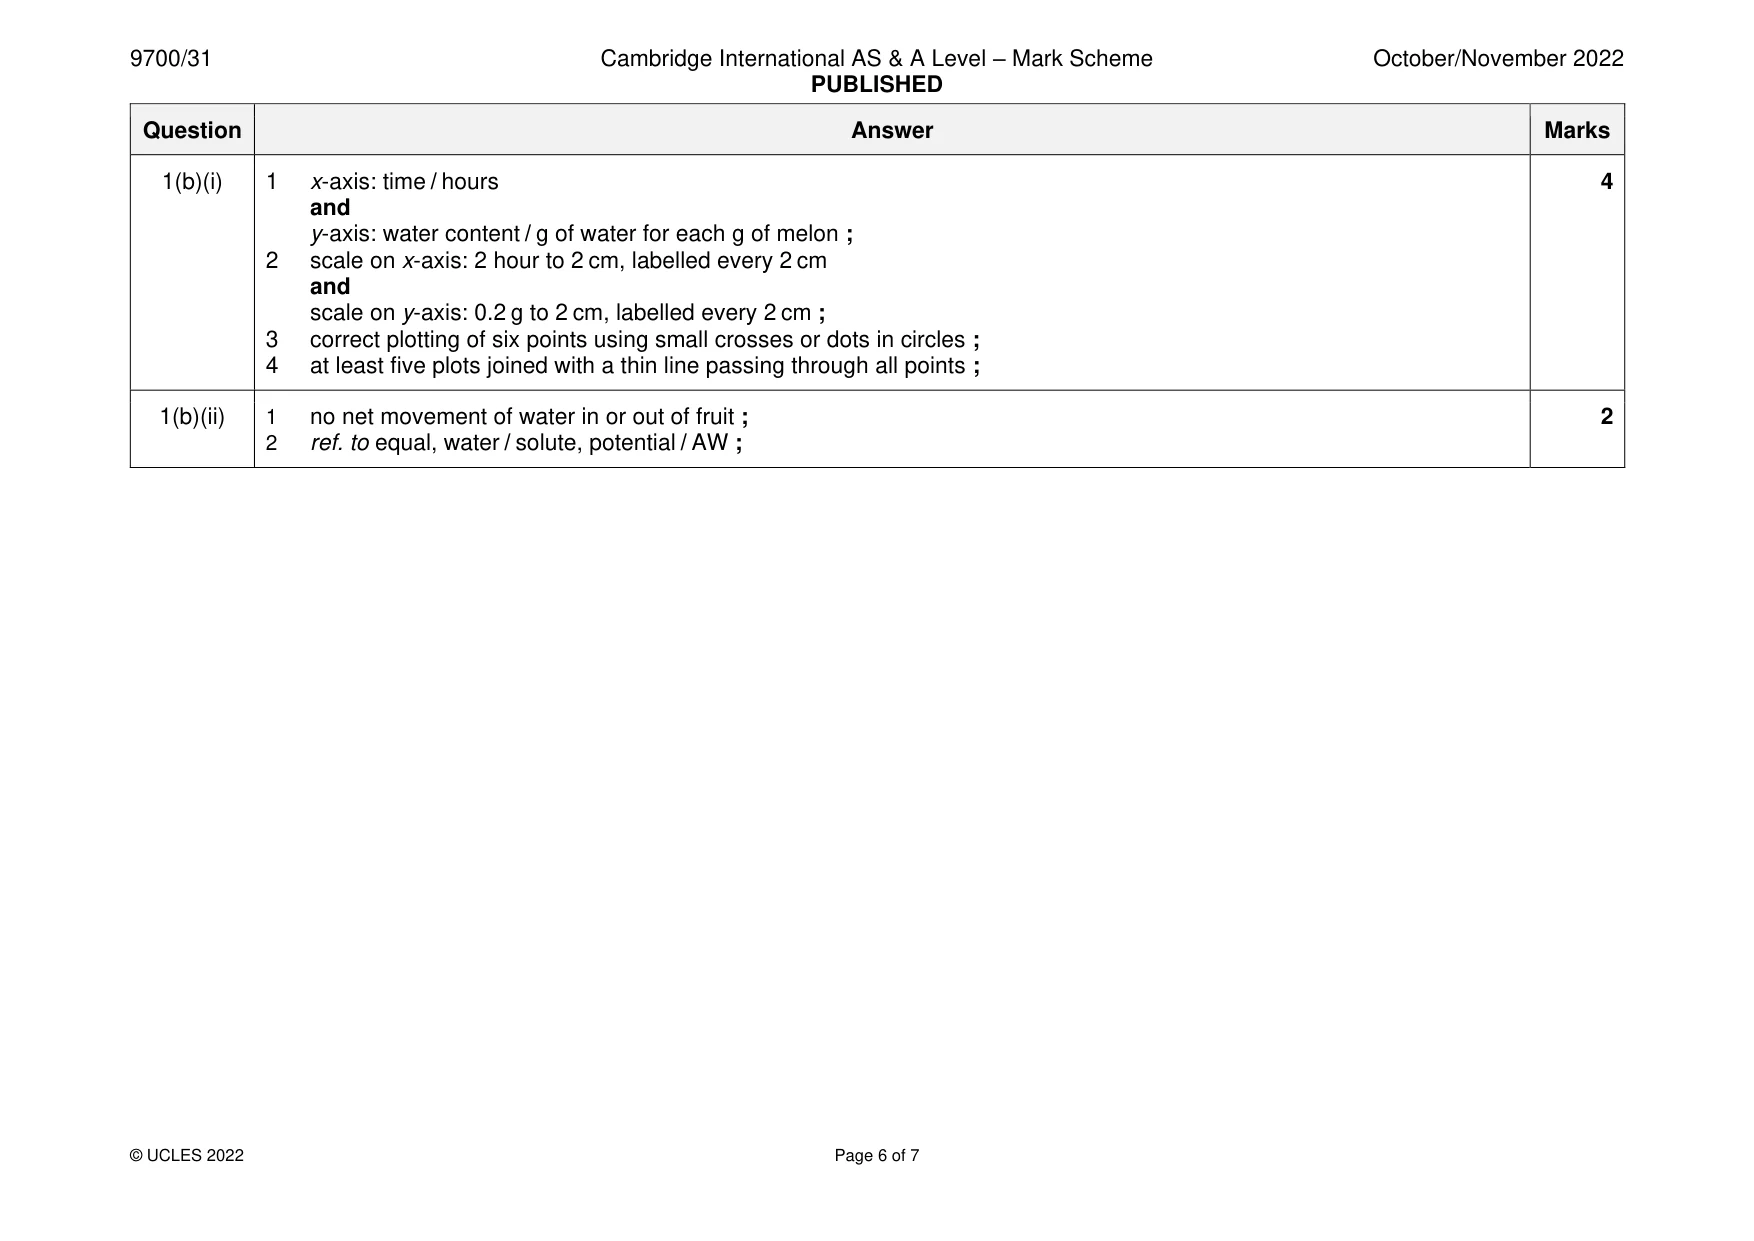
Mark scheme: Question Answer Marks 1(a)(i) 1 volume of water stated between 15 and 30 cm3 ; 1 1(a)(ii) 1 shows three other concentrations of ascorbic acid and in descending order ; 2 2 correct volumes of ascorbic acid and water to make 20 cm3 and correct concentration ; 1(a)(iii) 1 heading for independent variable: concentration of ascorbic acid and g dm–3 ; 5 2 heading dependent variable: volume and iodine and cm3 ; 3 results for all concentrations ; 4 greatest volume of iodine for highest concentration of ascorbic acid ; 5 records results to appropriate accuracy ; 1(a)(iv) 1 volume of iodine added and cm3 ; 1 1(a)(v) 1 correct estimation of concentration of ascorbic acid ; 1 1(a)(vi) 1 shows division by, time / 15 (minutes) ; 2 2 (correct) answer and units g dm–3 min–1 ; 1(a)(vii) any two from: 2 1 difficult to read scale on syringe ; 2 lack of suitable precision / ref. to volume of drop being too large ; 3 difficult to judge end-point / imprecise end-point (because whole drops are added each time) ; 4 imprecise start time (depending on when dialysis tubing added to distilled water) ; 5 rate of diffusion changes with time (highest at start and decreases as concentration gradient decreases) ; 6 volume of water added to outside of dialysis tubing not precisely determined so experiment could not be reliably repeated ; 1(a)(viii) any two from: 2 1 repeat and find mean ; 2 use of, burette / syringe, with narrow divisions ; 3 colorimeter / colour chart / colour standard, for end-point ; 4 use white card behind tube ; 5 find mass of iodine added ; 1(b)(i) 1 x-axis: time / hours 4 and y-axis: water content / g of water for each g of melon ; 2 scale on x-axis: 2 hour to 2 cm, labelled every 2 cm and scale on y-axis: 0.2 g to 2 cm, labelled every 2 cm ; 3 correct plotting of six points using small crosses or dots in circles ; 4 at least five plots joined with a thin line passing through all points ; 1(b)(ii) 1 no net movement of water in or out of fruit ; 2 2 ref. to equal, water / solute, potential / AW ;
Q2 · J1 is a slide of a stained transverse section through a plant stem
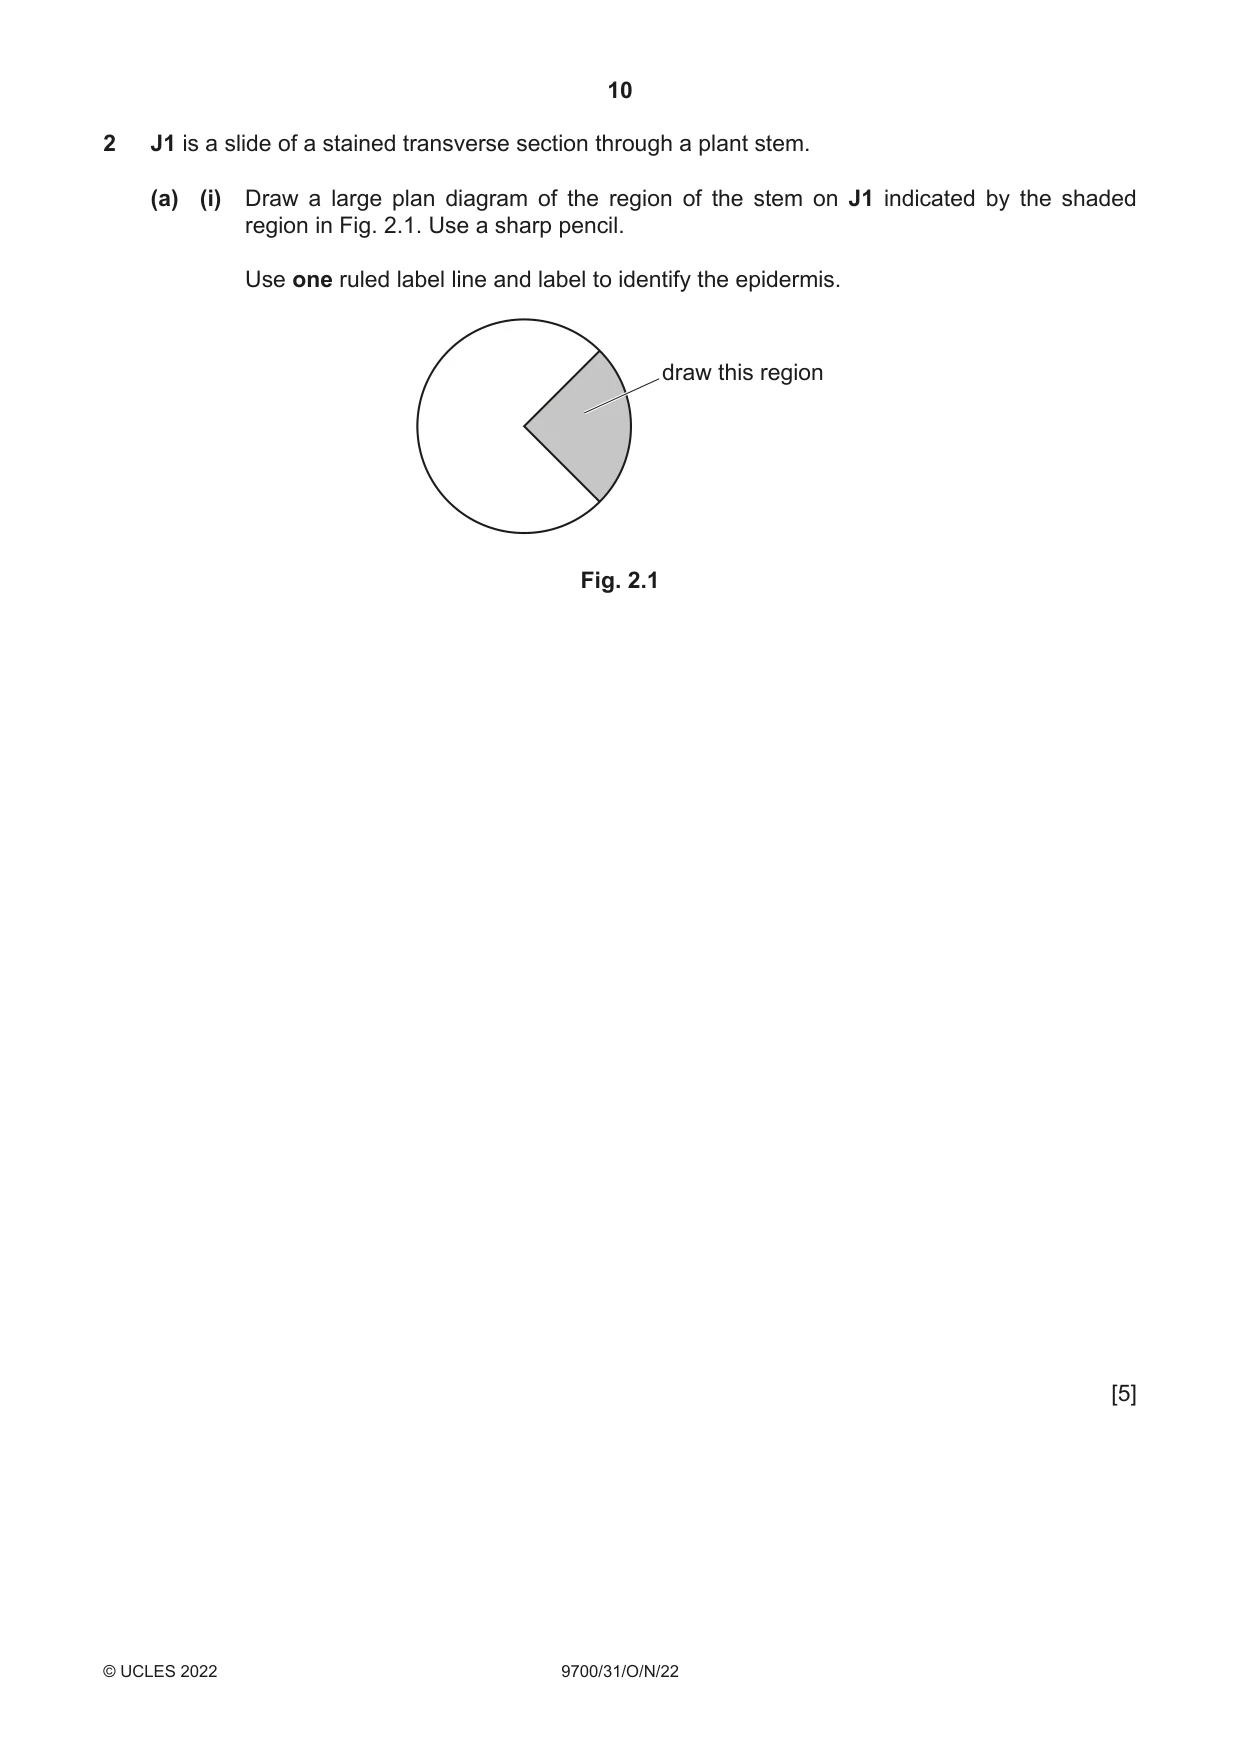
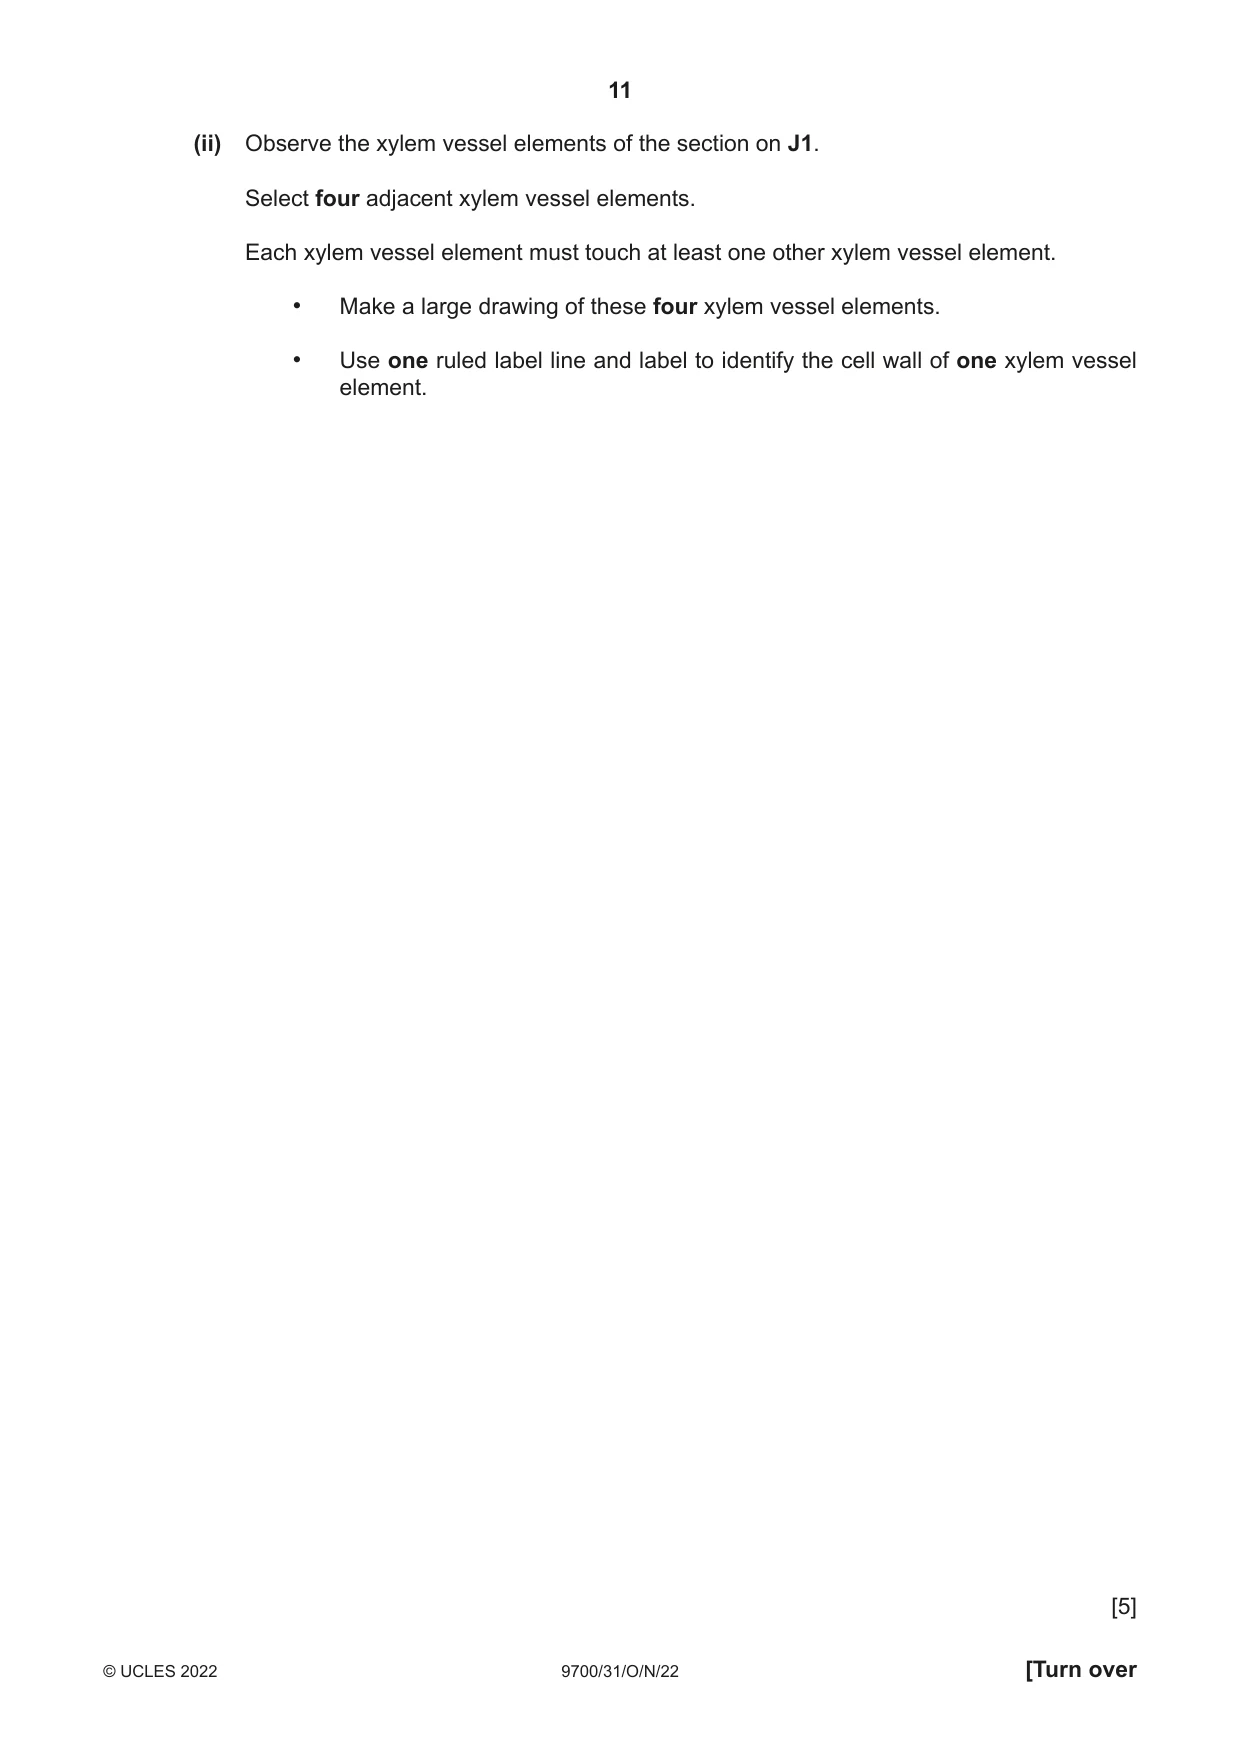
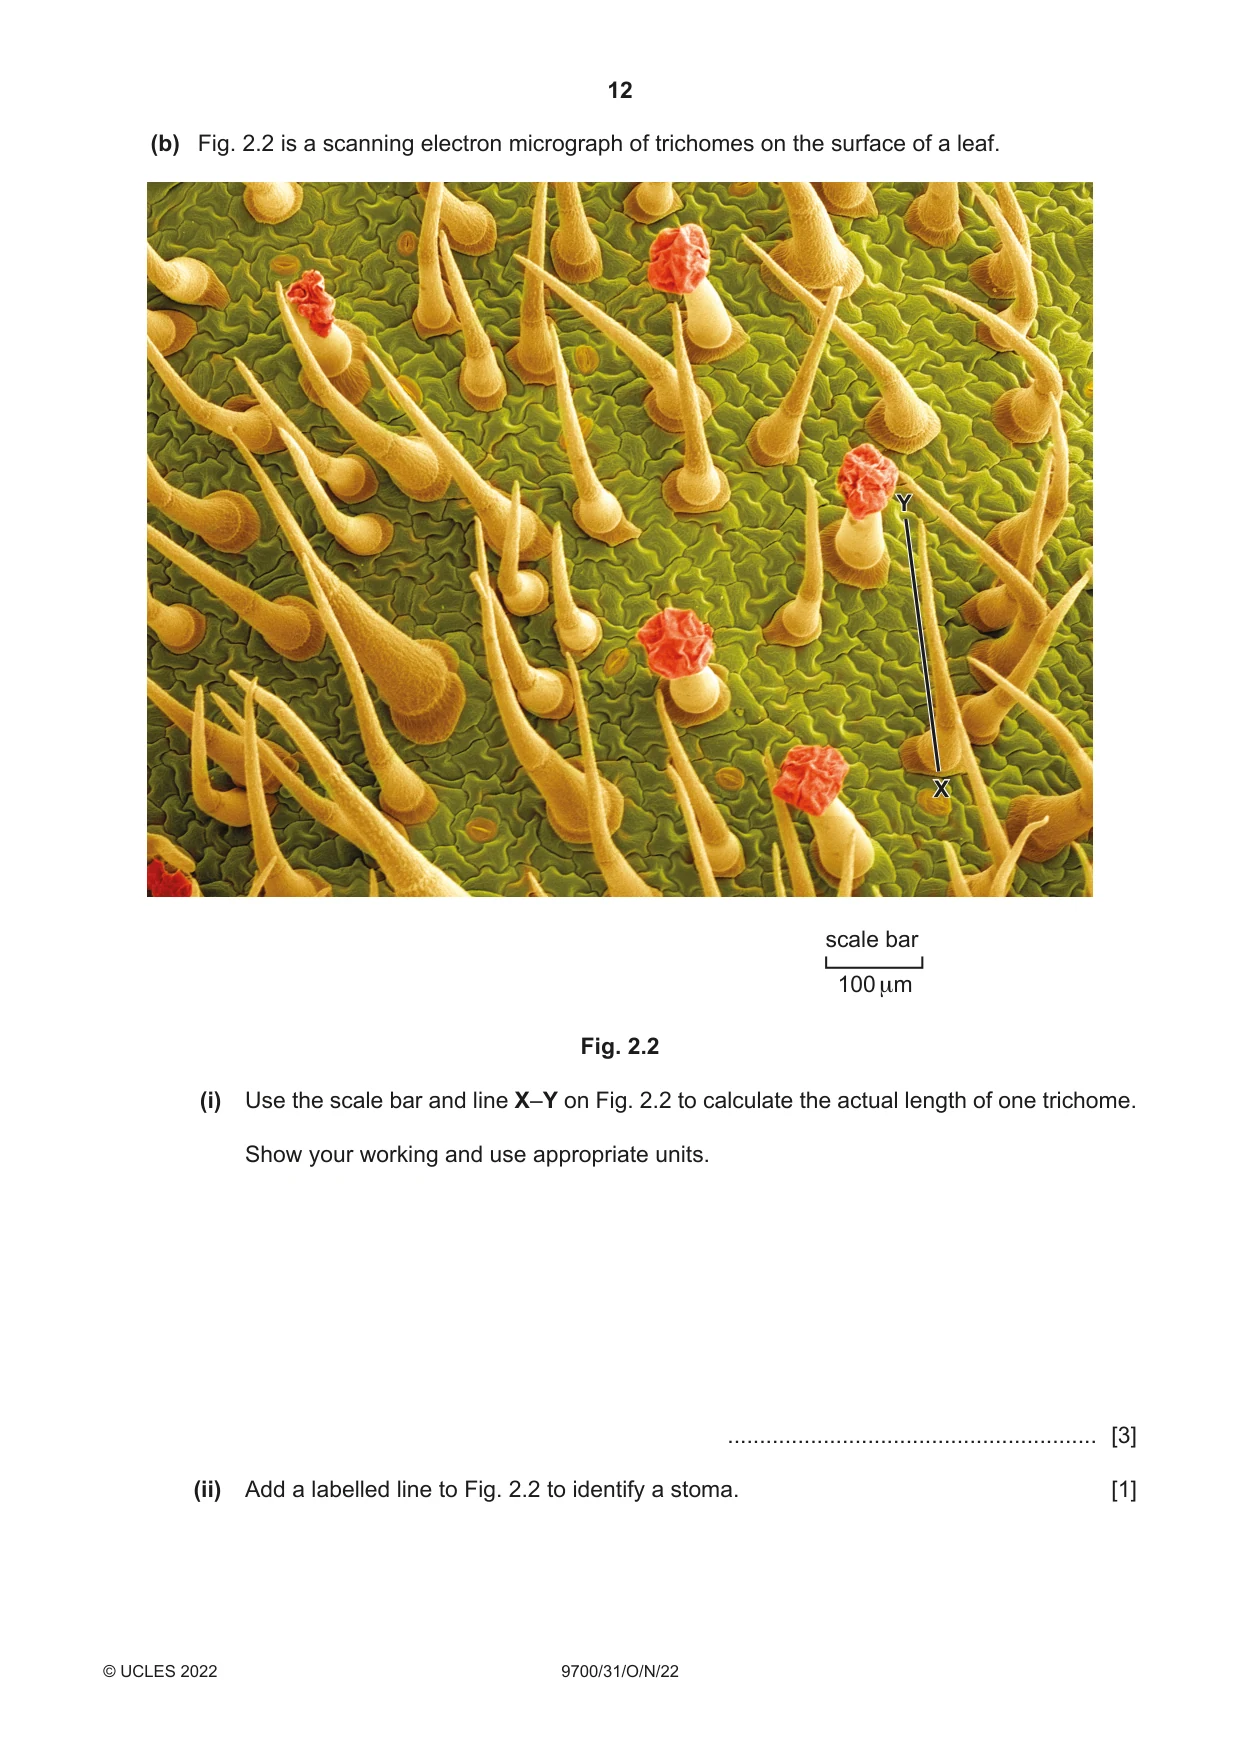
2 J1 is a slide of a stained transverse section through a plant stem. (a) (i) Draw a large plan diagram of the region of the stem on J1 indicated by the shaded region in Fig. 2.1. Use a sharp pencil. Use one ruled label line and label to identify the epidermis. draw this region Fig. 2.1 [5] (ii) Observe the xylem vessel elements of the section on J1. Select four adjacent xylem vessel elements. Each xylem vessel element must touch at least one other xylem vessel element. • Make a large drawing of these four xylem vessel elements. • Use one ruled label line and label to identify the cell wall of one xylem vessel element. [5] (b) Fig. 2.2 is a scanning electron micrograph of trichomes on the surface of a leaf. Y X scale bar 100 μm Fig. 2.2 (i) Use the scale bar and line X–Y on Fig. 2.2 to calculate the actual length of one trichome. Show your working and use appropriate units. .......................................................... [3] (ii) Add a labelled line to Fig. 2.2 to identify a stoma. [1]
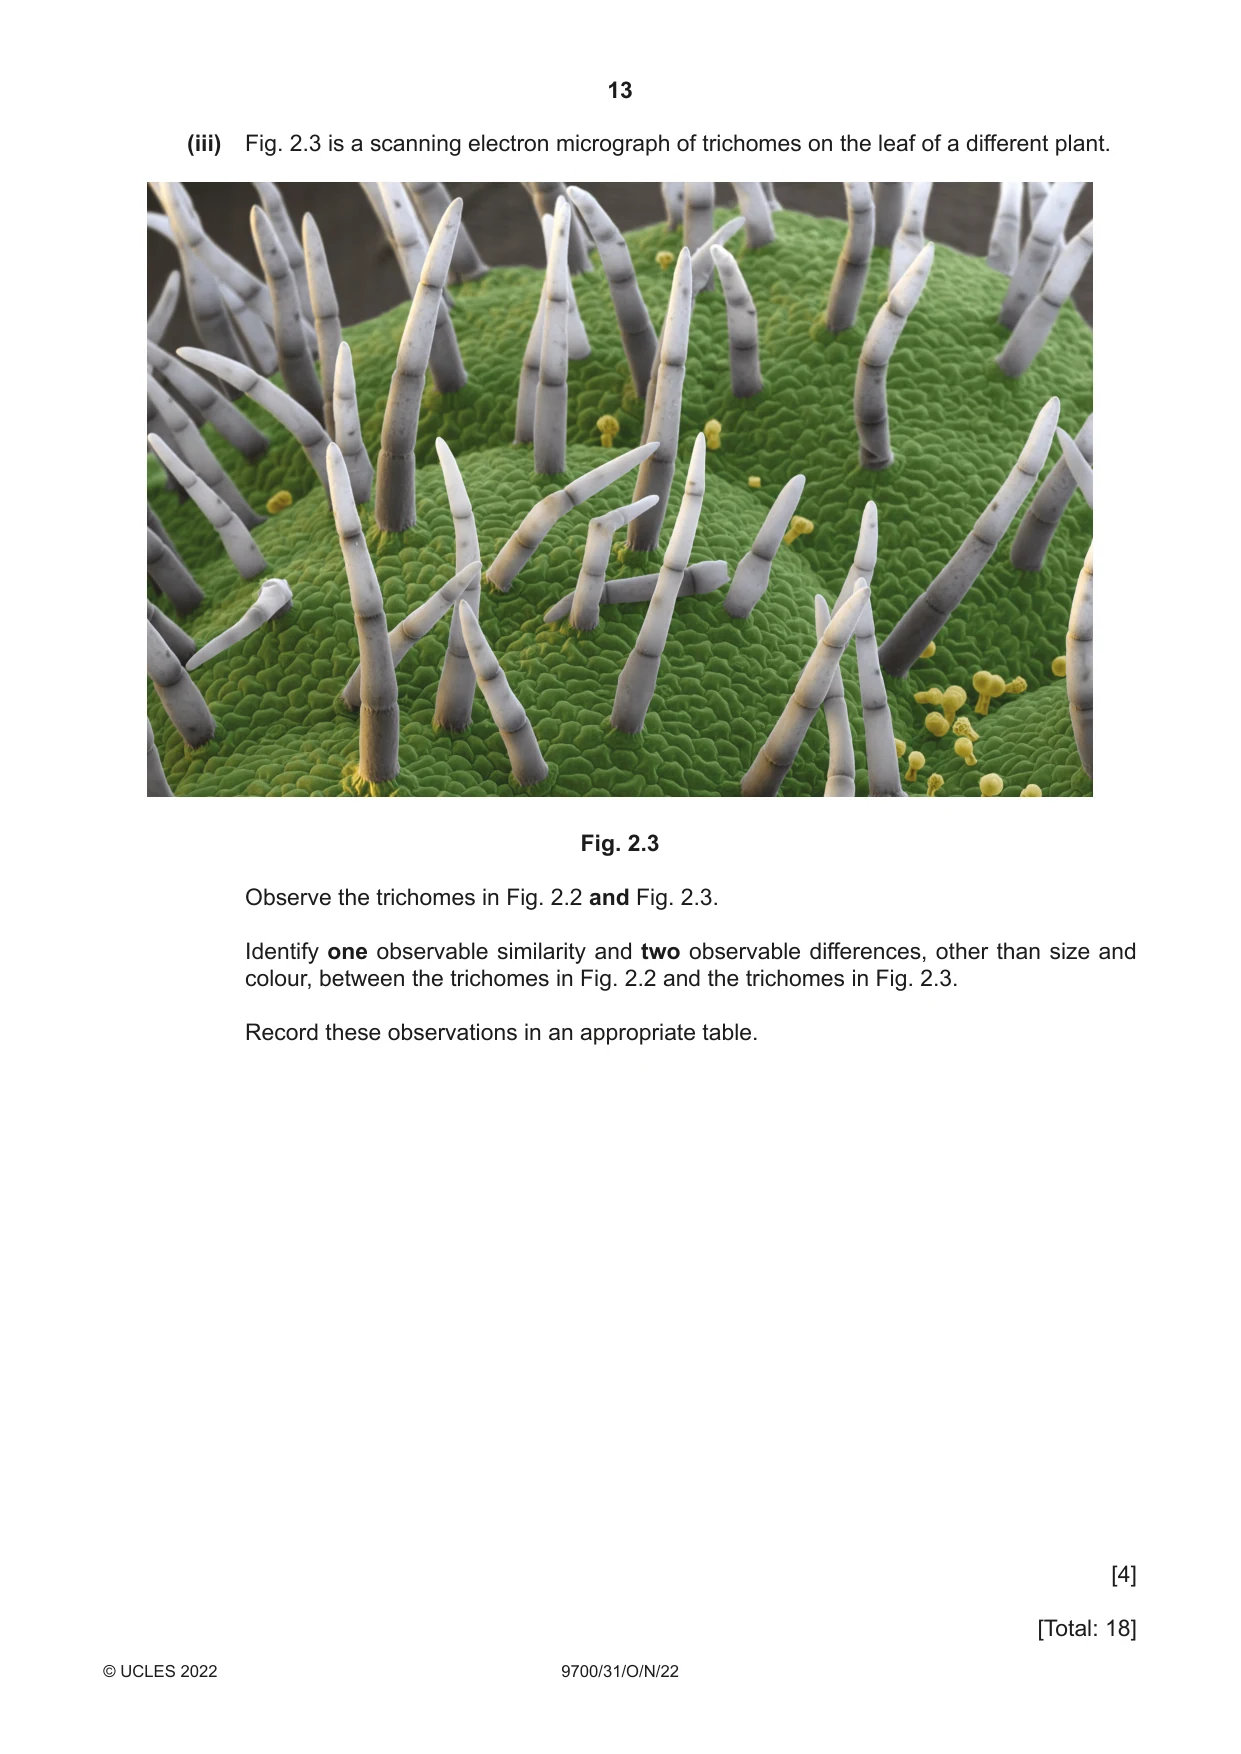
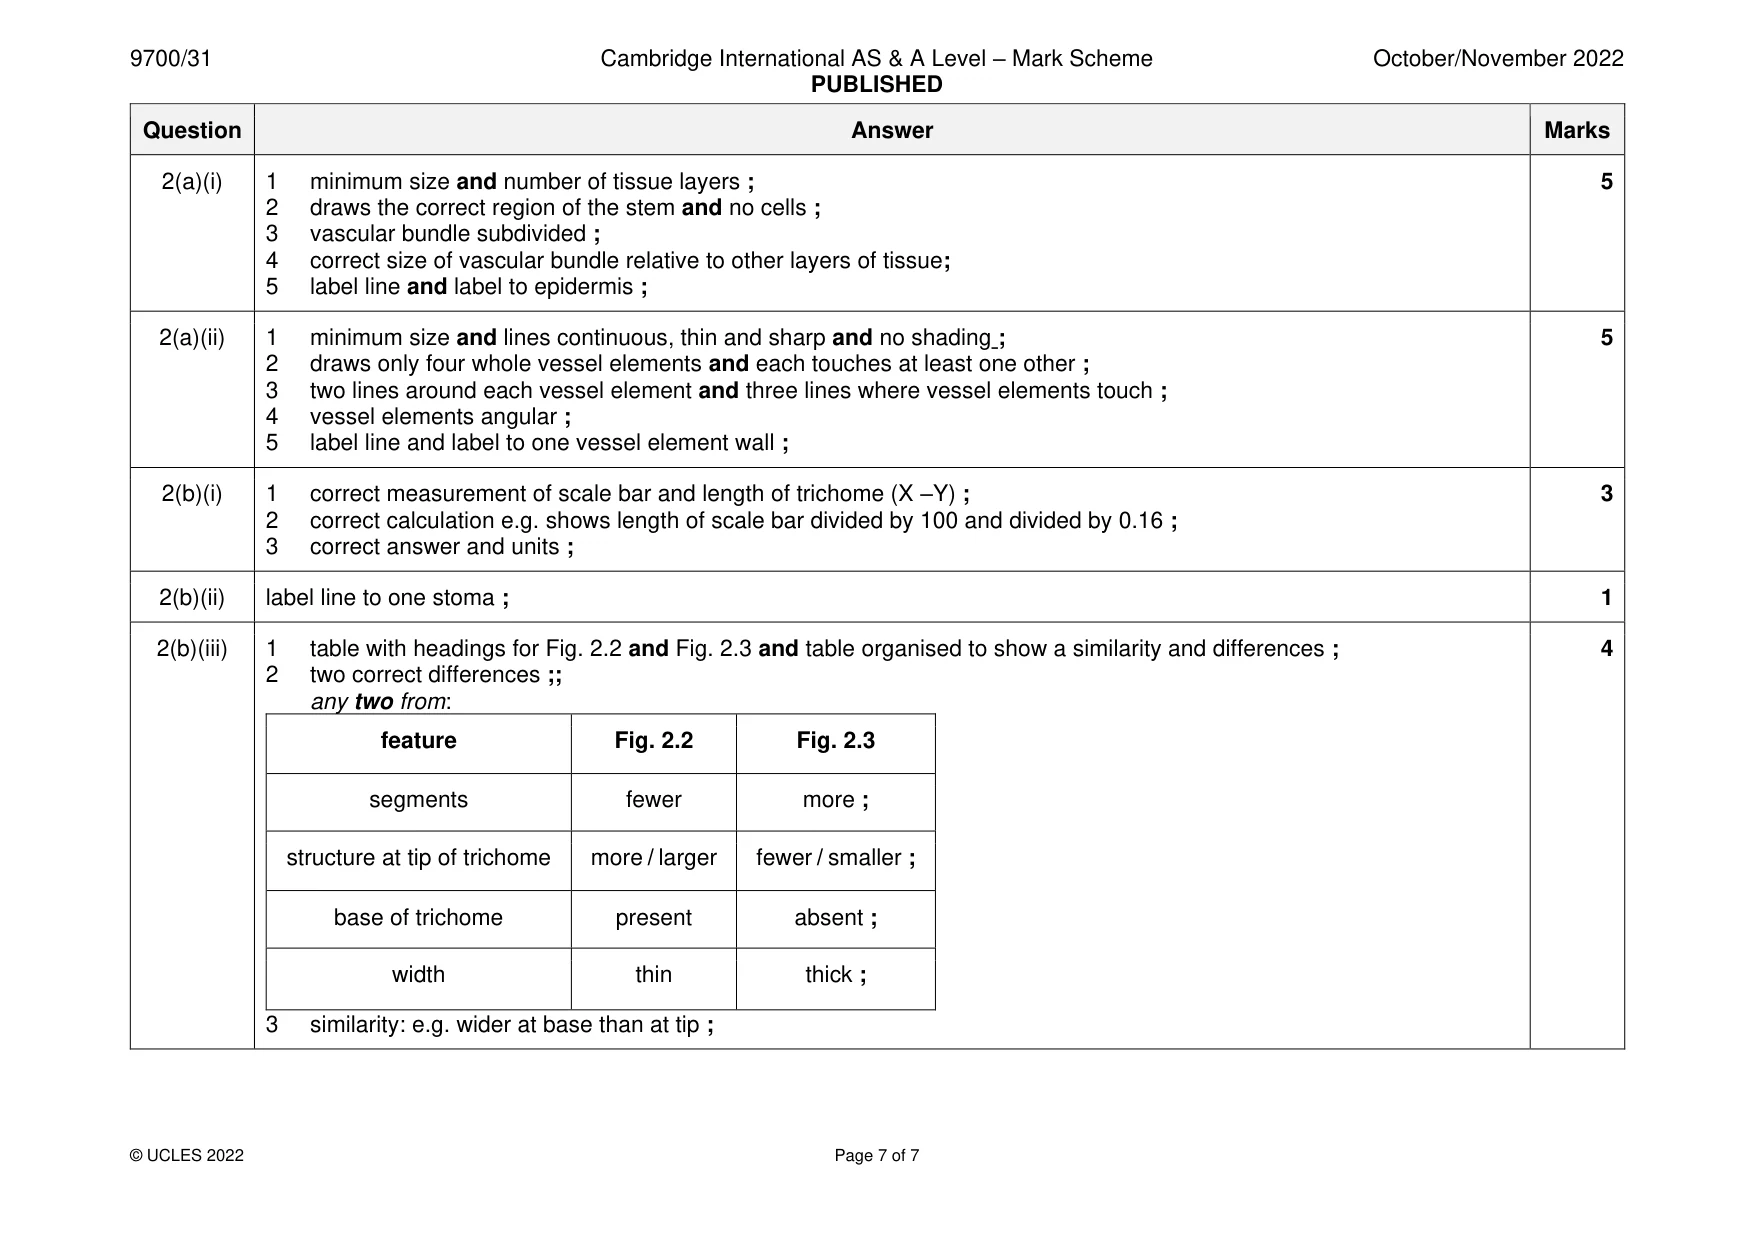
Mark scheme: 2(a)(i) 1 minimum size and number of tissue layers ; 5 2 draws the correct region of the stem and no cells ; 3 vascular bundle subdivided ; 4 correct size of vascular bundle relative to other layers of tissue; 5 label line and label to epidermis ; 2(a)(ii) 1 minimum size and lines continuous, thin and sharp and no shading ; 5 2 draws only four whole vessel elements and each touches at least one other ; 3 two lines around each vessel element and three lines where vessel elements touch ; 4 vessel elements angular ; 5 label line and label to one vessel element wall ; 2(b)(i) 1 correct measurement of scale bar and length of trichome (X –Y) ; 3 2 correct calculation e.g. shows length of scale bar divided by 100 and divided by 0.16 ; 3 correct answer and units ; 2(b)(ii) label line to one stoma ; 1 2(b)(iii) 1 table with headings for Fig. 2.2 and Fig. 2.3 and table organised to show a similarity and differences ; 4 2 two correct differences ;; any two from: feature Fig. 2.2 Fig. 2.3 segments fewer more ; structure at tip of trichome more / larger fewer / smaller ; base of trichome present absent ; width thin thick ; 3 similarity: e.g. wider at base than at tip ;
What was in this paper
The subtopics covered by these 2 questions, and how many questions each got. Open one in a new tab to see every Cambridge question on it.
What you needed in this session
Cambridge’s own grade thresholds for 2022 Oct/Nov, Paper 3 · Variant 1. A higher threshold means an easier paper — the bar moves with how the cohort did.