Cambridge A Level Accounting 9706 — 2009 Oct/Nov Paper 4 · Variant 2
9706/42/O/N/09 · 120 marks · ≈135 min
The question paper and its mark scheme, free to read here and free to download. This is Cambridge’s own paper, exactly as it was sat.
Question paper8 pages
Mark scheme5 pages
Answers below. Sit the paper first if you are practising.
Paper as text
Question paper, page 1
This document consists of 8 printed pages. IB09 11_9706_42/4RP © UCLES 2009 [Turn over *5079331081* UNIVERSITY OF CAMBRIDGE INTERNATIONAL EXAMINATIONS General Certificate of Education Advanced Subsidiary Level and Advanced Level ACCOUNTING 9706/42 Paper 4 Problem Solving (Supplementary Topics) October/November 2009 2 hours Additional Materials: Answer Booklet/Paper READ THESE INSTRUCTIONS FIRST If you have been given an Answer Booklet, follow the instructions on the front cover of the Booklet. Write your Centre number, candidate number and name on all the work you hand in. Write in dark blue or black pen. You may use a soft pencil for any diagrams, graphs or rough working. Do not use staples, paper clips, highlighters, glue or correction fluid. Answer all questions. All accounting statements are to be presented in good style. Workings should be shown. You may use a calculator. At the end of the examination, fasten all your work securely together. The number of marks is given in brackets [ ] at the end of each question or part question.
Question paper, page 2
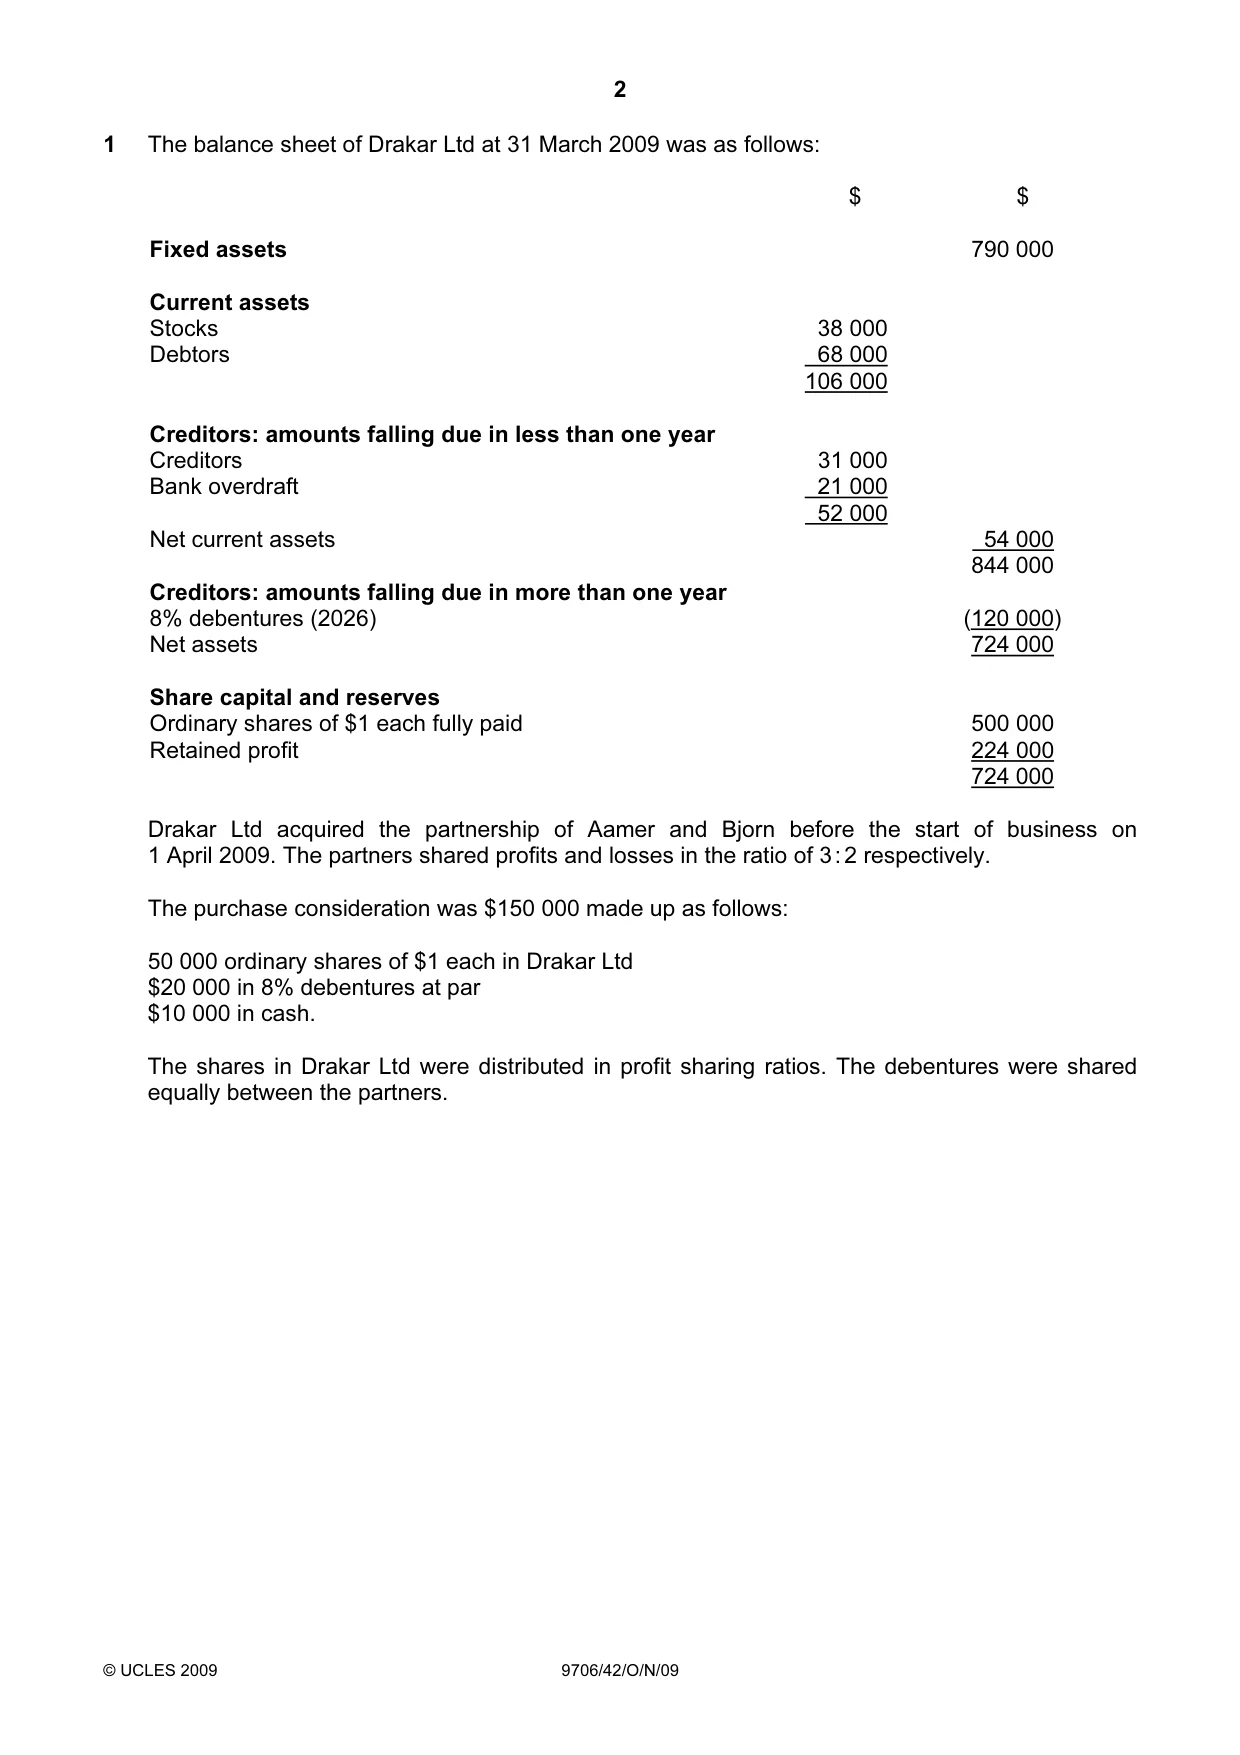
2 © UCLES 2009 9706/42/O/N/09 1 The balance sheet of Drakar Ltd at 31 March 2009 was as follows: $ $ Fixed assets 790 000 Current assets Stocks 38 000 Debtors 68 000 106 000 Creditors: amounts falling due in less than one year Creditors 31 000 Bank overdraft 21 000 52 000 Net current assets 54 000 844 000 Creditors: amounts falling due in more than one year 8% debentures (2026) (120 000) Net assets 724 000 Share capital and reserves Ordinary shares of $1 each fully paid 500 000 Retained profit 224 000 724 000 Drakar Ltd acquired the partnership of Aamer and Bjorn before the start of business on 1 April 2009. The partners shared profits and losses in the ratio of 3 : 2 respectively. The purchase consideration was $150 000 made up as follows: 50 000 ordinary shares of $1 each in Drakar Ltd $20 000 in 8% debentures at par $10 000 in cash. The shares in Drakar Ltd were distributed in profit sharing ratios. The debentures were shared equally between the partners.
Question paper, page 3
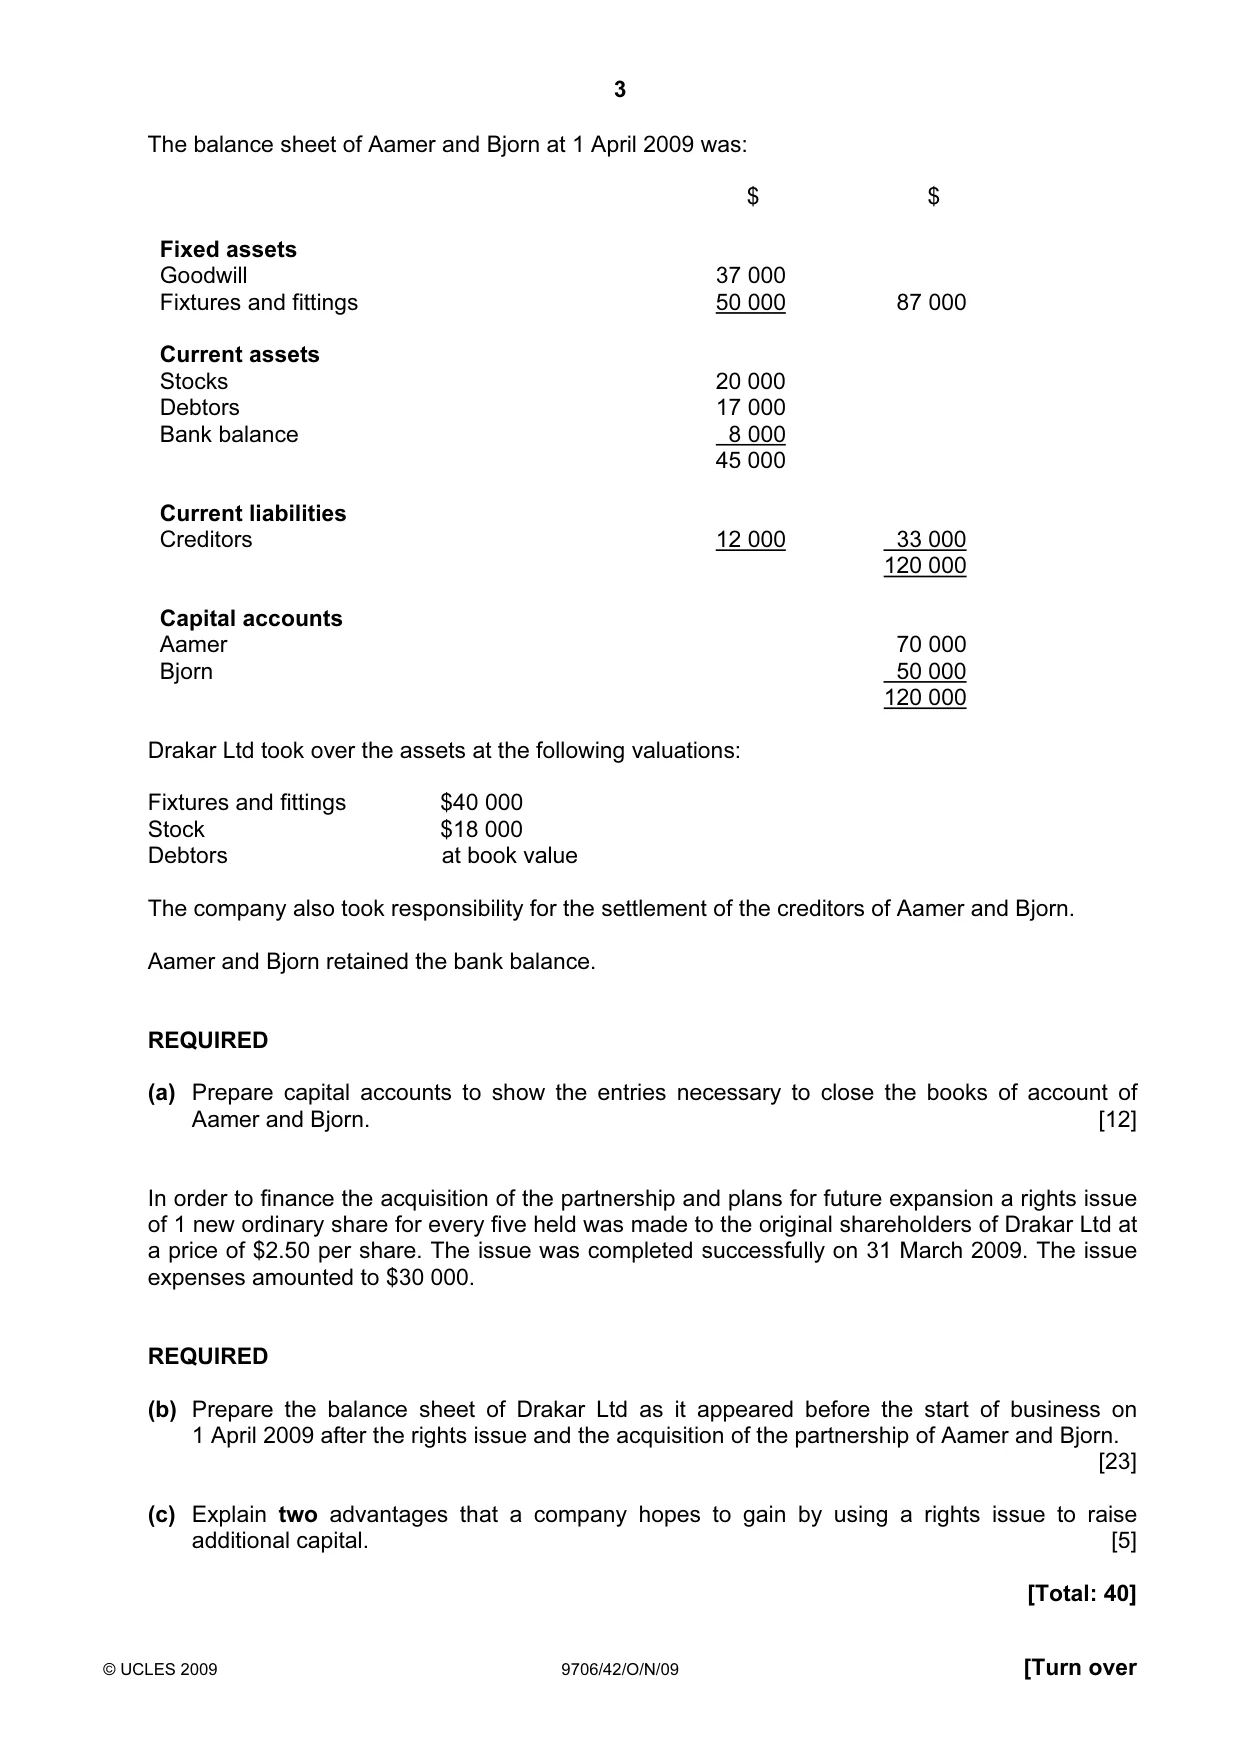
3 © UCLES 2009 9706/42/O/N/09 [Turn over The balance sheet of Aamer and Bjorn at 1 April 2009 was: $ $ Fixed assets Goodwill 37 000 Fixtures and fittings 50 000 87 000 Current assets Stocks 20 000 Debtors 17 000 Bank balance 8 000 45 000 Current liabilities Creditors 12 000 33 000 120 000 Capital accounts Aamer 70 000 Bjorn 50 000 120 000 Drakar Ltd took over the assets at the following valuations: Fixtures and fittings $40 000 Stock $18 000 Debtors at book value The company also took responsibility for the settlement of the creditors of Aamer and Bjorn. Aamer and Bjorn retained the bank balance. REQUIRED (a) Prepare capital accounts to show the entries necessary to close the books of account of Aamer and Bjorn. [12] In order to finance the acquisition of the partnership and plans for future expansion a rights issue of 1 new ordinary share for every five held was made to the original shareholders of Drakar Ltd at a price of $2.50 per share. The issue was completed successfully on 31 March 2009. The issue expenses amounted to $30 000. REQUIRED (b) Prepare the balance sheet of Drakar Ltd as it appeared before the start of business on 1 April 2009 after the rights issue and the acquisition of the partnership of Aamer and Bjorn. [23] (c) Explain two advantages that a company hopes to gain by using a rights issue to raise additional capital. [5] [Total: 40]
Question paper, page 4
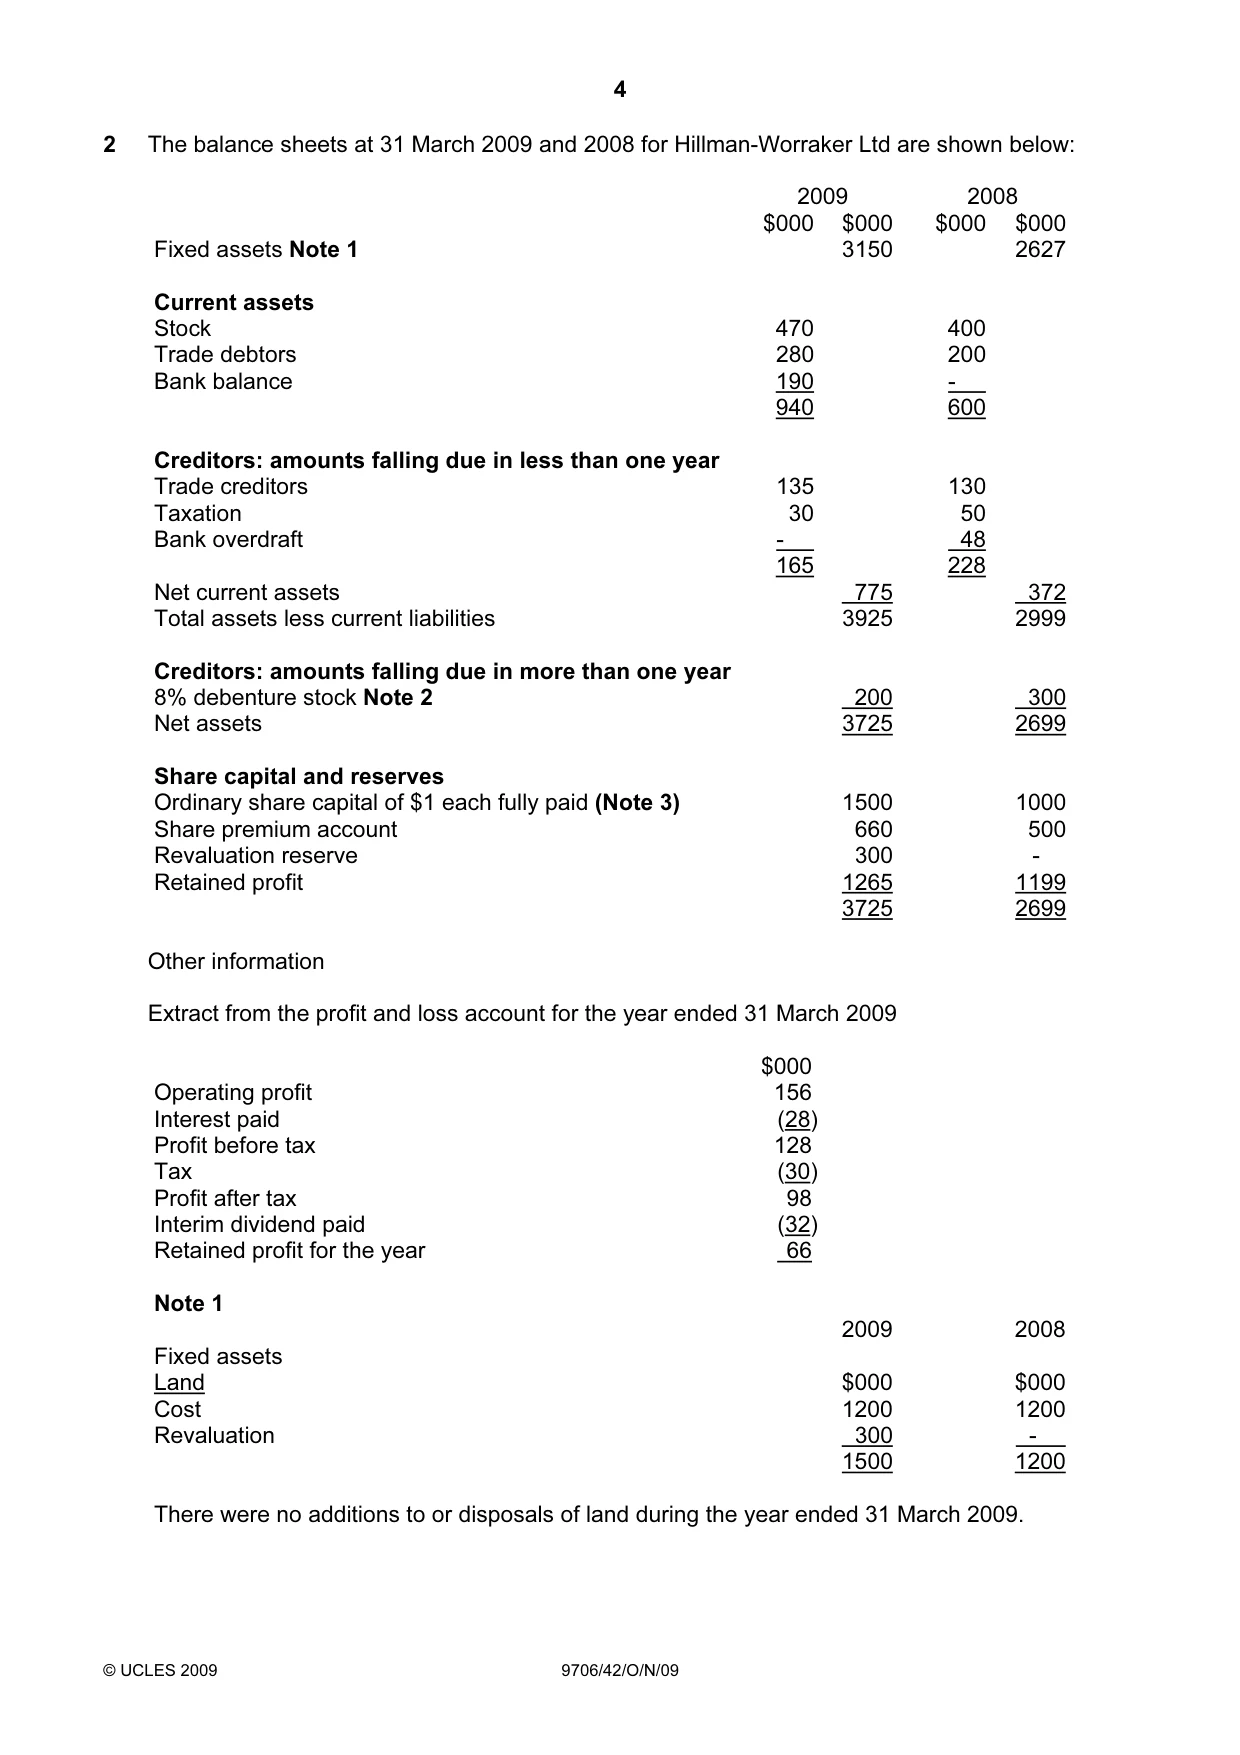
4 © UCLES 2009 9706/42/O/N/09 2 The balance sheets at 31 March 2009 and 2008 for Hillman-Worraker Ltd are shown below: 2009 2008 $000 $000 $000 $000 Fixed assets Note 1 3150 2627 Current assets Stock 470 400 Trade debtors 280 200 Bank balance 190 - 940 600 Creditors: amounts falling due in less than one year Trade creditors 135 130 Taxation 30 50 Bank overdraft - 48 165 228 Net current assets 775 372 Total assets less current liabilities 3925 2999 Creditors: amounts falling due in more than one year 8% debenture stock Note 2 200 300 Net assets 3725 2699 Share capital and reserves Ordinary share capital of $1 each fully paid (Note 3) 1500 1000 Share premium account 660 500 Revaluation reserve 300 - Retained profit 1265 1199 3725 2699 Other information Extract from the profit and loss account for the year ended 31 March 2009 $000 Operating profit 156 Interest paid (28) Profit before tax 128 Tax (30) Profit after tax 98 Interim dividend paid (32) Retained profit for the year 66 Note 1 2009 2008 Fixed assets Land $000 $000 Cost 1200 1200 Revaluation 300 - 1500 1200 There were no additions to or disposals of land during the year ended 31 March 2009.
Question paper, page 5
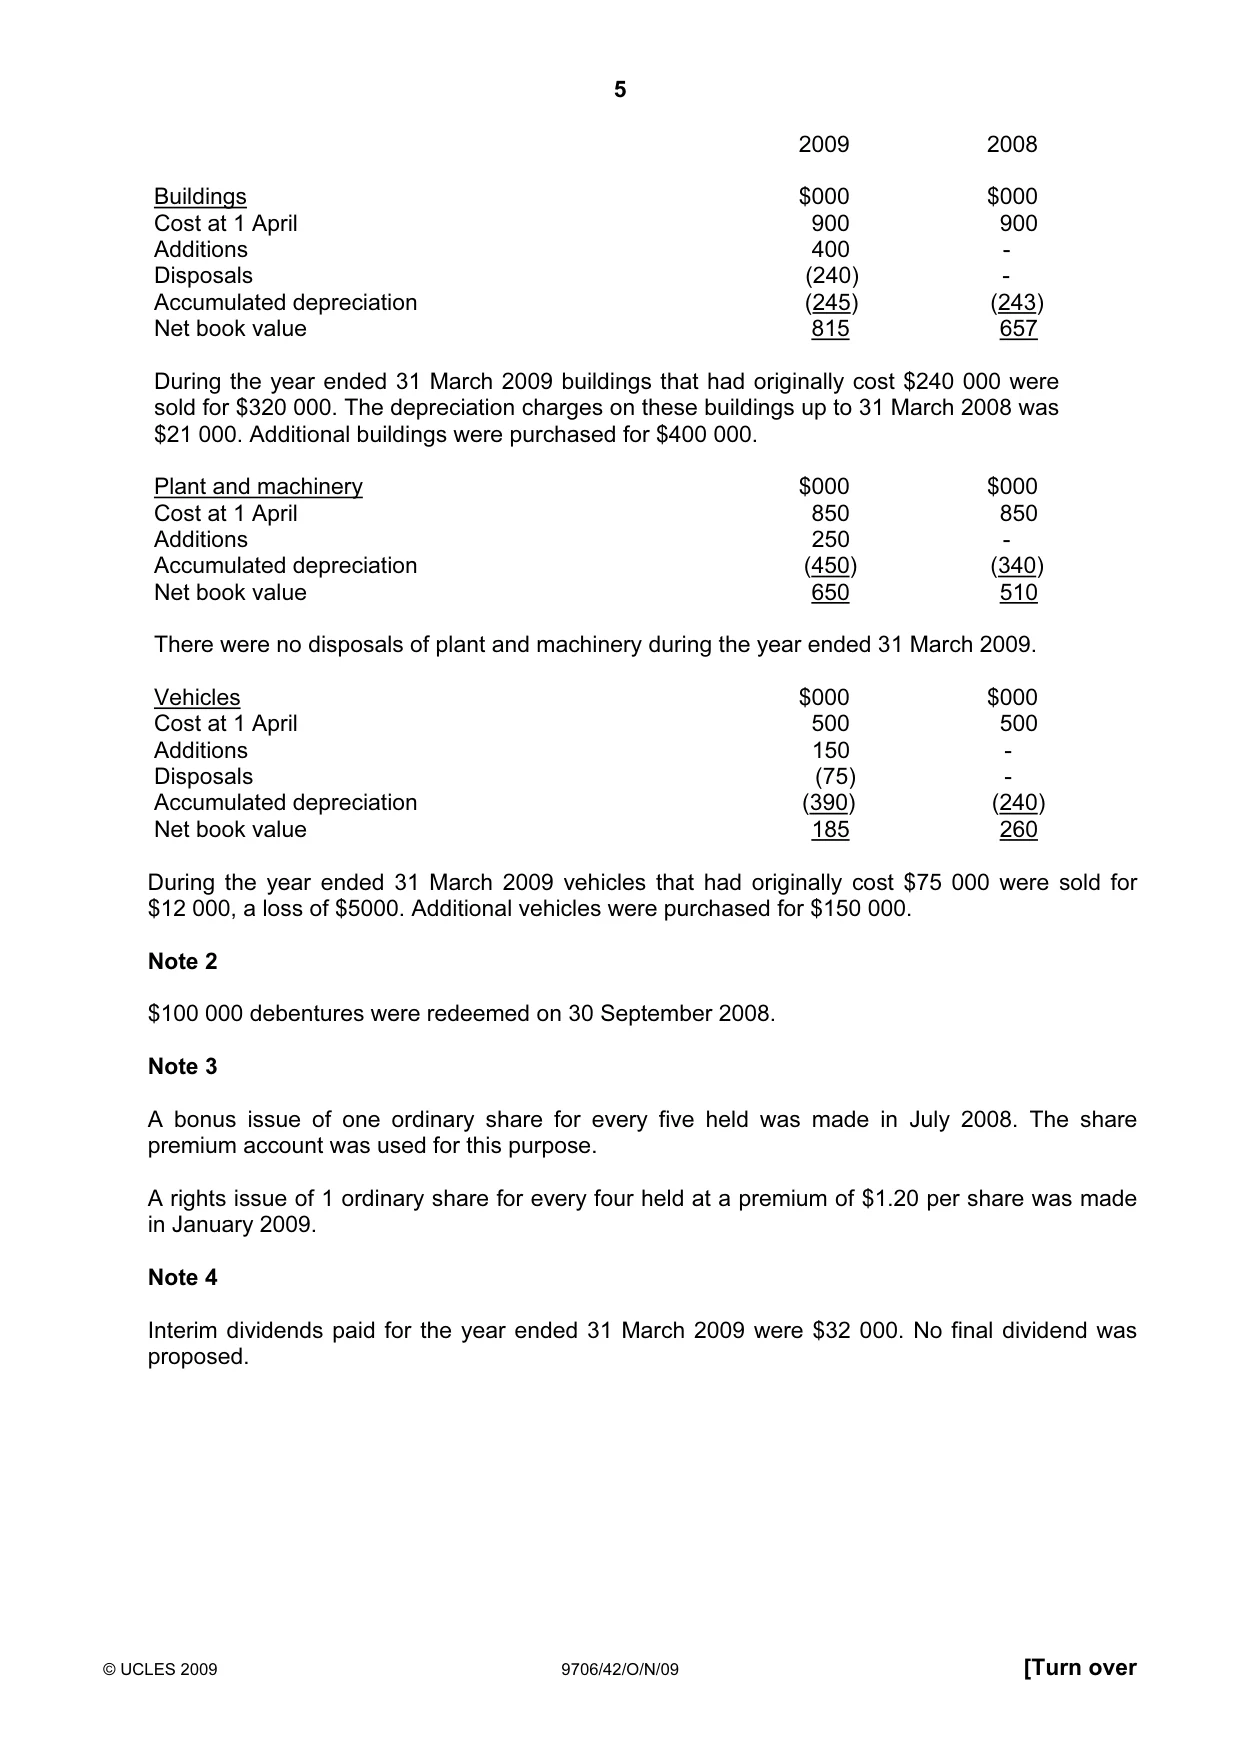
5 © UCLES 2009 9706/42/O/N/09 [Turn over 2009 2008 Buildings $000 $000 Cost at 1 April 900 900 Additions 400 - Disposals (240) - Accumulated depreciation (245) (243) Net book value 815 657 During the year ended 31 March 2009 buildings that had originally cost $240 000 were sold for $320 000. The depreciation charges on these buildings up to 31 March 2008 was $21 000. Additional buildings were purchased for $400 000. Plant and machinery $000 $000 Cost at 1 April 850 850 Additions 250 - Accumulated depreciation (450) (340) Net book value 650 510 There were no disposals of plant and machinery during the year ended 31 March 2009. Vehicles $000 $000 Cost at 1 April 500 500 Additions 150 - Disposals (75) - Accumulated depreciation (390) (240) Net book value 185 260 During the year ended 31 March 2009 vehicles that had originally cost $75 000 were sold for $12 000, a loss of $5000. Additional vehicles were purchased for $150 000. Note 2 $100 000 debentures were redeemed on 30 September 2008. Note 3 A bonus issue of one ordinary share for every five held was made in July 2008. The share premium account was used for this purpose. A rights issue of 1 ordinary share for every four held at a premium of $1.20 per share was made in January 2009. Note 4 Interim dividends paid for the year ended 31 March 2009 were $32 000. No final dividend was proposed.
Question paper, page 6
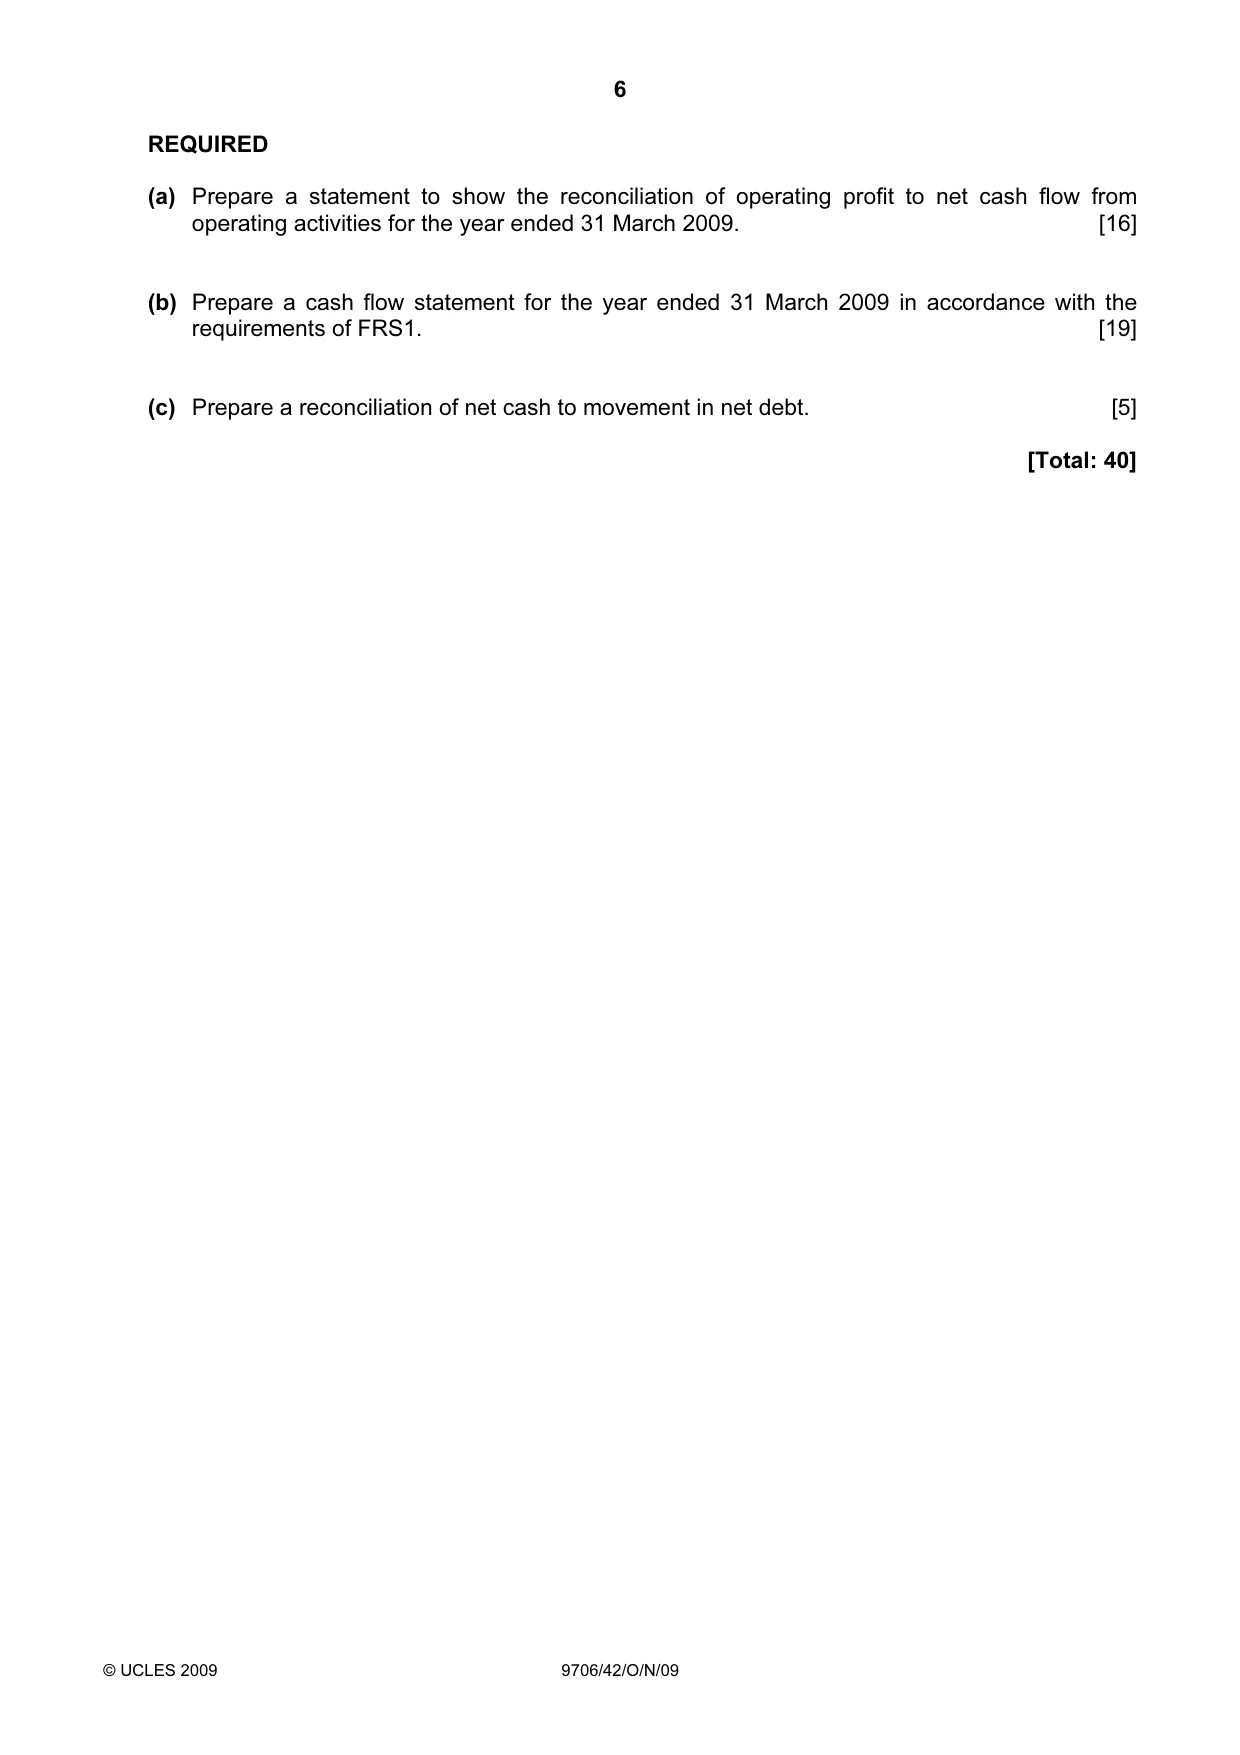
6 © UCLES 2009 9706/42/O/N/09 REQUIRED (a) Prepare a statement to show the reconciliation of operating profit to net cash flow from operating activities for the year ended 31 March 2009. [16] (b) Prepare a cash flow statement for the year ended 31 March 2009 in accordance with the requirements of FRS1. [19] (c) Prepare a reconciliation of net cash to movement in net debt. [5] [Total: 40]
Question paper, page 7
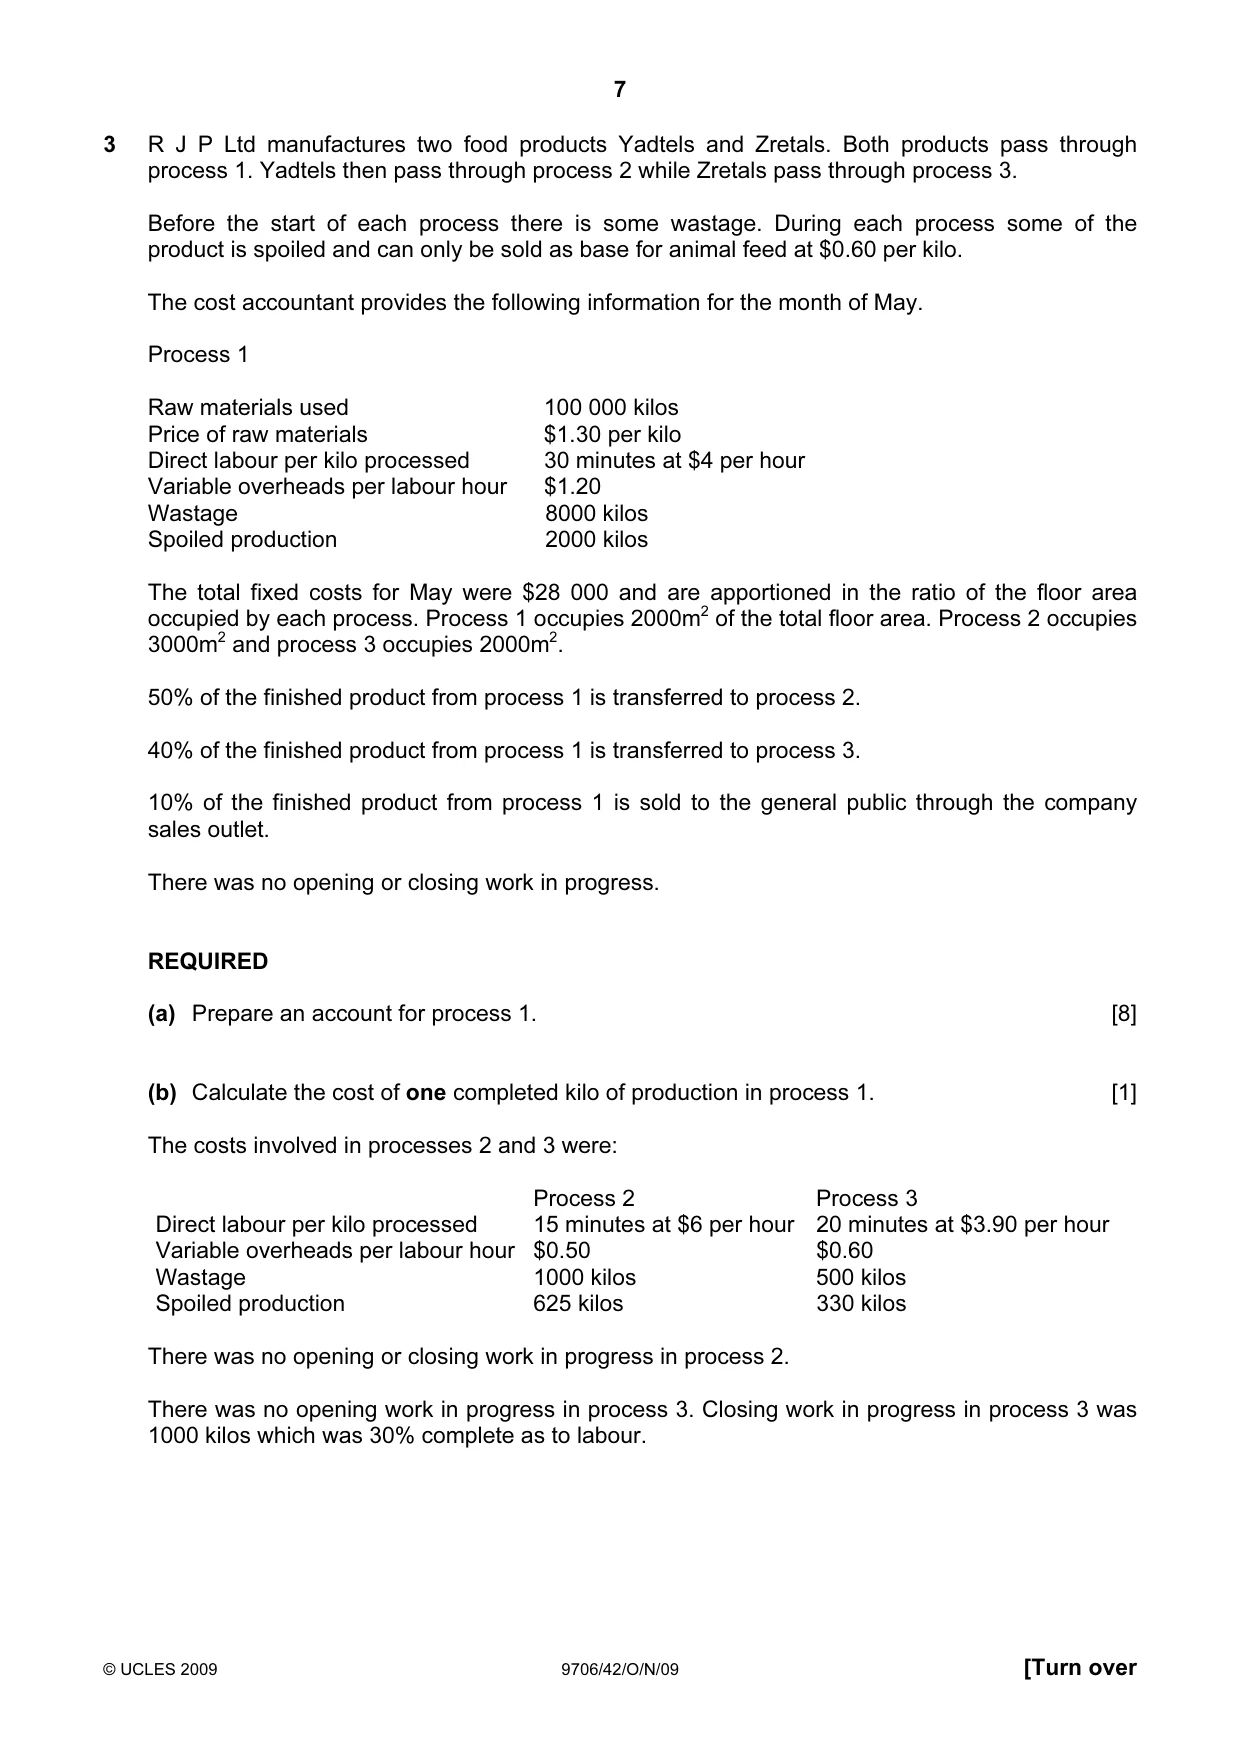
7 © UCLES 2009 9706/42/O/N/09 [Turn over 3 R J P Ltd manufactures two food products Yadtels and Zretals. Both products pass through process 1. Yadtels then pass through process 2 while Zretals pass through process 3. Before the start of each process there is some wastage. During each process some of the product is spoiled and can only be sold as base for animal feed at $0.60 per kilo. The cost accountant provides the following information for the month of May. Process 1 Raw materials used 100 000 kilos Price of raw materials $1.30 per kilo Direct labour per kilo processed 30 minutes at $4 per hour Variable overheads per labour hour $1.20 Wastage 8000 kilos Spoiled production 2000 kilos The total fixed costs for May were $28 000 and are apportioned in the ratio of the floor area occupied by each process. Process 1 occupies 2000m2 of the total floor area. Process 2 occupies 3000m2 and process 3 occupies 2000m2. 50% of the finished product from process 1 is transferred to process 2. 40% of the finished product from process 1 is transferred to process 3. 10% of the finished product from process 1 is sold to the general public through the company sales outlet. There was no opening or closing work in progress. REQUIRED (a) Prepare an account for process 1. [8] (b) Calculate the cost of one completed kilo of production in process 1. [1] The costs involved in processes 2 and 3 were: Process 2 Process 3 Direct labour per kilo processed 15 minutes at $6 per hour 20 minutes at $3.90 per hour Variable overheads per labour hour $0.50 $0.60 Wastage 1000 kilos 500 kilos Spoiled production 625 kilos 330 kilos There was no opening or closing work in progress in process 2. There was no opening work in progress in process 3. Closing work in progress in process 3 was 1000 kilos which was 30% complete as to labour.
Question paper, page 8
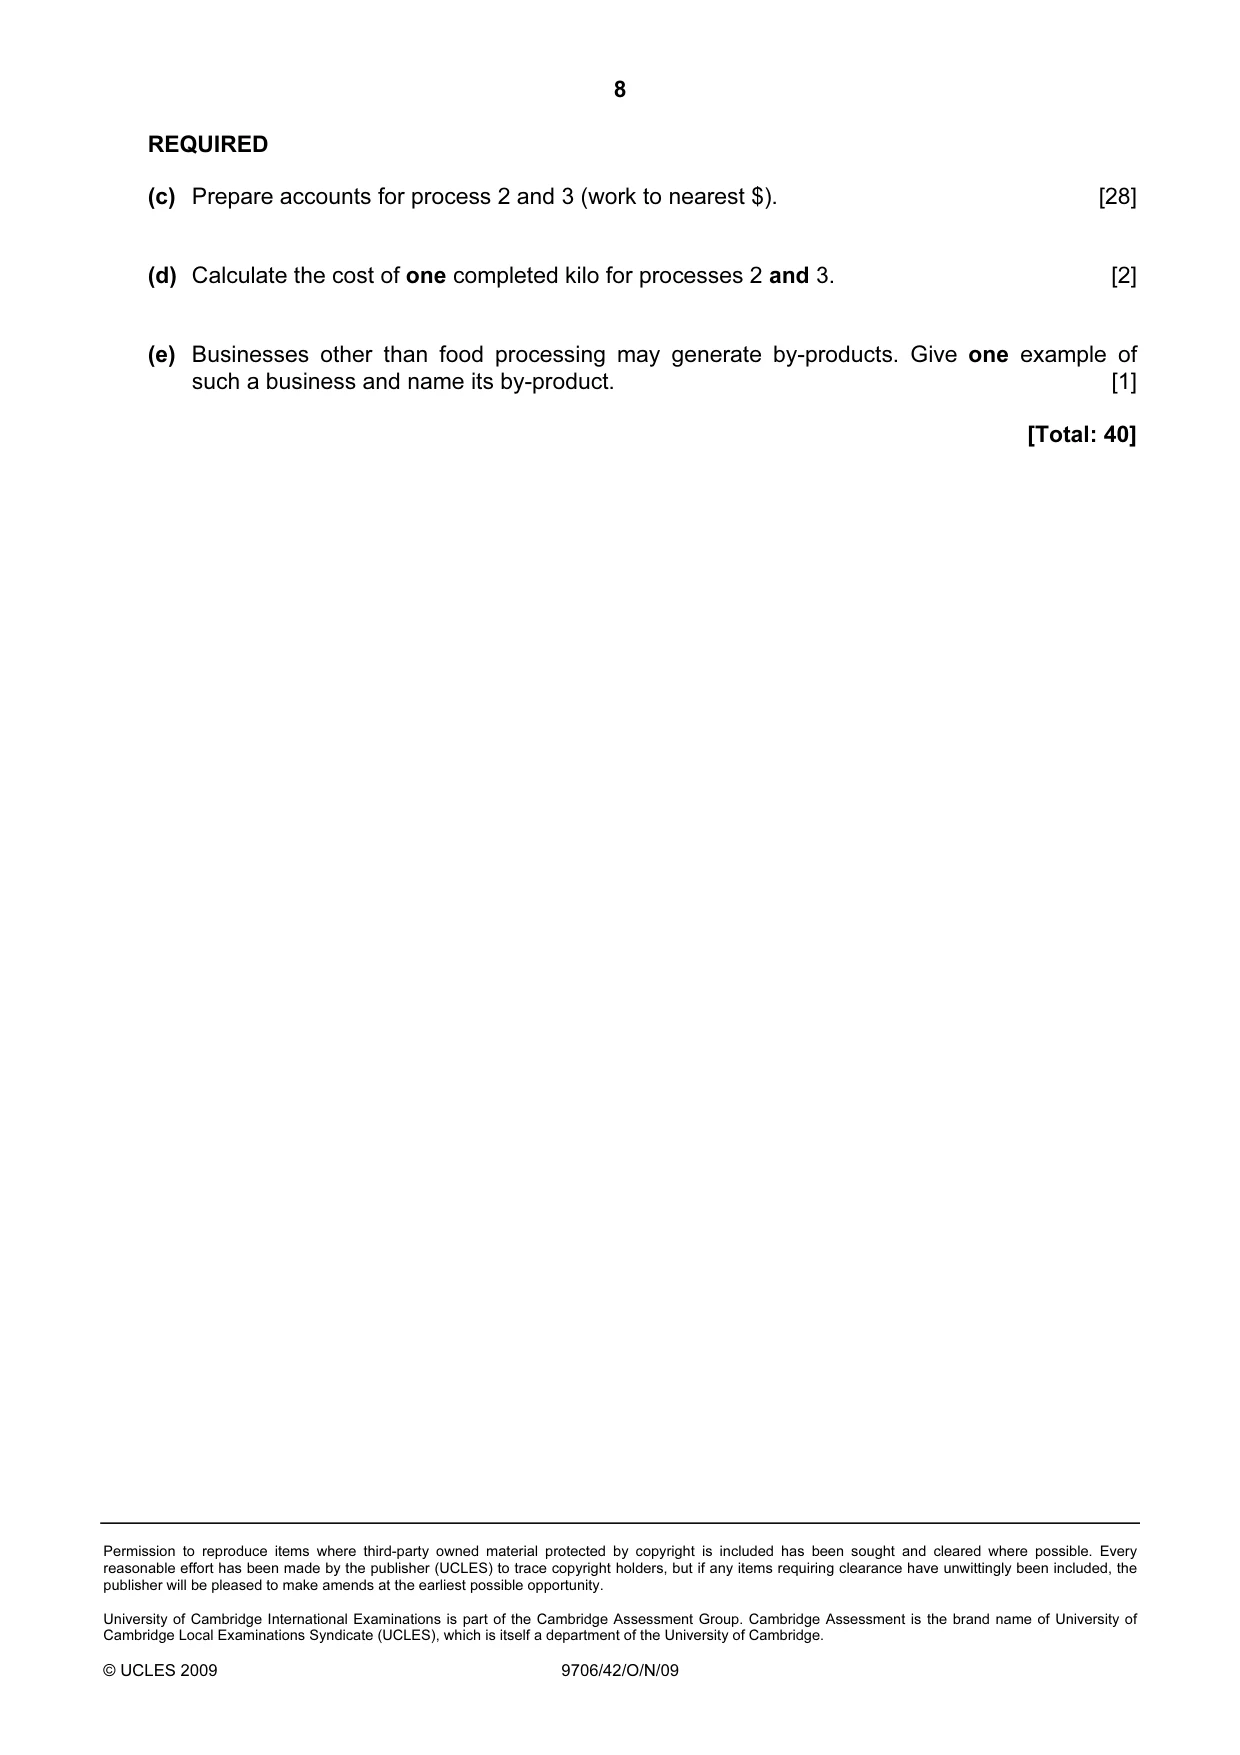
8 Permission to reproduce items where third-party owned material protected by copyright is included has been sought and cleared where possible. Every reasonable effort has been made by the publisher (UCLES) to trace copyright holders, but if any items requiring clearance have unwittingly been included, the publisher will be pleased to make amends at the earliest possible opportunity. University of Cambridge International Examinations is part of the Cambridge Assessment Group. Cambridge Assessment is the brand name of University of Cambridge Local Examinations Syndicate (UCLES), which is itself a department of the University of Cambridge. © UCLES 2009 9706/42/O/N/09 REQUIRED (c) Prepare accounts for process 2 and 3 (work to nearest $). [28] (d) Calculate the cost of one completed kilo for processes 2 and 3. [2] (e) Businesses other than food processing may generate by-products. Give one example of such a business and name its by-product. [1] [Total: 40]
Mark scheme, page 1
UNIVERSITY OF CAMBRIDGE INTERNATIONAL EXAMINATIONS GCE Advanced Subsidiary Level and GCE Advanced Level MARK SCHEME for the October/November 2009 question paper for the guidance of teachers 9706 ACCOUNTING 9706/42 Paper 42 (Problem Solving – Supplement), maximum raw mark 120 This mark scheme is published as an aid to teachers and candidates, to indicate the requirements of the examination. It shows the basis on which Examiners were instructed to award marks. It does not indicate the details of the discussions that took place at an Examiners’ meeting before marking began, which would have considered the acceptability of alternative answers. Mark schemes must be read in conjunction with the question papers and the report on the examination. • CIE will not enter into discussions or correspondence in connection with these mark schemes. CIE is publishing the mark schemes for the October/November 2009 question papers for most IGCSE, GCE Advanced Level and Advanced Subsidiary Level syllabuses and some Ordinary Level syllabuses.
Mark scheme, page 2
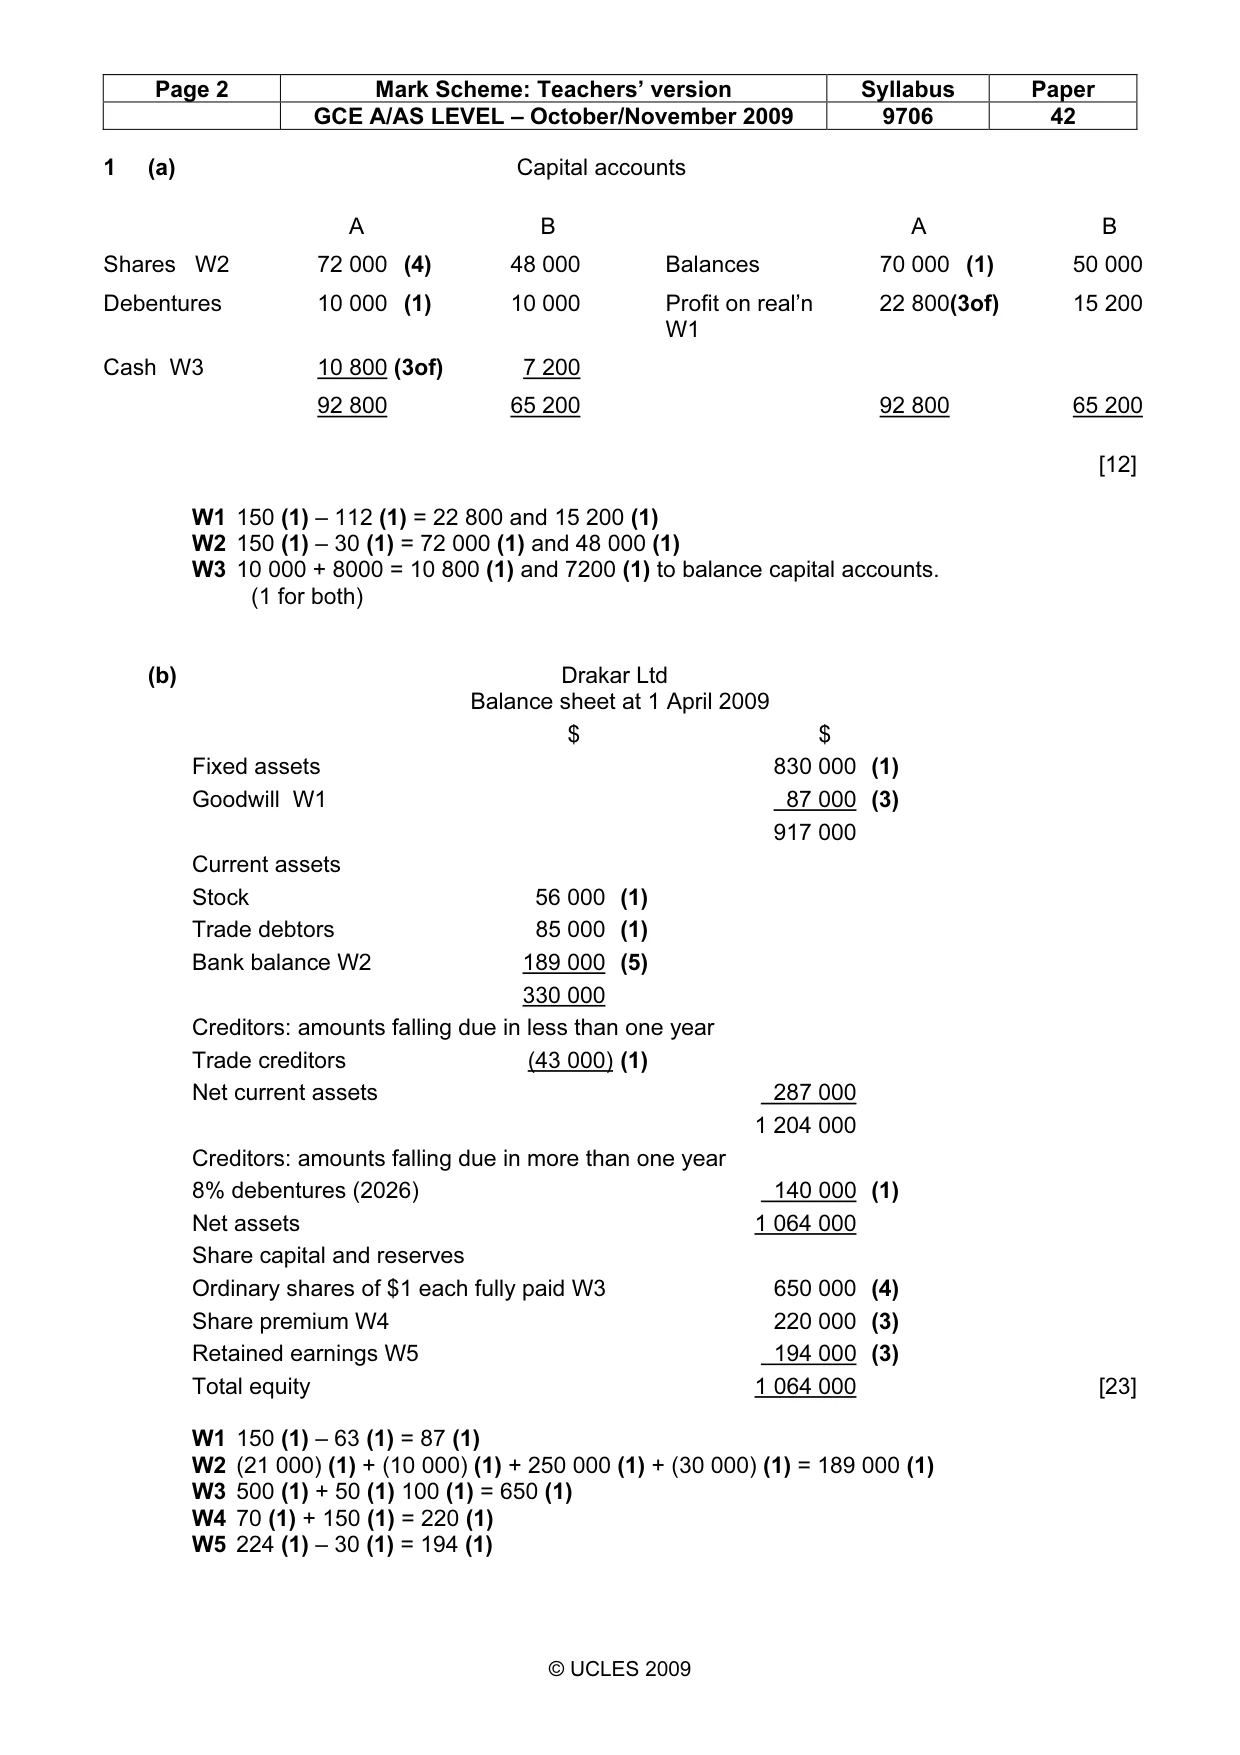
Page 2 Mark Scheme: Teachers’ version Syllabus Paper GCE A/AS LEVEL – October/November 2009 9706 42 © UCLES 2009 1 (a) Capital accounts A B A B Shares W2 72 000 (4) 48 000 Balances 70 000 (1) 50 000 Debentures 10 000 (1) 10 000 Profit on real’n W1 22 800(3of) 15 200 Cash W3 10 800 (3of) 7 200 92 800 65 200 92 800 65 200 [12] W1 150 (1) – 112 (1) = 22 800 and 15 200 (1) W2 150 (1) – 30 (1) = 72 000 (1) and 48 000 (1) W3 10 000 + 8000 = 10 800 (1) and 7200 (1) to balance capital accounts. (1 for both) (b) Drakar Ltd Balance sheet at 1 April 2009 $ $ Fixed assets 830 000 (1) Goodwill W1 87 000 (3) 917 000 Current assets Stock 56 000 (1) Trade debtors 85 000 (1) Bank balance W2 189 000 (5) 330 000 Creditors: amounts falling due in less than one year Trade creditors (43 000) (1) Net current assets 287 000 1 204 000 Creditors: amounts falling due in more than one year 8% debentures (2026) 140 000 (1) Net assets 1 064 000 Share capital and reserves Ordinary shares of $1 each fully paid W3 650 000 (4) Share premium W4 220 000 (3) Retained earnings W5 194 000 (3) Total equity 1 064 000 [23] W1 150 (1) – 63 (1) = 87 (1) W2 (21 000) (1) + (10 000) (1) + 250 000 (1) + (30 000) (1) = 189 000 (1) W3 500 (1) + 50 (1) 100 (1) = 650 (1) W4 70 (1) + 150 (1) = 220 (1) W5 224 (1) – 30 (1) = 194 (1)
Mark scheme, page 3
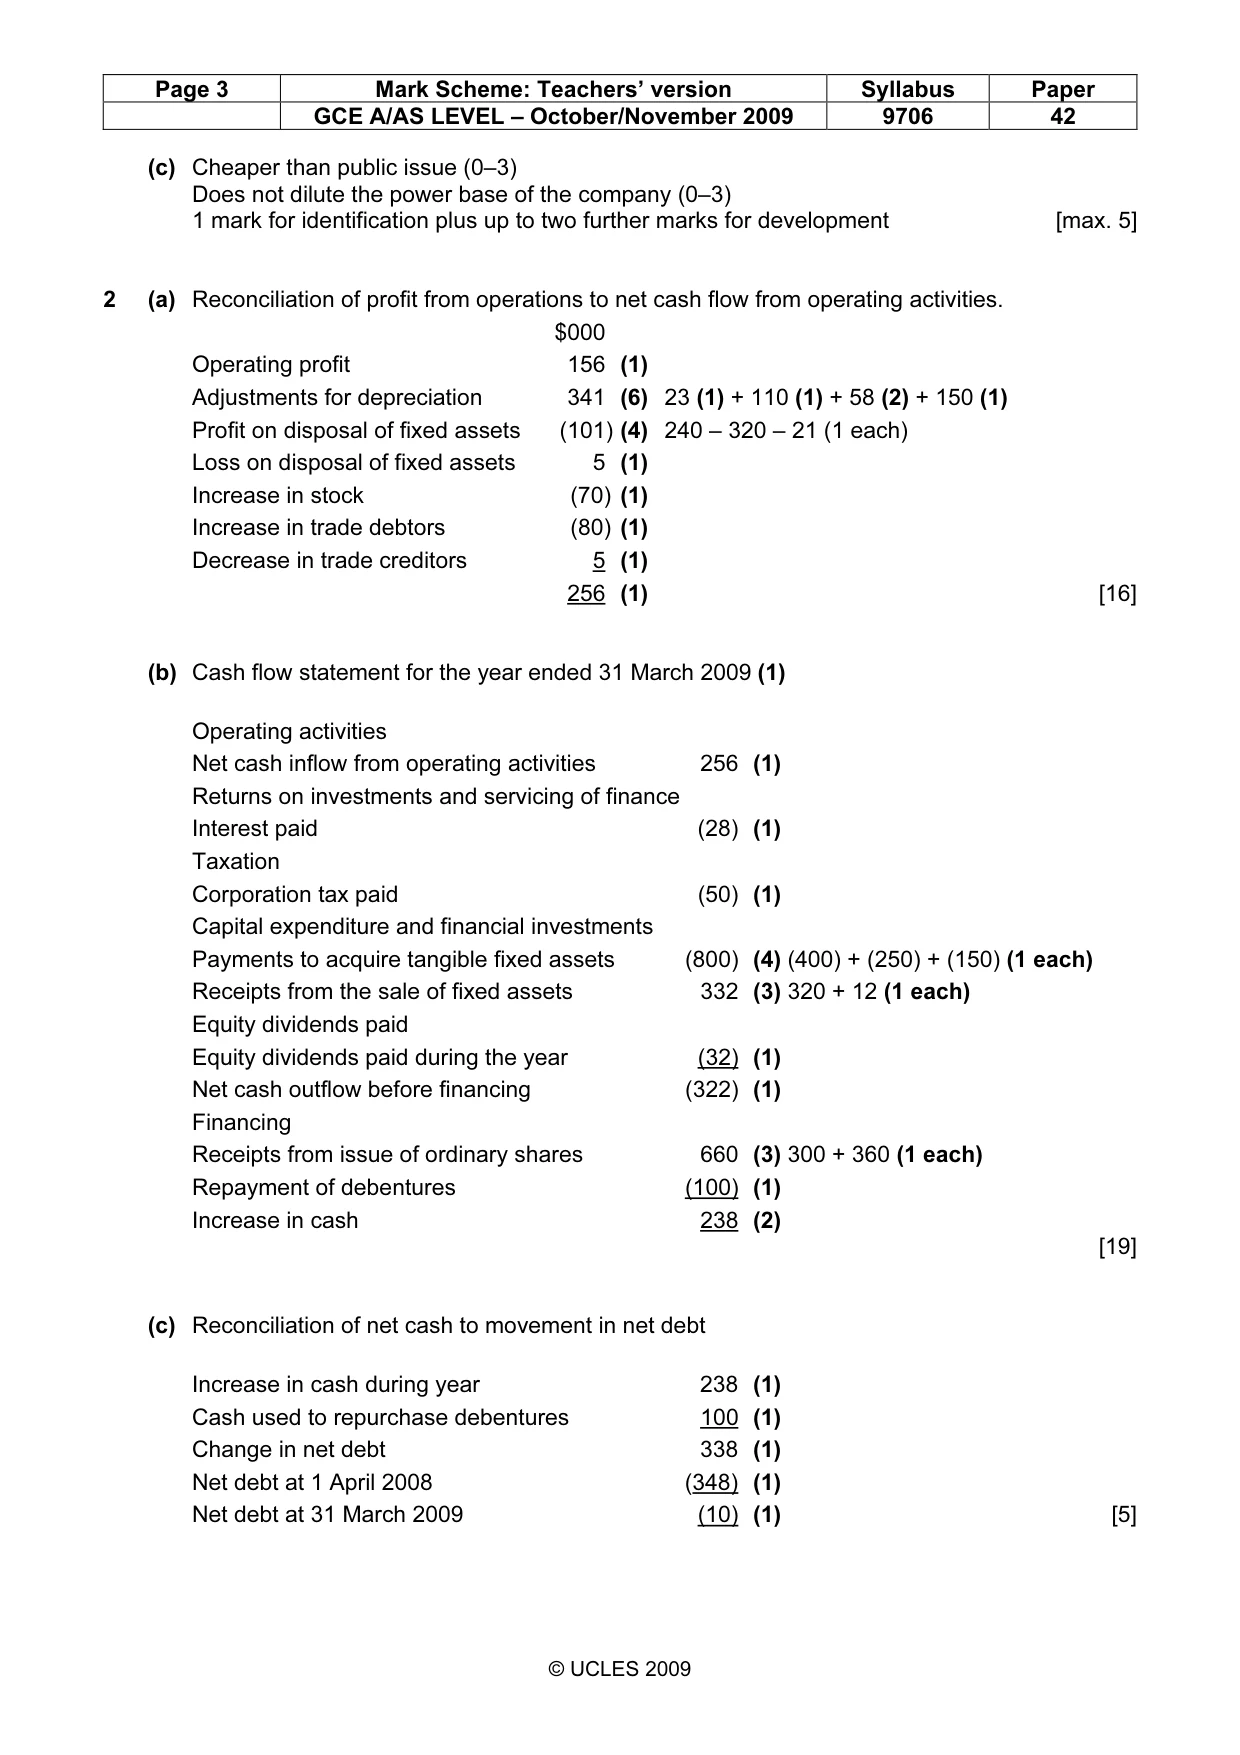
Page 3 Mark Scheme: Teachers’ version Syllabus Paper GCE A/AS LEVEL – October/November 2009 9706 42 © UCLES 2009 (c) Cheaper than public issue (0–3) Does not dilute the power base of the company (0–3) 1 mark for identification plus up to two further marks for development [max. 5] 2 (a) Reconciliation of profit from operations to net cash flow from operating activities. $000 Operating profit 156 (1) Adjustments for depreciation 341 (6) 23 (1) + 110 (1) + 58 (2) + 150 (1) Profit on disposal of fixed assets (101) (4) 240 – 320 – 21 (1 each) Loss on disposal of fixed assets 5 (1) Increase in stock (70) (1) Increase in trade debtors (80) (1) Decrease in trade creditors 5 (1) 256 (1) [16] (b) Cash flow statement for the year ended 31 March 2009 (1) Operating activities Net cash inflow from operating activities 256 (1) Returns on investments and servicing of finance Interest paid (28) (1) Taxation Corporation tax paid (50) (1) Capital expenditure and financial investments Payments to acquire tangible fixed assets (800) (4) (400) + (250) + (150) (1 each) Receipts from the sale of fixed assets 332 (3) 320 + 12 (1 each) Equity dividends paid Equity dividends paid during the year (32) (1) Net cash outflow before financing (322) (1) Financing Receipts from issue of ordinary shares 660 (3) 300 + 360 (1 each) Repayment of debentures (100) (1) Increase in cash 238 (2) [19] (c) Reconciliation of net cash to movement in net debt Increase in cash during year 238 (1) Cash used to repurchase debentures 100 (1) Change in net debt 338 (1) Net debt at 1 April 2008 (348) (1) Net debt at 31 March 2009 (10) (1) [5]
Mark scheme, page 4
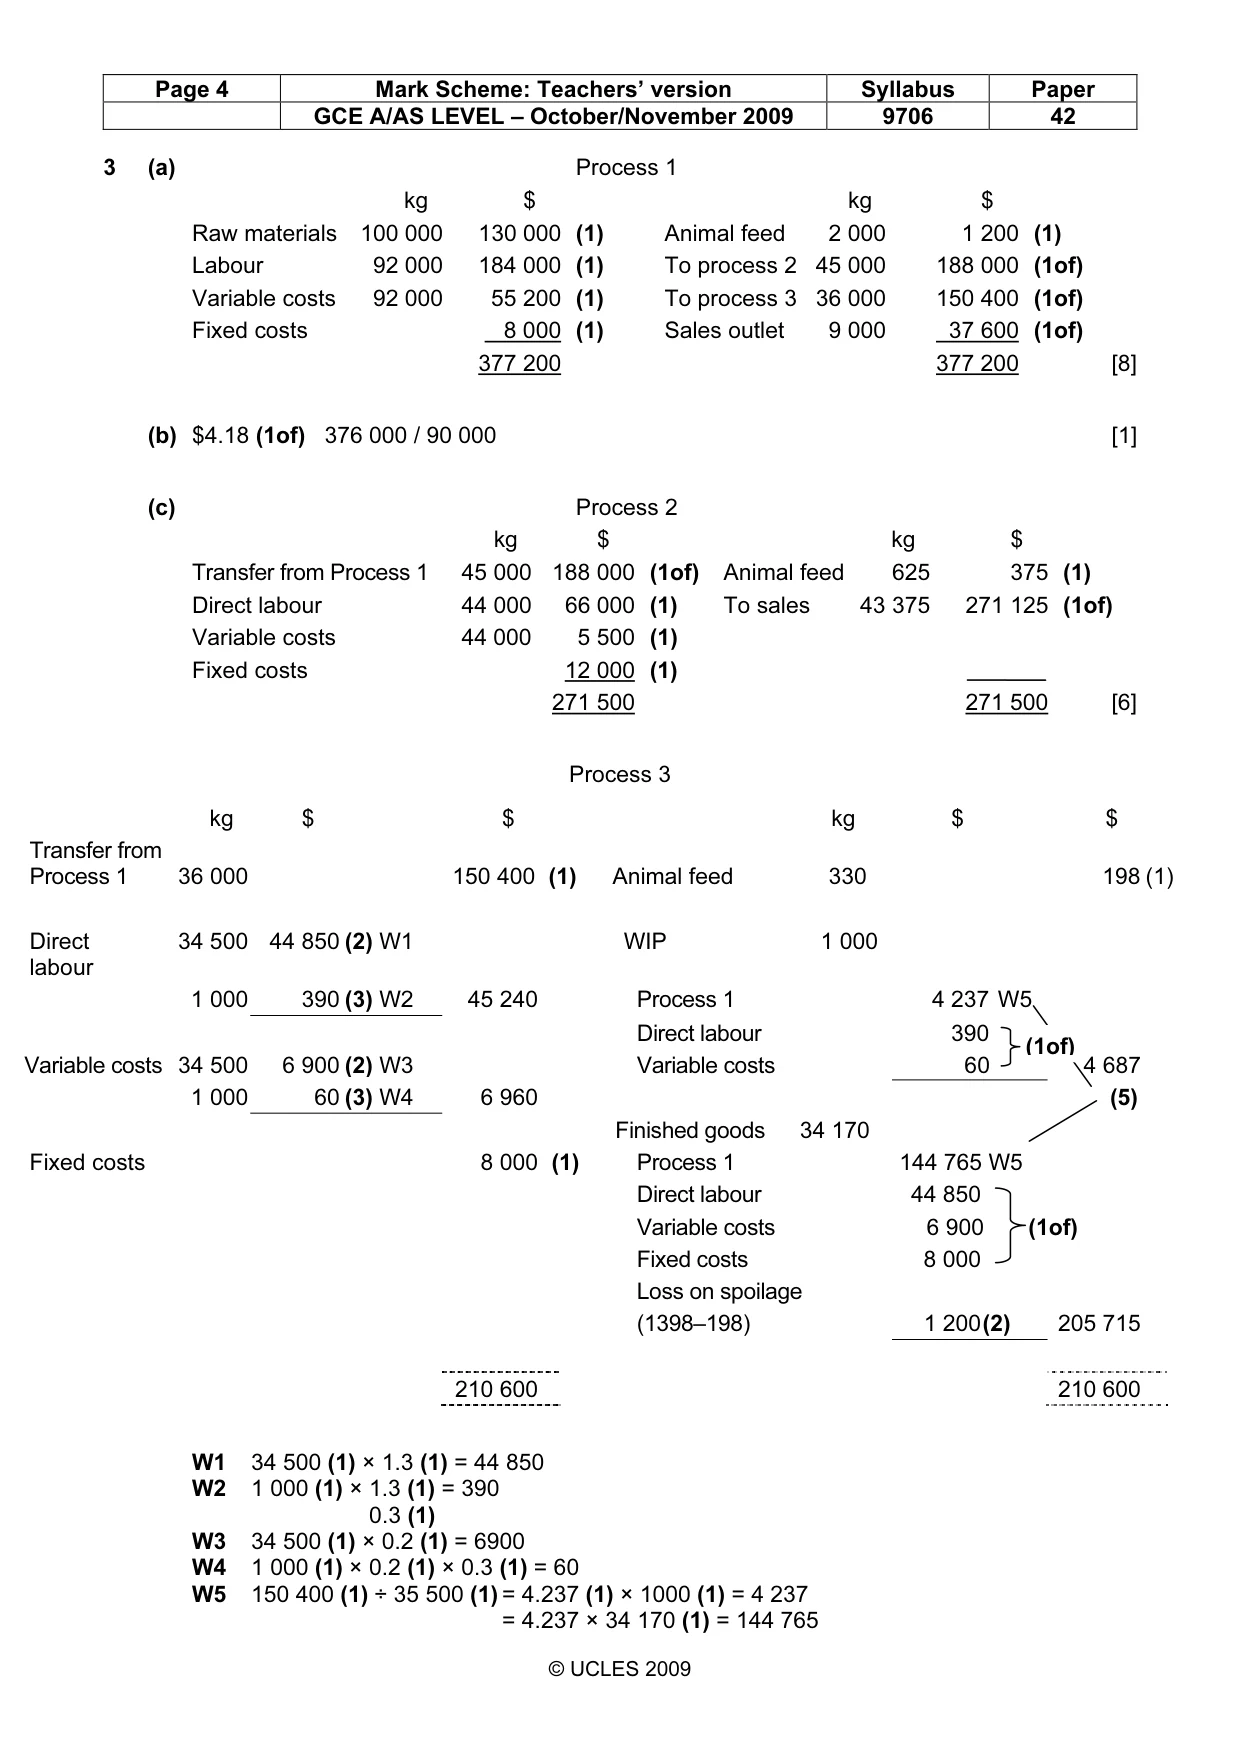
Page 4 Mark Scheme: Teachers’ version Syllabus Paper GCE A/AS LEVEL – October/November 2009 9706 42 © UCLES 2009 3 (a) Process 1 kg $ kg $ Raw materials 100 000 130 000 (1) Animal feed 2 000 1 200 (1) Labour 92 000 184 000 (1) To process 2 45 000 188 000 (1of) Variable costs 92 000 55 200 (1) To process 3 36 000 150 400 (1of) Fixed costs 8 000 (1) Sales outlet 9 000 37 600 (1of) 377 200 377 200 [8] (b) $4.18 (1of) 376 000 / 90 000 [1] (c) Process 2 kg $ kg $ Transfer from Process 1 45 000 188 000 (1of) Animal feed 625 375 (1) Direct labour 44 000 66 000 (1) To sales 43 375 271 125 (1of) Variable costs 44 000 5 500 (1) Fixed costs 12 000 (1) 271 500 271 500 [6] Process 3 kg $ $ kg $ $ Transfer from Process 1 36 000 150 400 (1) Animal feed 330 198 (1) Direct labour 34 500 44 850 (2) W1 WIP 1 000 1 000 390 (3) W2 45 240 Process 1 4 237 W5 Direct labour 390 Variable costs 34 500 6 900 (2) W3 Variable costs 60 4 687 1 000 60 (3) W4 6 960 (5) Finished goods 34 170 Fixed costs 8 000 (1) Process 1 144 765 W5 Direct labour 44 850 Variable costs 6 900 (1of) Fixed costs 8 000 Loss on spoilage (1398–198) 1 200 (2) 205 715 210 600 210 600 W1 34 500 (1) × 1.3 (1) = 44 850 W2 1 000 (1) × 1.3 (1) = 390 0.3 (1) W3 34 500 (1) × 0.2 (1) = 6900 W4 1 000 (1) × 0.2 (1) × 0.3 (1) = 60 W5 150 400 (1) ÷ 35 500 (1) = 4.237 (1) × 1000 (1) = 4 237 = 4.237 × 34 170 (1) = 144 765 (1of)
Mark scheme, page 5
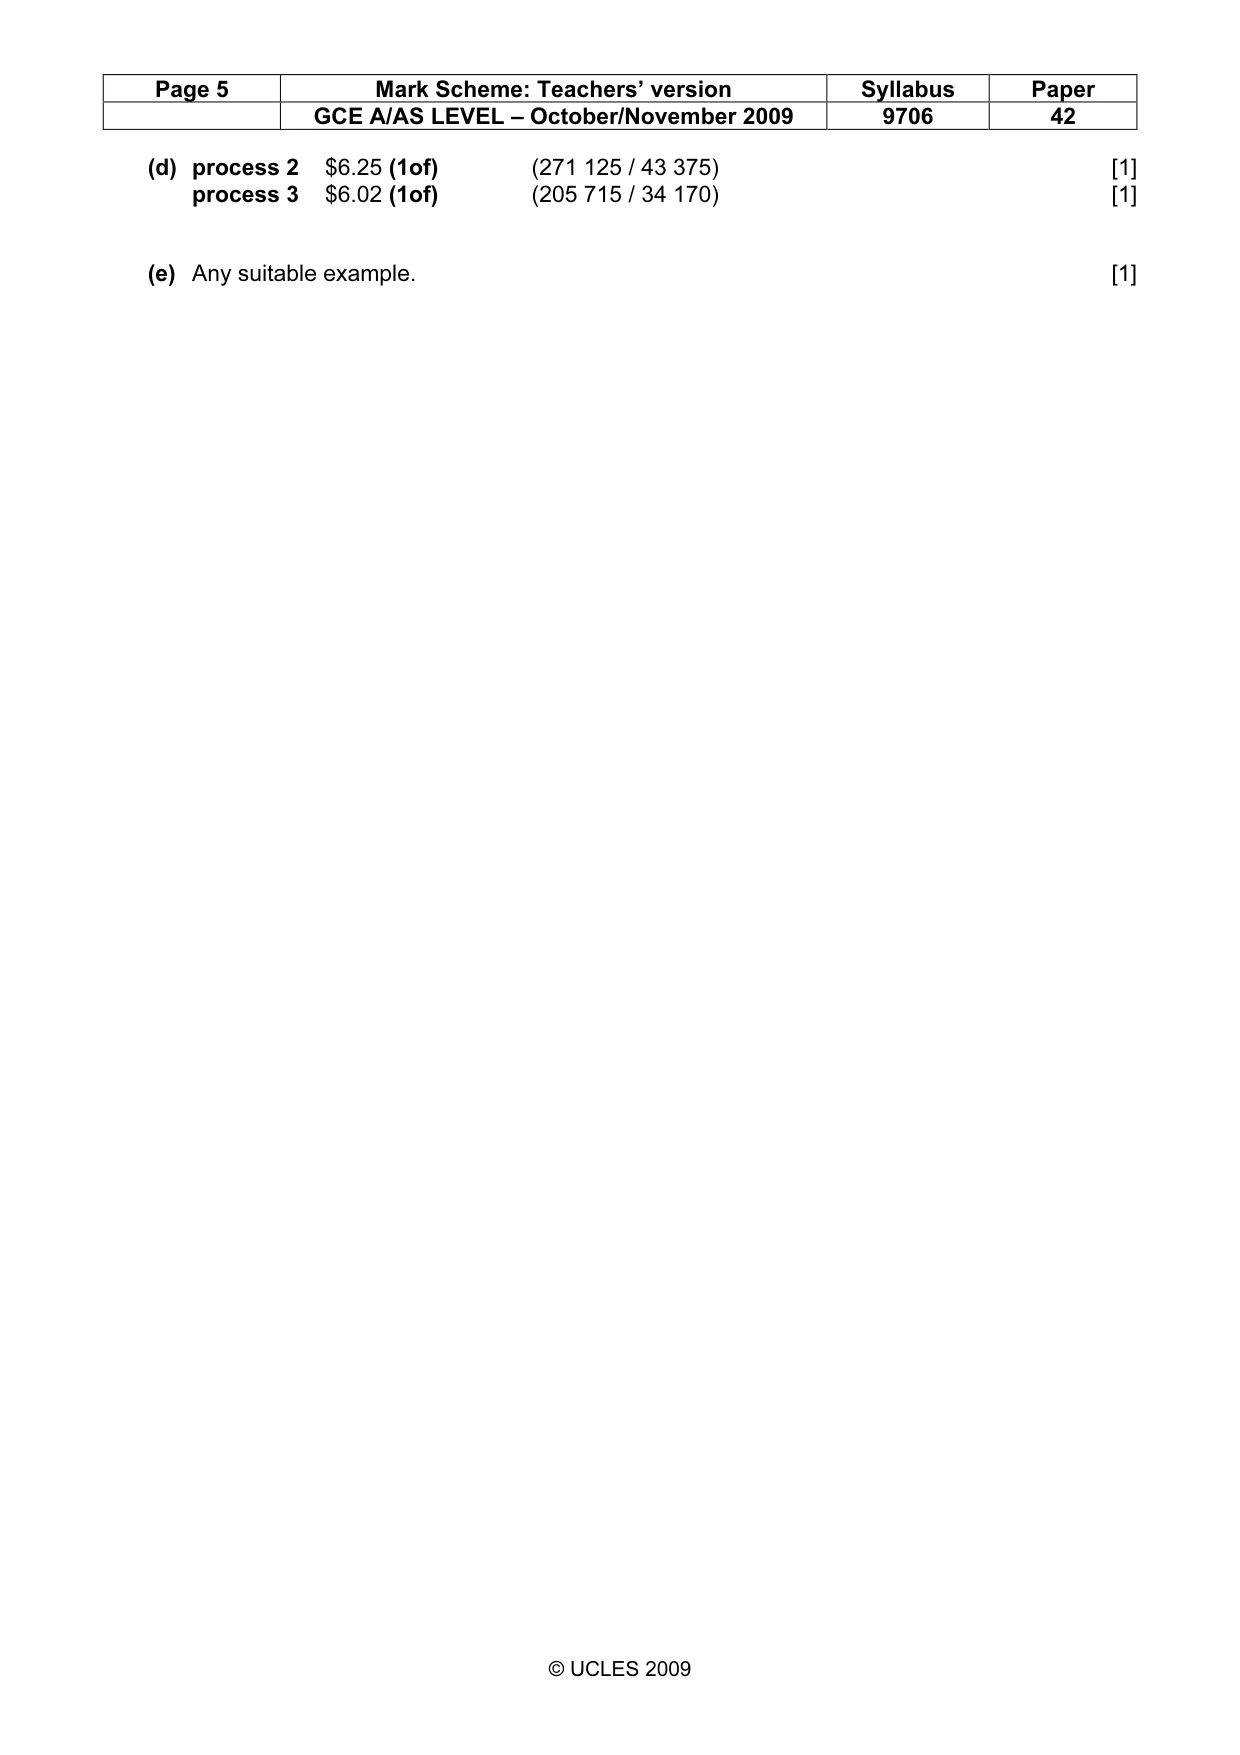
Page 5 Mark Scheme: Teachers’ version Syllabus Paper GCE A/AS LEVEL – October/November 2009 9706 42 © UCLES 2009 (d) process 2 $6.25 (1of) (271 125 / 43 375) [1] process 3 $6.02 (1of) (205 715 / 34 170) [1] (e) Any suitable example. [1]
What you needed in this session
Cambridge’s own grade thresholds for 2009 Oct/Nov, Paper 4 · Variant 2. A higher threshold means an easier paper — the bar moves with how the cohort did.