Cambridge IGCSE Twenty-First Century Science 0608 — 2013 May/June Paper 5 · Variant 1
0608/51/M/J/13 · 60 marks · ≈68 min
The question paper and its mark scheme, free to read here and free to download. This is Cambridge’s own paper, exactly as it was sat.
Question paper16 pages


Mark scheme5 pages
Answers below. Sit the paper first if you are practising.
Paper as text
Question paper, page 1
This document consists of 15 printed pages and 1 blank page. DC (LEG/CGW) 64753/3 © UCLES 2013 [Turn over UNIVERSITY OF CAMBRIDGE INTERNATIONAL EXAMINATIONS International General Certificate of Secondary Education * 9 3 4 6 8 8 1 6 7 5 * TWENTY FIRST CENTURY SCIENCE 0608/05 Paper 5 May/June 2013 1 hour 30 minutes Candidates answer on the Question Paper. No Additional Materials are required. READ THESE INSTRUCTIONS FIRST Write your Centre number, candidate number and name on all the work you hand in. Write in dark blue or black pen. You may use a pencil for any diagrams or graphs. Do not use staples, paper clips, highlighters, glue or correction fluid. DO NOT WRITE IN ANY BARCODES. Answer all questions. Electronic calculators may be used. At the end of the examination, fasten all your work securely together. The number of marks is given in brackets [ ] at the end of each question or part question. www.XtremePapers.com
Question paper, page 2
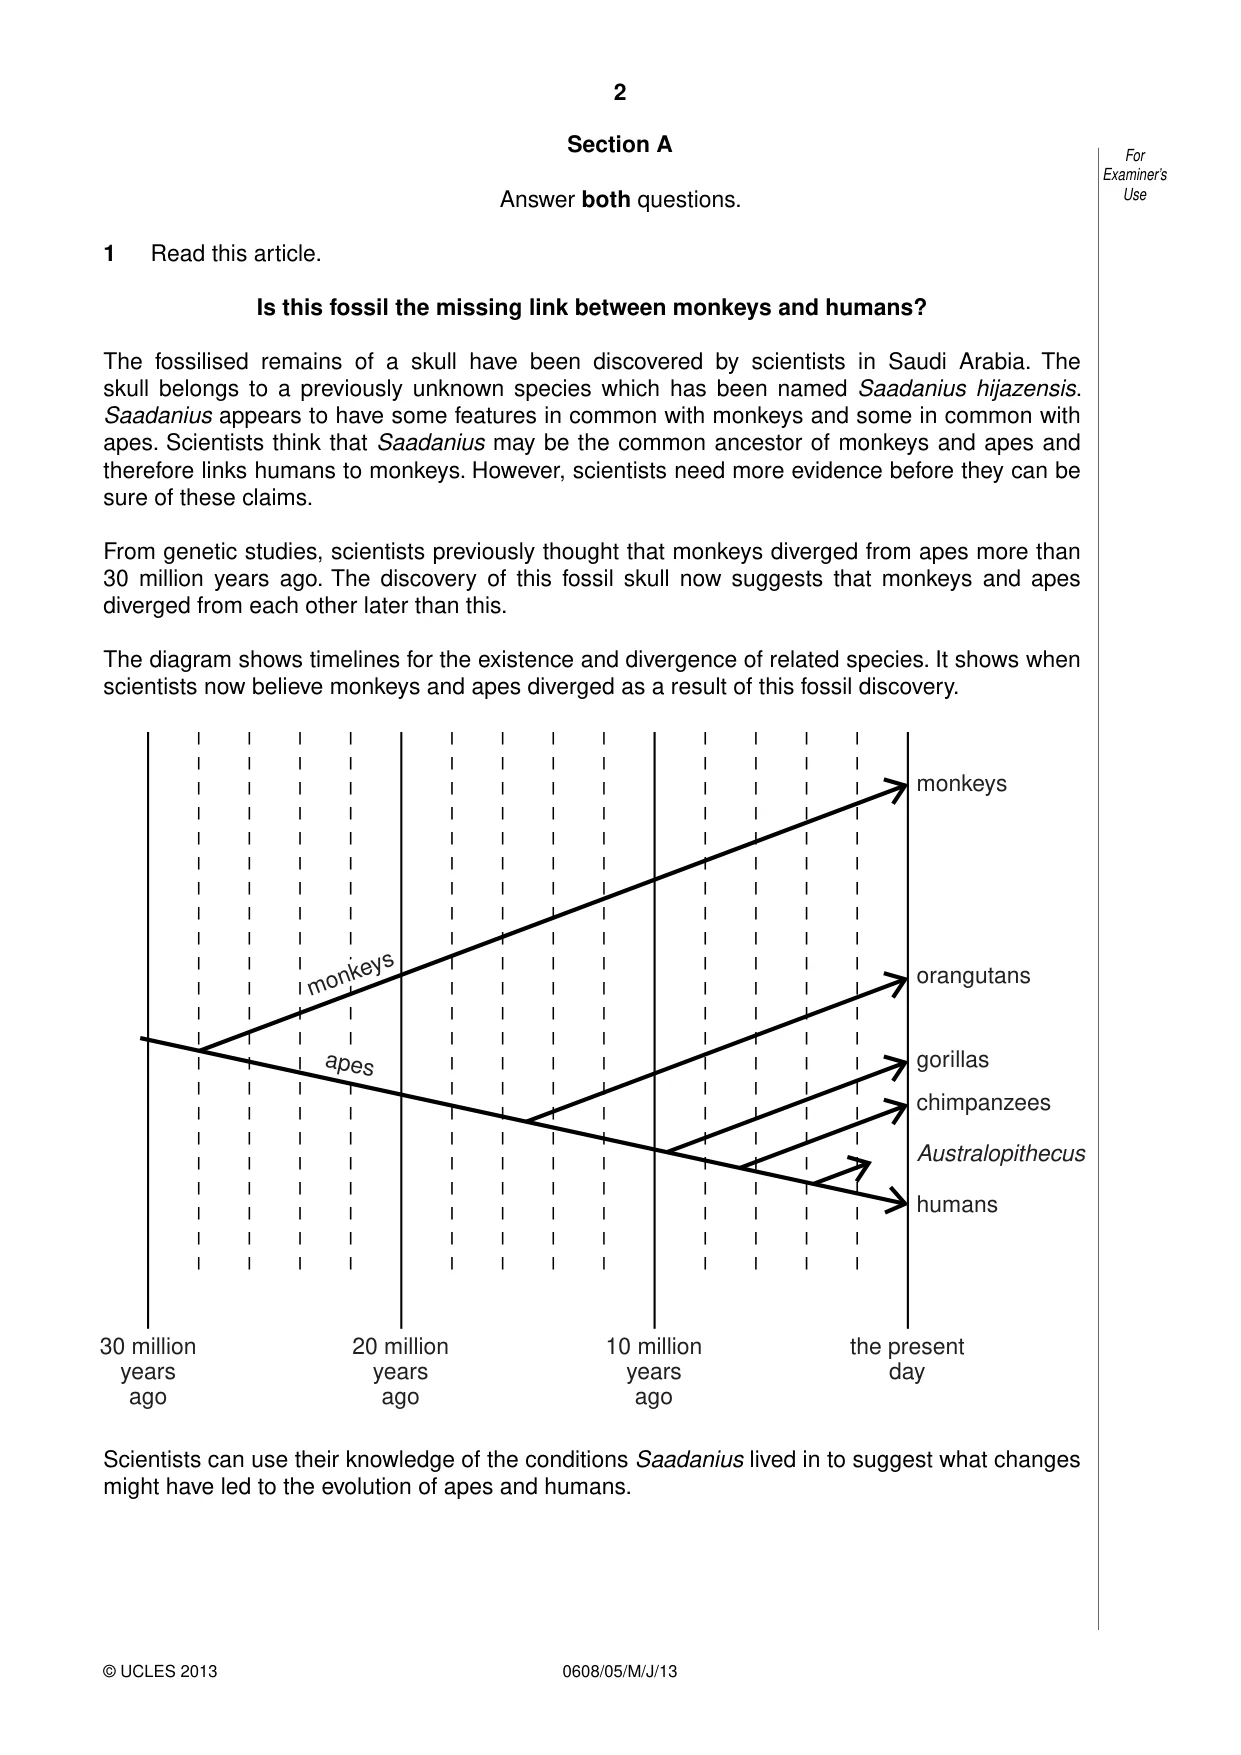
2 0608/05/M/J/13 © UCLES 2013 For Examiner’s Use Section A Answer both questions. 1 Read this article. Is this fossil the missing link between monkeys and humans? The fossilised remains of a skull have been discovered by scientists in Saudi Arabia. The skull belongs to a previously unknown species which has been named Saadanius hijazensis. Saadanius appears to have some features in common with monkeys and some in common with apes. Scientists think that Saadanius may be the common ancestor of monkeys and apes and therefore links humans to monkeys. However, scientists need more evidence before they can be sure of these claims. From genetic studies, scientists previously thought that monkeys diverged from apes more than 30 million years ago. The discovery of this fossil skull now suggests that monkeys and apes diverged from each other later than this. The diagram shows timelines for the existence and divergence of related species. It shows when scientists now believe monkeys and apes diverged as a result of this fossil discovery. 30 million years ago 20 million years ago 10 million years ago the present day monkeys orangutans gorillas chimpanzees Australopithecus humans apes monkeys Scientists can use their knowledge of the conditions Saadanius lived in to suggest what changes might have led to the evolution of apes and humans.
Question paper, page 3
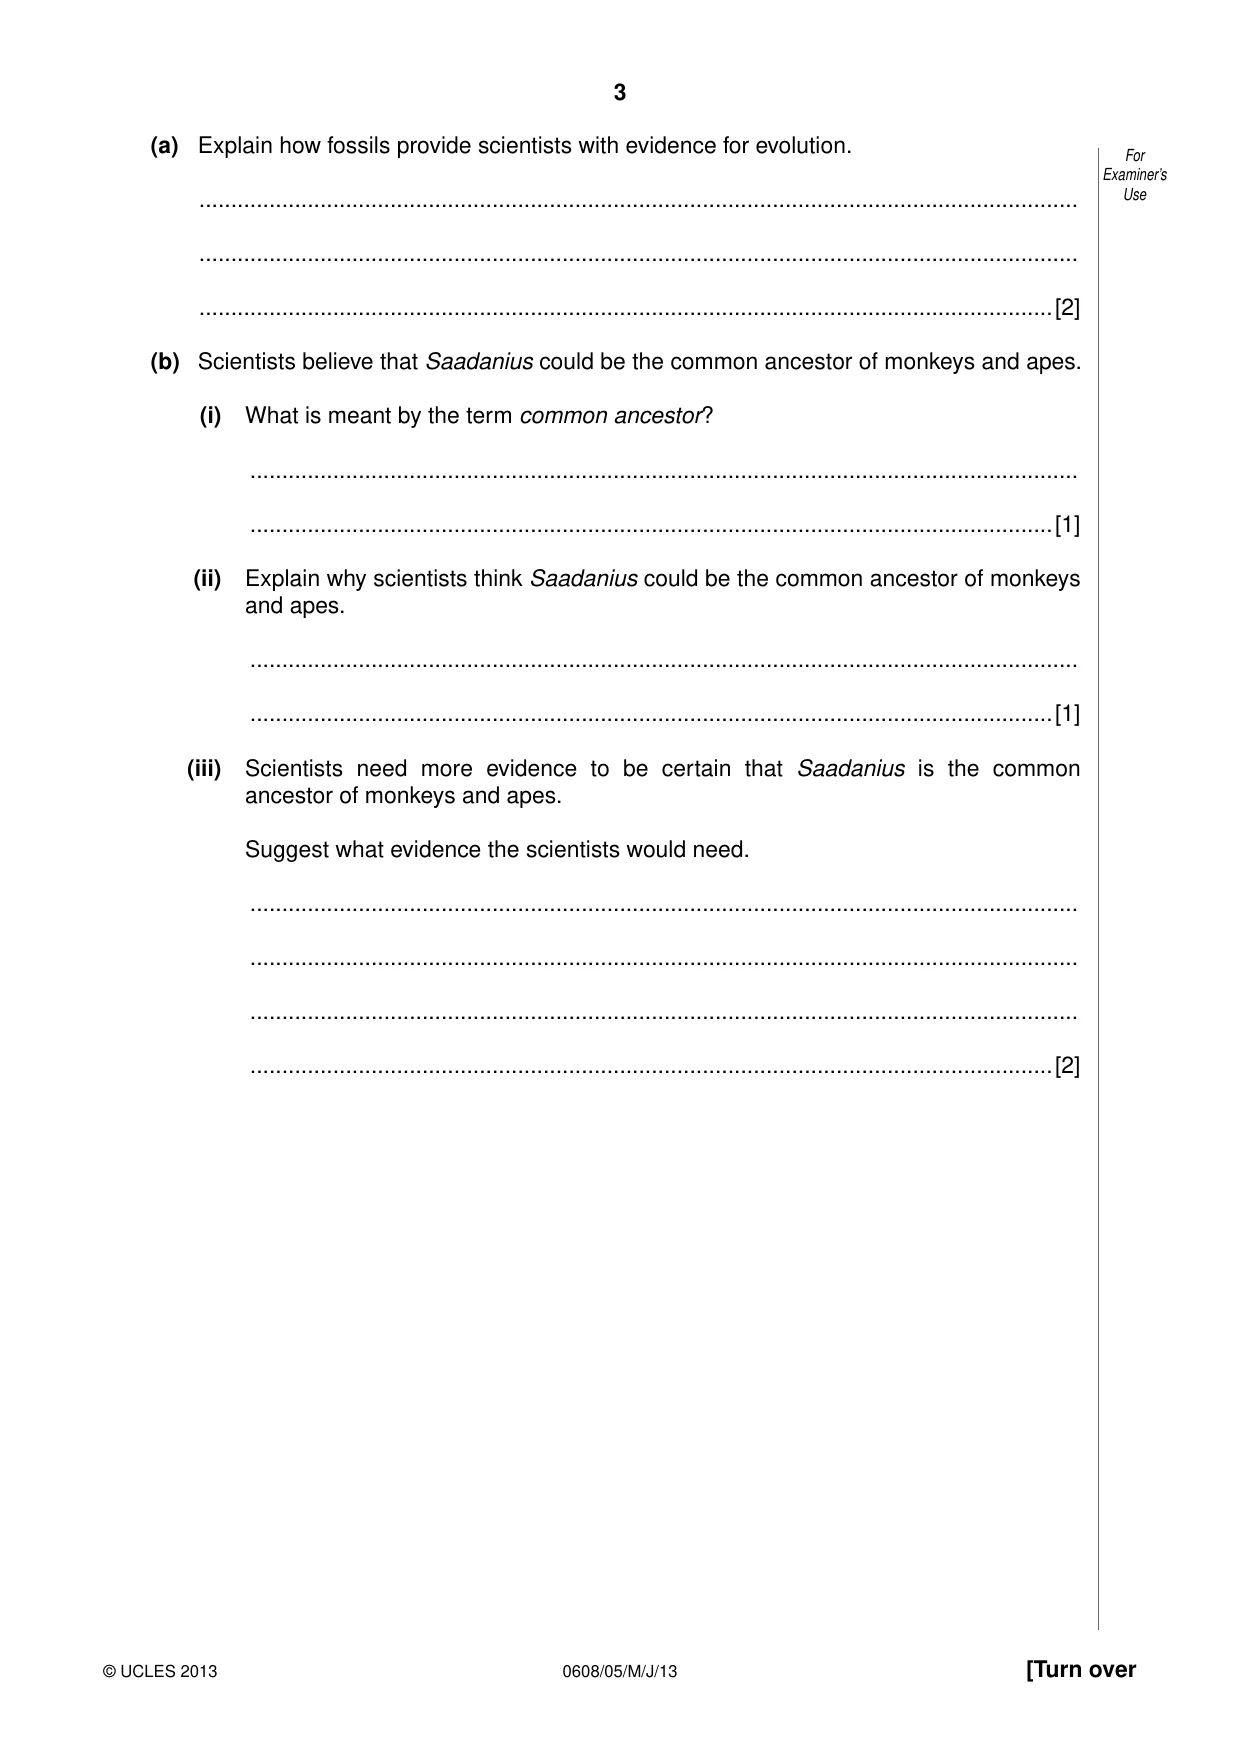
3 0608/05/M/J/13 © UCLES 2013 [Turn over For Examiner’s Use (a) Explain how fossils provide scientists with evidence for evolution. … … …[2] (b) Scientists believe that Saadanius could be the common ancestor of monkeys and apes. (i) What is meant by the term common ancestor? … …[1] (ii) Explain why scientists think Saadanius could be the common ancestor of monkeys and apes. … …[1] (iii) Scientists need more evidence to be certain that Saadanius is the common ancestor of monkeys and apes. Suggest what evidence the scientists would need. … … … …[2]
Question paper, page 4
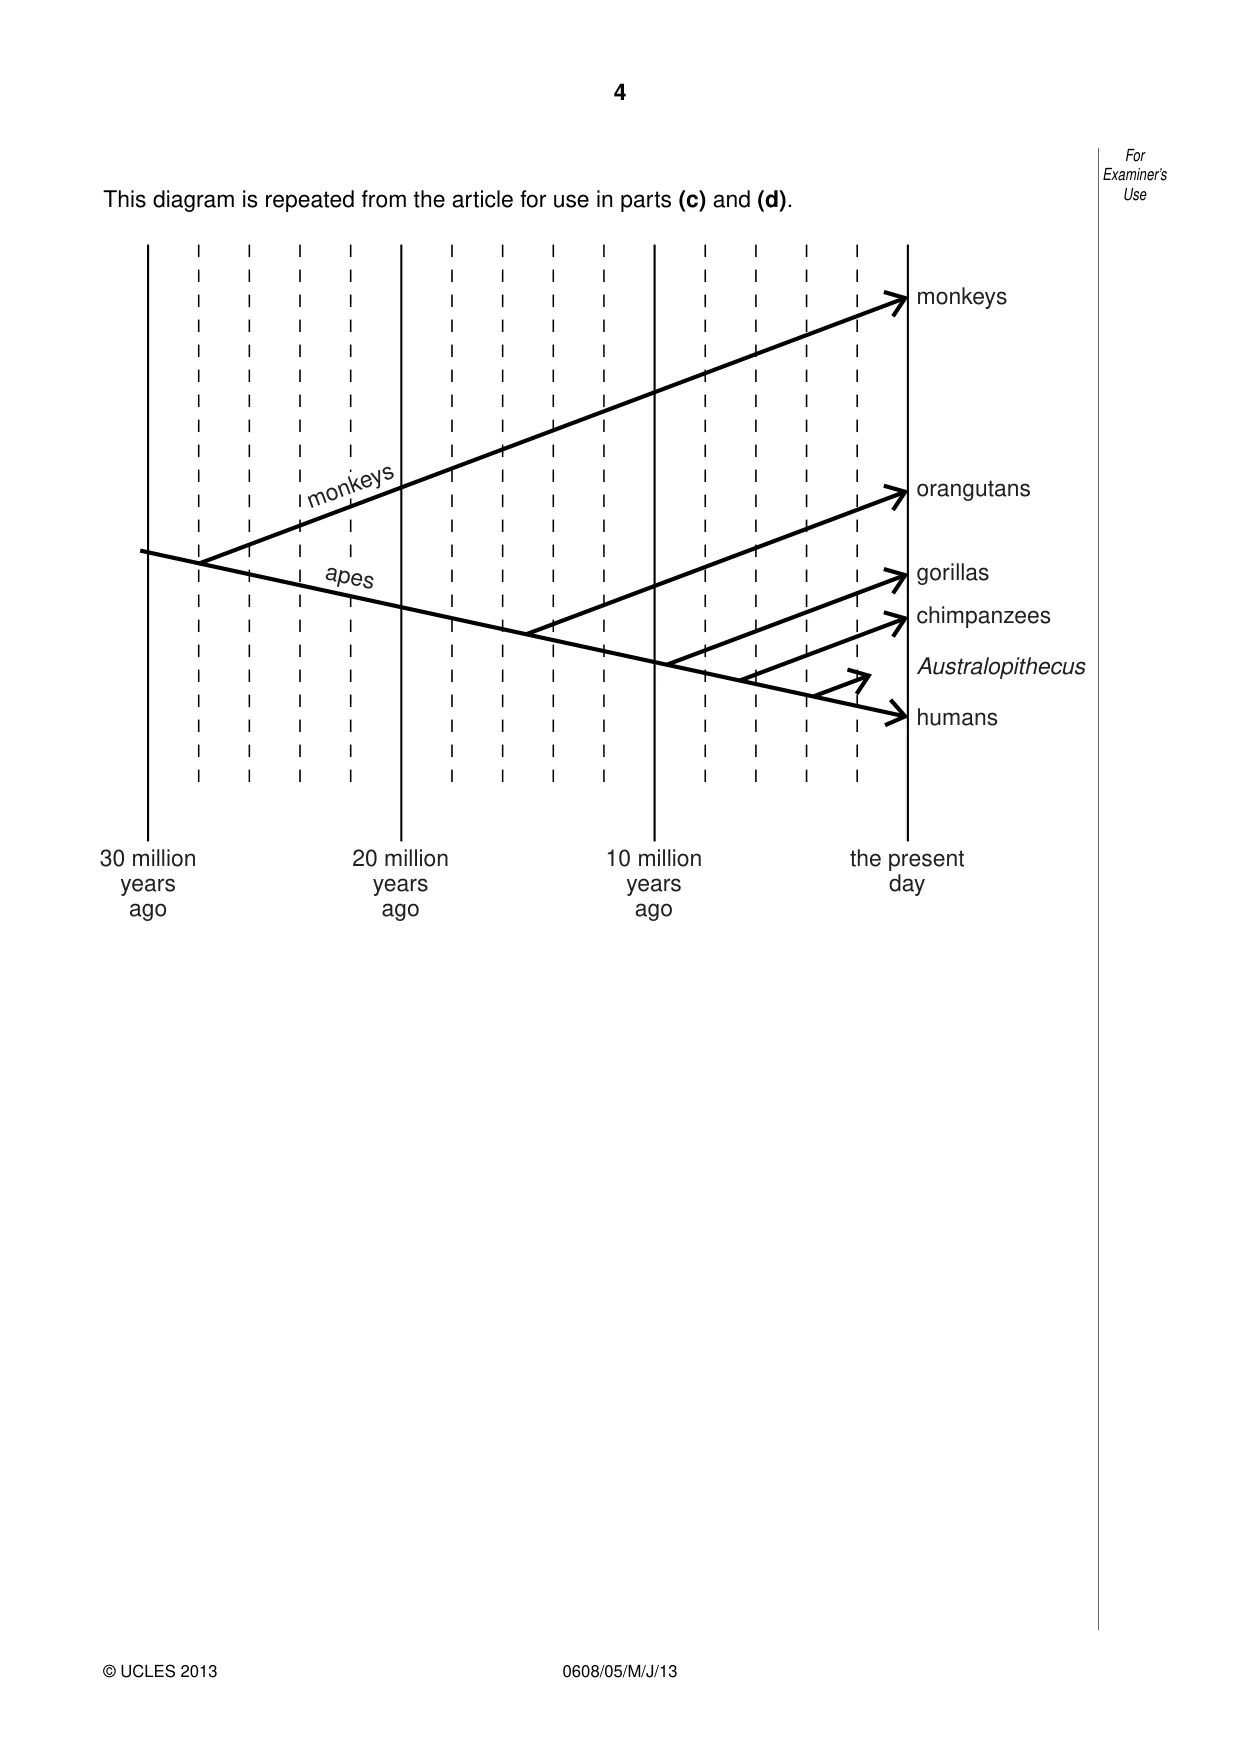
4 0608/05/M/J/13 © UCLES 2013 For Examiner’s Use This diagram is repeated from the article for use in parts (c) and (d). 30 million years ago 20 million years ago 10 million years ago the present day monkeys orangutans gorillas chimpanzees Australopithecus humans apes monkeys
Question paper, page 5
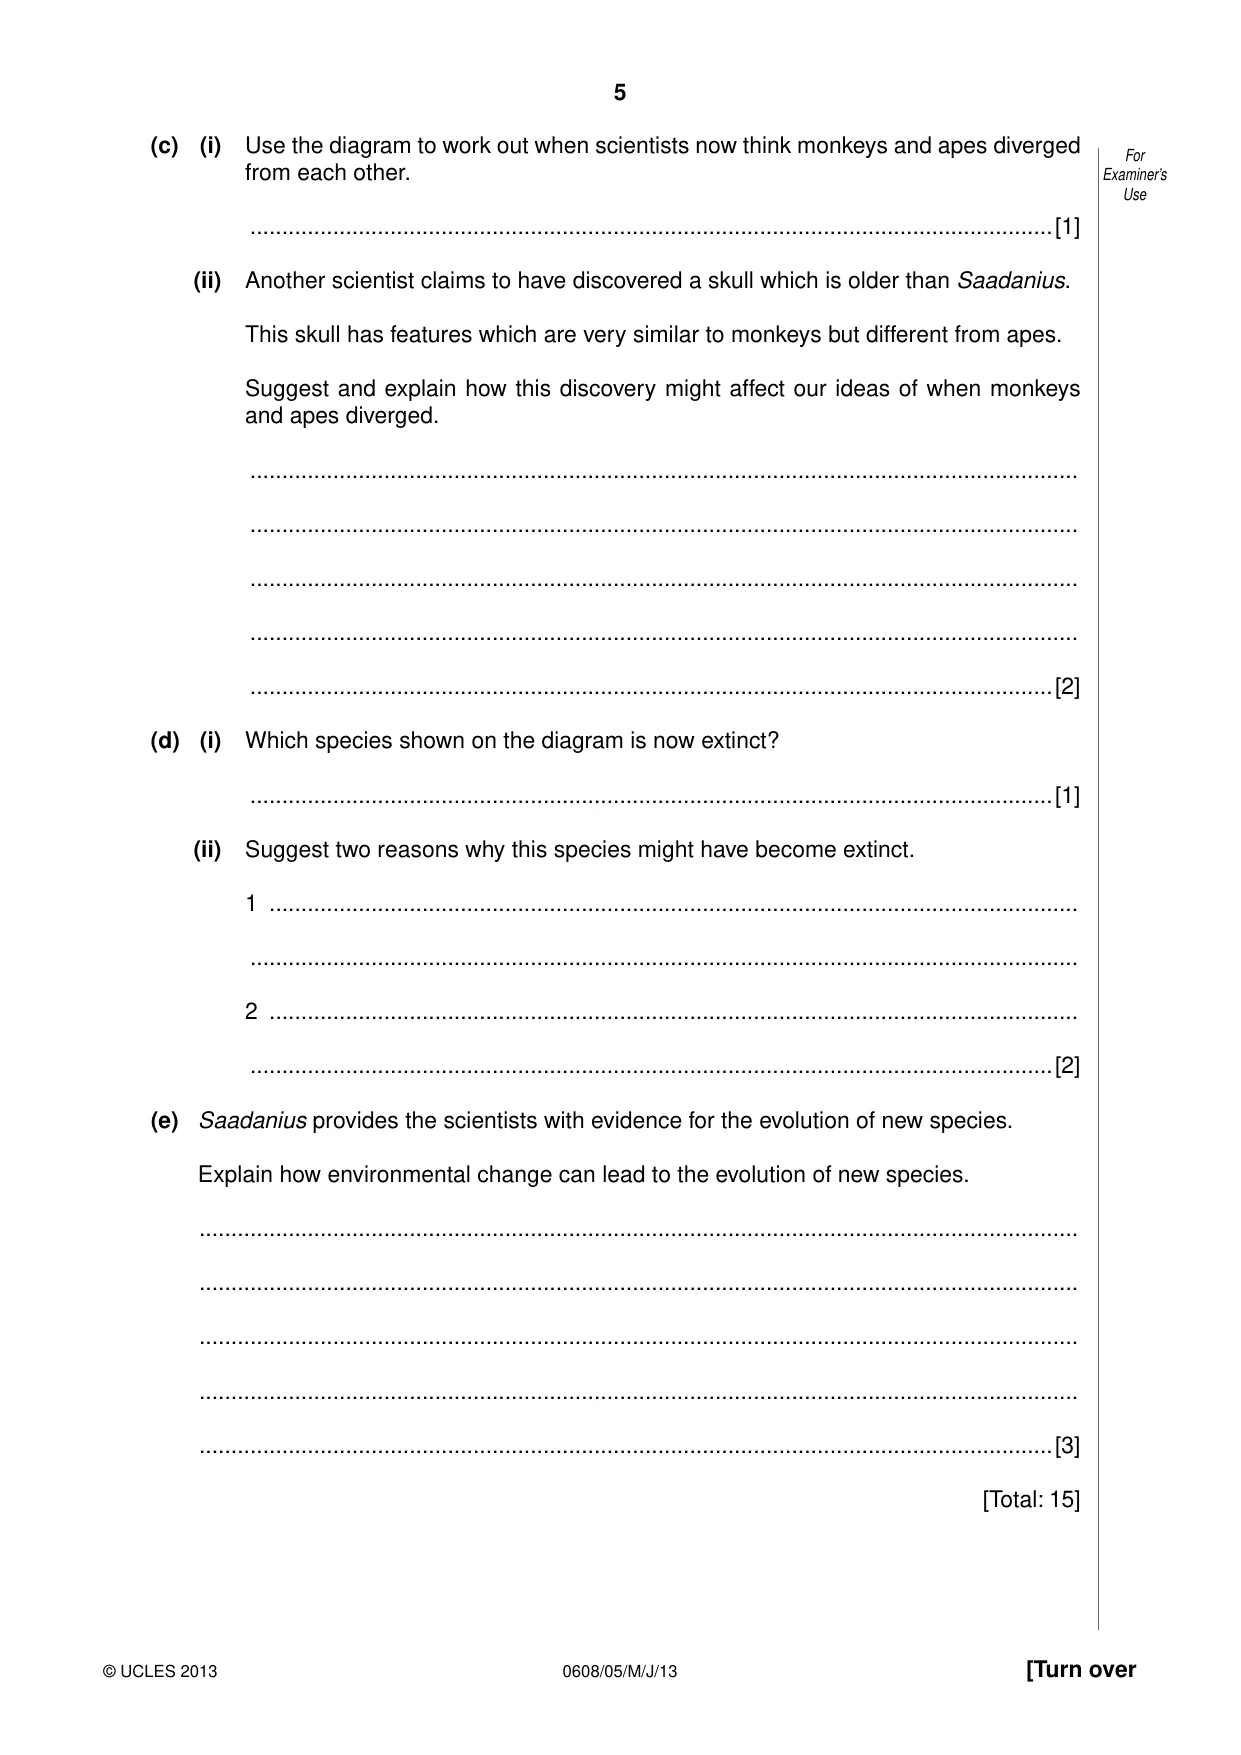
5 0608/05/M/J/13 © UCLES 2013 [Turn over For Examiner’s Use (c) (i) Use the diagram to work out when scientists now think monkeys and apes diverged from each other. …[1] (ii) Another scientist claims to have discovered a skull which is older than Saadanius. This skull has features which are very similar to monkeys but different from apes. Suggest and explain how this discovery might affect our ideas of when monkeys and apes diverged. … … … … …[2] (d) (i) Which species shown on the diagram is now extinct? …[1] (ii) Suggest two reasons why this species might have become extinct. 1 … … 2 … …[2] (e) Saadanius provides the scientists with evidence for the evolution of new species. Explain how environmental change can lead to the evolution of new species. … … … … …[3] [Total: 15]
Question paper, page 6
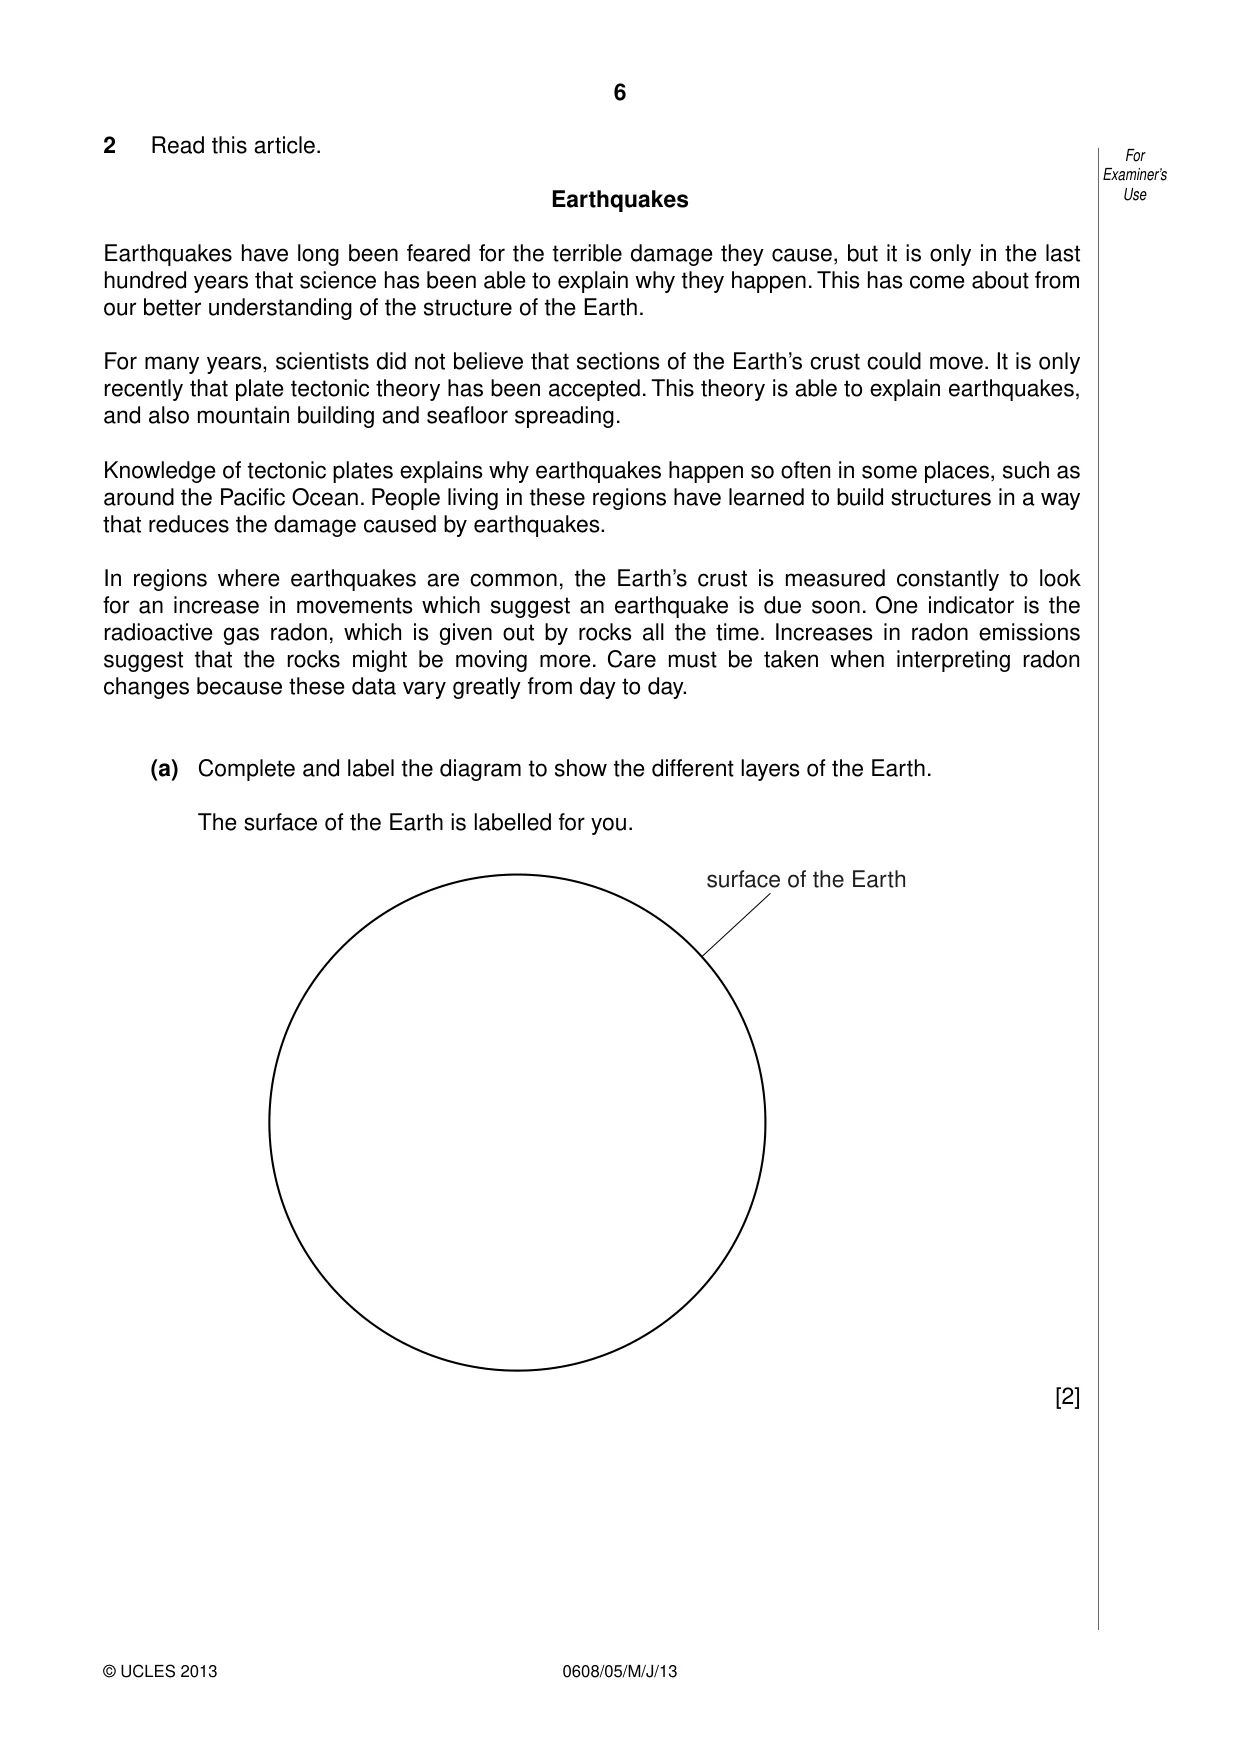
6 0608/05/M/J/13 © UCLES 2013 For Examiner’s Use 2 Read this article. Earthquakes Earthquakes have long been feared for the terrible damage they cause, but it is only in the last hundred years that science has been able to explain why they happen. This has come about from our better understanding of the structure of the Earth. For many years, scientists did not believe that sections of the Earth’s crust could move. It is only recently that plate tectonic theory has been accepted. This theory is able to explain earthquakes, and also mountain building and seafloor spreading. Knowledge of tectonic plates explains why earthquakes happen so often in some places, such as around the Pacific Ocean. People living in these regions have learned to build structures in a way that reduces the damage caused by earthquakes. In regions where earthquakes are common, the Earth’s crust is measured constantly to look for an increase in movements which suggest an earthquake is due soon. One indicator is the radioactive gas radon, which is given out by rocks all the time. Increases in radon emissions suggest that the rocks might be moving more. Care must be taken when interpreting radon changes because these data vary greatly from day to day. (a) Complete and label the diagram to show the different layers of the Earth. The surface of the Earth is labelled for you. surface of the Earth [2]
Question paper, page 7
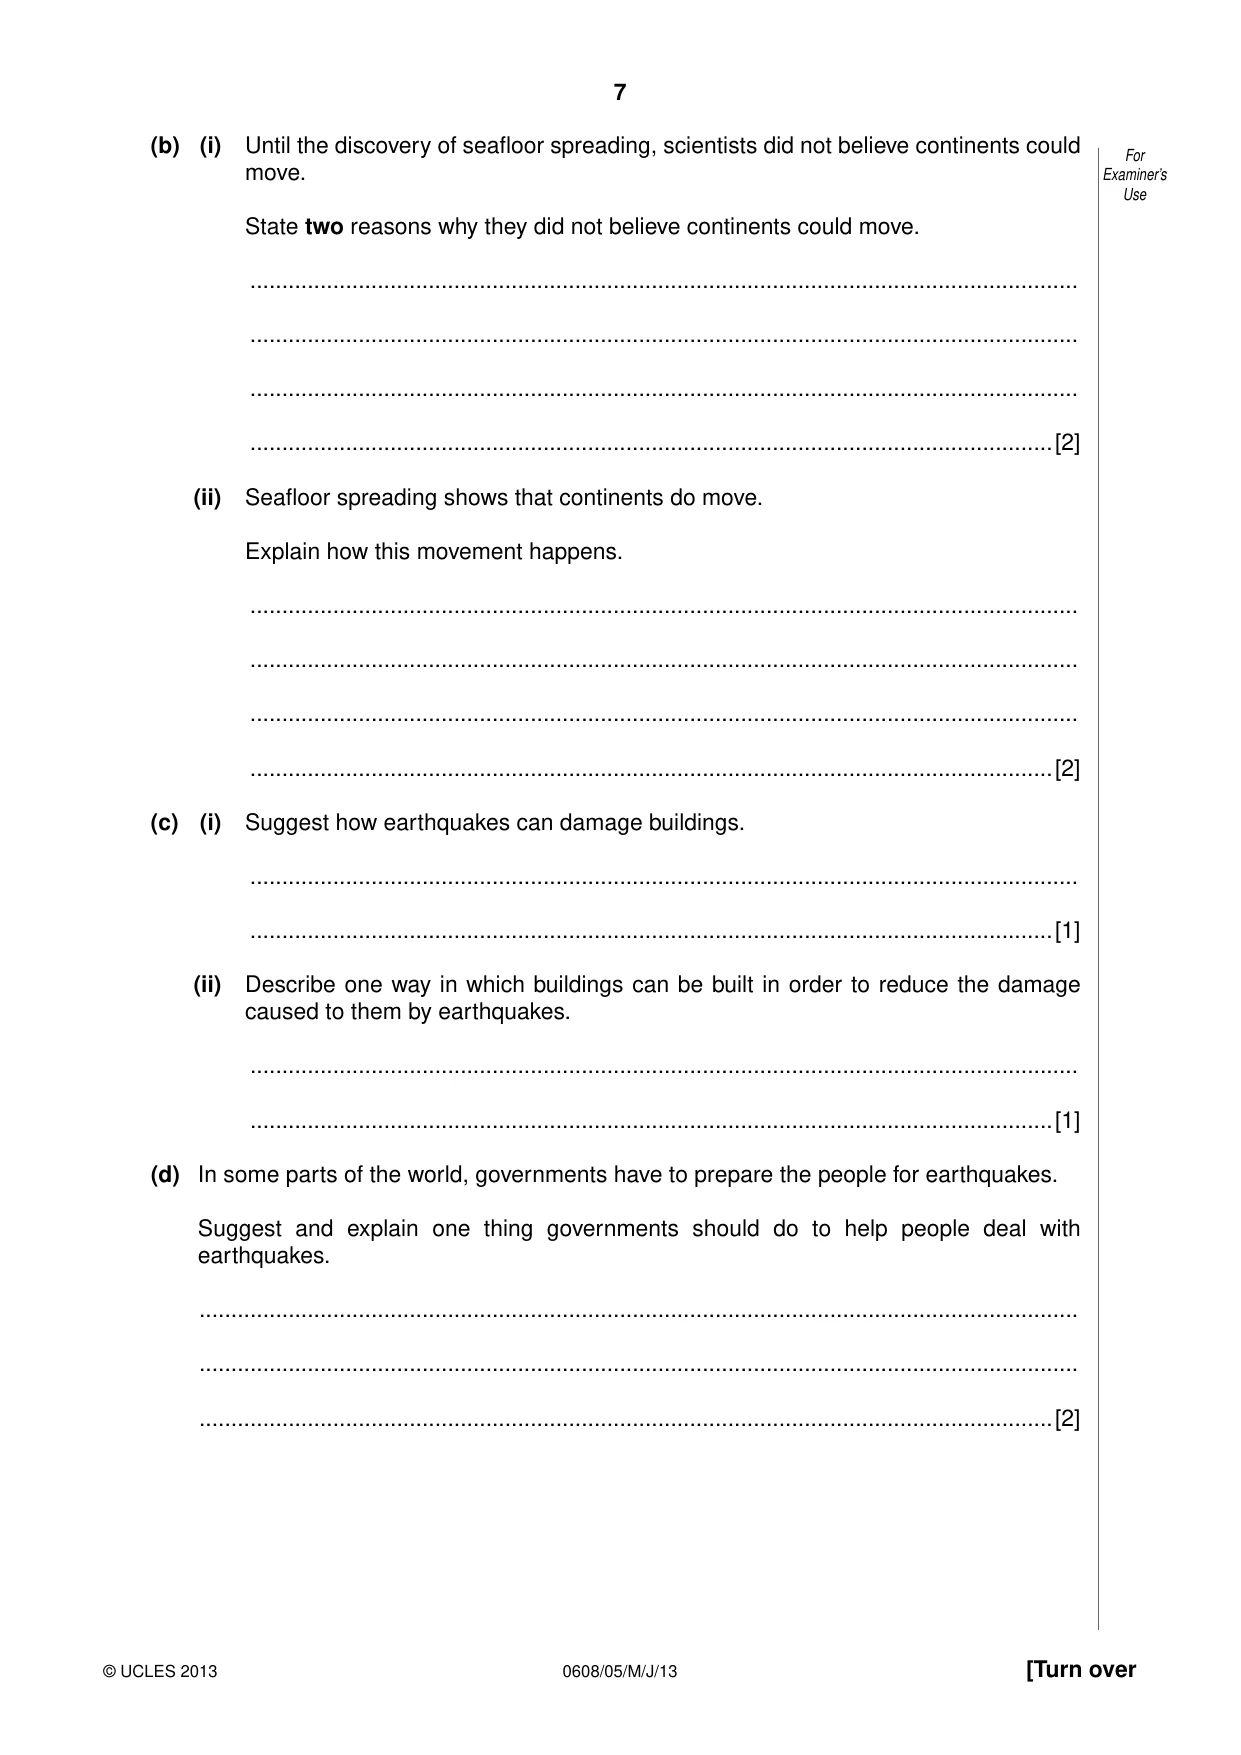
7 0608/05/M/J/13 © UCLES 2013 [Turn over For Examiner’s Use (b) (i) Until the discovery of seafloor spreading, scientists did not believe continents could move. State two reasons why they did not believe continents could move. … … … …[2] (ii) Seafloor spreading shows that continents do move. Explain how this movement happens. … … … …[2] (c) (i) Suggest how earthquakes can damage buildings. … …[1] (ii) Describe one way in which buildings can be built in order to reduce the damage caused to them by earthquakes. … …[1] (d) In some parts of the world, governments have to prepare the people for earthquakes. Suggest and explain one thing governments should do to help people deal with earthquakes. … … …[2]
Question paper, page 8
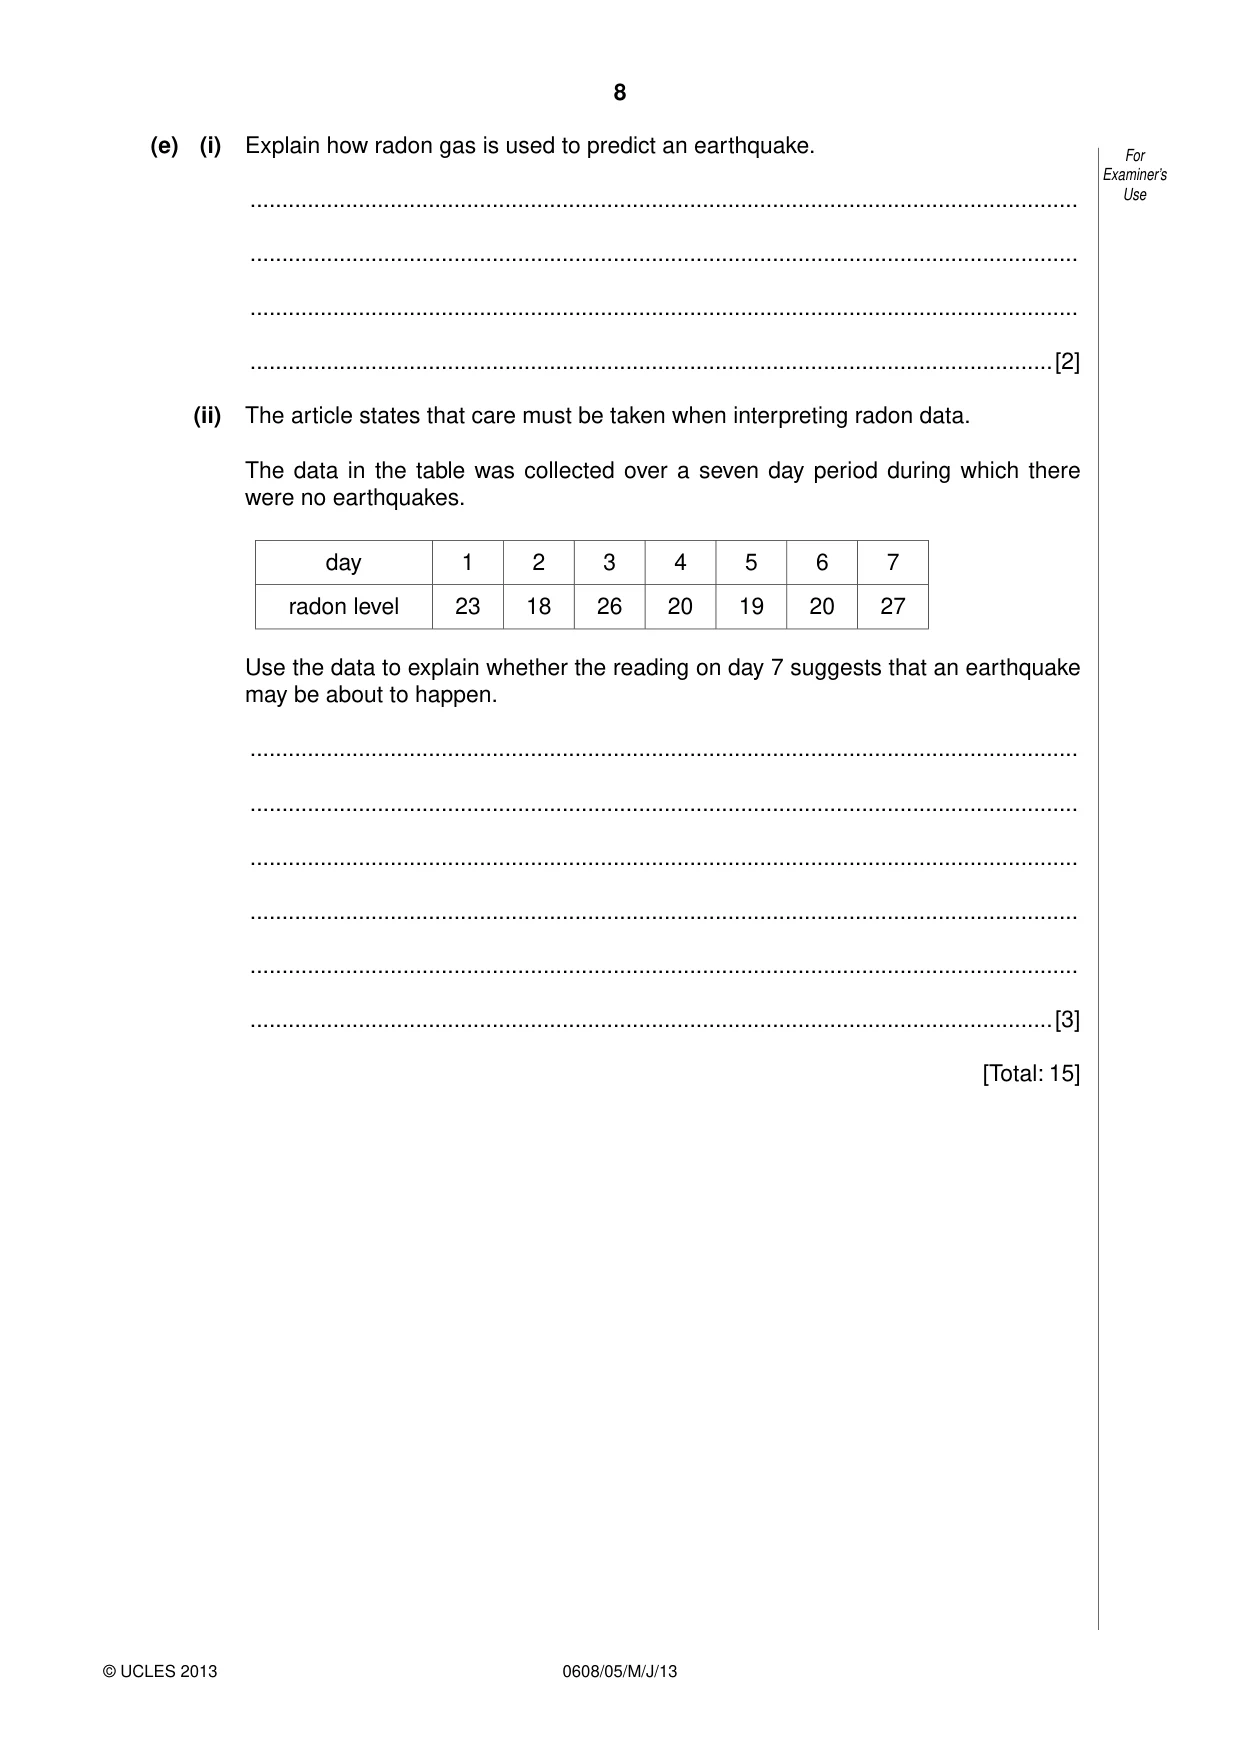
8 0608/05/M/J/13 © UCLES 2013 For Examiner’s Use (e) (i) Explain how radon gas is used to predict an earthquake. … … … …[2] (ii) The article states that care must be taken when interpreting radon data. The data in the table was collected over a seven day period during which there were no earthquakes. day 1 2 3 4 5 6 7 radon level 23 18 26 20 19 20 27 Use the data to explain whether the reading on day 7 suggests that an earthquake may be about to happen. … … … … … …[3] [Total: 15]
Question paper, page 9
9 0608/05/M/J/13 © UCLES 2013 [Turn over Question 3 begins on page 10.
Question paper, page 10
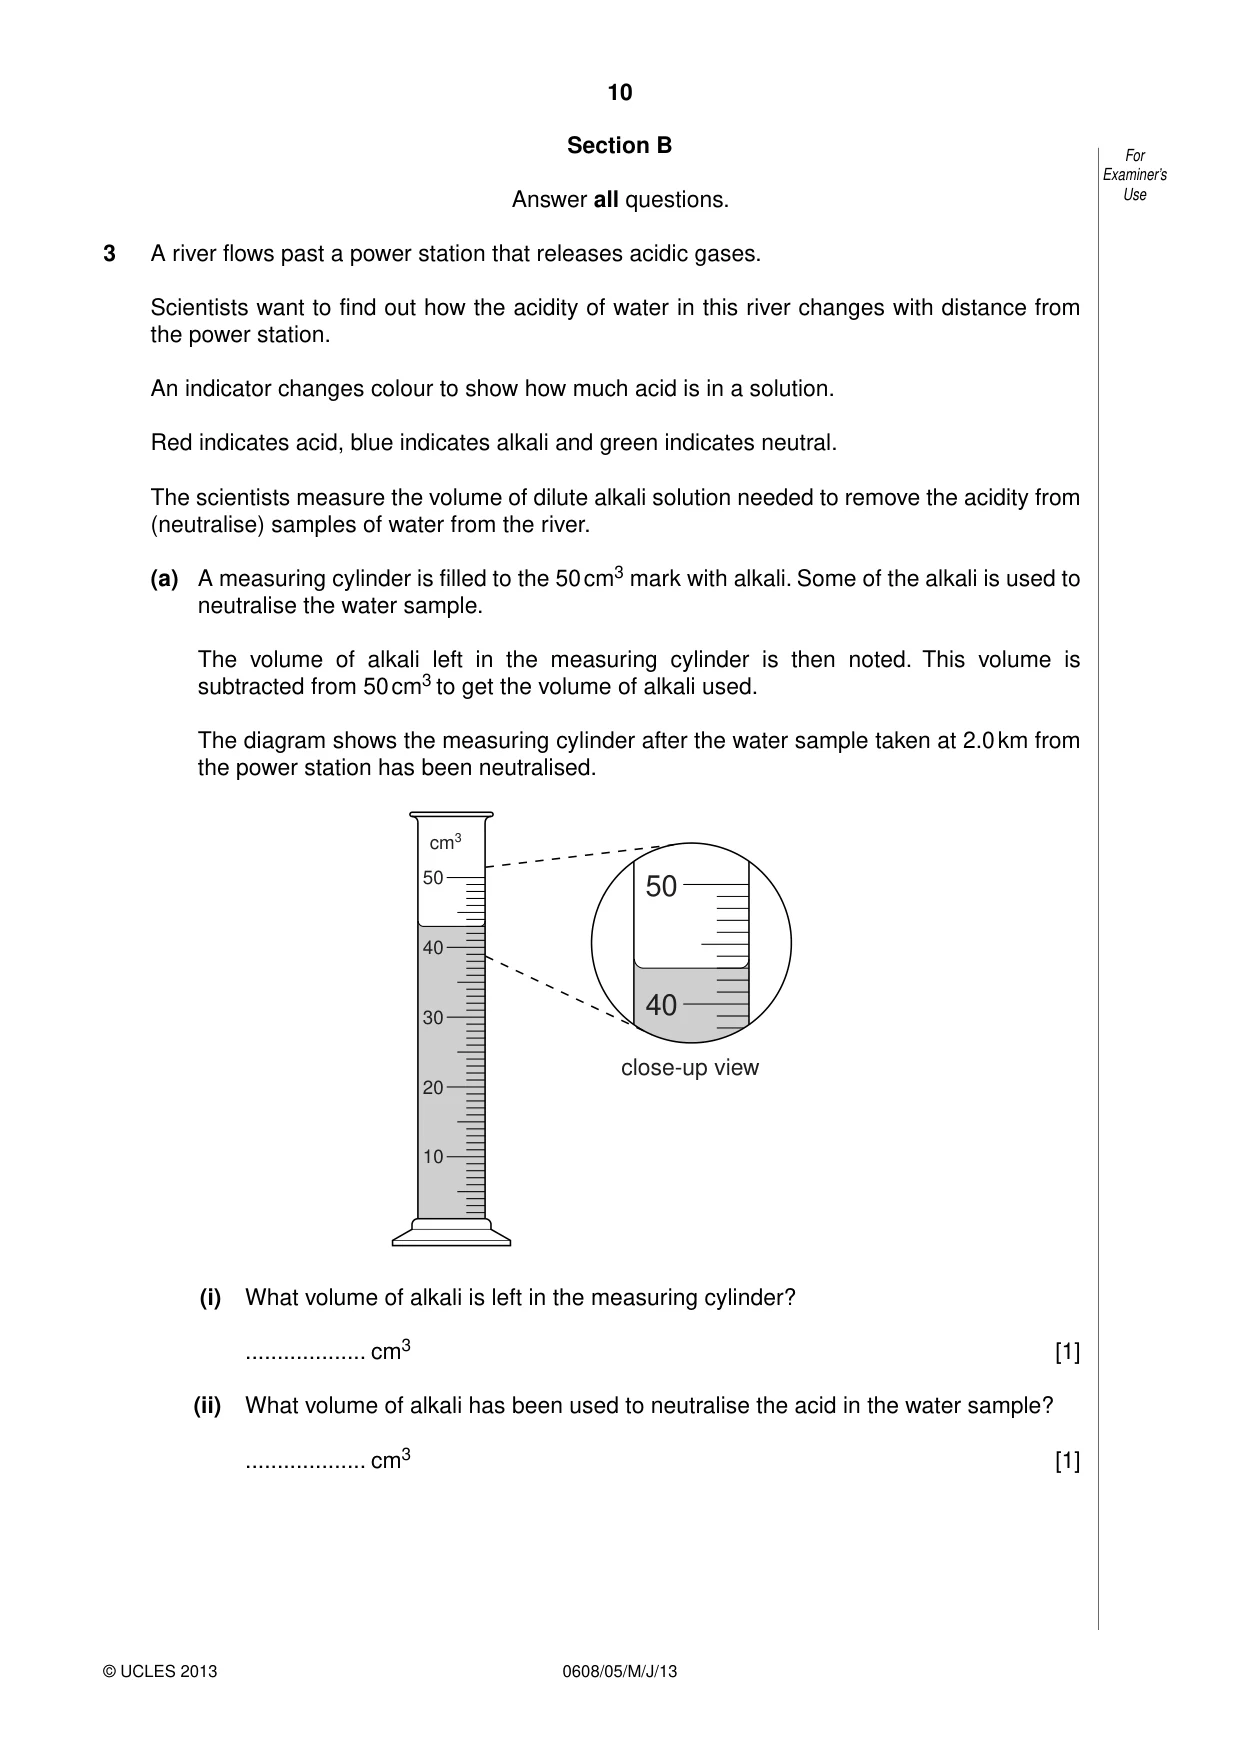
10 0608/05/M/J/13 © UCLES 2013 For Examiner’s Use Section B Answer all questions. 3 A river flows past a power station that releases acidic gases. Scientists want to find out how the acidity of water in this river changes with distance from the power station. An indicator changes colour to show how much acid is in a solution. Red indicates acid, blue indicates alkali and green indicates neutral. The scientists measure the volume of dilute alkali solution needed to remove the acidity from (neutralise) samples of water from the river. (a) A measuring cylinder is filled to the 50 cm3 mark with alkali. Some of the alkali is used to neutralise the water sample. The volume of alkali left in the measuring cylinder is then noted. This volume is subtracted from 50 cm3 to get the volume of alkali used. The diagram shows the measuring cylinder after the water sample taken at 2.0 km from the power station has been neutralised. 50 cm3 40 30 50 40 close-up view 10 20 (i) What volume of alkali is left in the measuring cylinder? … cm3 [1] (ii) What volume of alkali has been used to neutralise the acid in the water sample? … cm3 [1]
Question paper, page 11
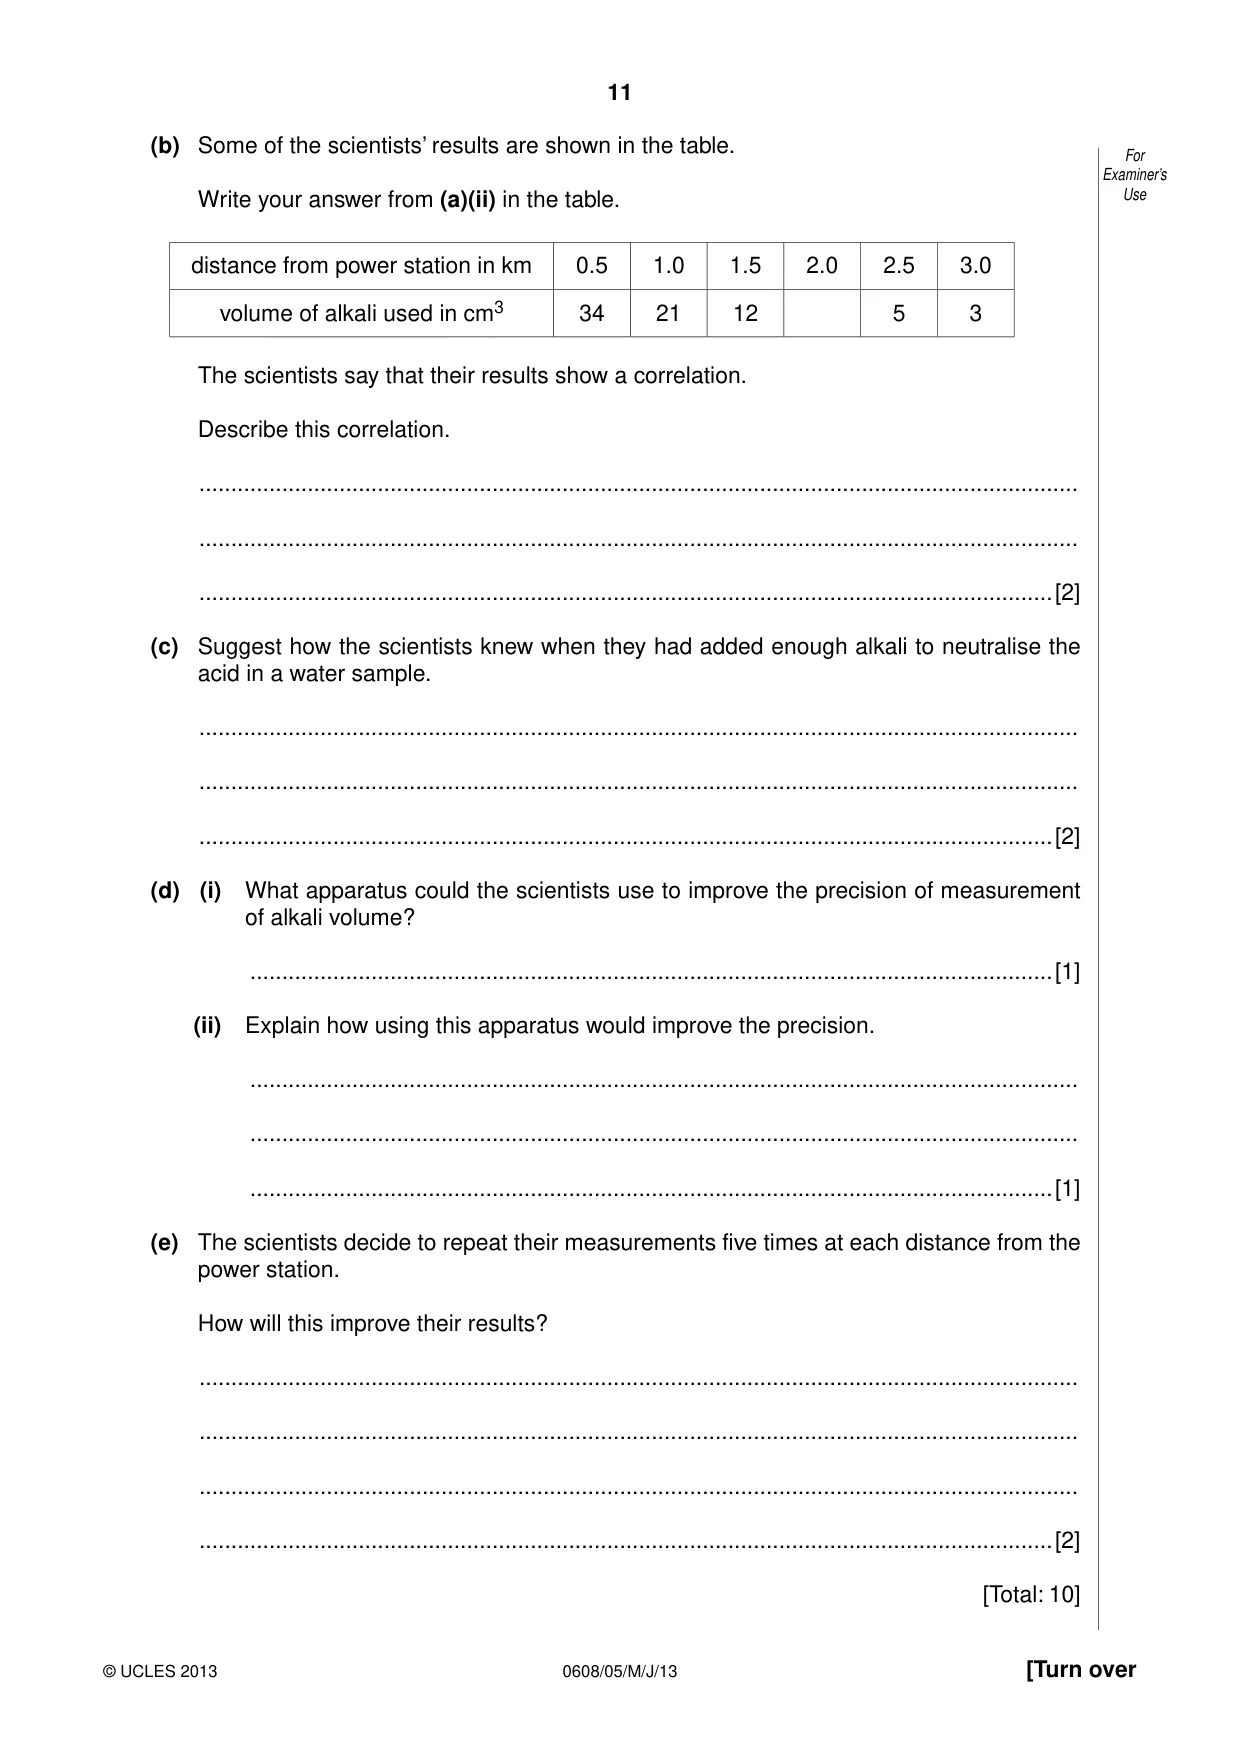
11 0608/05/M/J/13 © UCLES 2013 [Turn over For Examiner’s Use (b) Some of the scientists’ results are shown in the table. Write your answer from (a)(ii) in the table. distance from power station in km 0.5 1.0 1.5 2.0 2.5 3.0 volume of alkali used in cm3 34 21 12 5 3 The scientists say that their results show a correlation. Describe this correlation. … … …[2] (c) Suggest how the scientists knew when they had added enough alkali to neutralise the acid in a water sample. … … …[2] (d) (i) What apparatus could the scientists use to improve the precision of measurement of alkali volume? …[1] (ii) Explain how using this apparatus would improve the precision. … … …[1] (e) The scientists decide to repeat their measurements five times at each distance from the power station. How will this improve their results? … … … …[2] [Total: 10]
Question paper, page 12
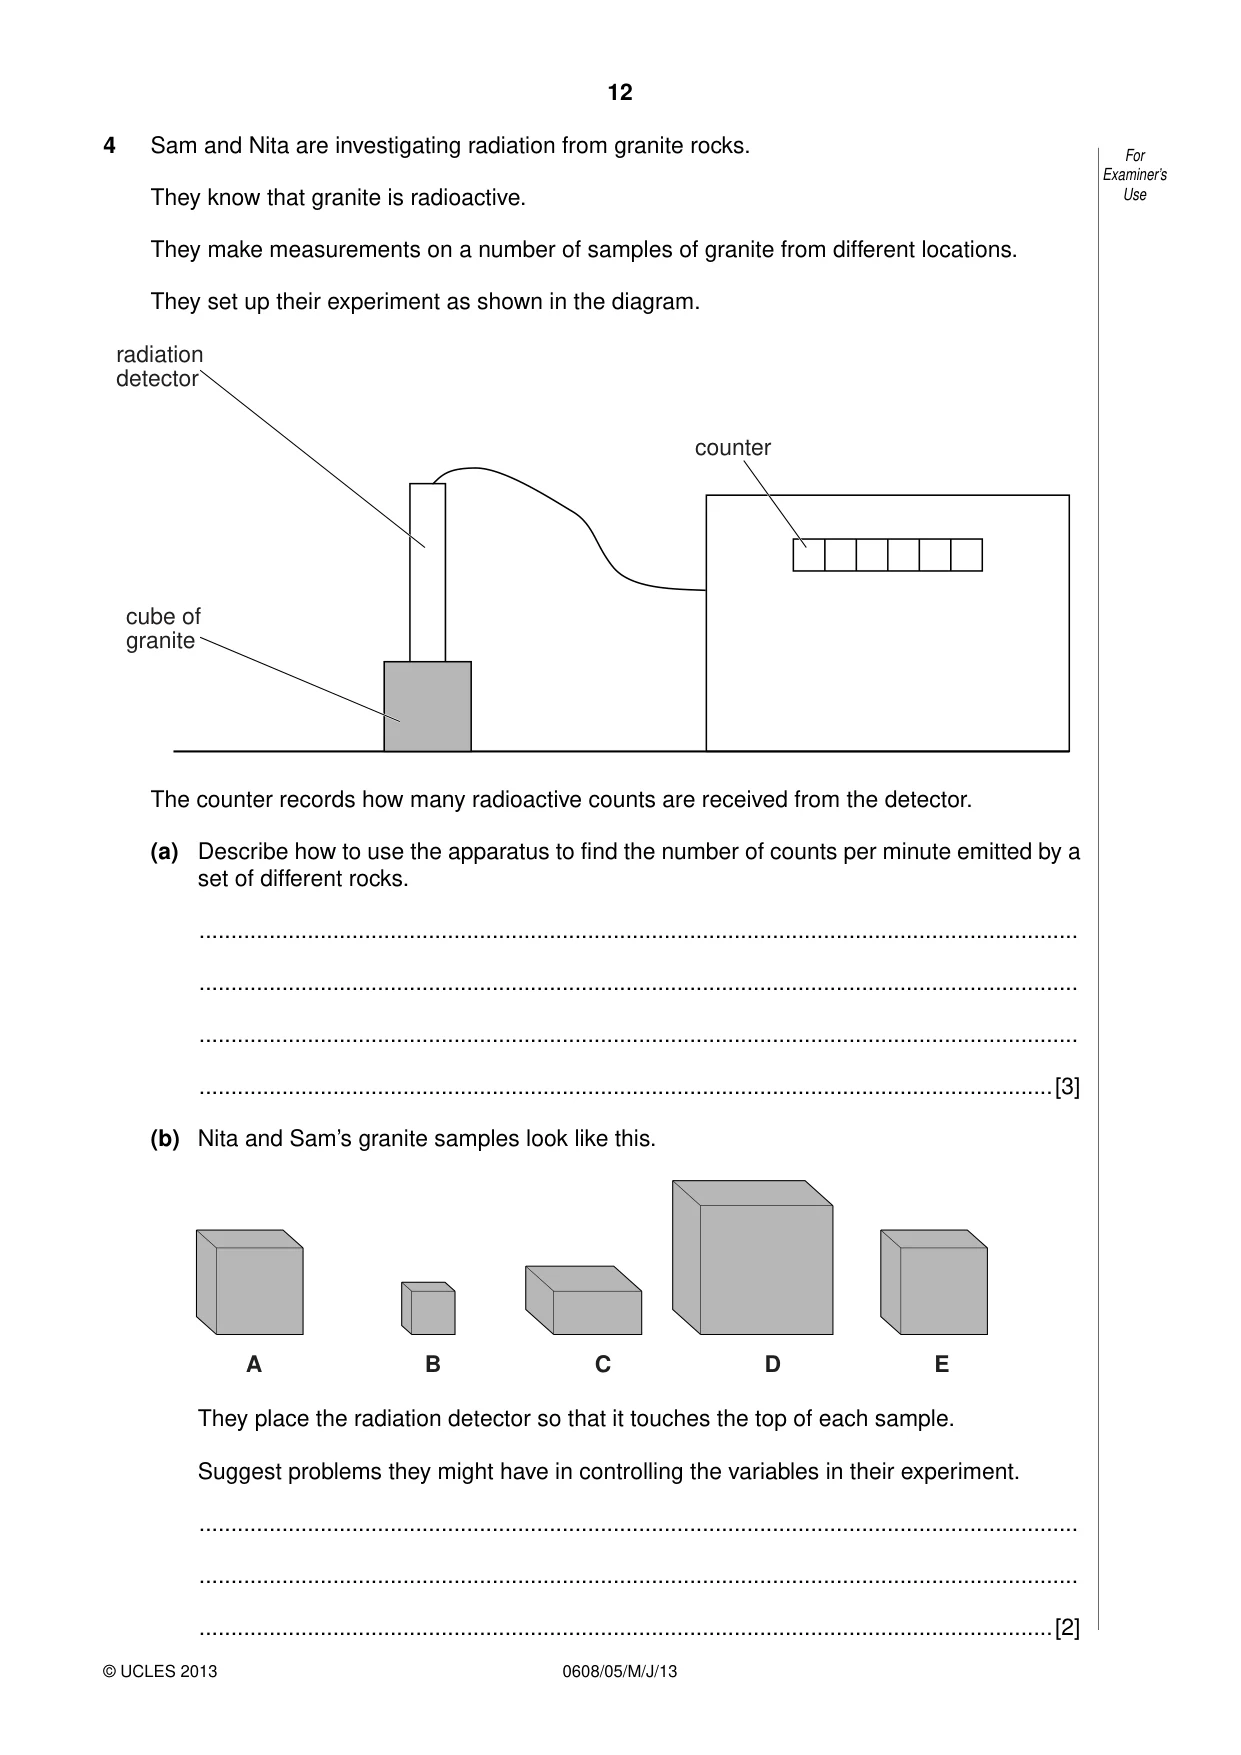
12 0608/05/M/J/13 © UCLES 2013 For Examiner’s Use 4 Sam and Nita are investigating radiation from granite rocks. They know that granite is radioactive. They make measurements on a number of samples of granite from different locations. They set up their experiment as shown in the diagram. counter radiation detector cube of granite The counter records how many radioactive counts are received from the detector. (a) Describe how to use the apparatus to find the number of counts per minute emitted by a set of different rocks. … … … …[3] (b) Nita and Sam’s granite samples look like this. A B C D E They place the radiation detector so that it touches the top of each sample. Suggest problems they might have in controlling the variables in their experiment. … … …[2]
Question paper, page 13
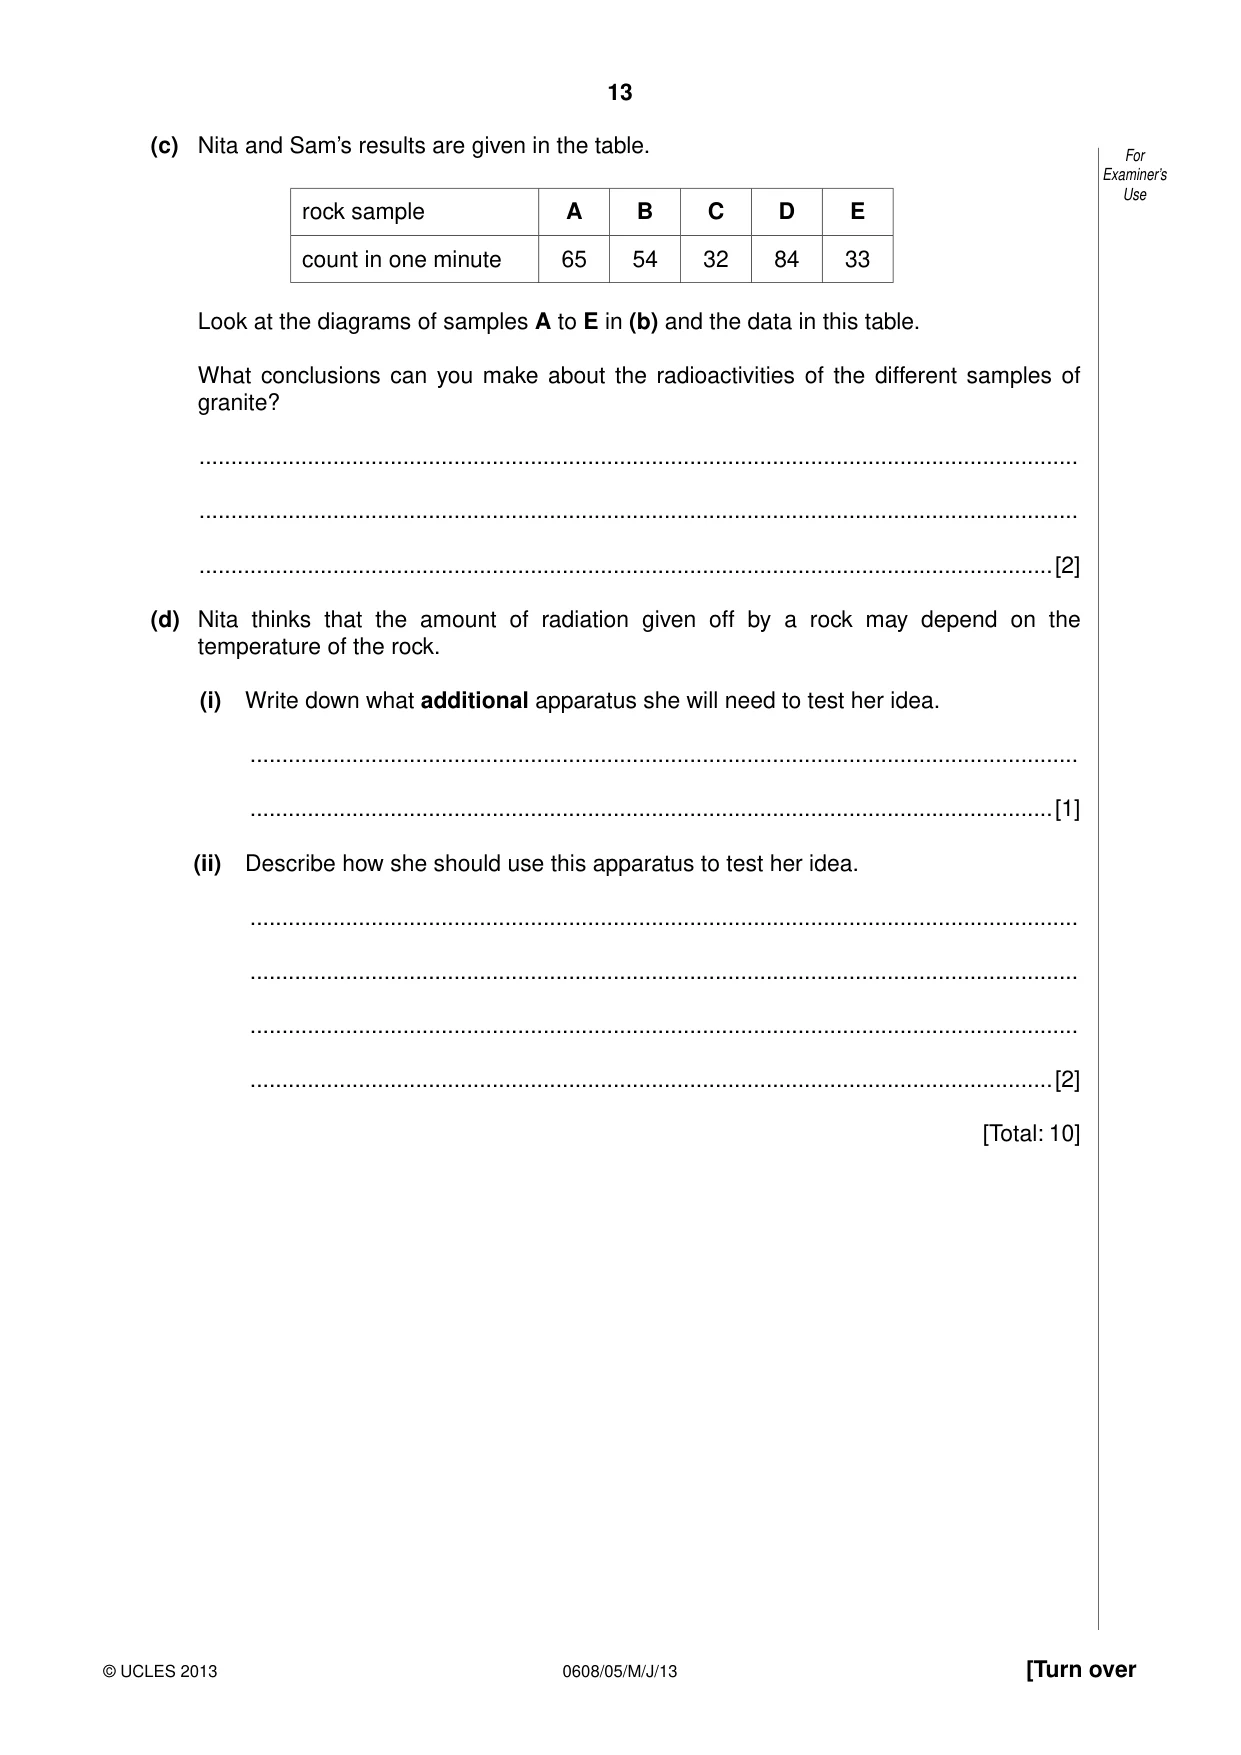
13 0608/05/M/J/13 © UCLES 2013 [Turn over For Examiner’s Use (c) Nita and Sam’s results are given in the table. rock sample A B C D E count in one minute 65 54 32 84 33 Look at the diagrams of samples A to E in (b) and the data in this table. What conclusions can you make about the radioactivities of the different samples of granite? … … …[2] (d) Nita thinks that the amount of radiation given off by a rock may depend on the temperature of the rock. (i) Write down what additional apparatus she will need to test her idea. … …[1] (ii) Describe how she should use this apparatus to test her idea. … … … …[2] [Total: 10]
Question paper, page 14
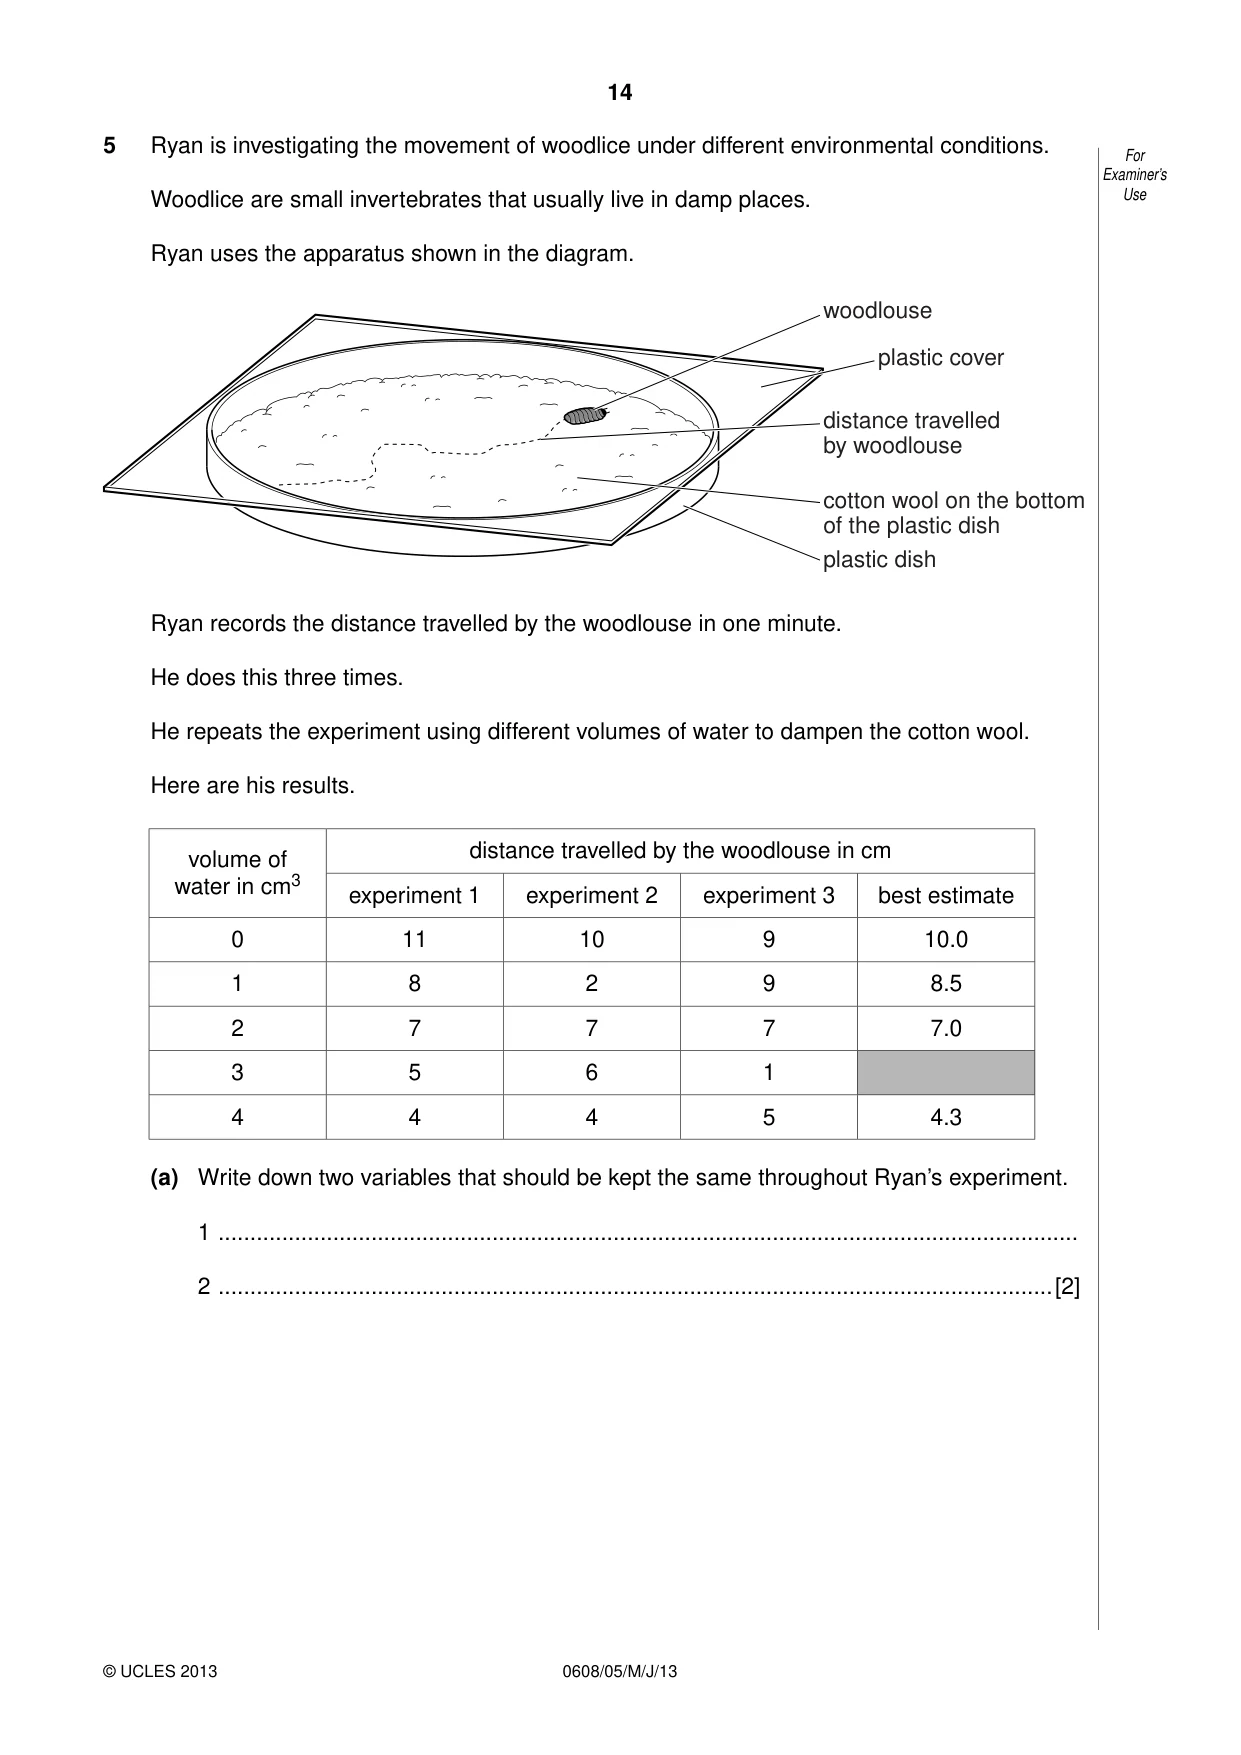
14 0608/05/M/J/13 © UCLES 2013 For Examiner’s Use 5 Ryan is investigating the movement of woodlice under different environmental conditions. Woodlice are small invertebrates that usually live in damp places. Ryan uses the apparatus shown in the diagram. woodlouse plastic cover distance travelled by woodlouse plastic dish cotton wool on the bottom of the plastic dish Ryan records the distance travelled by the woodlouse in one minute. He does this three times. He repeats the experiment using different volumes of water to dampen the cotton wool. Here are his results. volume of water in cm3 distance travelled by the woodlouse in cm experiment 1 experiment 2 experiment 3 best estimate 0 11 10 9 10.0 1 8 2 9 8.5 2 7 7 7 7.0 3 5 6 1 4 4 4 5 4.3 (a) Write down two variables that should be kept the same throughout Ryan’s experiment. 1 … 2 …[2]
Question paper, page 15
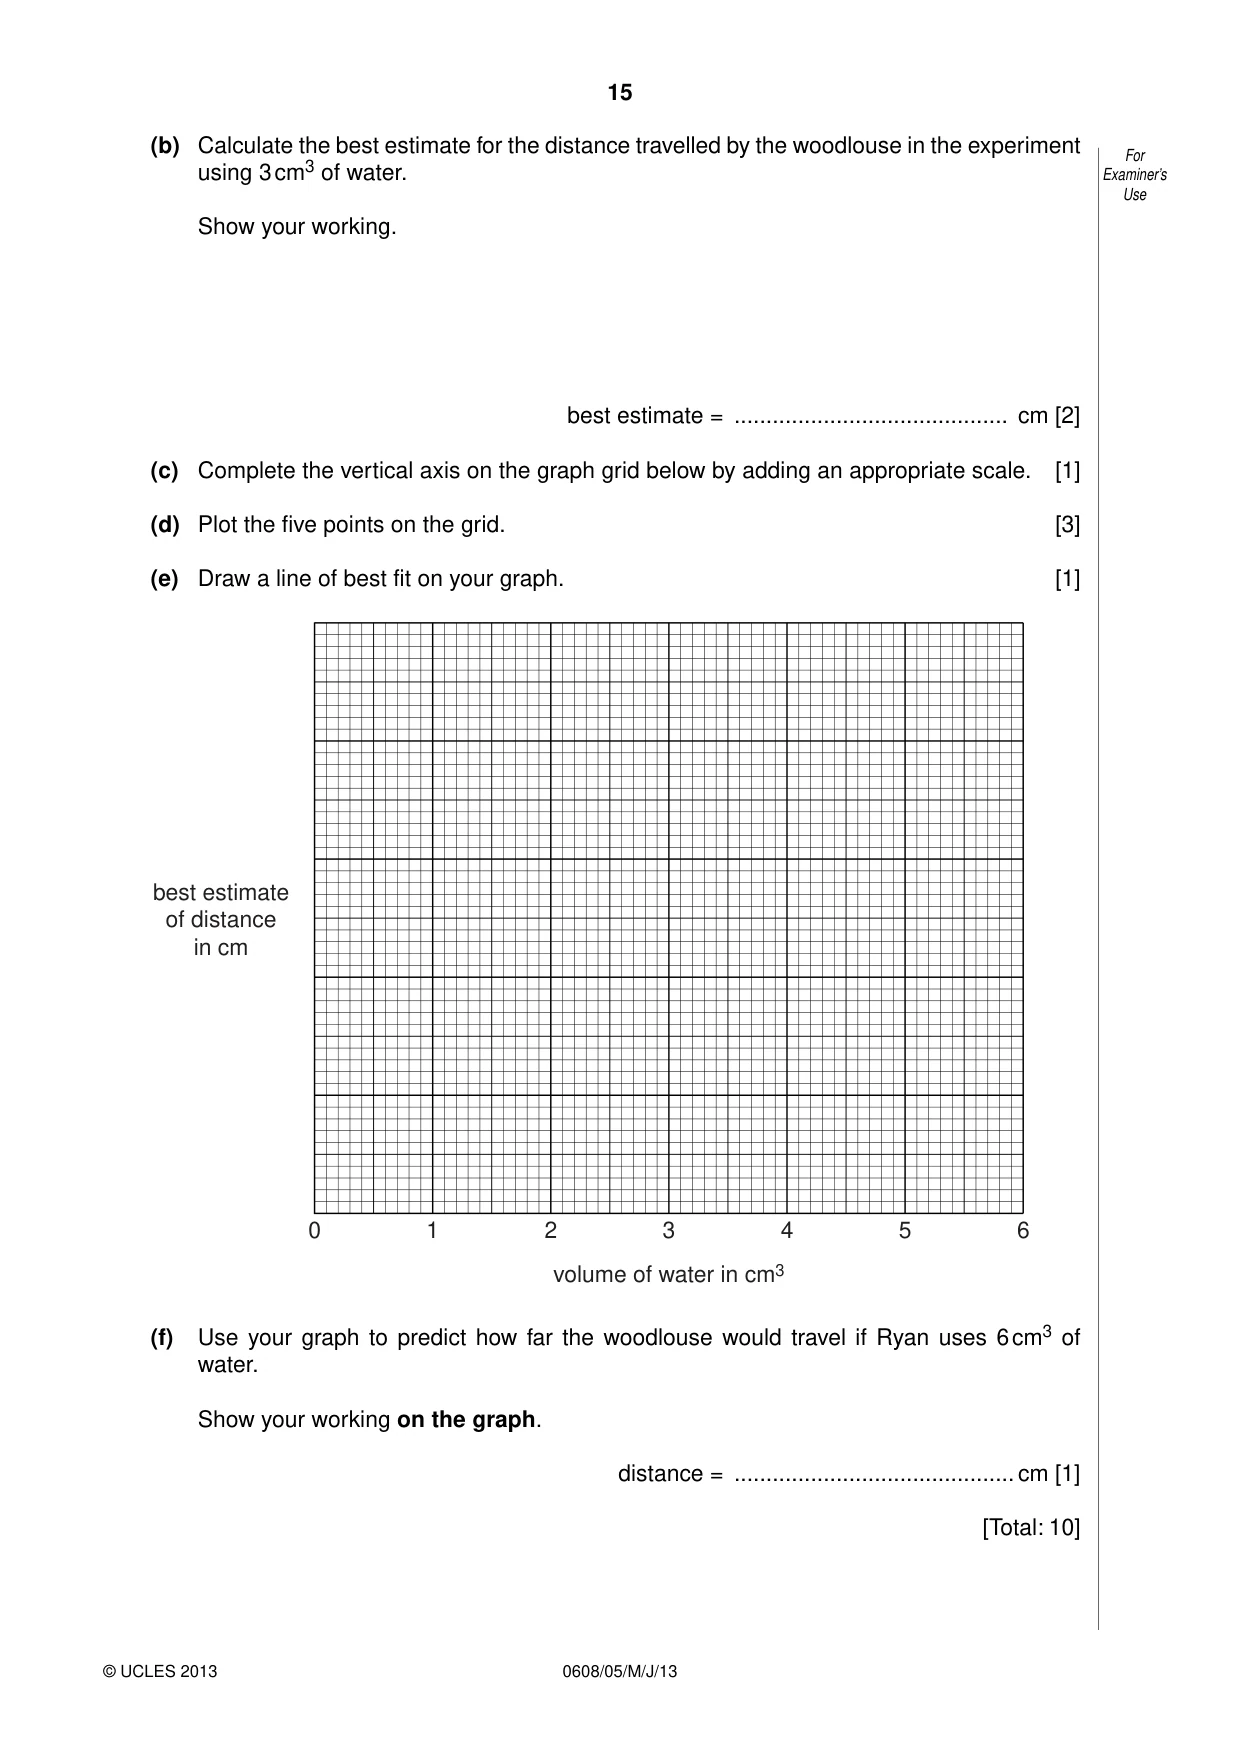
15 0608/05/M/J/13 © UCLES 2013 For Examiner’s Use (b) Calculate the best estimate for the distance travelled by the woodlouse in the experiment using 3 cm3 of water. Show your working. best estimate = … cm [2] (c) Complete the vertical axis on the graph grid below by adding an appropriate scale. [1] (d) Plot the five points on the grid. [3] (e) Draw a line of best fit on your graph. [1] 0 1 2 3 volume of water in cm3 best estimate of distance in cm 4 5 6 (f) Use your graph to predict how far the woodlouse would travel if Ryan uses 6 cm3 of water. Show your working on the graph. distance = … cm [1] [Total: 10]
Question paper, page 16
16 0608/05/M/J/13 © UCLES 2013 Permission to reproduce items where third-party owned material protected by copyright is included has been sought and cleared where possible. Every reasonable effort has been made by the publisher (UCLES) to trace copyright holders, but if any items requiring clearance have unwittingly been included, the publisher will be pleased to make amends at the earliest possible opportunity. University of Cambridge International Examinations is part of the Cambridge Assessment Group. Cambridge Assessment is the brand name of University of Cambridge Local Examinations Syndicate (UCLES), which is itself a department of the University of Cambridge. BLANK PAGE
Mark scheme, page 1
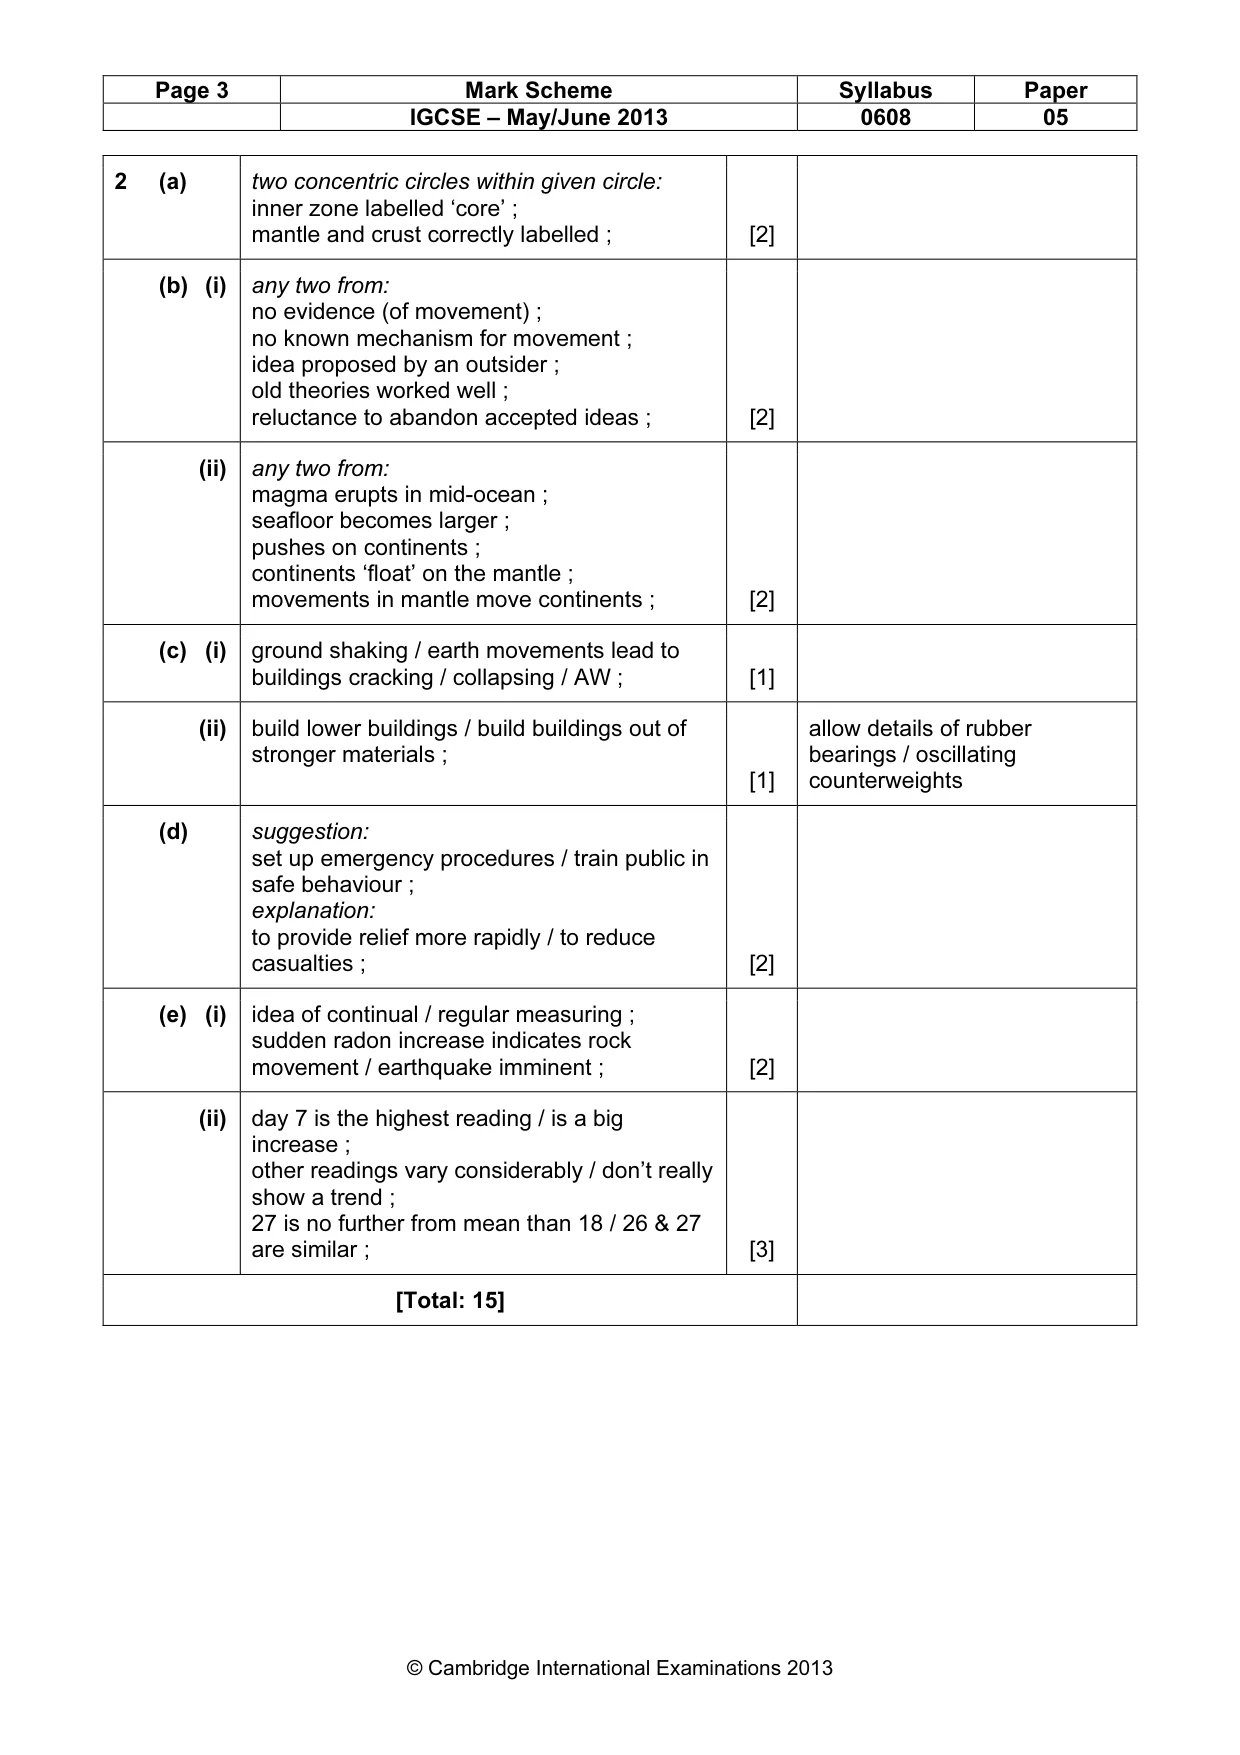
CAMBRIDGE INTERNATIONAL EXAMINATIONS International General Certificate of Secondary Education MARK SCHEME for the May/June 2013 series 0608 TWENTY FIRST CENTURY SCIENCE 0608/05 Paper 5 (Analysis and Interpretation), maximum raw mark 60 This mark scheme is published as an aid to teachers and candidates, to indicate the requirements of the examination. It shows the basis on which Examiners were instructed to award marks. It does not indicate the details of the discussions that took place at an Examiners’ meeting before marking began, which would have considered the acceptability of alternative answers. Mark schemes should be read in conjunction with the question paper and the Principal Examiner Report for Teachers. Cambridge will not enter into discussions about these mark schemes. Cambridge is publishing the mark schemes for the May/June 2013 series for most IGCSE, GCE Advanced Level and Advanced Subsidiary Level components and some Ordinary Level components. www.XtremePapers.com
Mark scheme, page 2
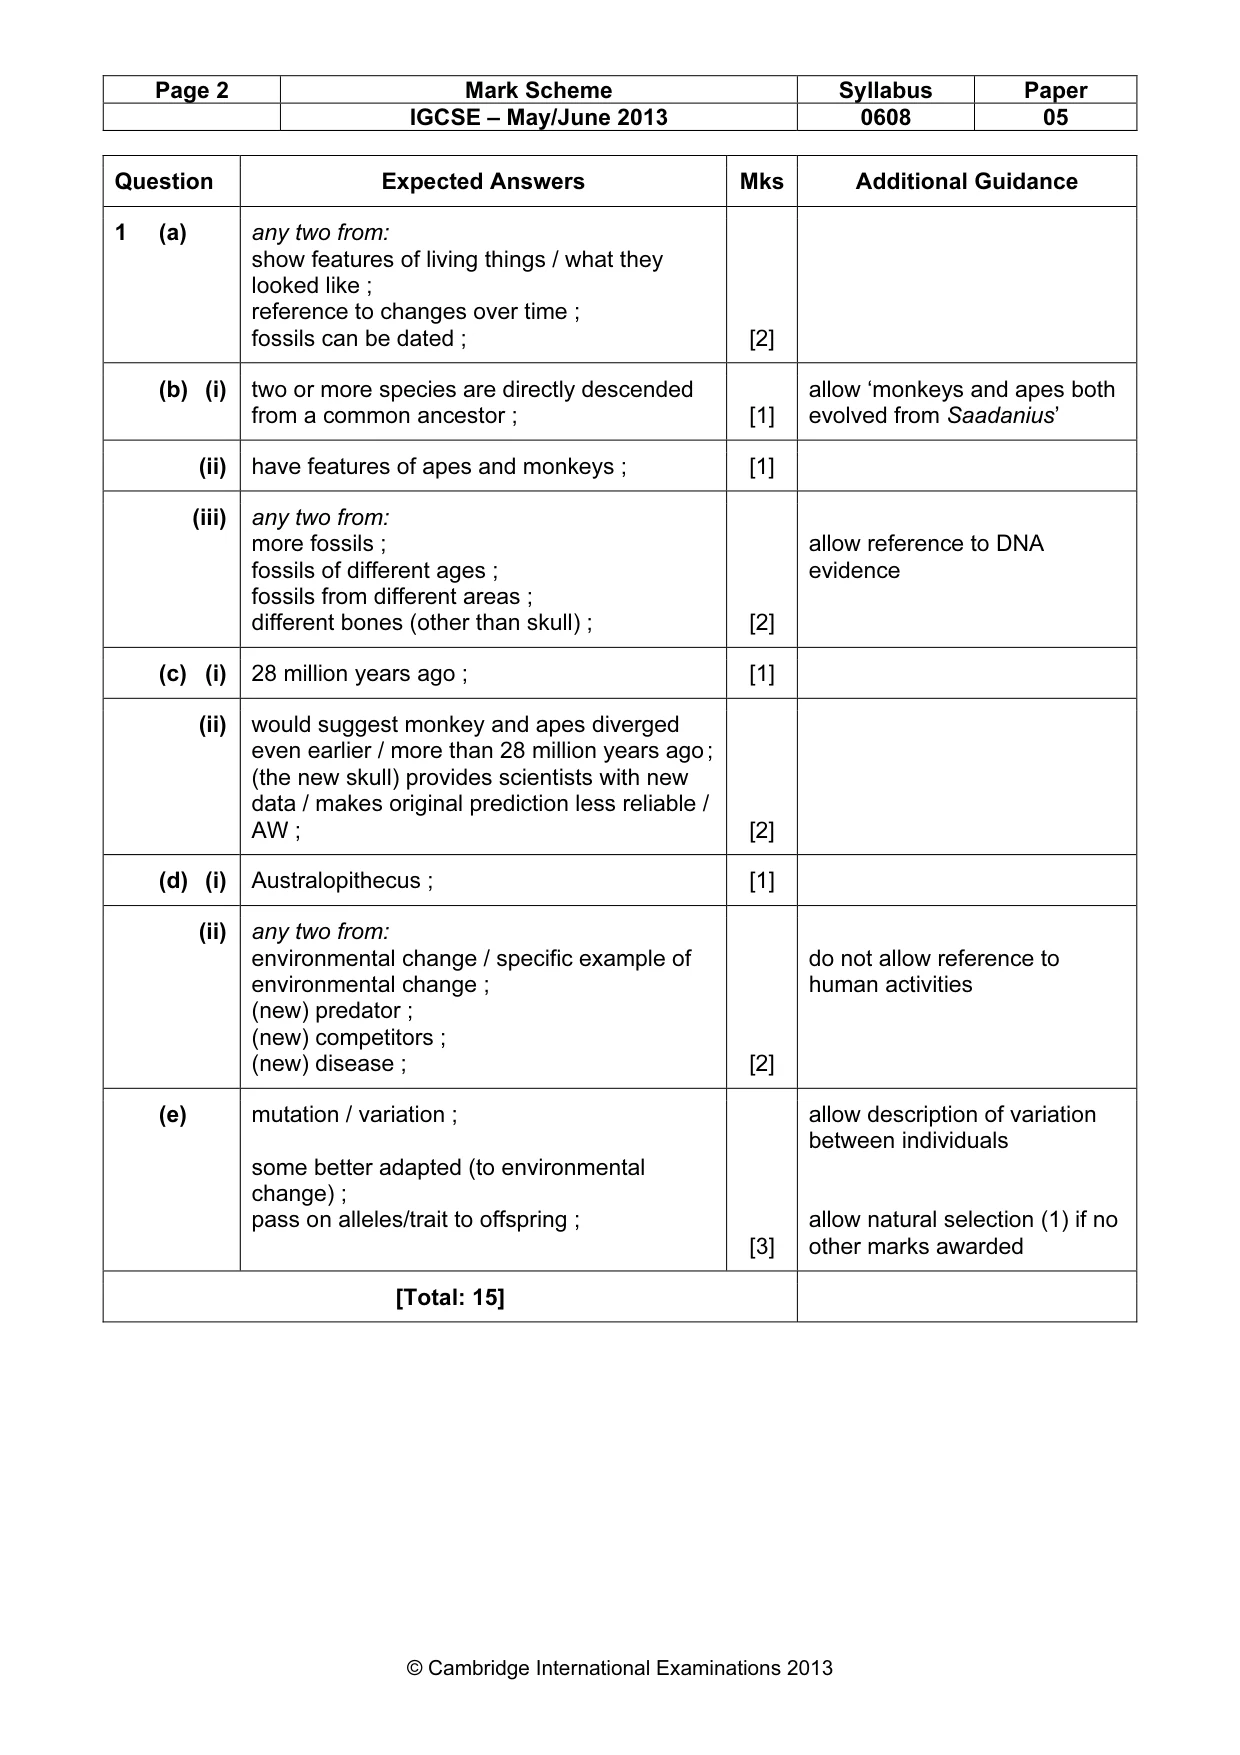
Page 2 Mark Scheme Syllabus Paper IGCSE – May/June 2013 0608 05 © Cambridge International Examinations 2013 Question Expected Answers Mks Additional Guidance 1 (a) any two from: show features of living things / what they looked like ; reference to changes over time ; fossils can be dated ; [2] (b) (i) two or more species are directly descended from a common ancestor ; [1] allow ‘monkeys and apes both evolved from Saadanius’ (ii) have features of apes and monkeys ; [1] (iii) any two from: more fossils ; fossils of different ages ; fossils from different areas ; different bones (other than skull) ; [2] allow reference to DNA evidence (c) (i) 28 million years ago ; [1] (ii) would suggest monkey and apes diverged even earlier / more than 28 million years ago ; (the new skull) provides scientists with new data / makes original prediction less reliable / AW ; [2] (d) (i) Australopithecus ; [1] (ii) any two from: environmental change / specific example of environmental change ; (new) predator ; (new) competitors ; (new) disease ; [2] do not allow reference to human activities (e) mutation / variation ; some better adapted (to environmental change) ; pass on alleles/trait to offspring ; [3] allow description of variation between individuals allow natural selection (1) if no other marks awarded [Total: 15]
Mark scheme, page 3
Page 3 Mark Scheme Syllabus Paper IGCSE – May/June 2013 0608 05 © Cambridge International Examinations 2013 2 (a) two concentric circles within given circle: inner zone labelled ‘core’ ; mantle and crust correctly labelled ; [2] (b) (i) any two from: no evidence (of movement) ; no known mechanism for movement ; idea proposed by an outsider ; old theories worked well ; reluctance to abandon accepted ideas ; [2] (ii) any two from: magma erupts in mid-ocean ; seafloor becomes larger ; pushes on continents ; continents ‘float’ on the mantle ; movements in mantle move continents ; [2] (c) (i) ground shaking / earth movements lead to buildings cracking / collapsing / AW ; [1] (ii) build lower buildings / build buildings out of stronger materials ; [1] allow details of rubber bearings / oscillating counterweights (d) suggestion: set up emergency procedures / train public in safe behaviour ; explanation: to provide relief more rapidly / to reduce casualties ; [2] (e) (i) idea of continual / regular measuring ; sudden radon increase indicates rock movement / earthquake imminent ; [2] (ii) day 7 is the highest reading / is a big increase ; other readings vary considerably / don’t really show a trend ; 27 is no further from mean than 18 / 26 & 27 are similar ; [3] [Total: 15]
Mark scheme, page 4
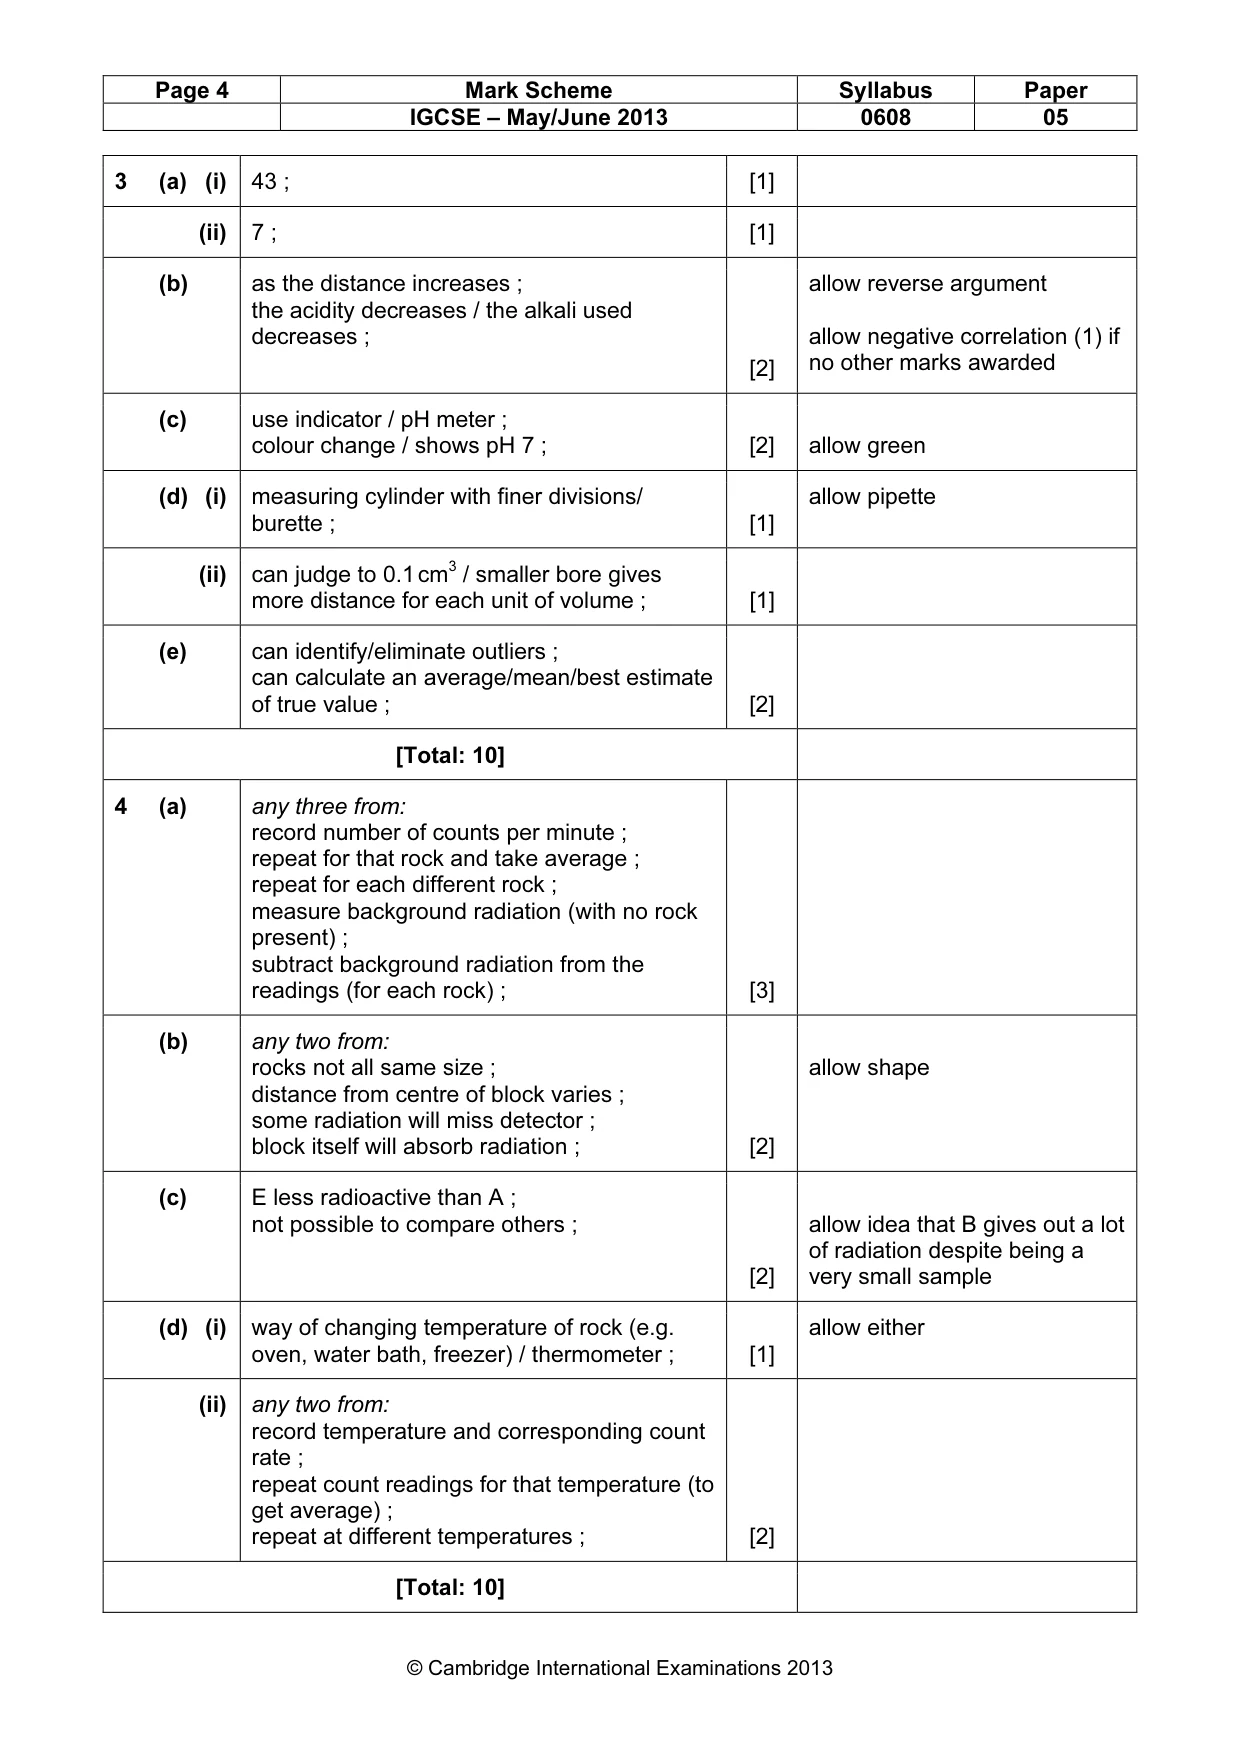
Page 4 Mark Scheme Syllabus Paper IGCSE – May/June 2013 0608 05 © Cambridge International Examinations 2013 3 (a) (i) 43 ; [1] (ii) 7 ; [1] (b) as the distance increases ; the acidity decreases / the alkali used decreases ; [2] allow reverse argument allow negative correlation (1) if no other marks awarded (c) use indicator / pH meter ; colour change / shows pH 7 ; [2] allow green (d) (i) measuring cylinder with finer divisions/ burette ; [1] allow pipette (ii) can judge to 0.1 cm3 / smaller bore gives more distance for each unit of volume ; [1] (e) can identify/eliminate outliers ; can calculate an average/mean/best estimate of true value ; [2] [Total: 10] 4 (a) any three from: record number of counts per minute ; repeat for that rock and take average ; repeat for each different rock ; measure background radiation (with no rock present) ; subtract background radiation from the readings (for each rock) ; [3] (b) any two from: rocks not all same size ; distance from centre of block varies ; some radiation will miss detector ; block itself will absorb radiation ; [2] allow shape (c) E less radioactive than A ; not possible to compare others ; [2] allow idea that B gives out a lot of radiation despite being a very small sample (d) (i) way of changing temperature of rock (e.g. oven, water bath, freezer) / thermometer ; [1] allow either (ii) any two from: record temperature and corresponding count rate ; repeat count readings for that temperature (to get average) ; repeat at different temperatures ; [2] [Total: 10]
Mark scheme, page 5
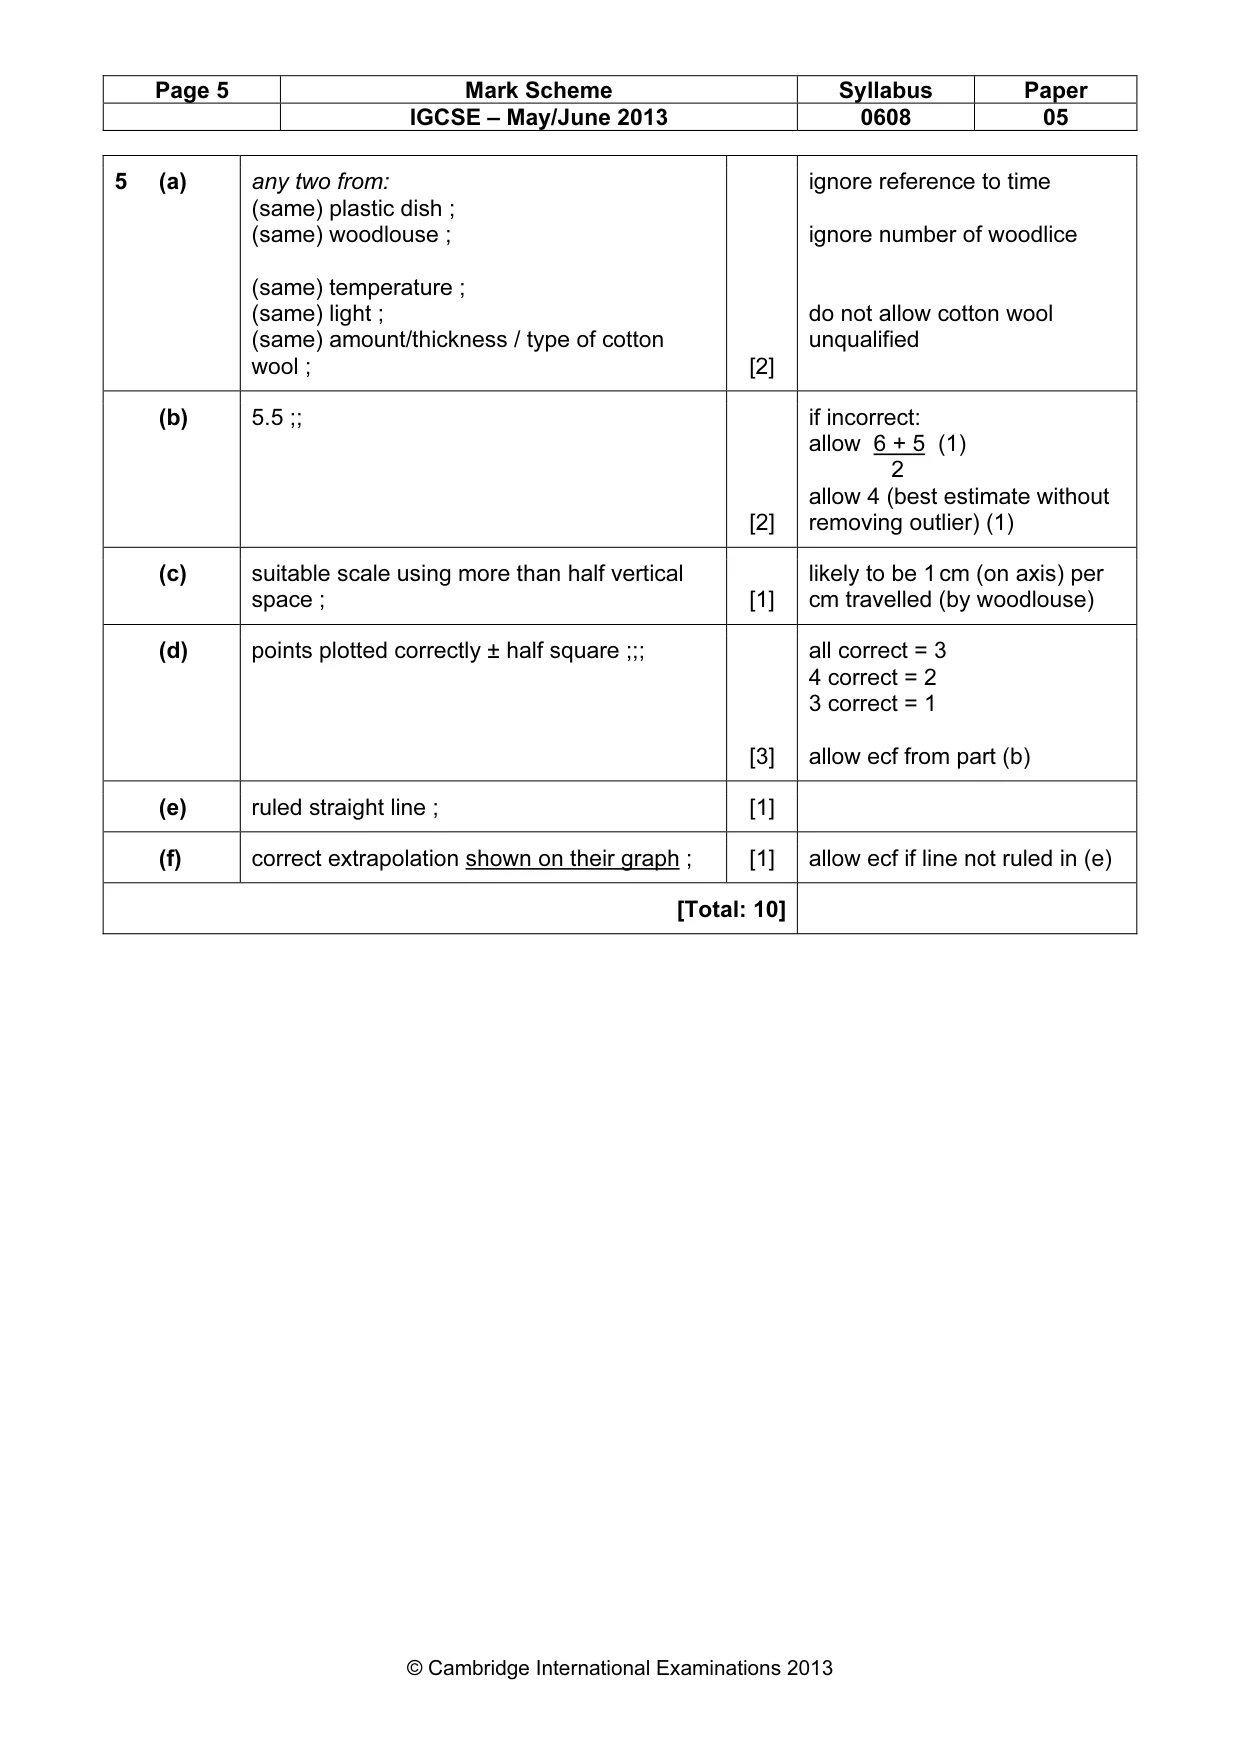
Page 5 Mark Scheme Syllabus Paper IGCSE – May/June 2013 0608 05 © Cambridge International Examinations 2013 5 (a) any two from: (same) plastic dish ; (same) woodlouse ; (same) temperature ; (same) light ; (same) amount/thickness / type of cotton wool ; [2] ignore reference to time ignore number of woodlice do not allow cotton wool unqualified (b) 5.5 ;; [2] if incorrect: allow 6 + 5 (1) 2 allow 4 (best estimate without removing outlier) (1) (c) suitable scale using more than half vertical space ; [1] likely to be 1 cm (on axis) per cm travelled (by woodlouse) (d) points plotted correctly ± half square ;;; [3] all correct = 3 4 correct = 2 3 correct = 1 allow ecf from part (b) (e) ruled straight line ; [1] (f) correct extrapolation shown on their graph ; [1] allow ecf if line not ruled in (e) [Total: 10]
What you needed in this session
Cambridge’s own grade thresholds for 2013 May/June, Paper 5 · Variant 1. A higher threshold means an easier paper — the bar moves with how the cohort did.