Cambridge IGCSE Twenty-First Century Science 0608 — 2012 May/June Paper 5 · Variant 1
0608/51/M/J/12 · 60 marks · ≈68 min
The question paper and its mark scheme, free to read here and free to download. This is Cambridge’s own paper, exactly as it was sat.
Question paper16 pages



Mark scheme6 pages
Answers below. Sit the paper first if you are practising.
Paper as text
Question paper, page 1
This document consists of 13 printed pages and 3 blank pages. DC (CW/SW) 51297/2 © UCLES 2012 [Turn over UNIVERSITY OF CAMBRIDGE INTERNATIONAL EXAMINATIONS International General Certificate of Secondary Education * 3 3 0 5 4 0 3 1 2 8 * TWENTY FIRST CENTURY SCIENCE 0608/05 Paper 5 May/June 2012 1 hour 30 minutes Candidates answer on the Question Paper. No Additional Materials are required. READ THESE INSTRUCTIONS FIRST Write your Centre number, candidate number and name on all the work you hand in. Write in dark blue or black pen. You may use a pencil for any diagrams or graphs. Do not use staples, paper clips, highlighters, glue or correction fluid. DO NOT WRITE IN ANY BARCODES. Answer all questions. At the end of the examination, fasten all your work securely together. The number of marks is given in brackets [ ] at the end of each question or part question. For Examiner’s Use 1 2 3 4 Total www.XtremePapers.com
Question paper, page 2
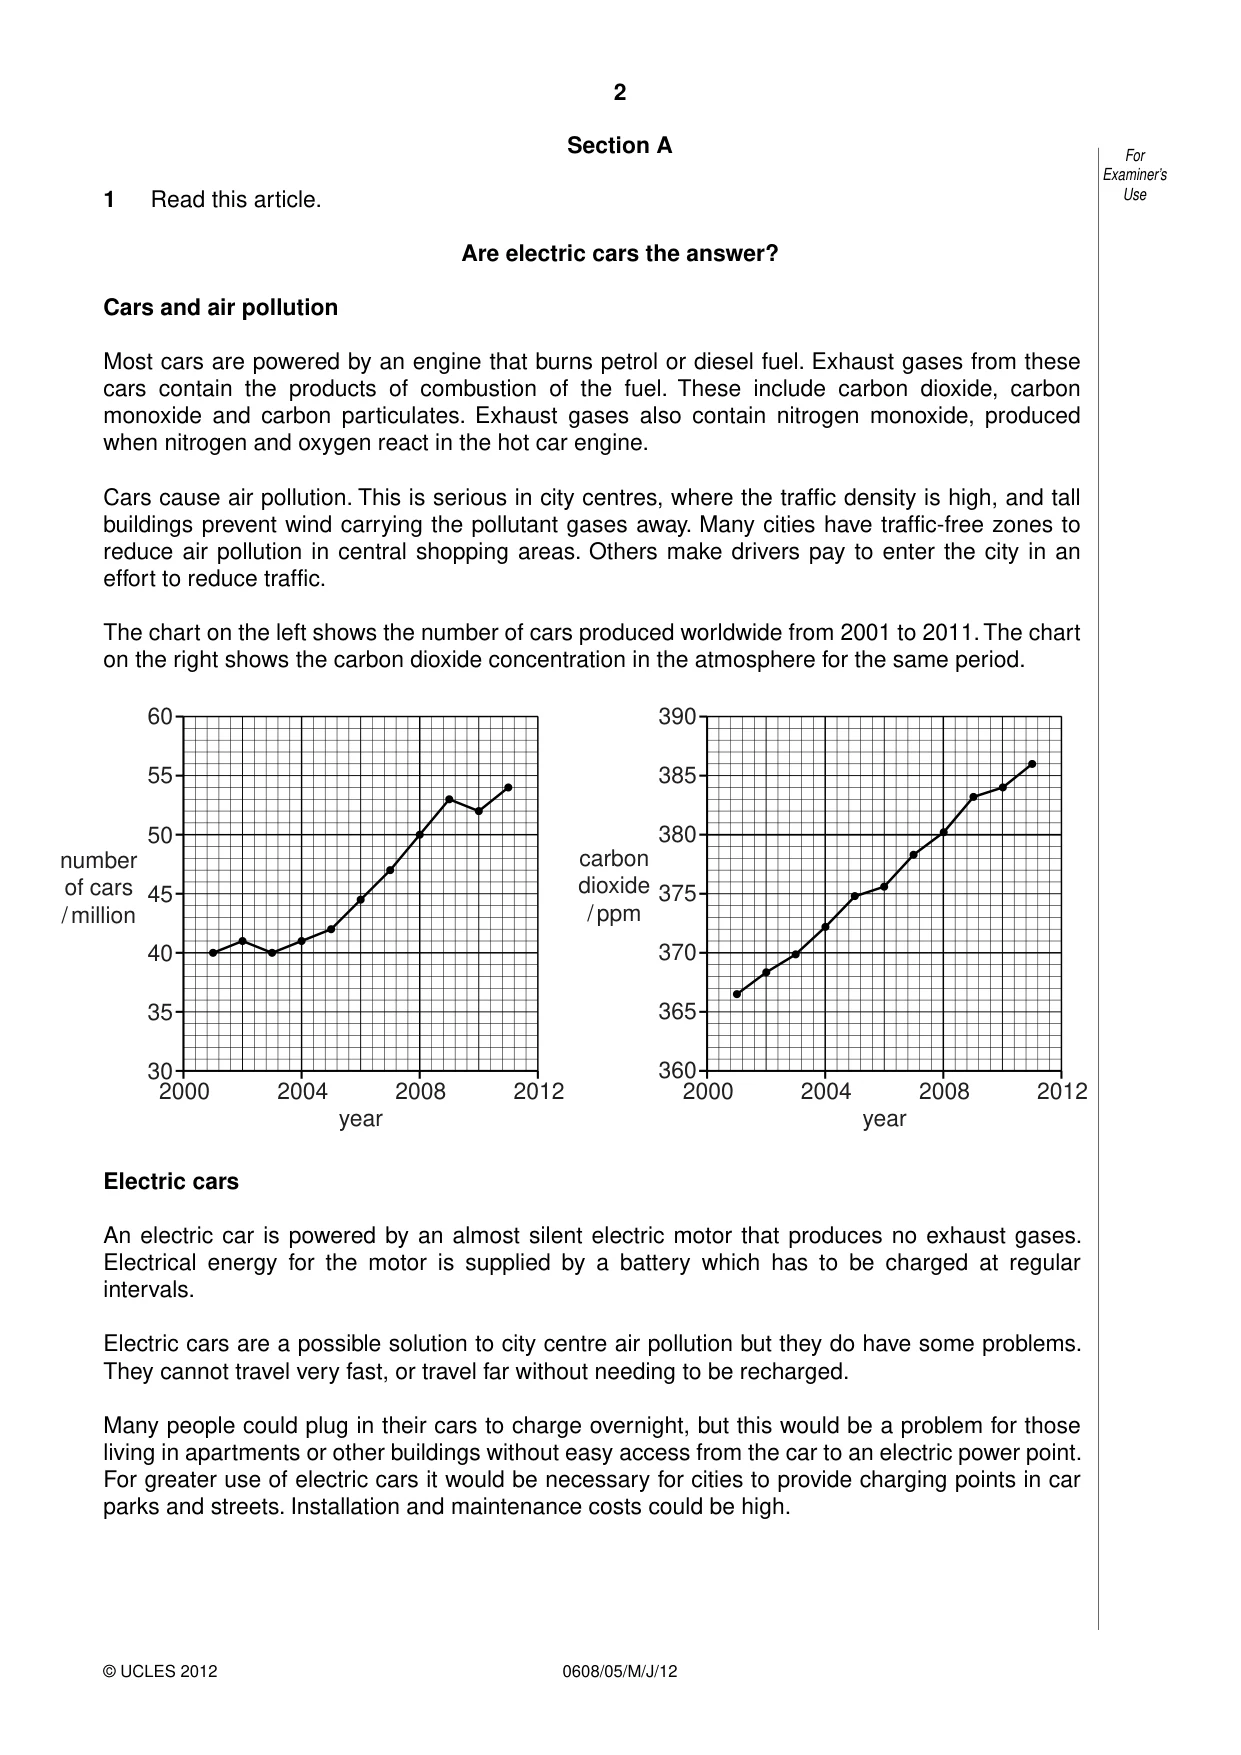
2 0608/05/M/J/12 © UCLES 2012 For Examiner’s Use Section A 1 Read this article. Are electric cars the answer? Cars and air pollution Most cars are powered by an engine that burns petrol or diesel fuel. Exhaust gases from these cars contain the products of combustion of the fuel. These include carbon dioxide, carbon monoxide and carbon particulates. Exhaust gases also contain nitrogen monoxide, produced when nitrogen and oxygen react in the hot car engine. Cars cause air pollution. This is serious in city centres, where the traffic density is high, and tall buildings prevent wind carrying the pollutant gases away. Many cities have traffic-free zones to reduce air pollution in central shopping areas. Others make drivers pay to enter the city in an effort to reduce traffic. The chart on the left shows the number of cars produced worldwide from 2001 to 2011. The chart on the right shows the carbon dioxide concentration in the atmosphere for the same period. 2000 30 35 40 45 50 number of cars / million 55 60 2004 2008 2012 2000 365 360 370 375 380 carbon dioxide / ppm 385 390 2004 year year 2008 2012 Electric cars An electric car is powered by an almost silent electric motor that produces no exhaust gases. Electrical energy for the motor is supplied by a battery which has to be charged at regular intervals. Electric cars are a possible solution to city centre air pollution but they do have some problems. They cannot travel very fast, or travel far without needing to be recharged. Many people could plug in their cars to charge overnight, but this would be a problem for those living in apartments or other buildings without easy access from the car to an electric power point. For greater use of electric cars it would be necessary for cities to provide charging points in car parks and streets. Installation and maintenance costs could be high.
Question paper, page 3
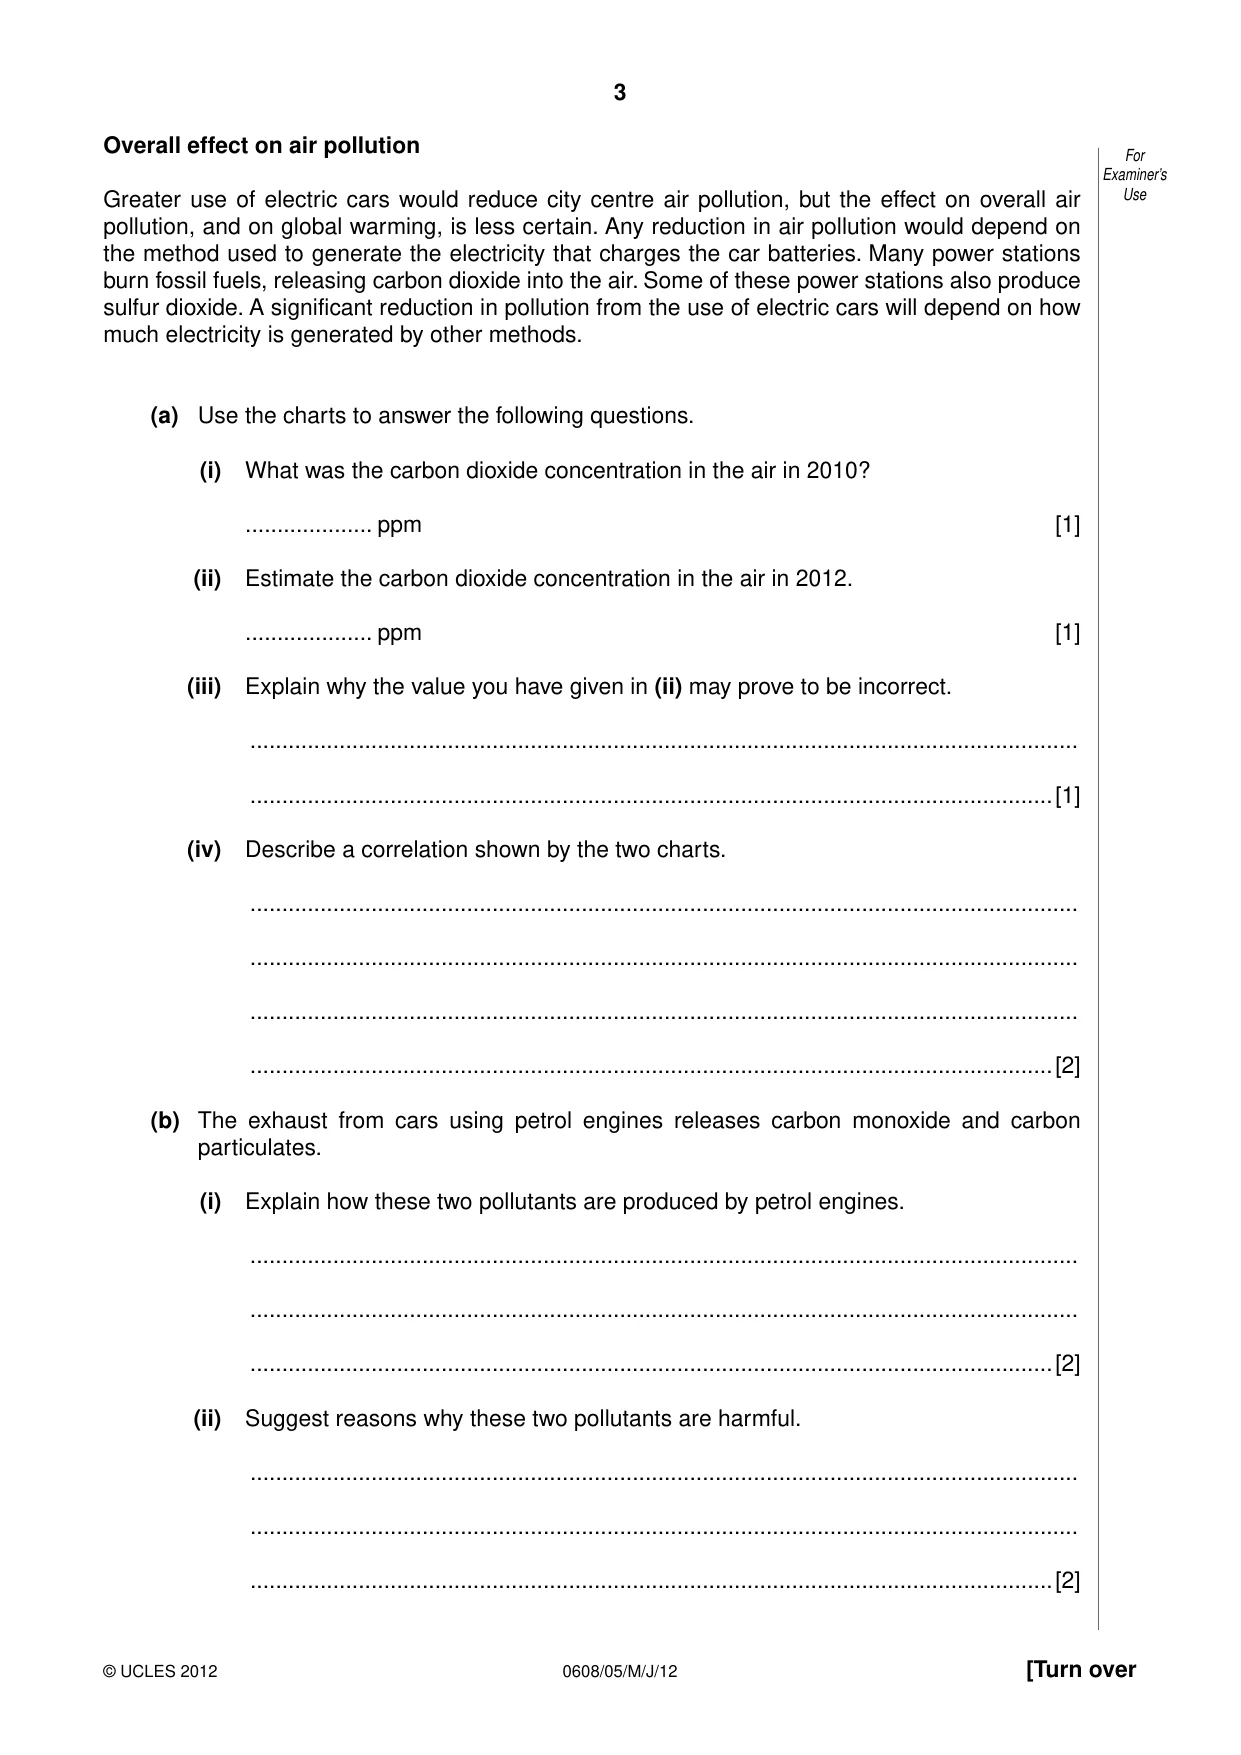
3 0608/05/M/J/12 © UCLES 2012 [Turn over For Examiner’s Use Overall effect on air pollution Greater use of electric cars would reduce city centre air pollution, but the effect on overall air pollution, and on global warming, is less certain. Any reduction in air pollution would depend on the method used to generate the electricity that charges the car batteries. Many power stations burn fossil fuels, releasing carbon dioxide into the air. Some of these power stations also produce sulfur dioxide. A significant reduction in pollution from the use of electric cars will depend on how much electricity is generated by other methods. (a) Use the charts to answer the following questions. (i) What was the carbon dioxide concentration in the air in 2010? … ppm [1] (ii) Estimate the carbon dioxide concentration in the air in 2012. … ppm [1] (iii) Explain why the value you have given in (ii) may prove to be incorrect. … …[1] (iv) Describe a correlation shown by the two charts. … … … …[2] (b) The exhaust from cars using petrol engines releases carbon monoxide and carbon particulates. (i) Explain how these two pollutants are produced by petrol engines. … … …[2] (ii) Suggest reasons why these two pollutants are harmful. … … …[2]
Question paper, page 4
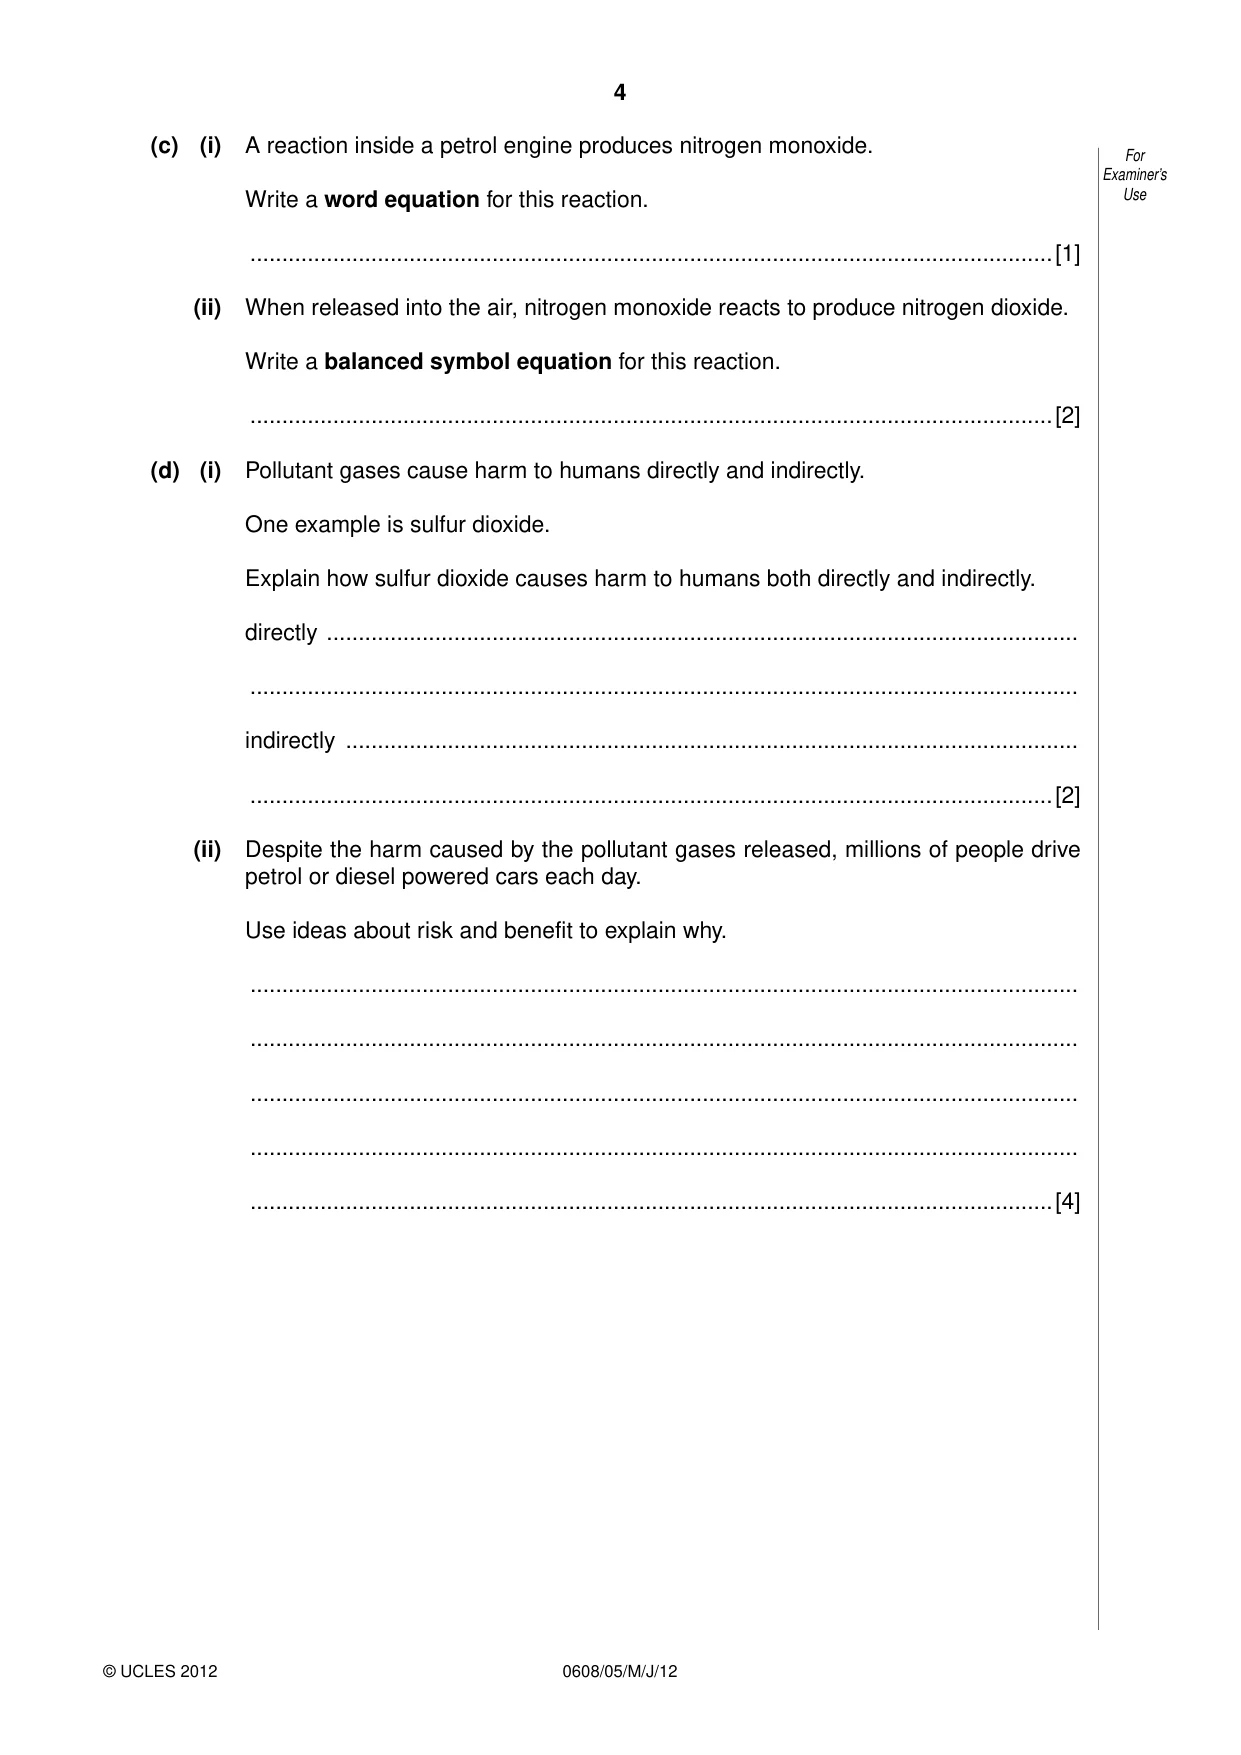
4 0608/05/M/J/12 © UCLES 2012 For Examiner’s Use (c) (i) A reaction inside a petrol engine produces nitrogen monoxide. Write a word equation for this reaction. …[1] (ii) When released into the air, nitrogen monoxide reacts to produce nitrogen dioxide. Write a balanced symbol equation for this reaction. …[2] (d) (i) Pollutant gases cause harm to humans directly and indirectly. One example is sulfur dioxide. Explain how sulfur dioxide causes harm to humans both directly and indirectly. directly … … indirectly … …[2] (ii) Despite the harm caused by the pollutant gases released, millions of people drive petrol or diesel powered cars each day. Use ideas about risk and benefit to explain why. … … … … …[4]
Question paper, page 5
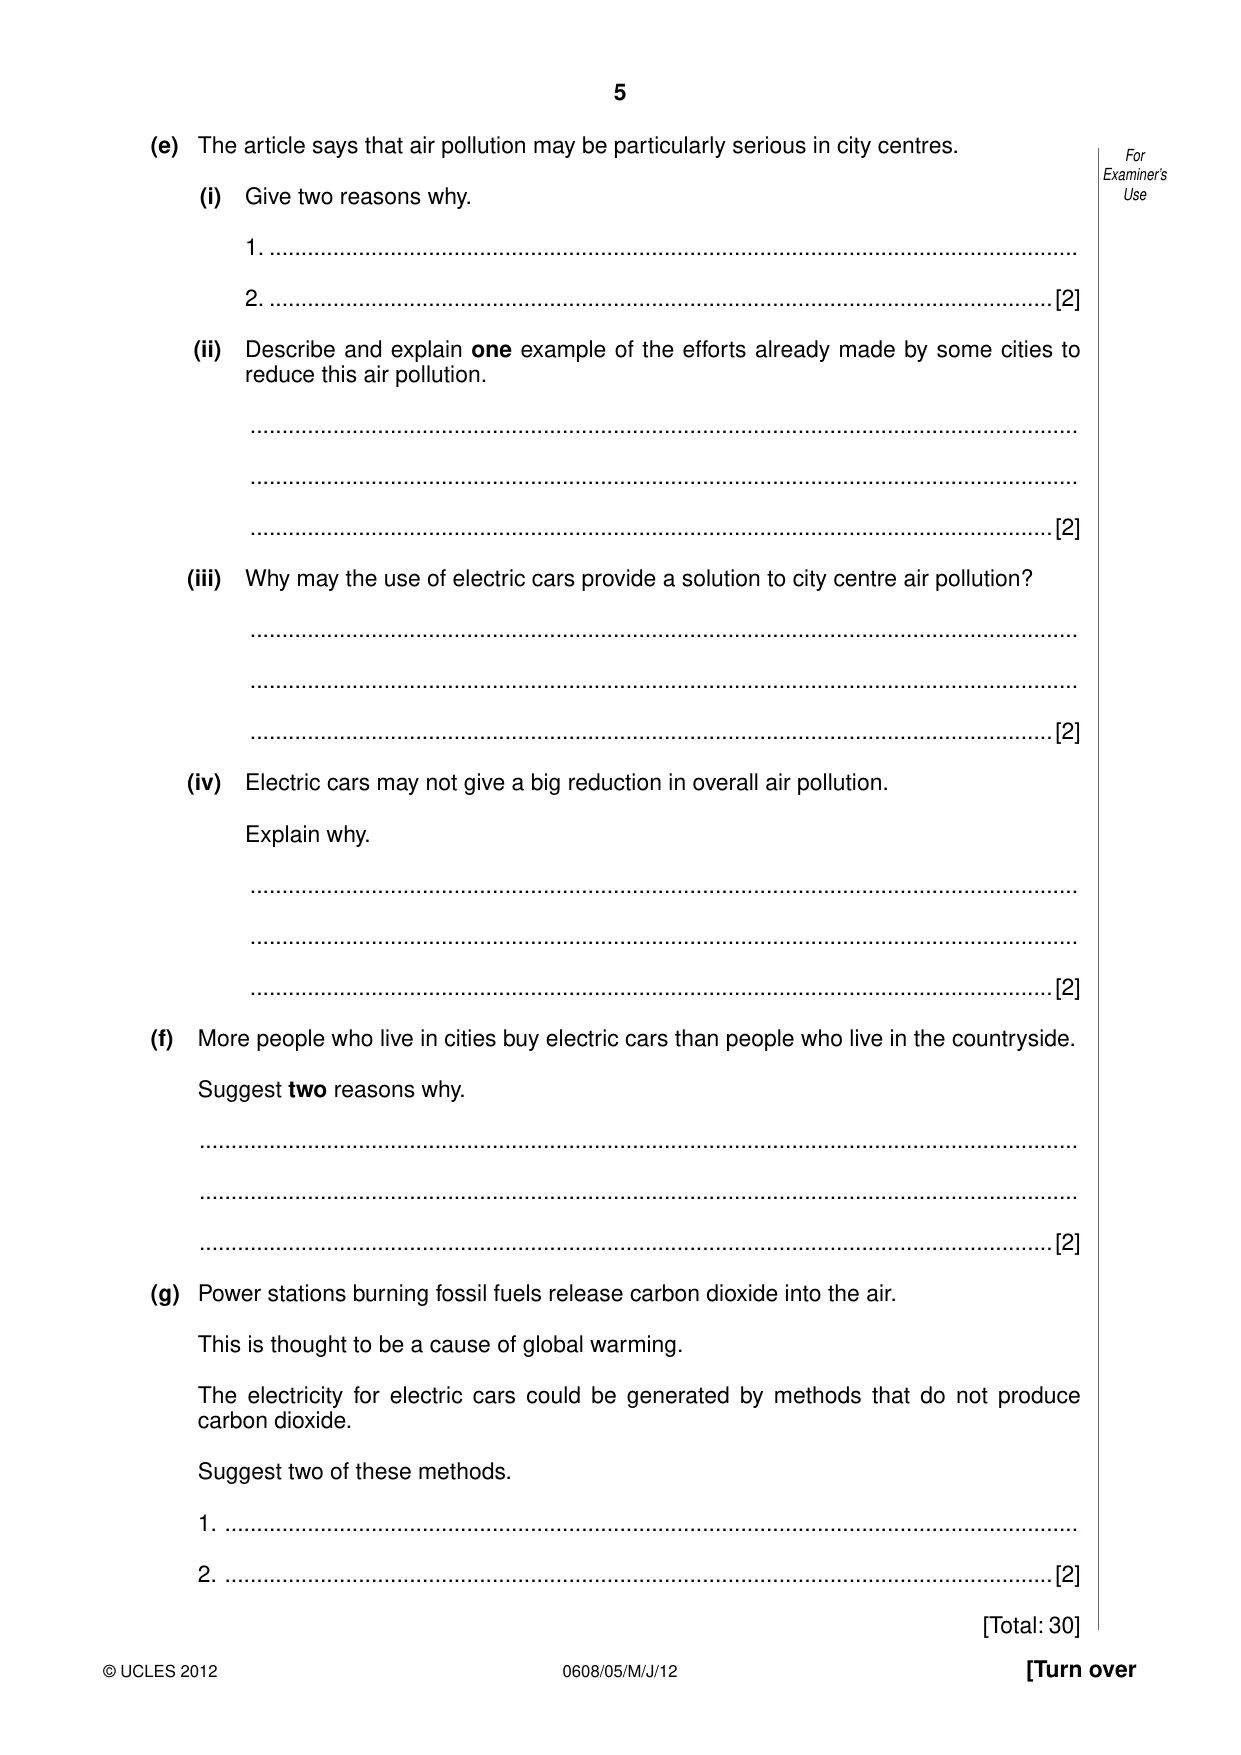
5 0608/05/M/J/12 © UCLES 2012 [Turn over For Examiner’s Use (e) The article says that air pollution may be particularly serious in city centres. (i) Give two reasons why. 1. … 2. …[2] (ii) Describe and explain one example of the efforts already made by some cities to reduce this air pollution. … … …[2] (iii) Why may the use of electric cars provide a solution to city centre air pollution? … … …[2] (iv) Electric cars may not give a big reduction in overall air pollution. Explain why. … … …[2] (f) More people who live in cities buy electric cars than people who live in the countryside. Suggest two reasons why. … … …[2] (g) Power stations burning fossil fuels release carbon dioxide into the air. This is thought to be a cause of global warming. The electricity for electric cars could be generated by methods that do not produce carbon dioxide. Suggest two of these methods. 1. … 2. …[2] [Total: 30]
Question paper, page 6
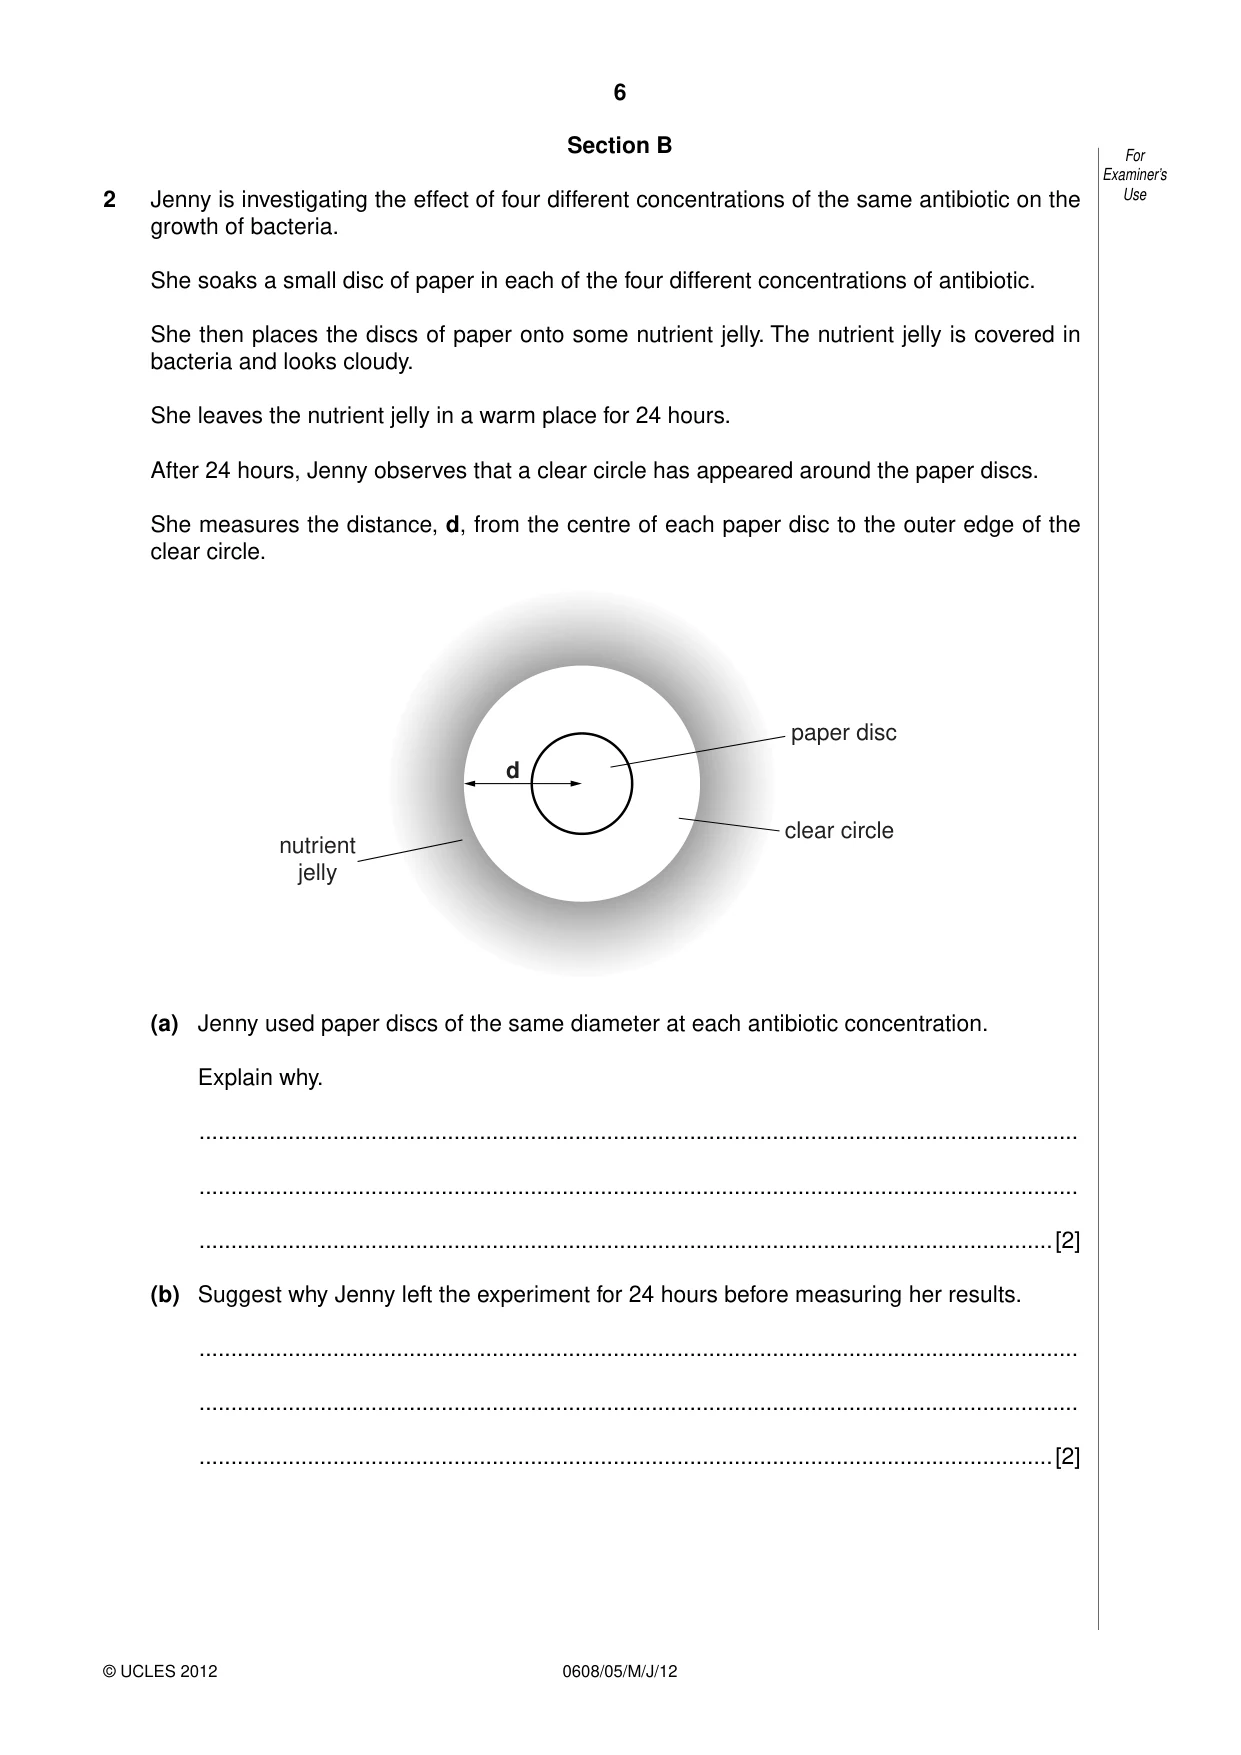
6 0608/05/M/J/12 © UCLES 2012 For Examiner’s Use Section B 2 Jenny is investigating the effect of four different concentrations of the same antibiotic on the growth of bacteria. She soaks a small disc of paper in each of the four different concentrations of antibiotic. She then places the discs of paper onto some nutrient jelly. The nutrient jelly is covered in bacteria and looks cloudy. She leaves the nutrient jelly in a warm place for 24 hours. After 24 hours, Jenny observes that a clear circle has appeared around the paper discs. She measures the distance, d, from the centre of each paper disc to the outer edge of the clear circle. d paper disc nutrient jelly clear circle (a) Jenny used paper discs of the same diameter at each antibiotic concentration. Explain why. … … …[2] (b) Suggest why Jenny left the experiment for 24 hours before measuring her results. … … …[2]
Question paper, page 7
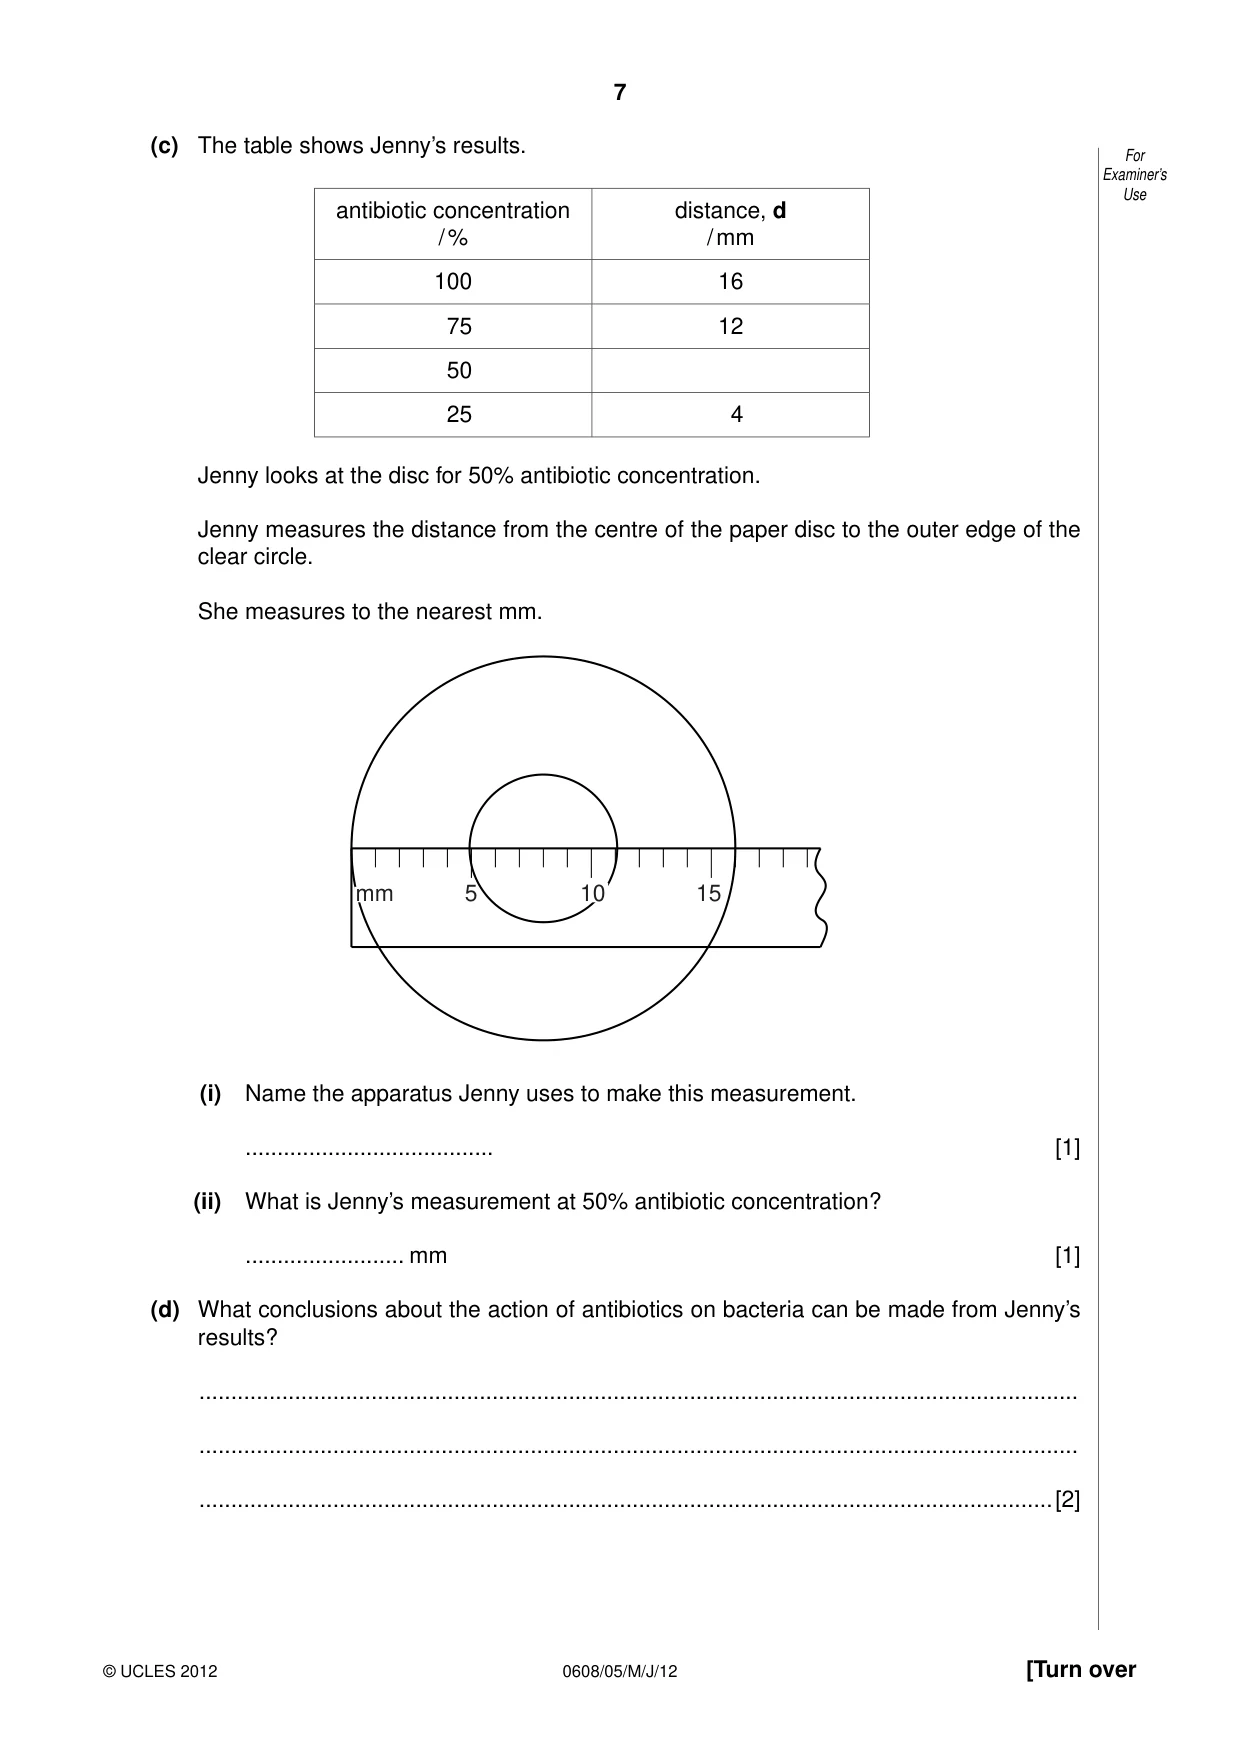
7 0608/05/M/J/12 © UCLES 2012 [Turn over For Examiner’s Use (c) The table shows Jenny’s results. antibiotic concentration / % distance, d / mm 100 16 75 12 50 25 4 Jenny looks at the disc for 50% antibiotic concentration. Jenny measures the distance from the centre of the paper disc to the outer edge of the clear circle. She measures to the nearest mm. 5 10 15 mm (i) Name the apparatus Jenny uses to make this measurement. … [1] (ii) What is Jenny’s measurement at 50% antibiotic concentration? … mm [1] (d) What conclusions about the action of antibiotics on bacteria can be made from Jenny’s results? … … …[2]
Question paper, page 8
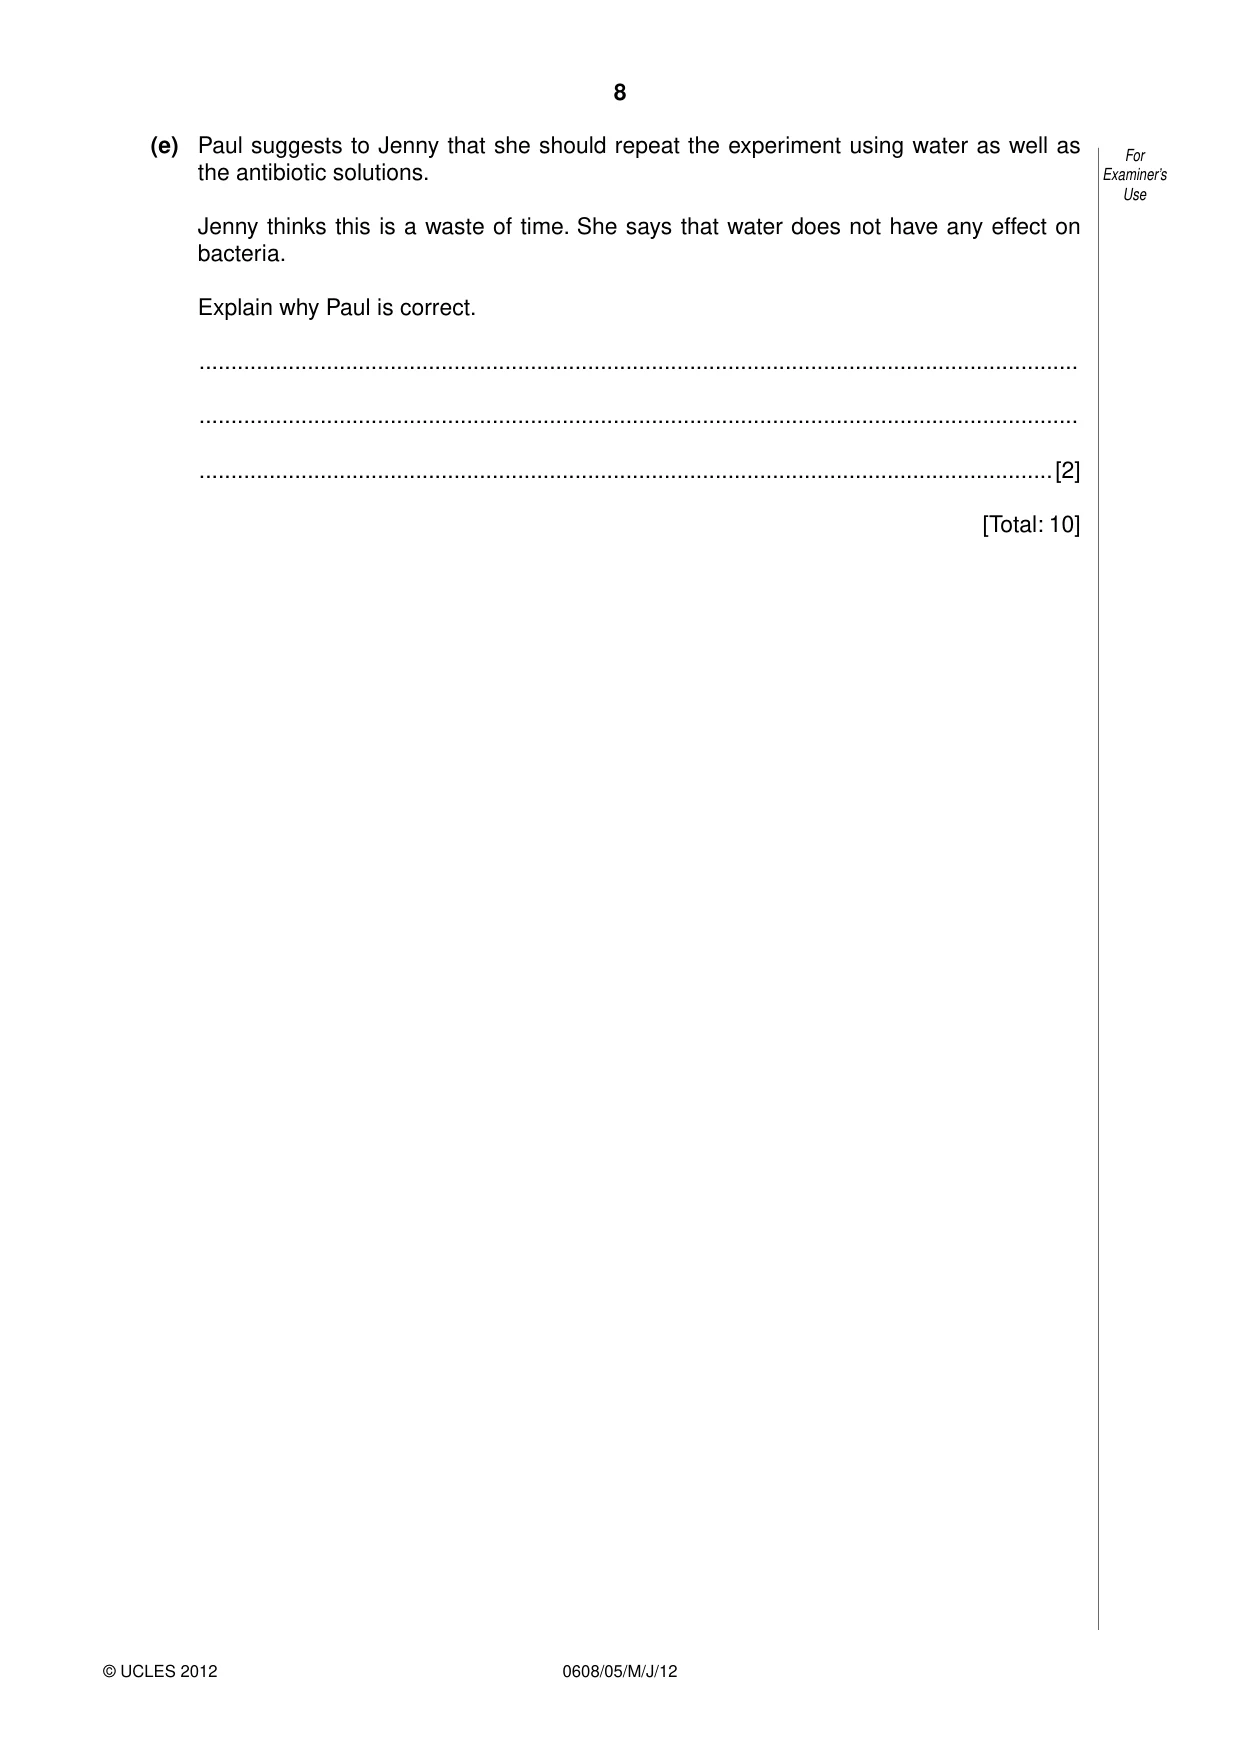
8 0608/05/M/J/12 © UCLES 2012 For Examiner’s Use (e) Paul suggests to Jenny that she should repeat the experiment using water as well as the antibiotic solutions. Jenny thinks this is a waste of time. She says that water does not have any effect on bacteria. Explain why Paul is correct. … … …[2] [Total: 10]
Question paper, page 9
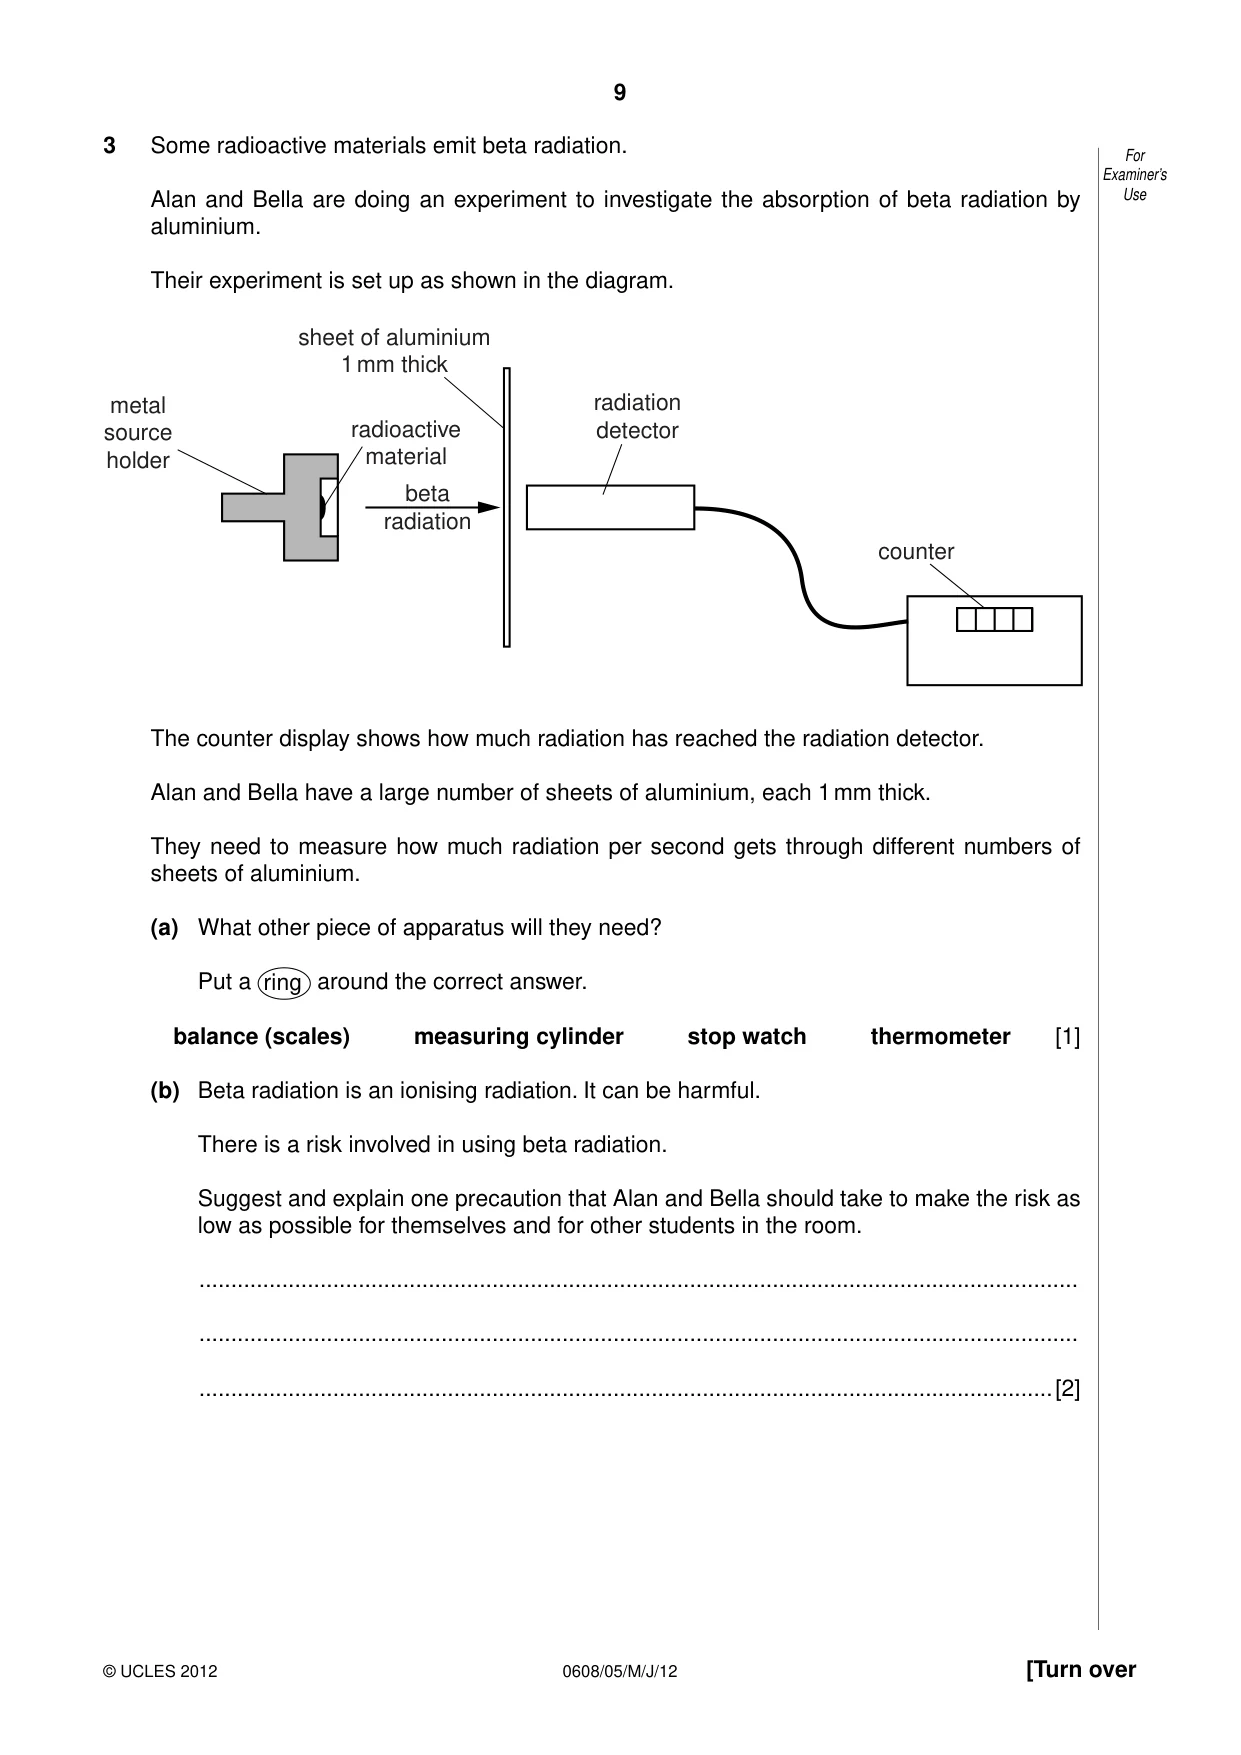
9 0608/05/M/J/12 © UCLES 2012 [Turn over For Examiner’s Use 3 Some radioactive materials emit beta radiation. Alan and Bella are doing an experiment to investigate the absorption of beta radiation by aluminium. Their experiment is set up as shown in the diagram. beta radiation sheet of aluminium 1 mm thick metal source holder radioactive material radiation detector counter The counter display shows how much radiation has reached the radiation detector. Alan and Bella have a large number of sheets of aluminium, each 1 mm thick. They need to measure how much radiation per second gets through different numbers of sheets of aluminium. (a) What other piece of apparatus will they need? Put a ring around the correct answer. balance (scales) measuring cylinder stop watch thermometer [1] (b) Beta radiation is an ionising radiation. It can be harmful. There is a risk involved in using beta radiation. Suggest and explain one precaution that Alan and Bella should take to make the risk as low as possible for themselves and for other students in the room. … … …[2]
Question paper, page 10
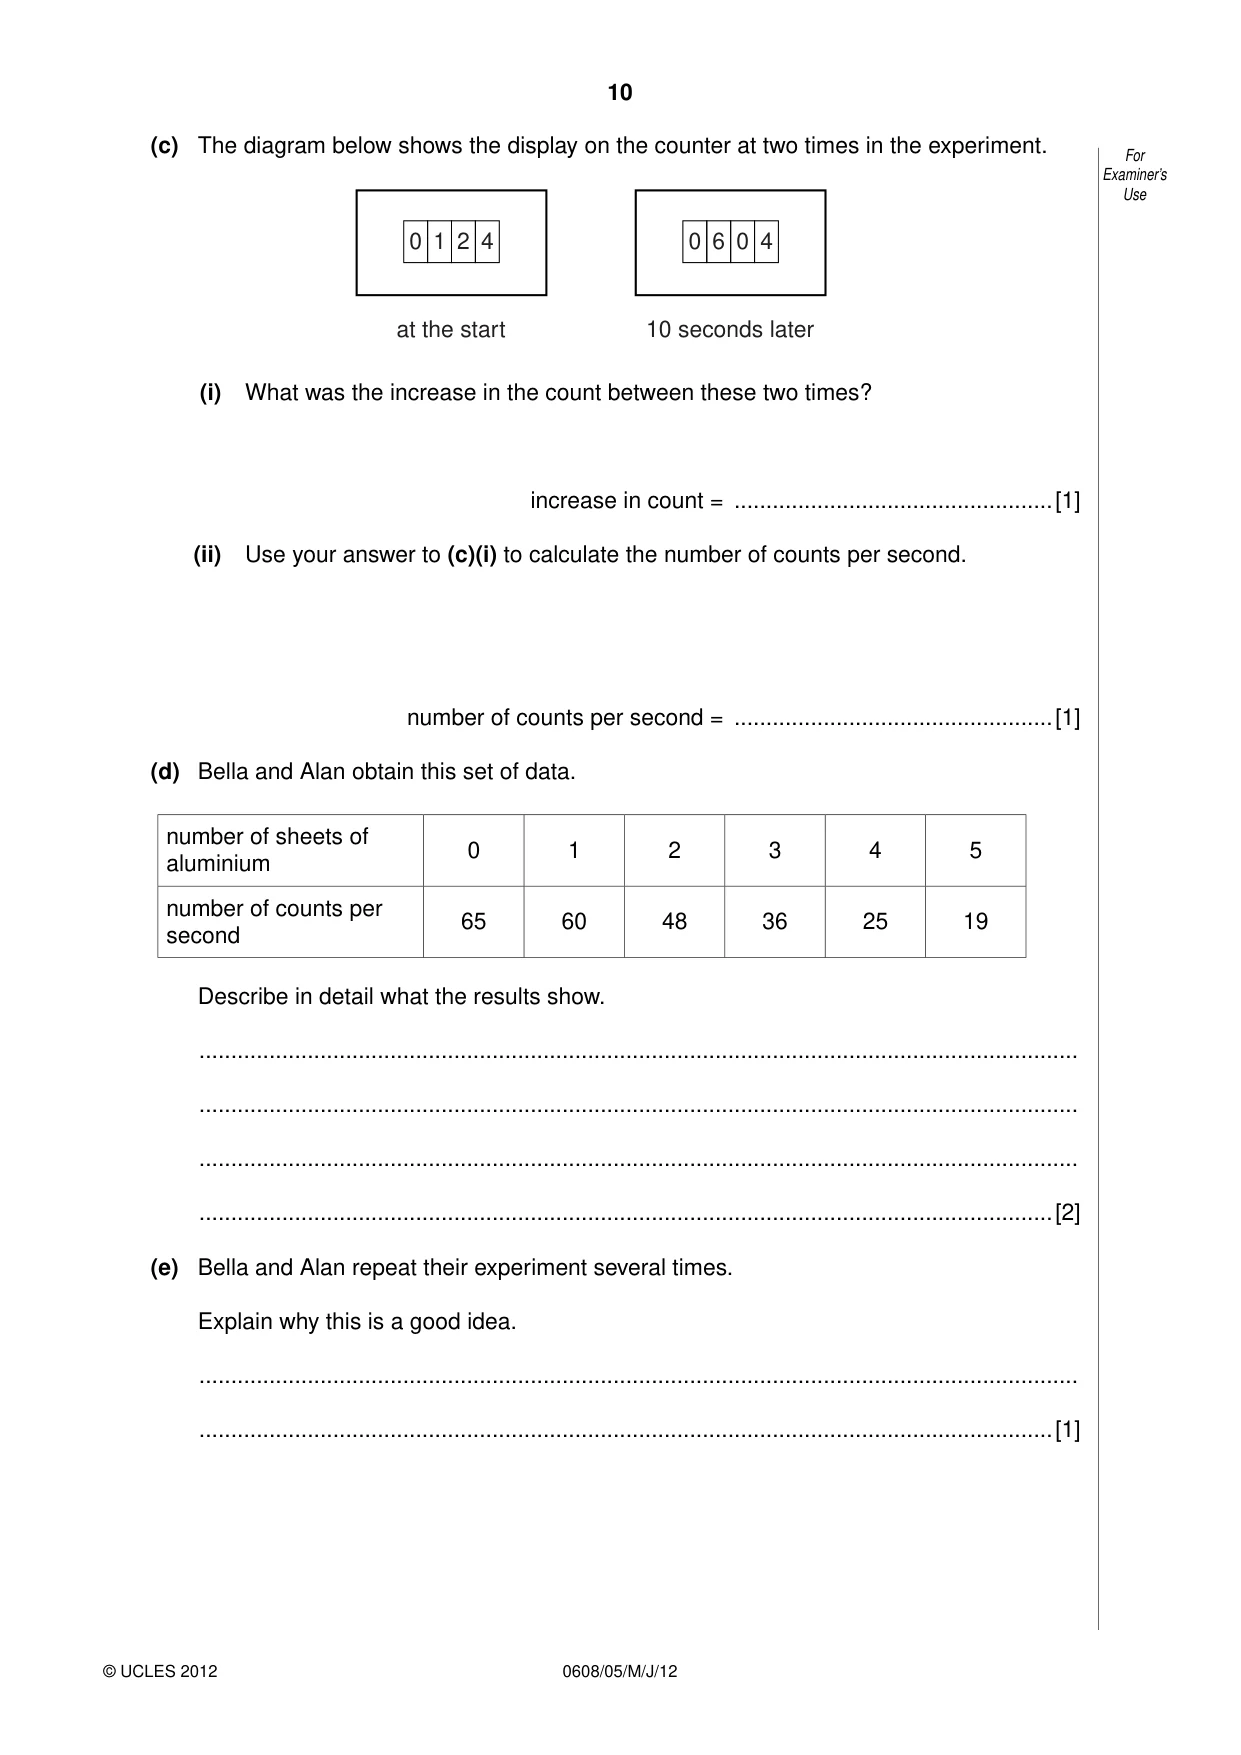
10 0608/05/M/J/12 © UCLES 2012 For Examiner’s Use (c) The diagram below shows the display on the counter at two times in the experiment. 0 1 2 4 at the start 0 6 0 4 10 seconds later (i) What was the increase in the count between these two times? increase in count = …[1] (ii) Use your answer to (c)(i) to calculate the number of counts per second. number of counts per second = …[1] (d) Bella and Alan obtain this set of data. number of sheets of aluminium 0 1 2 3 4 5 number of counts per second 65 60 48 36 25 19 Describe in detail what the results show. … … … …[2] (e) Bella and Alan repeat their experiment several times. Explain why this is a good idea. … …[1]
Question paper, page 11
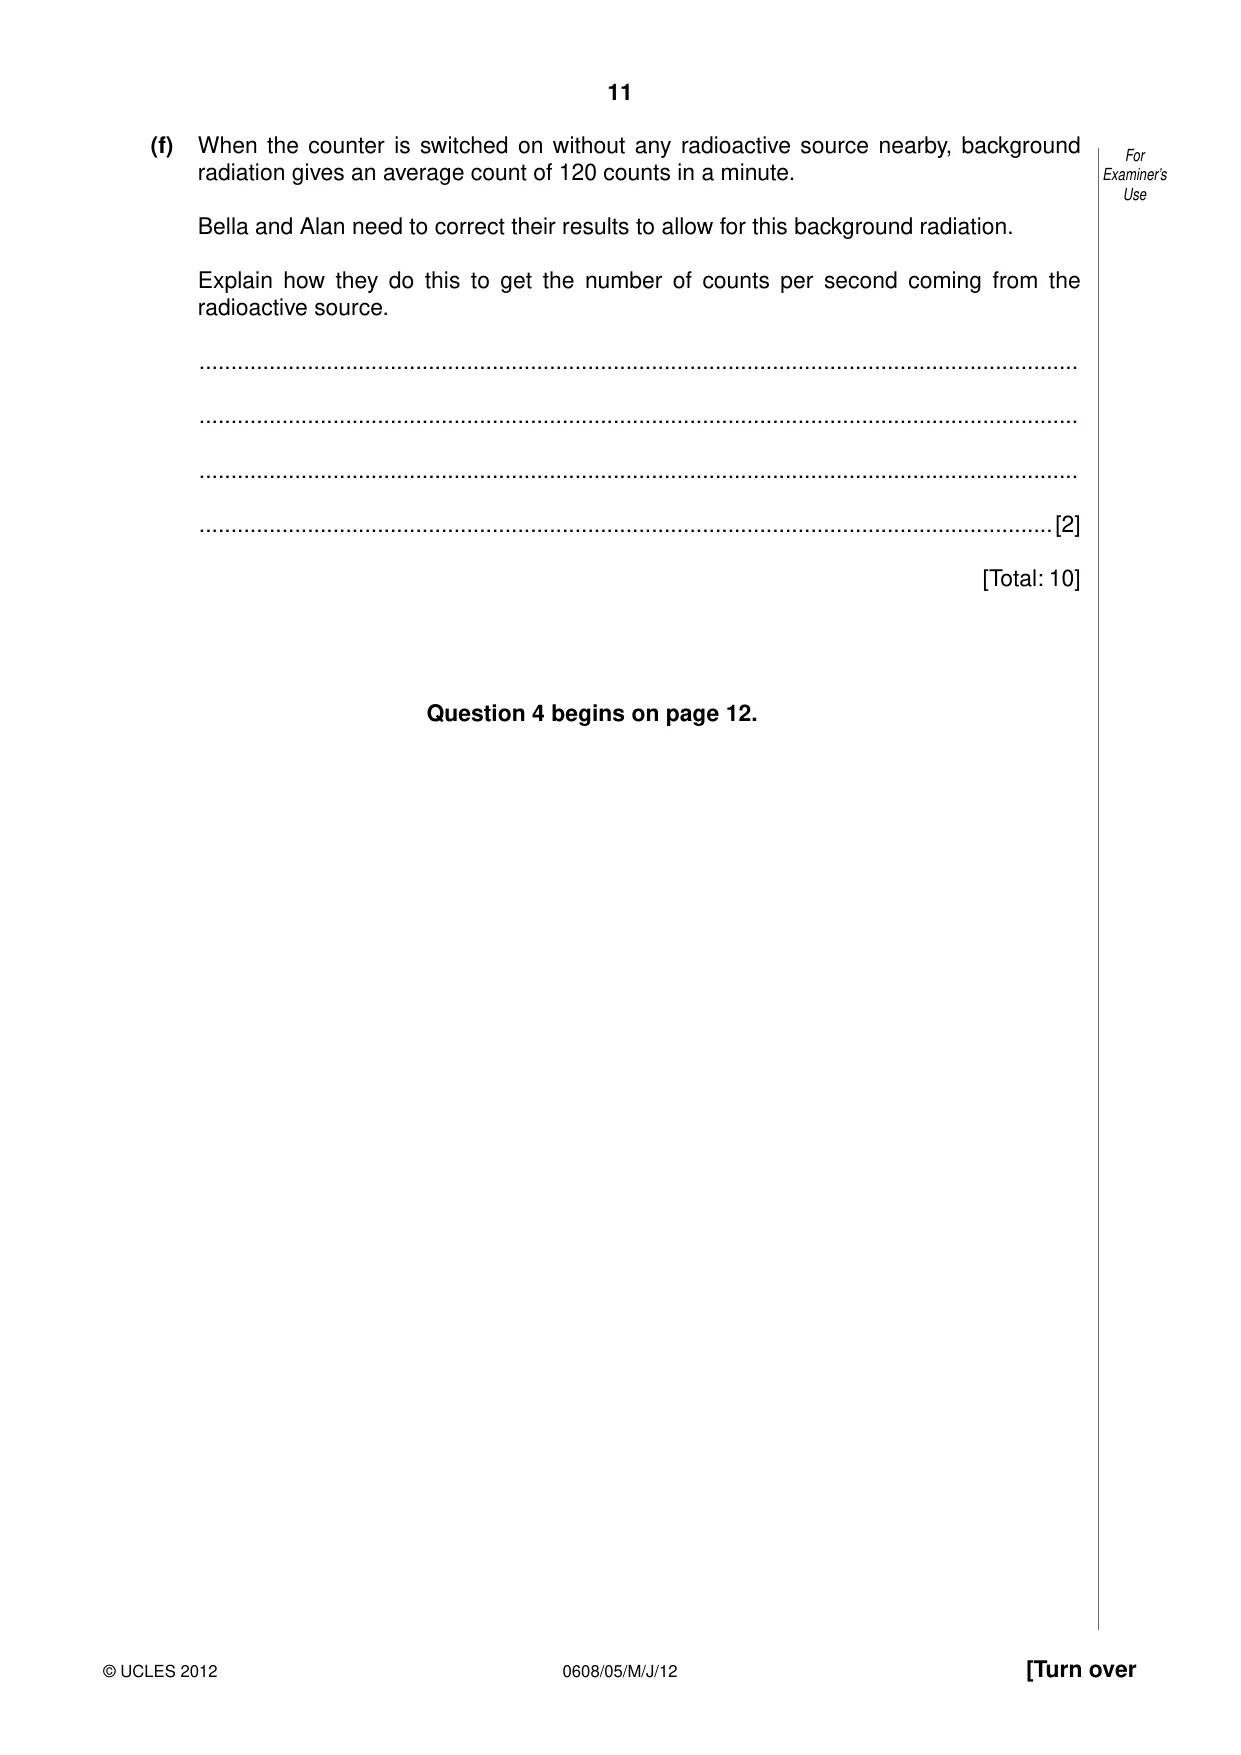
11 0608/05/M/J/12 © UCLES 2012 [Turn over For Examiner’s Use (f) When the counter is switched on without any radioactive source nearby, background radiation gives an average count of 120 counts in a minute. Bella and Alan need to correct their results to allow for this background radiation. Explain how they do this to get the number of counts per second coming from the radioactive source. … … … …[2] [Total: 10] Question 4 begins on page 12.
Question paper, page 12
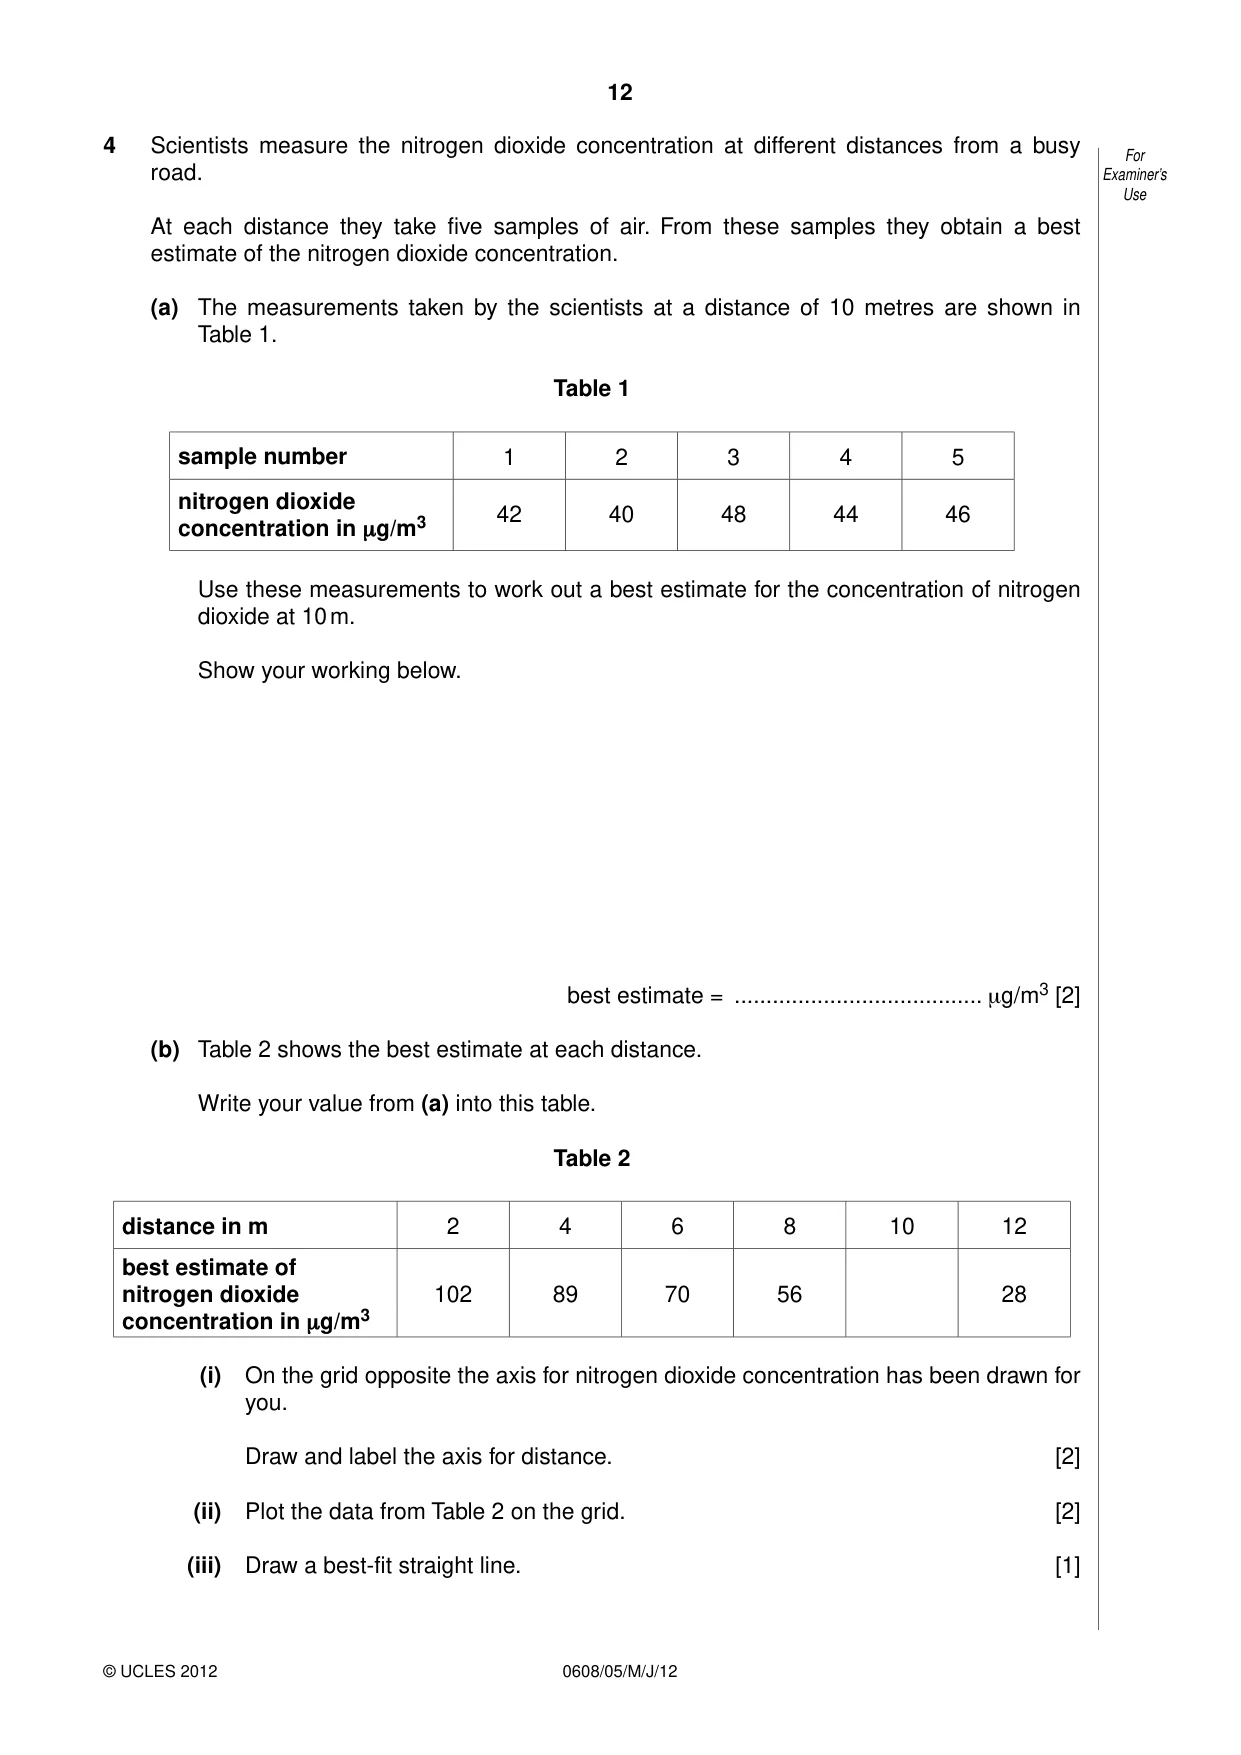
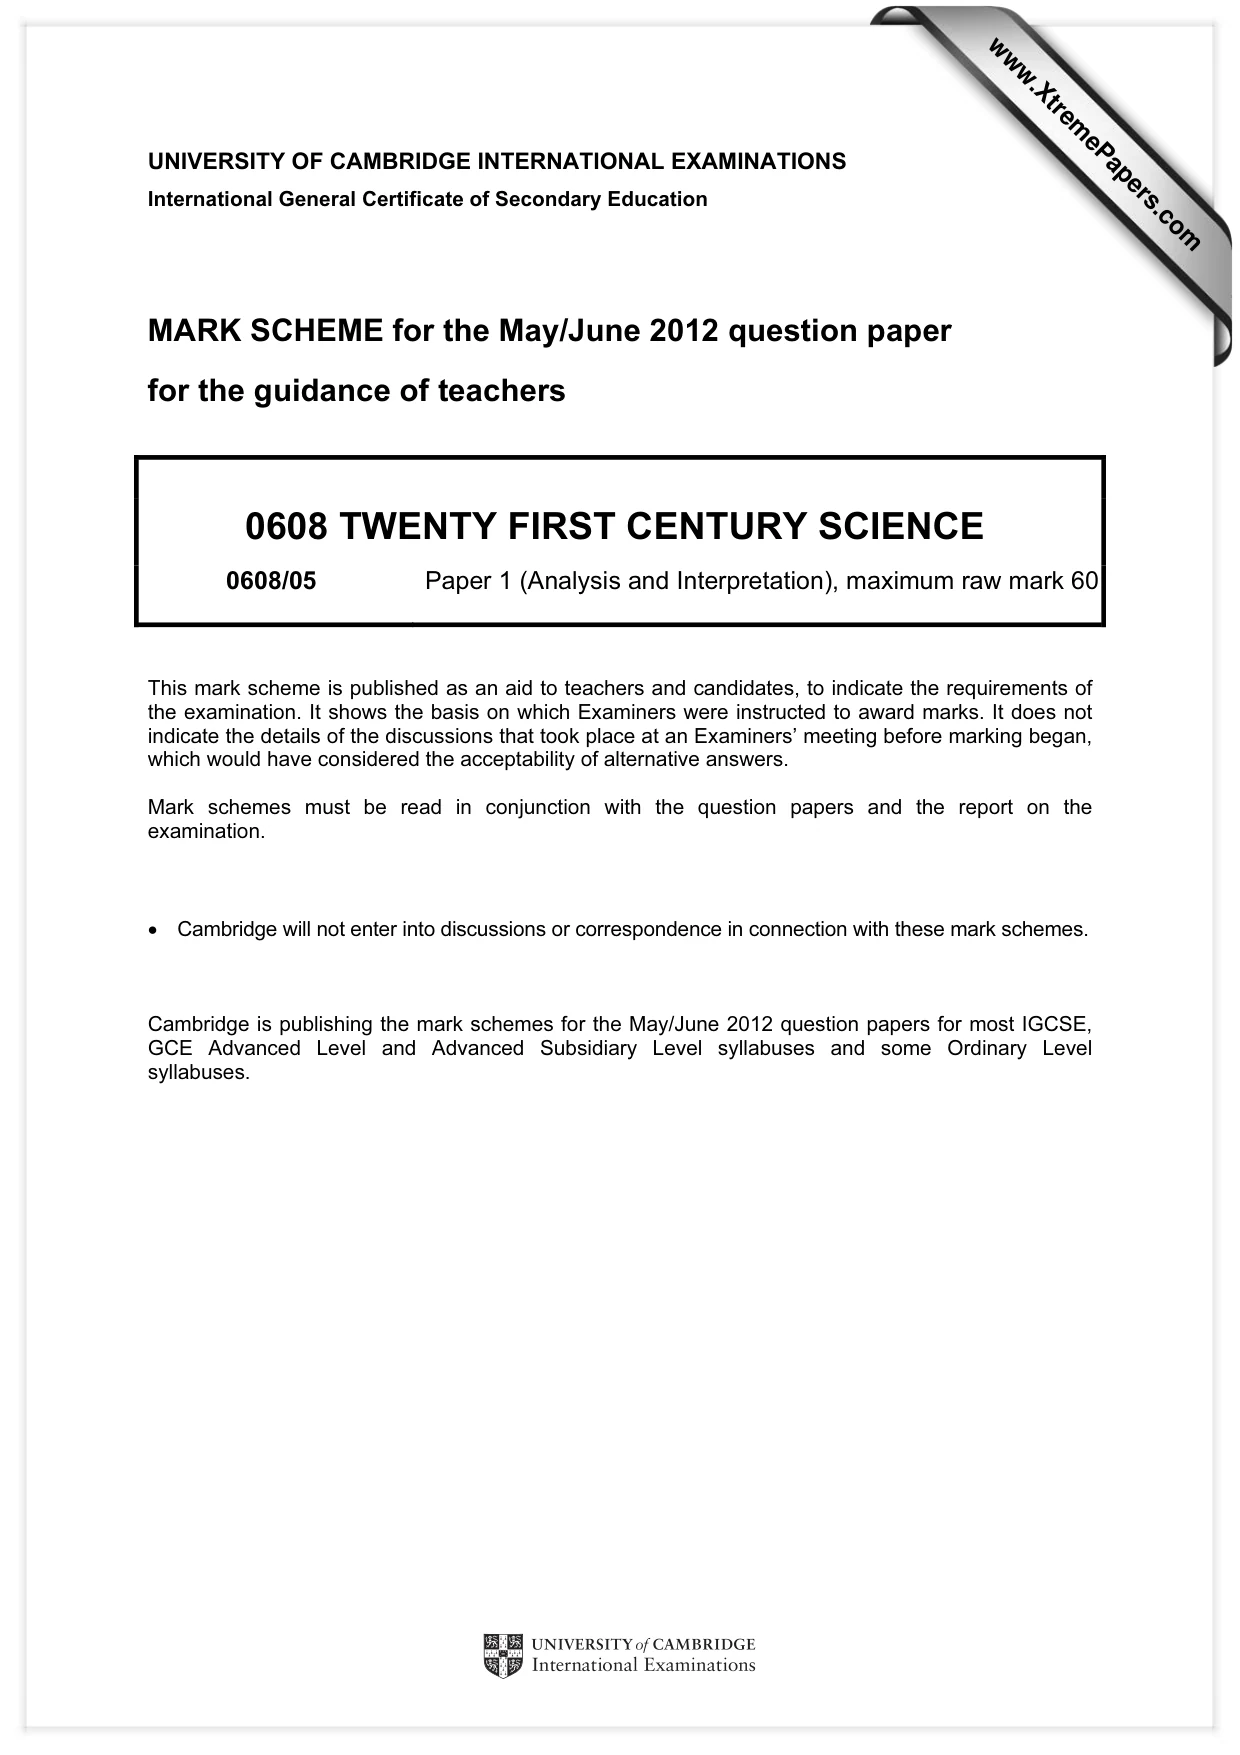
12 0608/05/M/J/12 © UCLES 2012 For Examiner’s Use 4 Scientists measure the nitrogen dioxide concentration at different distances from a busy road. At each distance they take five samples of air. From these samples they obtain a best estimate of the nitrogen dioxide concentration. (a) The measurements taken by the scientists at a distance of 10 metres are shown in Table 1. Table 1 sample number 1 2 3 4 5 nitrogen dioxide concentration in μg/m3 42 40 48 44 46 Use these measurements to work out a best estimate for the concentration of nitrogen dioxide at 10 m. Show your working below. best estimate = … μg/m3 [2] (b) Table 2 shows the best estimate at each distance. Write your value from (a) into this table. Table 2 distance in m 2 4 6 8 10 12 best estimate of nitrogen dioxide concentration in μg/m3 102 89 70 56 28 (i) On the grid opposite the axis for nitrogen dioxide concentration has been drawn for you. Draw and label the axis for distance. [2] (ii) Plot the data from Table 2 on the grid. [2] (iii) Draw a best-fit straight line. [1]
Question paper, page 13
13 0608/05/M/J/12 © UCLES 2012 For Examiner’s Use 0 20 40 60 nitrogen dioxide concentration in μg / m3 80 100 120 (c) Use your graph to find the nitrogen dioxide concentration at a distance of 5 m from the road. nitrogen dioxide concentration = … μg/m3 [1] (d) Use your graph to estimate the nitrogen dioxide concentration at a distance of 0 m from the road. nitrogen dioxide concentration = … μg/m3 [2] [Total: 10]
Question paper, page 14
14 0608/05/M/J/12 © UCLES 2012 BLANK PAGE
Question paper, page 15
15 0608/05/M/J/12 © UCLES 2012 BLANK PAGE
Question paper, page 16
16 0608/05/M/J/12 © UCLES 2012 BLANK PAGE Permission to reproduce items where third-party owned material protected by copyright is included has been sought and cleared where possible. Every reasonable effort has been made by the publisher (UCLES) to trace copyright holders, but if any items requiring clearance have unwittingly been included, the publisher will be pleased to make amends at the earliest possible opportunity. University of Cambridge International Examinations is part of the Cambridge Assessment Group. Cambridge Assessment is the brand name of University of Cambridge Local Examinations Syndicate (UCLES), which is itself a department of the University of Cambridge.
Mark scheme, page 1
UNIVERSITY OF CAMBRIDGE INTERNATIONAL EXAMINATIONS International General Certificate of Secondary Education MARK SCHEME for the May/June 2012 question paper for the guidance of teachers 0608 TWENTY FIRST CENTURY SCIENCE 0608/05 Paper 1 (Analysis and Interpretation), maximum raw mark 60 This mark scheme is published as an aid to teachers and candidates, to indicate the requirements of the examination. It shows the basis on which Examiners were instructed to award marks. It does not indicate the details of the discussions that took place at an Examiners’ meeting before marking began, which would have considered the acceptability of alternative answers. Mark schemes must be read in conjunction with the question papers and the report on the examination. • Cambridge will not enter into discussions or correspondence in connection with these mark schemes. Cambridge is publishing the mark schemes for the May/June 2012 question papers for most IGCSE, GCE Advanced Level and Advanced Subsidiary Level syllabuses and some Ordinary Level syllabuses. www.XtremePapers.com
Mark scheme, page 2
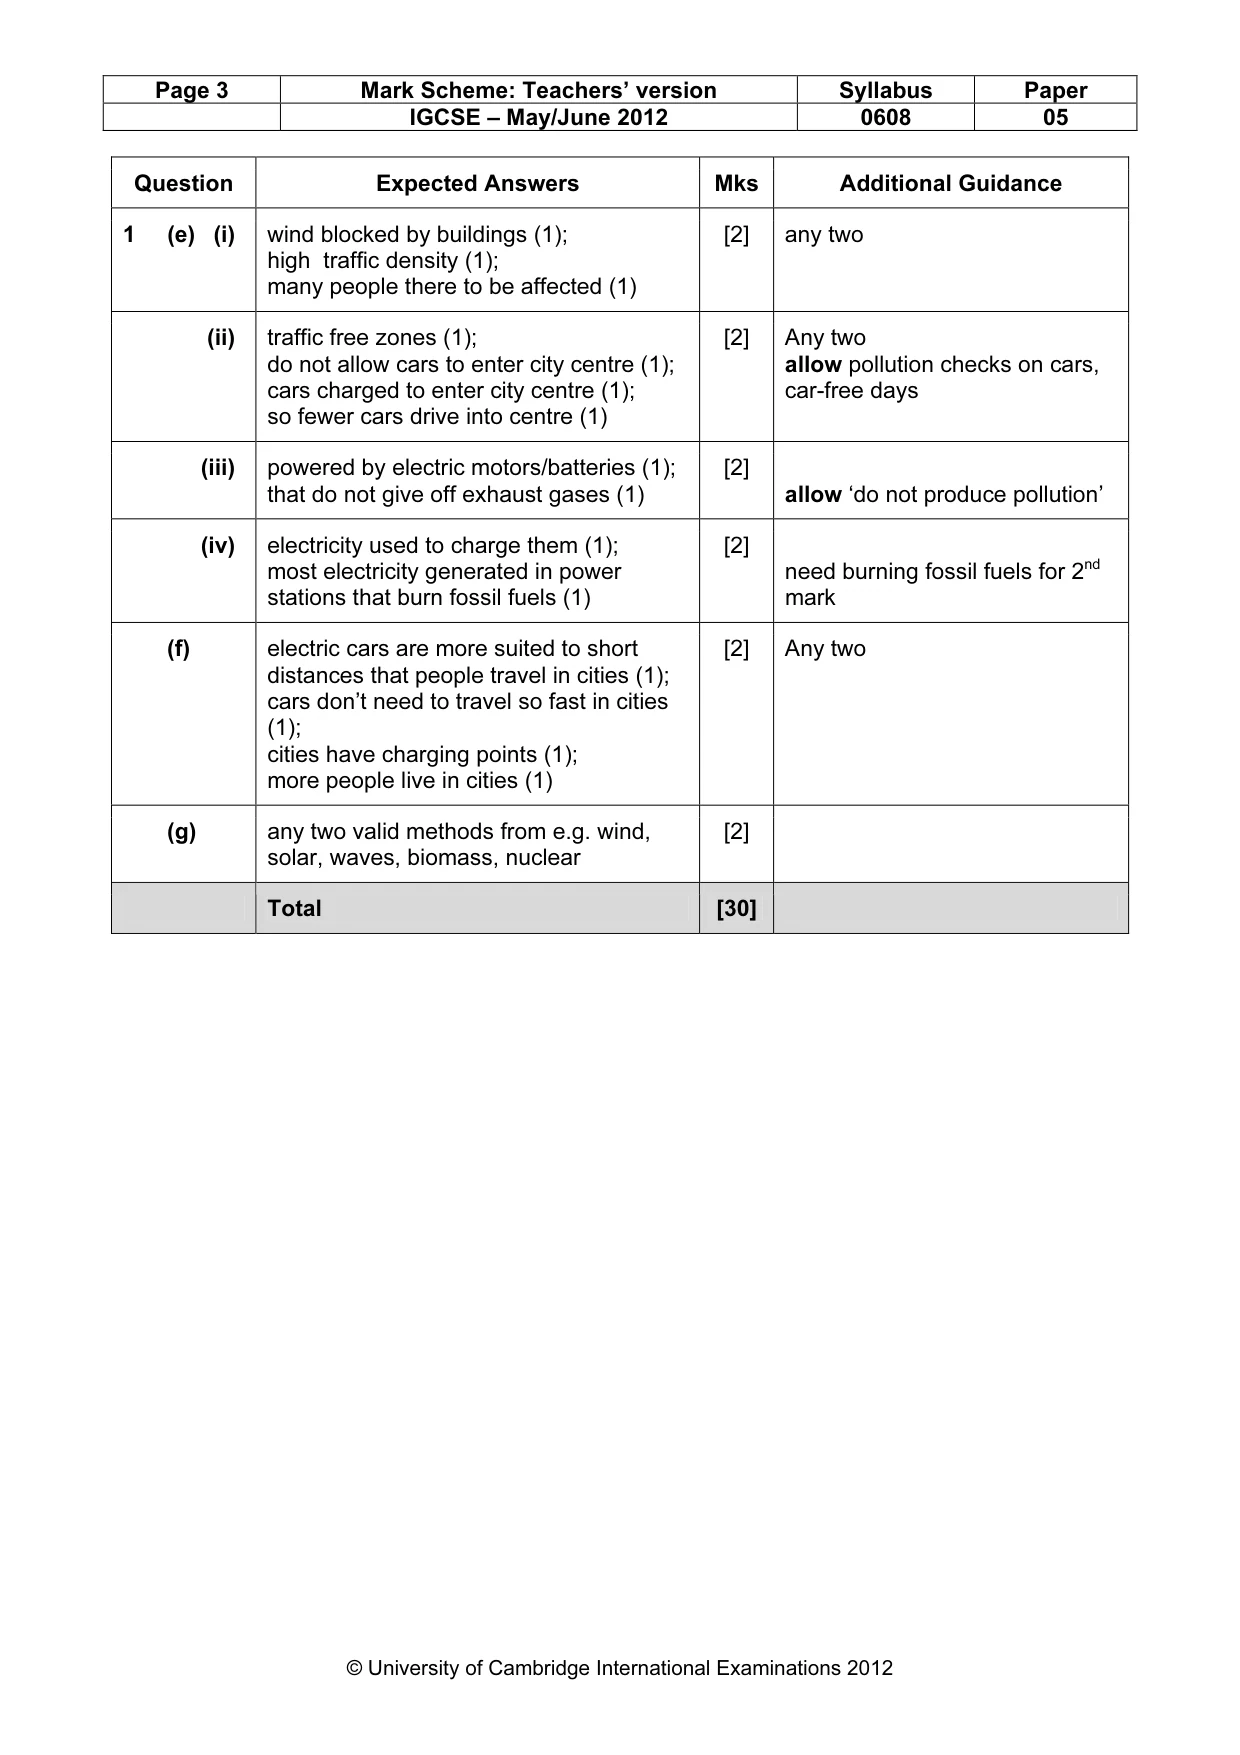
Page 2 Mark Scheme: Teachers’ version Syllabus Paper IGCSE – May/June 2012 0608 05 © University of Cambridge International Examinations 2012 Question Expected Answers Mks Additional Guidance 1 (a) (i) 384 [1] (ii) 388 [1] allow ± 2 (iii) factors affecting output of carbon dioxide may change/plot shows some variation [1] allow correct example of a factor that may change (iv) As the number of cars rises (1); concentration of carbon dioxide rises (1) [2] allow … falls … falls allow alternative words allow positive correlation if variables named (b) (i) (fuel) reacts with oxygen (1); oxygen/air supply is restricted (1); incomplete combustion takes place (1) [2] Any two (ii) carbon monoxide is poisonous (1); particulates bad for asthmatics/ particulates irritate lungs (1) [2] (c) (i) nitrogen + oxygen → nitrogen monoxide [1] (ii) 2NO + O2 → 2NO2 correct three formulae (1); correct balancing (1) [2] reject O2, NO2 NO + O → NO2 scores (1) for balancing (d) (i) directly: sulfur dioxide irritates lungs/eyes (1); indirectly: produces acid rain that kills plants/animals that humans use e.g. for food (1) [2] needs specific effect, not just ‘makes them ill’ needs effect on humans not just ‘causes acid rain’ (ii) risks: people do not know/do not care that driving cars is harmful (1); people underestimate the harm they are doing (1); people disagree that these gases are doing harm (1); people are willing to accept the problems they cause (1) benefits: people find cars convenient/useful (1); public transport is less convenient than cars/does not run from door to door (1); public transport can be more expensive (1) [4] Any four At least one from each area (risk and benefit)
Mark scheme, page 3
Page 3 Mark Scheme: Teachers’ version Syllabus Paper IGCSE – May/June 2012 0608 05 © University of Cambridge International Examinations 2012 Question Expected Answers Mks Additional Guidance 1 (e) (i) wind blocked by buildings (1); high traffic density (1); many people there to be affected (1) [2] any two (ii) traffic free zones (1); do not allow cars to enter city centre (1); cars charged to enter city centre (1); so fewer cars drive into centre (1) [2] Any two allow pollution checks on cars, car-free days (iii) powered by electric motors/batteries (1); that do not give off exhaust gases (1) [2] allow ‘do not produce pollution’ (iv) electricity used to charge them (1); most electricity generated in power stations that burn fossil fuels (1) [2] need burning fossil fuels for 2nd mark (f) electric cars are more suited to short distances that people travel in cities (1); cars don’t need to travel so fast in cities (1); cities have charging points (1); more people live in cities (1) [2] Any two (g) any two valid methods from e.g. wind, solar, waves, biomass, nuclear [2] Total [30]
Mark scheme, page 4
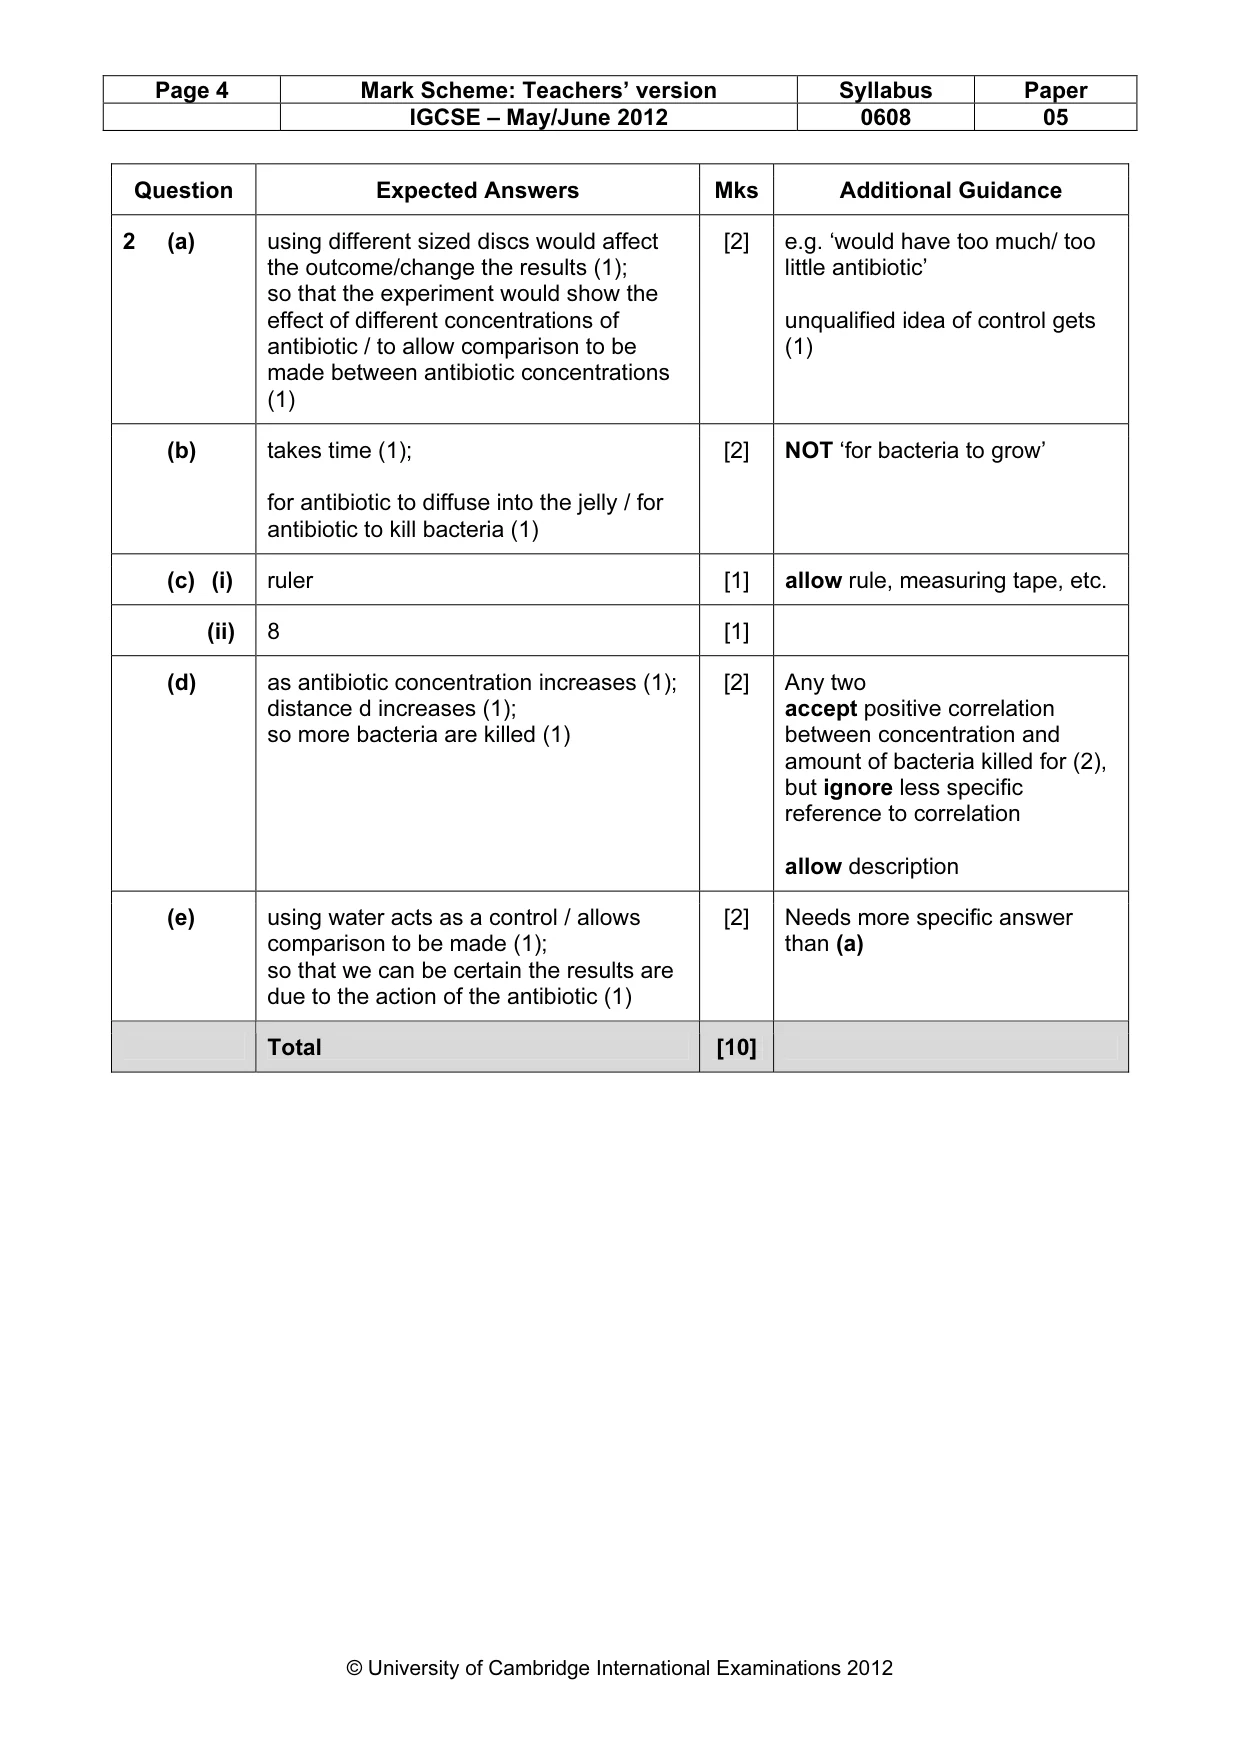
Page 4 Mark Scheme: Teachers’ version Syllabus Paper IGCSE – May/June 2012 0608 05 © University of Cambridge International Examinations 2012 Question Expected Answers Mks Additional Guidance 2 (a) using different sized discs would affect the outcome/change the results (1); so that the experiment would show the effect of different concentrations of antibiotic / to allow comparison to be made between antibiotic concentrations (1) [2] e.g. ‘would have too much/ too little antibiotic’ unqualified idea of control gets (1) (b) takes time (1); for antibiotic to diffuse into the jelly / for antibiotic to kill bacteria (1) [2] NOT ‘for bacteria to grow’ (c) (i) ruler [1] allow rule, measuring tape, etc. (ii) 8 [1] (d) as antibiotic concentration increases (1); distance d increases (1); so more bacteria are killed (1) [2] Any two accept positive correlation between concentration and amount of bacteria killed for (2), but ignore less specific reference to correlation allow description (e) using water acts as a control / allows comparison to be made (1); so that we can be certain the results are due to the action of the antibiotic (1) [2] Needs more specific answer than (a) Total [10]
Mark scheme, page 5
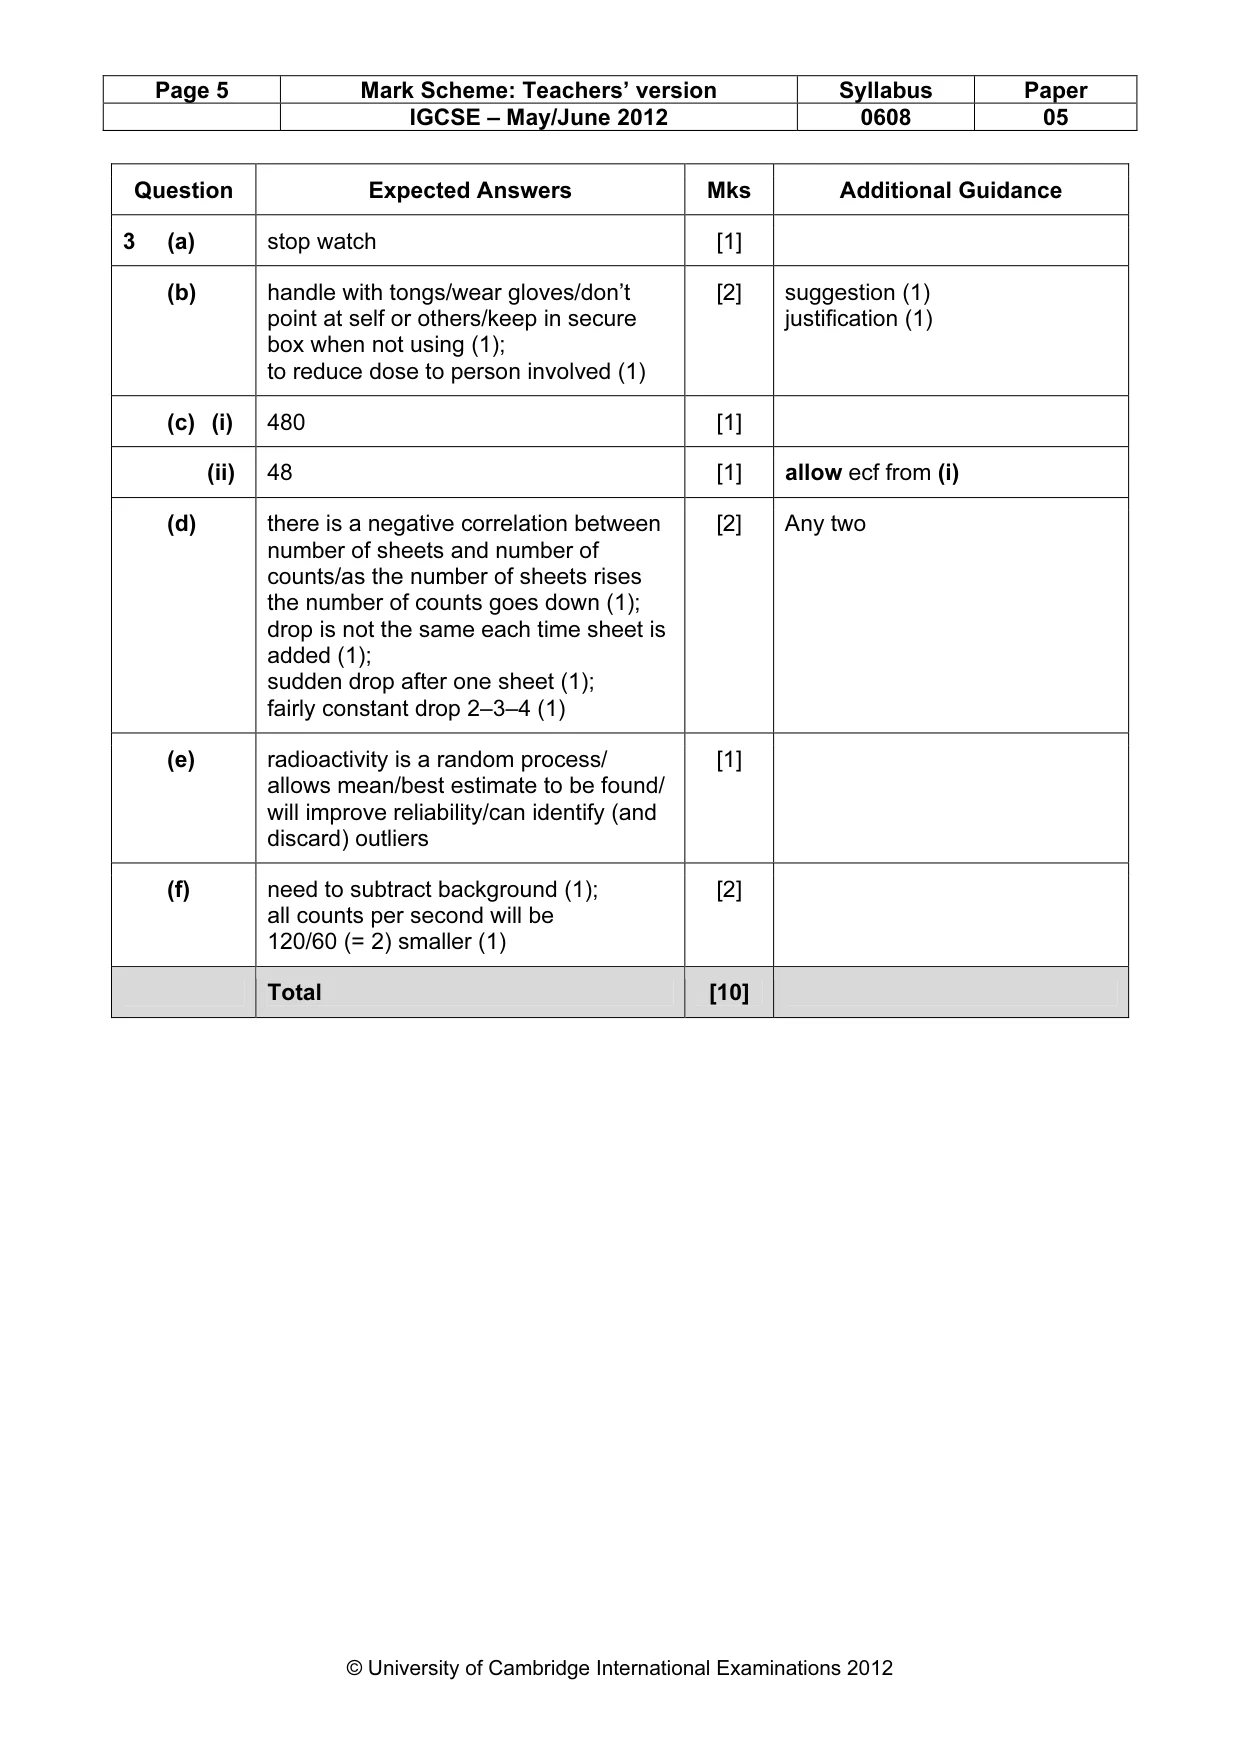
Page 5 Mark Scheme: Teachers’ version Syllabus Paper IGCSE – May/June 2012 0608 05 © University of Cambridge International Examinations 2012 Question Expected Answers Mks Additional Guidance 3 (a) stop watch [1] (b) handle with tongs/wear gloves/don’t point at self or others/keep in secure box when not using (1); to reduce dose to person involved (1) [2] suggestion (1) justification (1) (c) (i) 480 [1] (ii) 48 [1] allow ecf from (i) (d) there is a negative correlation between number of sheets and number of counts/as the number of sheets rises the number of counts goes down (1); drop is not the same each time sheet is added (1); sudden drop after one sheet (1); fairly constant drop 2–3–4 (1) [2] Any two (e) radioactivity is a random process/ allows mean/best estimate to be found/ will improve reliability/can identify (and discard) outliers [1] (f) need to subtract background (1); all counts per second will be 120/60 (= 2) smaller (1) [2] Total [10]
Mark scheme, page 6
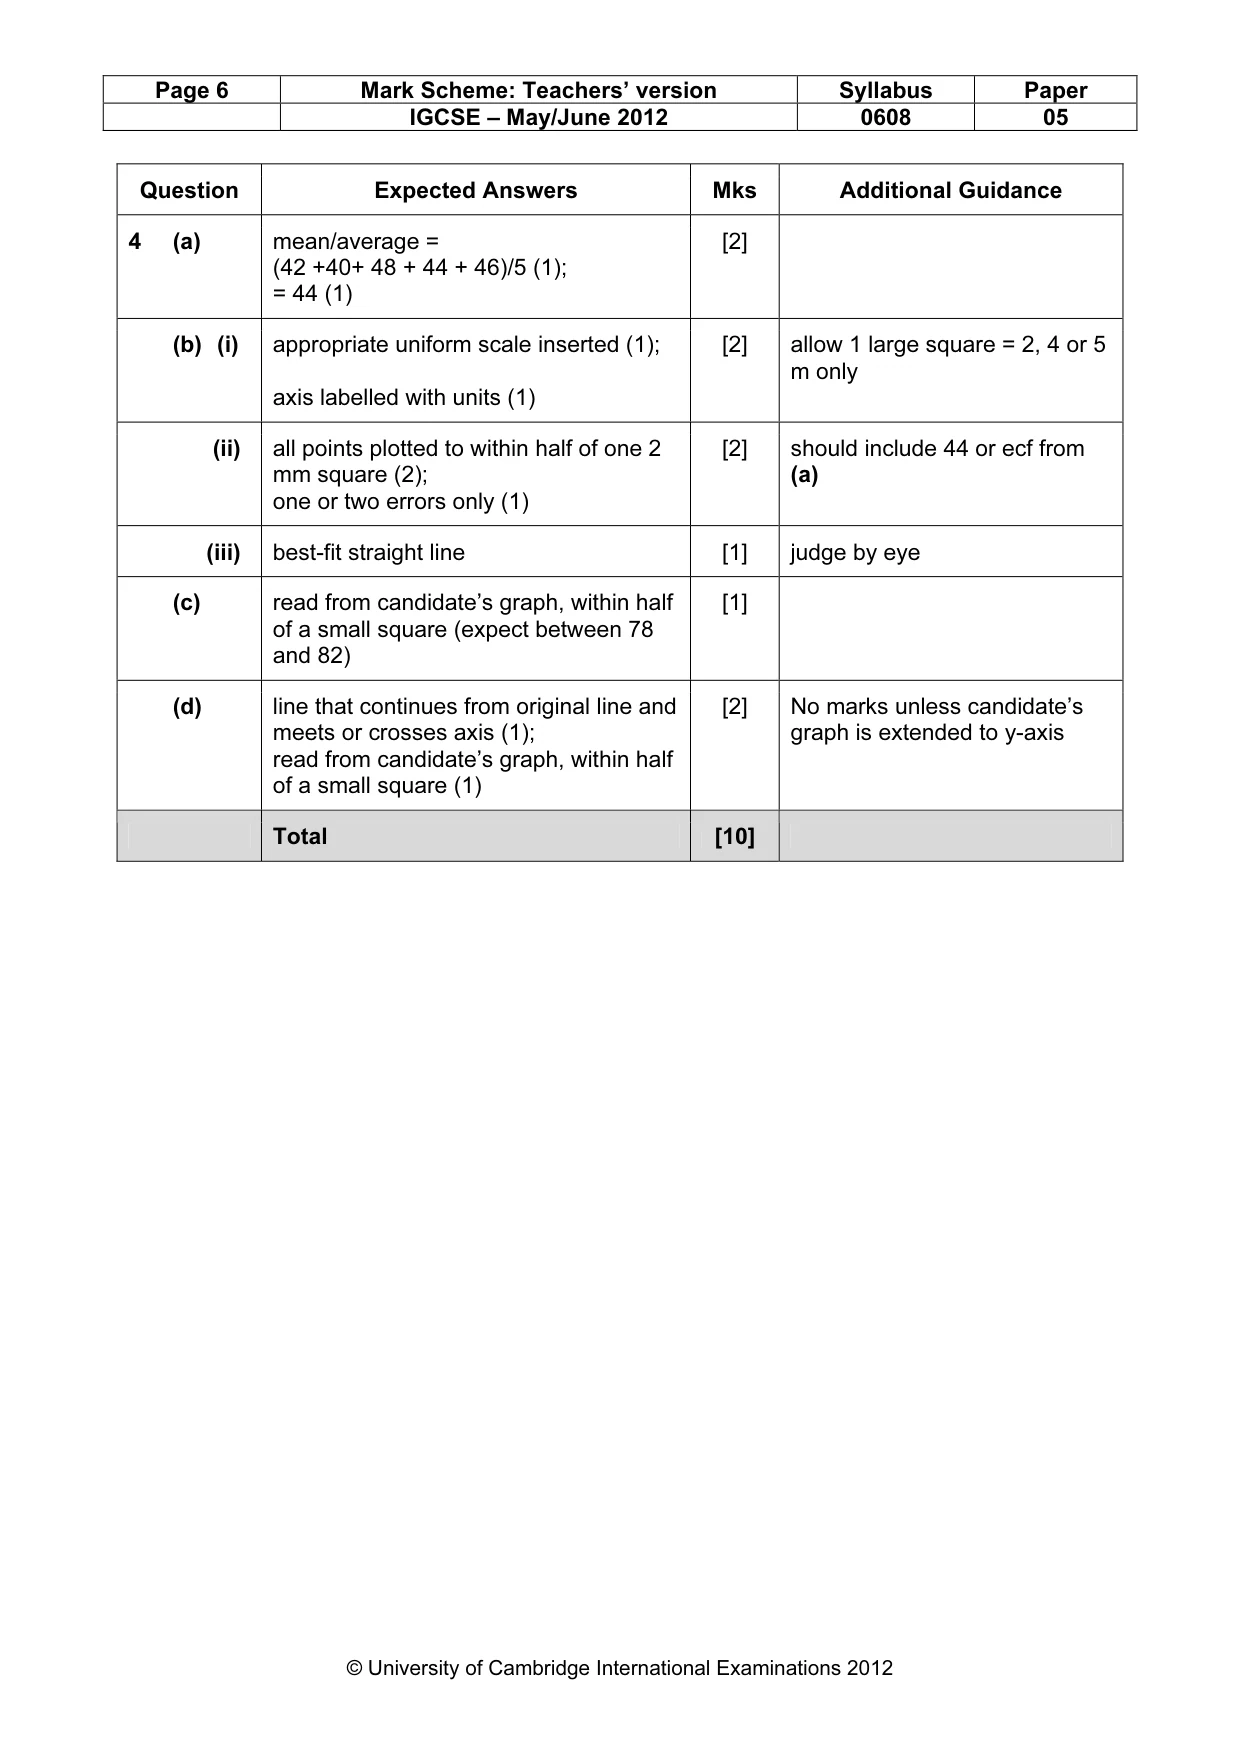
Page 6 Mark Scheme: Teachers’ version Syllabus Paper IGCSE – May/June 2012 0608 05 © University of Cambridge International Examinations 2012 Question Expected Answers Mks Additional Guidance 4 (a) mean/average = (42 +40+ 48 + 44 + 46)/5 (1); = 44 (1) [2] (b) (i) appropriate uniform scale inserted (1); axis labelled with units (1) [2] allow 1 large square = 2, 4 or 5 m only (ii) all points plotted to within half of one 2 mm square (2); one or two errors only (1) [2] should include 44 or ecf from (a) (iii) best-fit straight line [1] judge by eye (c) read from candidate’s graph, within half of a small square (expect between 78 and 82) [1] (d) line that continues from original line and meets or crosses axis (1); read from candidate’s graph, within half of a small square (1) [2] No marks unless candidate’s graph is extended to y-axis Total [10]
What you needed in this session
Cambridge’s own grade thresholds for 2012 May/June, Paper 5 · Variant 1. A higher threshold means an easier paper — the bar moves with how the cohort did.