Cambridge IGCSE Twenty-First Century Science 0608 — 2009 Oct/Nov Paper 5 · Variant 1
0608/51/O/N/09 · 60 marks · ≈68 min
The question paper and its mark scheme, free to read here and free to download. This is Cambridge’s own paper, exactly as it was sat.
Question paper16 pages


Mark scheme5 pages
Answers below. Sit the paper first if you are practising.
Paper as text
Question paper, page 1
This document consists of 14 printed pages and 2 blank pages. DC (CW/SW) 13663/2 © UCLES 2009 [Turn over UNIVERSITY OF CAMBRIDGE INTERNATIONAL EXAMINATIONS International General Certificate of Secondary Education READ THESE INSTRUCTIONS FIRST Write your Centre number, candidate number and name on all the work you hand in. Write in dark blue or black pen. You may use a pencil for any diagrams or graphs. Do not use staples, paper clips, highlighters, glue or correction fluid. DO NOT WRITE IN ANY BARCODES. Answer all questions. At the end of the examination, fasten all your work securely together. The number of marks is given in brackets [ ] at the end of each question or part question. * 1 1 6 9 7 8 0 1 2 8 * 21ST CENTURY SCIENCE 0608/05 Paper 5 October/November 2009 1 hour 30 minutes Candidates answer on the Question Paper. No Additional Materials are required. For Examiner’s Use 1 2 3 4 5 Total www.XtremePapers.com
Question paper, page 2
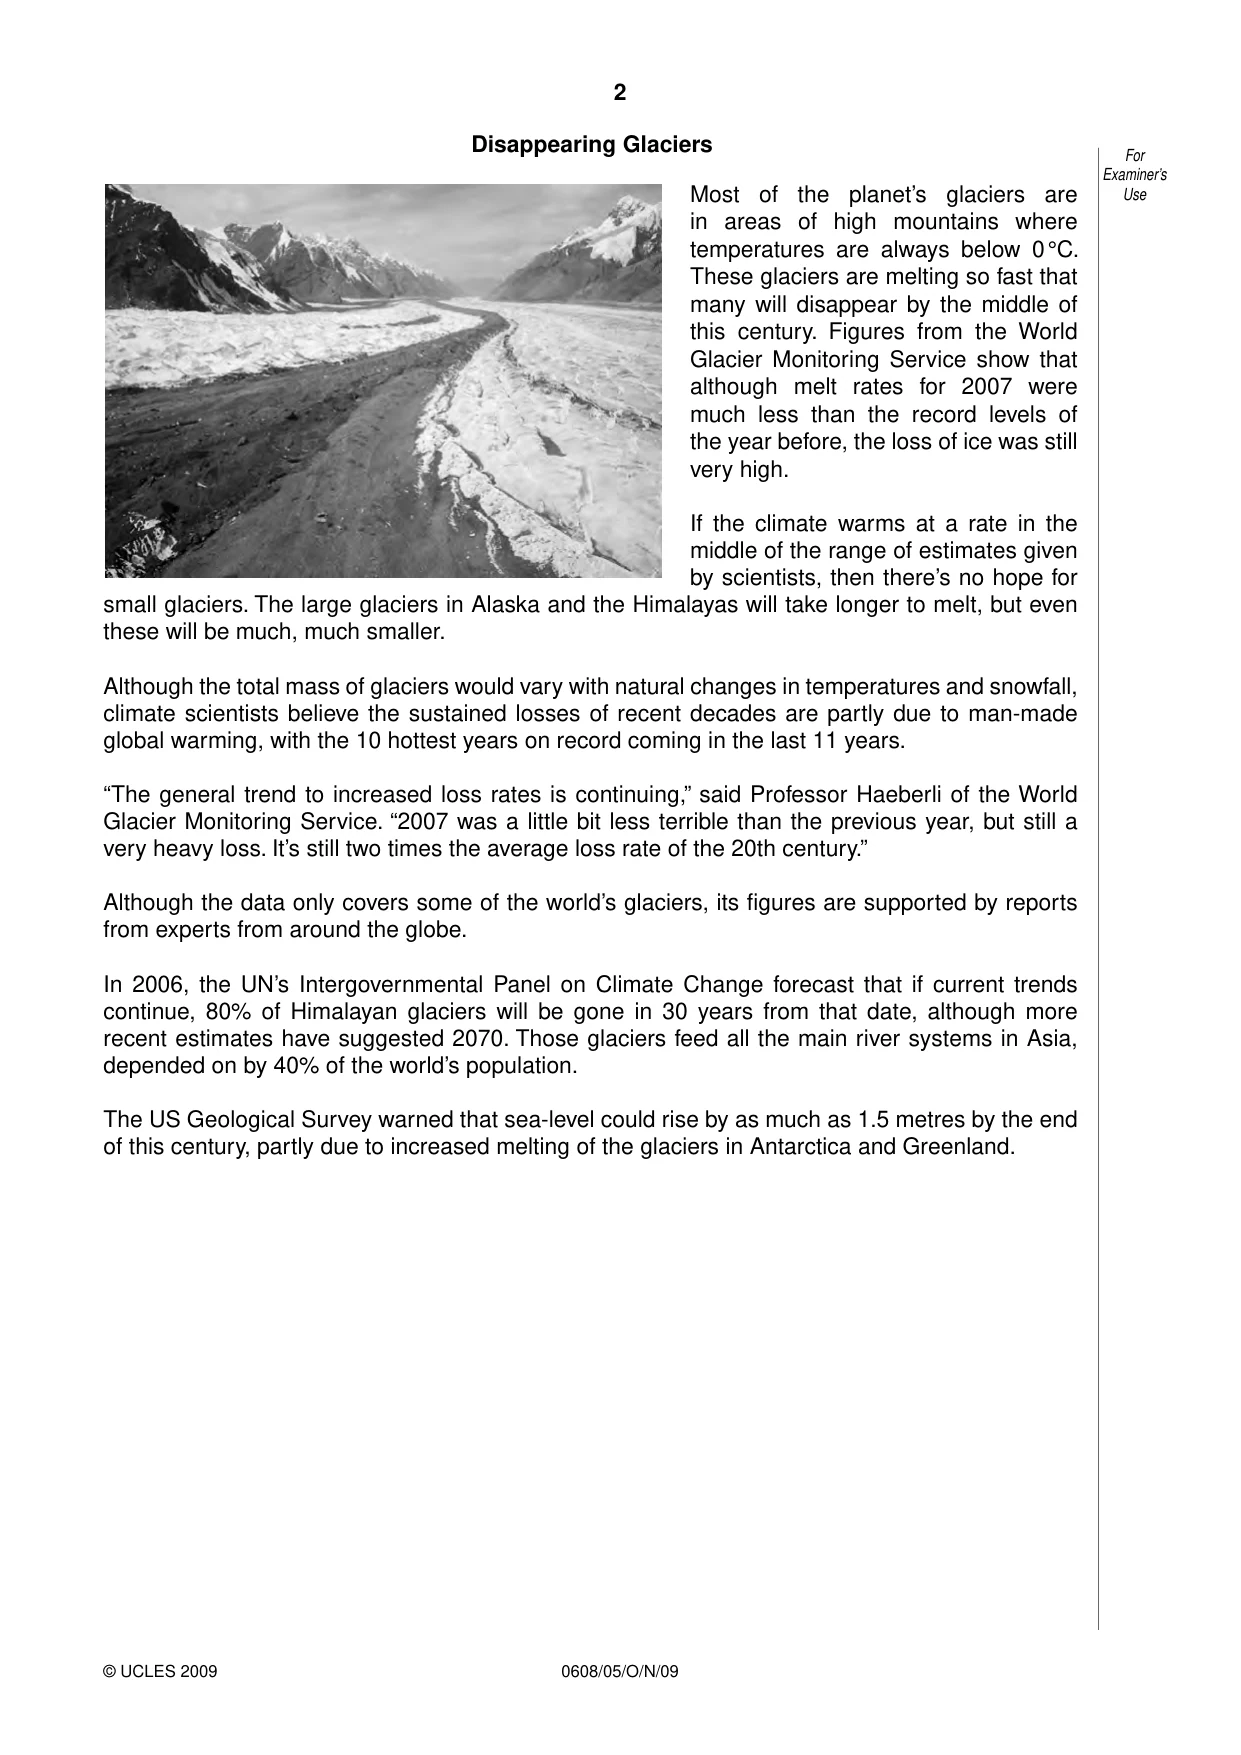
2 0608/05/O/N/09 © UCLES 2009 For Examiner’s Use Disappearing Glaciers Most of the planet’s glaciers are in areas of high mountains where temperatures are always below 0 °C. These glaciers are melting so fast that many will disappear by the middle of this century. Figures from the World Glacier Monitoring Service show that although melt rates for 2007 were much less than the record levels of the year before, the loss of ice was still very high. If the climate warms at a rate in the middle of the range of estimates given by scientists, then there’s no hope for small glaciers. The large glaciers in Alaska and the Himalayas will take longer to melt, but even these will be much, much smaller. Although the total mass of glaciers would vary with natural changes in temperatures and snowfall, climate scientists believe the sustained losses of recent decades are partly due to man-made global warming, with the 10 hottest years on record coming in the last 11 years. “The general trend to increased loss rates is continuing,” said Professor Haeberli of the World Glacier Monitoring Service. “2007 was a little bit less terrible than the previous year, but still a very heavy loss. It’s still two times the average loss rate of the 20th century.” Although the data only covers some of the world’s glaciers, its figures are supported by reports from experts from around the globe. In 2006, the UN’s Intergovernmental Panel on Climate Change forecast that if current trends continue, 80% of Himalayan glaciers will be gone in 30 years from that date, although more recent estimates have suggested 2070. Those glaciers feed all the main river systems in Asia, depended on by 40% of the world’s population. The US Geological Survey warned that sea-level could rise by as much as 1.5 metres by the end of this century, partly due to increased melting of the glaciers in Antarctica and Greenland.
Question paper, page 3
3 0608/05/O/N/09 © UCLES 2009 [Turn over For Examiner’s Use 1 This question is based on the article ‘Disappearing Glaciers’. (a) (i) All the research in this article took place in high mountains. Explain why most glaciers are in high mountains. …[1] (ii) In which year did the glaciers melt most? Put a ring around the correct answer. 2006 2007 2008 2060 [1] (b) The melting of glaciers is a measure of global warming. This is thought to be caused by an increase in carbon dioxide in the atmosphere. Explain how carbon dioxide causes the atmosphere to heat up. In your answer you should include • the electromagnetic spectrum emitted from the Sun • what happens to radiation on the Earth • what happens to radiation in the atmosphere … … … … …[3] (c) (i) Write the earliest and latest dates by which scientists expect 80% of the Himalayan glaciers to be gone. earliest date … latest date … [2] (ii) Explain why scientists are particularly concerned about the predicted loss of Himalayan glaciers. … … …[3] (d) The melting of glaciers may make sea-levels rise even higher than was feared. State and explain one serious consequence of sea-level rise. … …[2]
Question paper, page 4
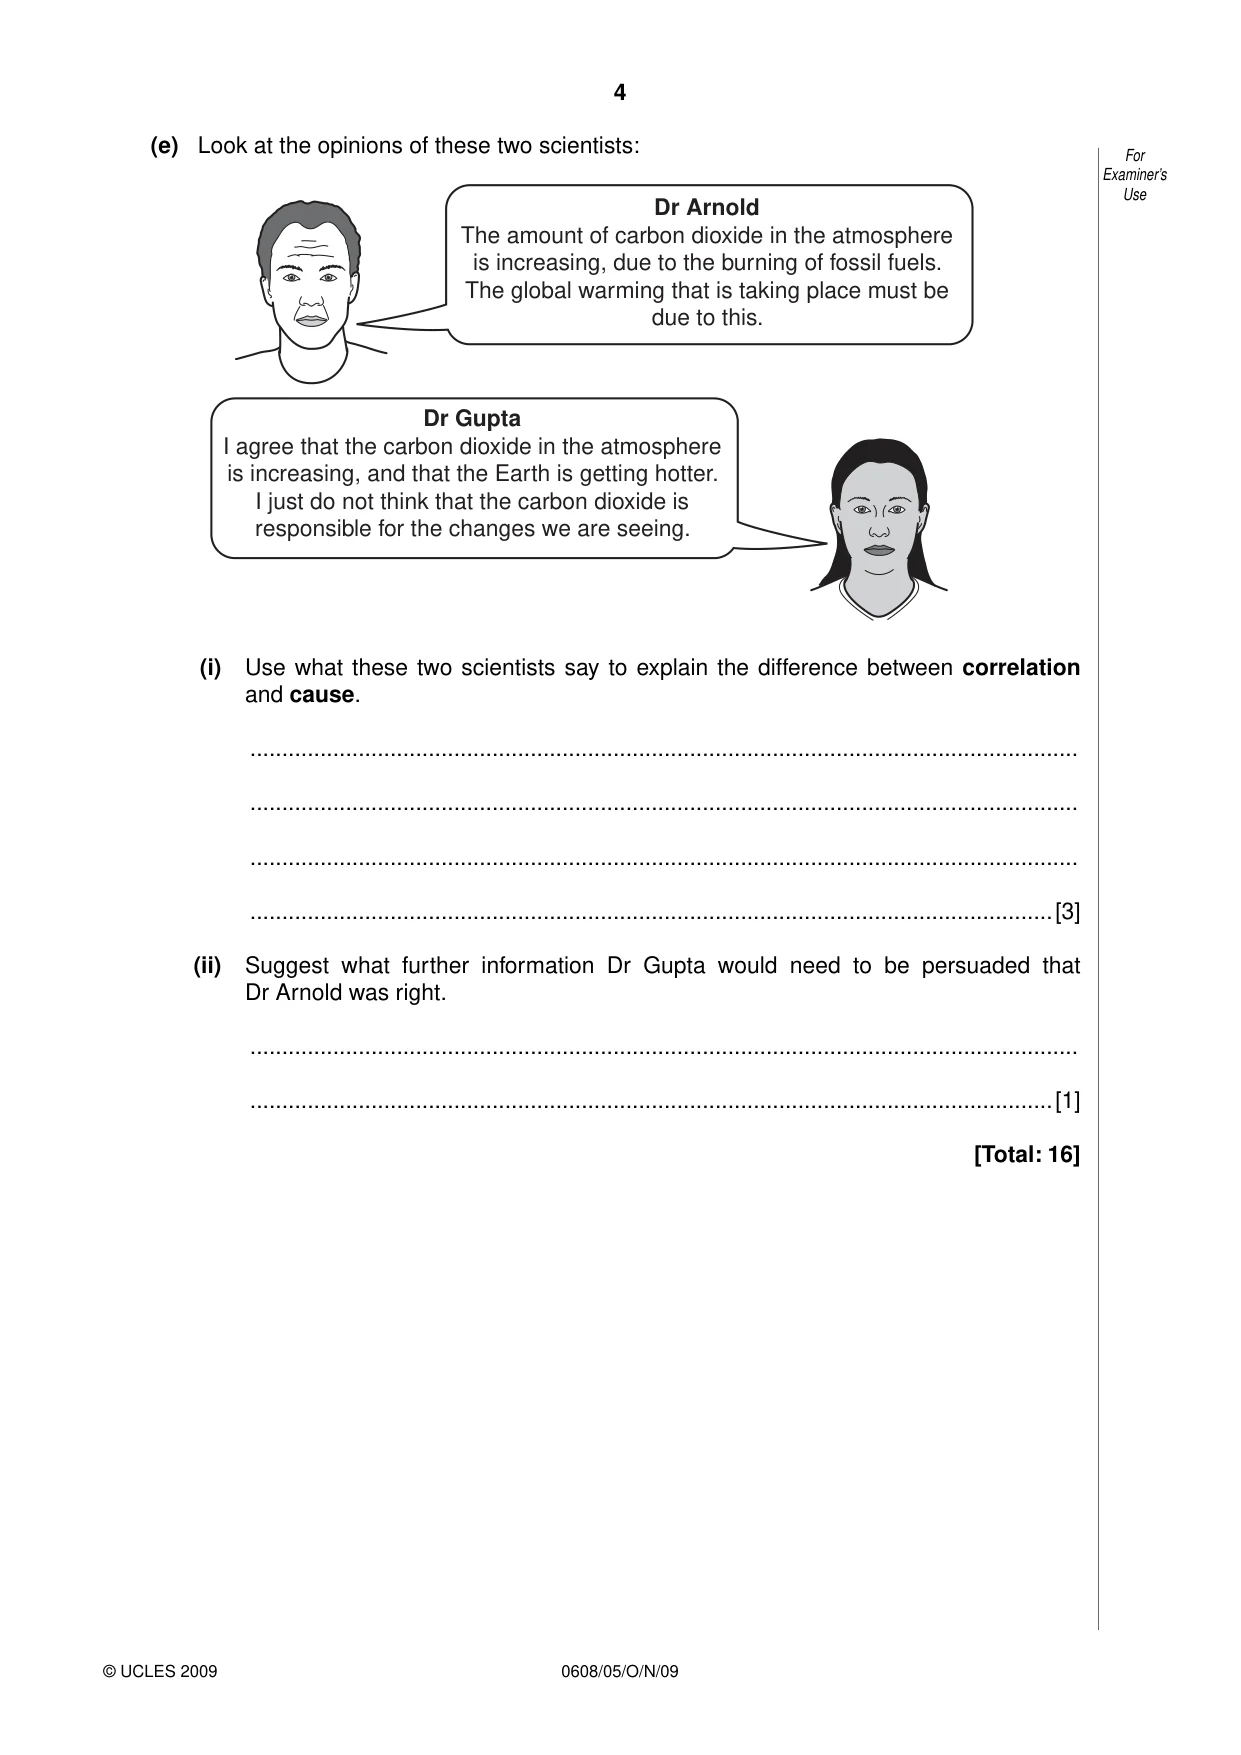
4 0608/05/O/N/09 © UCLES 2009 For Examiner’s Use (e) Look at the opinions of these two scientists: Dr Arnold The amount of carbon dioxide in the atmosphere is increasing, due to the burning of fossil fuels. The global warming that is taking place must be due to this. Dr Gupta I agree that the carbon dioxide in the atmosphere is increasing, and that the Earth is getting hotter. I just do not think that the carbon dioxide is responsible for the changes we are seeing. (i) Use what these two scientists say to explain the difference between correlation and cause. … … … …[3] (ii) Suggest what further information Dr Gupta would need to be persuaded that Dr Arnold was right. … …[1] [Total: 16]
Question paper, page 5
5 0608/05/O/N/09 © UCLES 2009 [Turn over For Examiner’s Use Life beyond Earth Mankind has long wondered if there is life on other planets. In recent years, two quite different areas of research have led to some interesting findings. Our Solar System Early science fiction stories put alien life on most planets of the Solar System, but now we know that many are far too hot or too cold. Life as we know it requires energy, and most probably also liquid water. Two places in the Solar System currently seem to offer both: the planet Mars, and Enceladus, the eighth moon of the planet Saturn. Although Mars now seems too cold and dry, it may once have had life. NASA’s Phoenix mission, which landed near Mars’ north pole, detected water in the form of ice. It also found the soil had chemicals needed for the life of microorganisms. The Cassini spaceprobe detected jets of water and other chemicals typical of life being ejected from geysers on the surface of Enceladus. This shows that there must be both water and warmth not far below the surface. Extra-solar planets These are planets around stars other than our Sun. Even the nearest star is about 4 light-years away, so these planets are very hard to detect, particularly from the Earth’s surface. Newer telescopes have been able to see these planets directly, even though they are extremely close to the stars that they orbit. Observations of the planets with these telescopes allow astronomers to work out what chemicals are in their atmospheres. In this way, chemicals such as methane and water have been detected. This does not prove that there is life on these distant planets, but it does show that the conditions needed for life are present there. Is the research worthwhile? Sending space-probes to search for possible life on Mars, or on Enceladus, is extremely costly. Even the telescope research into extra-solar planets is expensive. Many scientists and politicians feel that this research is interesting, but that the money could be much better spent on other projects. 2 This question is based on the article ‘Life beyond Earth’. (a) Explain why scientists would not expect to find life on (i) the planet Mercury, which orbits very close to the Sun …[1] (ii) the dwarf planet Pluto. …[1]
Question paper, page 6
6 0608/05/O/N/09 © UCLES 2009 For Examiner’s Use (b) There have been more space missions to Mars than to any other planet. Suggest one reason why. … …[1] (c) Write down two chemicals, that have been discovered in moons and planets, which show the possibility of life. … and …[2] (d) (i) State the meaning of extra-solar planets. … …[1] (ii) Detecting chemicals in the atmosphere of extra-solar planets is not easy from the Earth’s surface, but it has been done using telescopes in orbit around the Earth. Explain why orbiting telescopes are able to make better observations than those on the Earth’s surface. … … …[2] (e) The nearest star to our Solar System is 4 light-years away. Explain the meaning of the unit light-year. … …[2] (f) Many people think that the money spent on astronomical research could be better spent on projects on Earth. (i) Suggest one project on Earth which they might prefer and give one reason for spending money on this. … …[2] (ii) Give reasons for spending money on space research. … …[2] [Total: 14]
Question paper, page 7
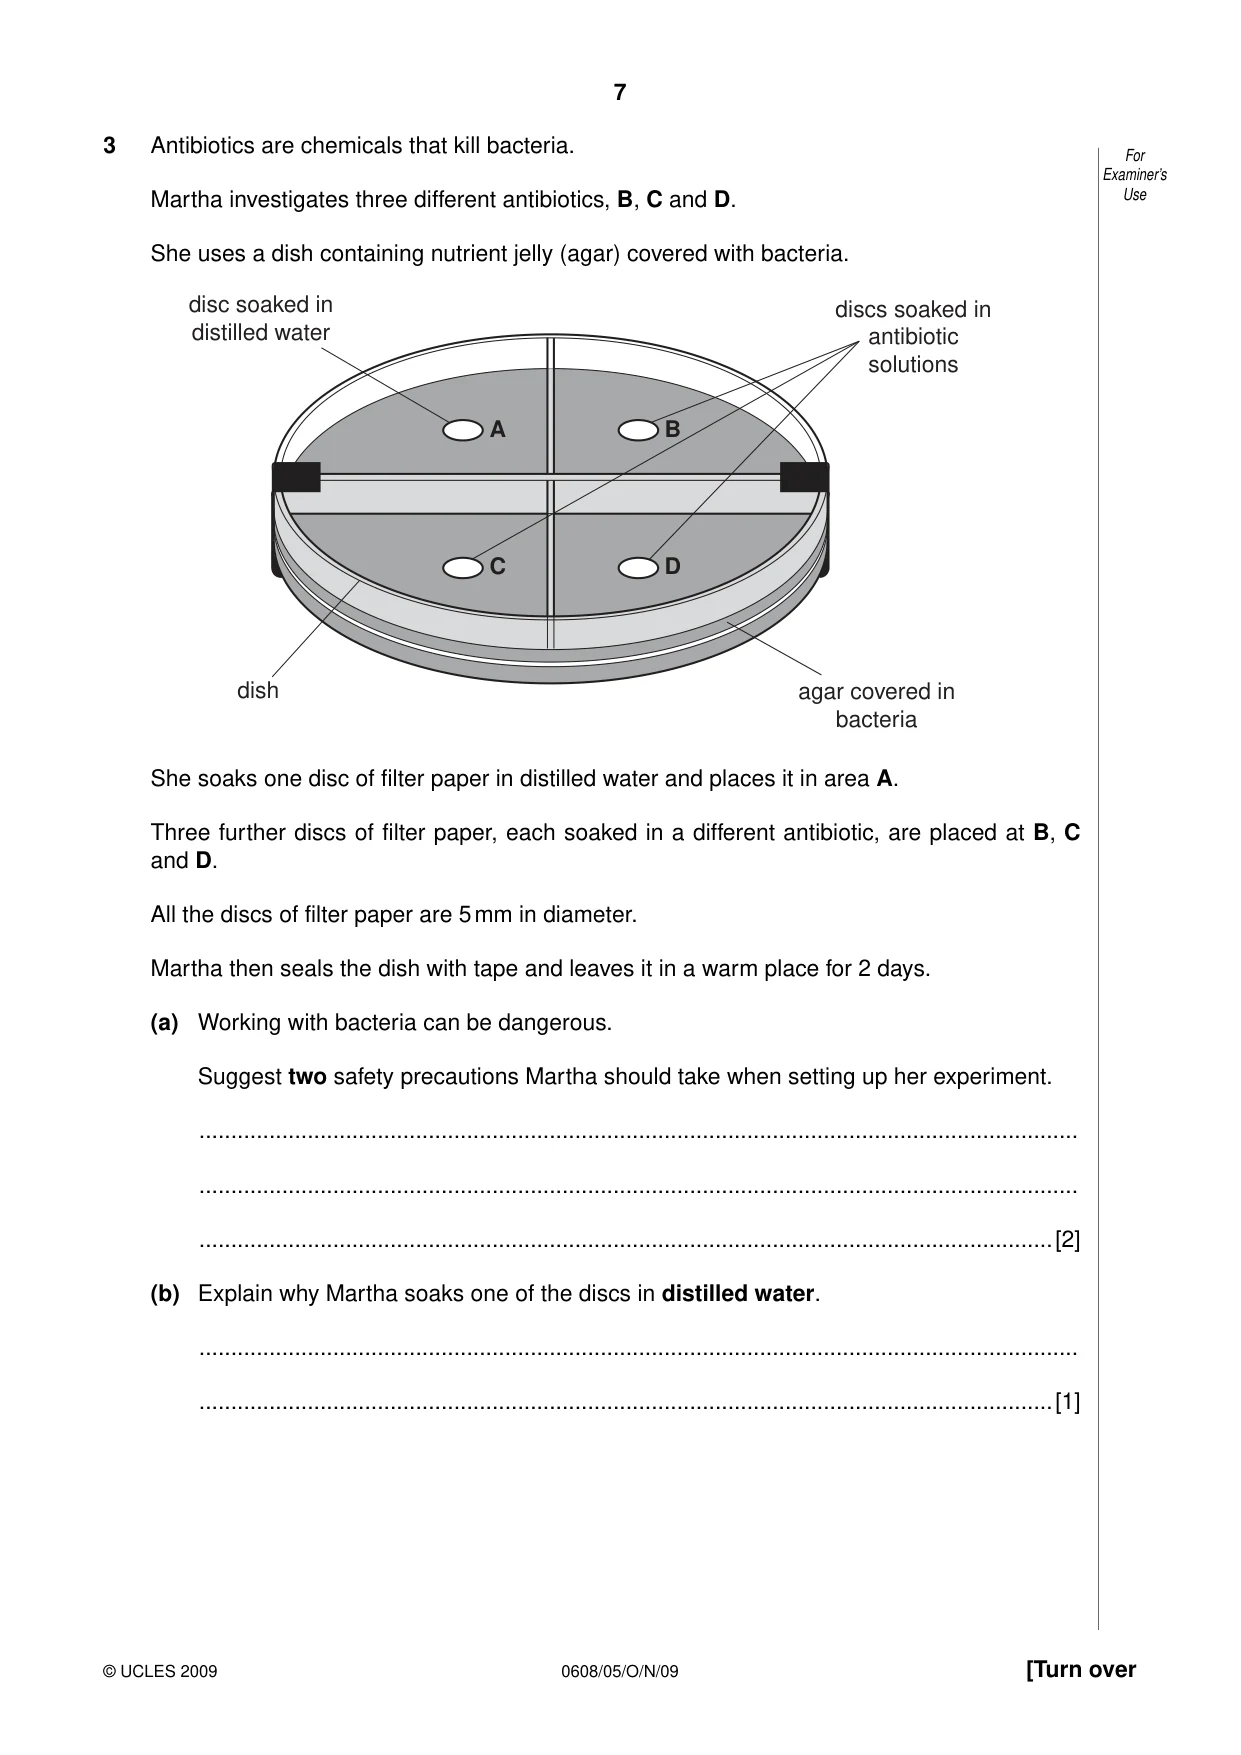
7 0608/05/O/N/09 © UCLES 2009 [Turn over For Examiner’s Use 3 Antibiotics are chemicals that kill bacteria. Martha investigates three different antibiotics, B, C and D. She uses a dish containing nutrient jelly (agar) covered with bacteria. A B C dish agar covered in bacteria disc soaked in distilled water discs soaked in antibiotic solutions D She soaks one disc of filter paper in distilled water and places it in area A. Three further discs of filter paper, each soaked in a different antibiotic, are placed at B, C and D. All the discs of filter paper are 5 mm in diameter. Martha then seals the dish with tape and leaves it in a warm place for 2 days. (a) Working with bacteria can be dangerous. Suggest two safety precautions Martha should take when setting up her experiment. … … …[2] (b) Explain why Martha soaks one of the discs in distilled water. … …[1]
Question paper, page 8
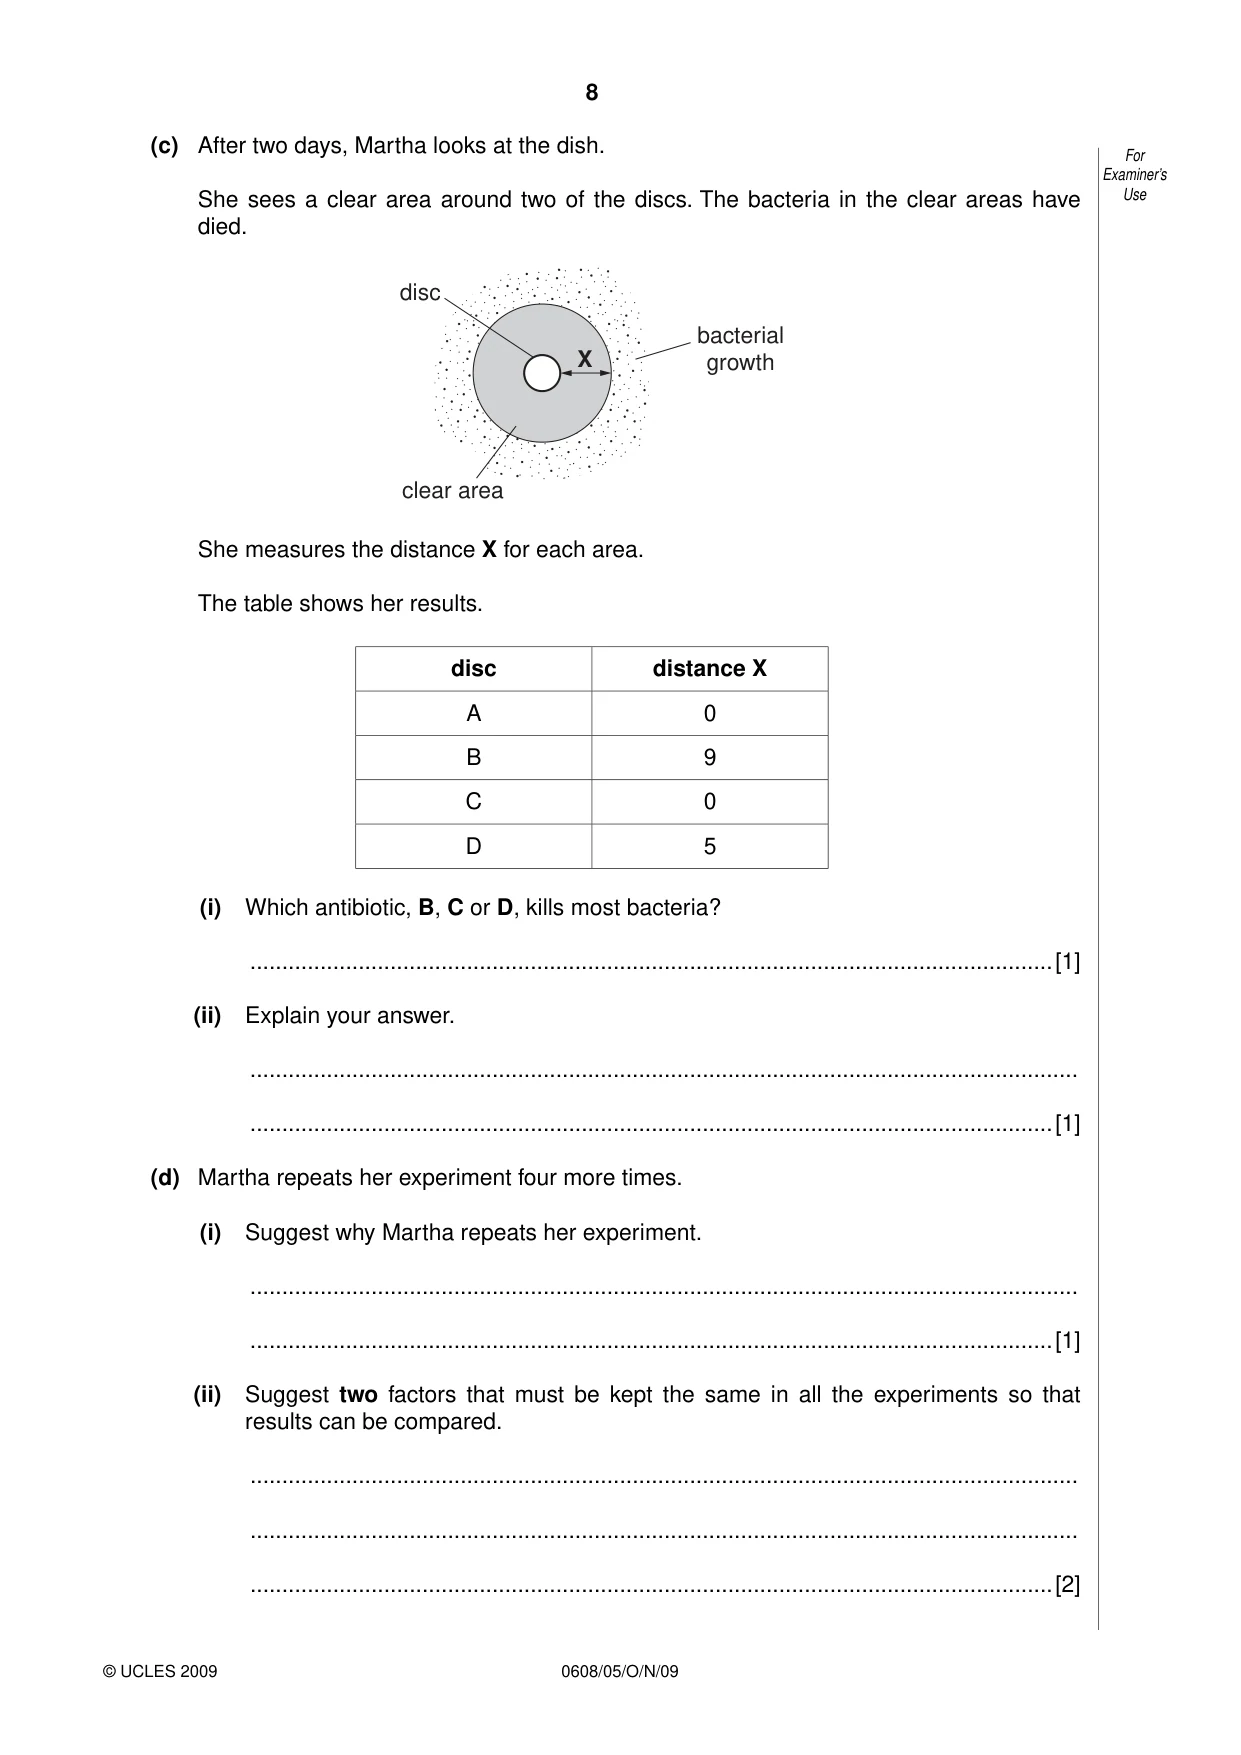
0608/05/O/N/09 © UCLES 2009 For Examiner’s Use (c) After two days, Martha looks at the dish. She sees a clear area around two of the discs. The bacteria in the clear areas have died. X clear area disc bacterial growth She measures the distance X for each area. The table shows her results. disc distance X A 0 B 9 C 0 D 5 (i) Which antibiotic, B, C or D, kills most bacteria? …[1] (ii) Explain your answer. … …[1] (d) Martha repeats her experiment four more times. (i) Suggest why Martha repeats her experiment. … …[1] (ii) Suggest two factors that must be kept the same in all the experiments so that results can be compared. … … …[2] 8
Question paper, page 9
9 0608/05/O/N/09 © UCLES 2009 [Turn over For Examiner’s Use (e) Martha notices that, in all of her experiments, no bacteria are killed by antibiotic C. Suggest and explain a reason for this. … … … …[2] [Total: 10]
Question paper, page 10
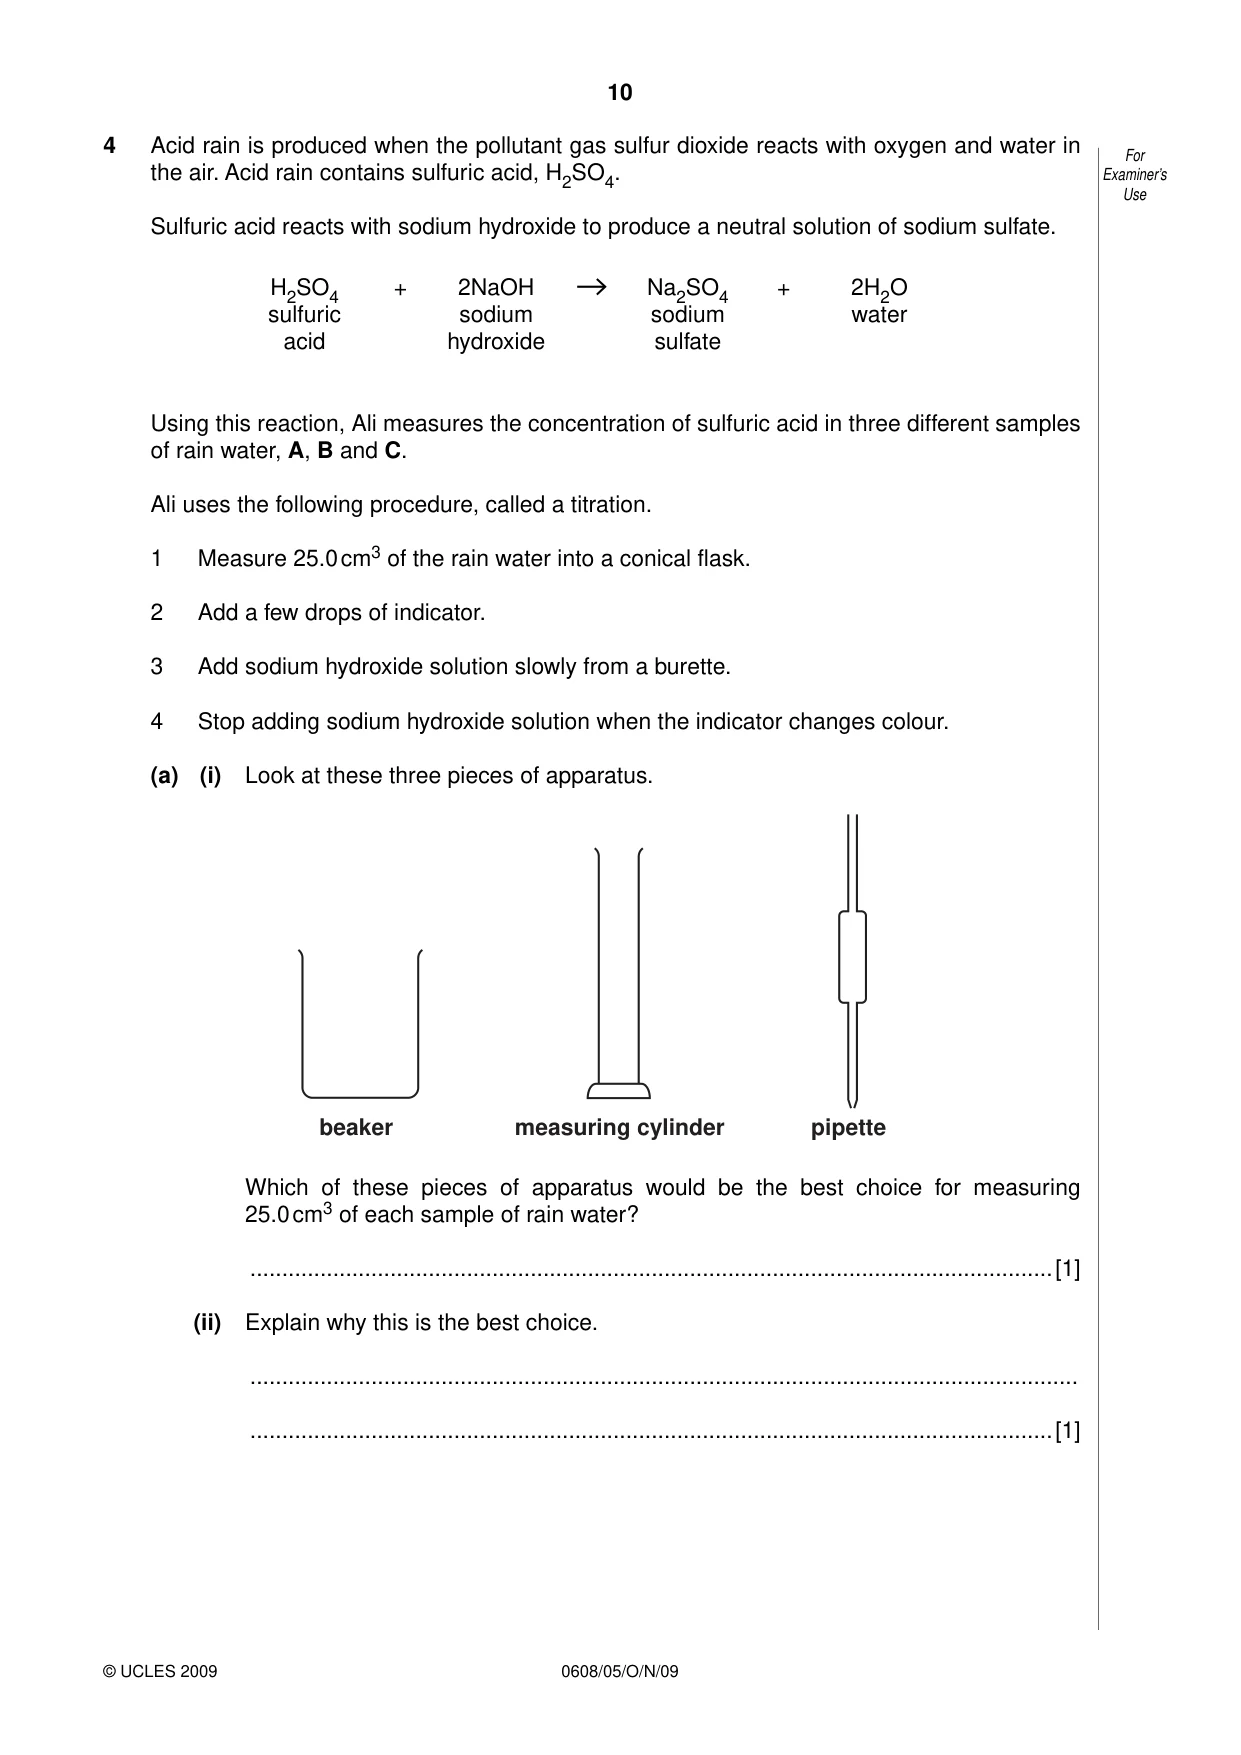
10 0608/05/O/N/09 © UCLES 2009 For Examiner’s Use 4 Acid rain is produced when the pollutant gas sulfur dioxide reacts with oxygen and water in the air. Acid rain contains sulfuric acid, H2SO4. Sulfuric acid reacts with sodium hydroxide to produce a neutral solution of sodium sulfate. H2SO4 sulfuric acid + 2NaOH sodium hydroxide Na2SO4 sodium sulfate + 2H2O water Using this reaction, Ali measures the concentration of sulfuric acid in three different samples of rain water, A, B and C. Ali uses the following procedure, called a titration. 1 Measure 25.0 cm3 of the rain water into a conical flask. 2 Add a few drops of indicator. 3 Add sodium hydroxide solution slowly from a burette. 4 Stop adding sodium hydroxide solution when the indicator changes colour. (a) (i) Look at these three pieces of apparatus. beaker measuring cylinder pipette Which of these pieces of apparatus would be the best choice for measuring 25.0 cm3 of each sample of rain water? …[1] (ii) Explain why this is the best choice. … …[1]
Question paper, page 11
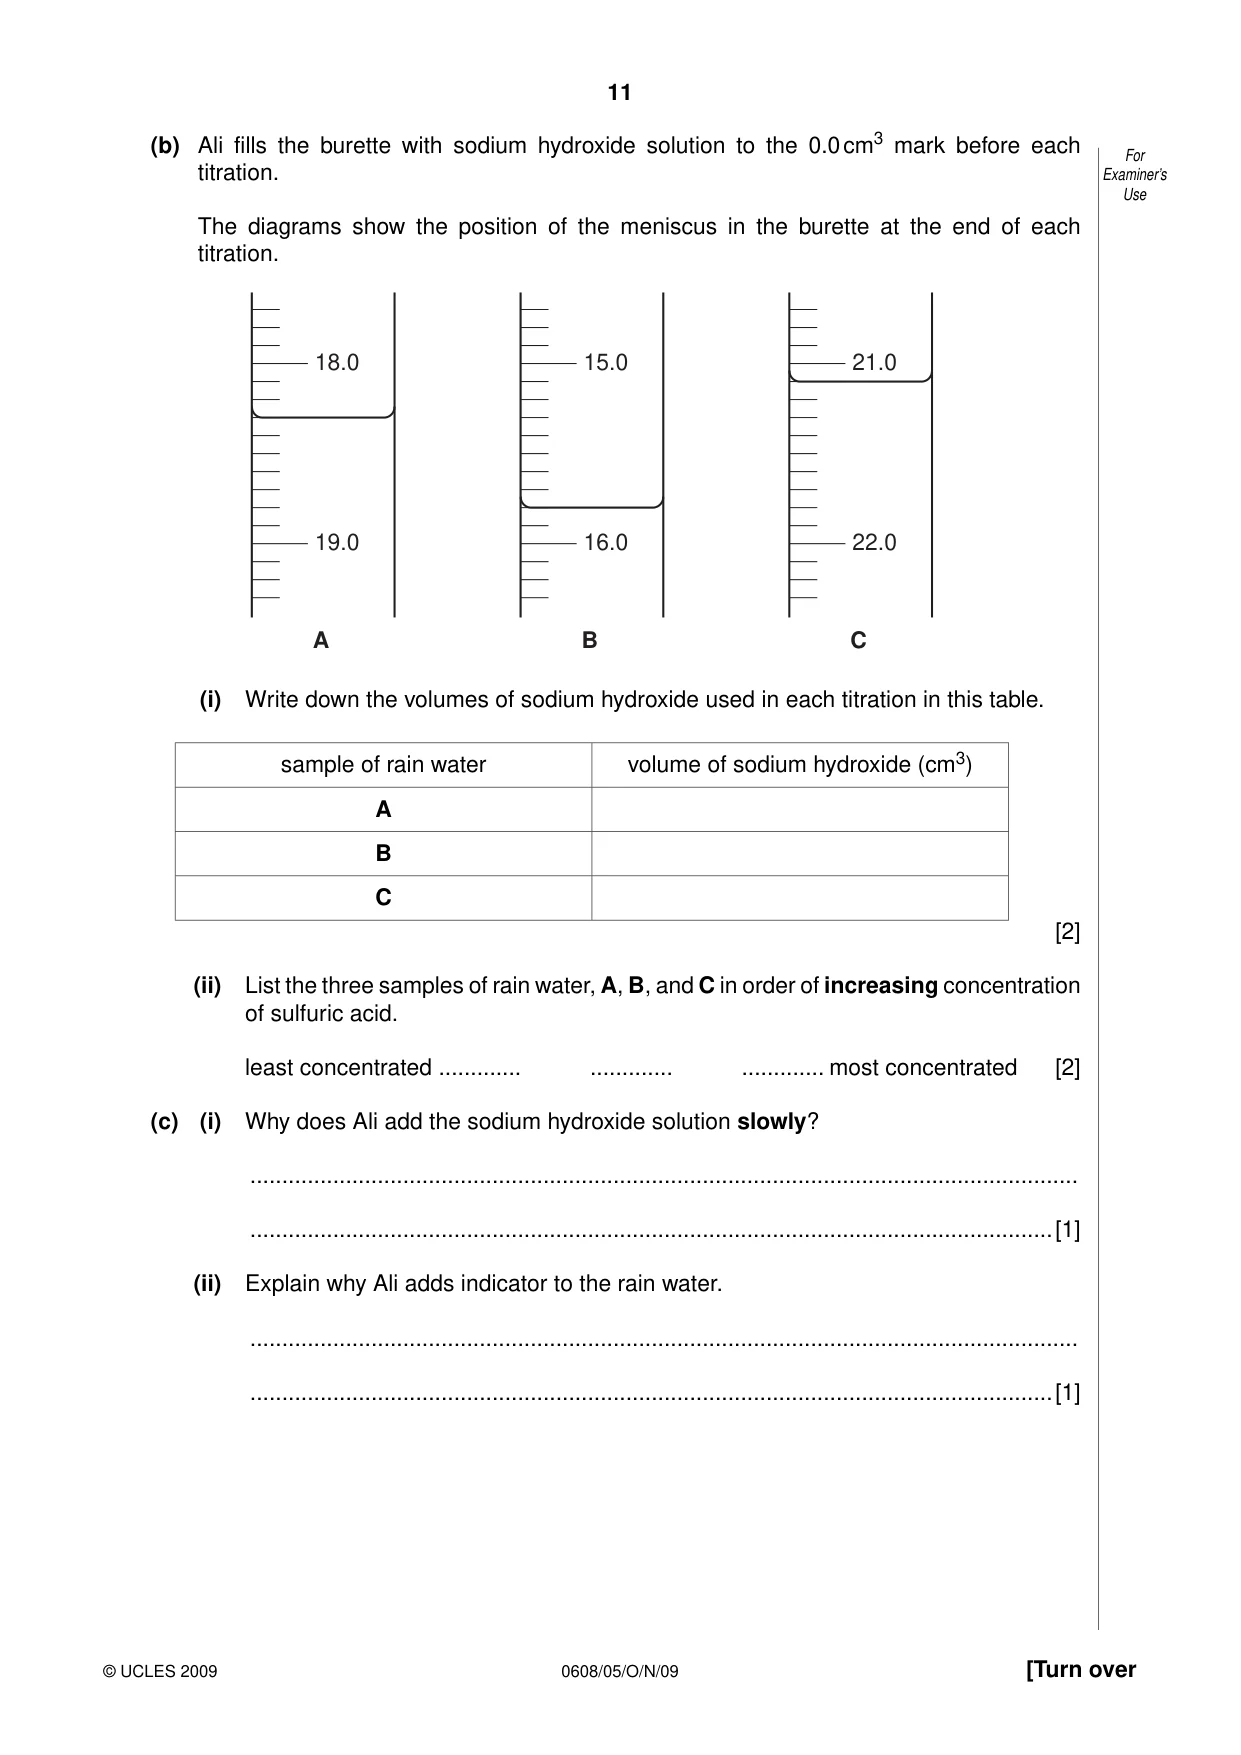
11 0608/05/O/N/09 © UCLES 2009 [Turn over For Examiner’s Use (b) Ali fills the burette with sodium hydroxide solution to the 0.0 cm3 mark before each titration. The diagrams show the position of the meniscus in the burette at the end of each titration. 18.0 19.0 A 15.0 16.0 B 21.0 22.0 C (i) Write down the volumes of sodium hydroxide used in each titration in this table. sample of rain water volume of sodium hydroxide (cm3) A B C [2] (ii) List the three samples of rain water, A, B, and C in order of increasing concentration of sulfuric acid. least concentrated … … … most concentrated [2] (c) (i) Why does Ali add the sodium hydroxide solution slowly? … …[1] (ii) Explain why Ali adds indicator to the rain water. … …[1]
Question paper, page 12
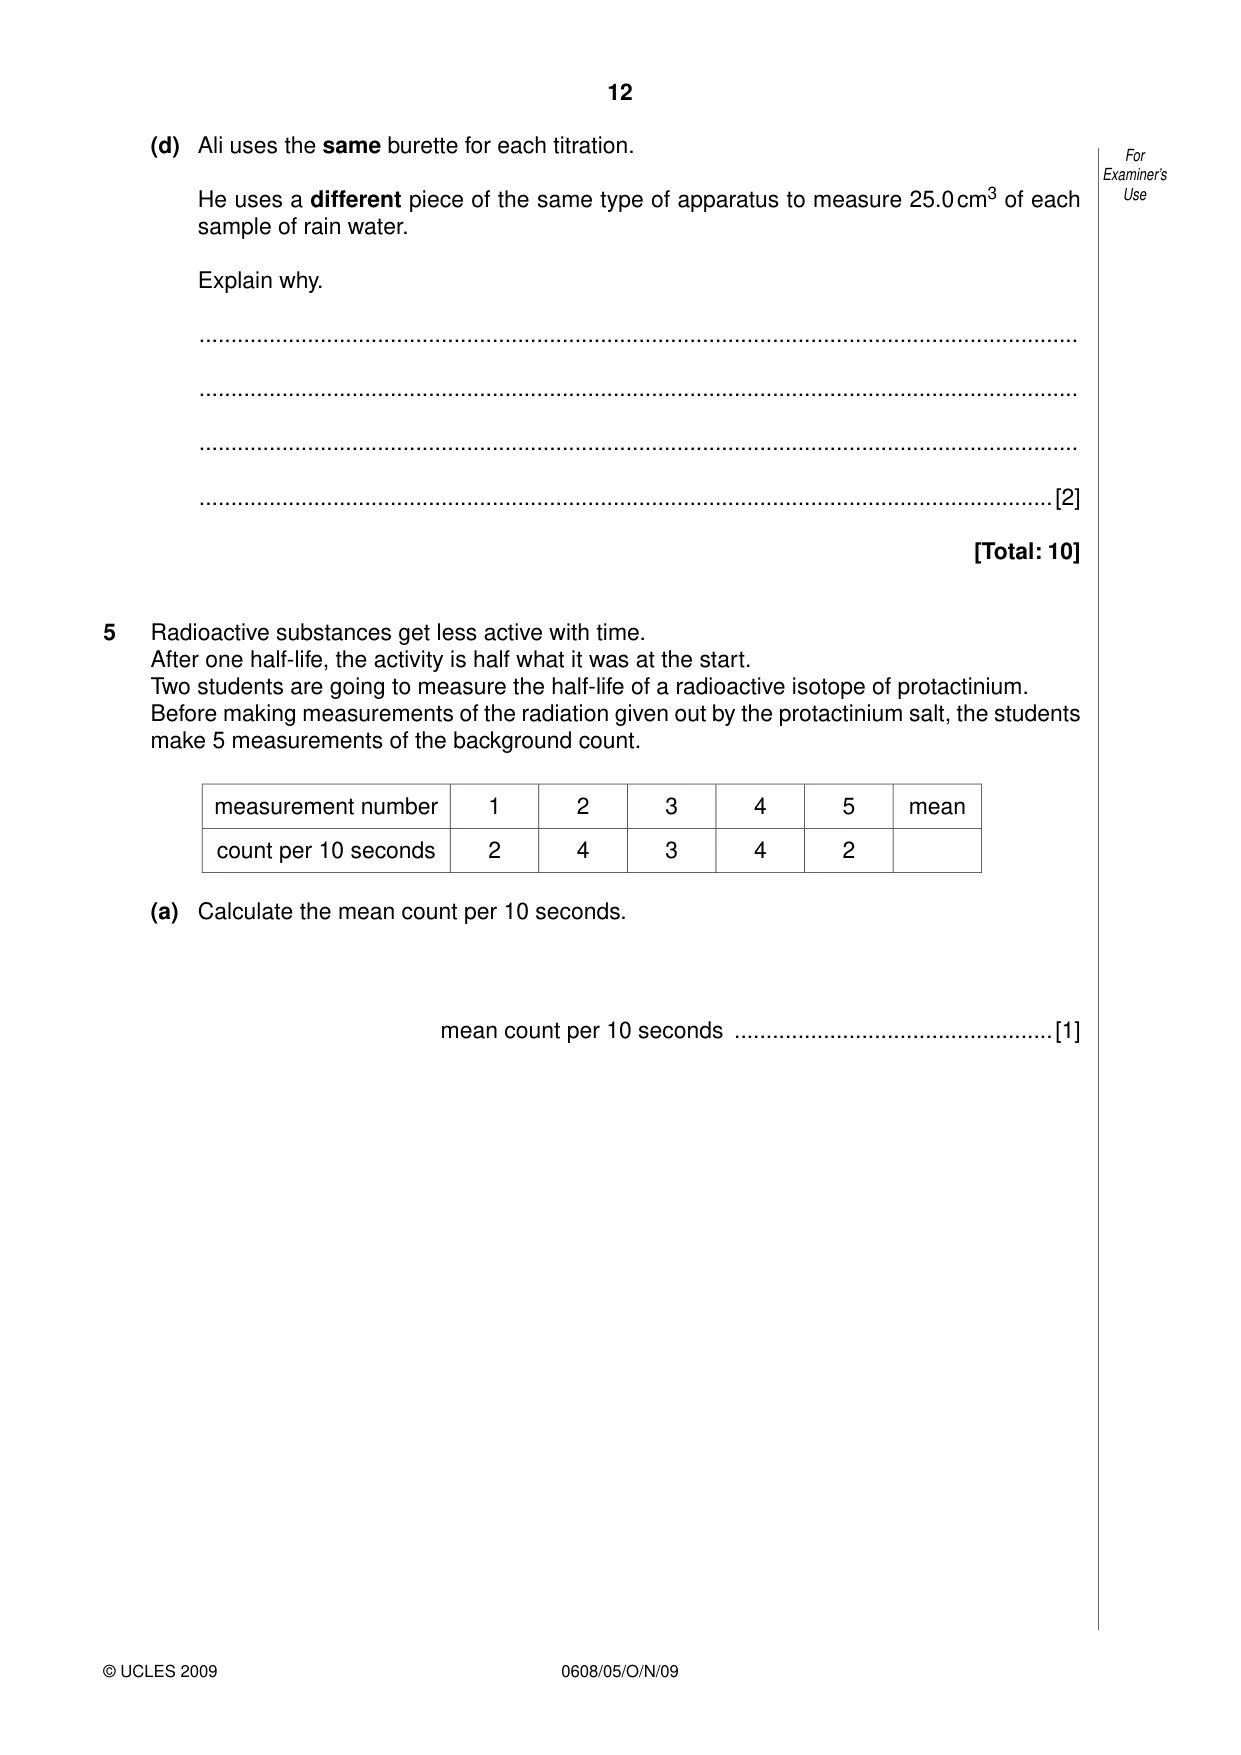
12 0608/05/O/N/09 © UCLES 2009 For Examiner’s Use (d) Ali uses the same burette for each titration. He uses a different piece of the same type of apparatus to measure 25.0 cm3 of each sample of rain water. Explain why. … … … …[2] [Total: 10] 5 Radioactive substances get less active with time. After one half-life, the activity is half what it was at the start. Two students are going to measure the half-life of a radioactive isotope of protactinium. Before making measurements of the radiation given out by the protactinium salt, the students make 5 measurements of the background count. measurement number 1 2 3 4 5 mean count per 10 seconds 2 4 3 4 2 (a) Calculate the mean count per 10 seconds. mean count per 10 seconds …[1]
Question paper, page 13
13 0608/05/O/N/09 © UCLES 2009 [Turn over For Examiner’s Use (b) A solution of the protactinium salt is freshly prepared and put into a bottle. A radiation detector is placed next to the bottle. solution of protactinium salt detector counter The count rate is recorded for three minutes. The results are shown in the table. time from start (seconds) 0 20 40 60 80 100 140 180 corrected count per 10 seconds 260 215 170 149 112 98 68 46 (i) Each reading on the counter was corrected by subtracting the mean background count. Explain why the students had to subtract the background count. … …[1] (ii) At first the students recorded the rate every 20 seconds, but later only every 40 seconds. Explain why. … …[2] (iii) The results from this experiment are very variable. Suggest how the students could get data which are more reliable. … … …[2]
Question paper, page 14
14 0608/05/O/N/09 © UCLES 2009 For Examiner’s Use (c) The data from the table are plotted on the graph below. The first three data points are missing. 0 0 50 100 150 200 250 300 10 20 30 40 50 60 time in seconds corrected count per 10 seconds 70 80 90 110 120 130 140 150 160 170 180 100 (i) Add the first three data points to the graph. [2] (ii) Draw a best-fit curve through the points. [1] (iii) The half-life is the time taken for the count to drop to half its value. The half-life of protactinium is 70 seconds. Explain whether the graph confirms this. Show your working on the graph or in this space. [1] [Total: 10]
Question paper, page 16
16 0608/05/O/N/09 BLANK PAGE Copyright Acknowledgements: Question 1 © South Inylchek Glacier; iStockphoto. Permission to reproduce items where third-party owned material protected by copyright is included has been sought and cleared where possible. Every reasonable effort has been made by the publisher (UCLES) to trace copyright holders, but if any items requiring clearance have unwittingly been included, the publisher will be pleased to make amends at the earliest possible opportunity. University of Cambridge International Examinations is part of the Cambridge Assessment Group. Cambridge Assessment is the brand name of University of Cambridge Local Examinations Syndicate (UCLES), which is itself a department of the University of Cambridge.
Mark scheme, page 1
UNIVERSITY OF CAMBRIDGE INTERNATIONAL EXAMINATIONS International General Certificate of Secondary Education MARK SCHEME for the October/November 2009 question paper for the guidance of teachers 0608 21ST CENTURY SCIENCE 0608/05 Paper 5 (Comprehension, Practical Procedures, Data Handling and Analysis), maximum raw mark 60 This mark scheme is published as an aid to teachers and candidates, to indicate the requirements of the examination. It shows the basis on which Examiners were instructed to award marks. It does not indicate the details of the discussions that took place at an Examiners’ meeting before marking began, which would have considered the acceptability of alternative answers. Mark schemes must be read in conjunction with the question papers and the report on the examination. • CIE will not enter into discussions or correspondence in connection with these mark schemes. CIE is publishing the mark schemes for the October/November 2009 question papers for most IGCSE, GCE Advanced Level and Advanced Subsidiary Level syllabuses and some Ordinary Level syllabuses. www.XtremePapers.com
Mark scheme, page 2
Page 2 Mark Scheme: Teachers’ version Syllabus Paper IGCSE – October/November 2009 0608 05 © UCLES 2009 Section A 1 (a) (i) cold / always below 0°C [1] (ii) 2006 [1] (b) light (shorter λ/higher energy photons) transmitted through atmosphere (1); Earth absorbs this energy (1); re-emits IR/heat/longer λ radiation/lower energy photons (1); more of this is absorbed by carbon dioxide in atmosphere (1) Any 3 points [3] (c) (i) 2036 2070 [2] (ii) lack of melt water into rivers (1); e.g. ‘feed’ rivers deliver less water to Asia/dry up (1); huge population in those areas (1); possible drought (1); Any 3 points allow flooding as short term problem [3] (d) flooding of cities/farmland (1); more detail, e.g. most people live near sea level, most productive farmland lost, destruction of roads (1) Second mark may be example of country affected. [2] (e) (i) explanation of correlation (1); explanation of cause (1); correct reference to either scientist (1) Any 3 points [3] (ii) A clear mechanism to explain the causal link/ further data on different possible mechanisms to show that the CO2 mechanism is the most likely correct one. [1] [Total: 16]
Mark scheme, page 3
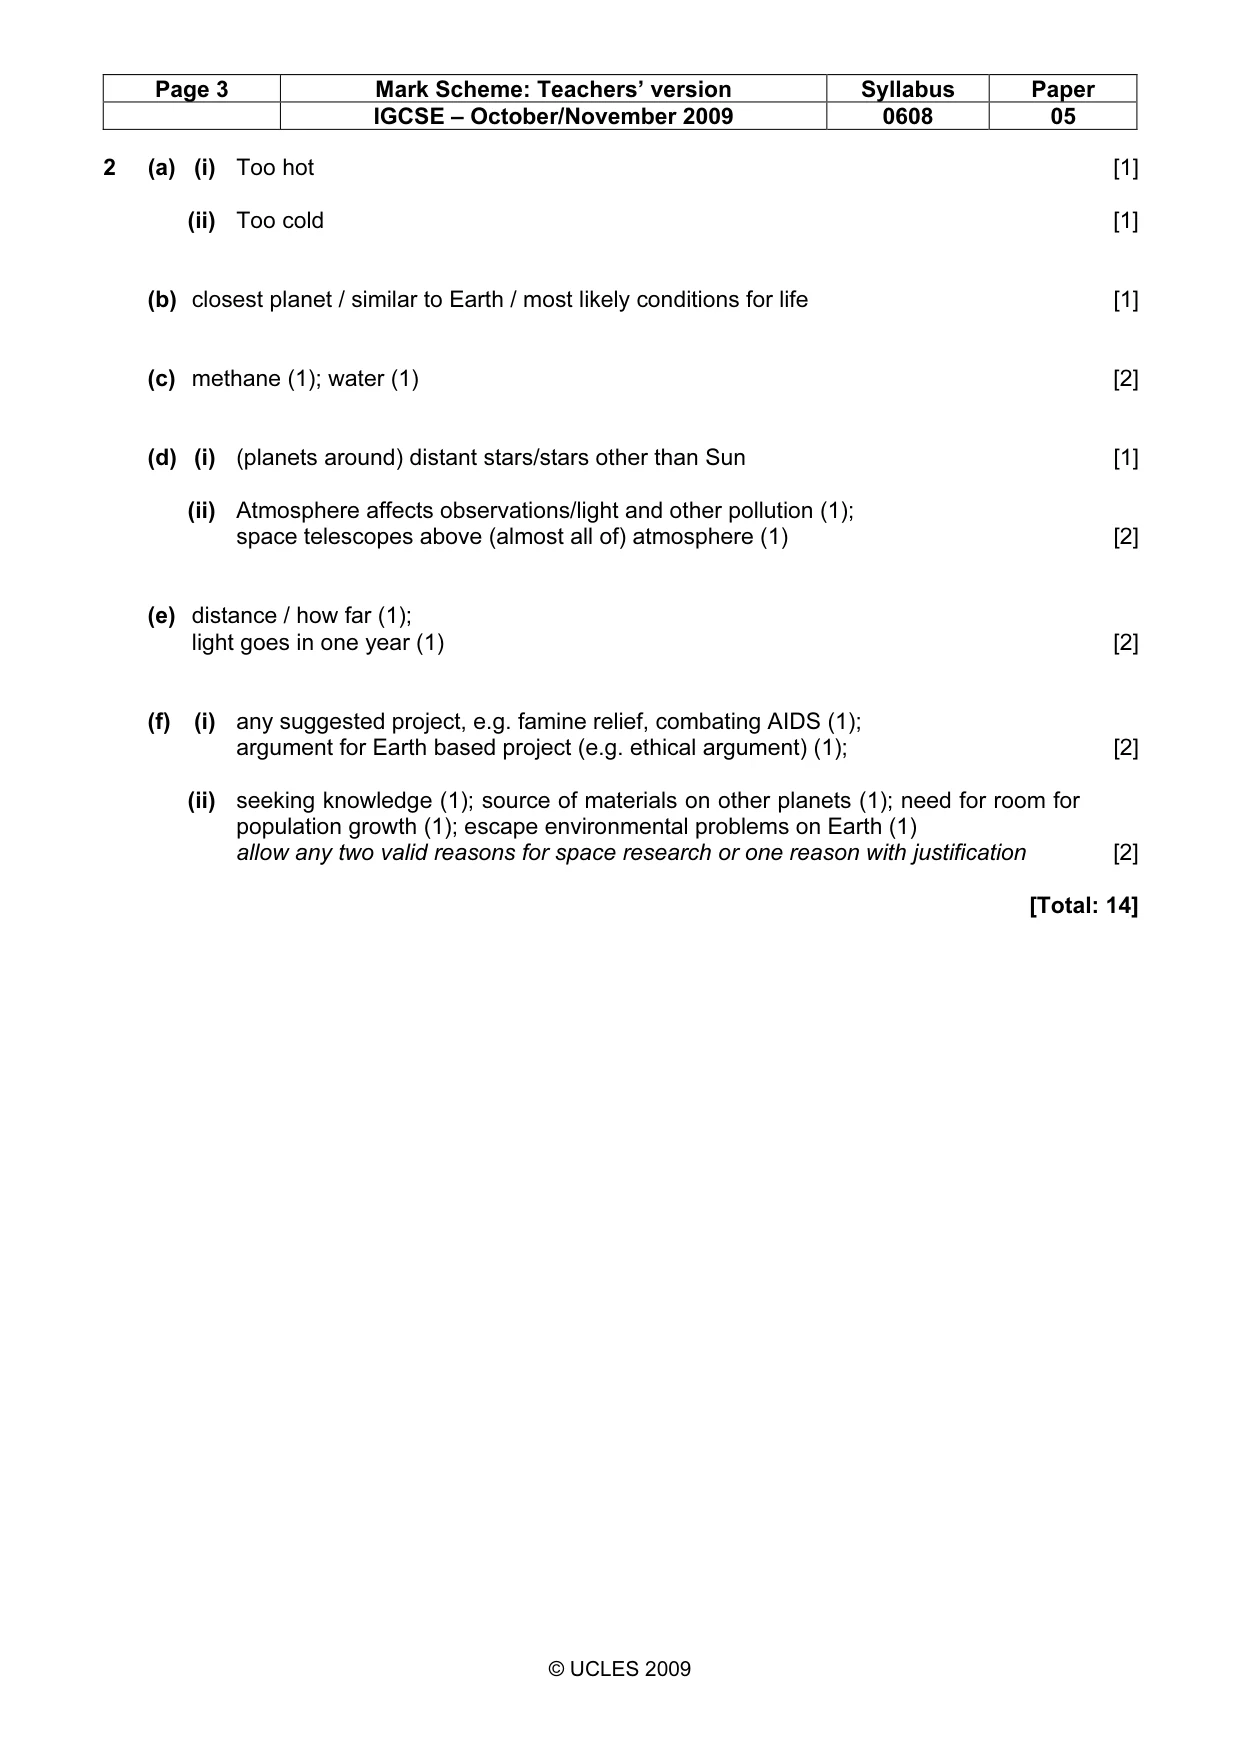
Page 3 Mark Scheme: Teachers’ version Syllabus Paper IGCSE – October/November 2009 0608 05 © UCLES 2009 2 (a) (i) Too hot [1] (ii) Too cold [1] (b) closest planet / similar to Earth / most likely conditions for life [1] (c) methane (1); water (1) [2] (d) (i) (planets around) distant stars/stars other than Sun [1] (ii) Atmosphere affects observations/light and other pollution (1); space telescopes above (almost all of) atmosphere (1) [2] (e) distance / how far (1); light goes in one year (1) [2] (f) (i) any suggested project, e.g. famine relief, combating AIDS (1); argument for Earth based project (e.g. ethical argument) (1); [2] (ii) seeking knowledge (1); source of materials on other planets (1); need for room for population growth (1); escape environmental problems on Earth (1) allow any two valid reasons for space research or one reason with justification [2] [Total: 14]
Mark scheme, page 4
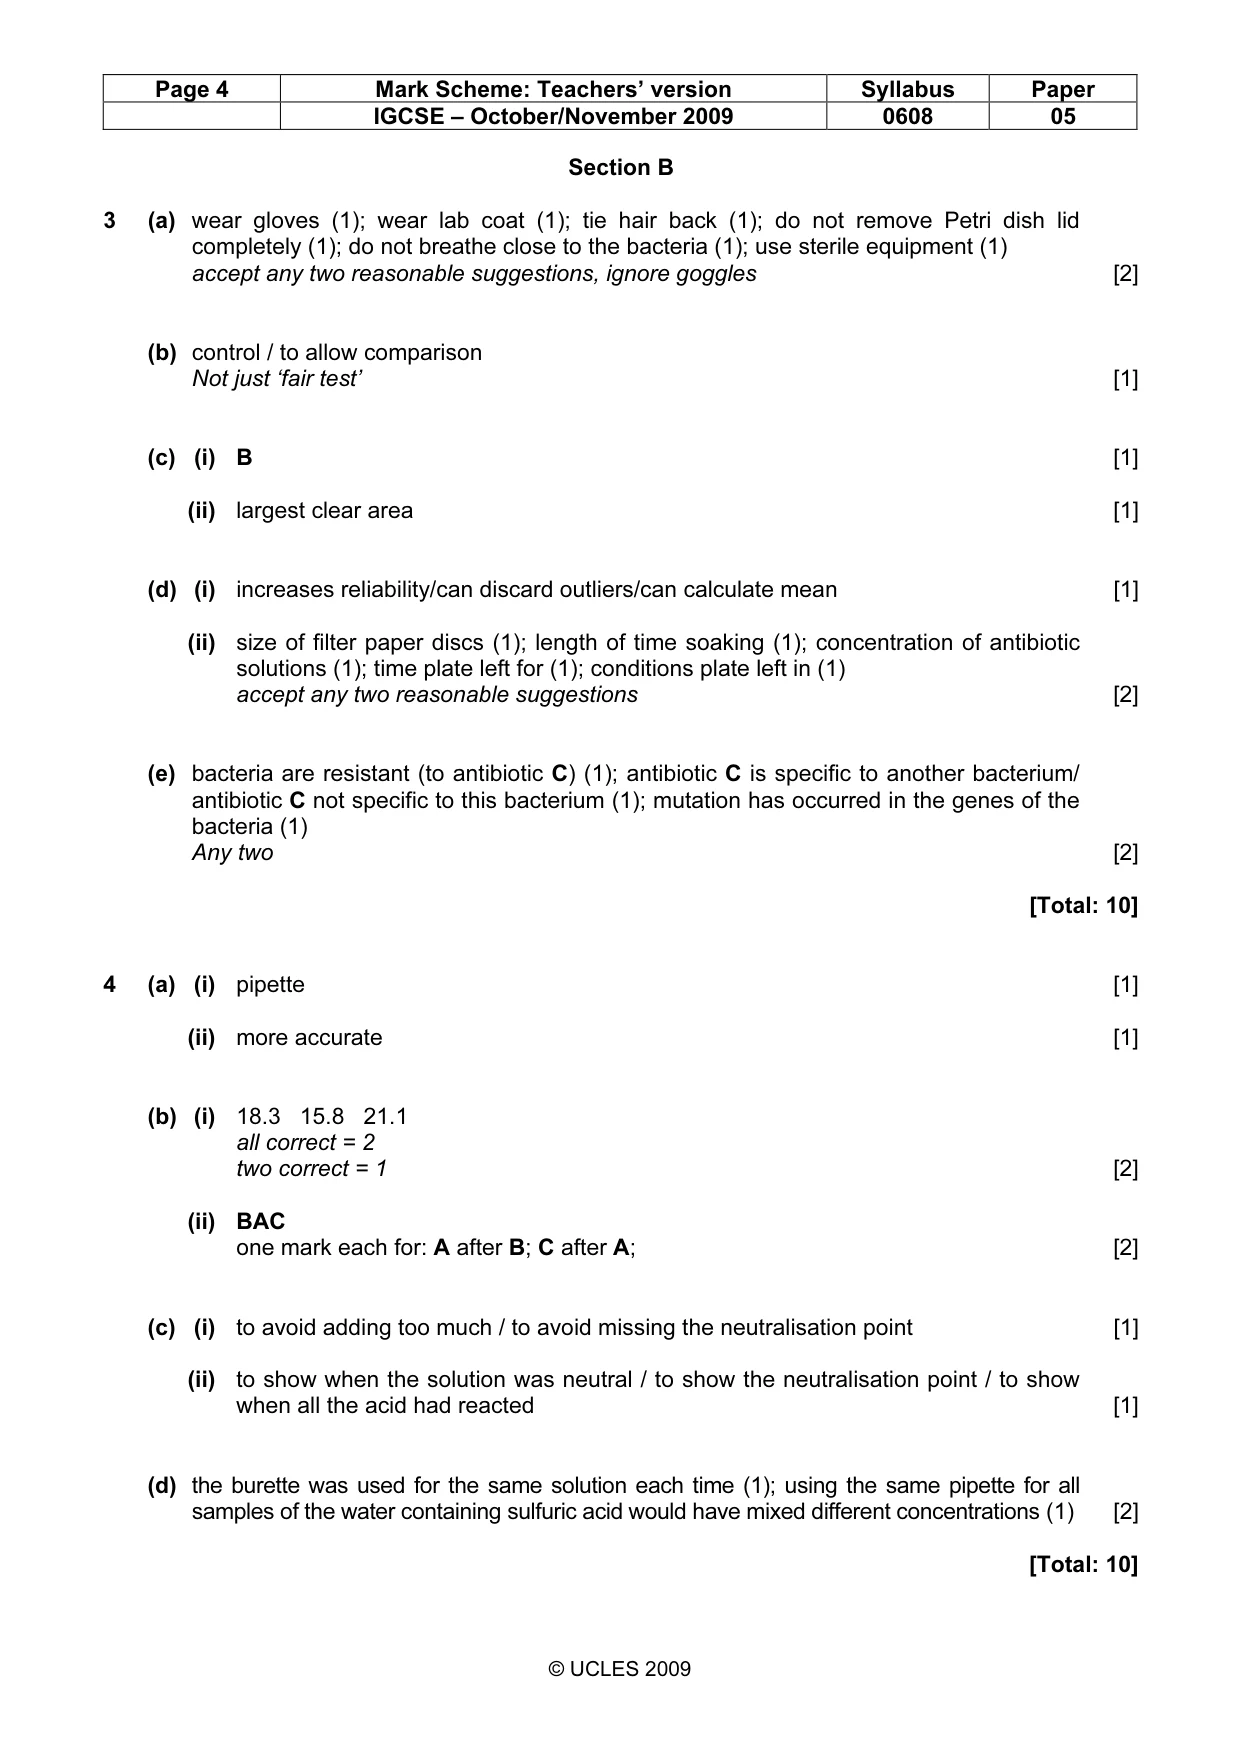
Page 4 Mark Scheme: Teachers’ version Syllabus Paper IGCSE – October/November 2009 0608 05 © UCLES 2009 Section B 3 (a) wear gloves (1); wear lab coat (1); tie hair back (1); do not remove Petri dish lid completely (1); do not breathe close to the bacteria (1); use sterile equipment (1) accept any two reasonable suggestions, ignore goggles [2] (b) control / to allow comparison Not just ‘fair test’ [1] (c) (i) B [1] (ii) largest clear area [1] (d) (i) increases reliability/can discard outliers/can calculate mean [1] (ii) size of filter paper discs (1); length of time soaking (1); concentration of antibiotic solutions (1); time plate left for (1); conditions plate left in (1) accept any two reasonable suggestions [2] (e) bacteria are resistant (to antibiotic C) (1); antibiotic C is specific to another bacterium/ antibiotic C not specific to this bacterium (1); mutation has occurred in the genes of the bacteria (1) Any two [2] [Total: 10] 4 (a) (i) pipette [1] (ii) more accurate [1] (b) (i) 18.3 15.8 21.1 all correct = 2 two correct = 1 [2] (ii) BAC one mark each for: A after B; C after A; [2] (c) (i) to avoid adding too much / to avoid missing the neutralisation point [1] (ii) to show when the solution was neutral / to show the neutralisation point / to show when all the acid had reacted [1] (d) the burette was used for the same solution each time (1); using the same pipette for all samples of the water containing sulfuric acid would have mixed different concentrations (1) [2] [Total: 10]
Mark scheme, page 5
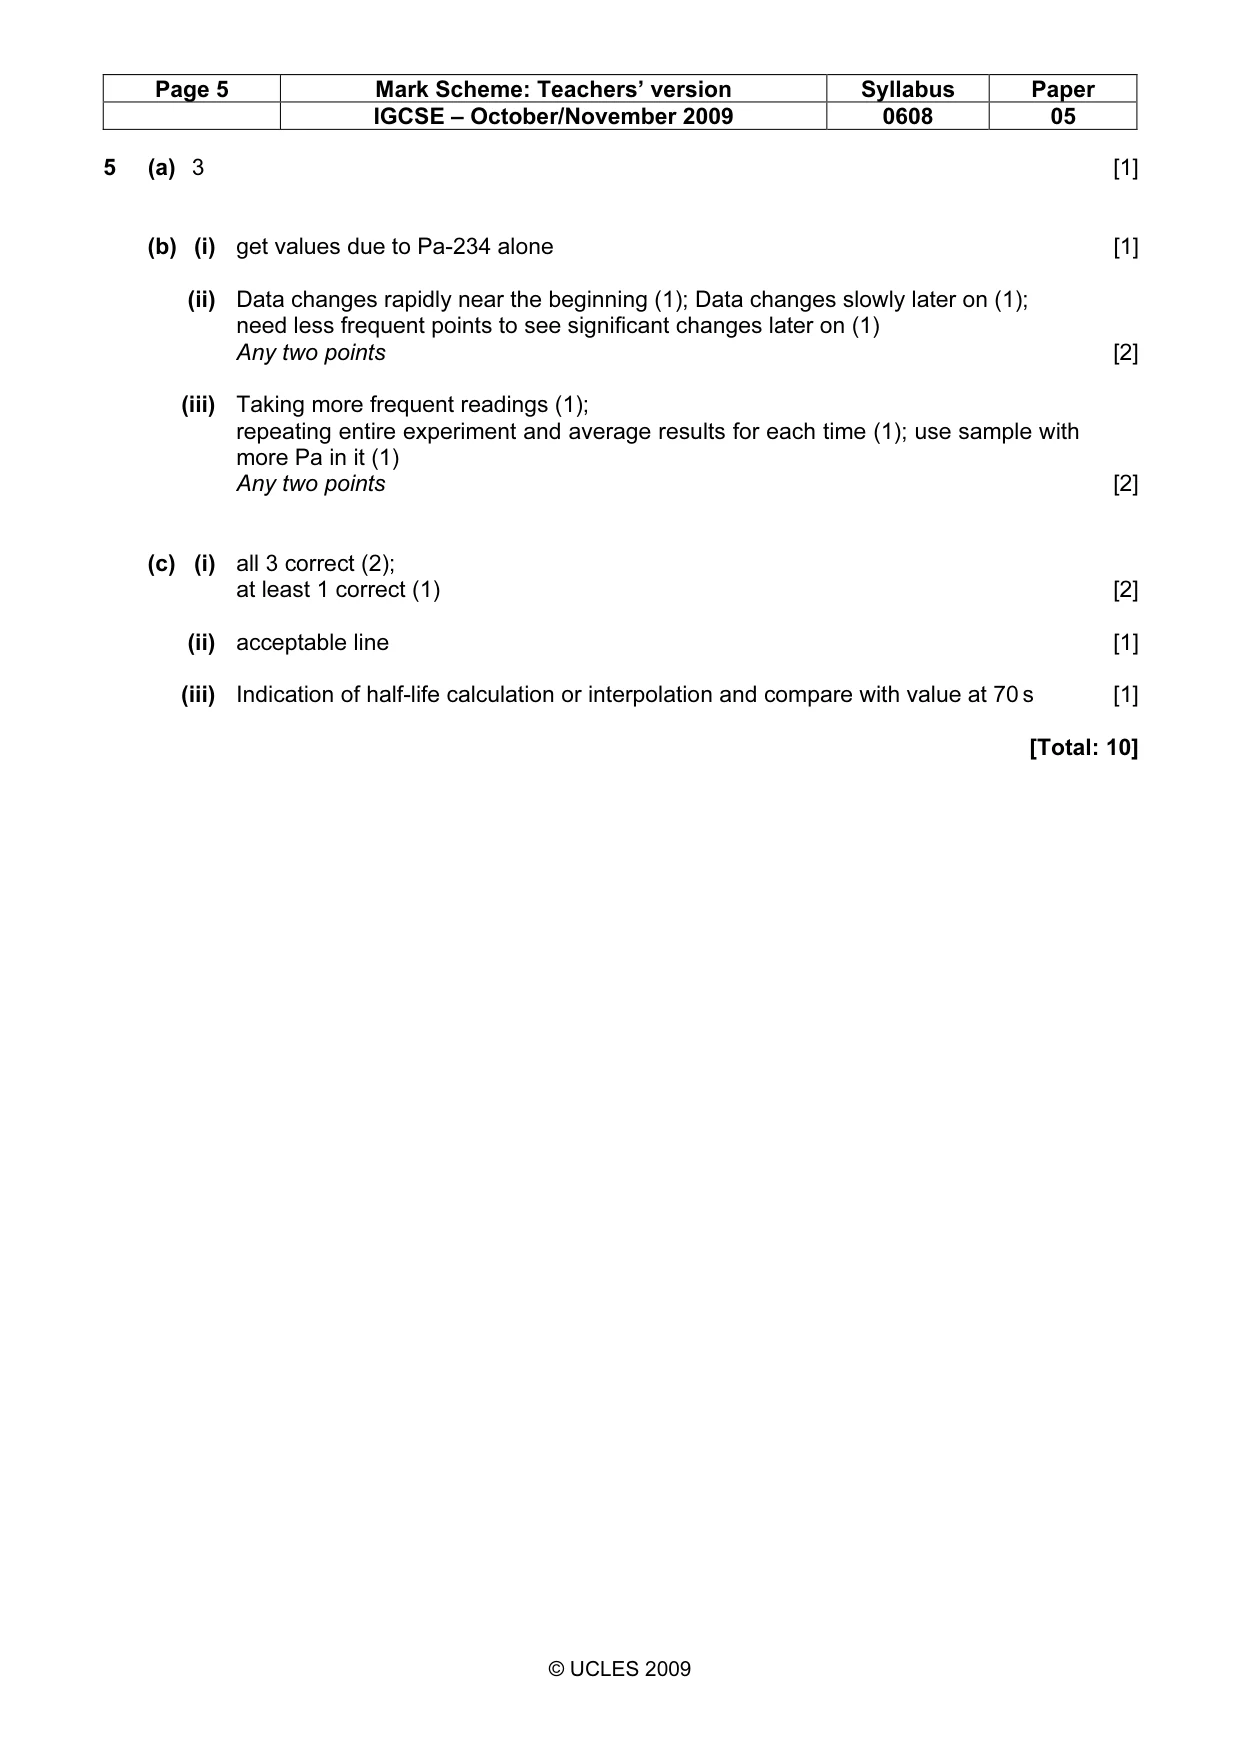
Page 5 Mark Scheme: Teachers’ version Syllabus Paper IGCSE – October/November 2009 0608 05 © UCLES 2009 5 (a) 3 [1] (b) (i) get values due to Pa-234 alone [1] (ii) Data changes rapidly near the beginning (1); Data changes slowly later on (1); need less frequent points to see significant changes later on (1) Any two points [2] (iii) Taking more frequent readings (1); repeating entire experiment and average results for each time (1); use sample with more Pa in it (1) Any two points [2] (c) (i) all 3 correct (2); at least 1 correct (1) [2] (ii) acceptable line [1] (iii) Indication of half-life calculation or interpolation and compare with value at 70 s [1] [Total: 10]
What you needed in this session
Cambridge’s own grade thresholds for 2009 Oct/Nov, Paper 5 · Variant 1. A higher threshold means an easier paper — the bar moves with how the cohort did.