Cambridge IGCSE Sciences - Co-ordinated (Double) 0654 — 2025 Oct/Nov Paper 6 · Variant 3
0654/63/O/N/25 · 6 questions · 60 marks · 90 min
The question paper and its mark scheme, free to read here and free to download. This is Cambridge’s own paper, exactly as it was sat.
Question paper24 pages



Mark scheme11 pages
Answers below. Sit the paper first if you are practising.
Questions as text
Q1 · A student investigates the uptake of water by a plant
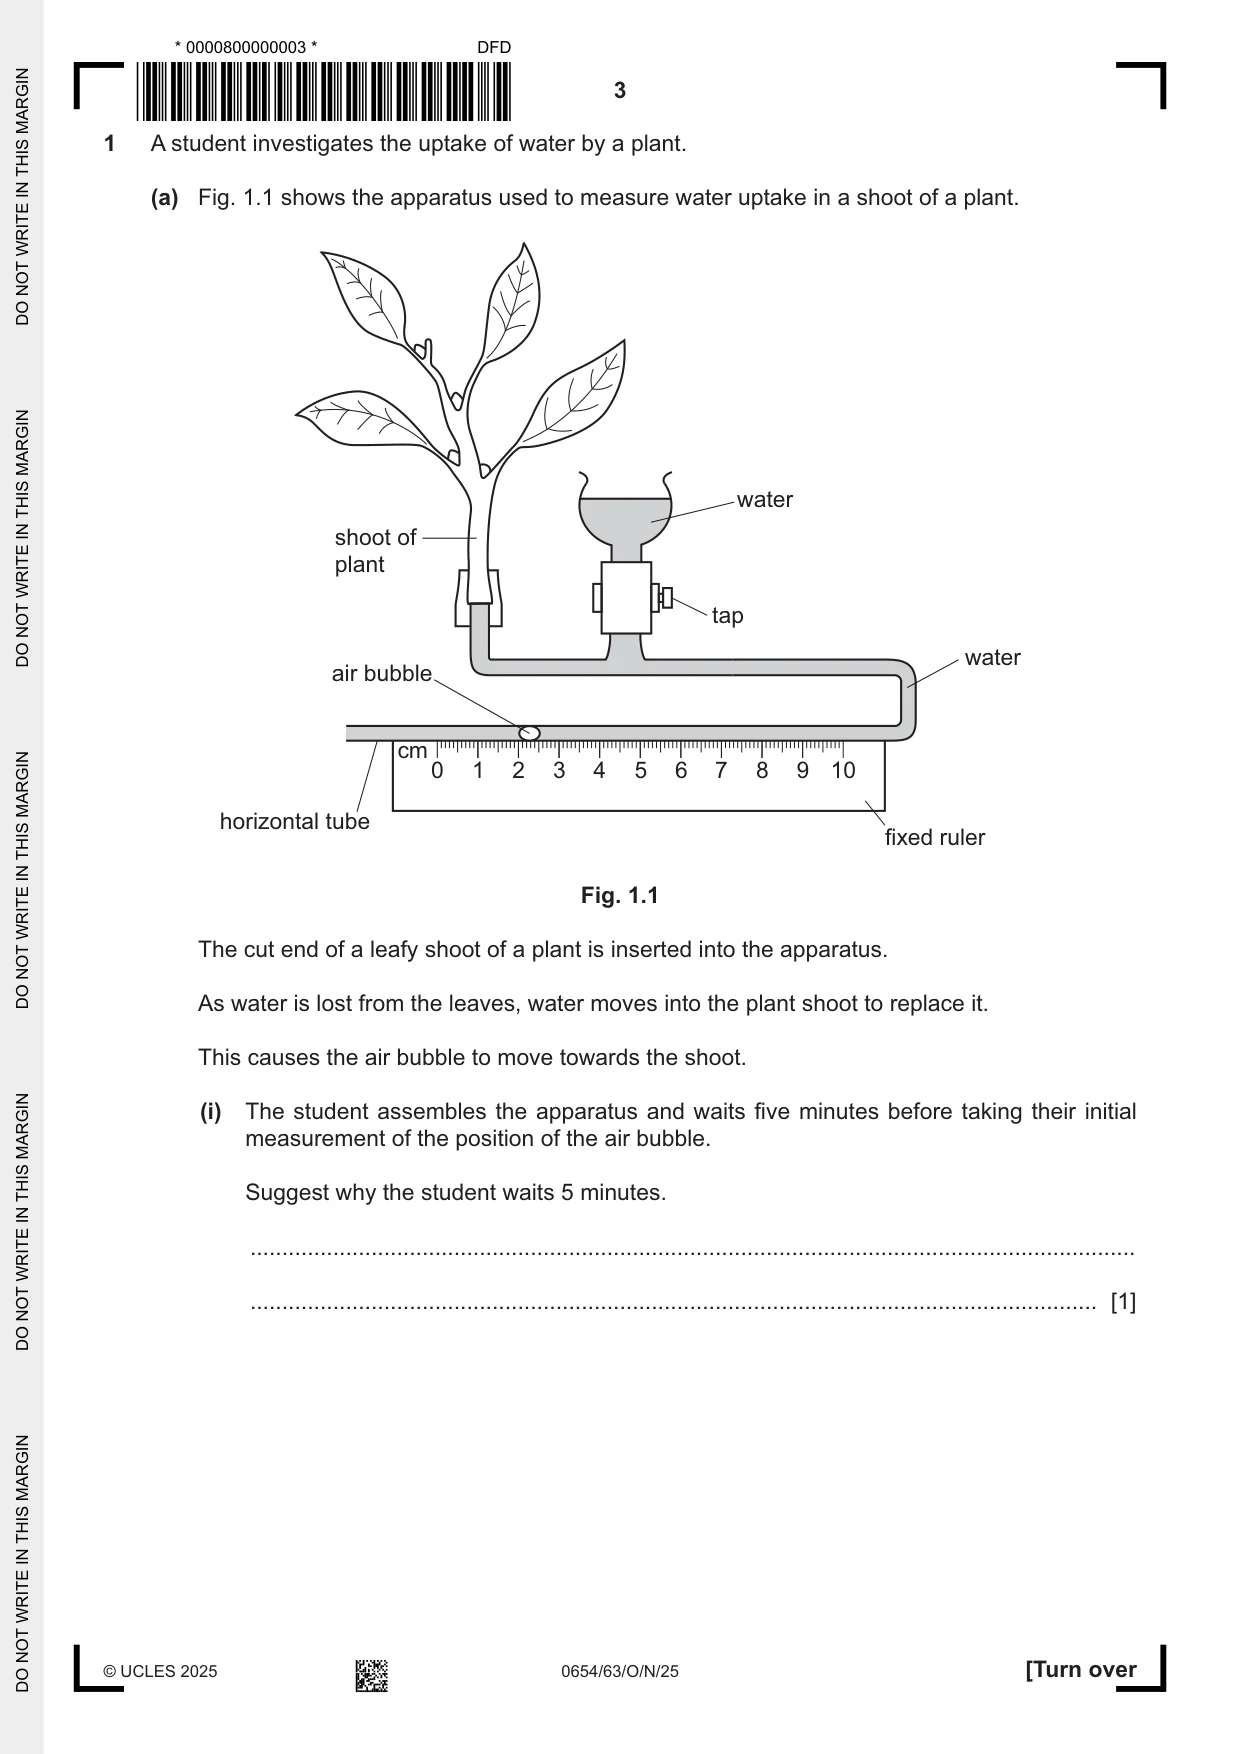
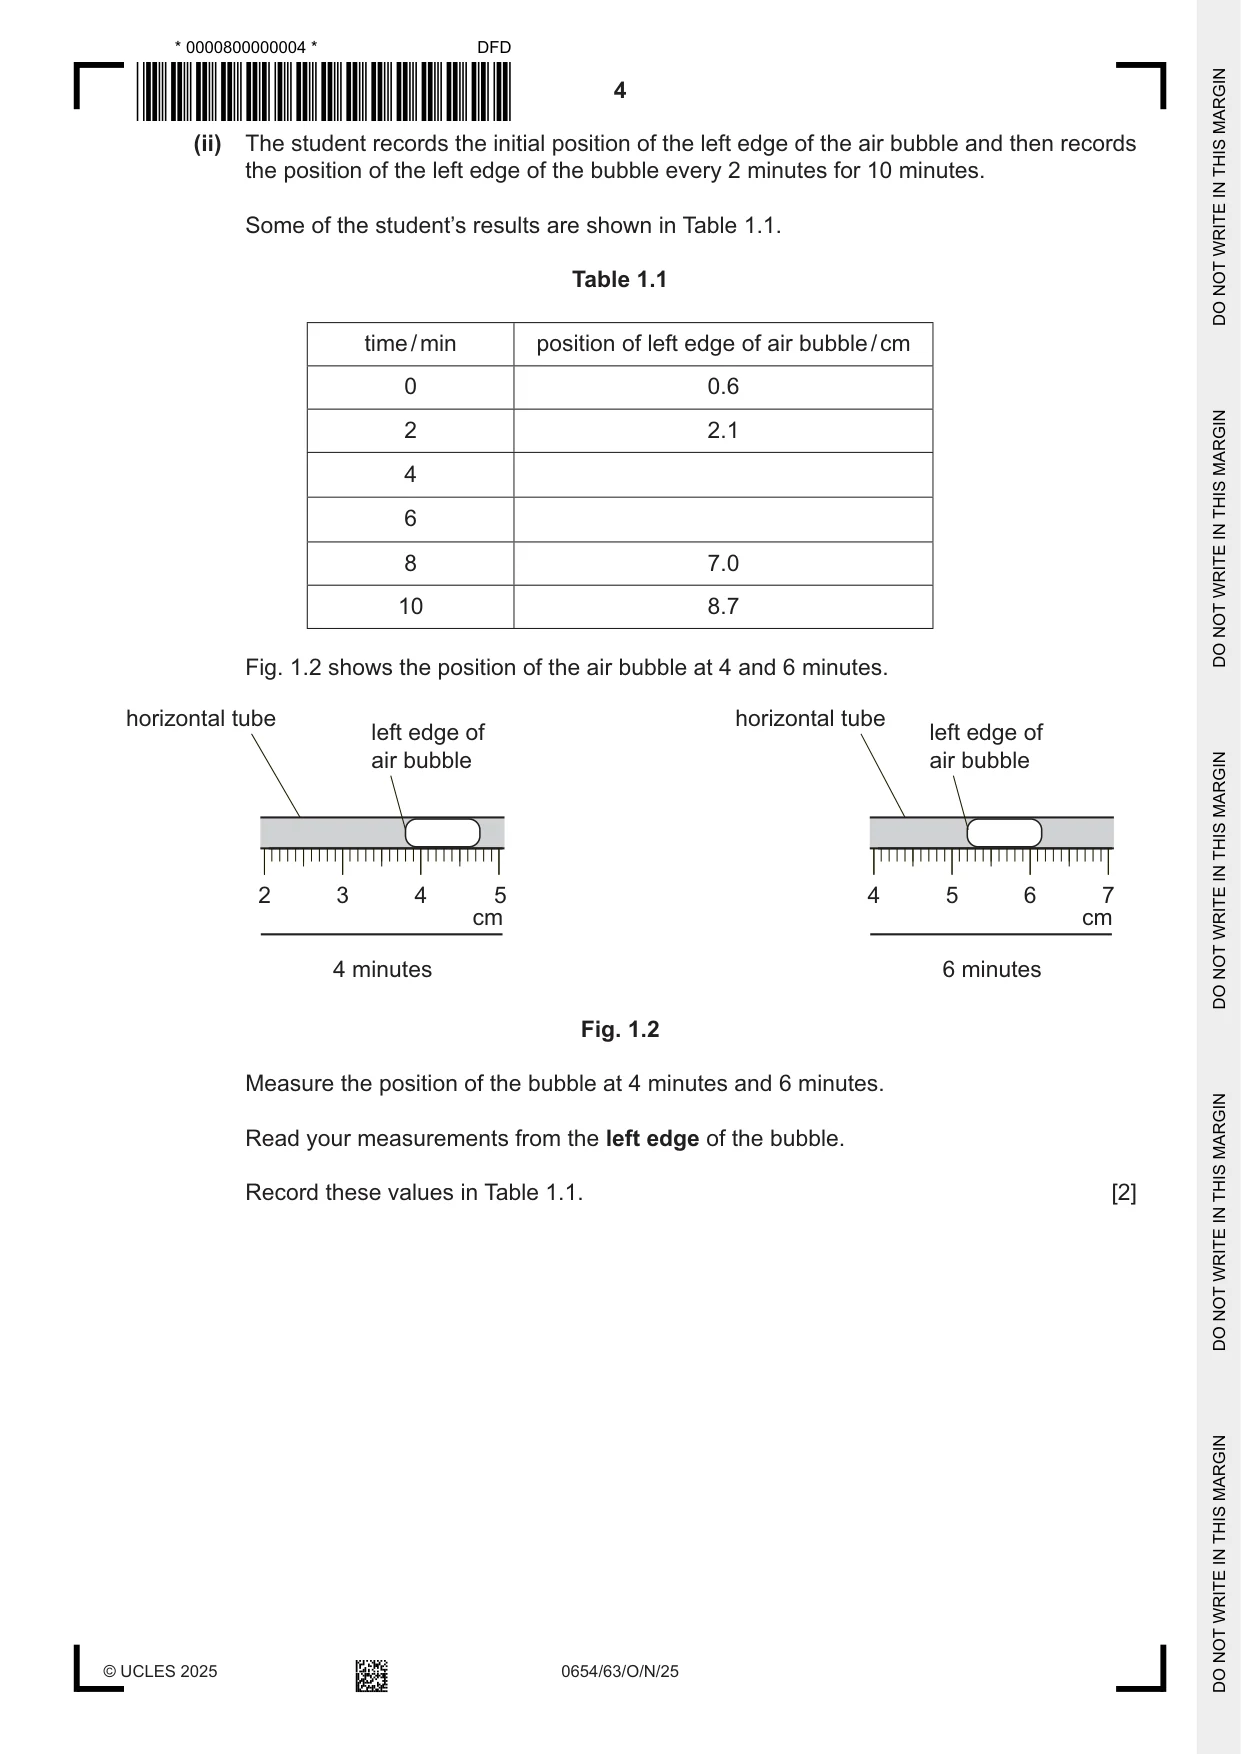
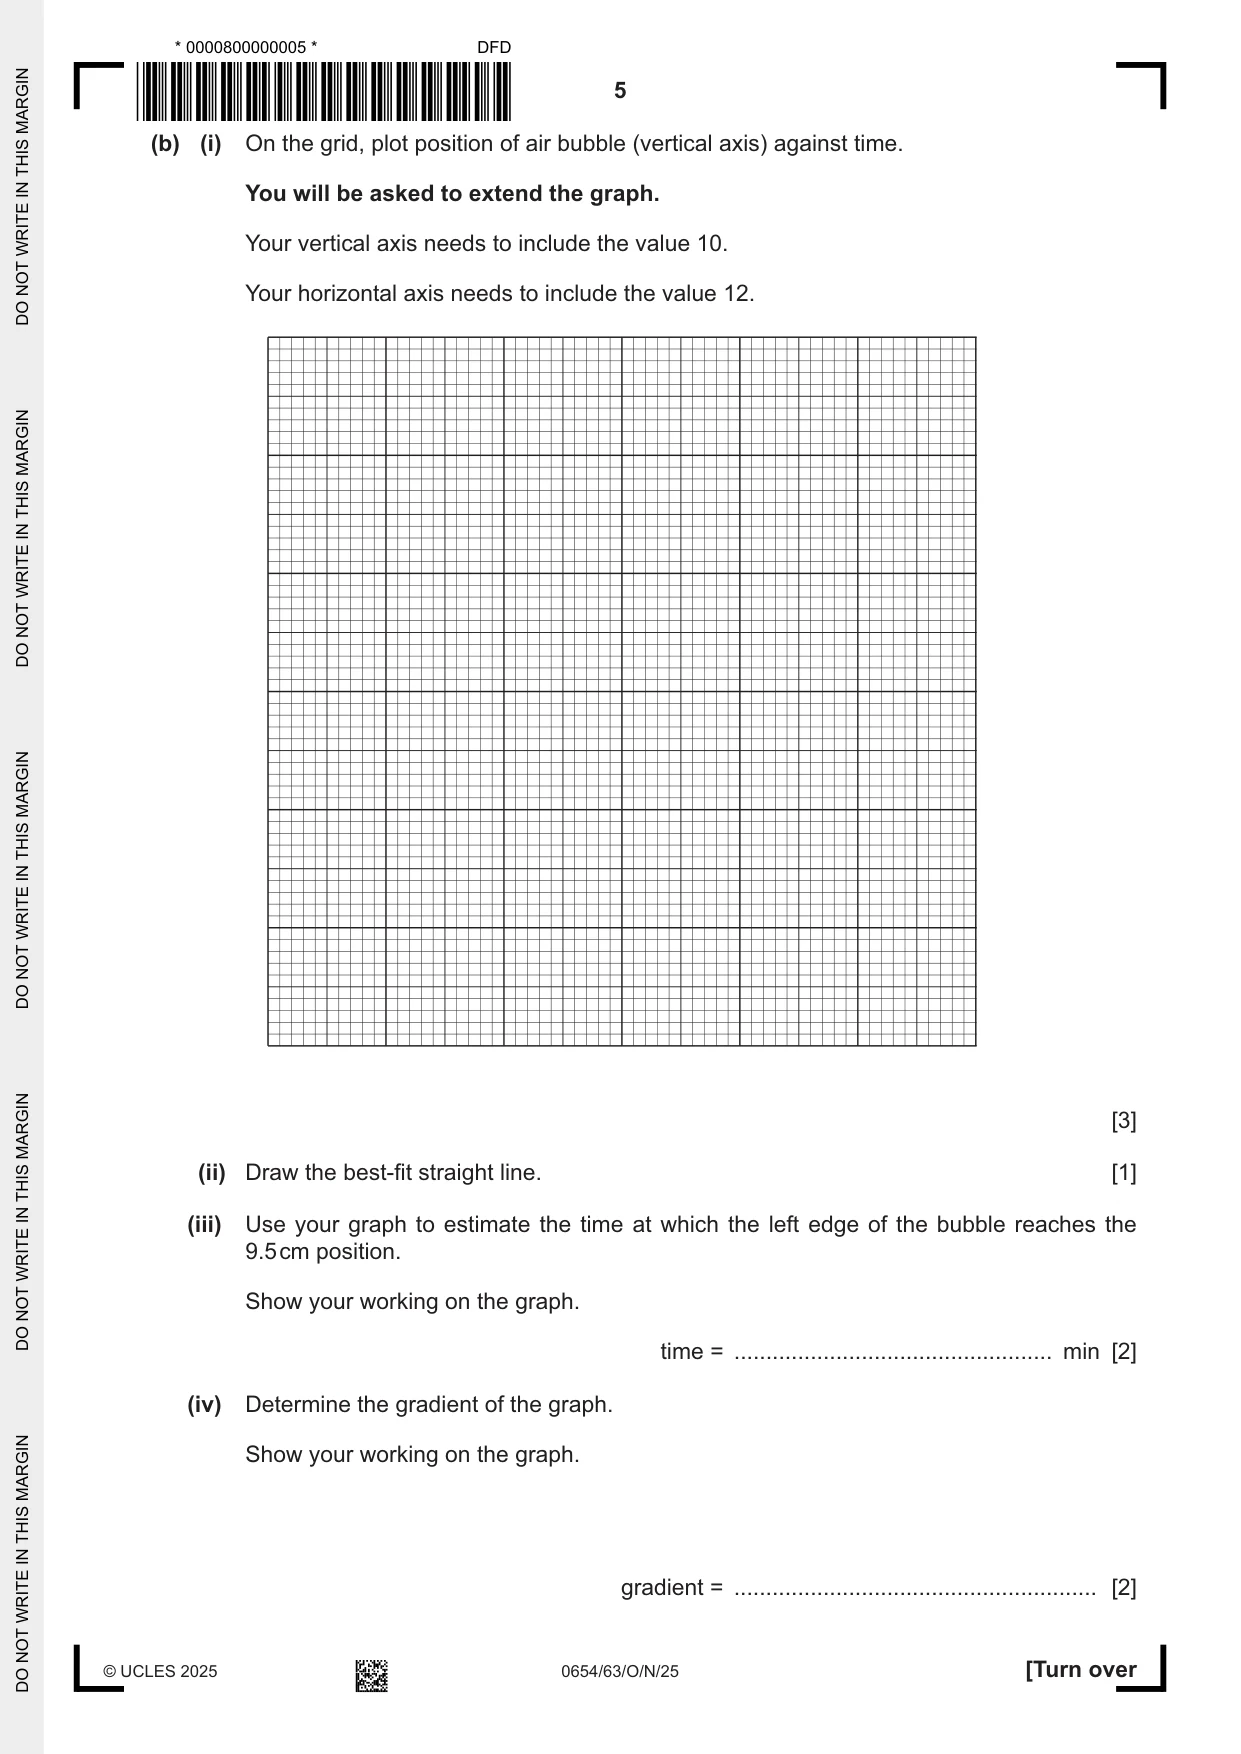
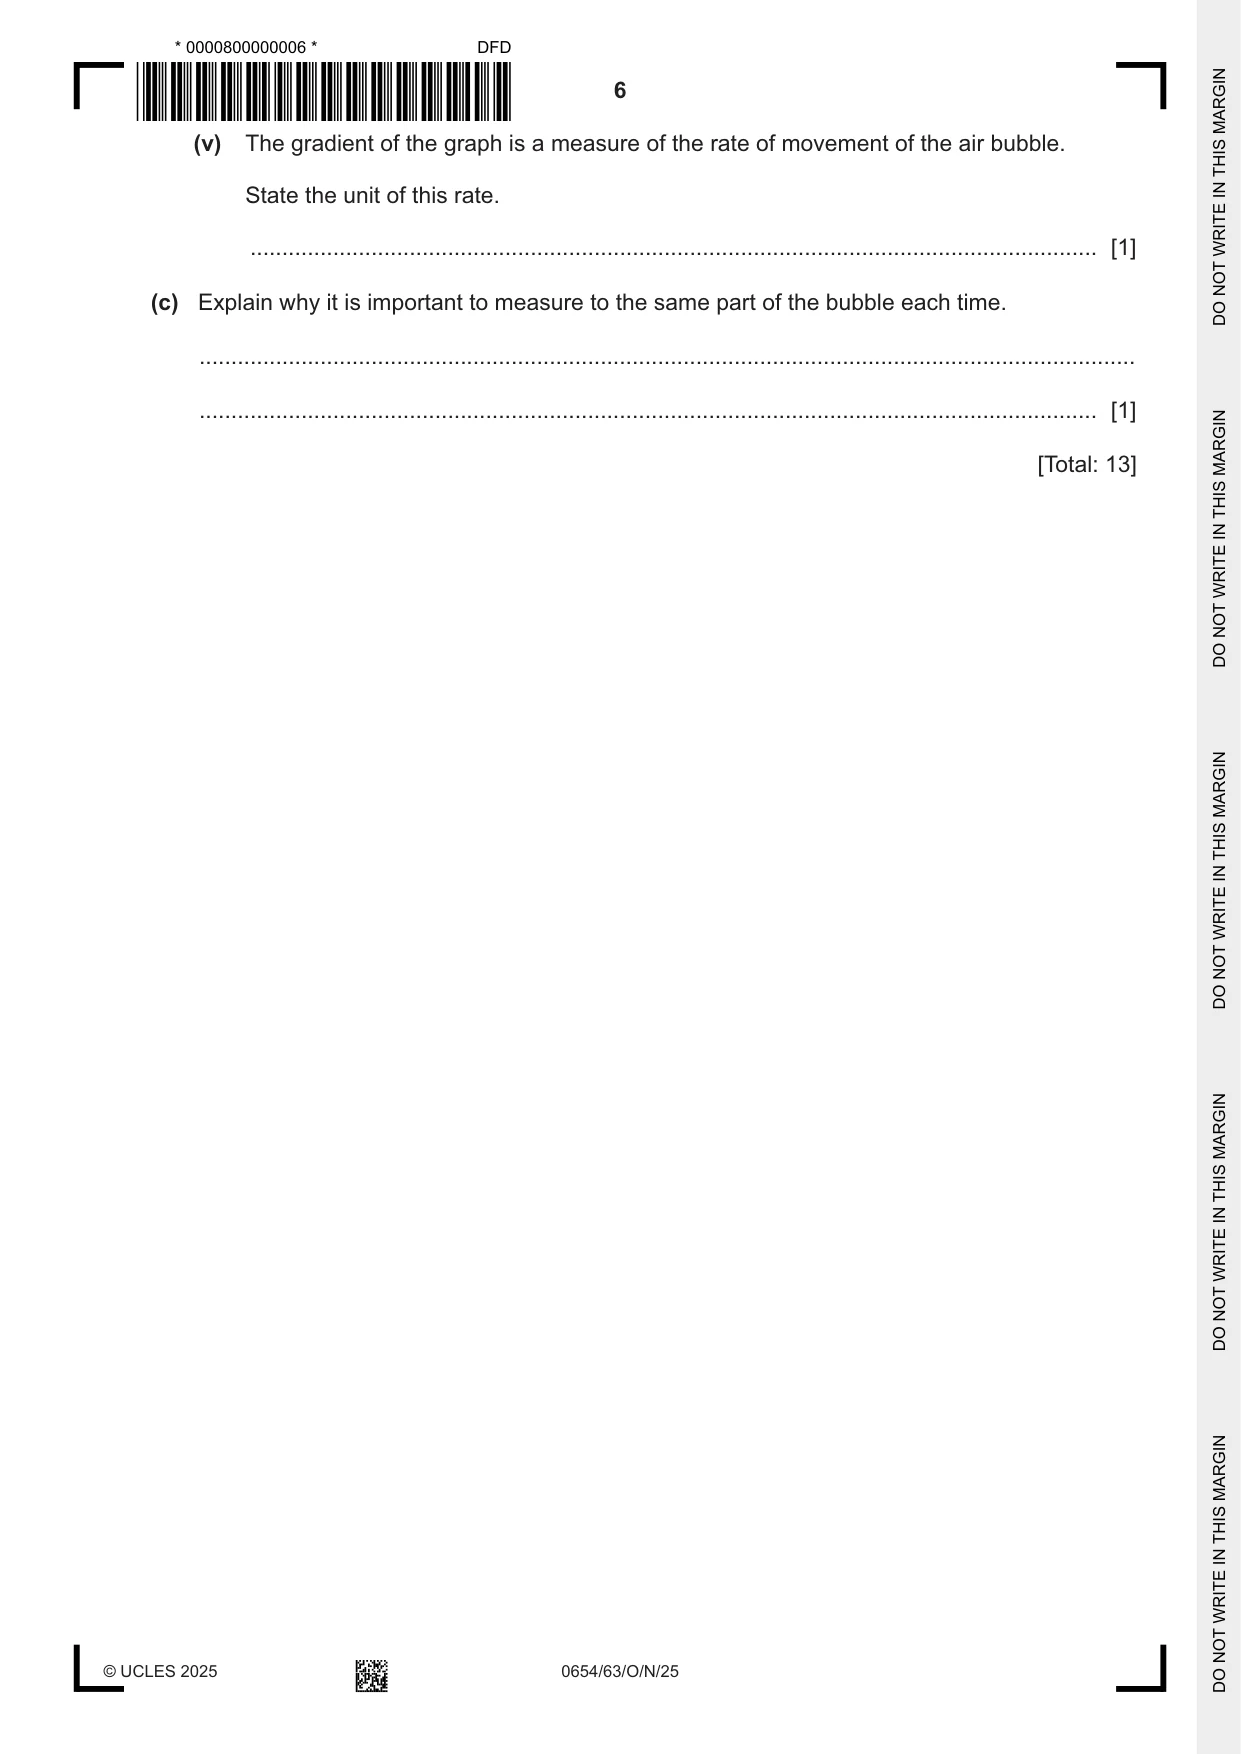
1 A student investigates the uptake of water by a plant. (a) Fig. 1.1 shows the apparatus used to measure water uptake in a shoot of a plant. water shoot of plant tap water air bubble cm 0 1 2 3 4 5 6 7 8 9 10 horizontal tube fixed ruler Fig. 1.1 The cut end of a leafy shoot of a plant is inserted into the apparatus. As water is lost from the leaves, water moves into the plant shoot to replace it. This causes the air bubble to move towards the shoot. (i) The student assembles the apparatus and waits five minutes before taking their initial measurement of the position of the air bubble. Suggest why the student waits 5 minutes. ........................................................................................................................................... ..................................................................................................................................... [1] (ii) The student records the initial position of the left edge of the air bubble and then records the position of the left edge of the bubble every 2 minutes for 10 minutes. Some of the student’s results are shown in Table 1.1. Table 1.1 time / min position of left edge of air bubble / cm 0 0.6 2 2.1 4 6 8 7.0 10 8.7 Fig. 1.2 shows the position of the air bubble at 4 and 6 minutes. horizontal tube horizontal tube left edge of left edge of air bubble air bubble 2 3 4 5 4 5 6 7 cm cm 4 minutes 6 minutes Fig. 1.2 Measure the position of the bubble at 4 minutes and 6 minutes. Read your measurements from the left edge of the bubble. Record these values in Table 1.1. [2] (b) (i) On the grid, plot position of air bubble (vertical axis) against time. You will be asked to extend the graph. Your vertical axis needs to include the value 10. Your horizontal axis needs to include the value 12. [3] (ii) Draw the best-fit straight line. [1] (iii) Use your graph to estimate the time at which the left edge of the bubble reaches the 9.5 cm position. Show your working on the graph. time = .................................................. min [2] (iv) Determine the gradient of the graph. Show your working on the graph. gradient = ......................................................... [2] (v) The gradient of the graph is a measure of the rate of movement of the air bubble. State the unit of this rate. ..................................................................................................................................... [1] (c) Explain why it is important to measure to the same part of the bubble each time. ................................................................................................................................................... ............................................................................................................................................. [1] [Total: 13] Question 2 starts on page 8.
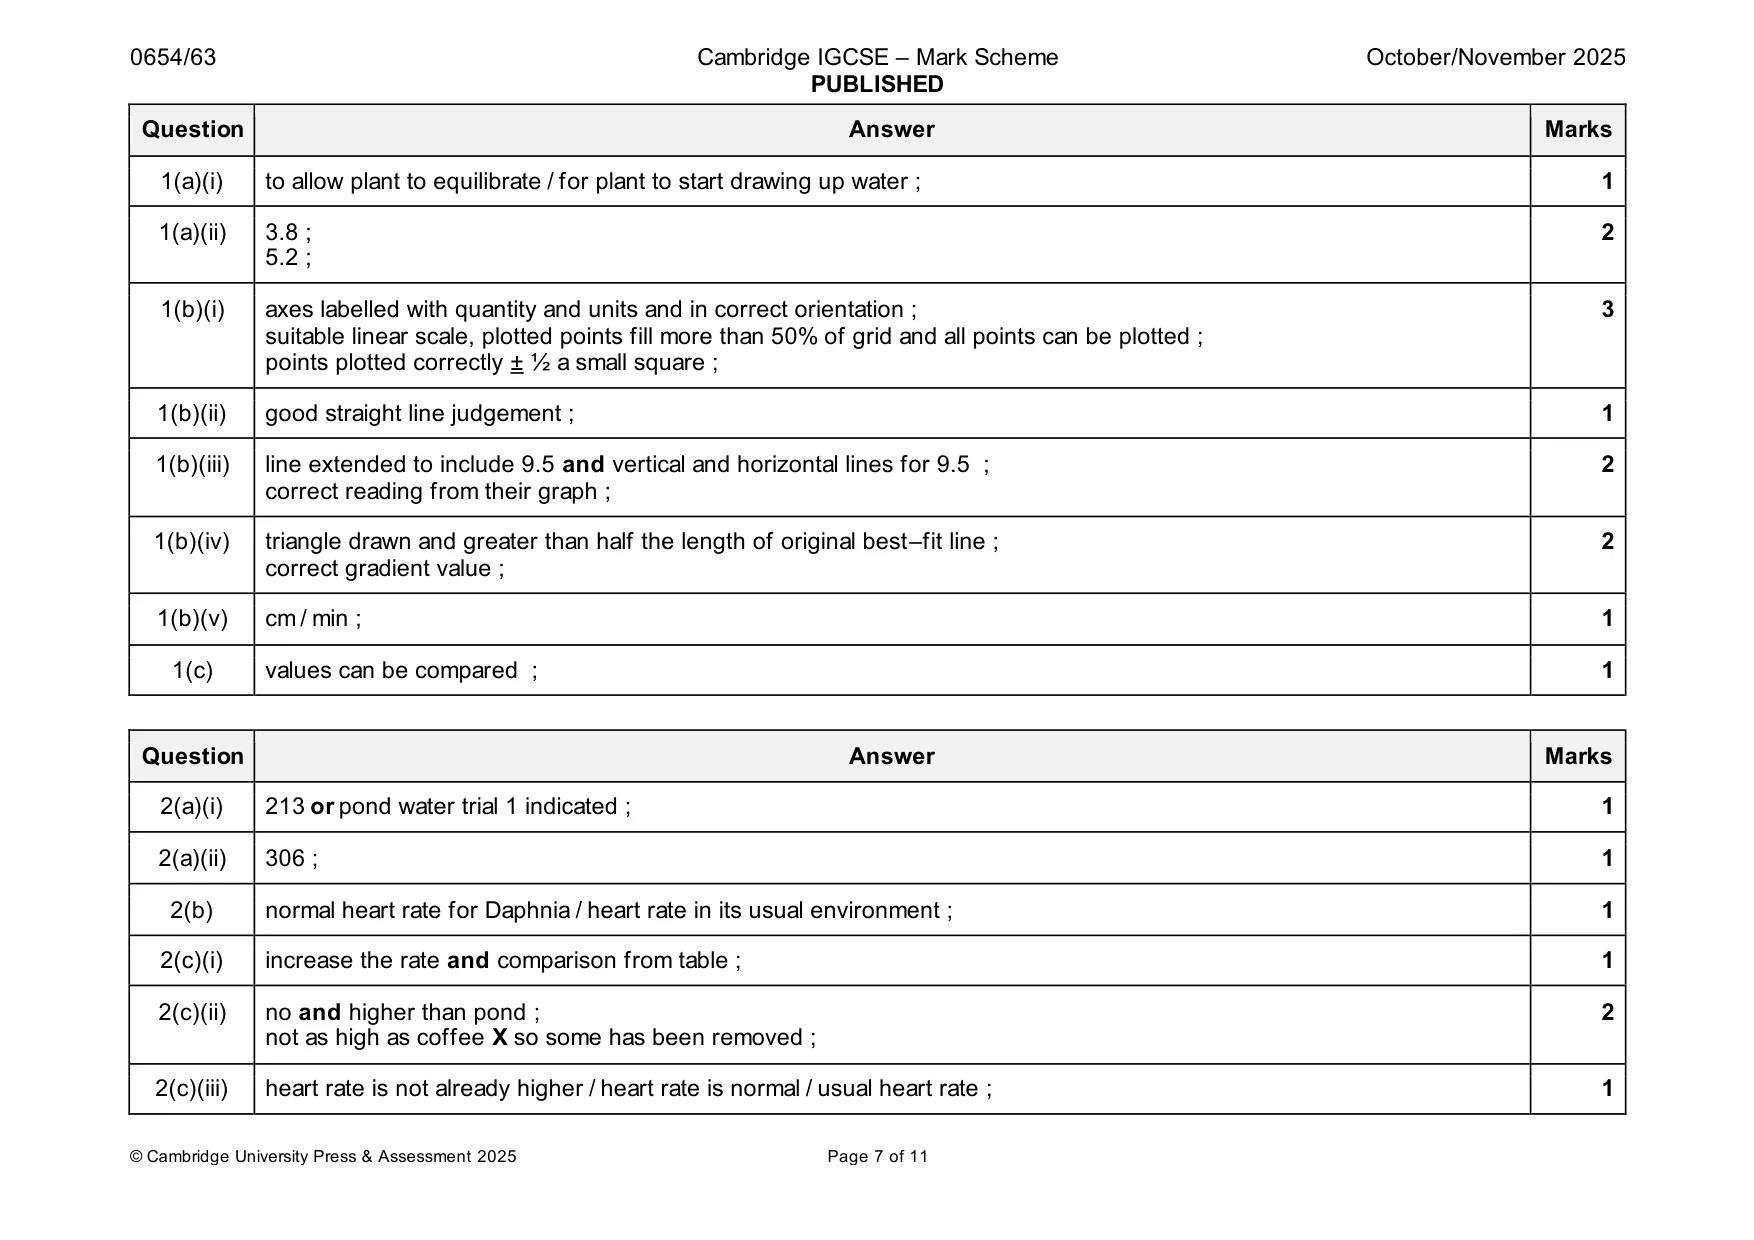
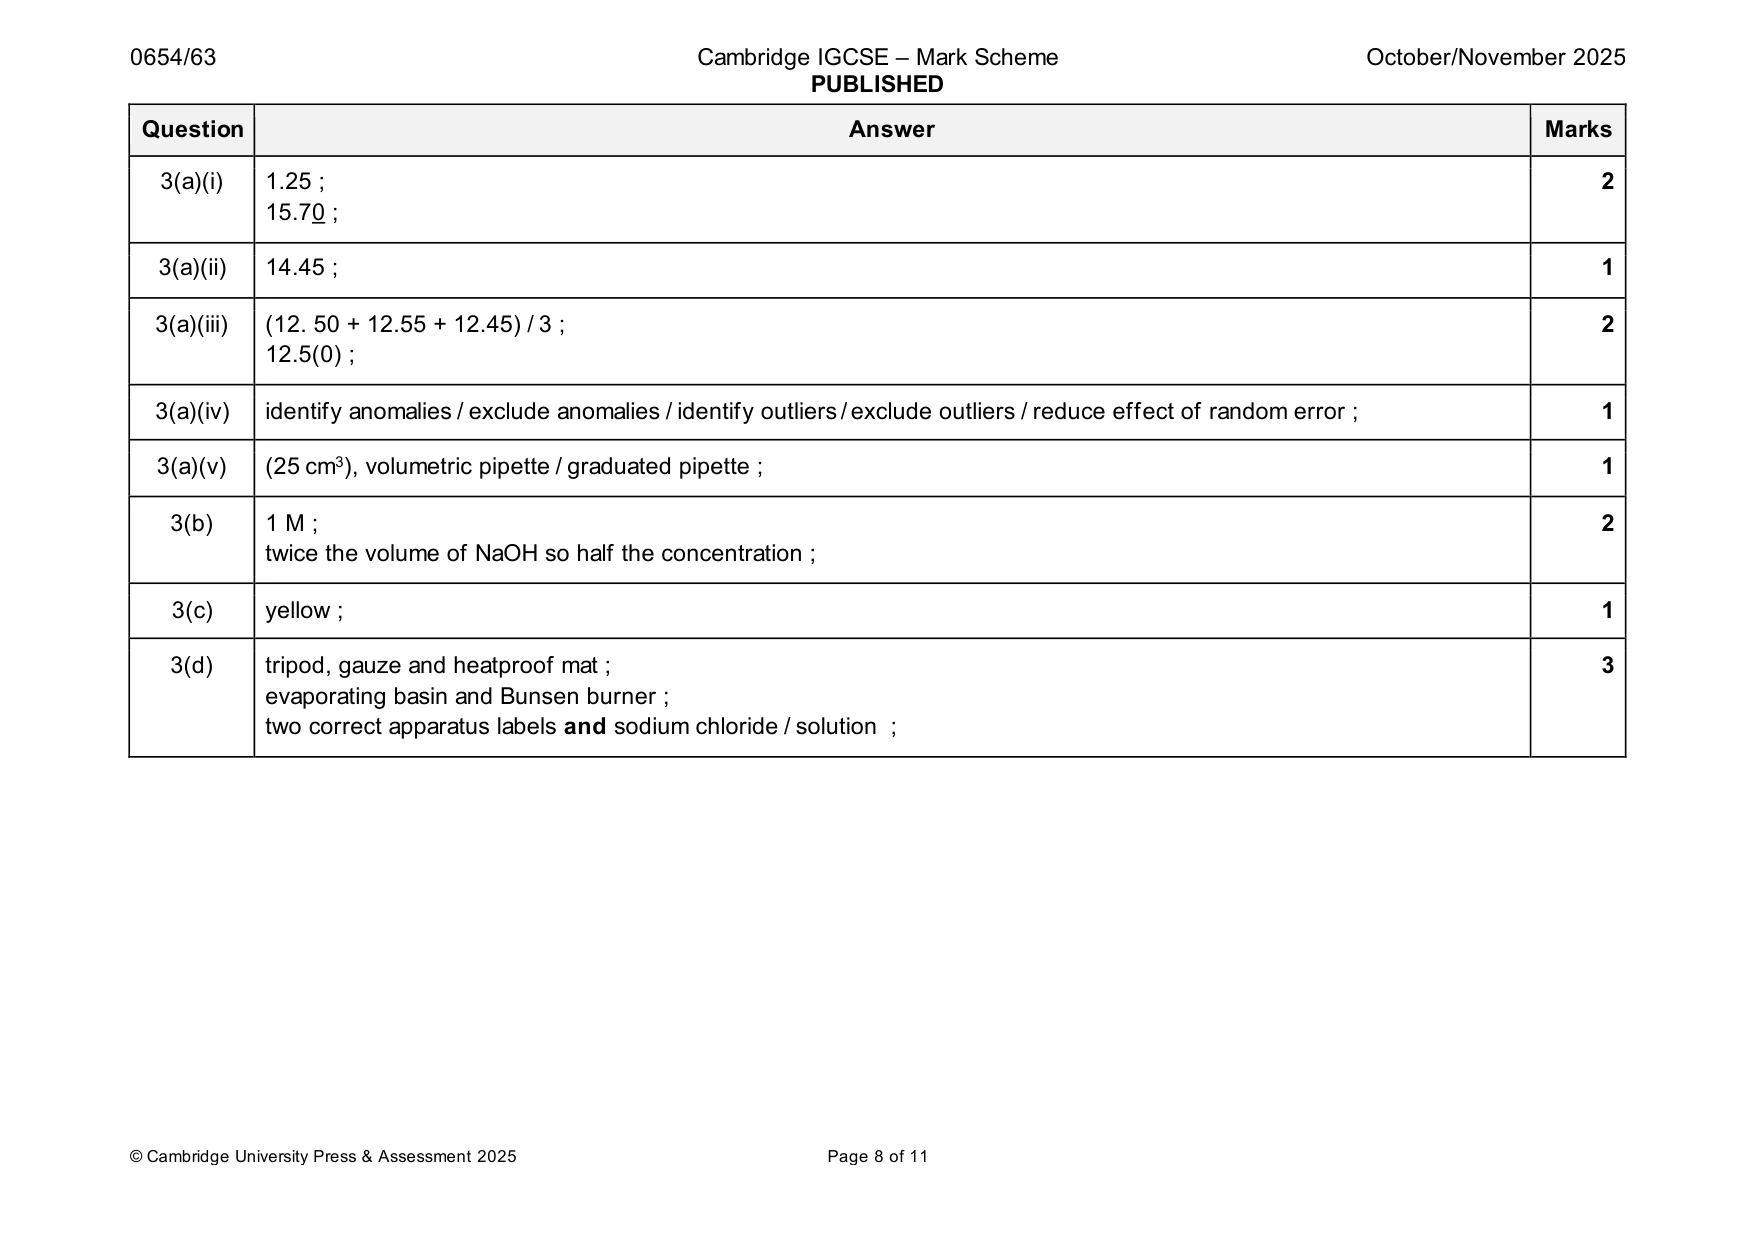
Mark scheme: Question Answer Marks 1(a)(i) to allow plant to equilibrate / for plant to start drawing up water ; 1 1(a)(ii) 3.8 ; 2 5.2 ; 1(b)(i) axes labelled with quantity and units and in correct orientation ; 3 suitable linear scale, plotted points fill more than 50% of grid and all points can be plotted ; points plotted correctly ± ½ a small square ; 1(b)(ii) good straight line judgement ; 1 1(b)(iii) line extended to include 9.5 and vertical and horizontal lines for 9.5 ; 2 correct reading from their graph ; 1(b)(iv) triangle drawn and greater than half the length of original best–fit line ; 2 correct gradient value ; 1(b)(v) cm / min ; 1 1(c) values can be compared ; 1
Q2 · Daphnia are transparent aquatic animals that live in ponds
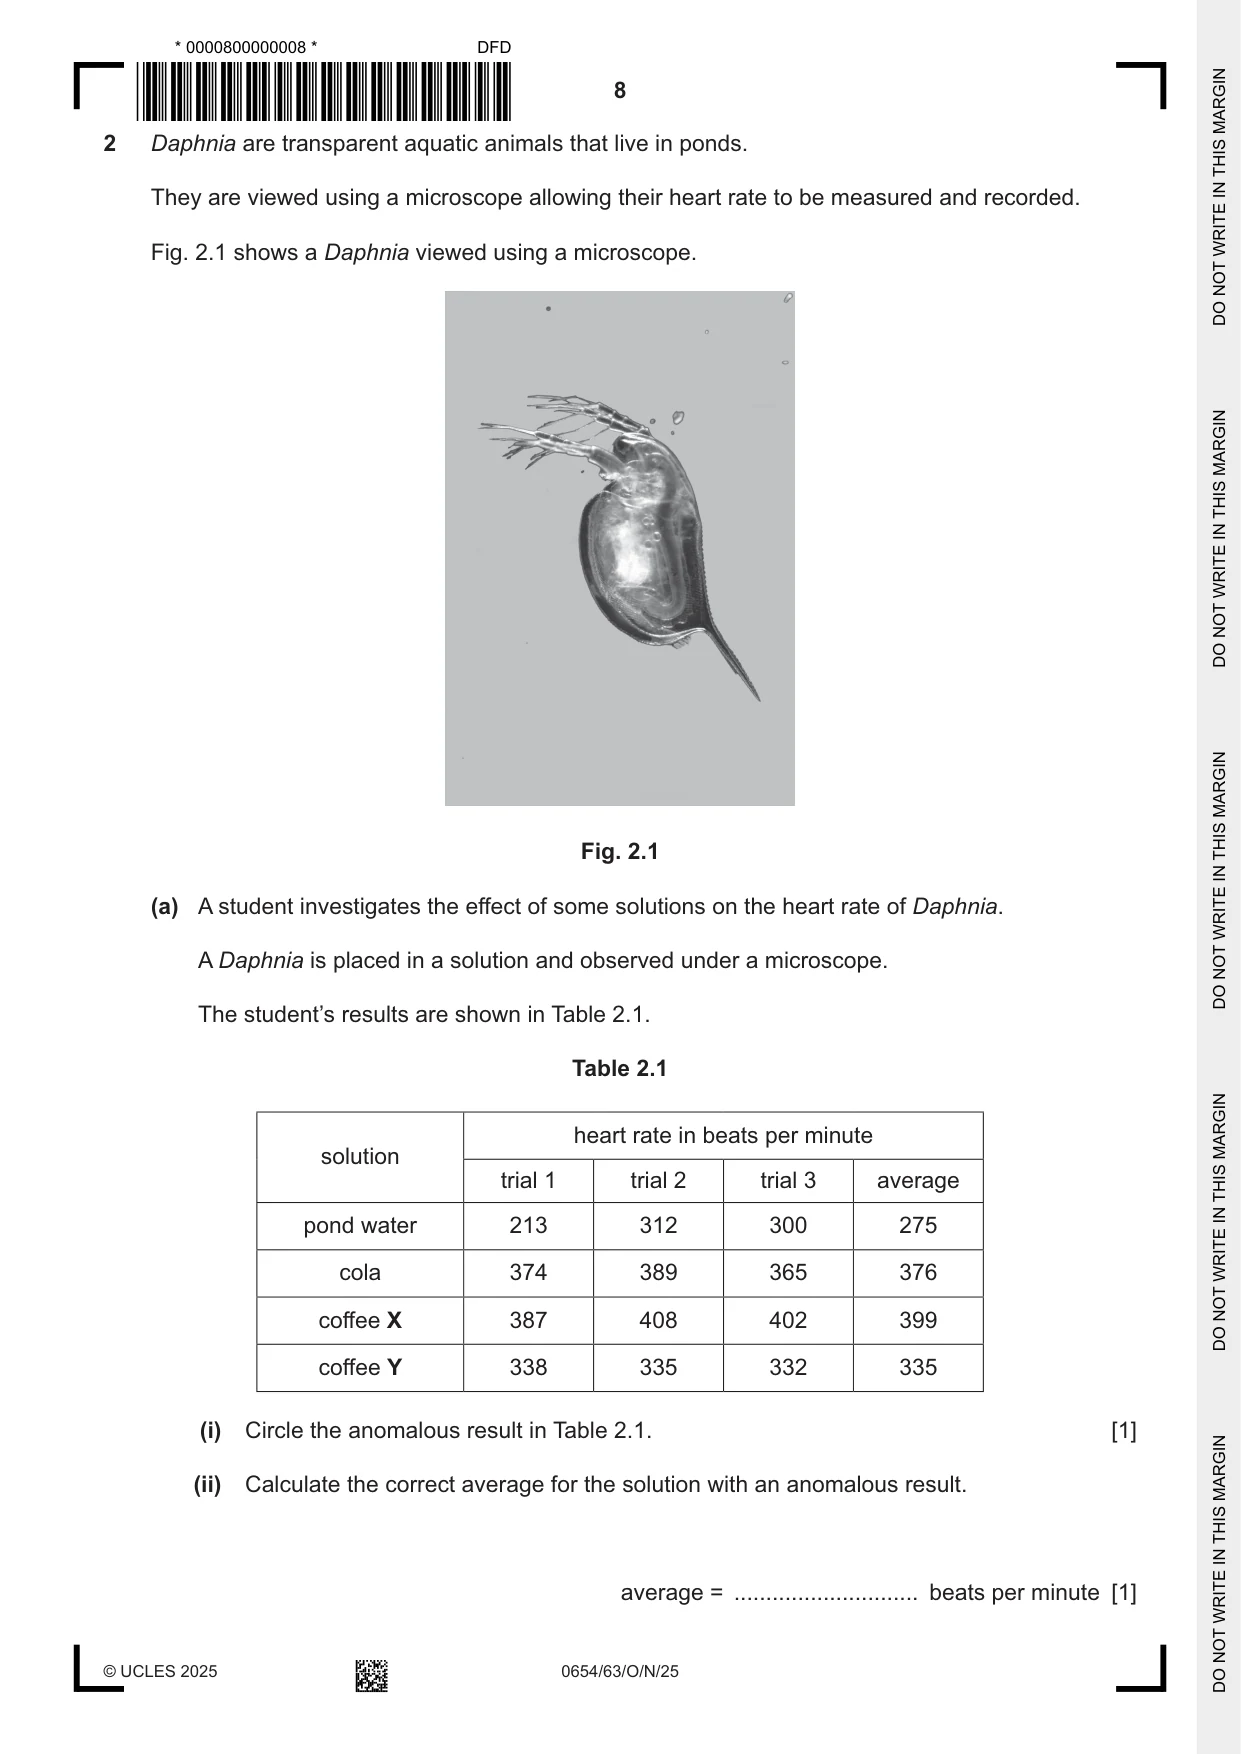
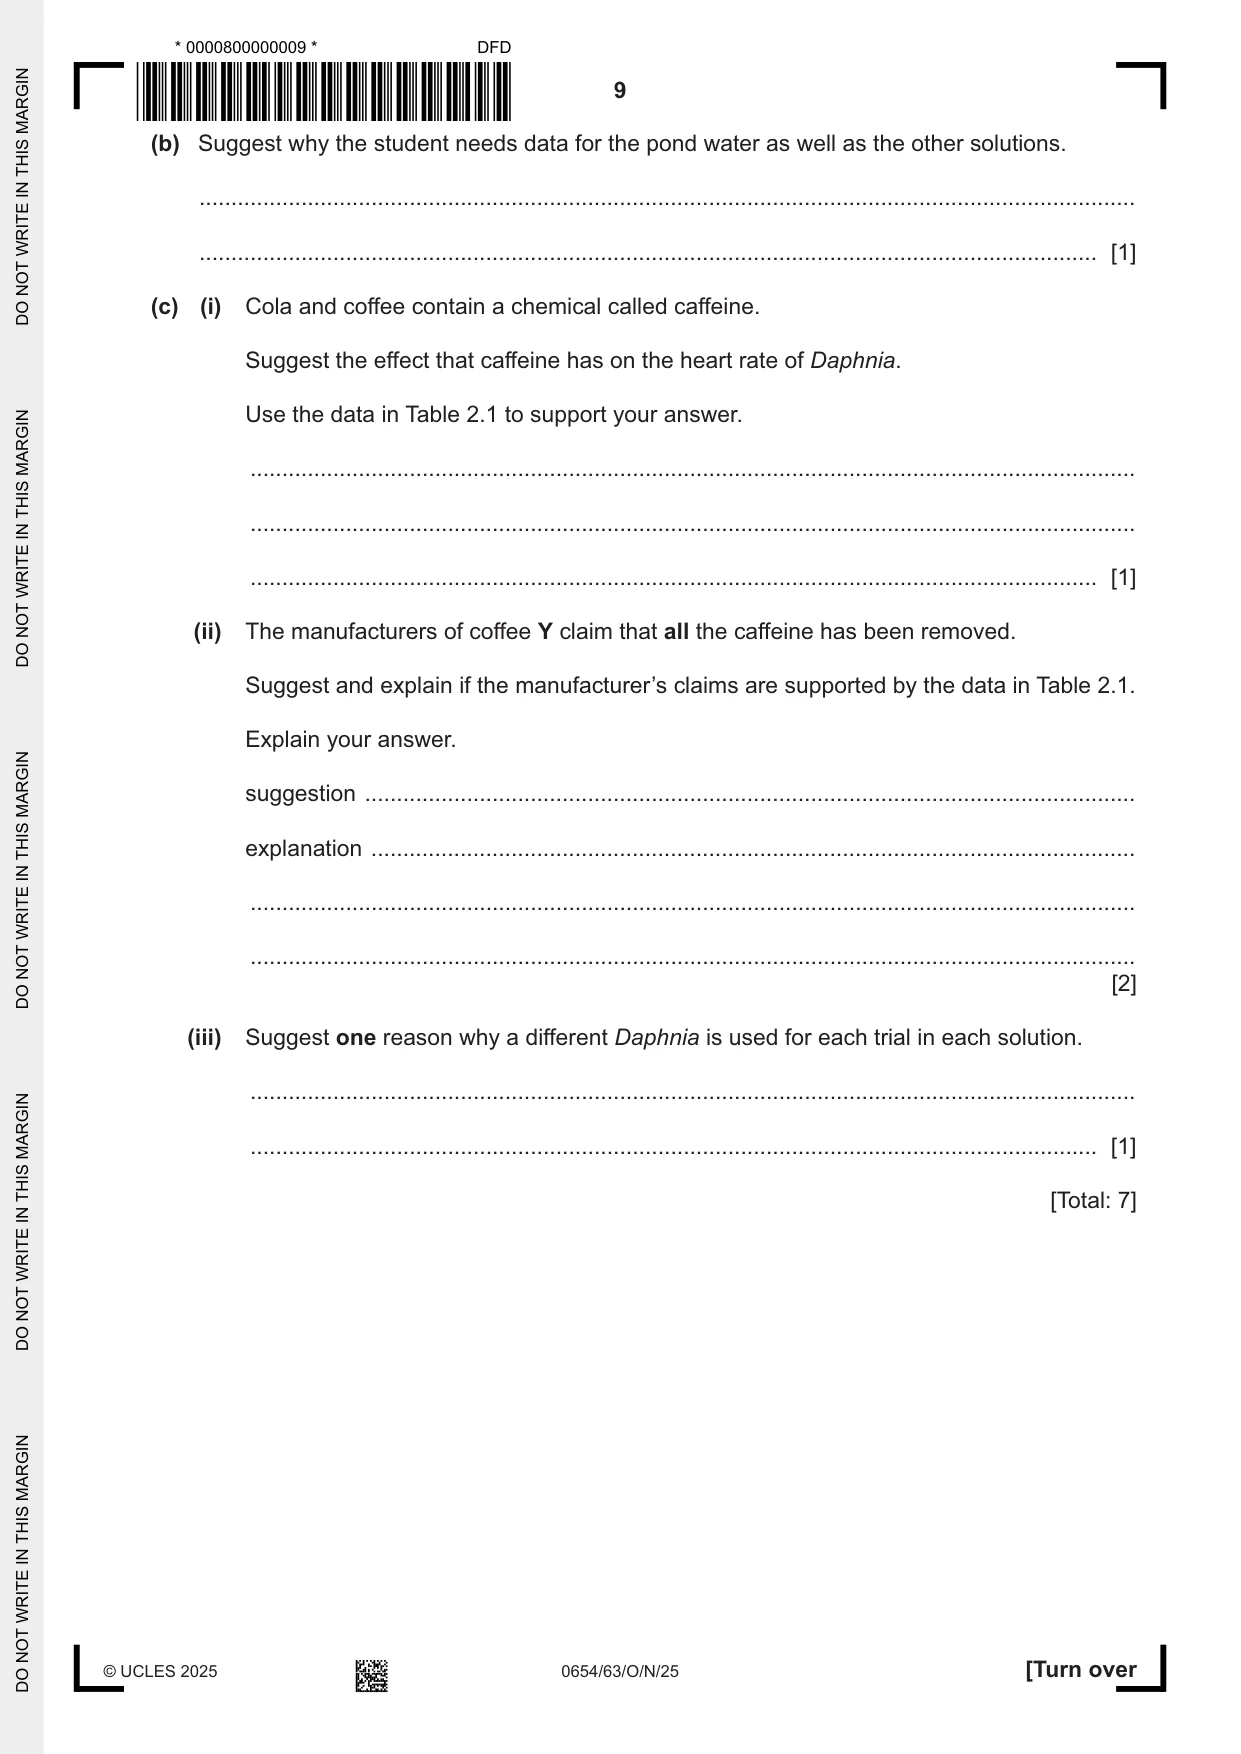
2 Daphnia are transparent aquatic animals that live in ponds. They are viewed using a microscope allowing their heart rate to be measured and recorded. Fig. 2.1 shows a Daphnia viewed using a microscope. Fig. 2.1 (a) A student investigates the effect of some solutions on the heart rate of Daphnia. A Daphnia is placed in a solution and observed under a microscope. The student’s results are shown in Table 2.1. Table 2.1 heart rate in beats per minute solution trial 1 trial 2 trial 3 average pond water 213 312 300 275 cola 374 389 365 376 coffee X 387 408 402 399 coffee Y 338 335 332 335 (i) Circle the anomalous result in Table 2.1. [1] (ii) Calculate the correct average for the solution with an anomalous result. average = ............................. beats per minute [1] (b) Suggest why the student needs data for the pond water as well as the other solutions. ................................................................................................................................................... ............................................................................................................................................. [1] (c) (i) Cola and coffee contain a chemical called caffeine. Suggest the effect that caffeine has on the heart rate of Daphnia. Use the data in Table 2.1 to support your answer. ........................................................................................................................................... ........................................................................................................................................... ..................................................................................................................................... [1] (ii) The manufacturers of coffee Y claim that all the caffeine has been removed. Suggest and explain if the manufacturer’s claims are supported by the data in Table 2.1. Explain your answer. suggestion ......................................................................................................................... explanation ........................................................................................................................ ........................................................................................................................................... ........................................................................................................................................... [2] (iii) Suggest one reason why a different Daphnia is used for each trial in each solution. ........................................................................................................................................... ..................................................................................................................................... [1] [Total: 7]
Mark scheme: 2(a)(i) 213 or pond water trial 1 indicated ; 1 2(a)(ii) 306 ; 1 2(b) normal heart rate for Daphnia / heart rate in its usual environment ; 1 2(c)(i) increase the rate and comparison from table ; 1 2(c)(ii) no and higher than pond ; 2 not as high as coffee X so some has been removed ; 2(c)(iii) heart rate is not already higher / heart rate is normal / usual heart rate ; 1
Q3 · A student investigates the neutralisation reaction between dilute hydrochloric acid and…
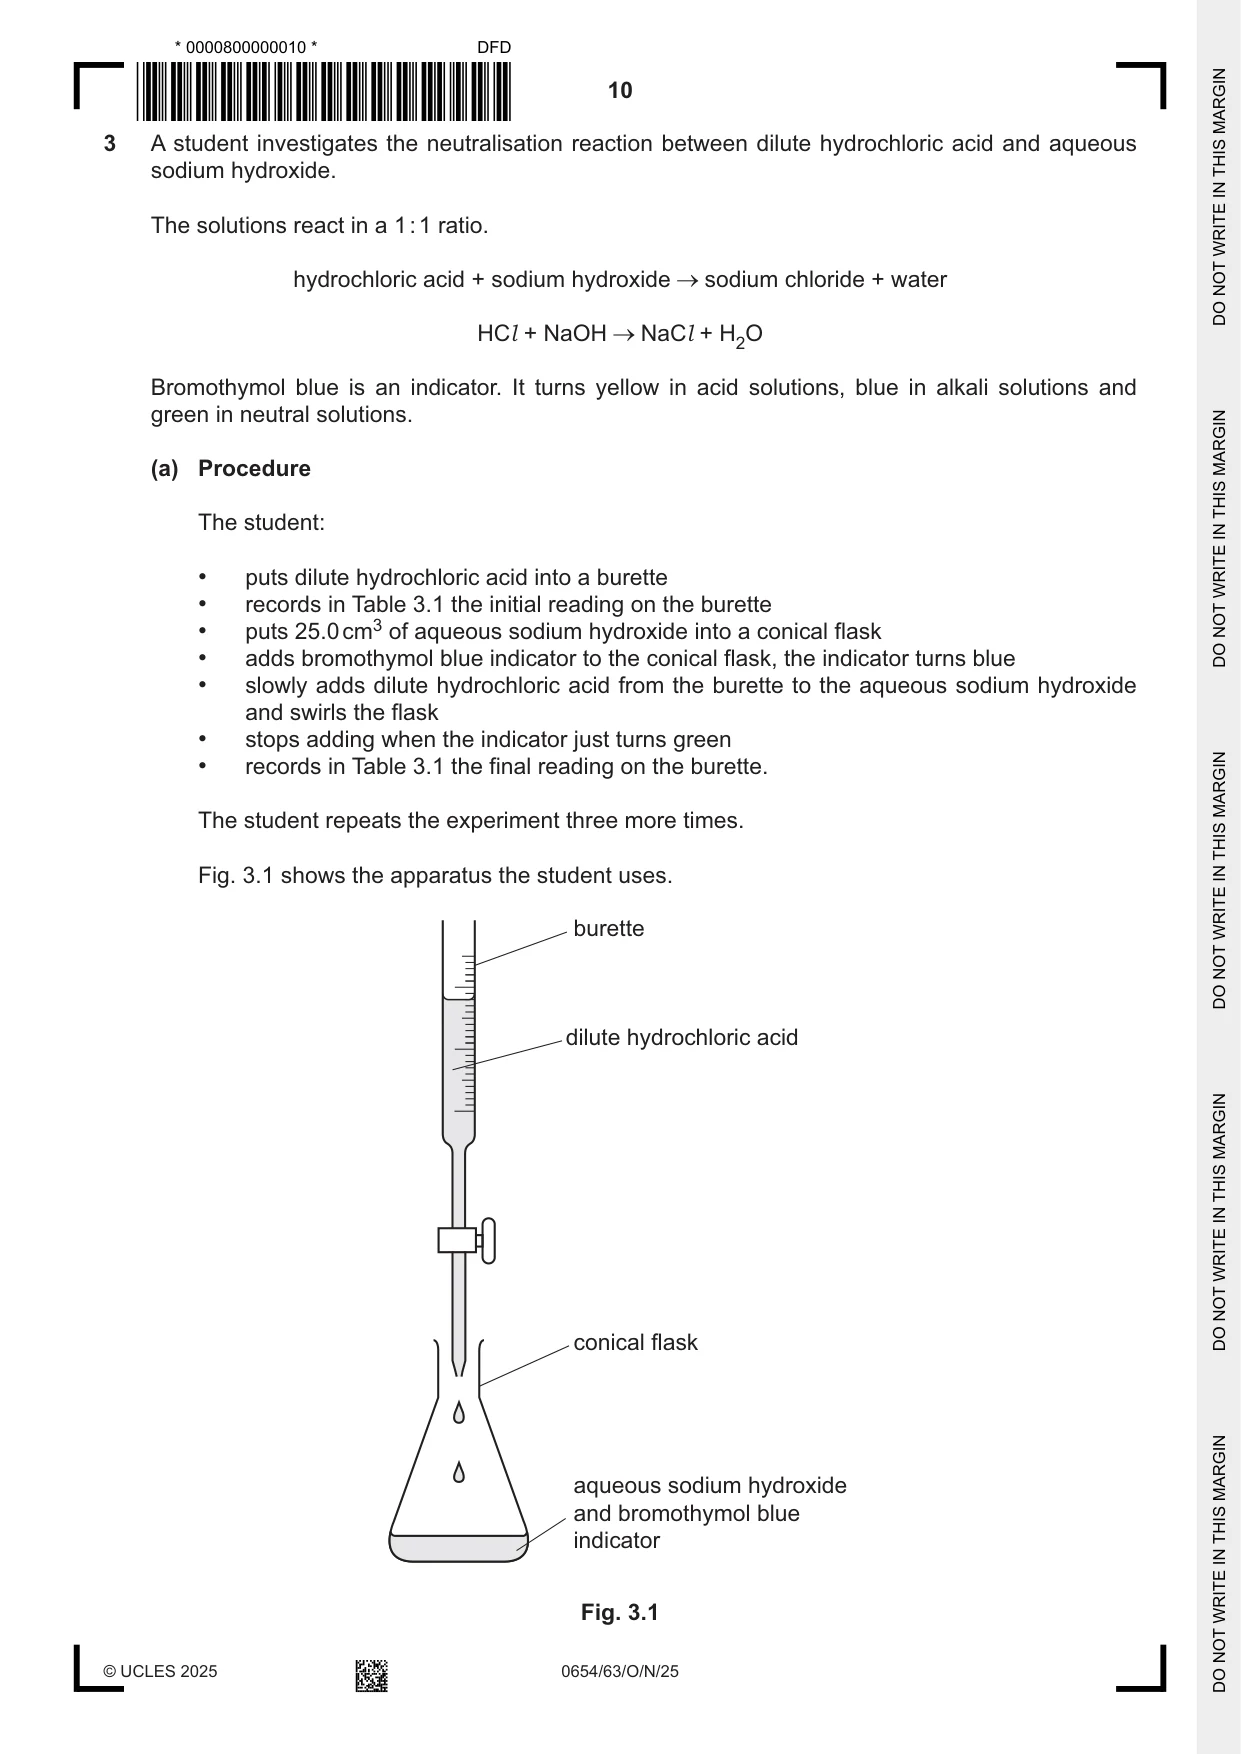
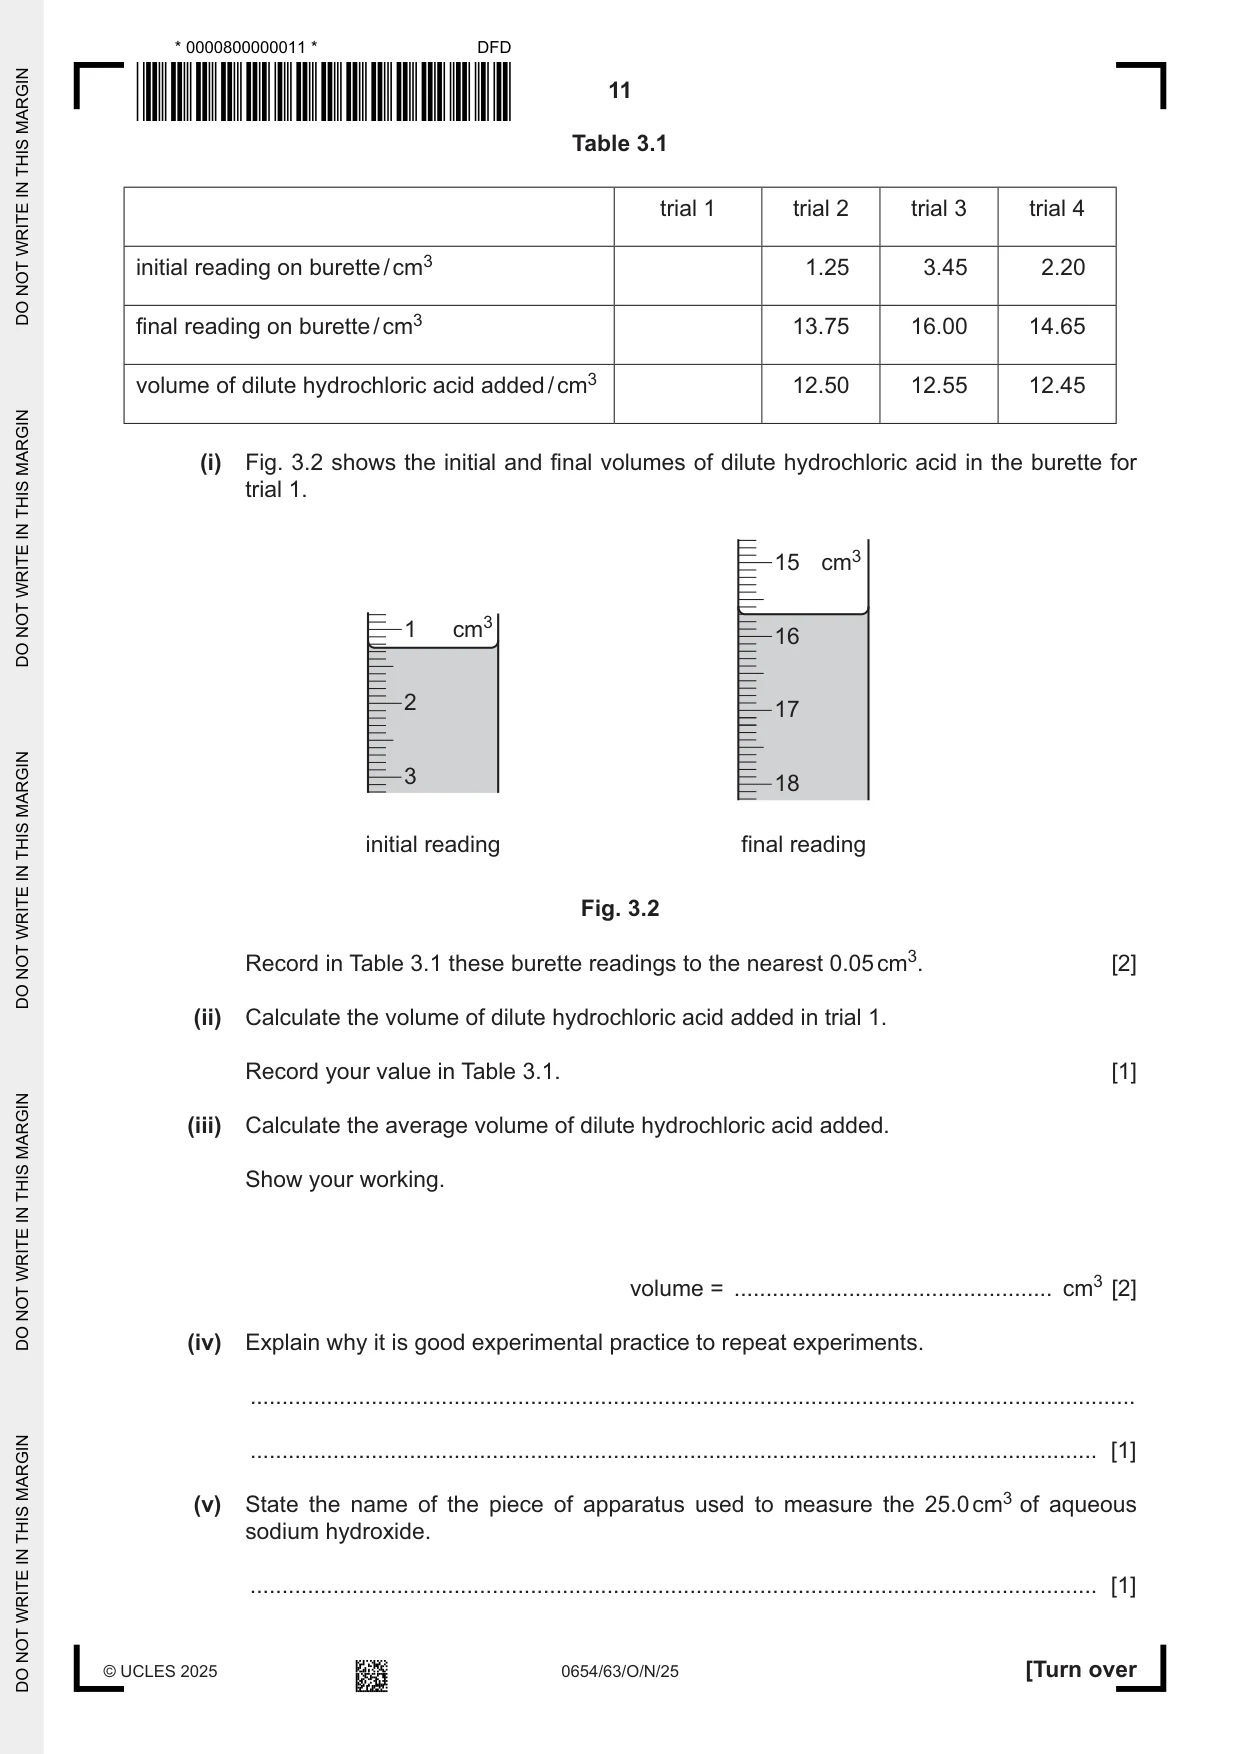
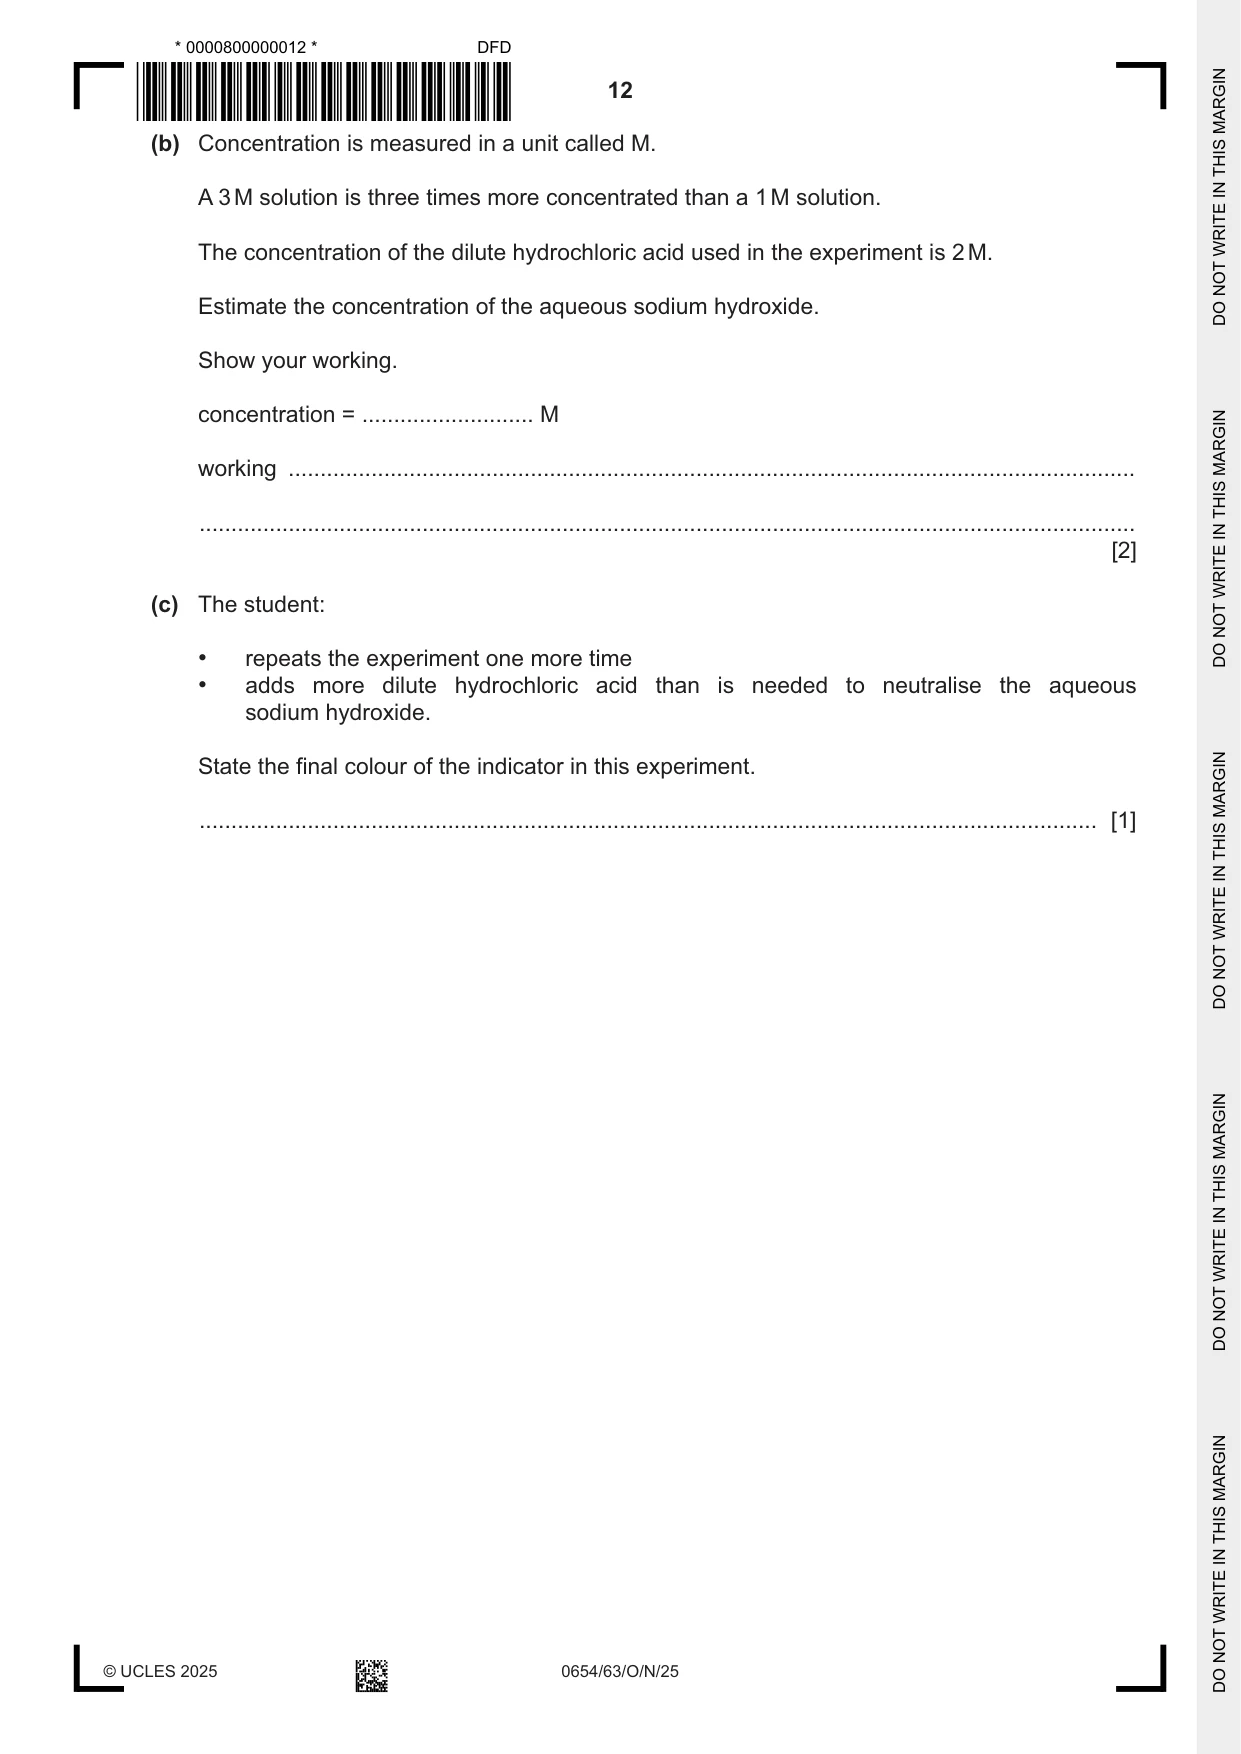
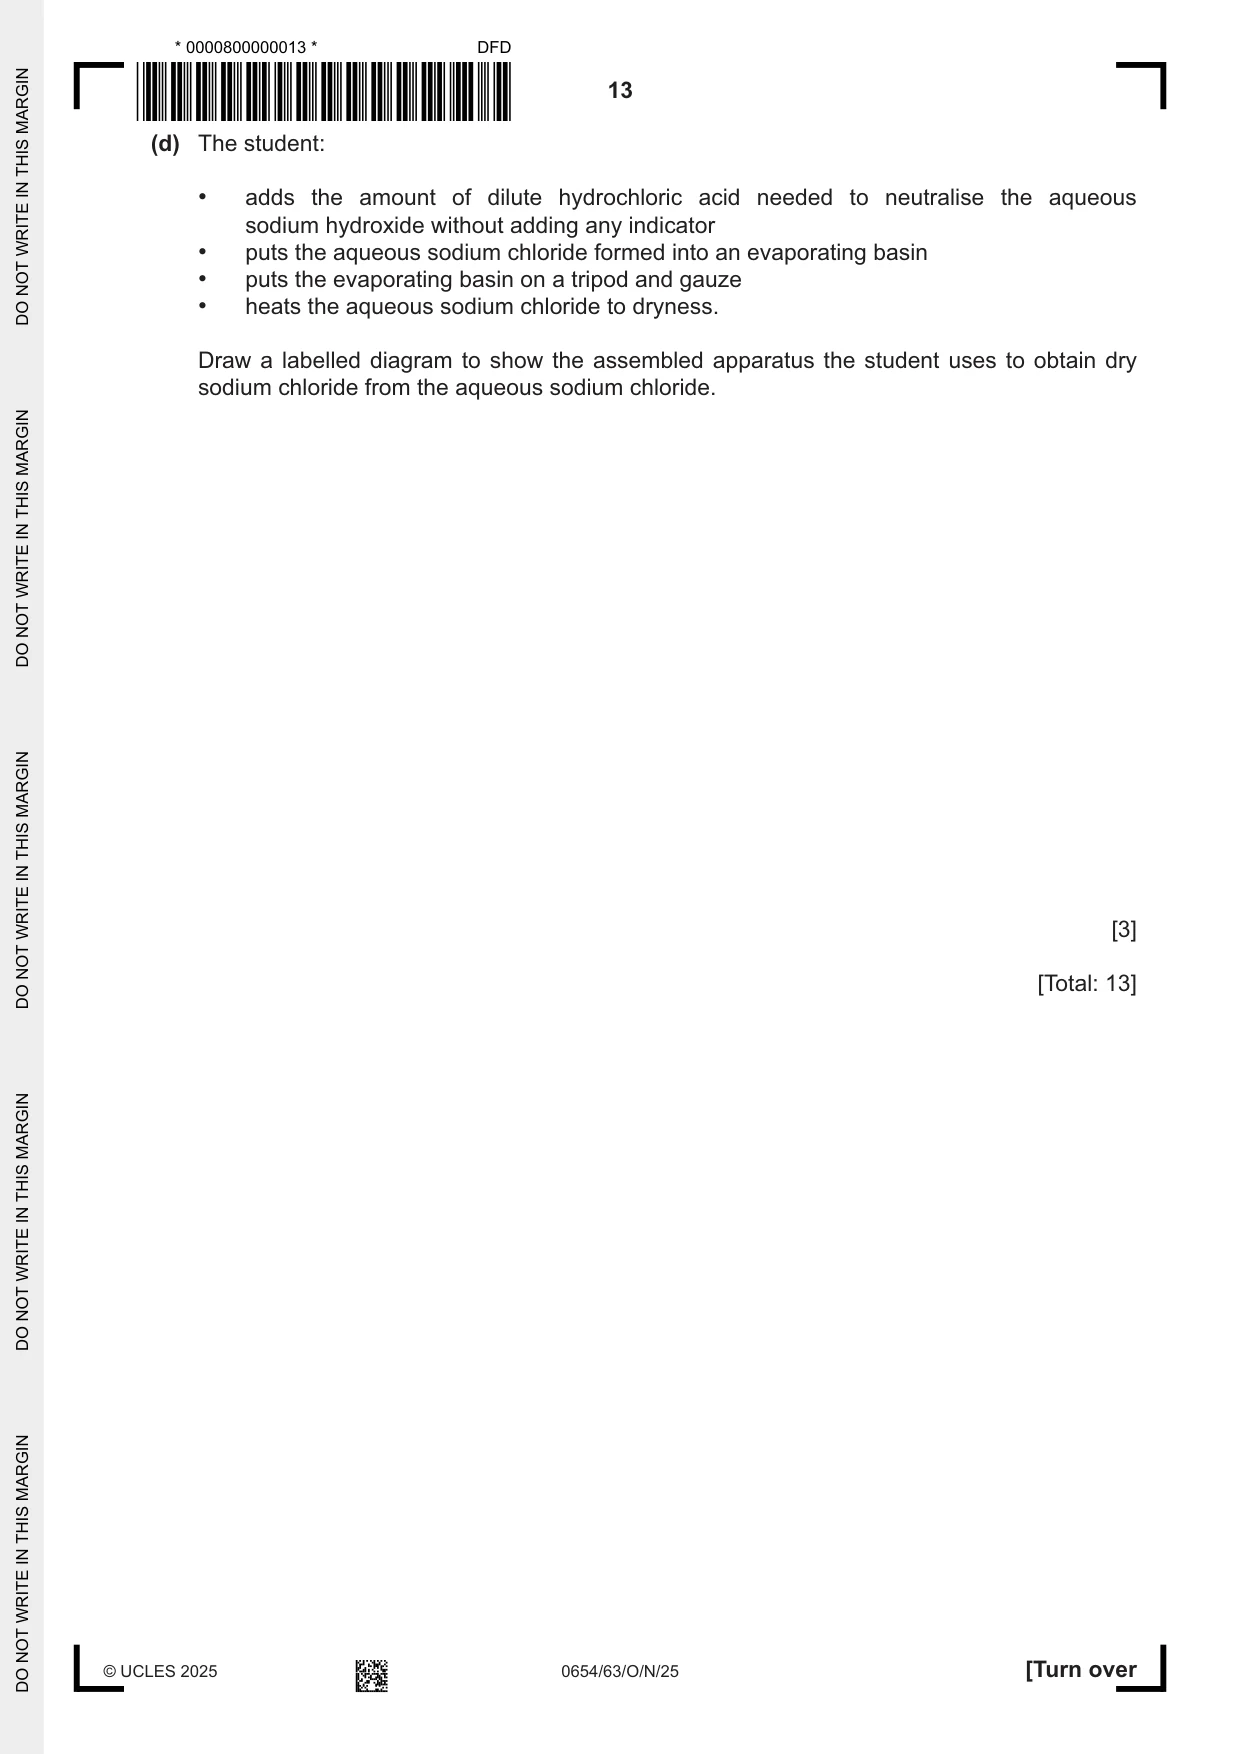
3 A student investigates the neutralisation reaction between dilute hydrochloric acid and aqueous sodium hydroxide. The solutions react in a 1 : 1 ratio. hydrochloric acid + sodium hydroxide sodium chloride + water HCl + NaOH NaCl + H2O Bromothymol blue is an indicator. It turns yellow in acid solutions, blue in alkali solutions and green in neutral solutions. (a) Procedure The student: • puts dilute hydrochloric acid into a burette • records in Table 3.1 the initial reading on the burette • puts 25.0 cm3 of aqueous sodium hydroxide into a conical flask • adds bromothymol blue indicator to the conical flask, the indicator turns blue • slowly adds dilute hydrochloric acid from the burette to the aqueous sodium hydroxide and swirls the flask • stops adding when the indicator just turns green • records in Table 3.1 the final reading on the burette. The student repeats the experiment three more times. Fig. 3.1 shows the apparatus the student uses. burette dilute hydrochloric acid conical flask aqueous sodium hydroxide and bromothymol blue indicator Fig. 3.1 Table 3.1 trial 1 trial 2 trial 3 trial 4 initial reading on burette / cm3 1.25 3.45 2.20 final reading on burette / cm3 13.75 16.00 14.65 volume of dilute hydrochloric acid added / cm3 12.50 12.55 12.45 (i) Fig. 3.2 shows the initial and final volumes of dilute hydrochloric acid in the burette for trial 1. 15 cm3 1 cm3 16 2 17 3 18 initial reading final reading Fig. 3.2 Record in Table 3.1 these burette readings to the nearest 0.05 cm3. [2] (ii) Calculate the volume of dilute hydrochloric acid added in trial 1. Record your value in Table 3.1. [1] (iii) Calculate the average volume of dilute hydrochloric acid added. Show your working. volume = .................................................. cm3 [2] (iv) Explain why it is good experimental practice to repeat experiments. ........................................................................................................................................... ..................................................................................................................................... [1] (v) State the name of the piece of apparatus used to measure the 25.0 cm3 of aqueous sodium hydroxide. ..................................................................................................................................... [1] (b) Concentration is measured in a unit called M. A 3 M solution is three times more concentrated than a 1 M solution. The concentration of the dilute hydrochloric acid used in the experiment is 2 M. Estimate the concentration of the aqueous sodium hydroxide. Show your working. concentration = ........................... M working ..................................................................................................................................... ................................................................................................................................................... [2] (c) The student: • repeats the experiment one more time • adds more dilute hydrochloric acid than is needed to neutralise the aqueous sodium hydroxide. State the final colour of the indicator in this experiment. ............................................................................................................................................. [1] (d) The student: • adds the amount of dilute hydrochloric acid needed to neutralise the aqueous sodium hydroxide without adding any indicator • puts the aqueous sodium chloride formed into an evaporating basin • puts the evaporating basin on a tripod and gauze • heats the aqueous sodium chloride to dryness. Draw a labelled diagram to show the assembled apparatus the student uses to obtain dry sodium chloride from the aqueous sodium chloride. [3] [Total: 13]
Mark scheme: 3(a)(i) 1.25 ; 2 15.70 ; 3(a)(ii) 14.45 ; 1 3(a)(iii) (12. 50 + 12.55 + 12.45) / 3 ; 2 12.5(0) ; 3(a)(iv) identify anomalies / exclude anomalies / identify outliers / exclude outliers / reduce effect of random error ; 1 3(a)(v) (25 cm3), volumetric pipette / graduated pipette ; 1 3(b) 1 M ; 2 twice the volume of NaOH so half the concentration ; 3(c) yellow ; 1 3(d) tripod, gauze and heatproof mat ; 3 evaporating basin and Bunsen burner ; two correct apparatus labels and sodium chloride / solution ;
Q4 · Solid X dissolves in water and the solution it forms is acidic
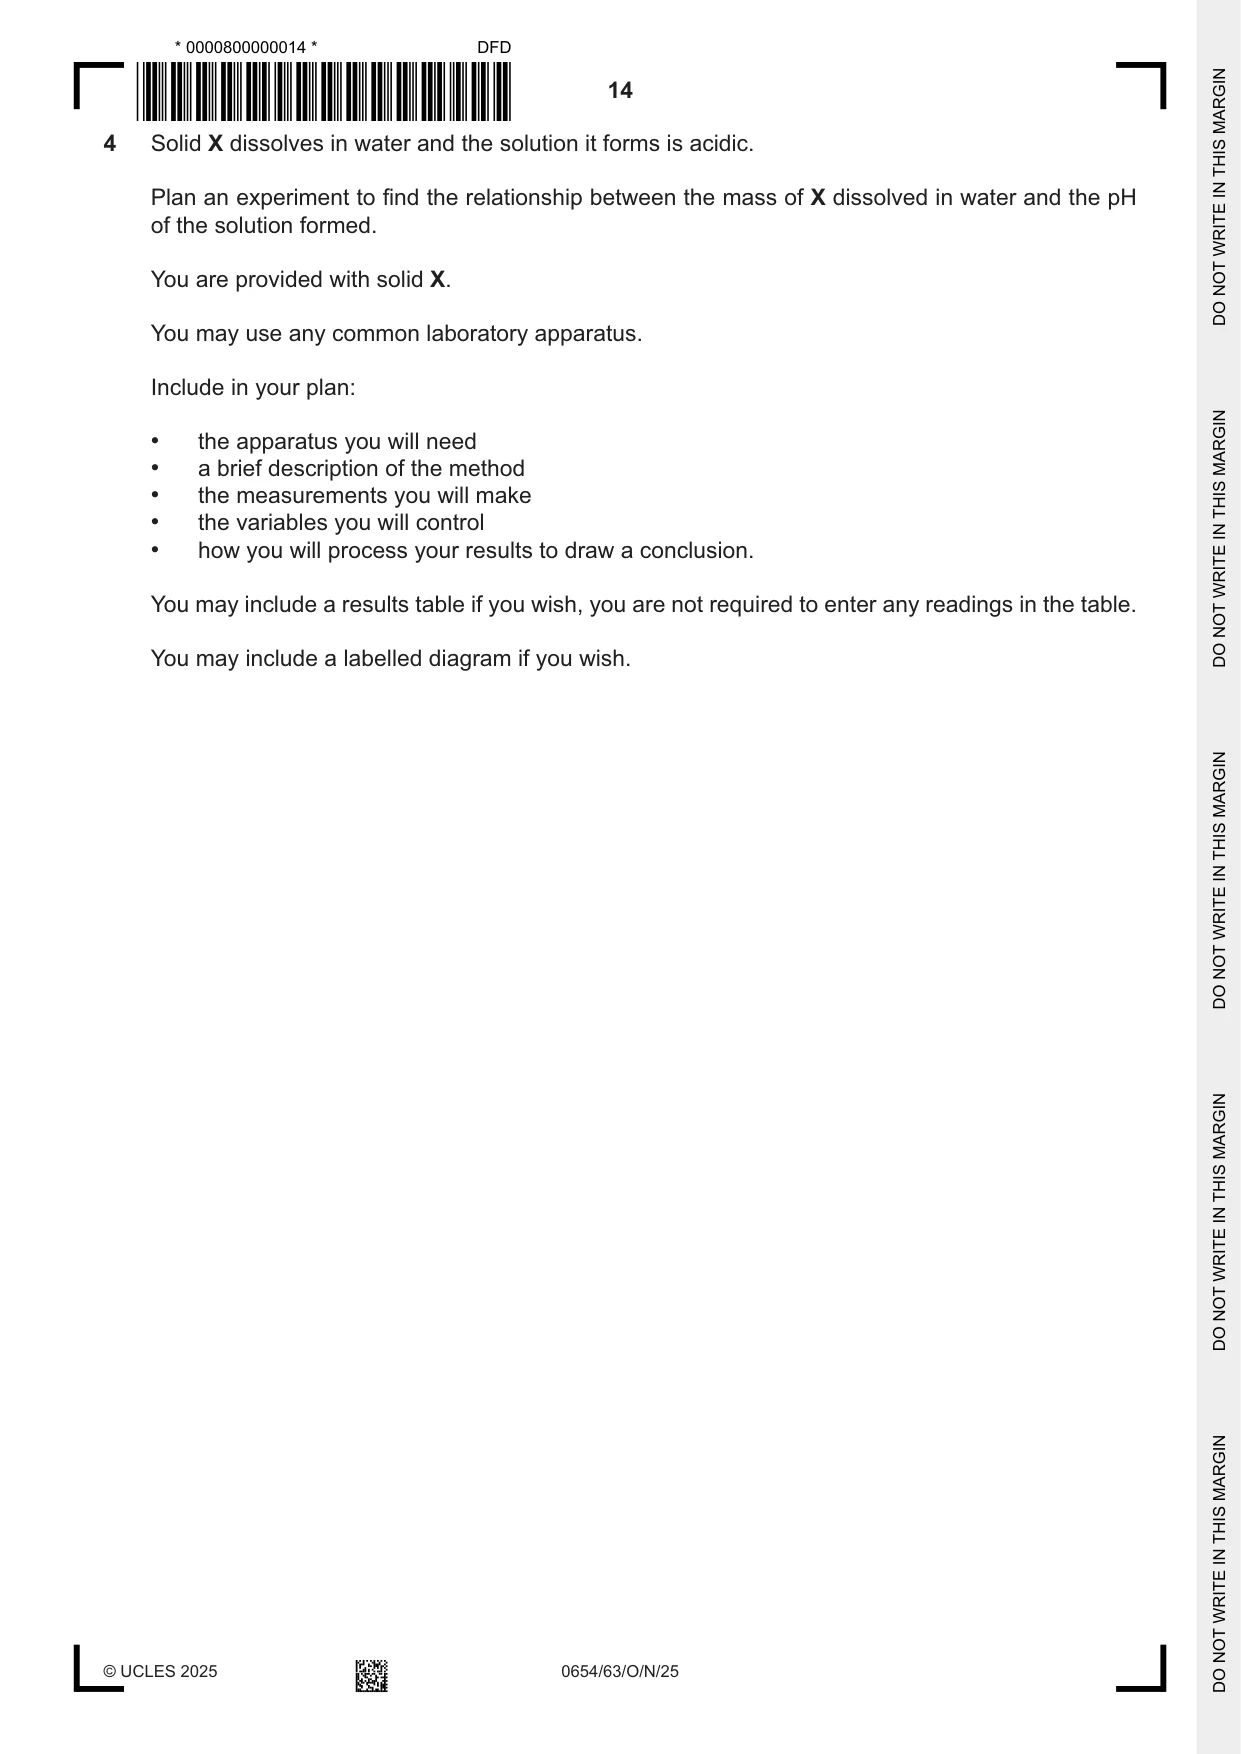
4 Solid X dissolves in water and the solution it forms is acidic. Plan an experiment to find the relationship between the mass of X dissolved in water and the pH of the solution formed. You are provided with solid X. You may use any common laboratory apparatus. Include in your plan: • the apparatus you will need • a brief description of the method • the measurements you will make • the variables you will control • how you will process your results to draw a conclusion. You may include a results table if you wish, you are not required to enter any readings in the table. You may include a labelled diagram if you wish. .......................................................................................................................................................... .......................................................................................................................................................... .......................................................................................................................................................... .......................................................................................................................................................... .......................................................................................................................................................... .......................................................................................................................................................... .......................................................................................................................................................... .......................................................................................................................................................... .......................................................................................................................................................... .......................................................................................................................................................... .......................................................................................................................................................... .......................................................................................................................................................... .......................................................................................................................................................... .......................................................................................................................................................... .......................................................................................................................................................... .......................................................................................................................................................... .......................................................................................................................................................... .......................................................................................................................................................... .......................................................................................................................................................... .......................................................................................................................................................... .......................................................................................................................................................... .......................................................................................................................................................... .......................................................................................................................................................... .......................................................................................................................................................... .......................................................................................................................................................... .......................................................................................................................................................... .......................................................................................................................................................... .................................................................................................................................................... [7]
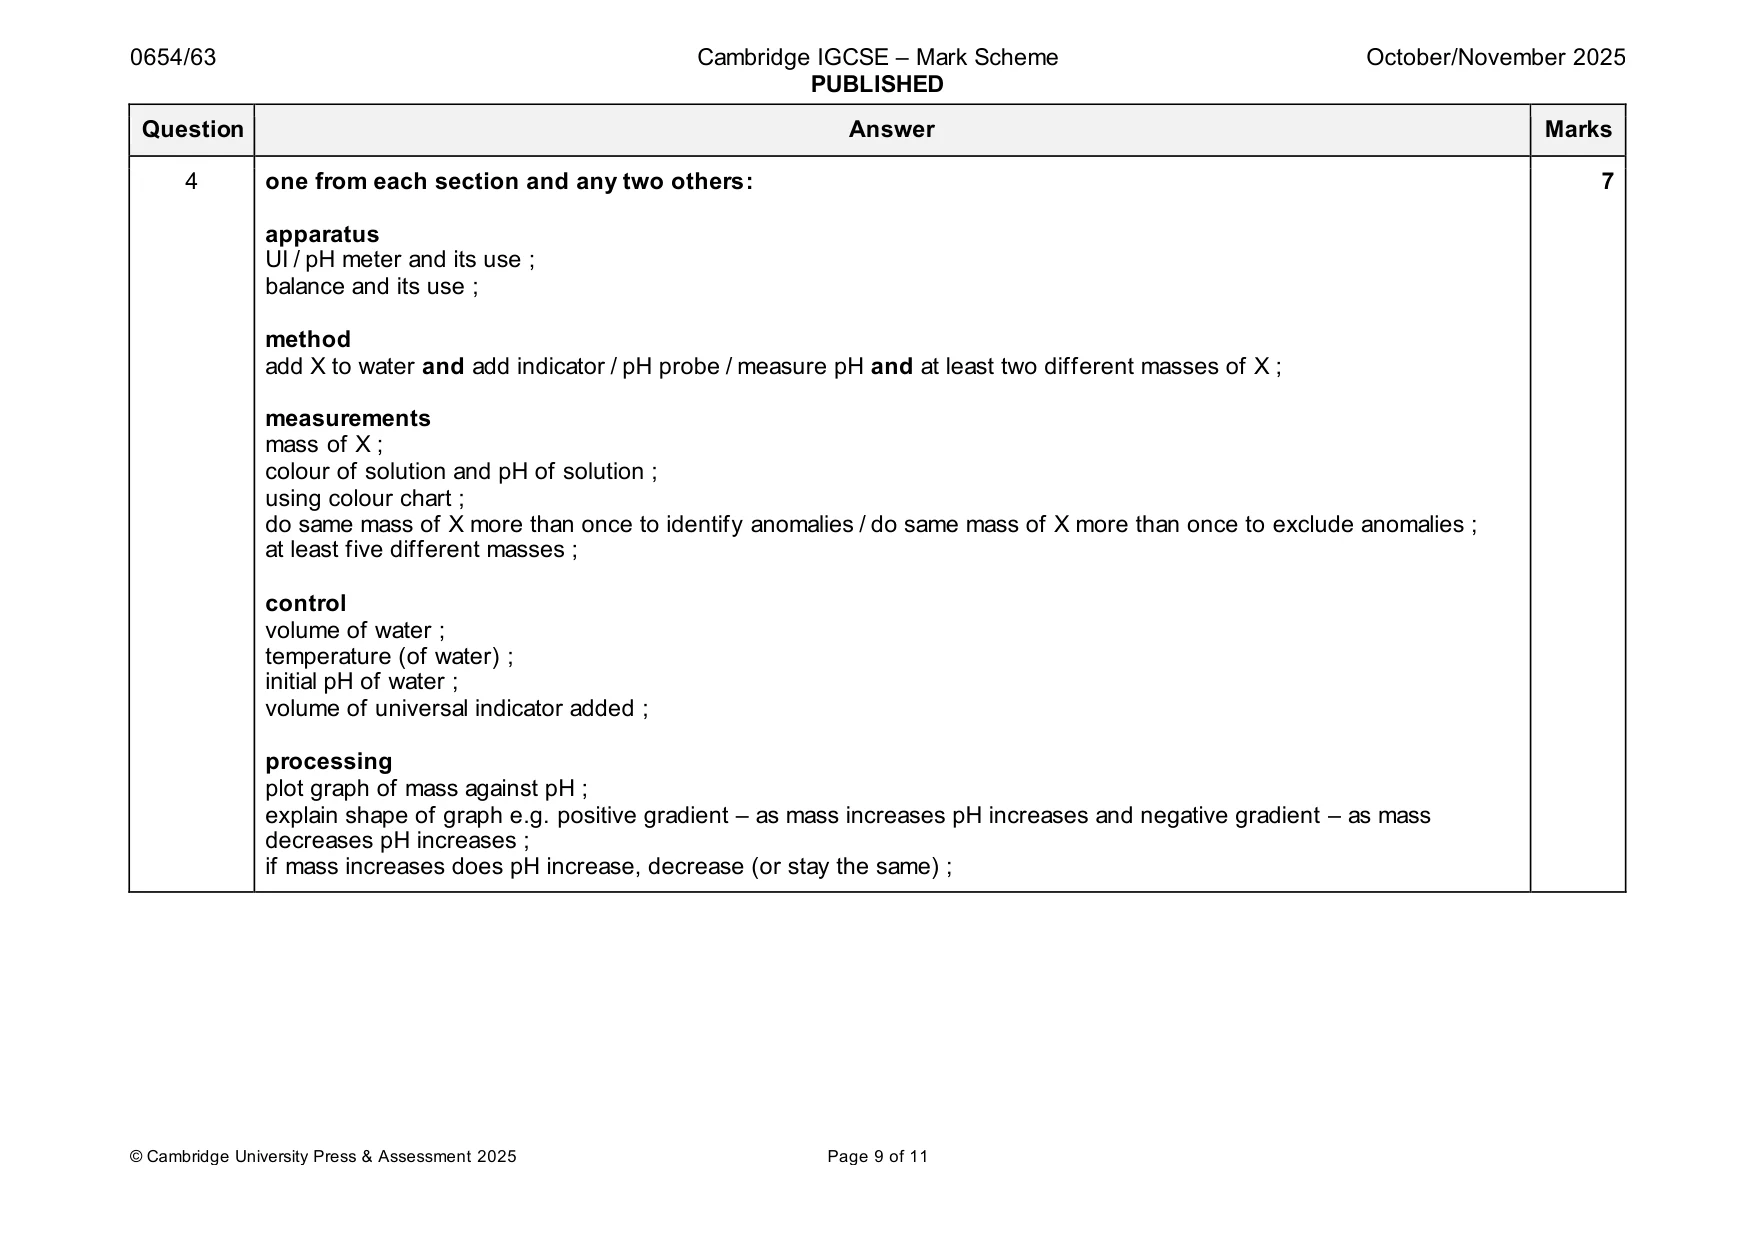
Mark scheme: 4 one from each section and any two others: 7 apparatus UI / pH meter and its use ; balance and its use ; method add X to water and add indicator / pH probe / measure pH and at least two different masses of X ; measurements mass of X ; colour of solution and pH of solution ; using colour chart ; do same mass of X more than once to identify anomalies / do same mass of X more than once to exclude anomalies ; at least five different masses ; control volume of water ; temperature (of water) ; initial pH of water ; volume of universal indicator added ; processing plot graph of mass against pH ; explain shape of graph e.g. positive gradient – as mass increases pH increases and negative gradient – as mass decreases pH increases ; if mass increases does pH increase, decrease (or stay the same) ;
Q5 · A student determines the mass of a metal ball using a balancing method
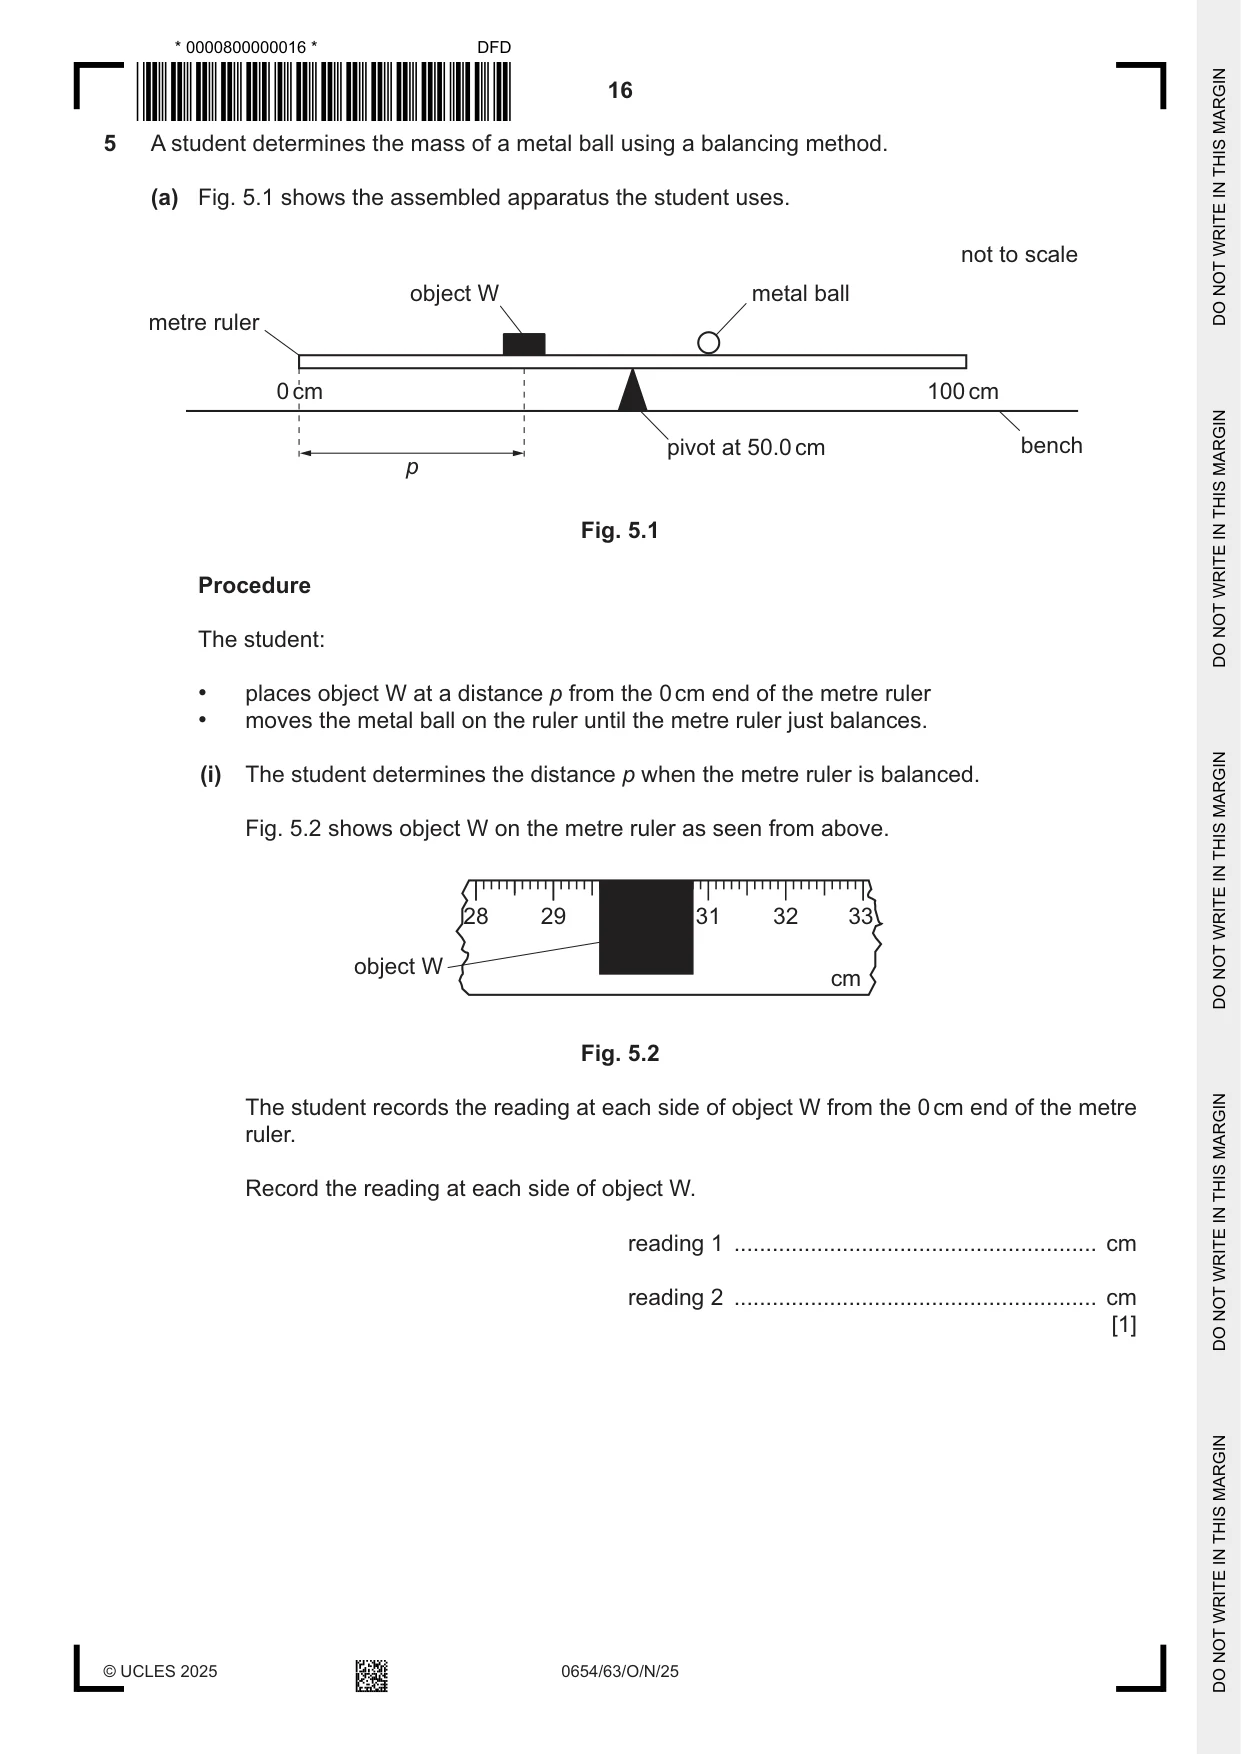
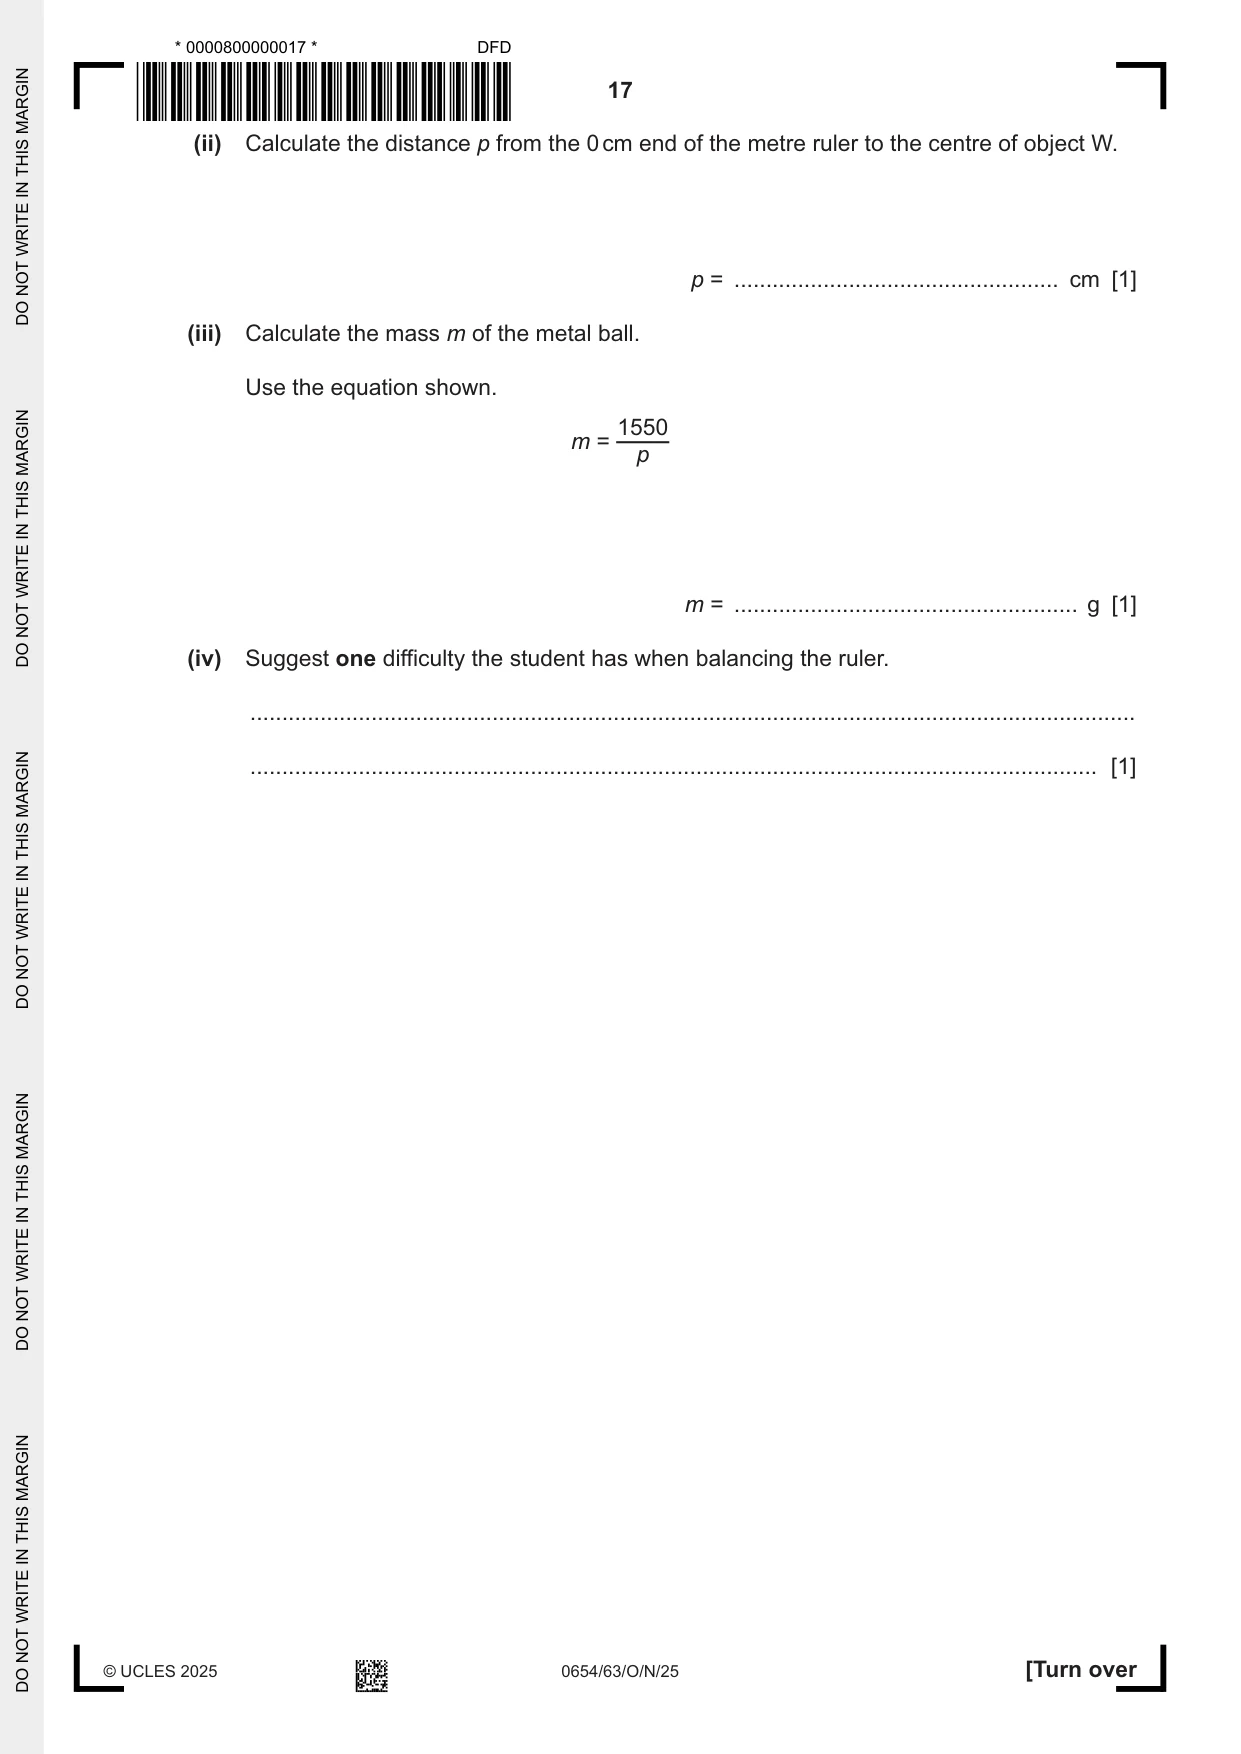
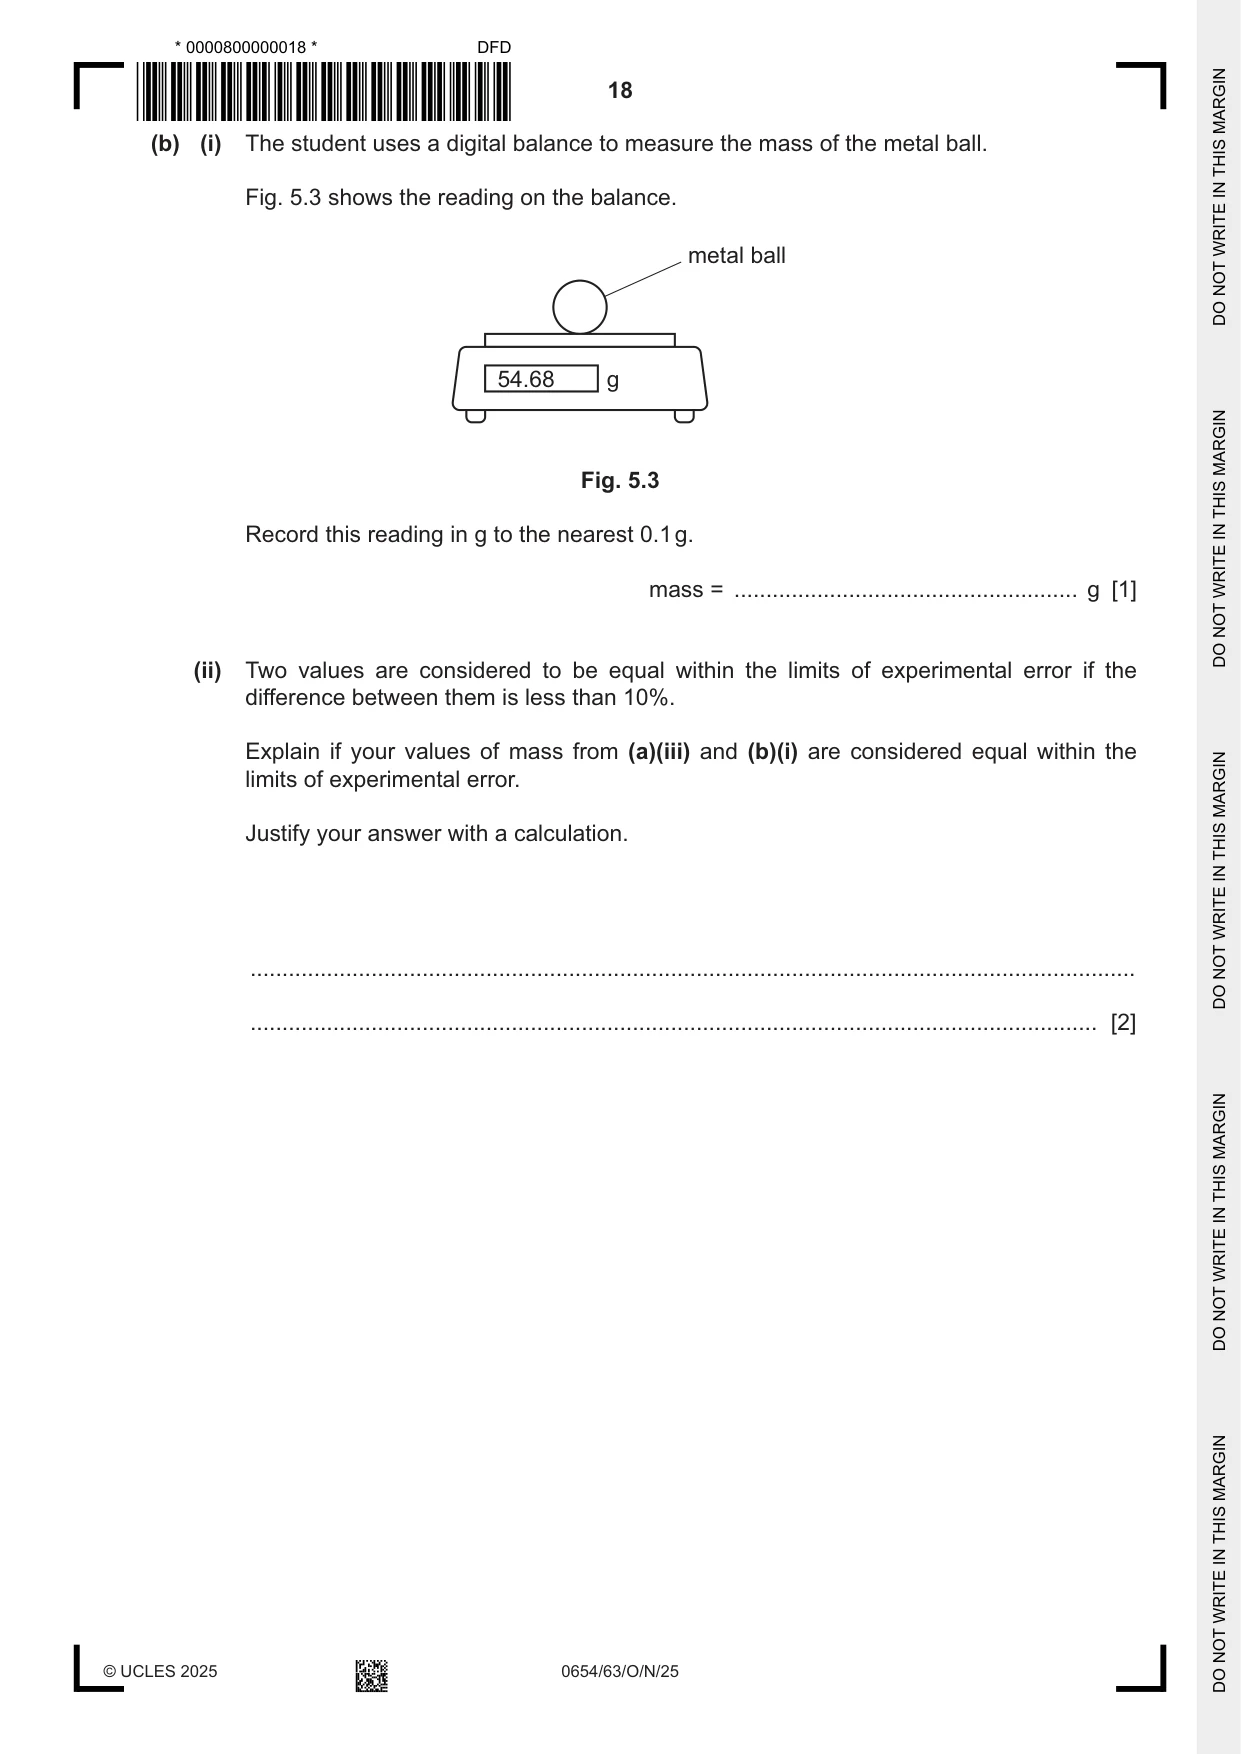
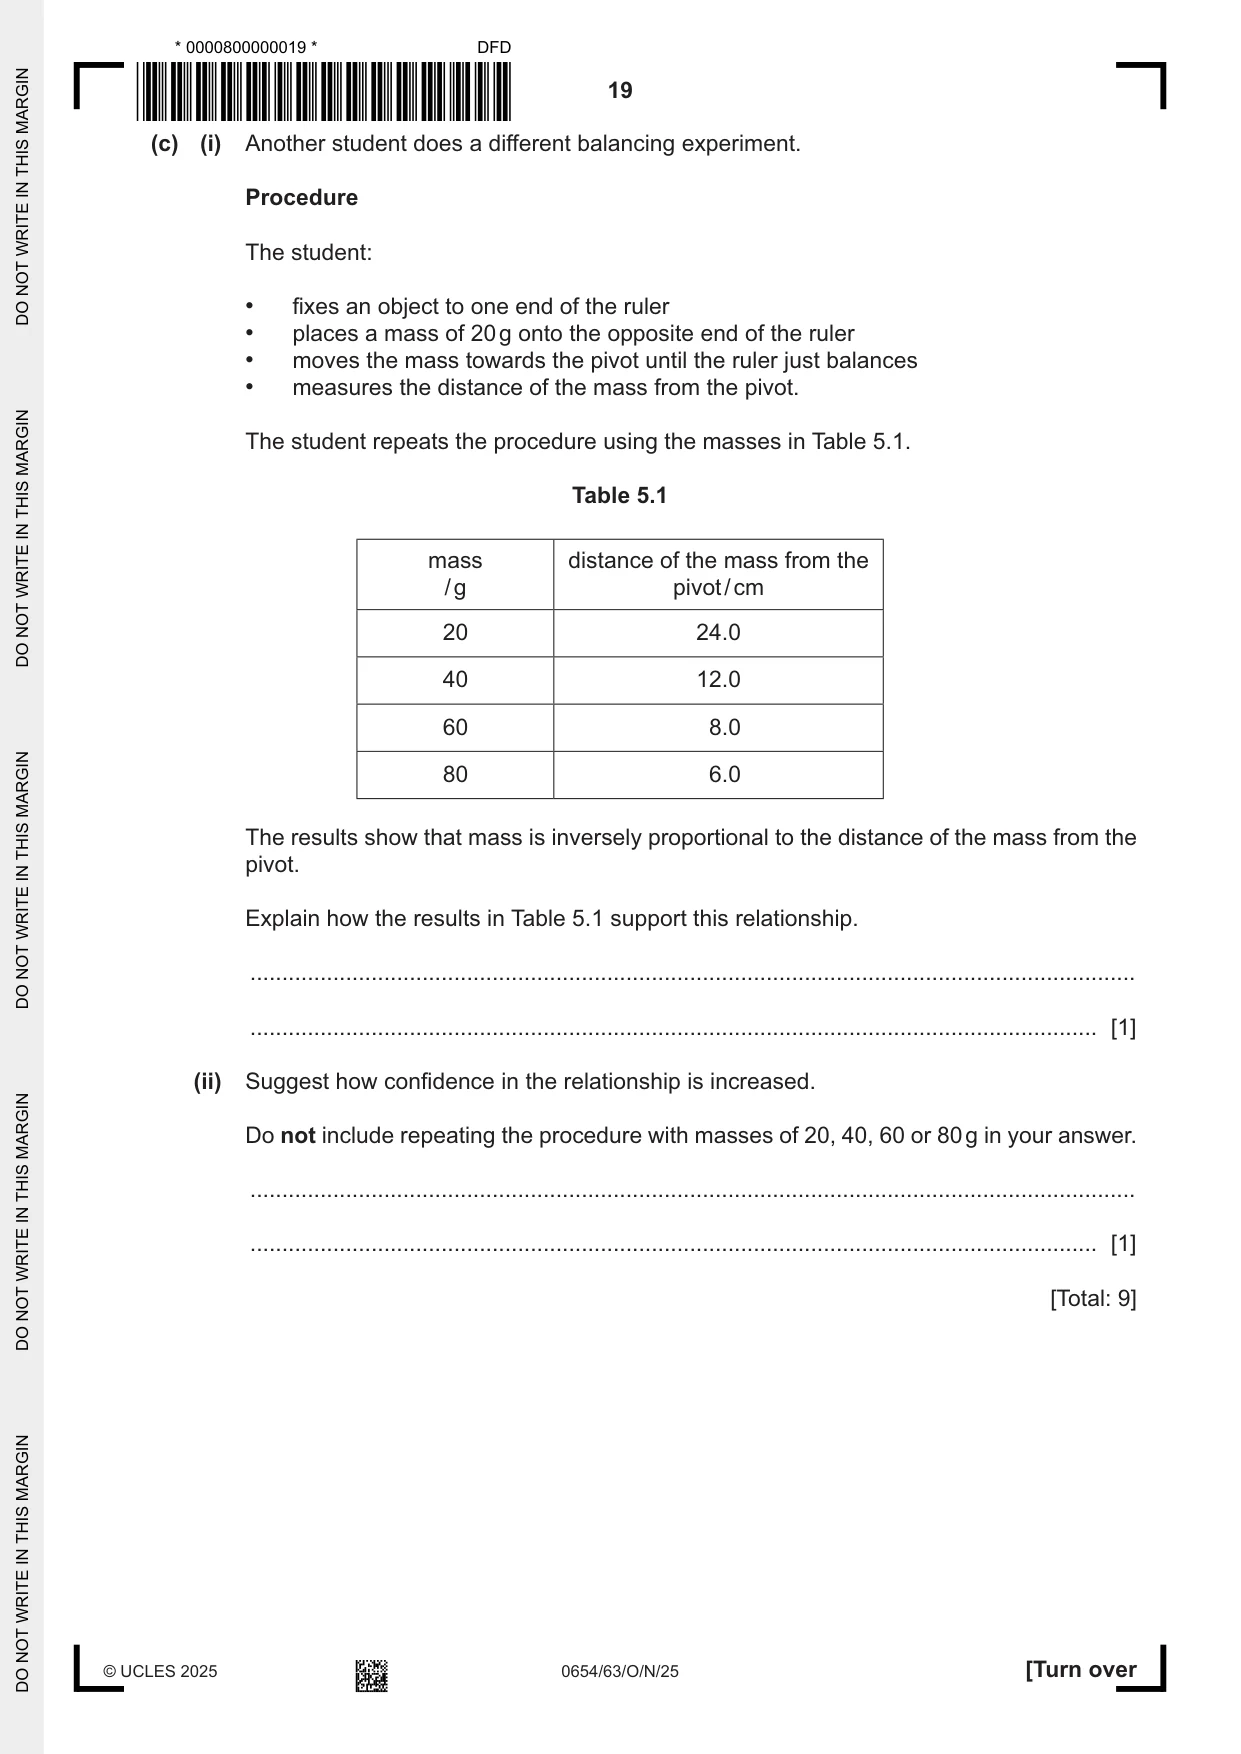
5 A student determines the mass of a metal ball using a balancing method. (a) Fig. 5.1 shows the assembled apparatus the student uses. not to scale object W metal ball metre ruler 0 cm 100 cm pivot at 50.0 cm bench p Fig. 5.1 Procedure The student: • places object W at a distance p from the 0 cm end of the metre ruler • moves the metal ball on the ruler until the metre ruler just balances. (i) The student determines the distance p when the metre ruler is balanced. Fig. 5.2 shows object W on the metre ruler as seen from above. 28 29 30 31 32 33 object W cm Fig. 5.2 The student records the reading at each side of object W from the 0 cm end of the metre ruler. Record the reading at each side of object W. reading 1 ......................................................... cm reading 2 ......................................................... cm [1] (ii) Calculate the distance p from the 0 cm end of the metre ruler to the centre of object W. p = ................................................... cm [1] (iii) Calculate the mass m of the metal ball. Use the equation shown. 1550 m = p m = ...................................................... g [1] (iv) Suggest one difficulty the student has when balancing the ruler. ........................................................................................................................................... ..................................................................................................................................... [1] (b) (i) The student uses a digital balance to measure the mass of the metal ball. Fig. 5.3 shows the reading on the balance. metal ball 54.68 g Fig. 5.3 Record this reading in g to the nearest 0.1 g. mass = ...................................................... g [1] (ii) Two values are considered to be equal within the limits of experimental error if the difference between them is less than 10%. Explain if your values of mass from (a)(iii) and (b)(i) are considered equal within the limits of experimental error. Justify your answer with a calculation. ........................................................................................................................................... ..................................................................................................................................... [2] (c) (i) Another student does a different balancing experiment. Procedure The student: • fixes an object to one end of the ruler • places a mass of 20 g onto the opposite end of the ruler • moves the mass towards the pivot until the ruler just balances • measures the distance of the mass from the pivot. The student repeats the procedure using the masses in Table 5.1. Table 5.1 mass distance of the mass from the / g pivot / cm 20 24.0 40 12.0 60 8.0 80 6.0 The results show that mass is inversely proportional to the distance of the mass from the pivot. Explain how the results in Table 5.1 support this relationship. ........................................................................................................................................... ..................................................................................................................................... [1] (ii) Suggest how confidence in the relationship is increased. Do not include repeating the procedure with masses of 20, 40, 60 or 80 g in your answer. ........................................................................................................................................... ..................................................................................................................................... [1] [Total: 9]
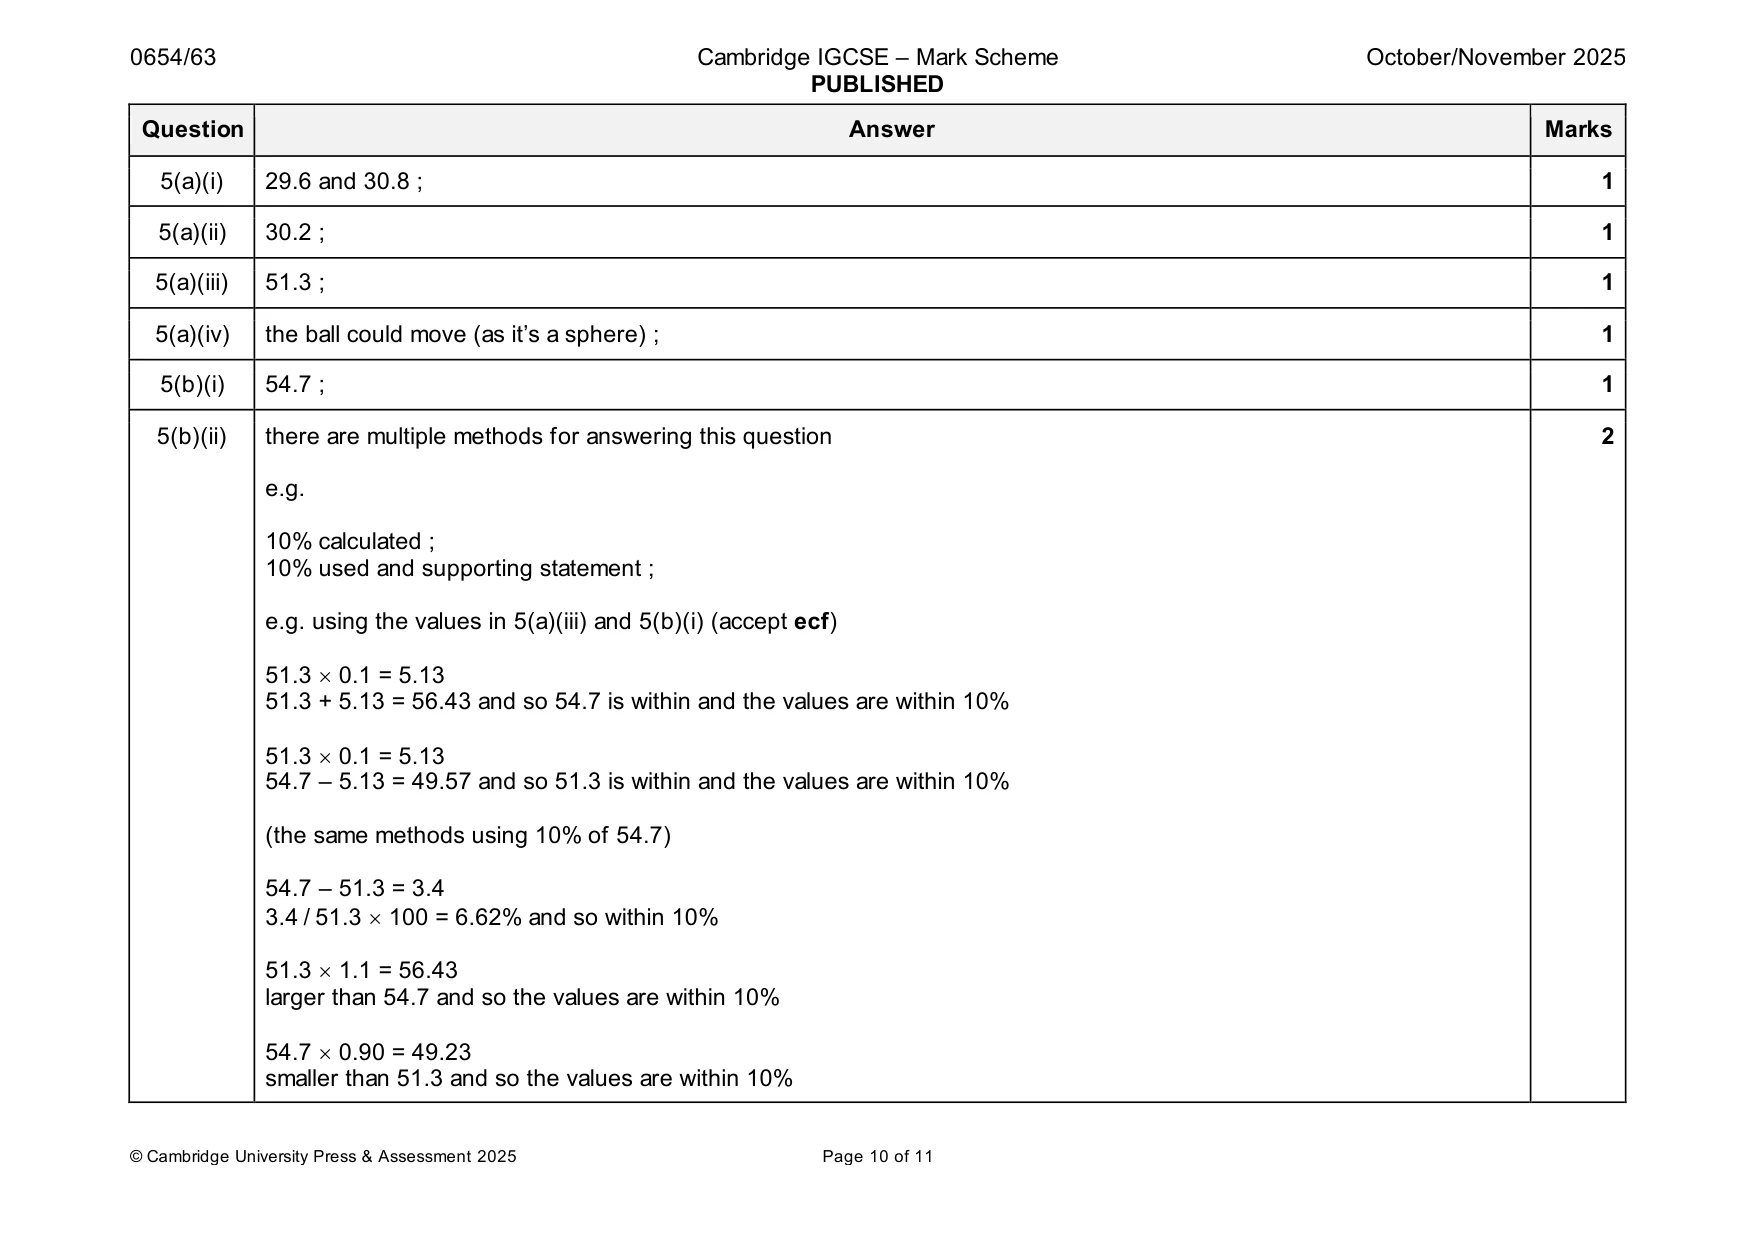
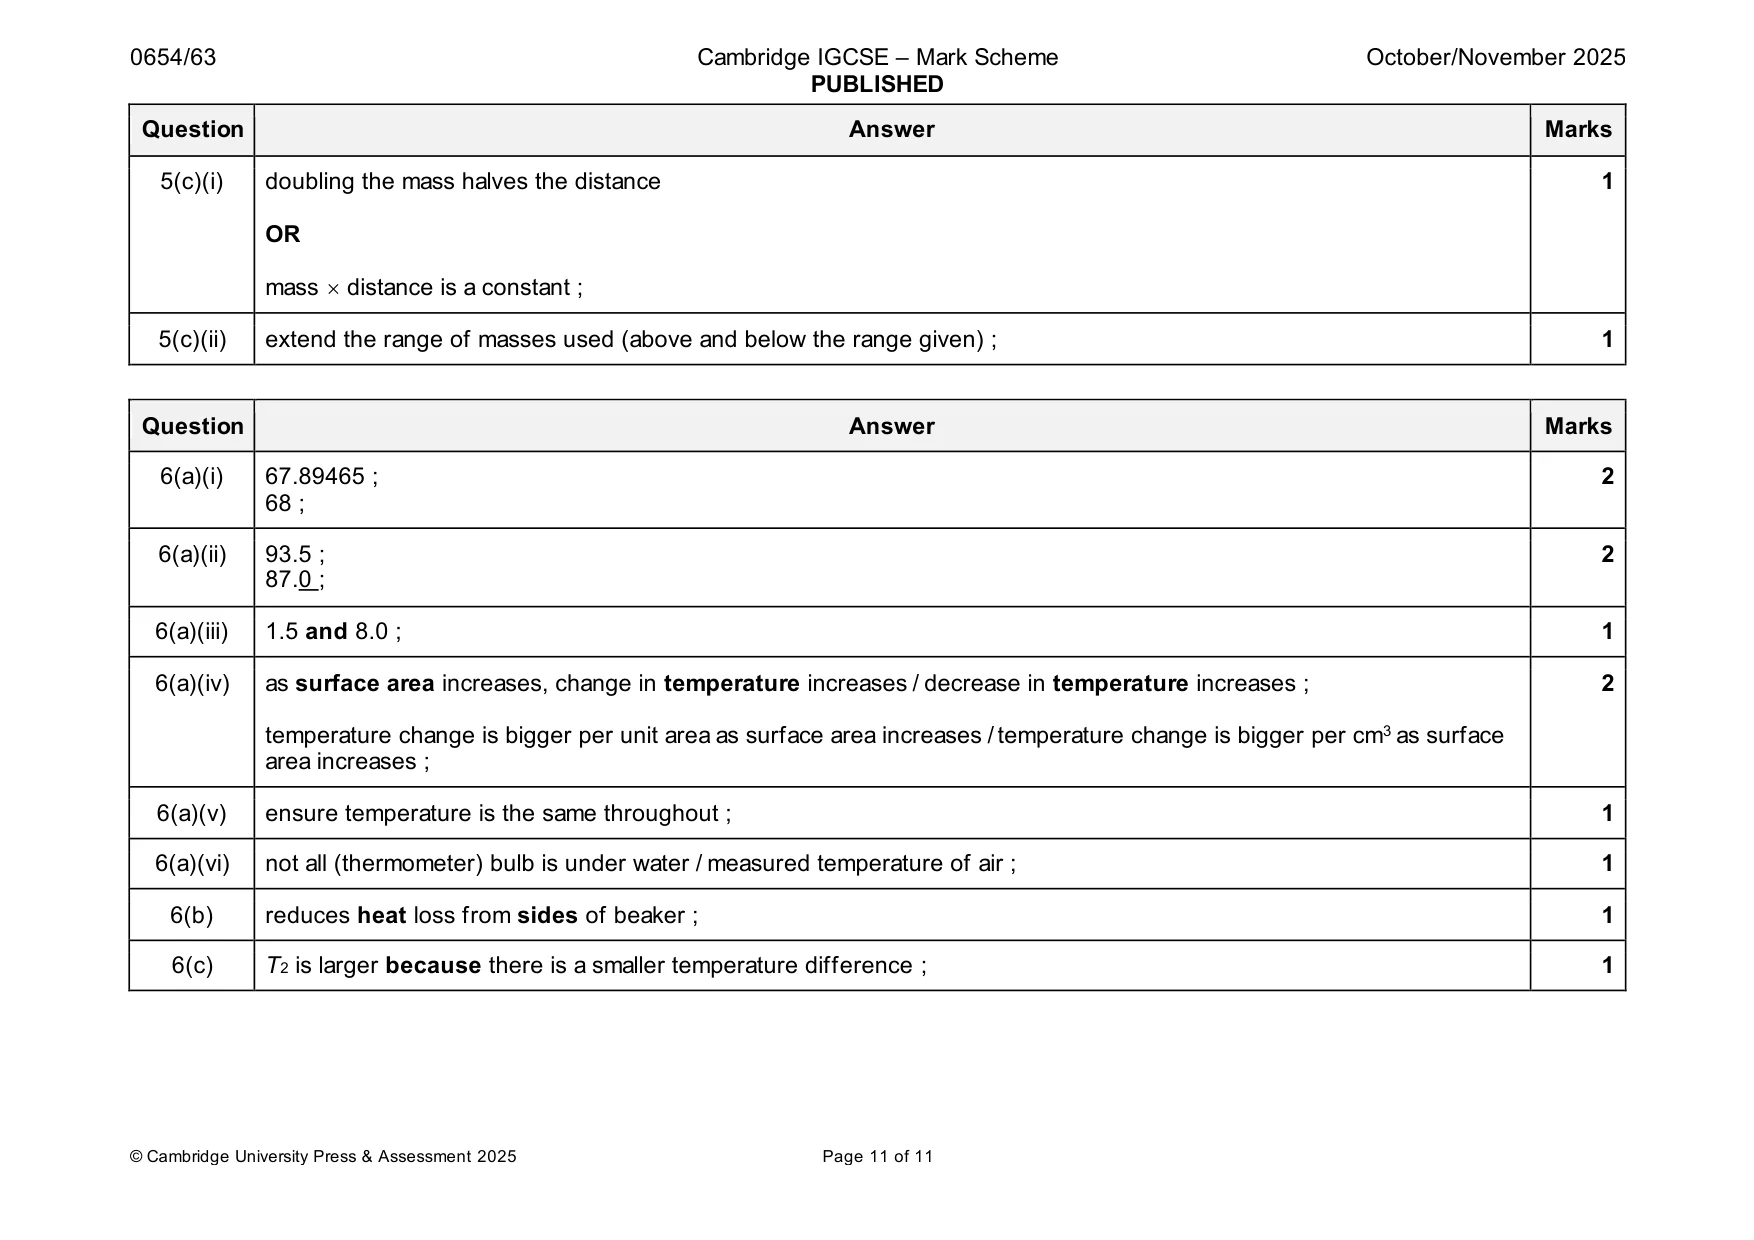
Mark scheme: 5(a)(i) 29.6 and 30.8 ; 1 5(a)(ii) 30.2 ; 1 5(a)(iii) 51.3 ; 1 5(a)(iv) the ball could move (as it’s a sphere) ; 1 5(b)(i) 54.7 ; 1 5(b)(ii) there are multiple methods for answering this question 2 e.g. 10% calculated ; 10% used and supporting statement ; e.g. using the values in 5(a)(iii) and 5(b)(i) (accept ecf) 51.3 0.1 = 5.13 51.3 + 5.13 = 56.43 and so 54.7 is within and the values are within 10% 51.3 0.1 = 5.13 54.7 – 5.13 = 49.57 and so 51.3 is within and the values are within 10% (the same methods using 10% of 54.7) 54.7 – 51.3 = 3.4 3.4 / 51.3 100 = 6.62% and so within 10% 51.3 1.1 = 56.43 larger than 54.7 and so the values are within 10% 54.7 0.90 = 49.23 smaller than 51.3 and so the values are within 10% 5(c)(i) doubling the mass halves the distance 1 OR mass distance is a constant ; 5(c)(ii) extend the range of masses used (above and below the range given) ; 1
More questions on Physical quantities and measurement techniques
Q6 · A student investigates how the surface area of hot water exposed to the air affects the…
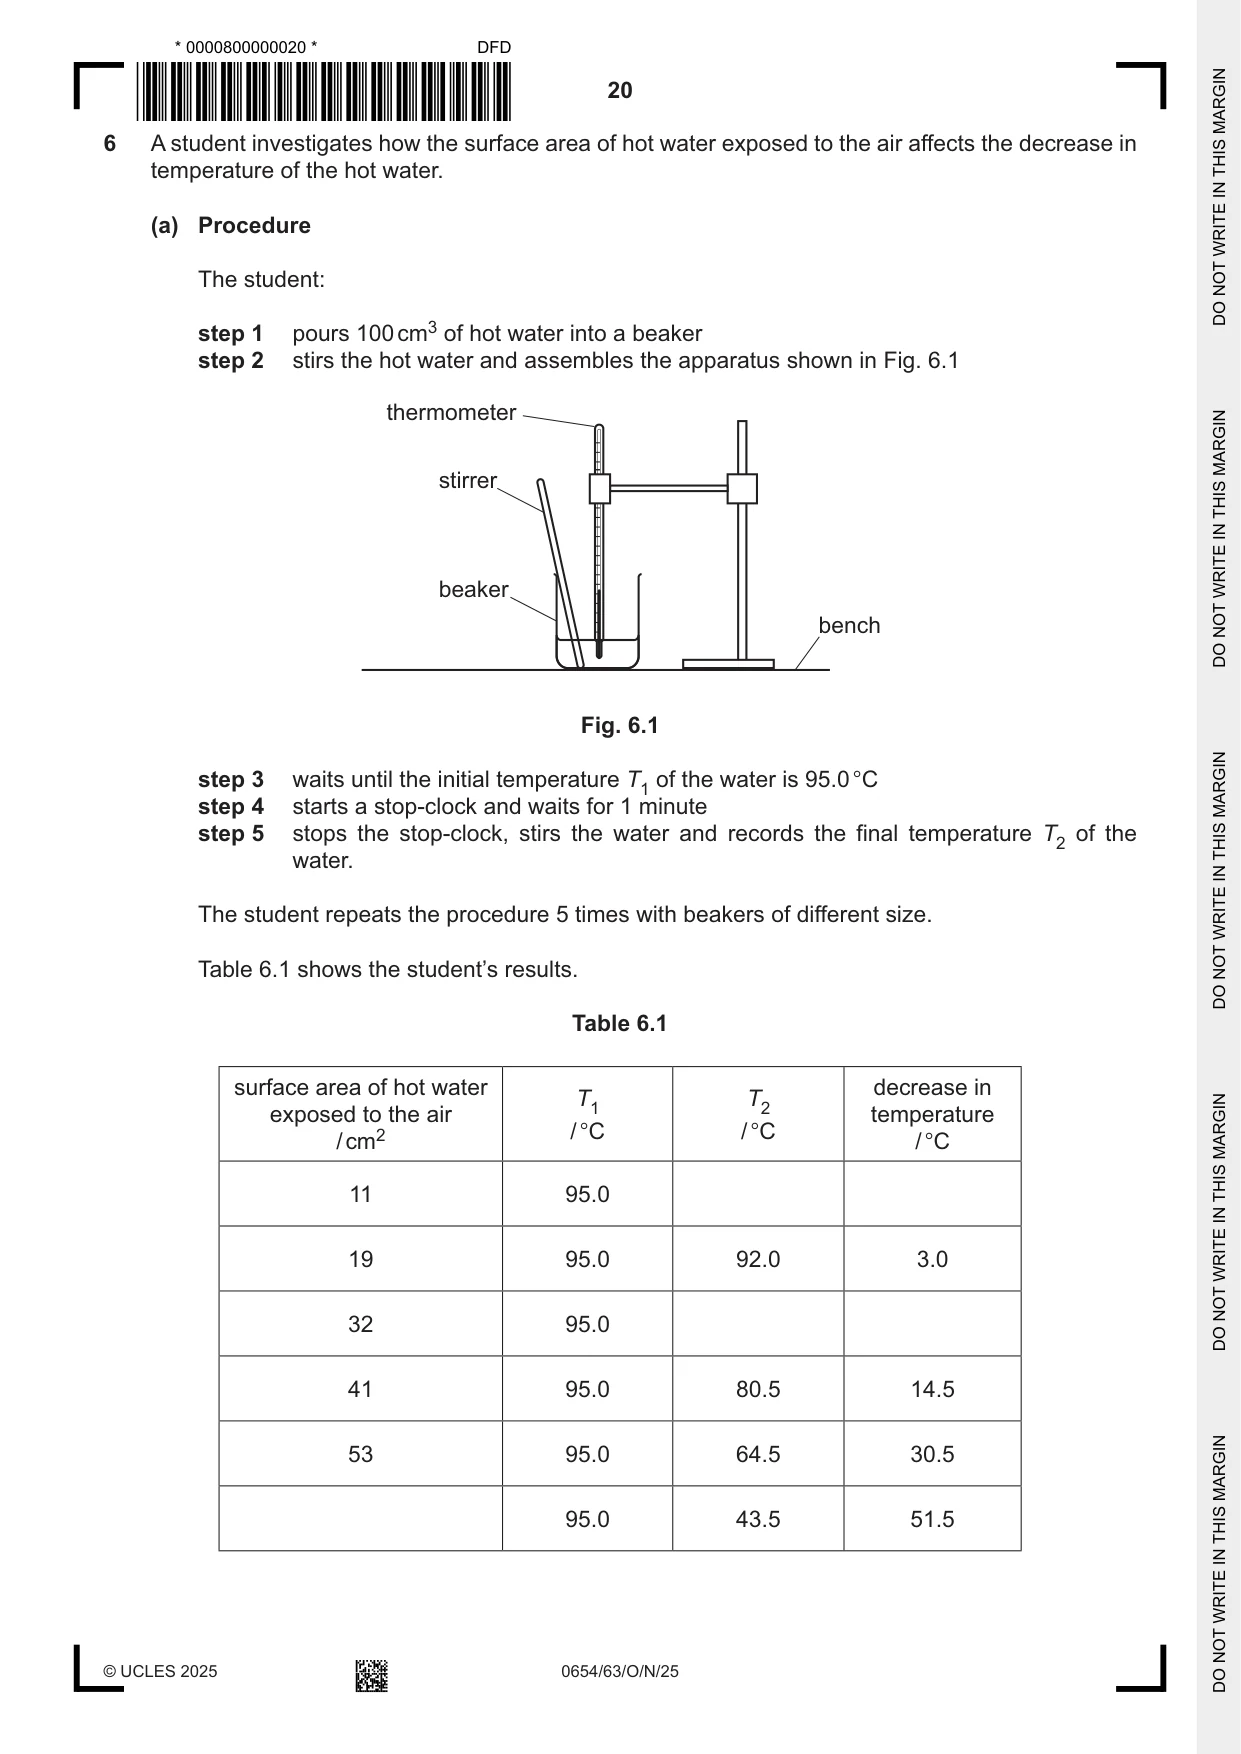
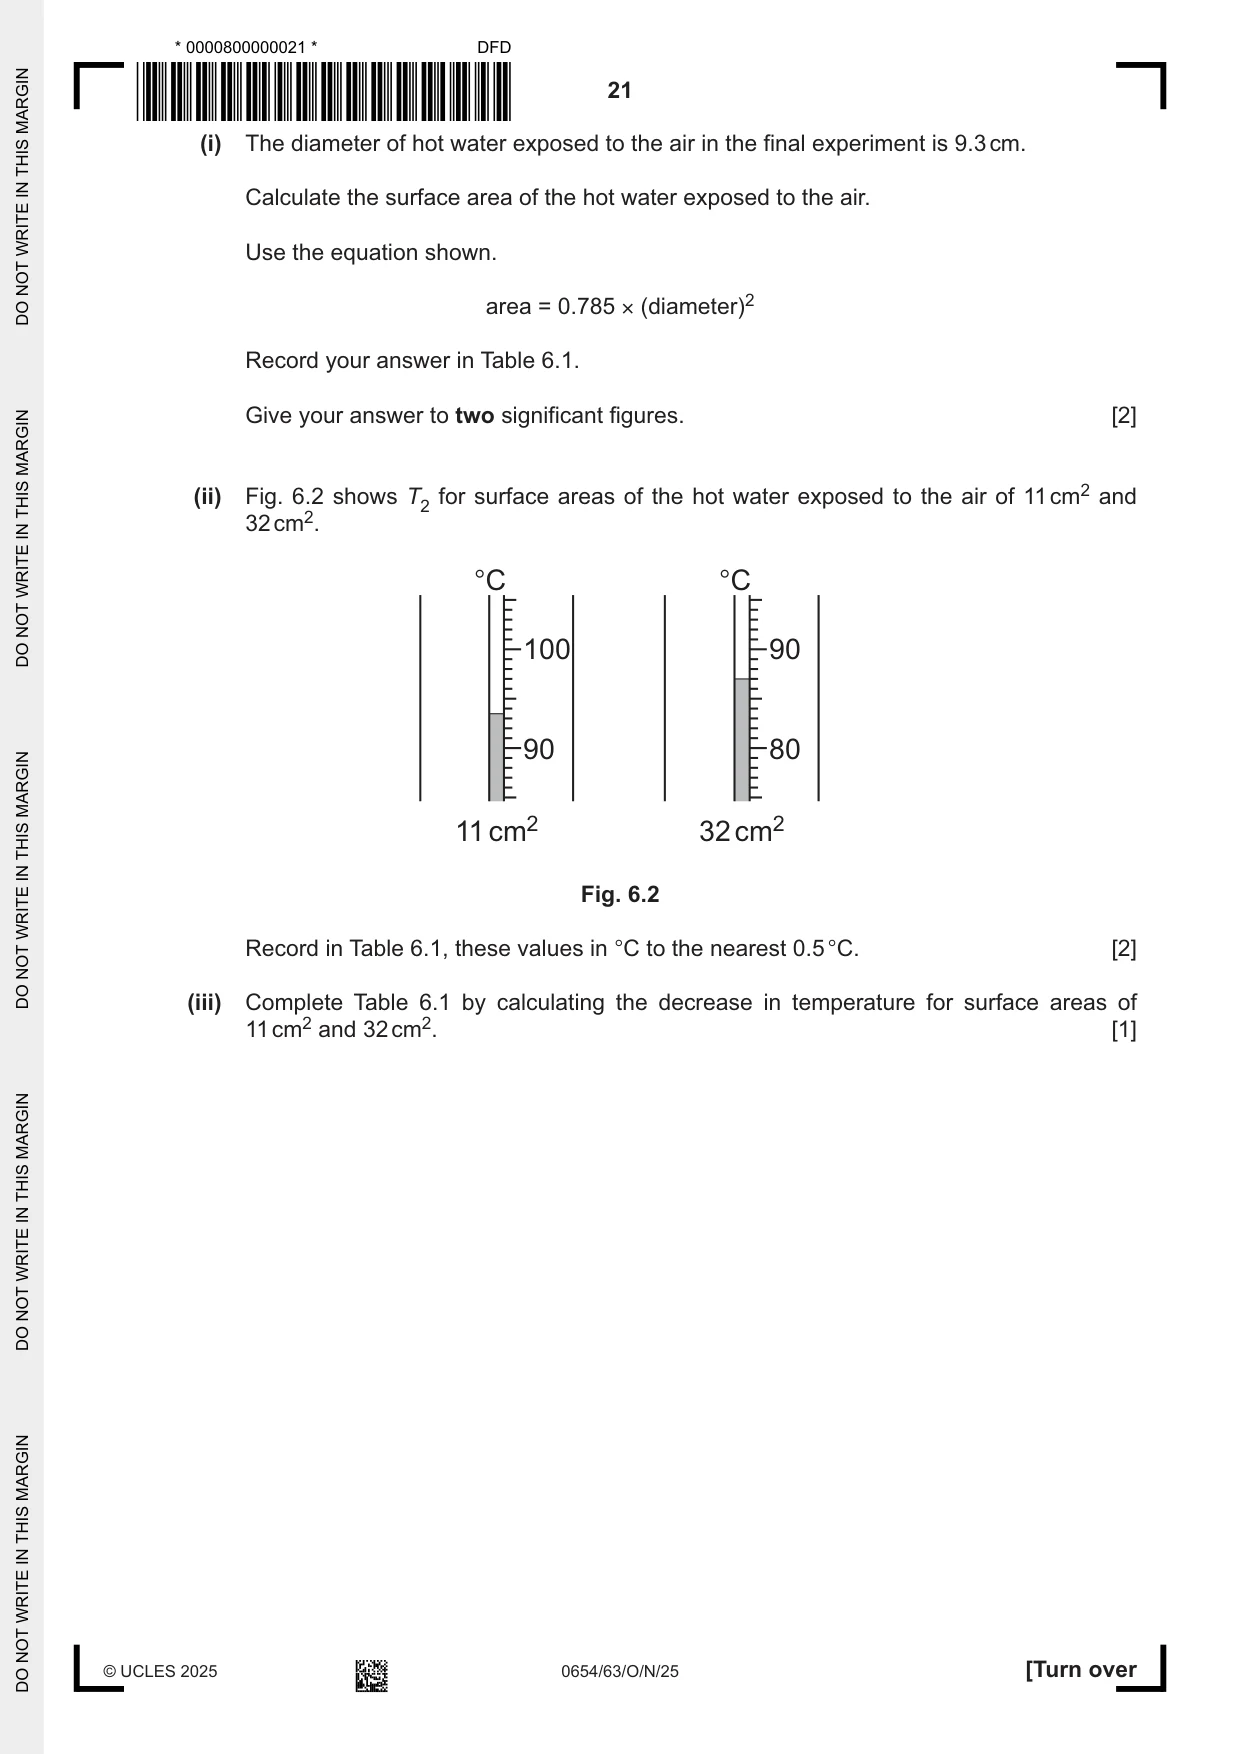
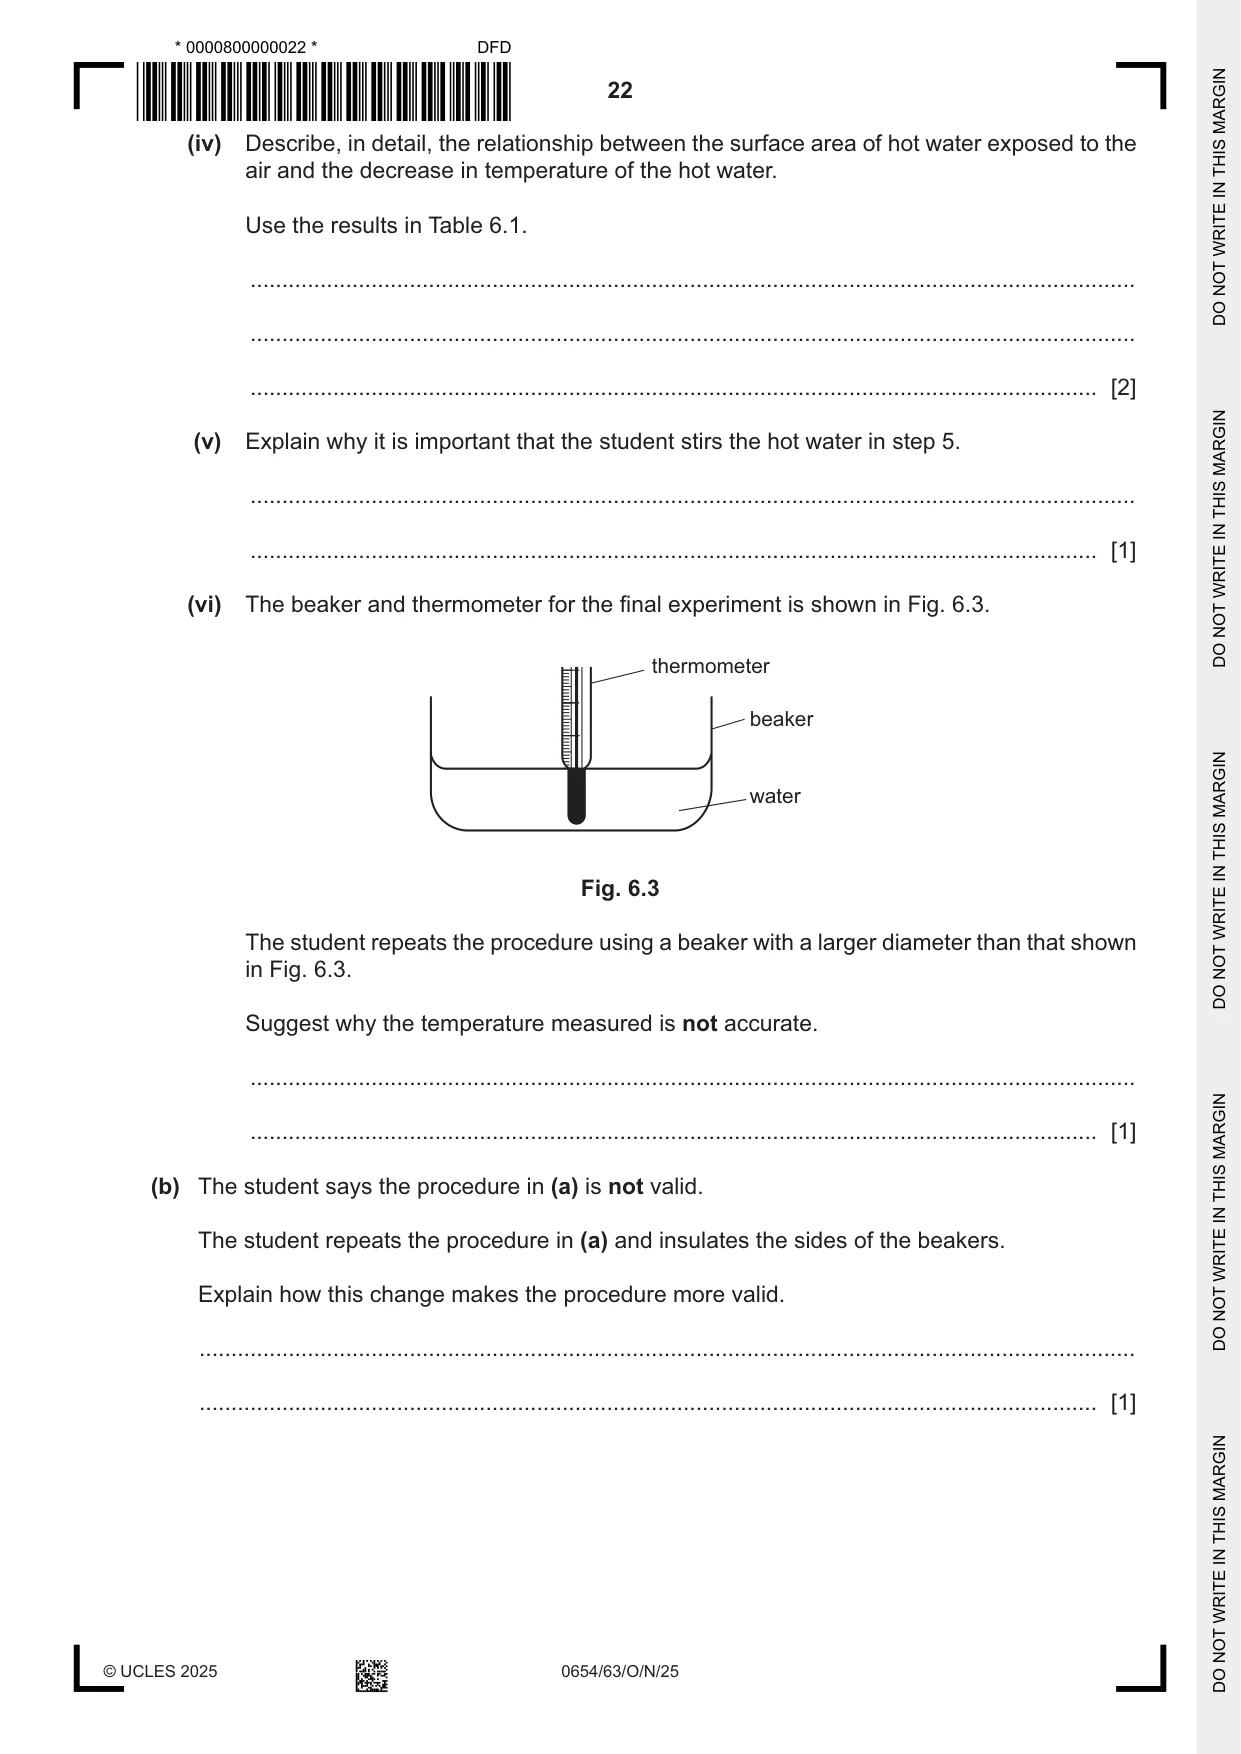
6 A student investigates how the surface area of hot water exposed to the air affects the decrease in temperature of the hot water. (a) Procedure The student: step 1 pours 100 cm3 of hot water into a beaker step 2 stirs the hot water and assembles the apparatus shown in Fig. 6.1 thermometer stirrer beaker bench Fig. 6.1 step 3 waits until the initial temperature T1 of the water is 95.0 °C step 4 starts a stop-clock and waits for 1 minute step 5 stops the stop-clock, stirs the water and records the final temperature T2 of the water. The student repeats the procedure 5 times with beakers of different size. Table 6.1 shows the student’s results. Table 6.1 surface area of hot water decrease in T1 T2 exposed to the air temperature / °C / °C / cm2 / °C 11 95.0 19 95.0 92.0 3.0 32 95.0 41 95.0 80.5 14.5 53 95.0 64.5 30.5 95.0 43.5 51.5 (i) The diameter of hot water exposed to the air in the final experiment is 9.3 cm. Calculate the surface area of the hot water exposed to the air. Use the equation shown. area = 0.785 × (diameter)2 Record your answer in Table 6.1. Give your answer to two significant figures. [2] (ii) Fig. 6.2 shows T2 for surface areas of the hot water exposed to the air of 11 cm2 and 32 cm2. °C °C 100 90 90 80 11 cm2 32 cm2 Fig. 6.2 Record in Table 6.1, these values in °C to the nearest 0.5 °C. [2] (iii) Complete Table 6.1 by calculating the decrease in temperature for surface areas of 11 cm2 and 32 cm2. [1] (iv) Describe, in detail, the relationship between the surface area of hot water exposed to the air and the decrease in temperature of the hot water. Use the results in Table 6.1. ........................................................................................................................................... ........................................................................................................................................... ..................................................................................................................................... [2] (v) Explain why it is important that the student stirs the hot water in step 5. ........................................................................................................................................... ..................................................................................................................................... [1] (vi) The beaker and thermometer for the final experiment is shown in Fig. 6.3. thermometer beaker water Fig. 6.3 The student repeats the procedure using a beaker with a larger diameter than that shown in Fig. 6.3. Suggest why the temperature measured is not accurate. ........................................................................................................................................... ..................................................................................................................................... [1] (b) The student says the procedure in (a) is not valid. The student repeats the procedure in (a) and insulates the sides of the beakers. Explain how this change makes the procedure more valid. ................................................................................................................................................... ............................................................................................................................................. [1]
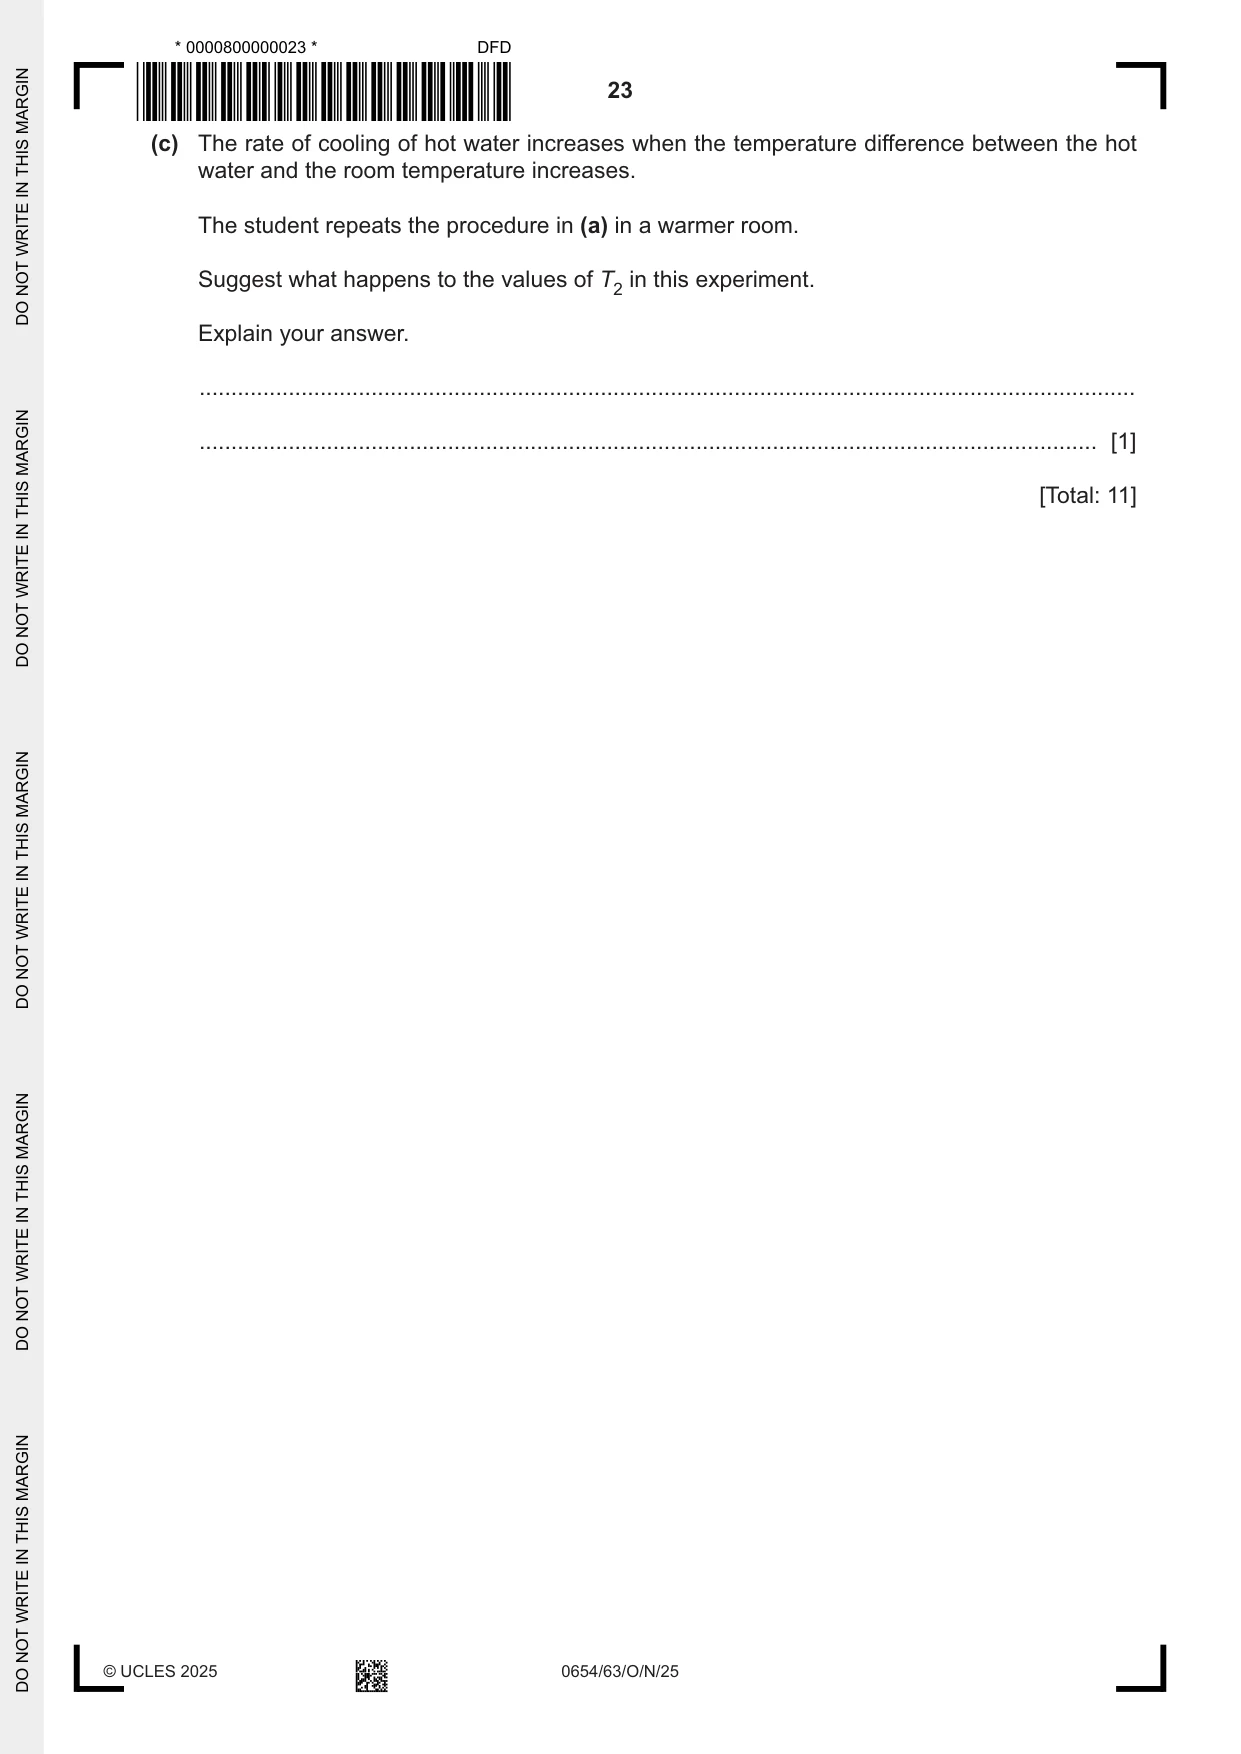
Mark scheme: 6(a)(i) 67.89465 ; 2 68 ; 6(a)(ii) 93.5 ; 2 87.0 ; 6(a)(iii) 1.5 and 8.0 ; 1 6(a)(iv) as surface area increases, change in temperature increases / decrease in temperature increases ; 2 temperature change is bigger per unit area as surface area increases / temperature change is bigger per cm3 as surface area increases ; 6(a)(v) ensure temperature is the same throughout ; 1 6(a)(vi) not all (thermometer) bulb is under water / measured temperature of air ; 1 6(b) reduces heat loss from sides of beaker ; 1 6(c) T2 is larger because there is a smaller temperature difference ; 1
What was in this paper
The subtopics covered by these 6 questions, and how many questions each got. Open one in a new tab to see every Cambridge question on it.
What you needed in this session
Cambridge’s own grade thresholds for 2025 Oct/Nov, Paper 6 · Variant 3. A higher threshold means an easier paper — the bar moves with how the cohort did.