Cambridge IGCSE Sciences - Co-ordinated (Double) 0654 — 2025 Oct/Nov Paper 6 · Variant 1
0654/61/O/N/25 · 6 questions · 60 marks · 90 min
The question paper and its mark scheme, free to read here and free to download. This is Cambridge’s own paper, exactly as it was sat.
Question paper20 pages



Mark scheme11 pages
Answers below. Sit the paper first if you are practising.
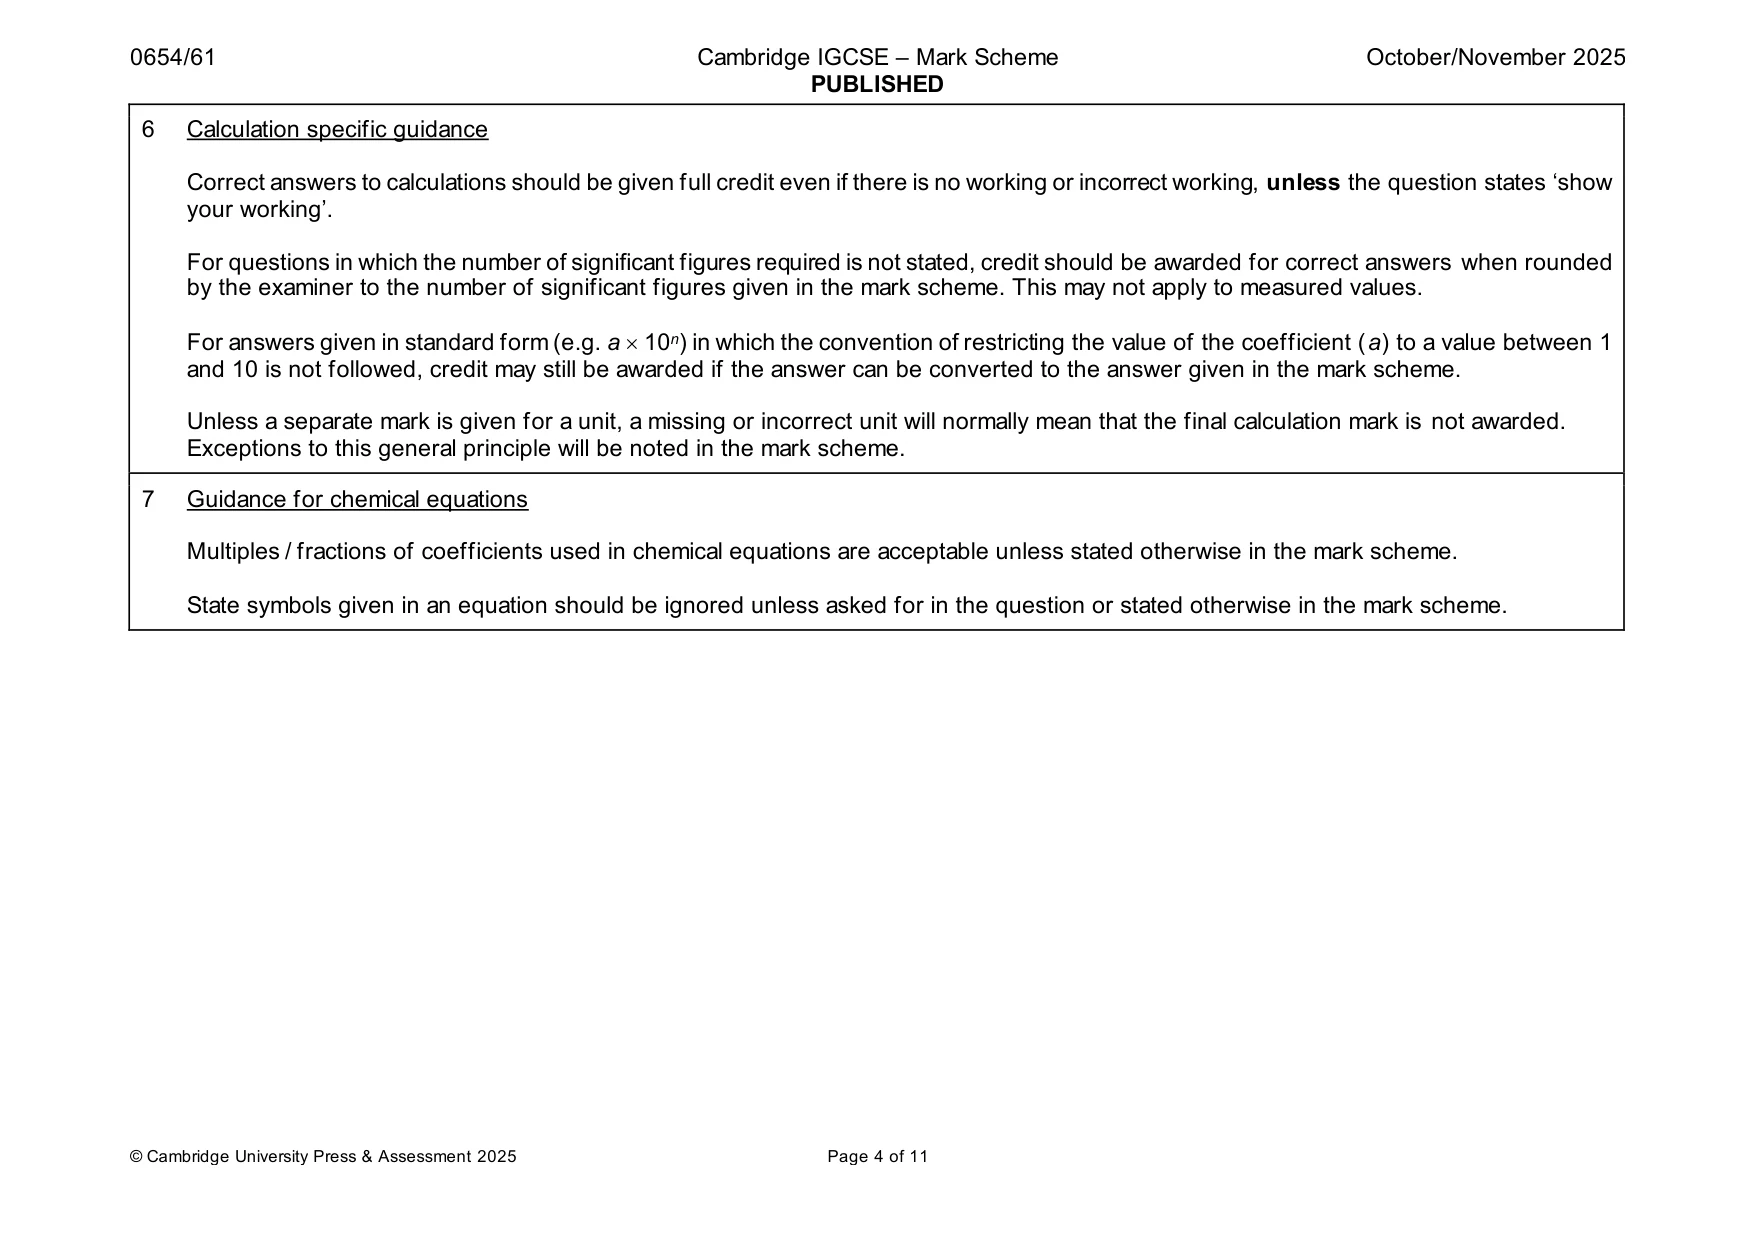
Questions as text
Q1 · A student tests potato and milk for their nutrient content
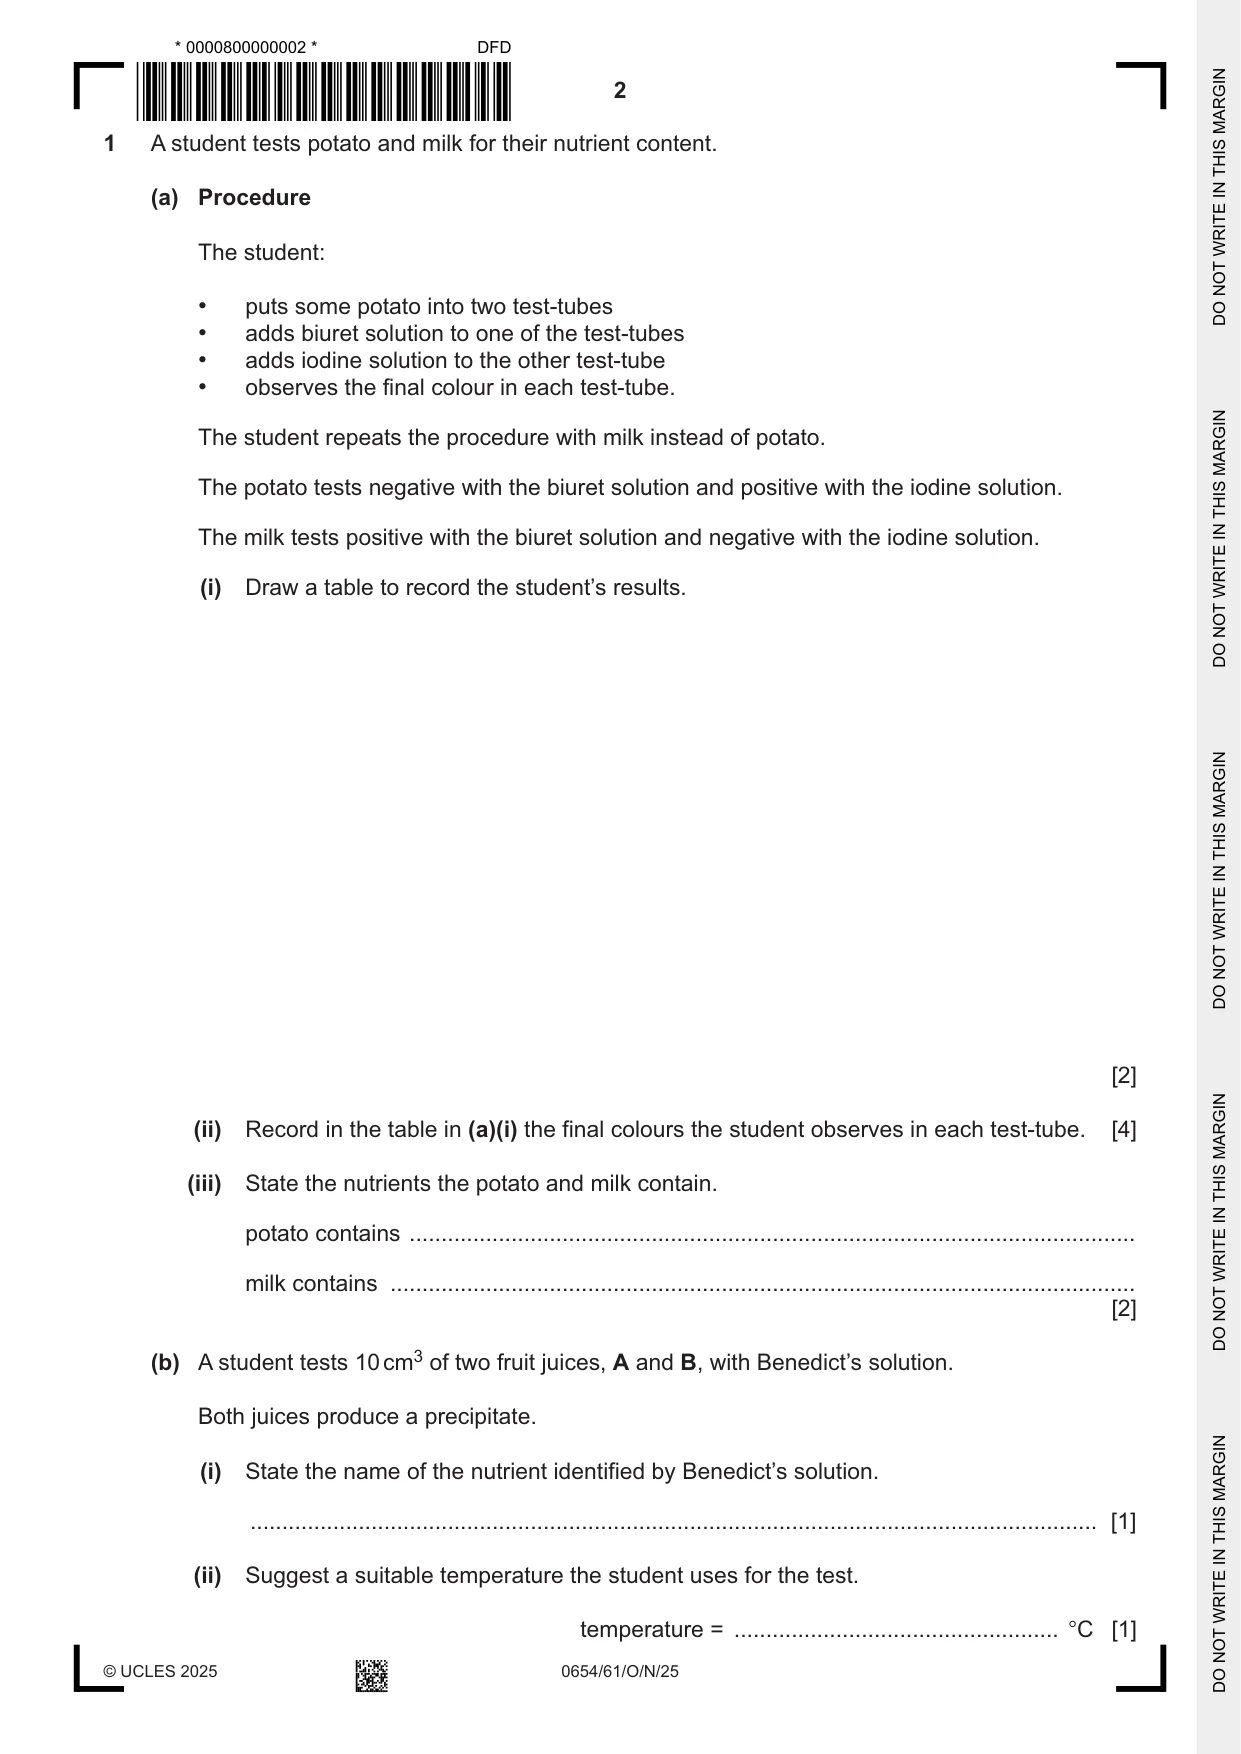
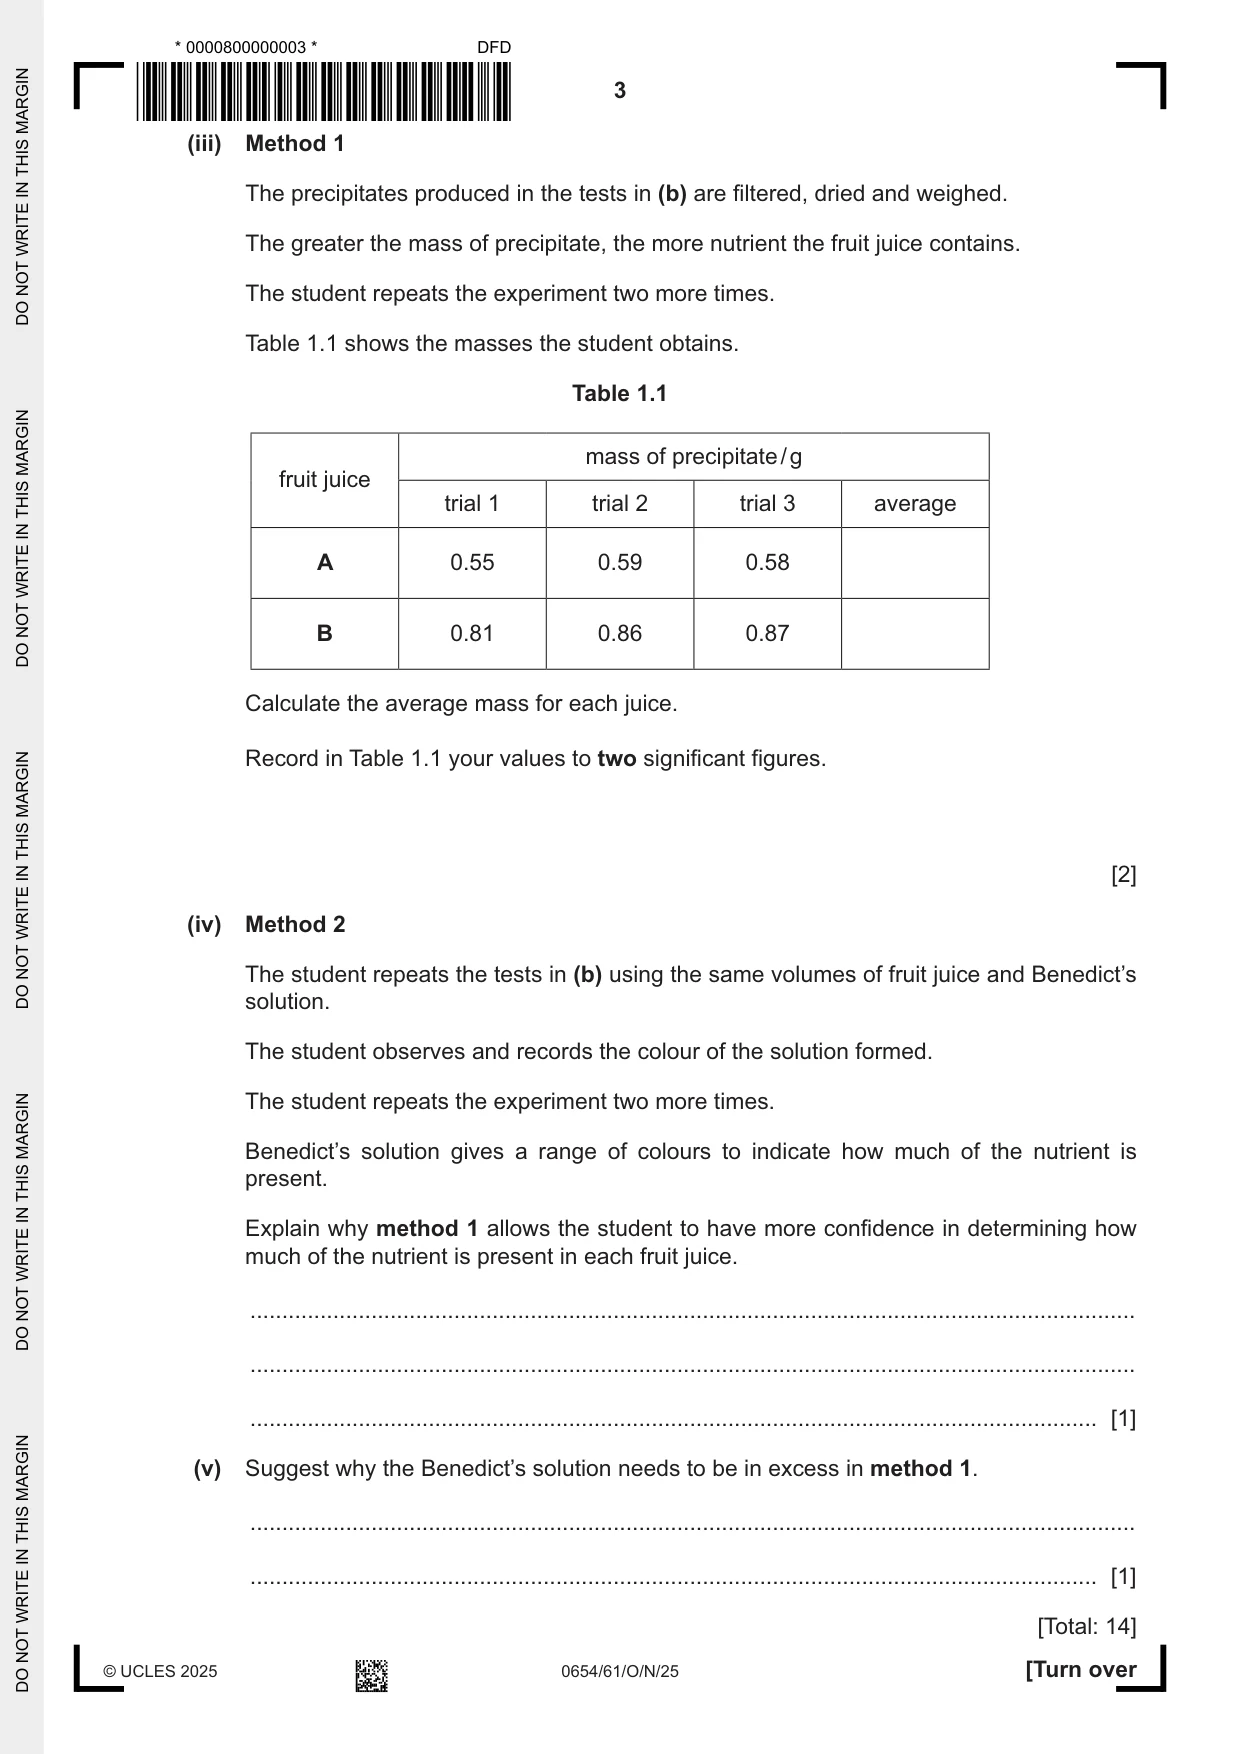
1 A student tests potato and milk for their nutrient content. (a) Procedure The student: • puts some potato into two test‑tubes • adds biuret solution to one of the test‑tubes • adds iodine solution to the other test‑tube • observes the final colour in each test‑tube. The student repeats the procedure with milk instead of potato. The potato tests negative with the biuret solution and positive with the iodine solution. The milk tests positive with the biuret solution and negative with the iodine solution. (i) Draw a table to record the student’s results. [2] (ii) Record in the table in (a)(i) the final colours the student observes in each test‑tube. [4] (iii) State the nutrients the potato and milk contain. potato contains .................................................................................................................. milk contains ..................................................................................................................... [2] (b) A student tests 10 cm3 of two fruit juices, A and B, with Benedict’s solution. Both juices produce a precipitate. (i) State the name of the nutrient identified by Benedict’s solution. ..................................................................................................................................... [1] (ii) Suggest a suitable temperature the student uses for the test. temperature = ................................................... °C [1] (iii) Method 1 The precipitates produced in the tests in (b) are filtered, dried and weighed. The greater the mass of precipitate, the more nutrient the fruit juice contains. The student repeats the experiment two more times. Table 1.1 shows the masses the student obtains. Table 1.1 mass of precipitate / g fruit juice trial 1 trial 2 trial 3 average A 0.55 0.59 0.58 B 0.81 0.86 0.87 Calculate the average mass for each juice. Record in Table 1.1 your values to two significant figures. [2] (iv) Method 2 The student repeats the tests in (b) using the same volumes of fruit juice and Benedict’s solution. The student observes and records the colour of the solution formed. The student repeats the experiment two more times. Benedict’s solution gives a range of colours to indicate how much of the nutrient is present. Explain why method 1 allows the student to have more confidence in determining how much of the nutrient is present in each fruit juice. ........................................................................................................................................... ........................................................................................................................................... ..................................................................................................................................... [1] (v) Suggest why the Benedict’s solution needs to be in excess in method 1. ........................................................................................................................................... ..................................................................................................................................... [1] [Total: 14]
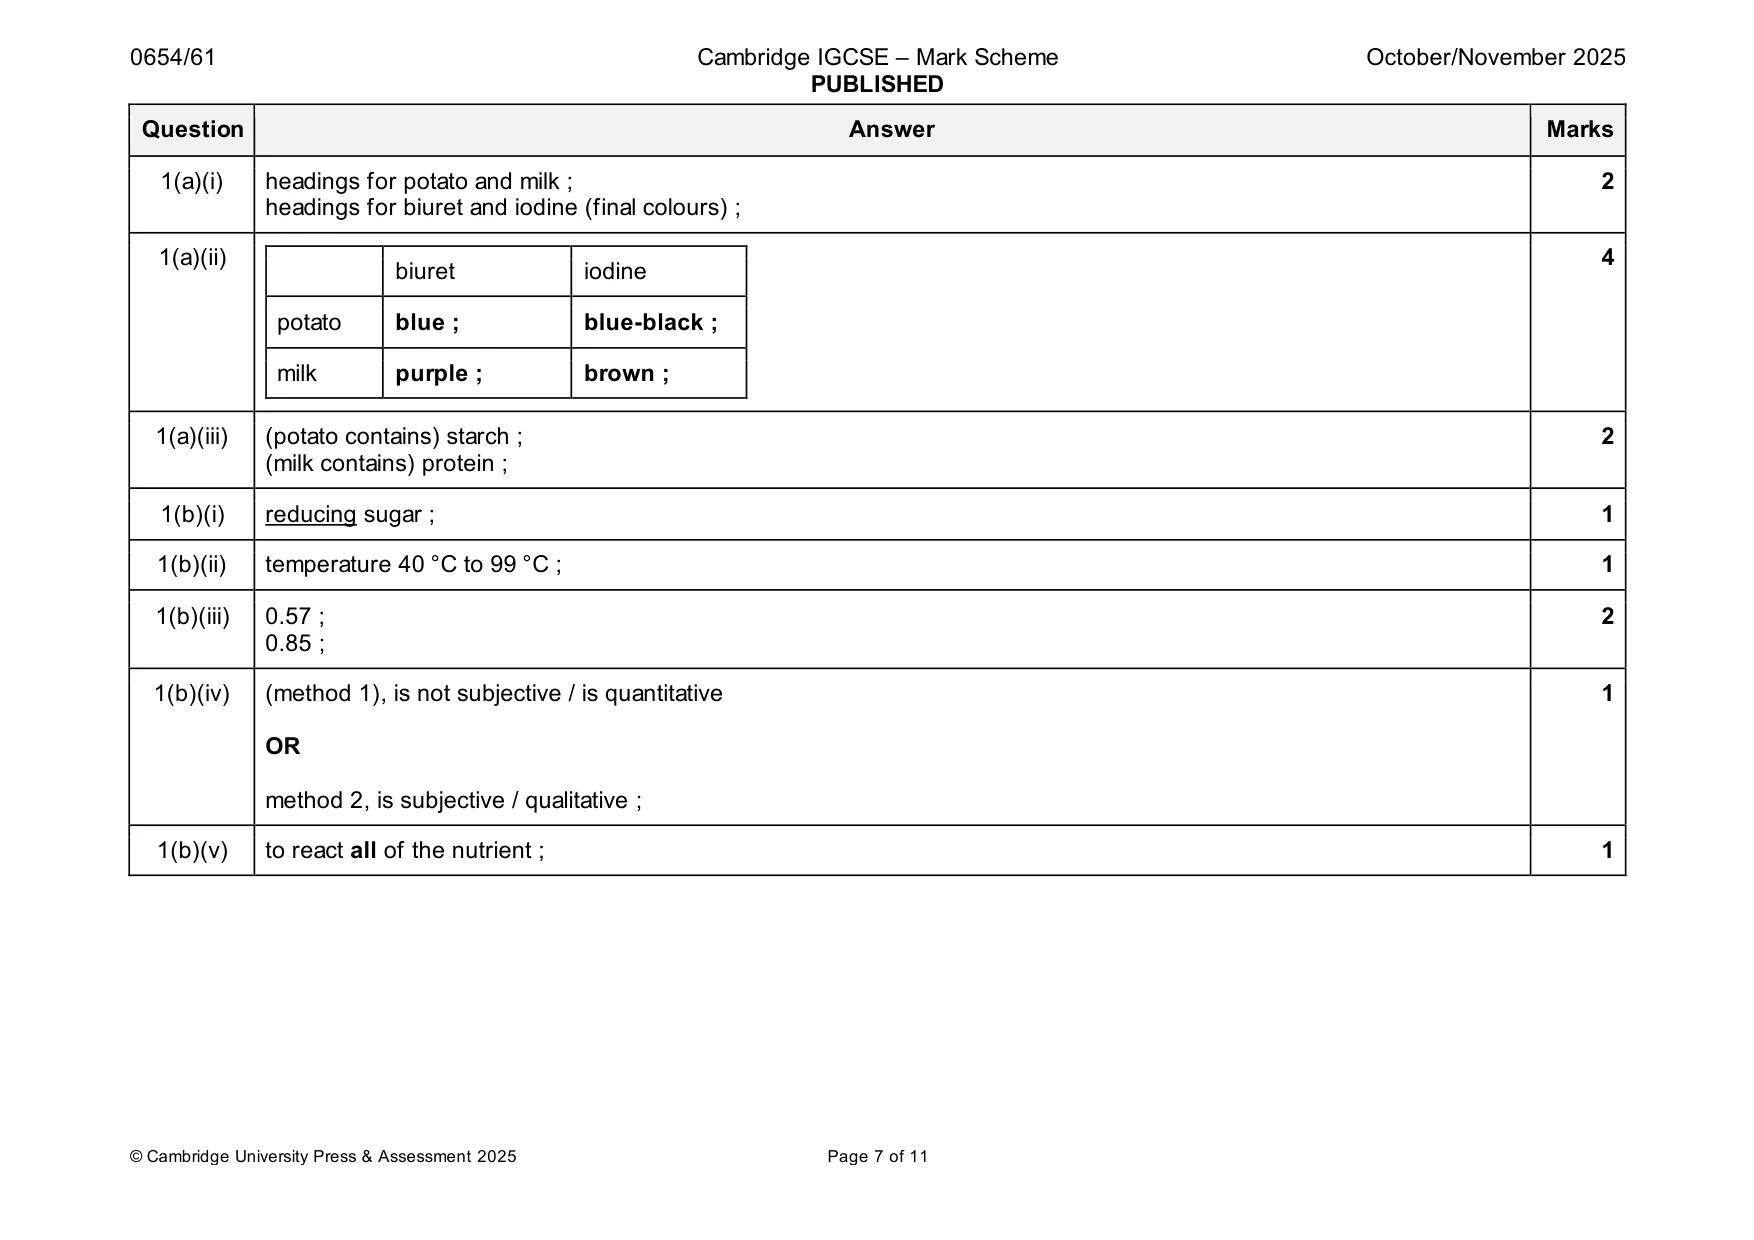
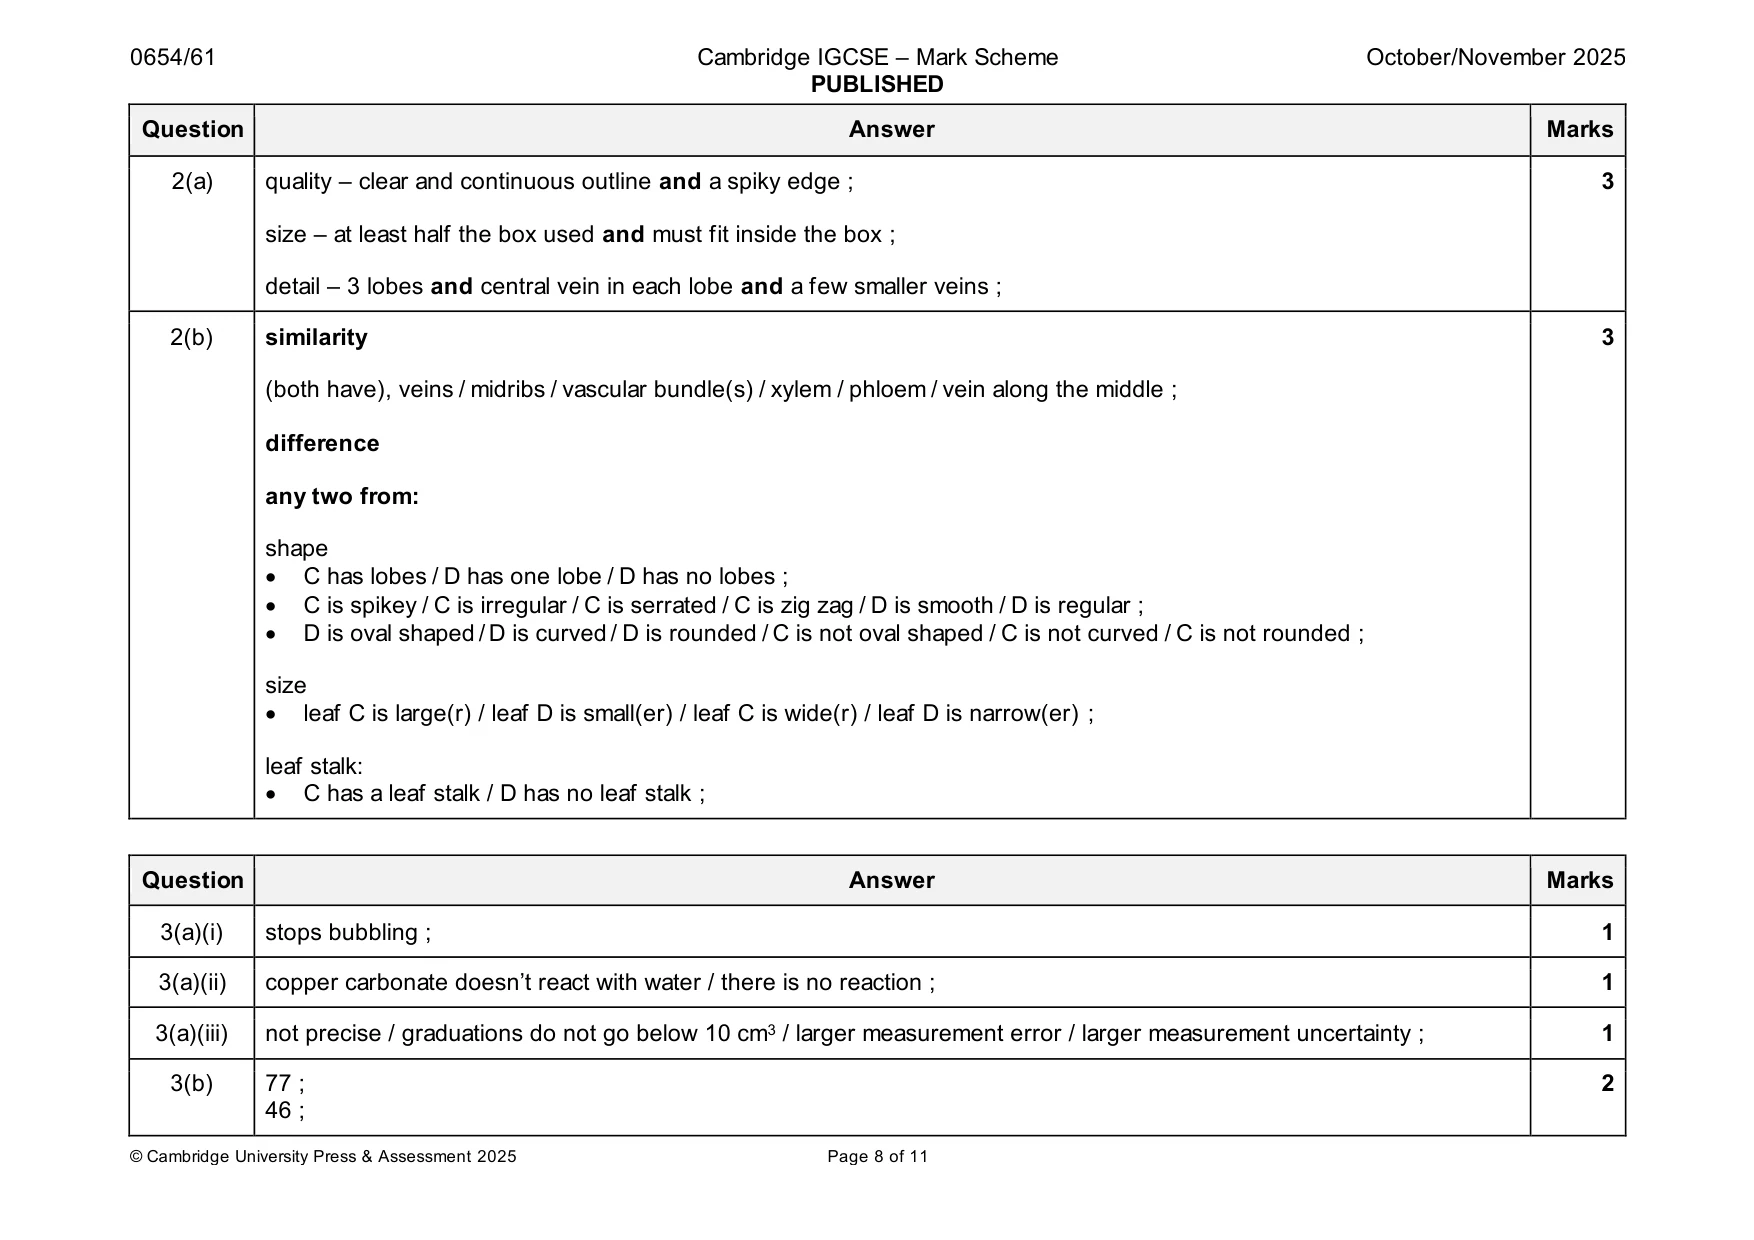
Mark scheme: Question Answer Marks 1(a)(i) headings for potato and milk ; 2 headings for biuret and iodine (final colours) ; 1(a)(ii) 4 biuret iodine potato blue ; blue-black ; milk purple ; brown ; 1(a)(iii) (potato contains) starch ; 2 (milk contains) protein ; 1(b)(i) reducing sugar ; 1 1(b)(ii) temperature 40 °C to 99 °C ; 1 1(b)(iii) 0.57 ; 2 0.85 ; 1(b)(iv) (method 1), is not subjective / is quantitative 1 OR method 2, is subjective / qualitative ; 1(b)(v) to react all of the nutrient ; 1
Q2 · A photograph of a leaf, C
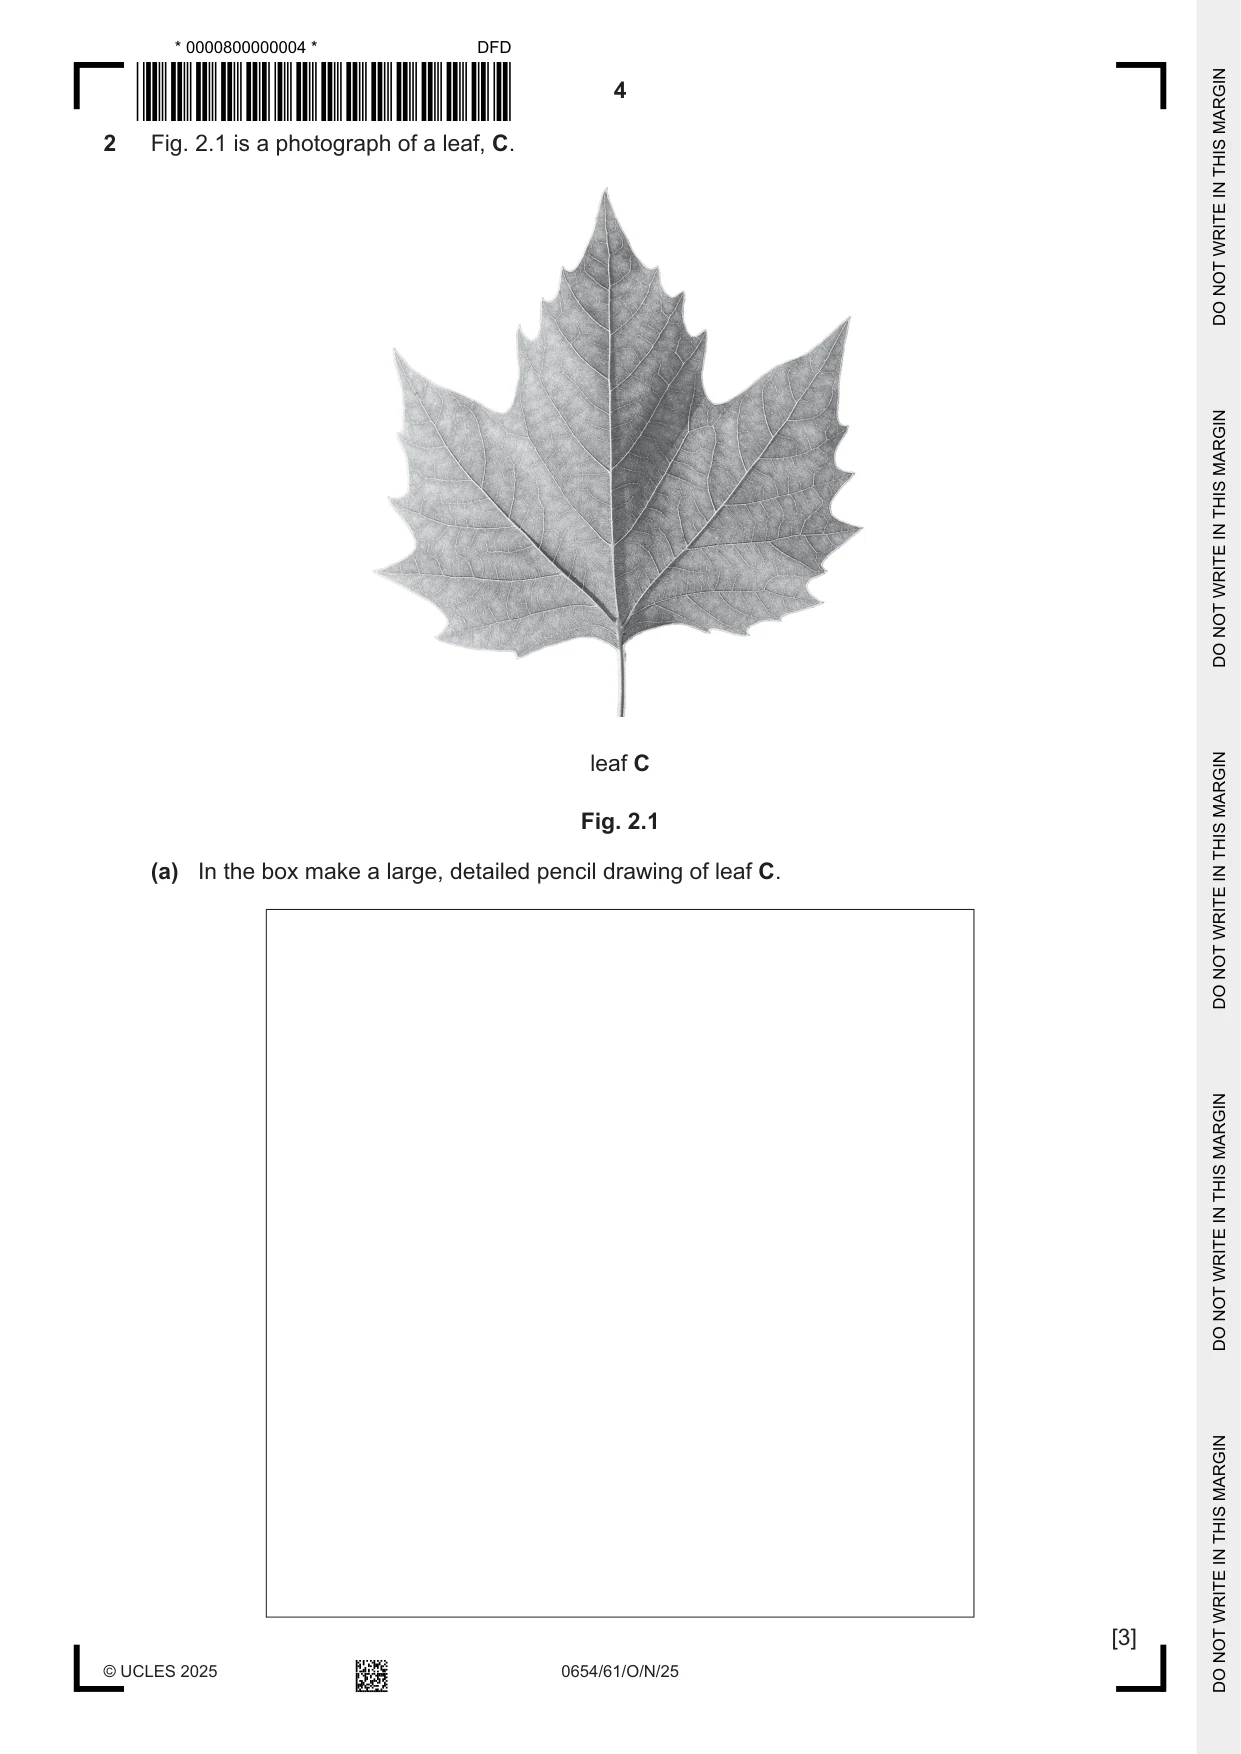
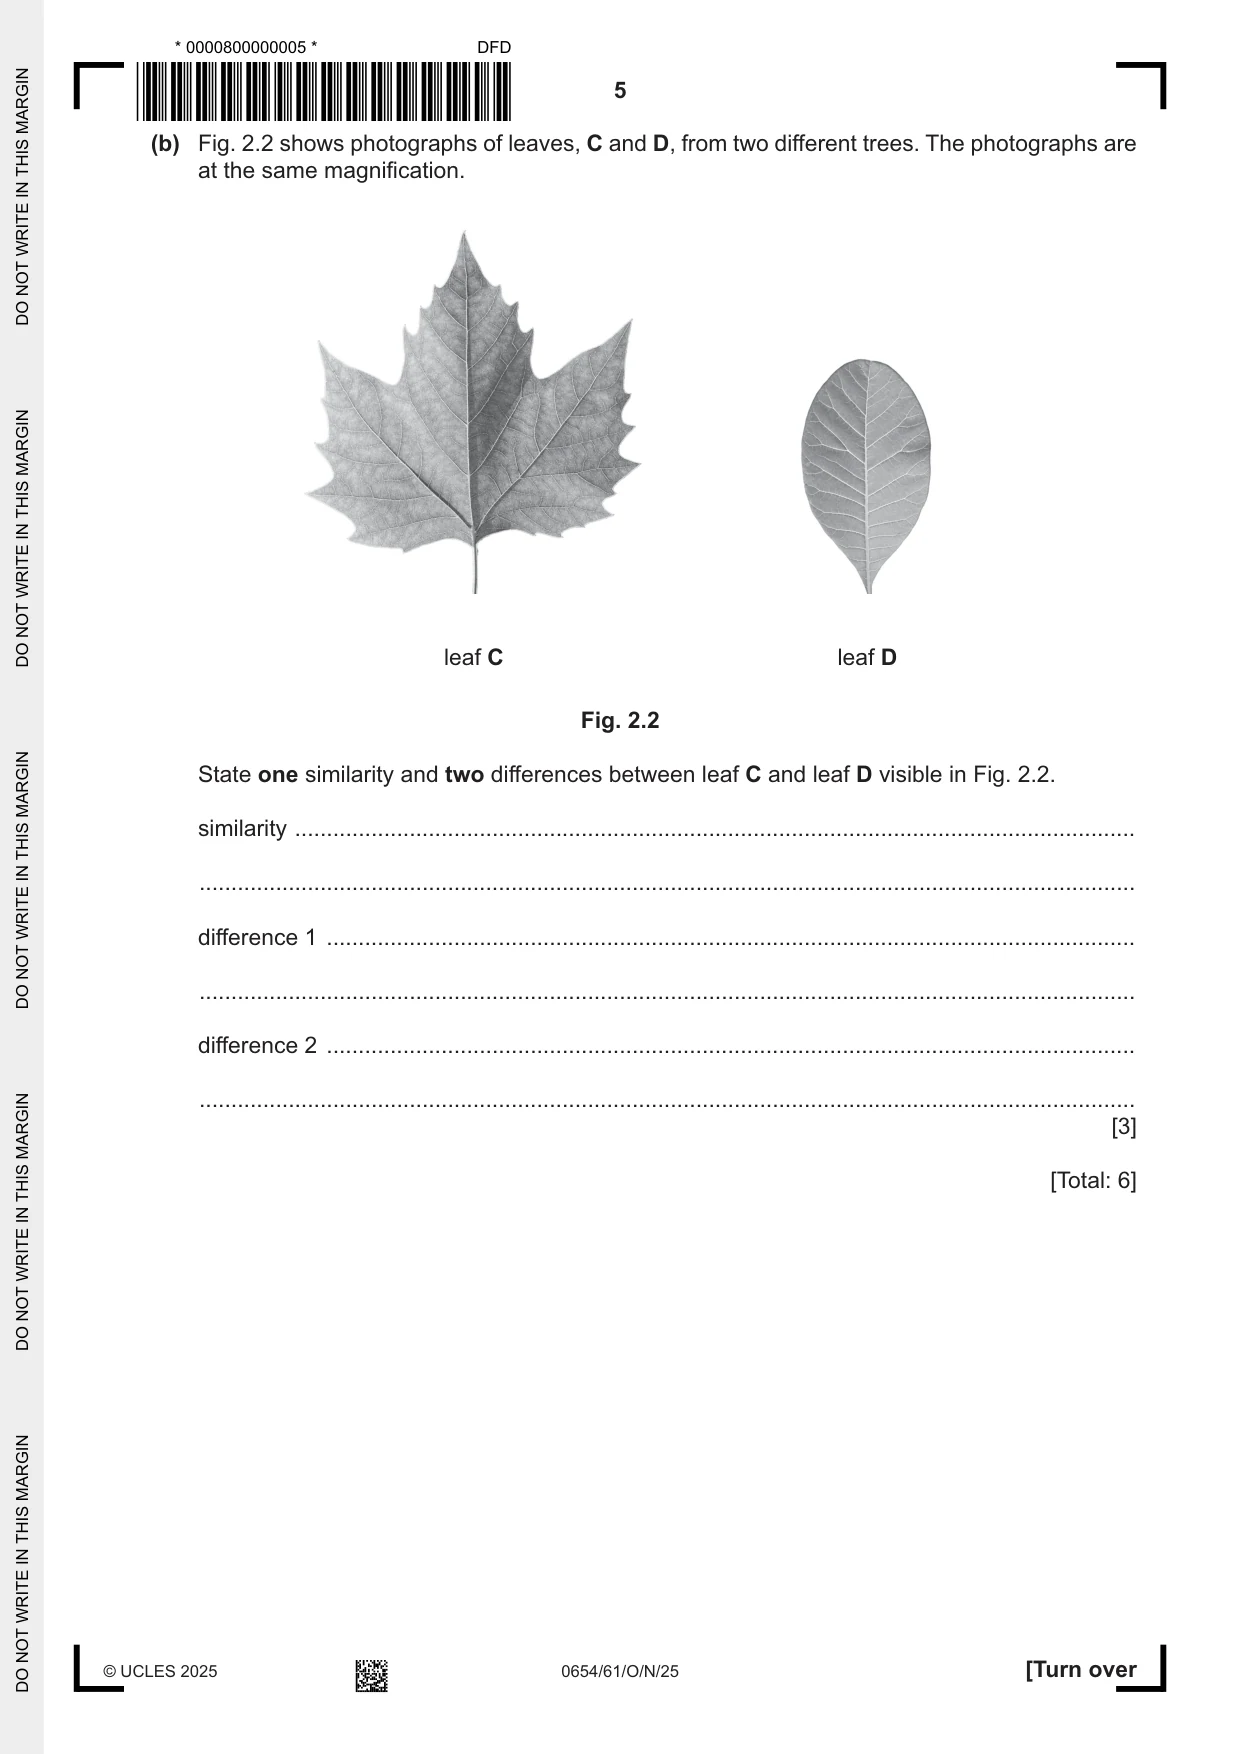
2 Fig. 2.1 is a photograph of a leaf, C. leaf C Fig. 2.1 (a) In the box make a large, detailed pencil drawing of leaf C. [3] (b) Fig. 2.2 shows photographs of leaves, C and D, from two different trees. The photographs are at the same magnification. leaf C leaf D Fig. 2.2 State one similarity and two differences between leaf C and leaf D visible in Fig. 2.2. similarity .................................................................................................................................... ................................................................................................................................................... difference 1 ............................................................................................................................... ................................................................................................................................................... difference 2 ............................................................................................................................... ................................................................................................................................................... [3] [Total: 6]
Mark scheme: 2(a) quality – clear and continuous outline and a spiky edge ; 3 size – at least half the box used and must fit inside the box ; detail – 3 lobes and central vein in each lobe and a few smaller veins ; 2(b) similarity 3 (both have), veins / midribs / vascular bundle(s) / xylem / phloem / vein along the middle ; difference any two from: shape • C has lobes / D has one lobe / D has no lobes ; • C is spikey / C is irregular / C is serrated / C is zig zag / D is smooth / D is regular ; • D is oval shaped / D is curved / D is rounded / C is not oval shaped / C is not curved / C is not rounded ; size • leaf C is large(r) / leaf D is small(er) / leaf C is wide(r) / leaf D is narrow(er) ; leaf stalk: • C has a leaf stalk / D has no leaf stalk ;
Q3 · A student investigates the effect of concentration on the rate of a reaction
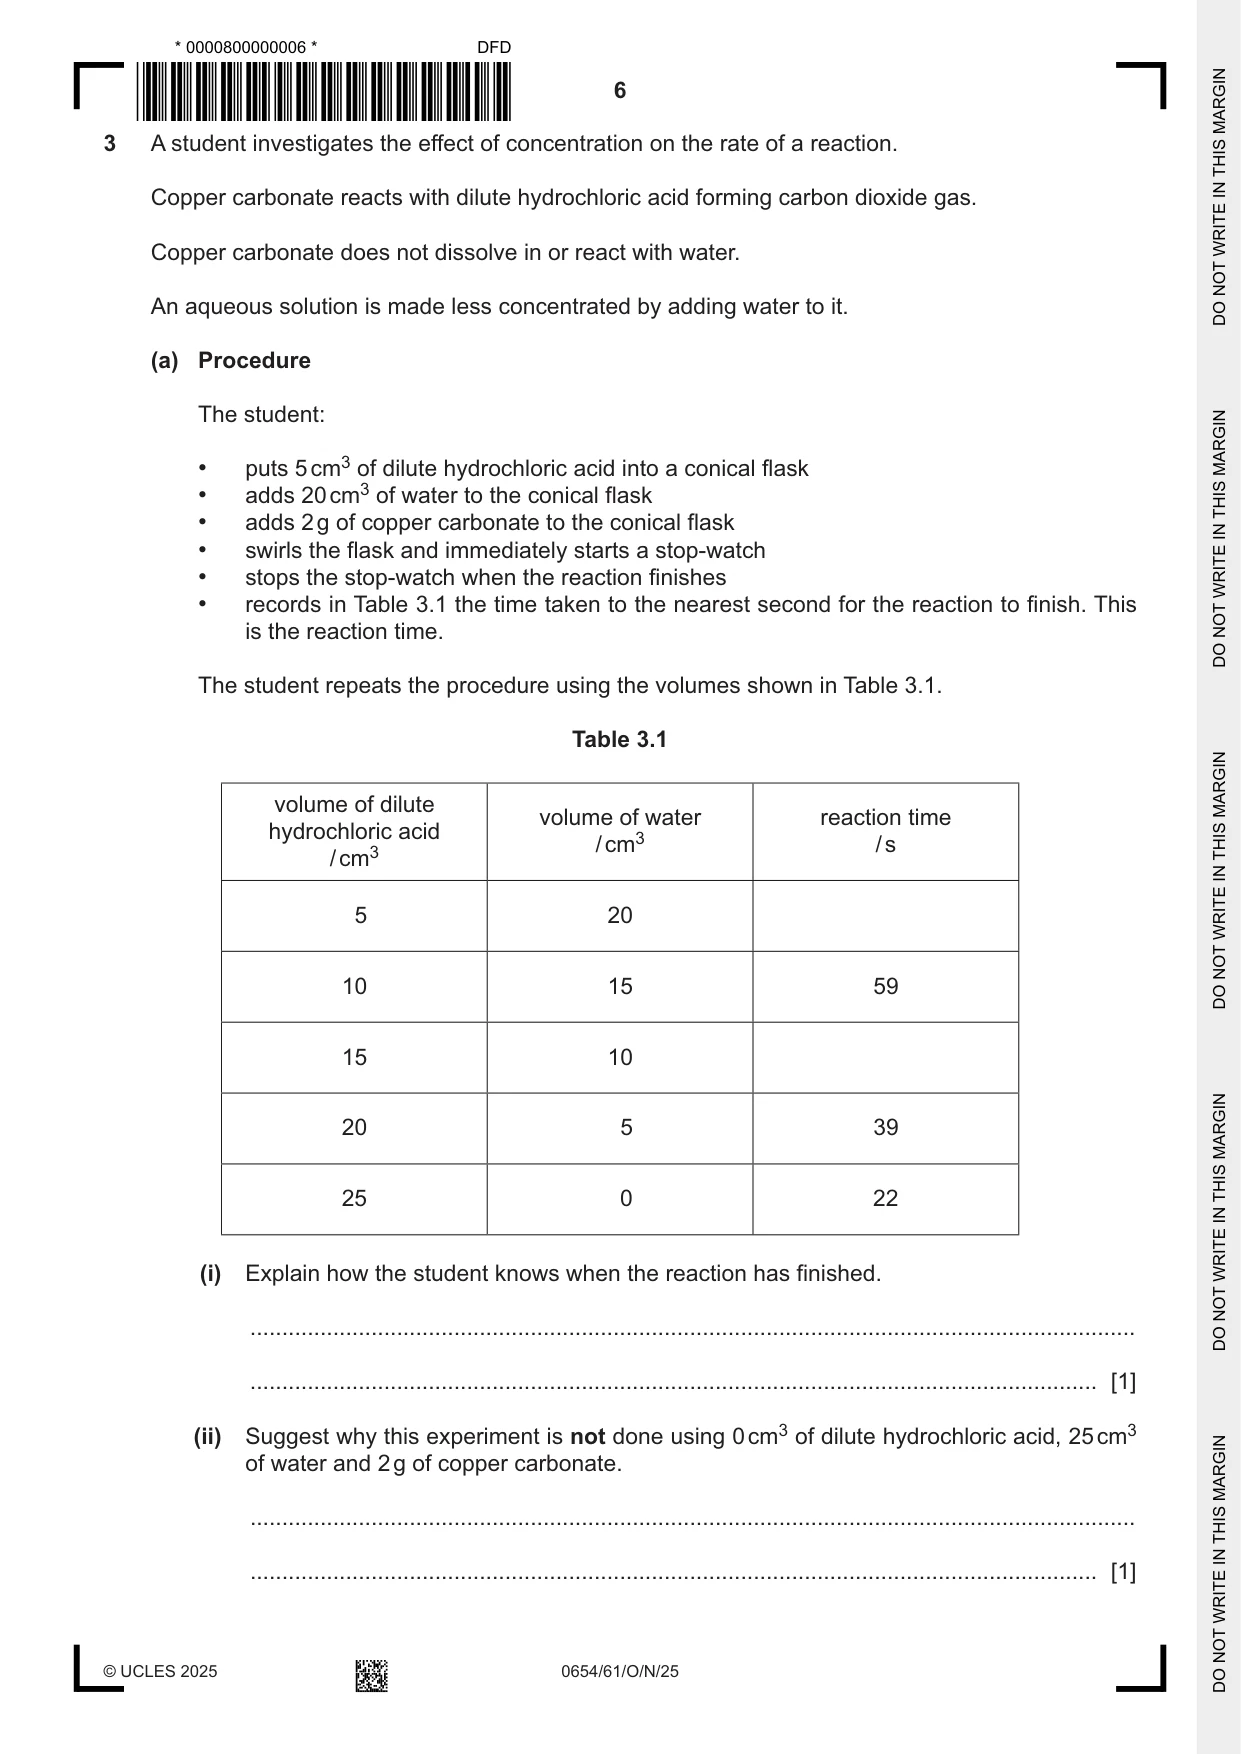
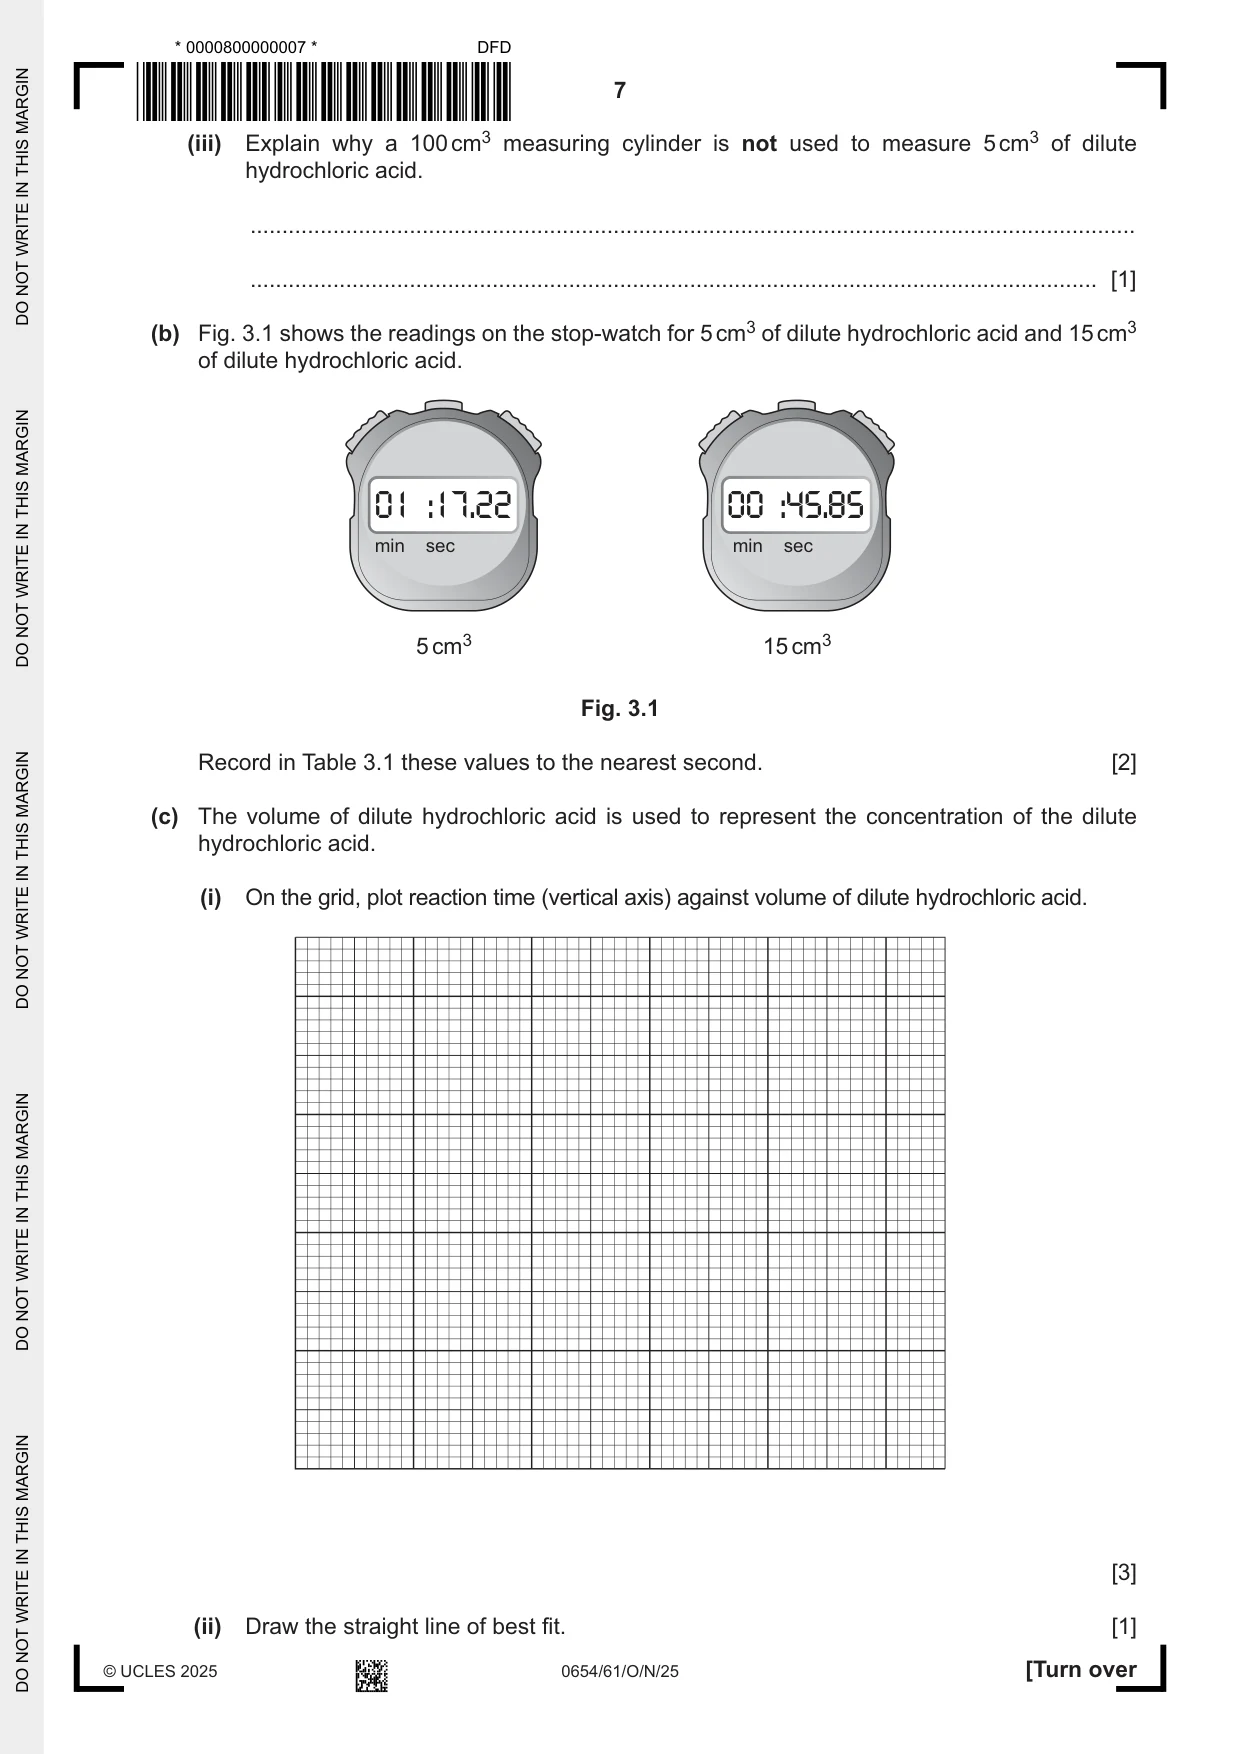
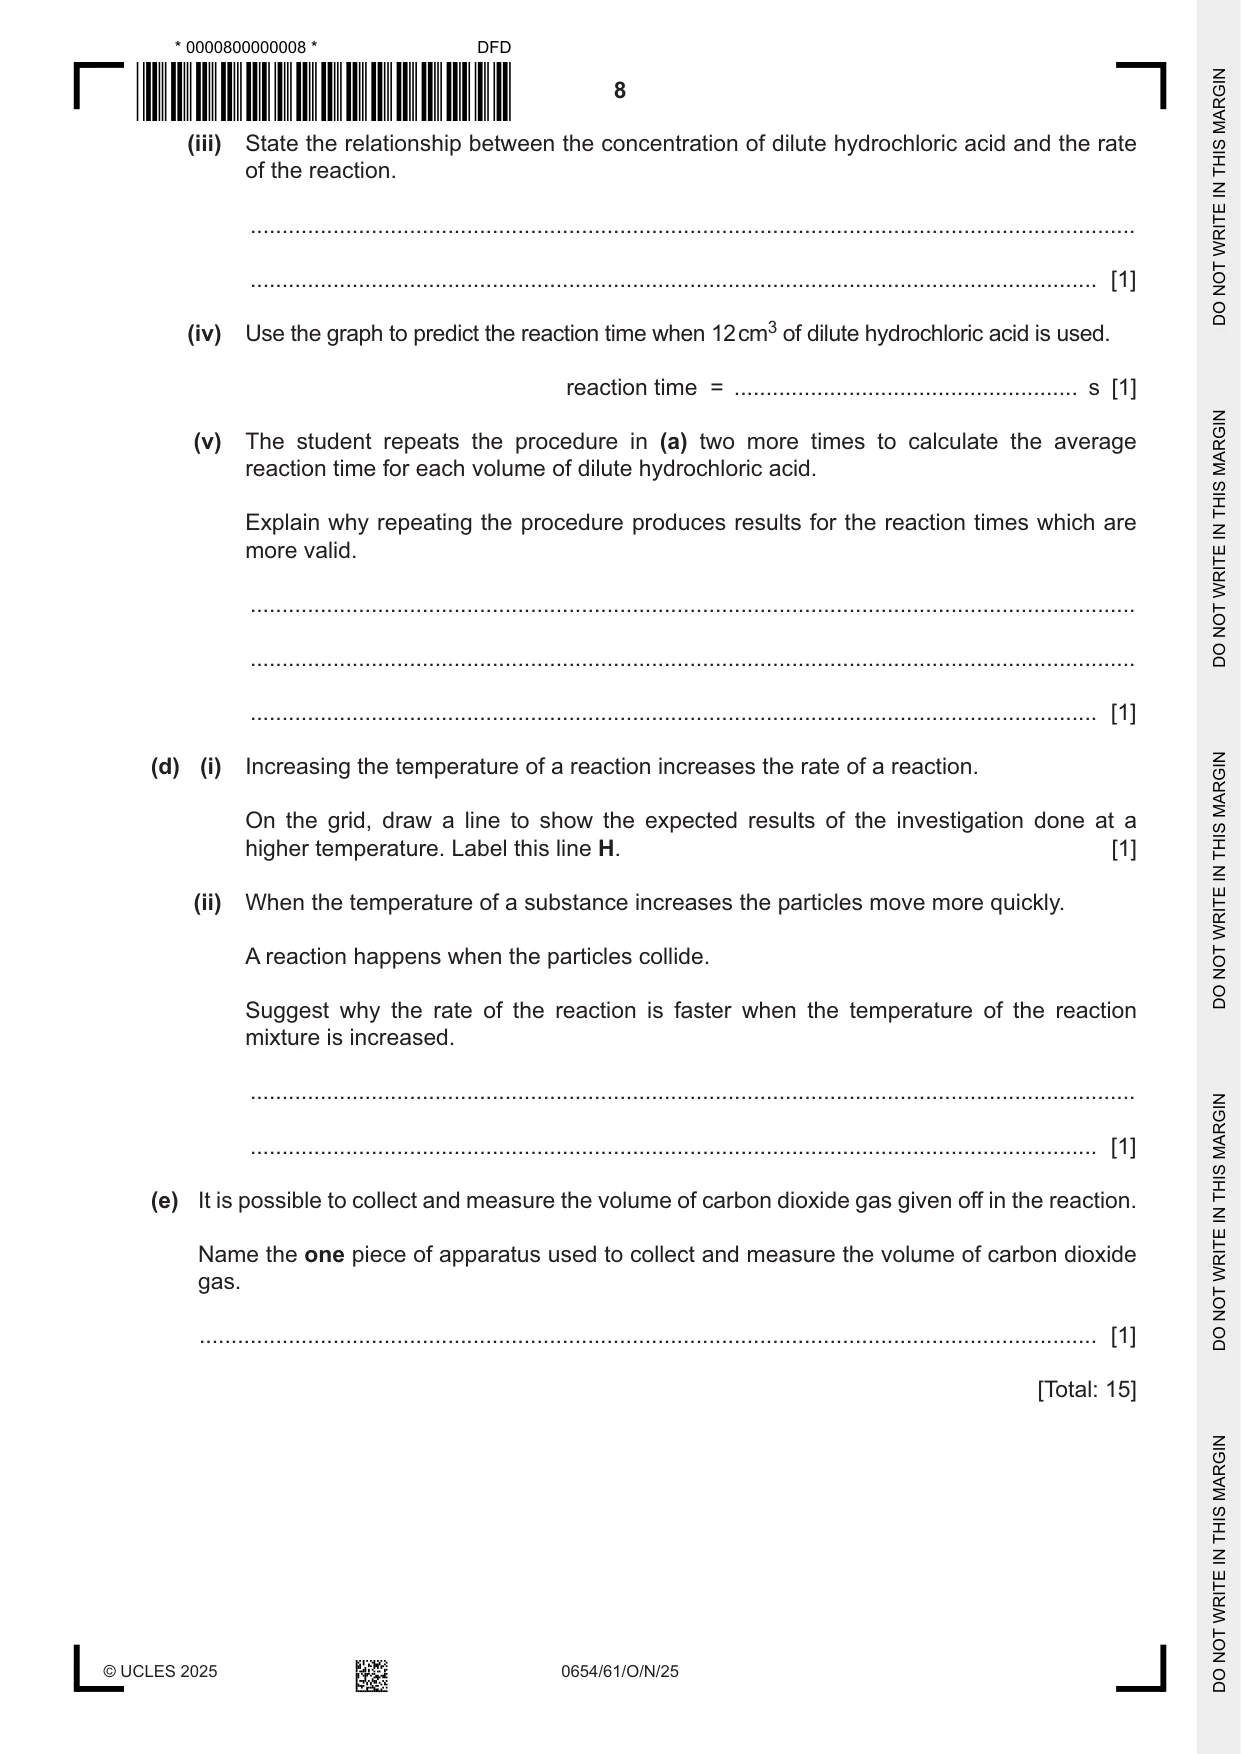
3 A student investigates the effect of concentration on the rate of a reaction. Copper carbonate reacts with dilute hydrochloric acid forming carbon dioxide gas. Copper carbonate does not dissolve in or react with water. An aqueous solution is made less concentrated by adding water to it. (a) Procedure The student: • puts 5 cm3 of dilute hydrochloric acid into a conical flask • adds 20 cm3 of water to the conical flask • adds 2 g of copper carbonate to the conical flask • swirls the flask and immediately starts a stop‑watch • stops the stop‑watch when the reaction finishes • records in Table 3.1 the time taken to the nearest second for the reaction to finish. This is the reaction time. The student repeats the procedure using the volumes shown in Table 3.1. Table 3.1 volume of dilute volume of water reaction time hydrochloric acid / cm3 / s / cm3 5 20 10 15 59 15 10 20 5 39 25 0 22 (i) Explain how the student knows when the reaction has finished. ........................................................................................................................................... ..................................................................................................................................... [1] (ii) Suggest why this experiment is not done using 0 cm3 of dilute hydrochloric acid, 25 cm3 of water and 2 g of copper carbonate. ........................................................................................................................................... ..................................................................................................................................... [1] (iii) Explain why a 100 cm3 measuring cylinder is not used to measure 5 cm3 of dilute hydrochloric acid. ........................................................................................................................................... ..................................................................................................................................... [1] (b) Fig. 3.1 shows the readings on the stop‑watch for 5 cm3 of dilute hydrochloric acid and 15 cm3 of dilute hydrochloric acid. 01 :17.22 00 :45.85 min sec min sec 5 cm3 15 cm3 Fig. 3.1 Record in Table 3.1 these values to the nearest second. [2] (c) The volume of dilute hydrochloric acid is used to represent the concentration of the dilute hydrochloric acid. (i) On the grid, plot reaction time (vertical axis) against volume of dilute hydrochloric acid. [3] (ii) Draw the straight line of best fit. [1] (iii) State the relationship between the concentration of dilute hydrochloric acid and the rate of the reaction. ........................................................................................................................................... ..................................................................................................................................... [1] (iv) Use the graph to predict the reaction time when 12 cm3 of dilute hydrochloric acid is used. reaction time = ...................................................... s [1] (v) The student repeats the procedure in (a) two more times to calculate the average reaction time for each volume of dilute hydrochloric acid. Explain why repeating the procedure produces results for the reaction times which are more valid. ........................................................................................................................................... ........................................................................................................................................... ..................................................................................................................................... [1] (d) (i) Increasing the temperature of a reaction increases the rate of a reaction. On the grid, draw a line to show the expected results of the investigation done at a higher temperature. Label this line H. [1] (ii) When the temperature of a substance increases the particles move more quickly. A reaction happens when the particles collide. Suggest why the rate of the reaction is faster when the temperature of the reaction mixture is increased. ........................................................................................................................................... ..................................................................................................................................... [1] (e) It is possible to collect and measure the volume of carbon dioxide gas given off in the reaction. Name the one piece of apparatus used to collect and measure the volume of carbon dioxide gas. ............................................................................................................................................. [1] [Total: 15]
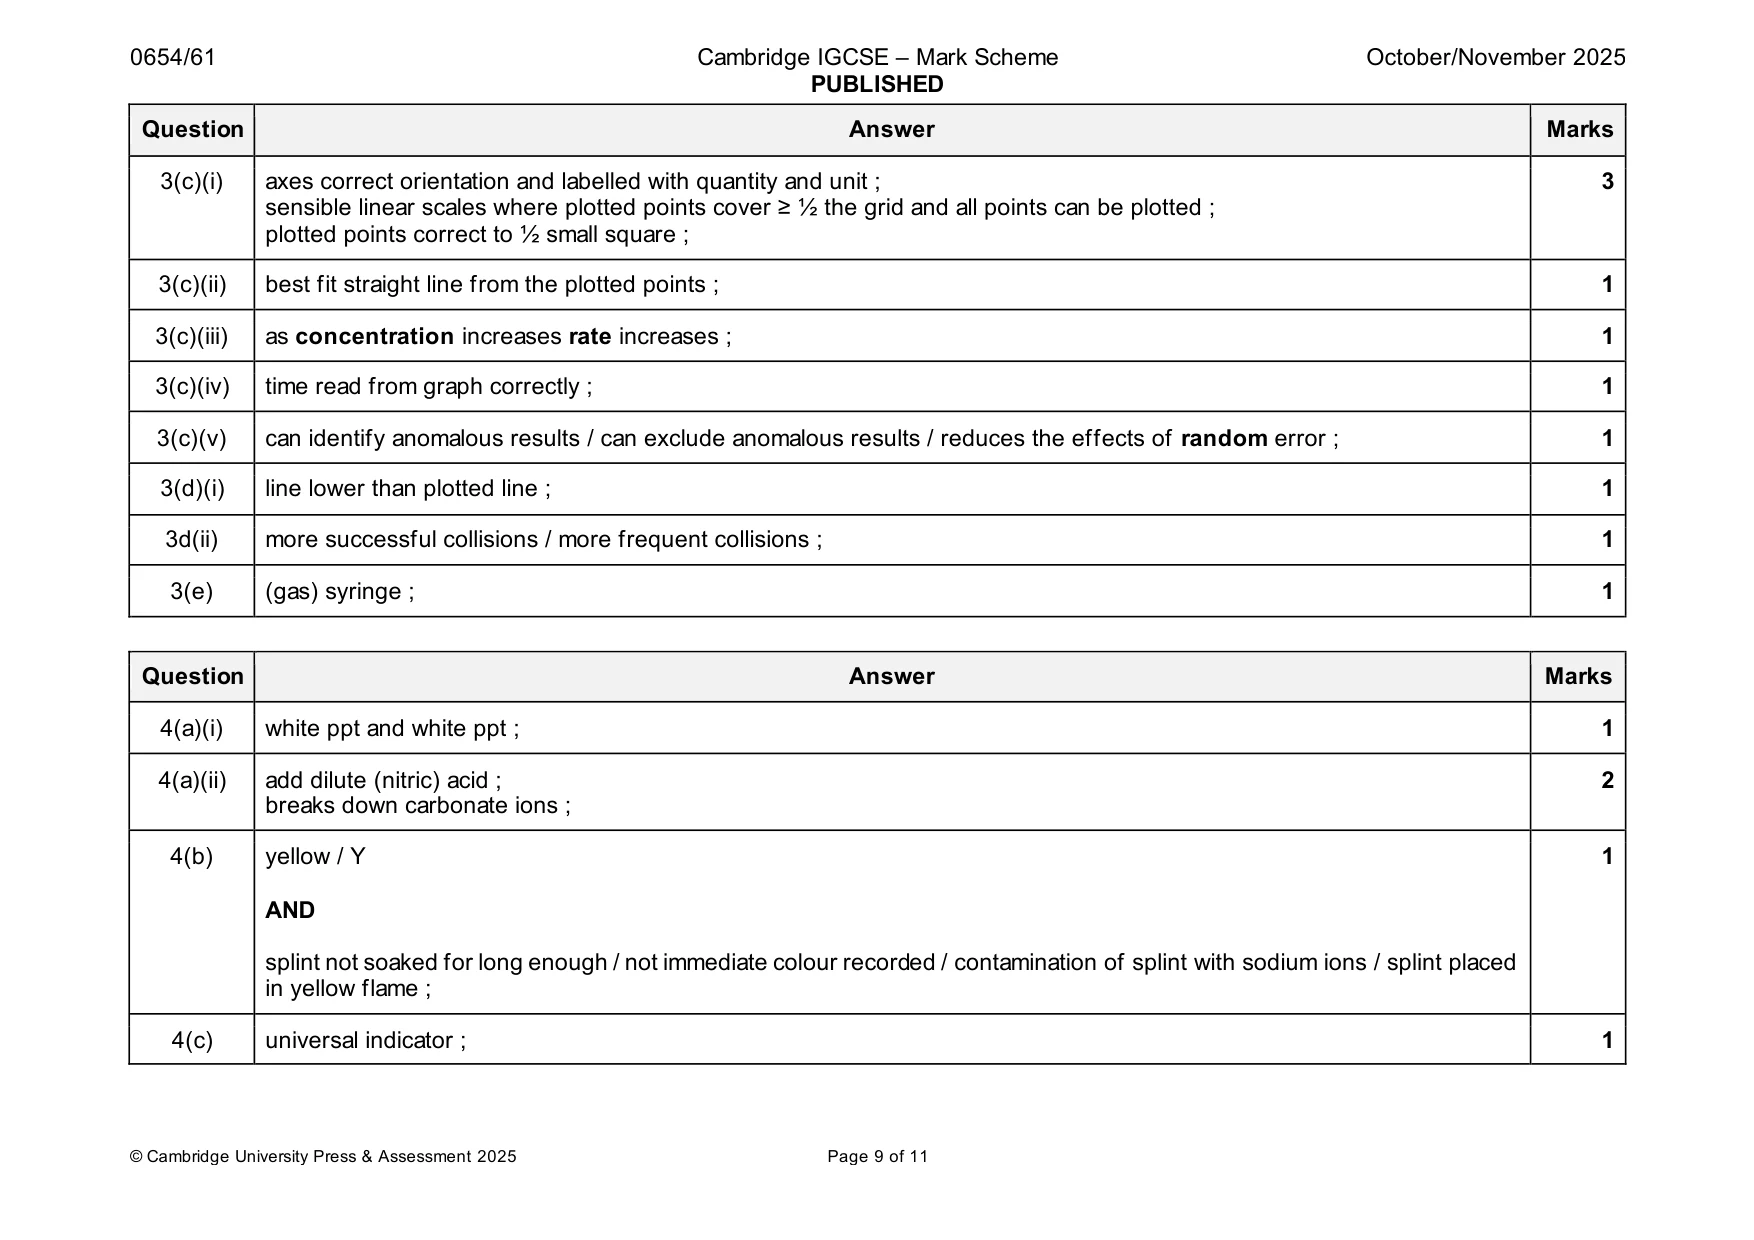
Mark scheme: 3(a)(i) stops bubbling ; 1 3(a)(ii) copper carbonate doesn’t react with water / there is no reaction ; 1 3(a)(iii) not precise / graduations do not go below 10 cm3 / larger measurement error / larger measurement uncertainty ; 1 3(b) 77 ; 2 46 ; 3(c)(i) axes correct orientation and labelled with quantity and unit ; 3 sensible linear scales where plotted points cover ≥ ½ the grid and all points can be plotted ; plotted points correct to ½ small square ; 3(c)(ii) best fit straight line from the plotted points ; 1 3(c)(iii) as concentration increases rate increases ; 1 3(c)(iv) time read from graph correctly ; 1 3(c)(v) can identify anomalous results / can exclude anomalous results / reduces the effects of random error ; 1 3(d)(i) line lower than plotted line ; 1 3d(ii) more successful collisions / more frequent collisions ; 1 3(e) (gas) syringe ; 1
Q4 · A student identifies some of the ions in aqueous X and aqueous Y
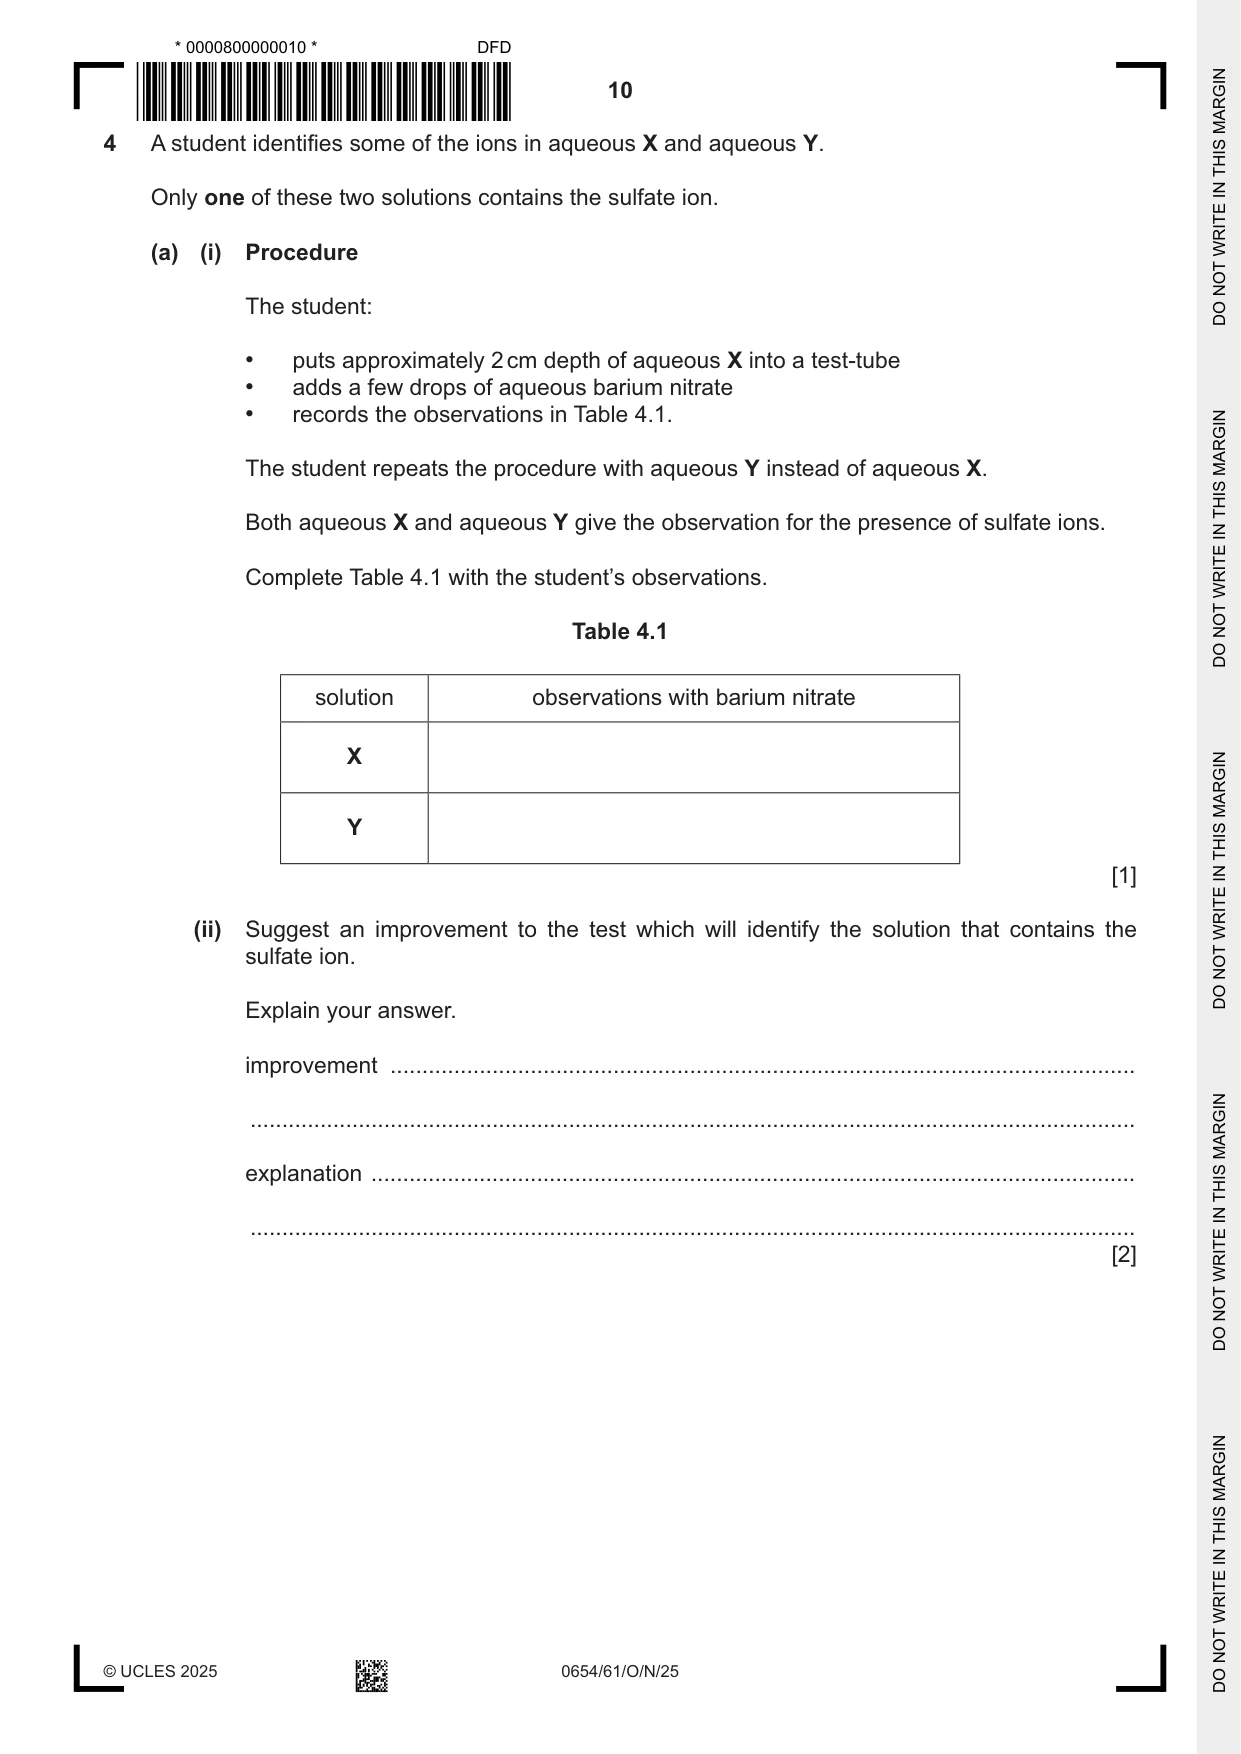
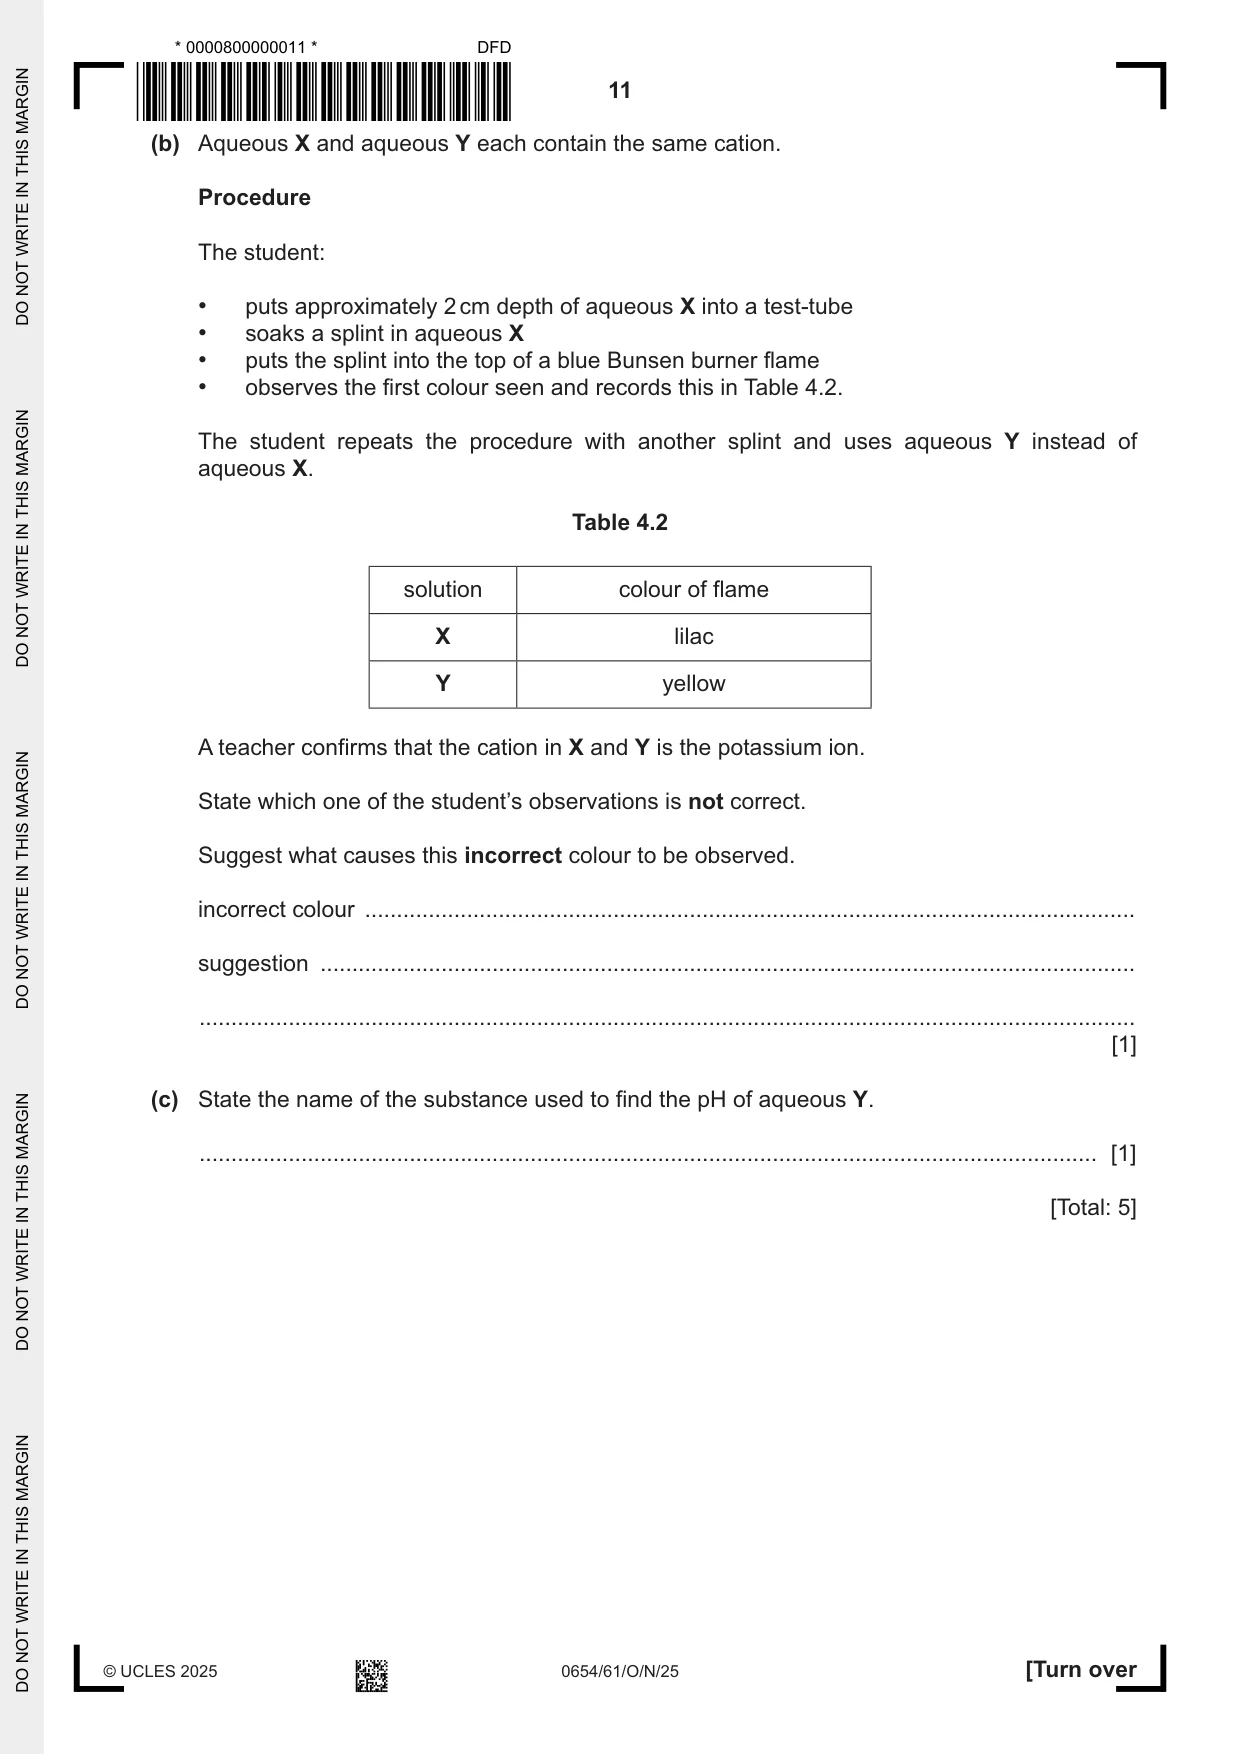
4 A student identifies some of the ions in aqueous X and aqueous Y. Only one of these two solutions contains the sulfate ion. (a) (i) Procedure The student: • puts approximately 2 cm depth of aqueous X into a test‑tube • adds a few drops of aqueous barium nitrate • records the observations in Table 4.1. The student repeats the procedure with aqueous Y instead of aqueous X. Both aqueous X and aqueous Y give the observation for the presence of sulfate ions. Complete Table 4.1 with the student’s observations. Table 4.1 solution observations with barium nitrate X Y [1] (ii) Suggest an improvement to the test which will identify the solution that contains the sulfate ion. Explain your answer. improvement ..................................................................................................................... ........................................................................................................................................... explanation ........................................................................................................................ ........................................................................................................................................... [2] (b) Aqueous X and aqueous Y each contain the same cation. Procedure The student: • puts approximately 2 cm depth of aqueous X into a test‑tube • soaks a splint in aqueous X • puts the splint into the top of a blue Bunsen burner flame • observes the first colour seen and records this in Table 4.2. The student repeats the procedure with another splint and uses aqueous Y instead of aqueous X. Table 4.2 solution colour of flame X lilac Y yellow A teacher confirms that the cation in X and Y is the potassium ion. State which one of the student’s observations is not correct. Suggest what causes this incorrect colour to be observed. incorrect colour ......................................................................................................................... suggestion ................................................................................................................................ ................................................................................................................................................... [1] (c) State the name of the substance used to find the pH of aqueous Y. ............................................................................................................................................. [1] [Total: 5]
Mark scheme: 4(a)(i) white ppt and white ppt ; 1 4(a)(ii) add dilute (nitric) acid ; 2 breaks down carbonate ions ; 4(b) yellow / Y 1 AND splint not soaked for long enough / not immediate colour recorded / contamination of splint with sodium ions / splint placed in yellow flame ; 4(c) universal indicator ; 1
Q5 · A student does an experiment to calculate the focal length f of a converging lens
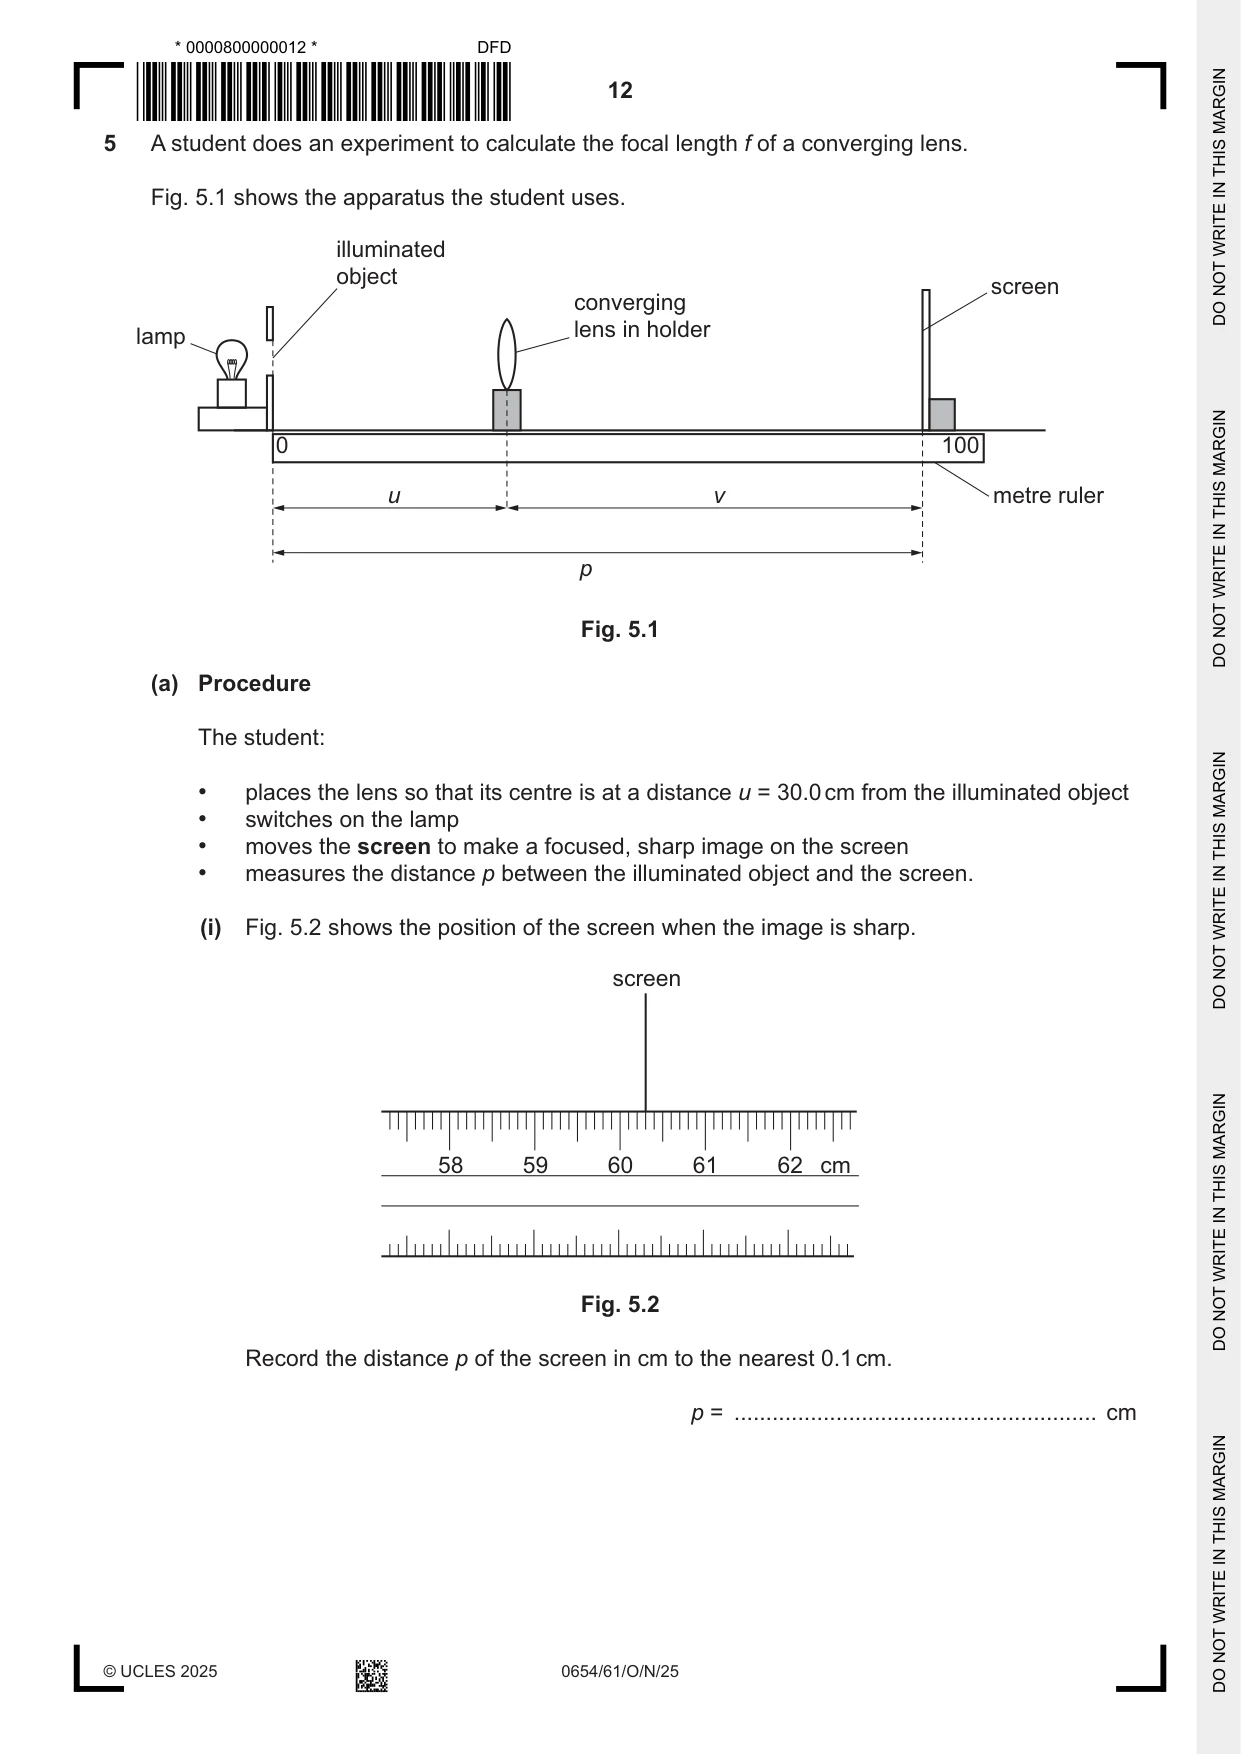
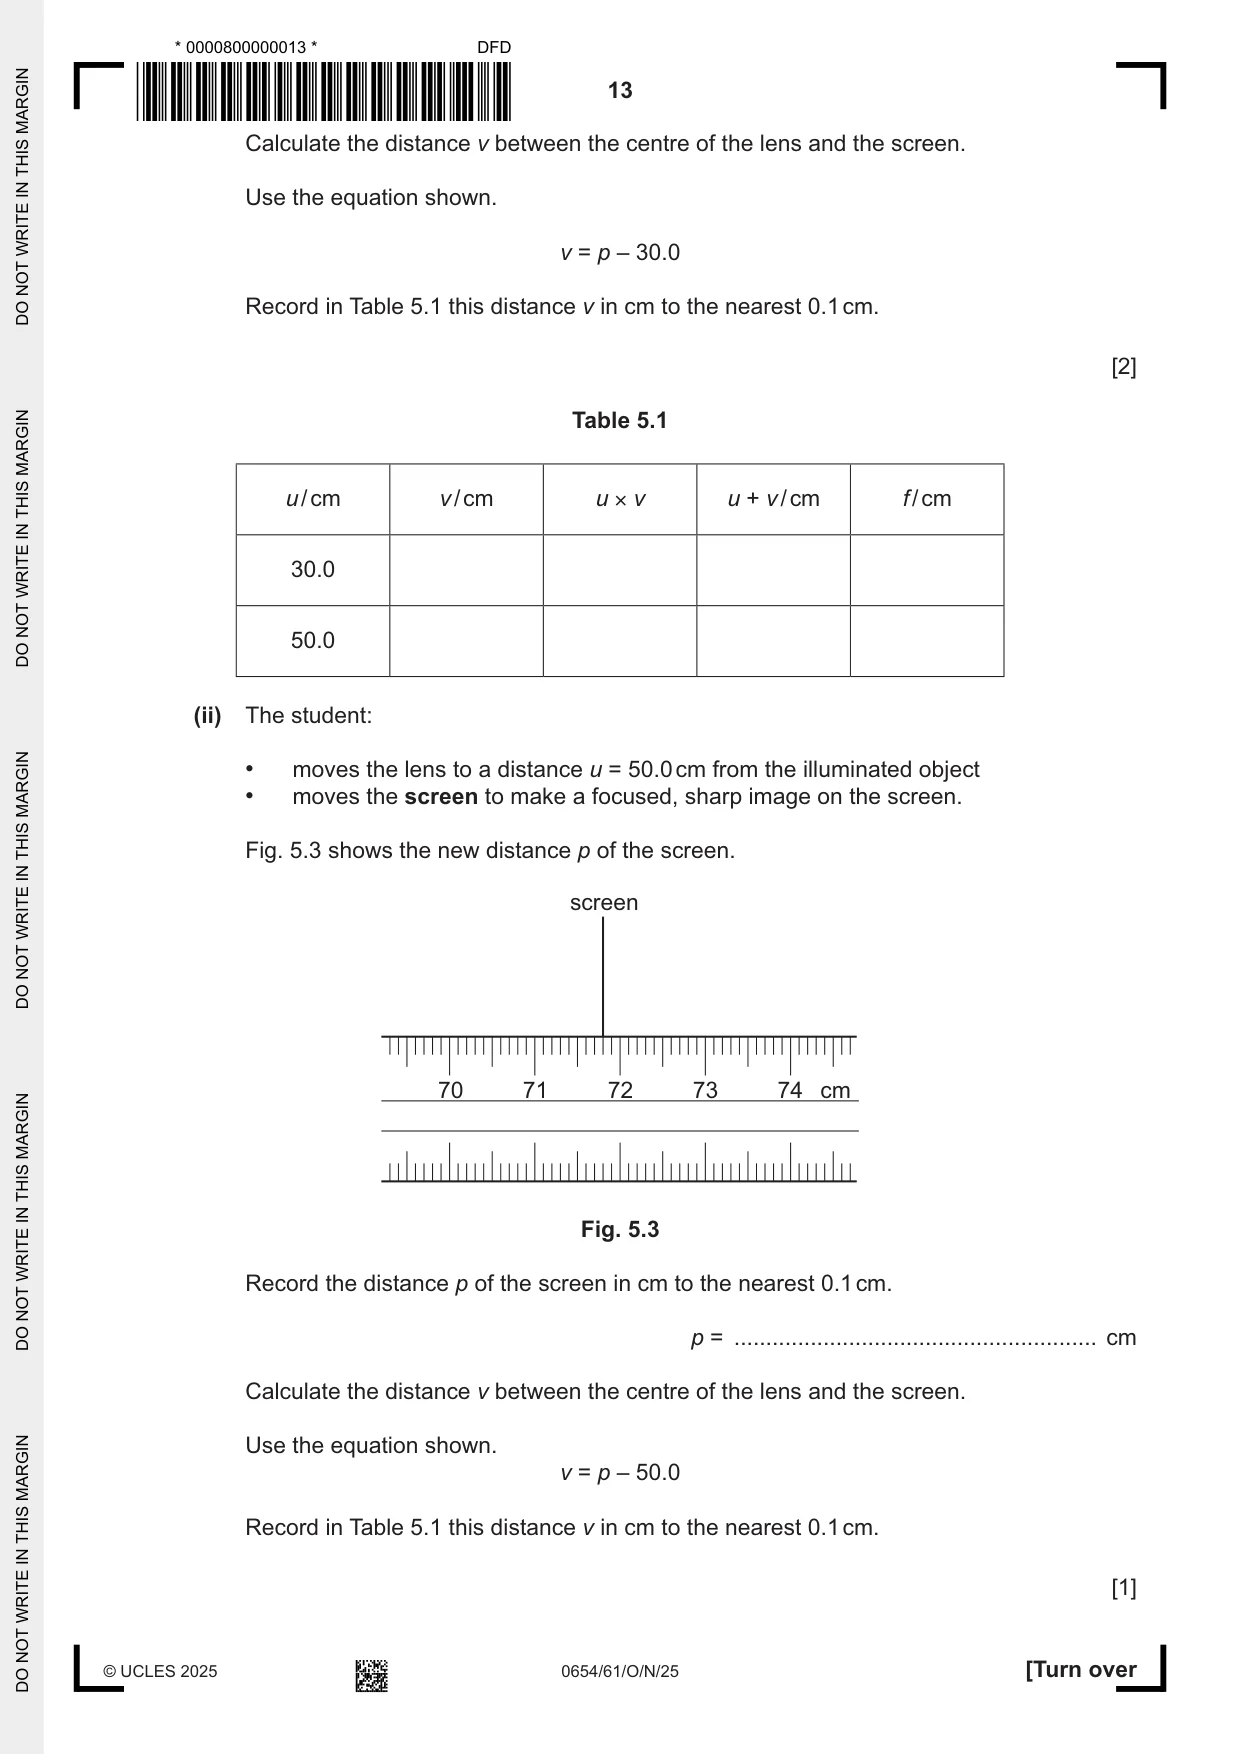
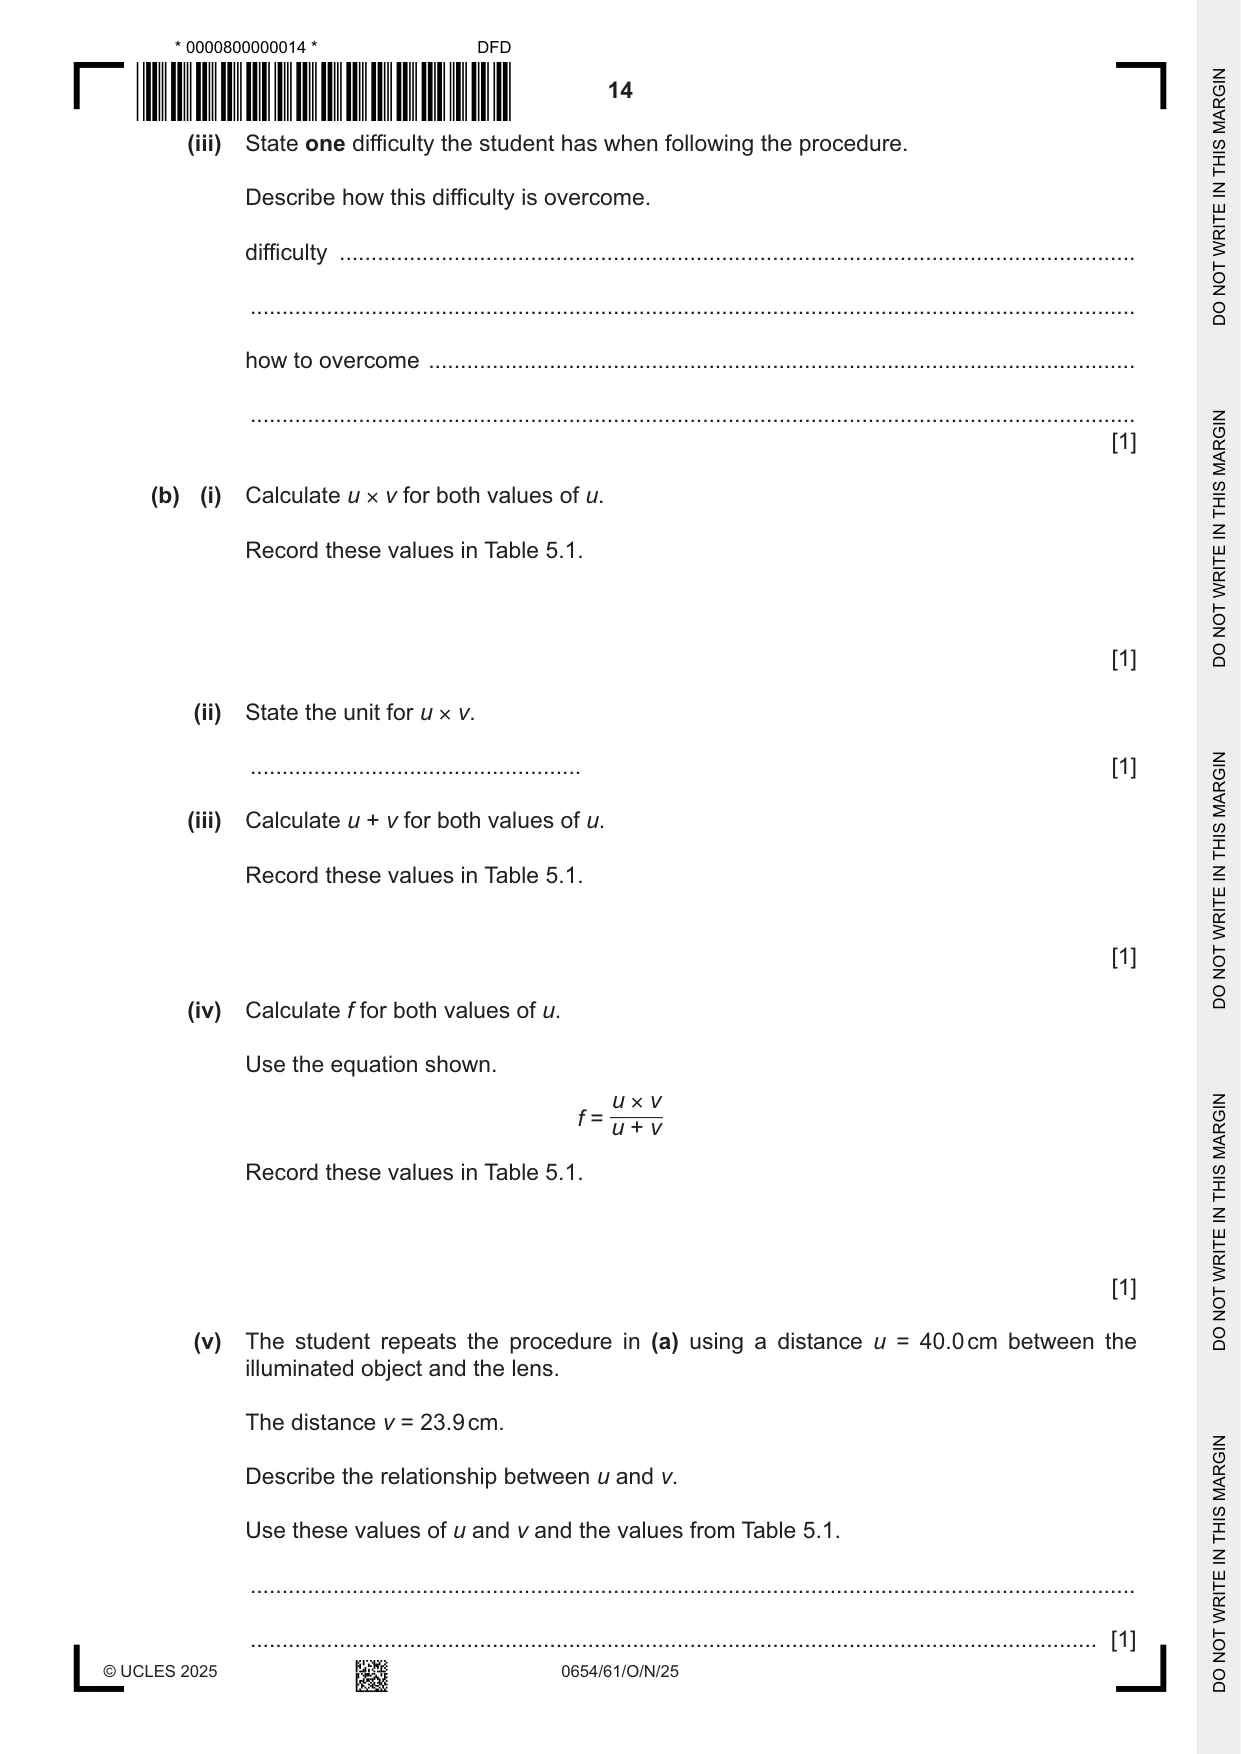
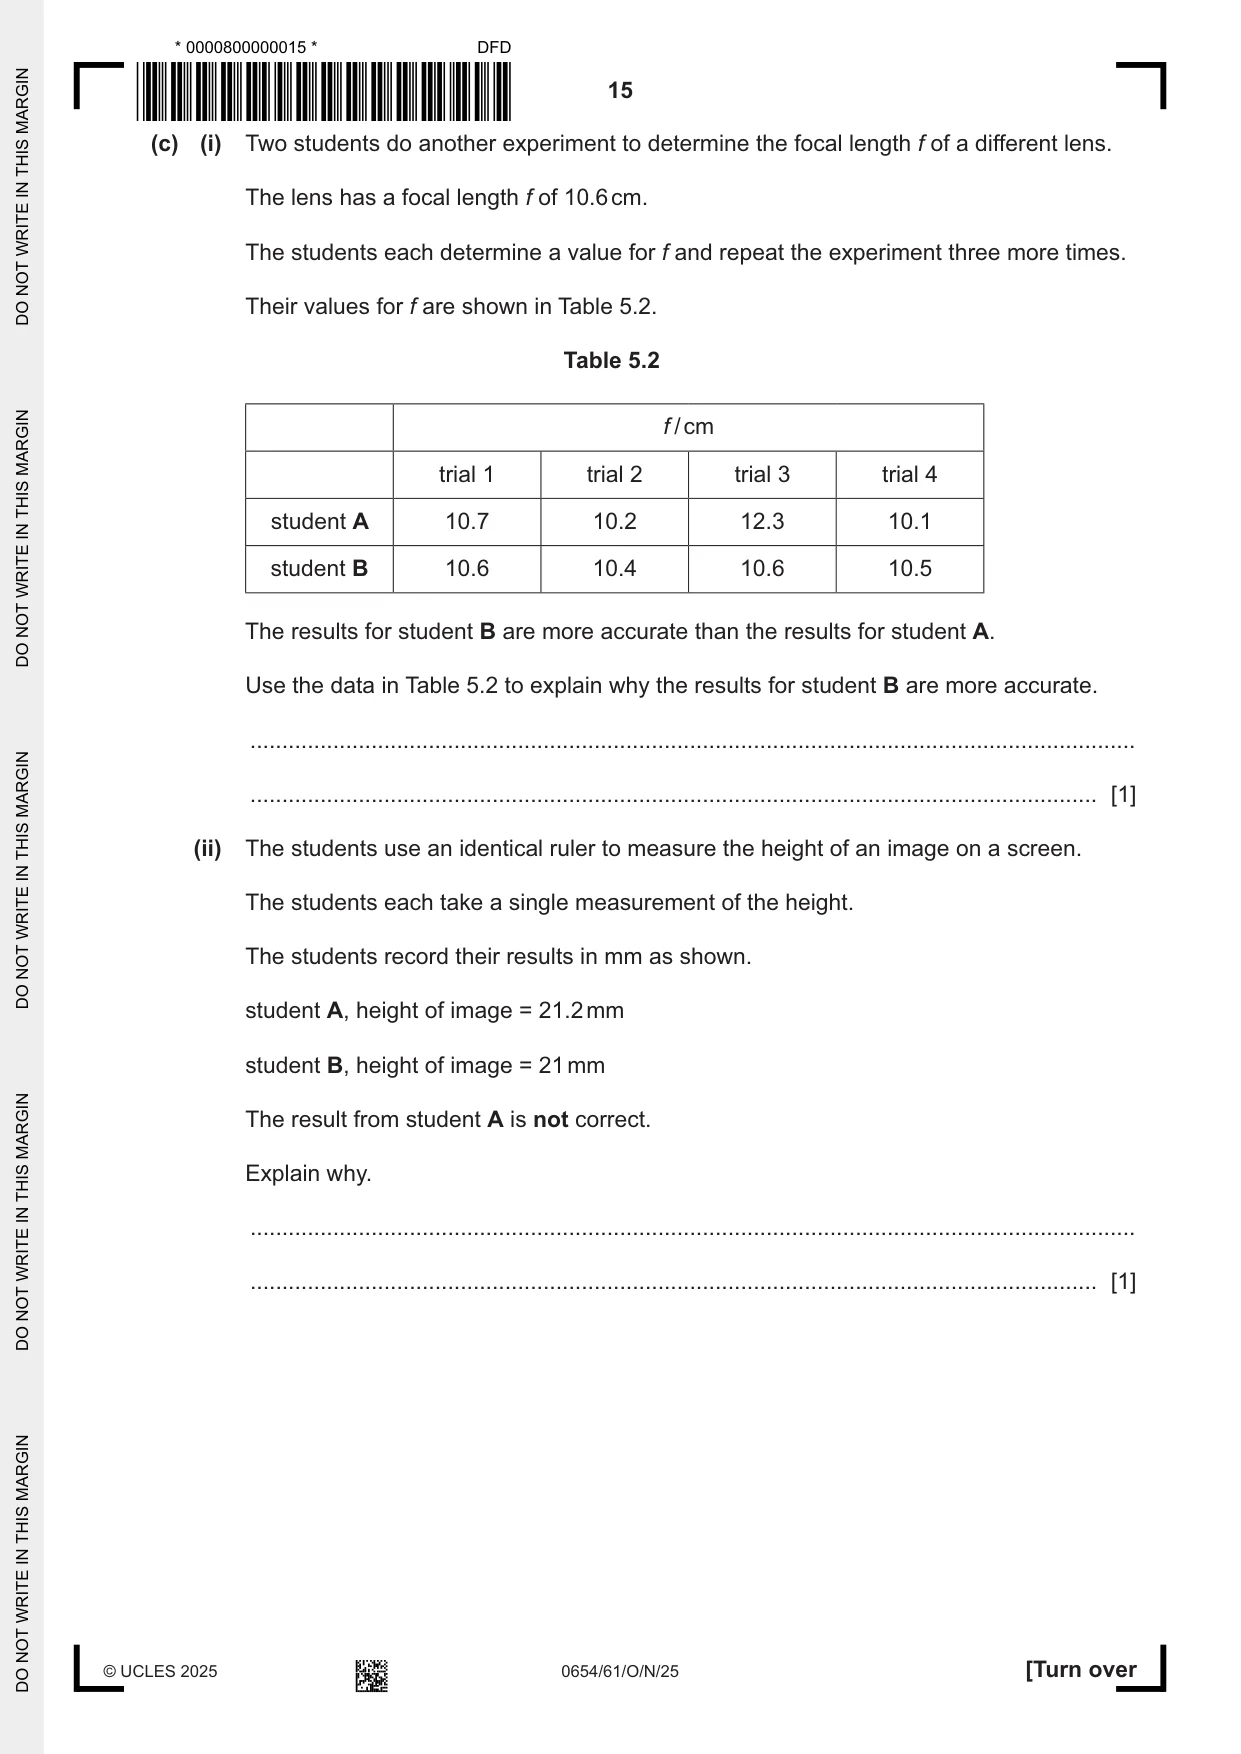
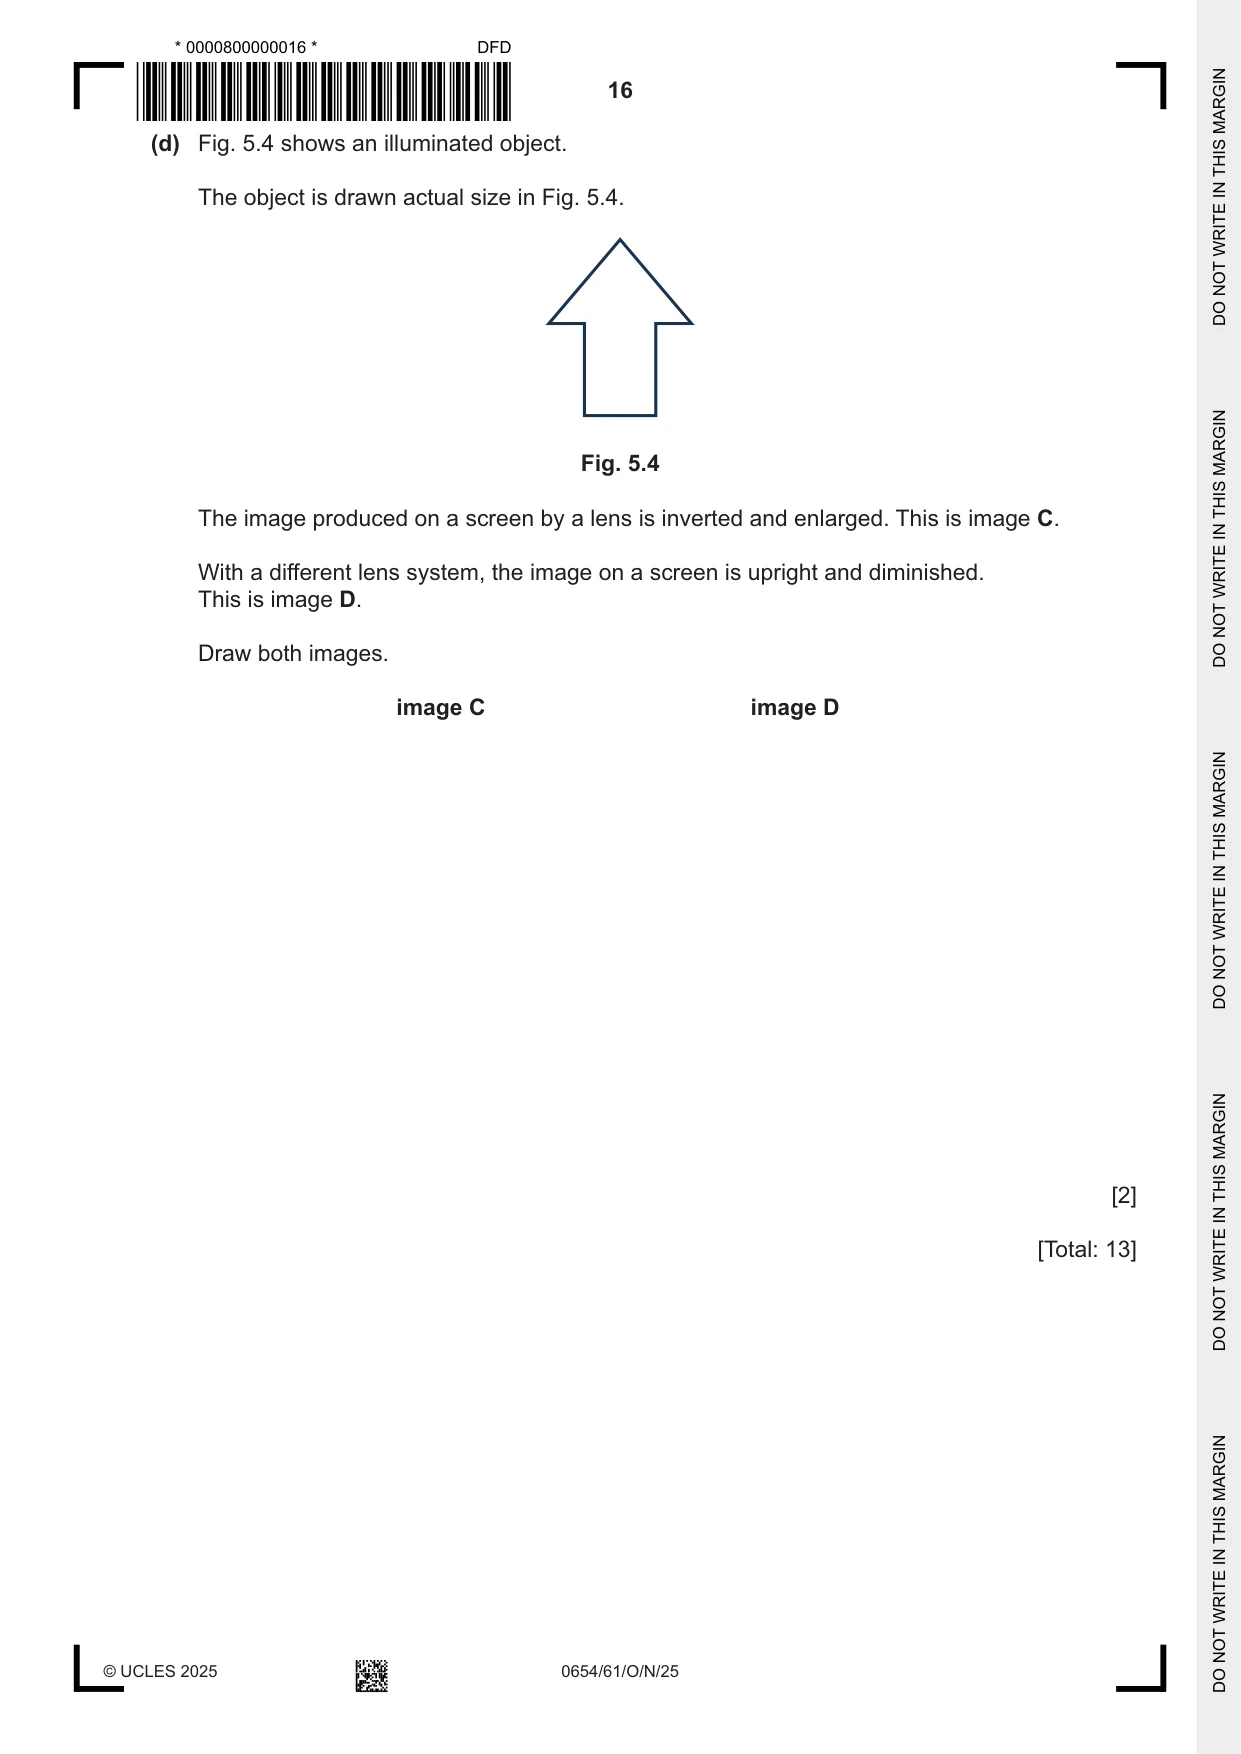
5 A student does an experiment to calculate the focal length f of a converging lens. Fig. 5.1 shows the apparatus the student uses. illuminated object screen converging lens in holder lamp 0 100 u v metre ruler p Fig. 5.1 (a) Procedure The student: • places the lens so that its centre is at a distance u = 30.0 cm from the illuminated object • switches on the lamp • moves the screen to make a focused, sharp image on the screen • measures the distance p between the illuminated object and the screen. (i) Fig. 5.2 shows the position of the screen when the image is sharp. screen 58 59 60 61 62 cm Fig. 5.2 Record the distance p of the screen in cm to the nearest 0.1 cm. p = ......................................................... cm Calculate the distance v between the centre of the lens and the screen. Use the equation shown. v = p – 30.0 Record in Table 5.1 this distance v in cm to the nearest 0.1 cm. [2] Table 5.1 u / cm v / cm u × v u + v / cm f / cm 30.0 50.0 (ii) The student: • moves the lens to a distance u = 50.0 cm from the illuminated object • moves the screen to make a focused, sharp image on the screen. Fig. 5.3 shows the new distance p of the screen. screen 70 71 72 73 74 cm Fig. 5.3 Record the distance p of the screen in cm to the nearest 0.1 cm. p = ......................................................... cm Calculate the distance v between the centre of the lens and the screen. Use the equation shown. v = p – 50.0 Record in Table 5.1 this distance v in cm to the nearest 0.1 cm. [1] (iii) State one difficulty the student has when following the procedure. Describe how this difficulty is overcome. difficulty ............................................................................................................................. ........................................................................................................................................... how to overcome ............................................................................................................... ........................................................................................................................................... [1] (b) (i) Calculate u × v for both values of u. Record these values in Table 5.1. [1] (ii) State the unit for u × v. .................................................... [1] (iii) Calculate u + v for both values of u. Record these values in Table 5.1. [1] (iv) Calculate f for both values of u. Use the equation shown. u × v f = u + v Record these values in Table 5.1. [1] (v) The student repeats the procedure in (a) using a distance u = 40.0 cm between the illuminated object and the lens. The distance v = 23.9 cm. Describe the relationship between u and v. Use these values of u and v and the values from Table 5.1. ........................................................................................................................................... ..................................................................................................................................... [1] (c) (i) Two students do another experiment to determine the focal length f of a different lens. The lens has a focal length f of 10.6 cm. The students each determine a value for f and repeat the experiment three more times. Their values for f are shown in Table 5.2. Table 5.2 f / cm trial 1 trial 2 trial 3 trial 4 student A 10.7 10.2 12.3 10.1 student B 10.6 10.4 10.6 10.5 The results for student B are more accurate than the results for student A. Use the data in Table 5.2 to explain why the results for student B are more accurate. ........................................................................................................................................... ..................................................................................................................................... [1] (ii) The students use an identical ruler to measure the height of an image on a screen. The students each take a single measurement of the height. The students record their results in mm as shown. student A, height of image = 21.2 mm student B, height of image = 21 mm The result from student A is not correct. Explain why. ........................................................................................................................................... ..................................................................................................................................... [1] (d) Fig. 5.4 shows an illuminated object. The object is drawn actual size in Fig. 5.4. Fig. 5.4 The image produced on a screen by a lens is inverted and enlarged. This is image C. With a different lens system, the image on a screen is upright and diminished. This is image D. Draw both images. image C image D [2] [Total: 13]
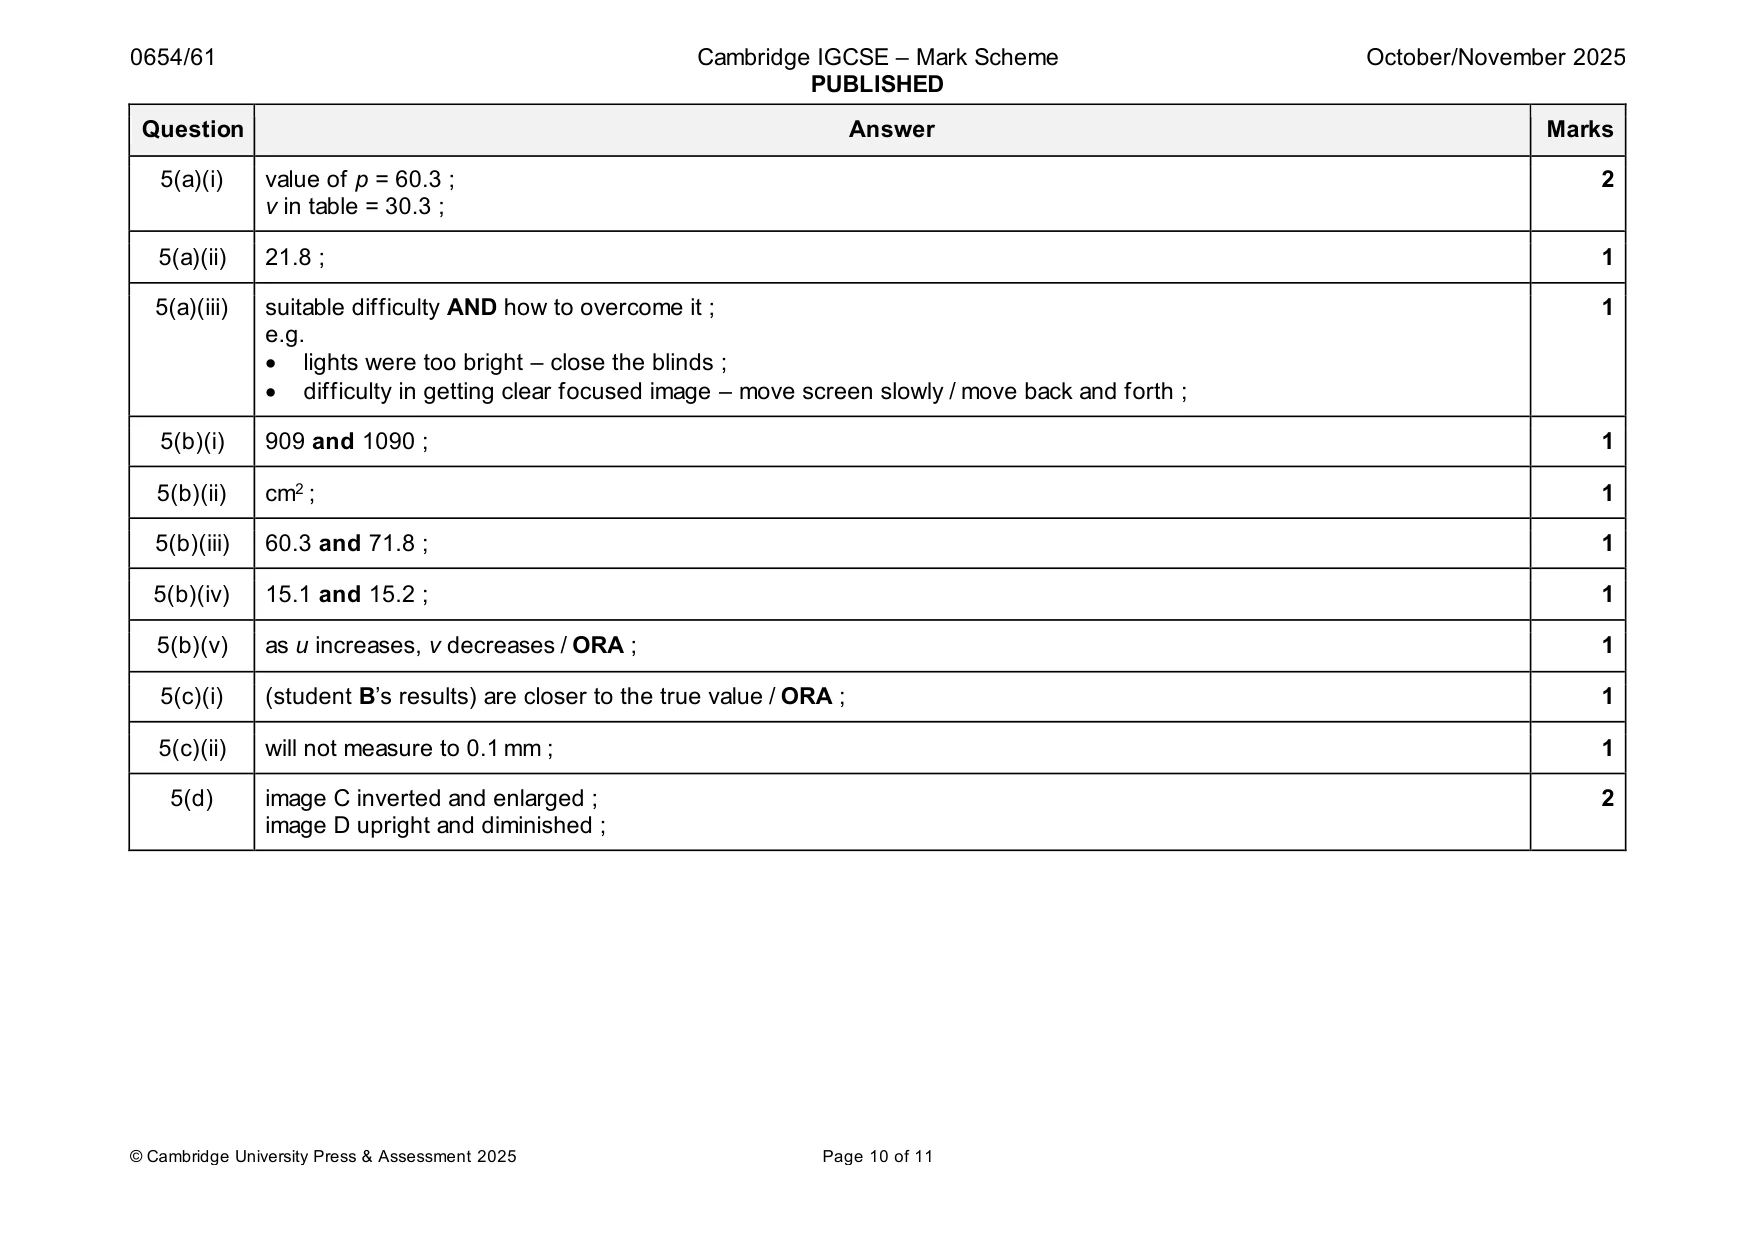
Mark scheme: 5(a)(i) value of p = 60.3 ; 2 v in table = 30.3 ; 5(a)(ii) 21.8 ; 1 5(a)(iii) suitable difficulty AND how to overcome it ; 1 e.g. • lights were too bright – close the blinds ; • difficulty in getting clear focused image – move screen slowly / move back and forth ; 5(b)(i) 909 and 1090 ; 1 5(b)(ii) cm2 ; 1 5(b)(iii) 60.3 and 71.8 ; 1 5(b)(iv) 15.1 and 15.2 ; 1 5(b)(v) as u increases, v decreases / ORA ; 1 5(c)(i) (student B’s results) are closer to the true value / ORA ; 1 5(c)(ii) will not measure to 0.1 mm ; 1 5(d) image C inverted and enlarged ; 2 image D upright and diminished ;
Q6 · A student investigates the time taken for one swing of a pendulum (period)
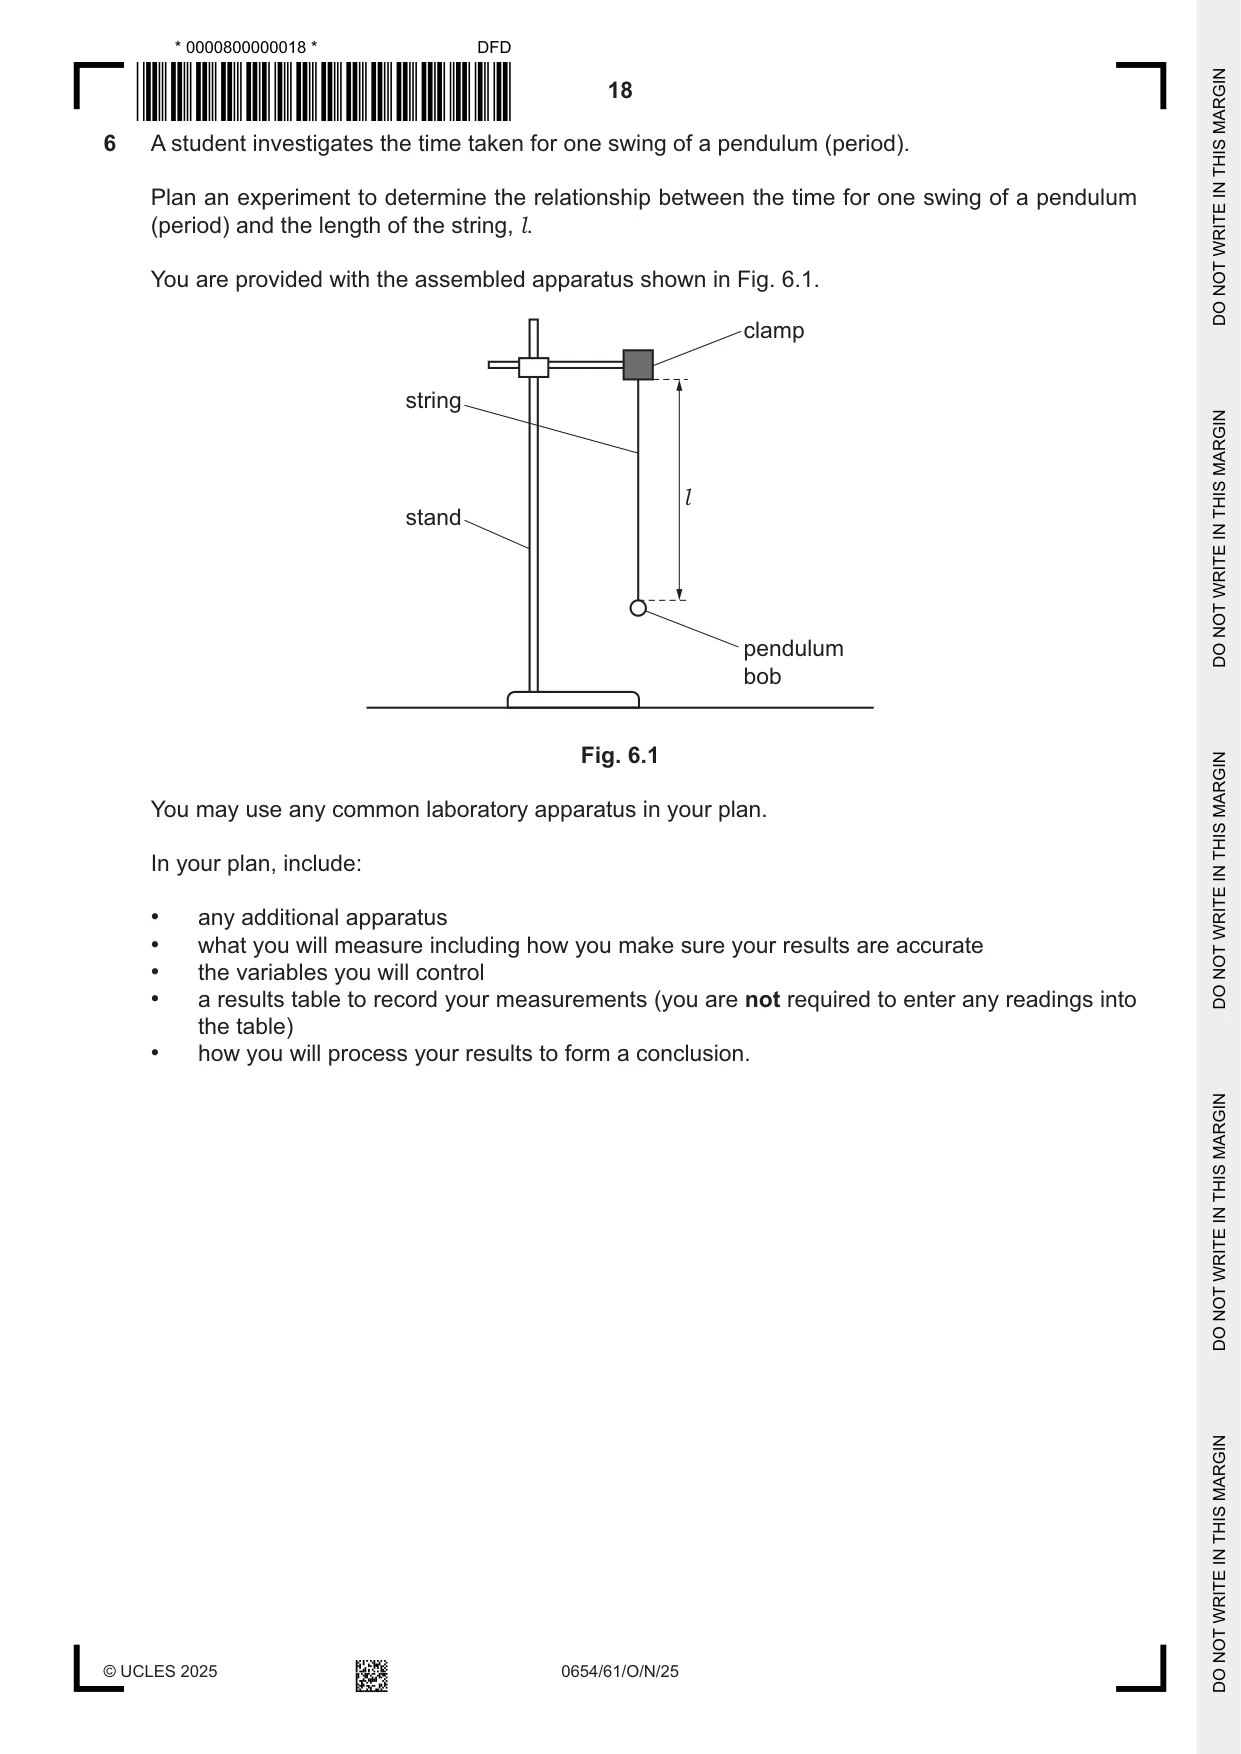
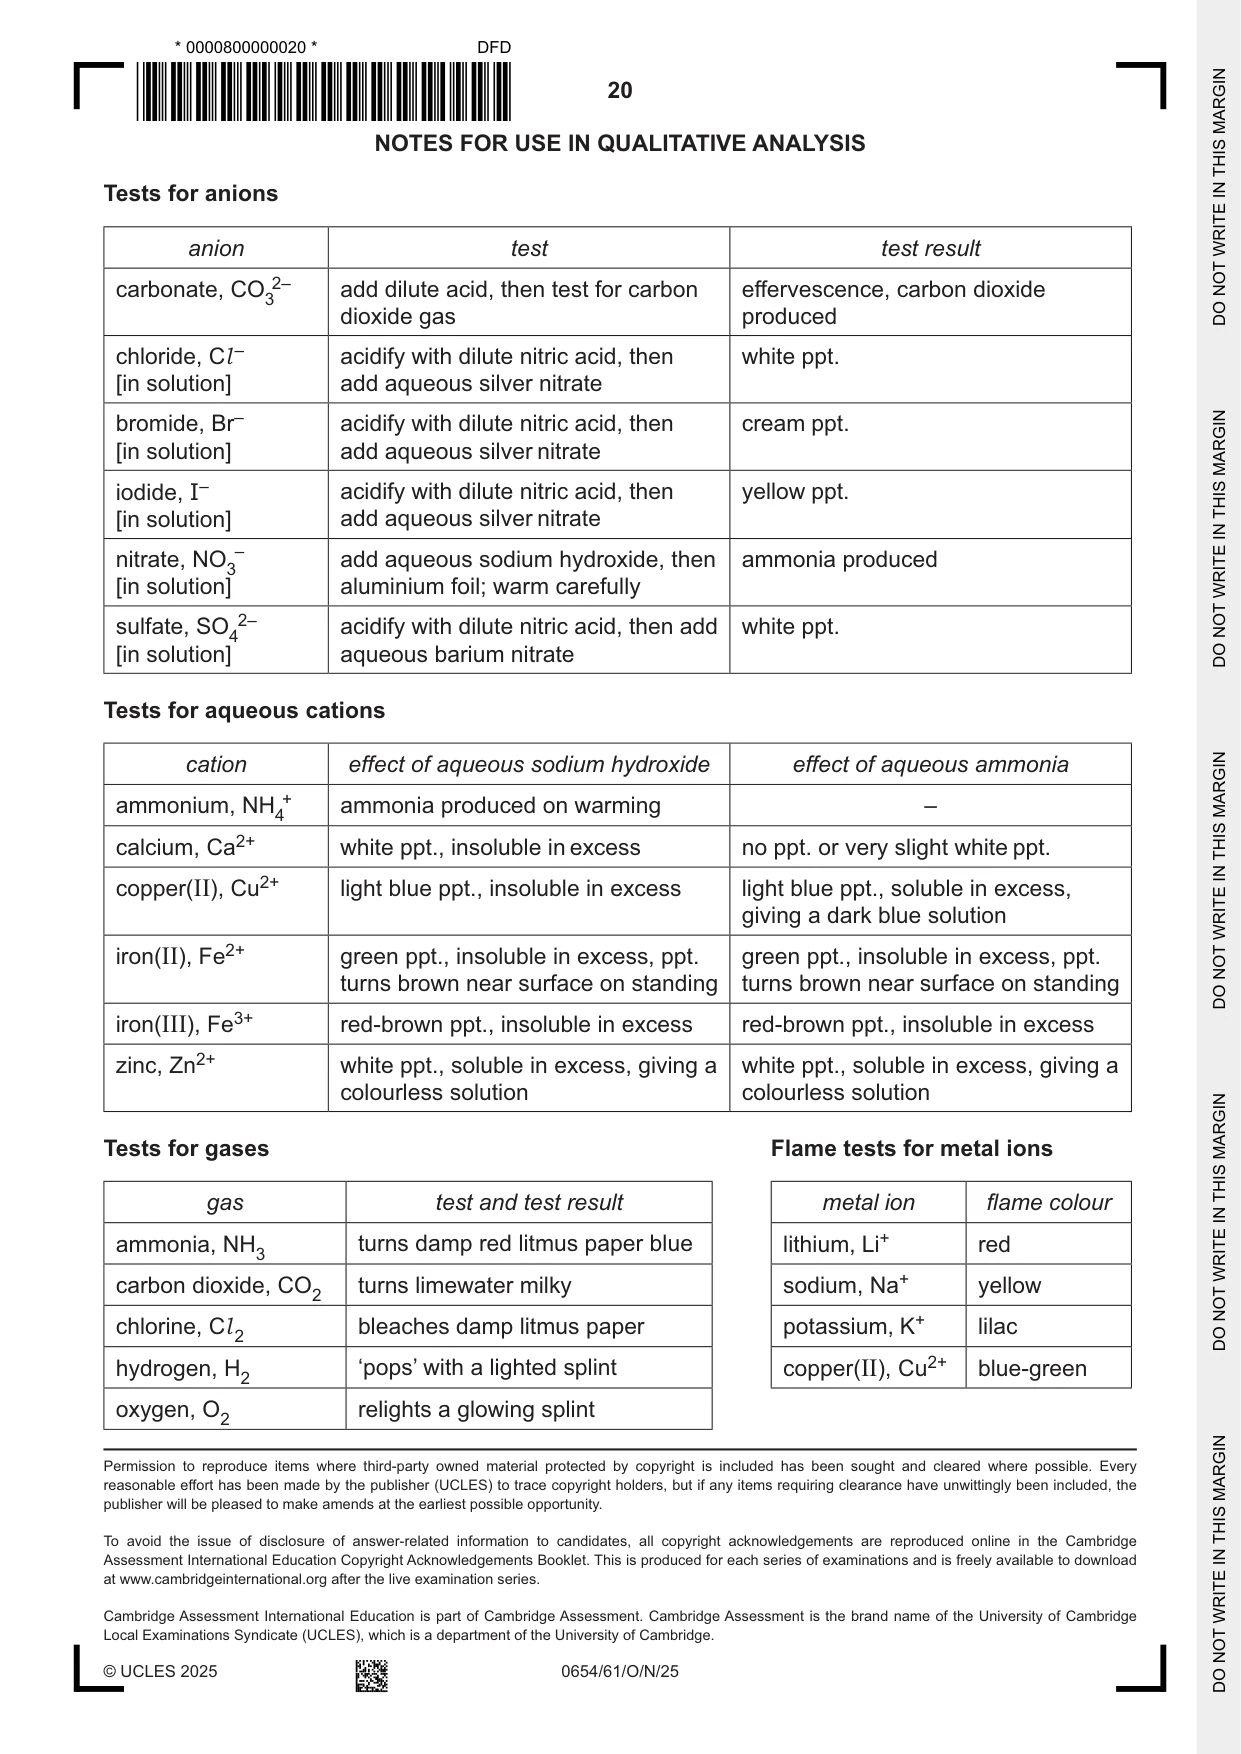
6 A student investigates the time taken for one swing of a pendulum (period). Plan an experiment to determine the relationship between the time for one swing of a pendulum (period) and the length of the string, l. You are provided with the assembled apparatus shown in Fig. 6.1. clamp string l stand pendulum bob Fig. 6.1 You may use any common laboratory apparatus in your plan. In your plan, include: • any additional apparatus • what you will measure including how you make sure your results are accurate • the variables you will control • a results table to record your measurements (you are not required to enter any readings into the table) • how you will process your results to form a conclusion. .......................................................................................................................................................... .......................................................................................................................................................... .......................................................................................................................................................... .......................................................................................................................................................... .......................................................................................................................................................... .......................................................................................................................................................... .......................................................................................................................................................... .......................................................................................................................................................... .......................................................................................................................................................... .......................................................................................................................................................... .......................................................................................................................................................... .......................................................................................................................................................... .......................................................................................................................................................... .......................................................................................................................................................... .......................................................................................................................................................... .......................................................................................................................................................... .......................................................................................................................................................... .......................................................................................................................................................... .......................................................................................................................................................... .......................................................................................................................................................... .................................................................................................................................................... [7] NOTES FOR USE IN QUALITATIVE ANALYSIS Tests for anions anion test test result carbonate, CO32– add dilute acid, then test for carbon effervescence, carbon dioxide dioxide gas produced chloride, Cl – acidify with dilute nitric acid, then white ppt. [in solution] add aqueous silver nitrate bromide, Br– acidify with dilute nitric acid, then cream ppt. [in solution] add aqueous silver nitrate iodide, I– acidify with dilute nitric acid, then yellow ppt. [in solution] add aqueous silver nitrate nitrate, NO3– add aqueous sodium hydroxide, then ammonia produced [in solution] aluminium foil; warm carefully sulfate, SO42– acidify with dilute nitric acid, then add white ppt. [in solution] aqueous barium nitrate Tests for aqueous cations cation effect of aqueous sodium hydroxide effect of aqueous ammonia ammonium, NH4+ ammonia produced on warming – calcium, Ca2+ white ppt., insoluble in excess no ppt. or very slight white ppt. copper(II), Cu2+ light blue ppt., insoluble in excess light blue ppt., soluble in excess, giving a dark blue solution iron(II), Fe2+ green ppt., insoluble in excess, ppt. green ppt., insoluble in excess, ppt. turns brown near surface on standing turns brown near surface on standing iron(III), Fe3+ red‑brown ppt., insoluble in excess red‑brown ppt., insoluble in excess zinc, Zn2+ white ppt., soluble in excess, giving a white ppt., soluble in excess, giving a colourless solution colourless solution Tests for gases Flame tests for metal ions gas test and test result metal ion flame colour ammonia, NH3 turns damp red litmus paper blue lithium, Li+ red carbon dioxide, CO2 turns limewater milky sodium, Na+ yellow chlorine, Cl bleaches damp litmus paper potassium, K+ lilac 2 hydrogen, H2 ‘pops’ with a lighted splint copper(II), Cu2+ blue‑green oxygen, O2 relights a glowing splint
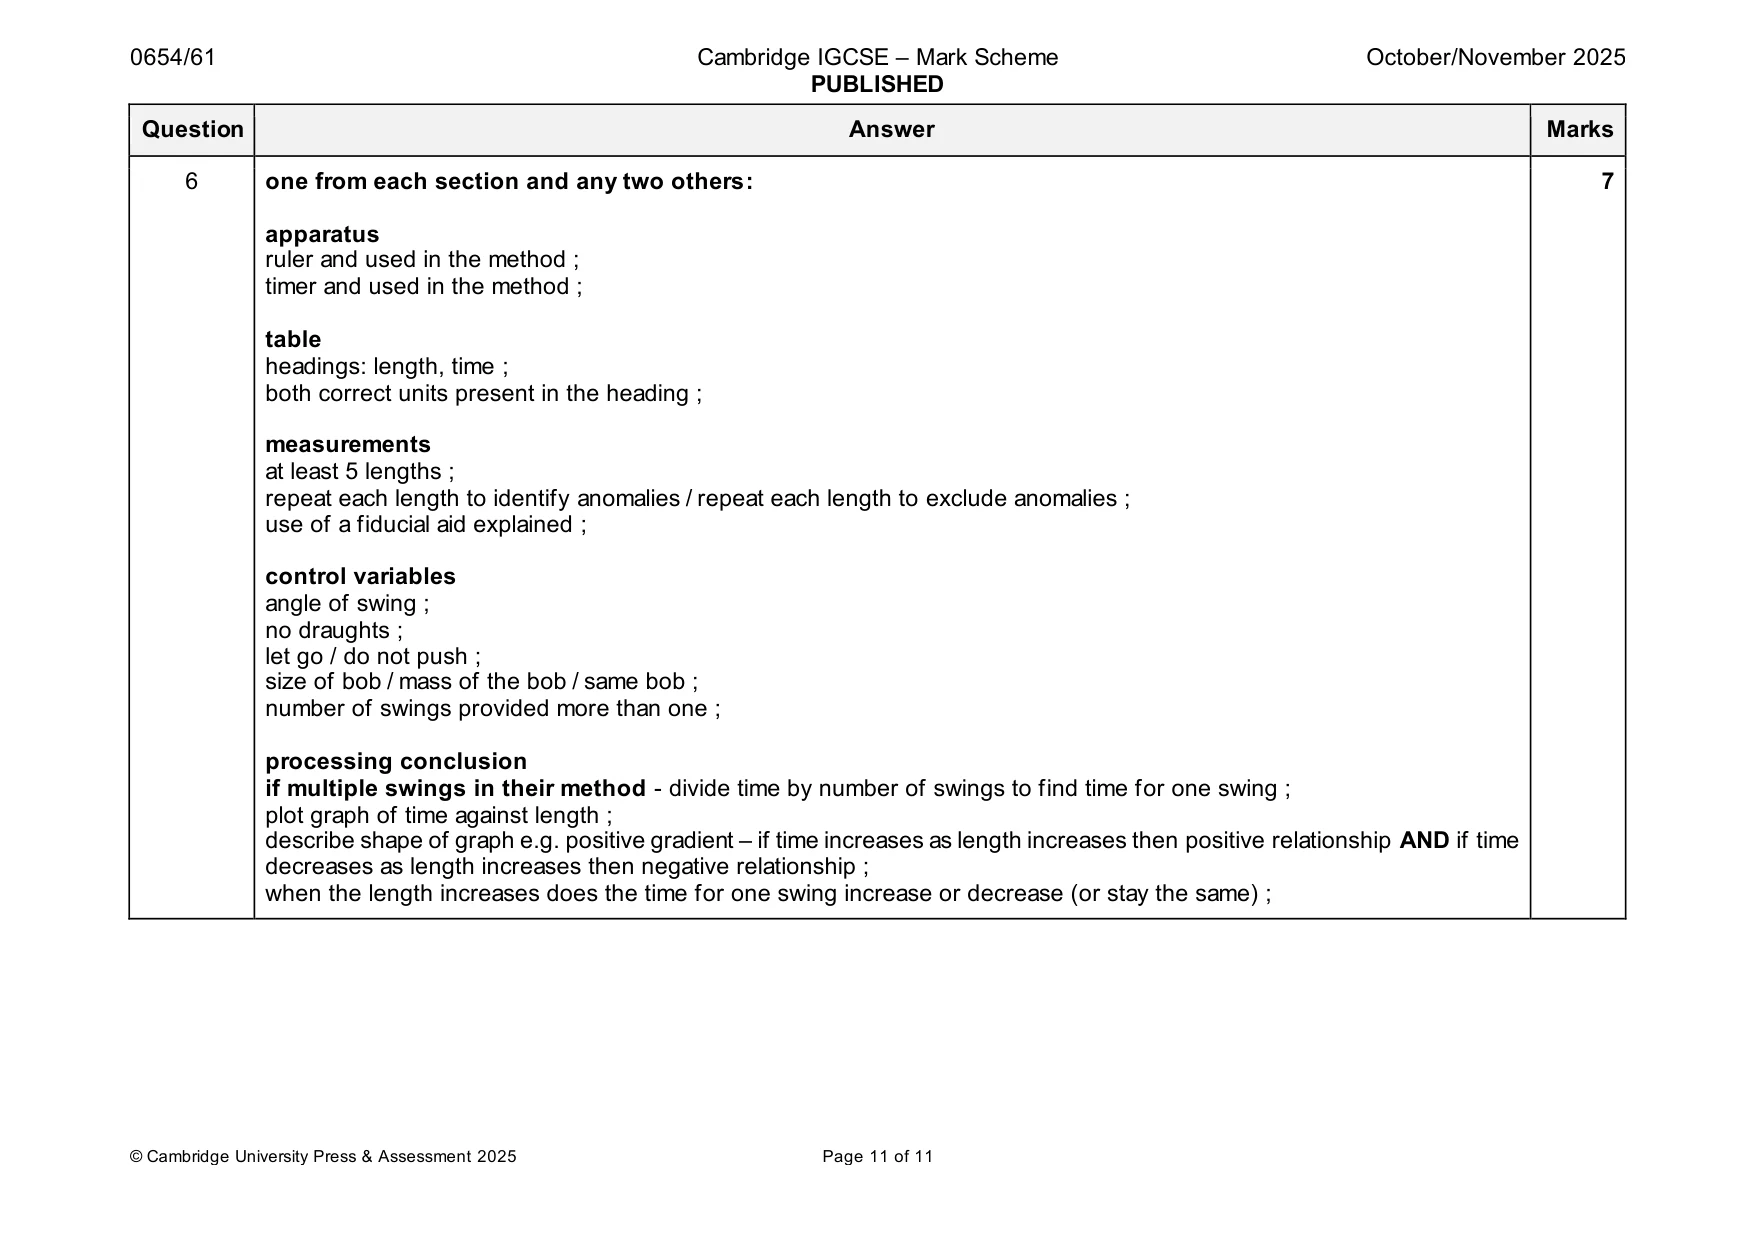
Mark scheme: 6 one from each section and any two others: 7 apparatus ruler and used in the method ; timer and used in the method ; table headings: length, time ; both correct units present in the heading ; measurements at least 5 lengths ; repeat each length to identify anomalies / repeat each length to exclude anomalies ; use of a fiducial aid explained ; control variables angle of swing ; no draughts ; let go / do not push ; size of bob / mass of the bob / same bob ; number of swings provided more than one ; processing conclusion if multiple swings in their method - divide time by number of swings to find time for one swing ; plot graph of time against length ; describe shape of graph e.g. positive gradient – if time increases as length increases then positive relationship AND if time decreases as length increases then negative relationship ; when the length increases does the time for one swing increase or decrease (or stay the same) ;
What was in this paper
The subtopics covered by these 6 questions, and how many questions each got. Open one in a new tab to see every Cambridge question on it.
What you needed in this session
Cambridge’s own grade thresholds for 2025 Oct/Nov, Paper 6 · Variant 1. A higher threshold means an easier paper — the bar moves with how the cohort did.