Cambridge IGCSE Sciences - Co-ordinated (Double) 0654 — 2024 Oct/Nov Paper 6 · Variant 3
0654/63/O/N/24 · 6 questions · 60 marks · ≈68 min
The question paper and its mark scheme, free to read here and free to download. This is Cambridge’s own paper, exactly as it was sat.
Question paper20 pages


Mark scheme10 pages
Answers below. Sit the paper first if you are practising.
Questions as text
Q1 · A student investigates the movement of water into and out of plant cells by osmosis
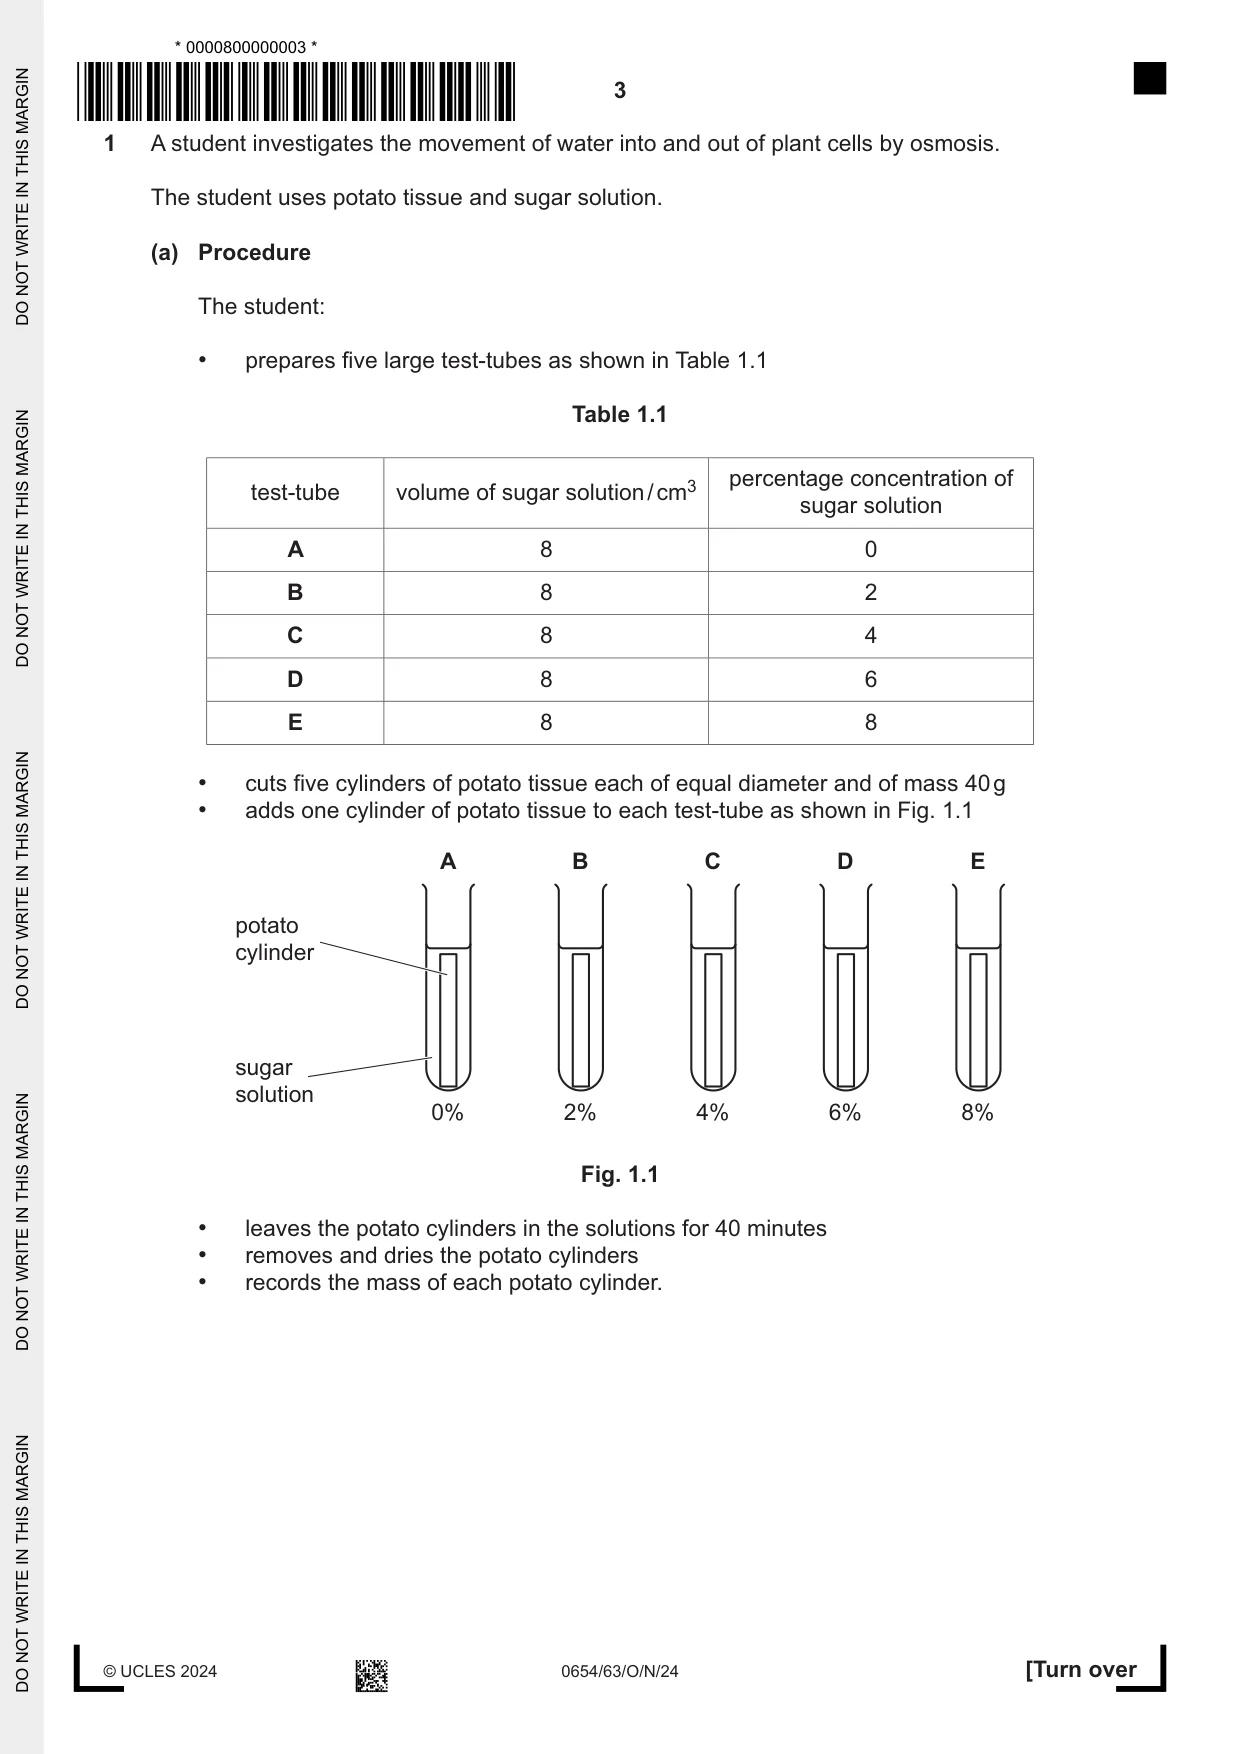
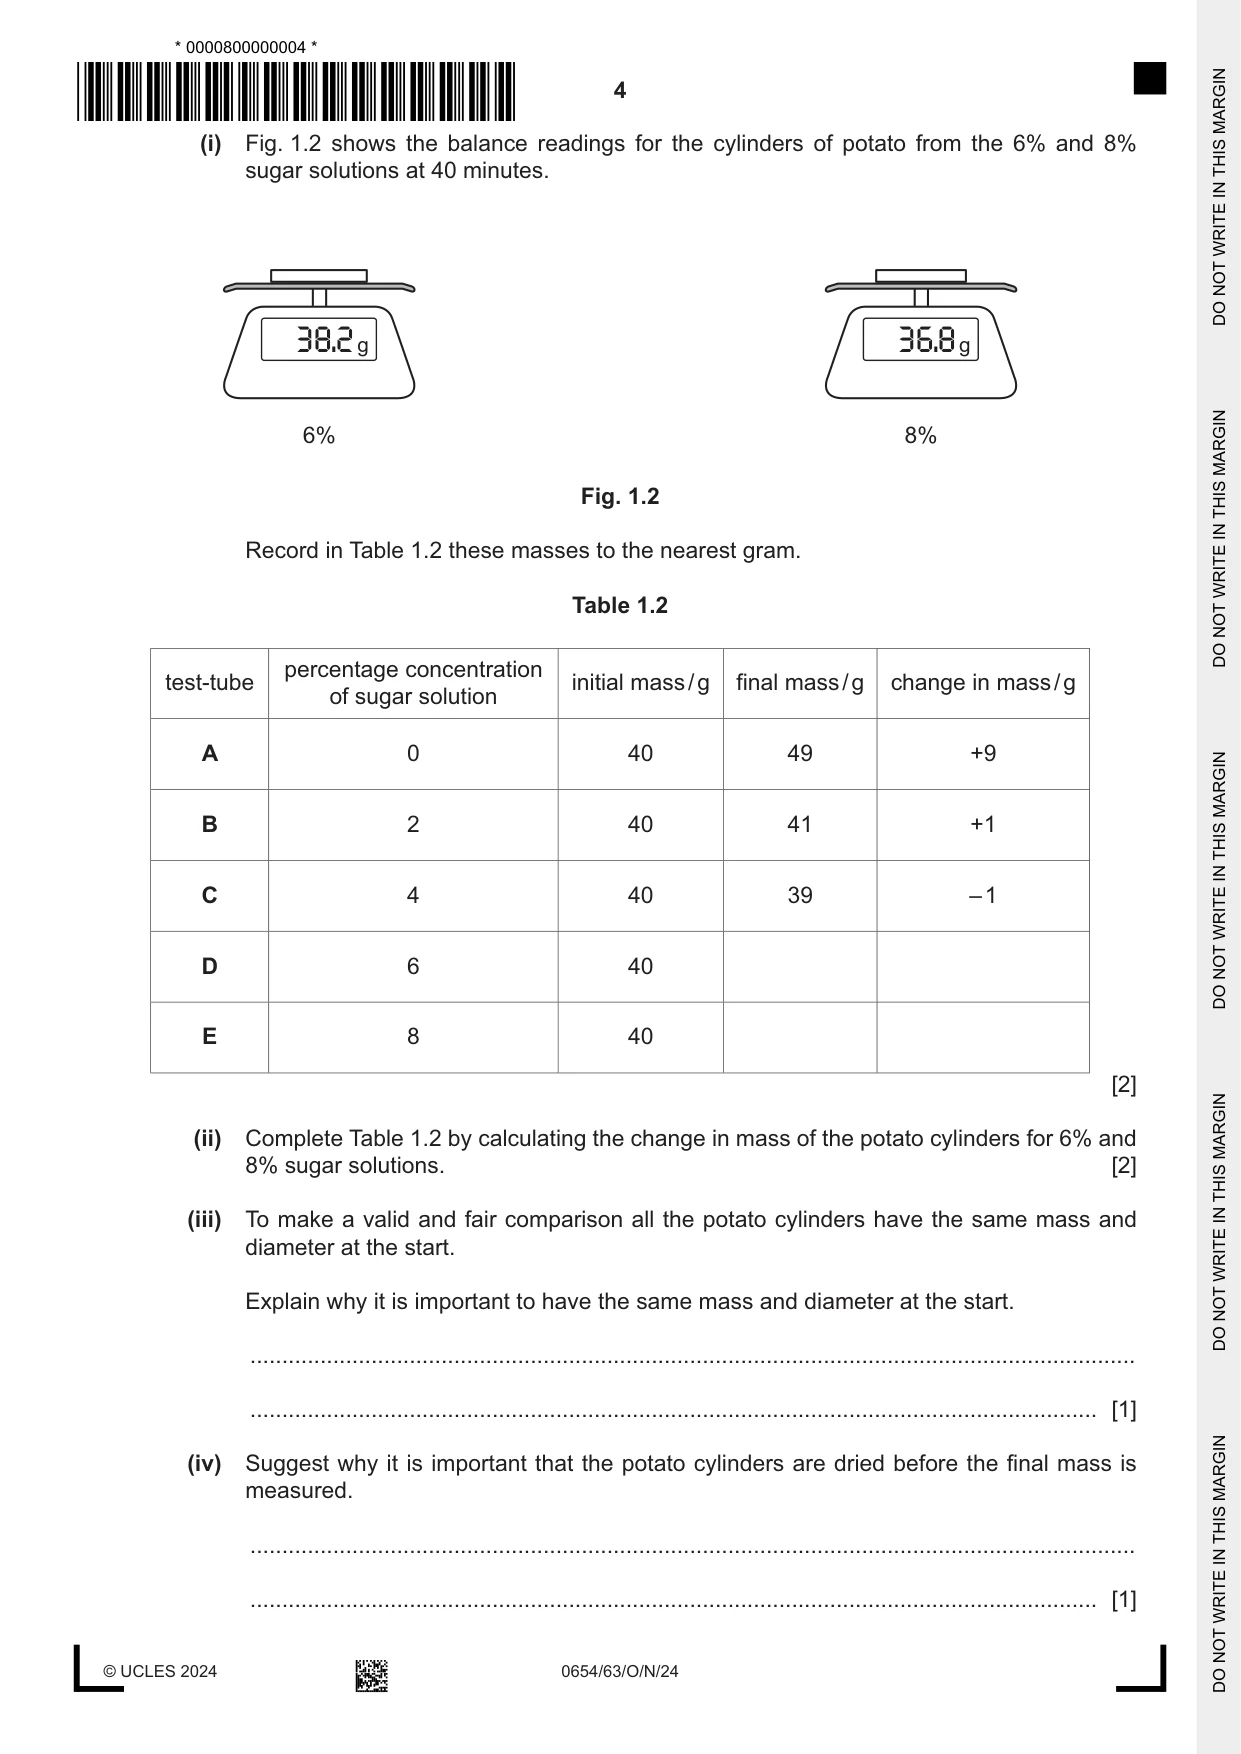
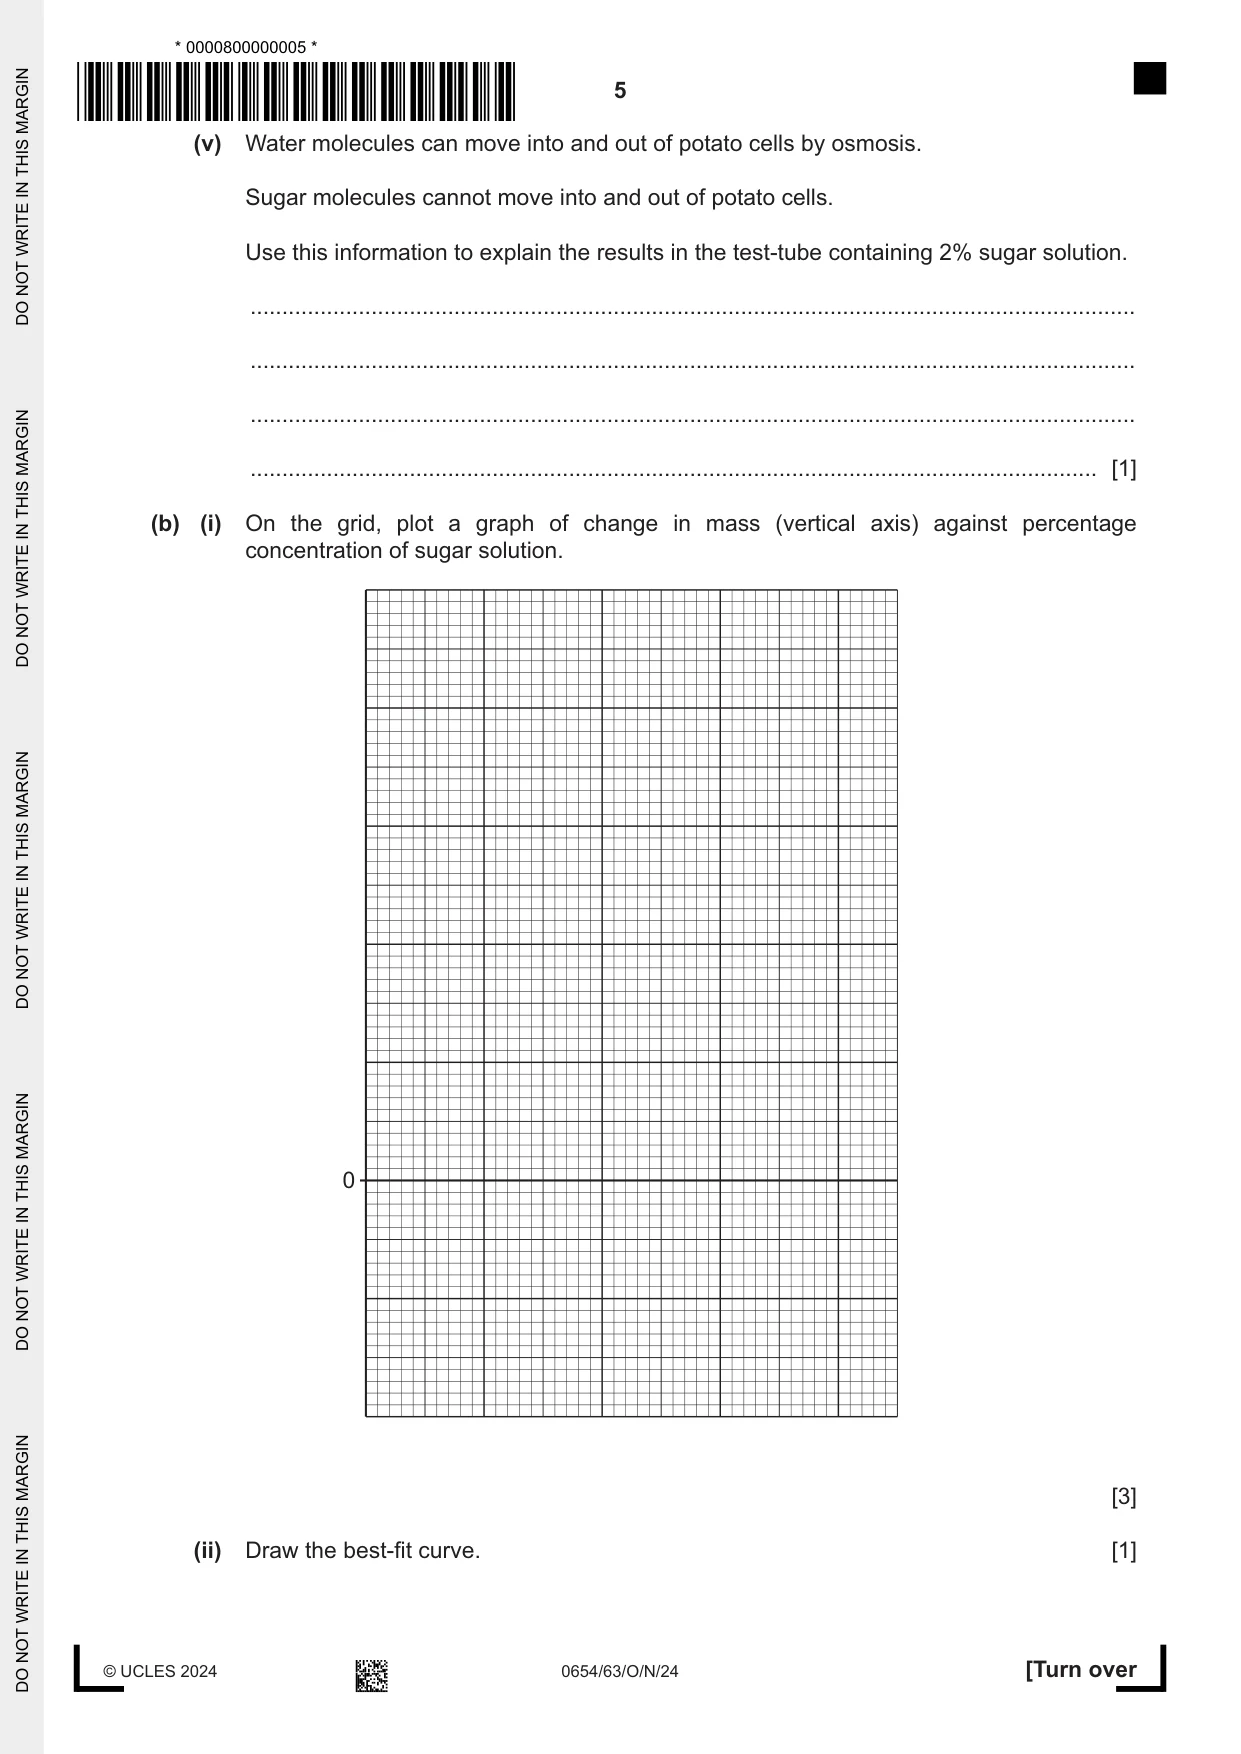
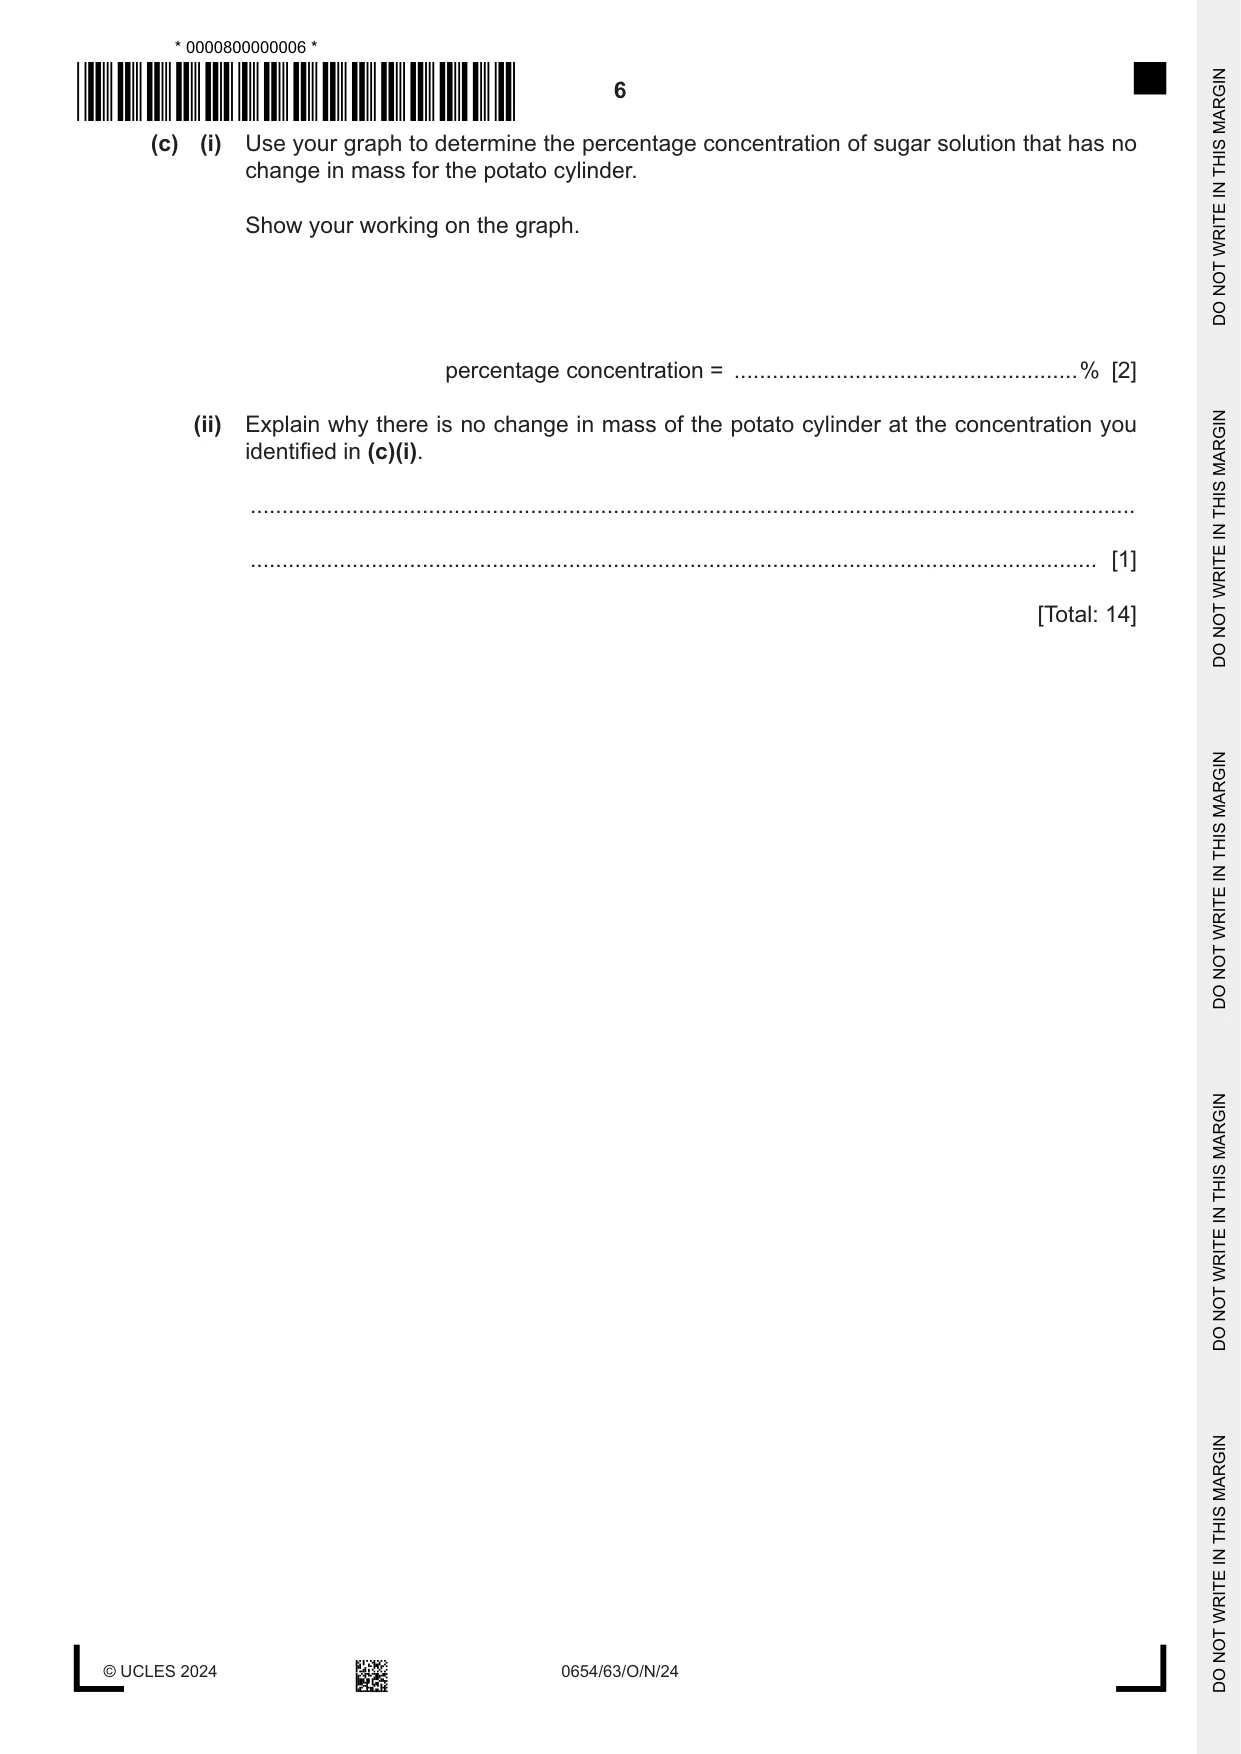
1 A student investigates the movement of water into and out of plant cells by osmosis. The student uses potato tissue and sugar solution. (a) Procedure The student: • prepares five large test-tubes as shown in Table 1.1 Table 1.1 percentage concentration of test-tube volume of sugar solution / cm3 sugar solution A 8 0 B 8 2 C 8 4 D 8 6 E 8 8 • cuts five cylinders of potato tissue each of equal diameter and of mass 40 g • adds one cylinder of potato tissue to each test-tube as shown in Fig. 1.1 A B C D E potato cylinder sugar solution 0% 2% 4% 6% 8% Fig. 1.1 • leaves the potato cylinders in the solutions for 40 minutes • removes and dries the potato cylinders • records the mass of each potato cylinder. (i) Fig. 1.2 shows the balance readings for the cylinders of potato from the 6% and 8% sugar solutions at 40 minutes. 38.2 g 36.8 g 6% 8% Fig. 1.2 Record in Table 1.2 these masses to the nearest gram. Table 1.2 percentage concentration test-tube initial mass / g final mass / g change in mass / g of sugar solution A 0 40 49 +9 B 2 40 41 +1 C 4 40 39 – 1 D 6 40 E 8 40 [2] (ii) Complete Table 1.2 by calculating the change in mass of the potato cylinders for 6% and 8% sugar solutions. [2] (iii) To make a valid and fair comparison all the potato cylinders have the same mass and diameter at the start. Explain why it is important to have the same mass and diameter at the start. ........................................................................................................................................... ..................................................................................................................................... [1] (iv) Suggest why it is important that the potato cylinders are dried before the final mass is measured. ........................................................................................................................................... ..................................................................................................................................... [1] (v) Water molecules can move into and out of potato cells by osmosis. Sugar molecules cannot move into and out of potato cells. Use this information to explain the results in the test-tube containing 2% sugar solution. ........................................................................................................................................... ........................................................................................................................................... ........................................................................................................................................... ..................................................................................................................................... [1] (b) (i) On the grid, plot a graph of change in mass (vertical axis) against percentage concentration of sugar solution. 0 [3] (ii) Draw the best-fit curve. [1] (c) (i) Use your graph to determine the percentage concentration of sugar solution that has no change in mass for the potato cylinder. Show your working on the graph. percentage concentration = ......................................................% [2] (ii) Explain why there is no change in mass of the potato cylinder at the concentration you identified in (c)(i). ........................................................................................................................................... ..................................................................................................................................... [1] [Total: 14]
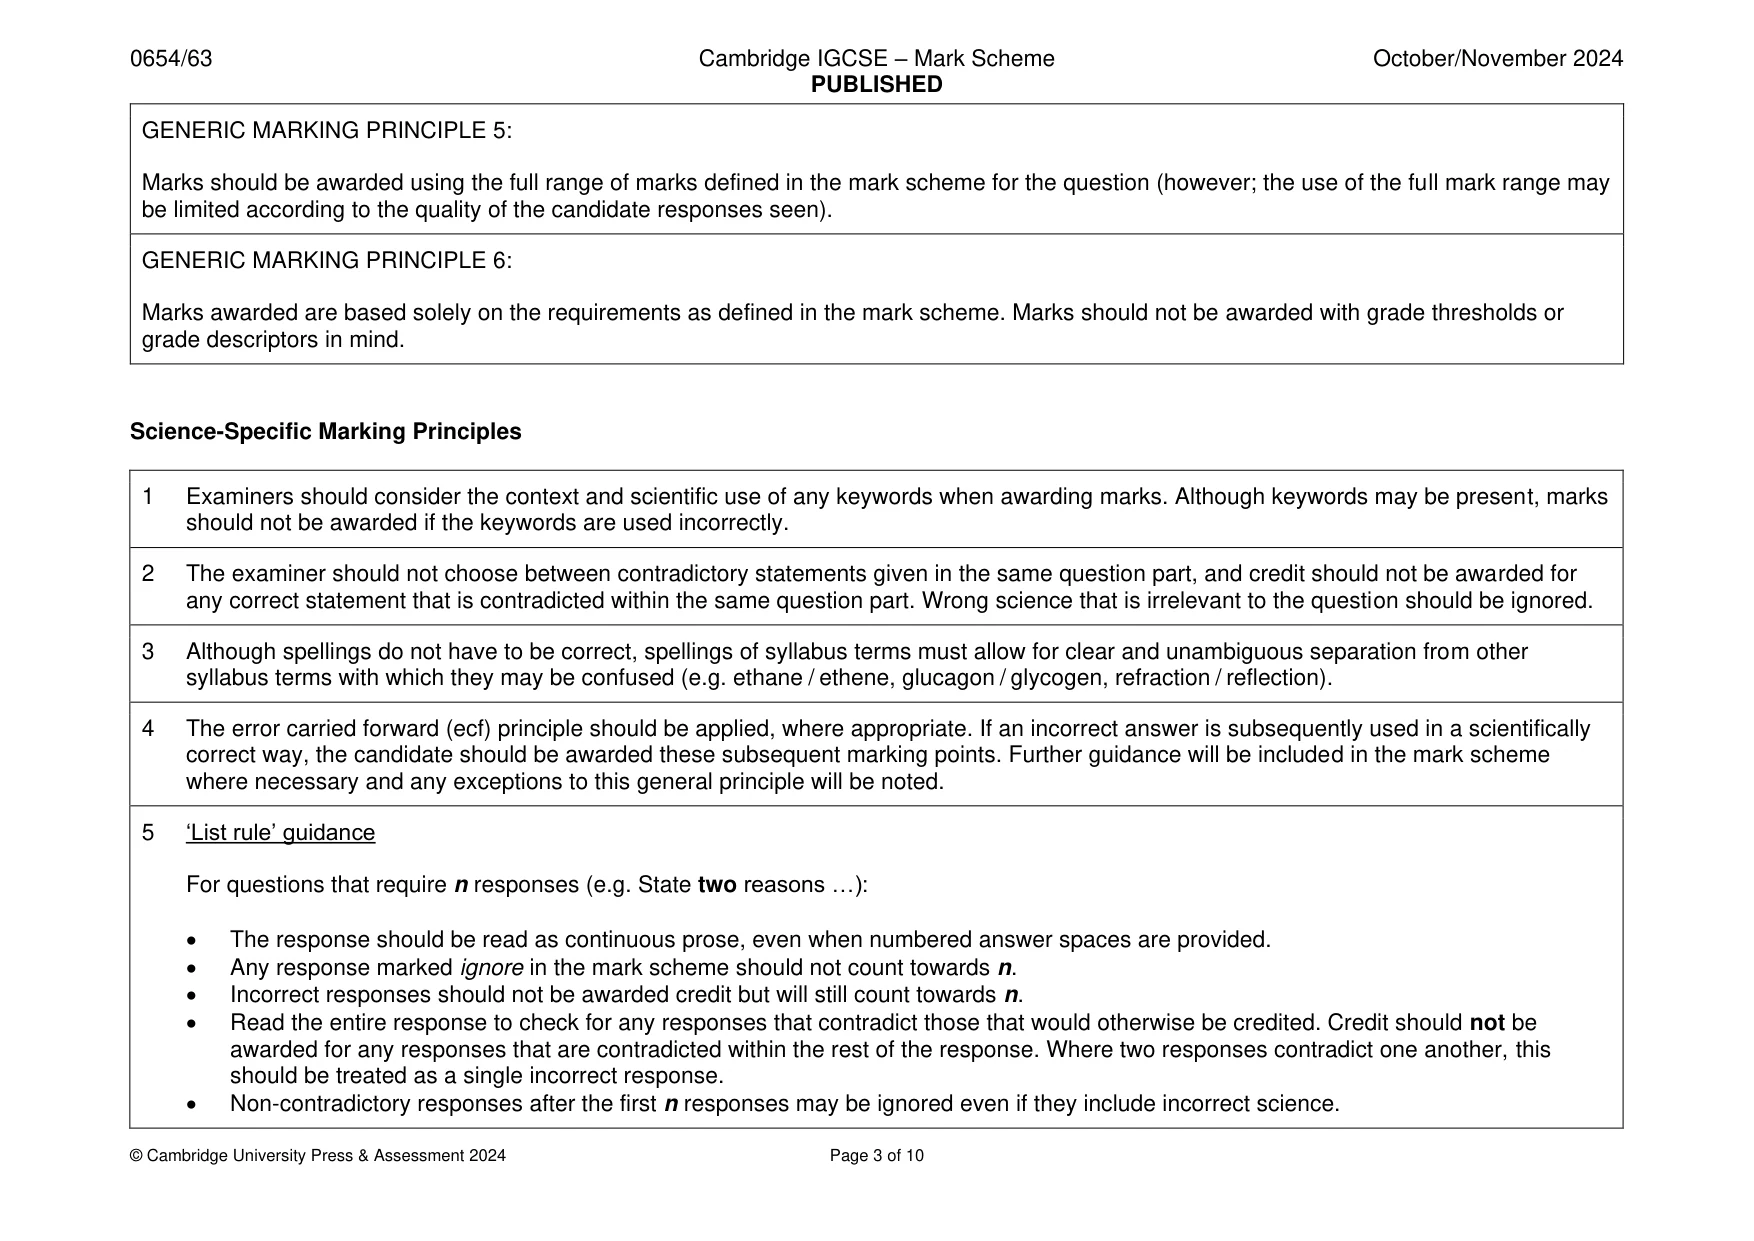
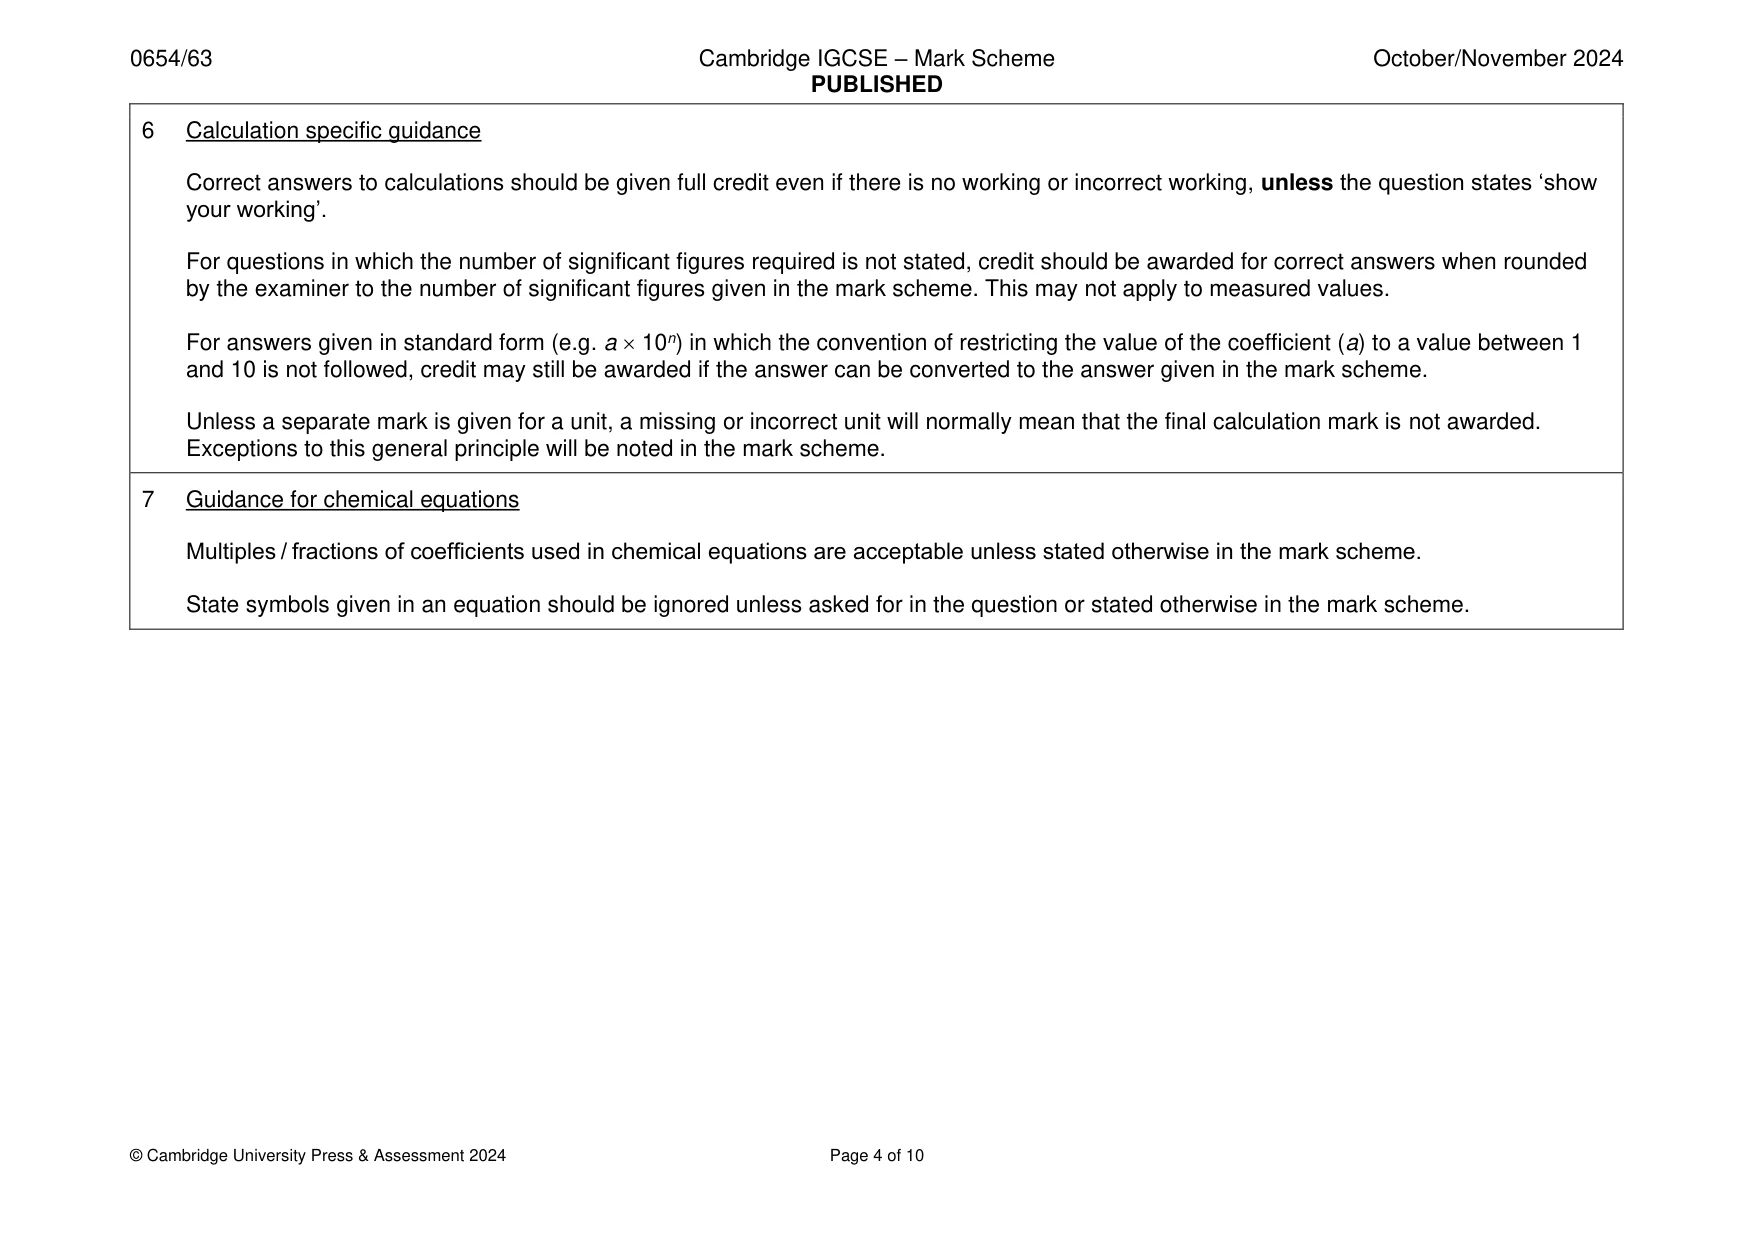
Mark scheme: Question Answer Marks 1(a)(i) 38 ; 2 37 ; 1(a)(ii) (–)2 and (–)3 ; 2 – sign against both ; 1(a)(iii) to keep the same surface area; 1 1(a)(iv) water / sugar solution on outside will increase mass / also measuring mass of solution on outside AW ; 1 1(a)(v) (mass of the cylinder has increased because) water has entered the potato ; 1 1(b)(i) axes right way round and labelled with quantity and units ; 3 sensible linear scale and plots cover more than half the grid ; plots correct ± half small square ; 1(b)(ii) best-fit curve ; 1 1(c)(i) reading off graph ; 2 line from 0 to x axis ; 1(c)(ii) no net overall movement of water ; 1
Q2 · A student tests potato and apple for their nutrient content using Benedict’s solution…
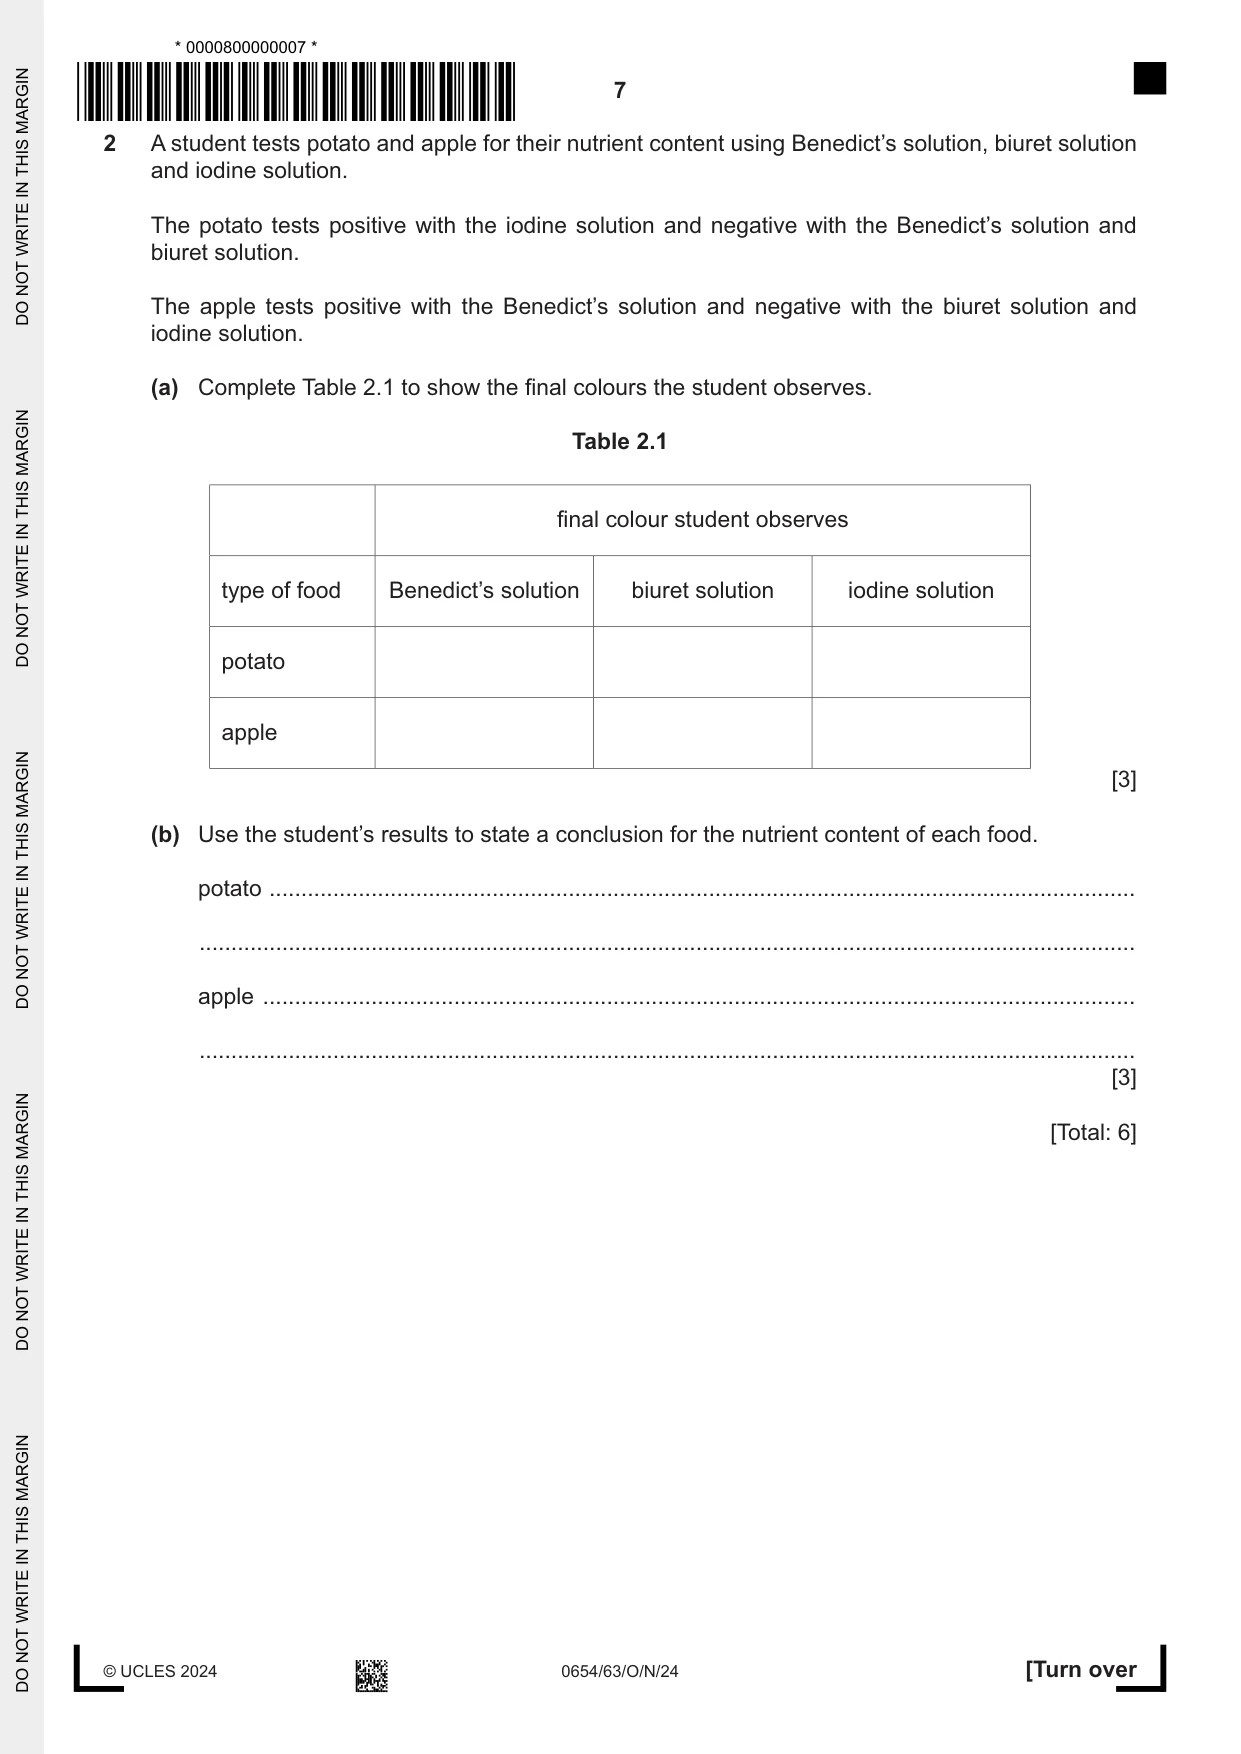
2 A student tests potato and apple for their nutrient content using Benedict’s solution, biuret solution and iodine solution. The potato tests positive with the iodine solution and negative with the Benedict’s solution and biuret solution. The apple tests positive with the Benedict’s solution and negative with the biuret solution and iodine solution. (a) Complete Table 2.1 to show the final colours the student observes. Table 2.1 final colour student observes type of food Benedict’s solution biuret solution iodine solution potato apple [3] (b) Use the student’s results to state a conclusion for the nutrient content of each food. potato ........................................................................................................................................ ................................................................................................................................................... apple ......................................................................................................................................... ................................................................................................................................................... [3] [Total: 6]
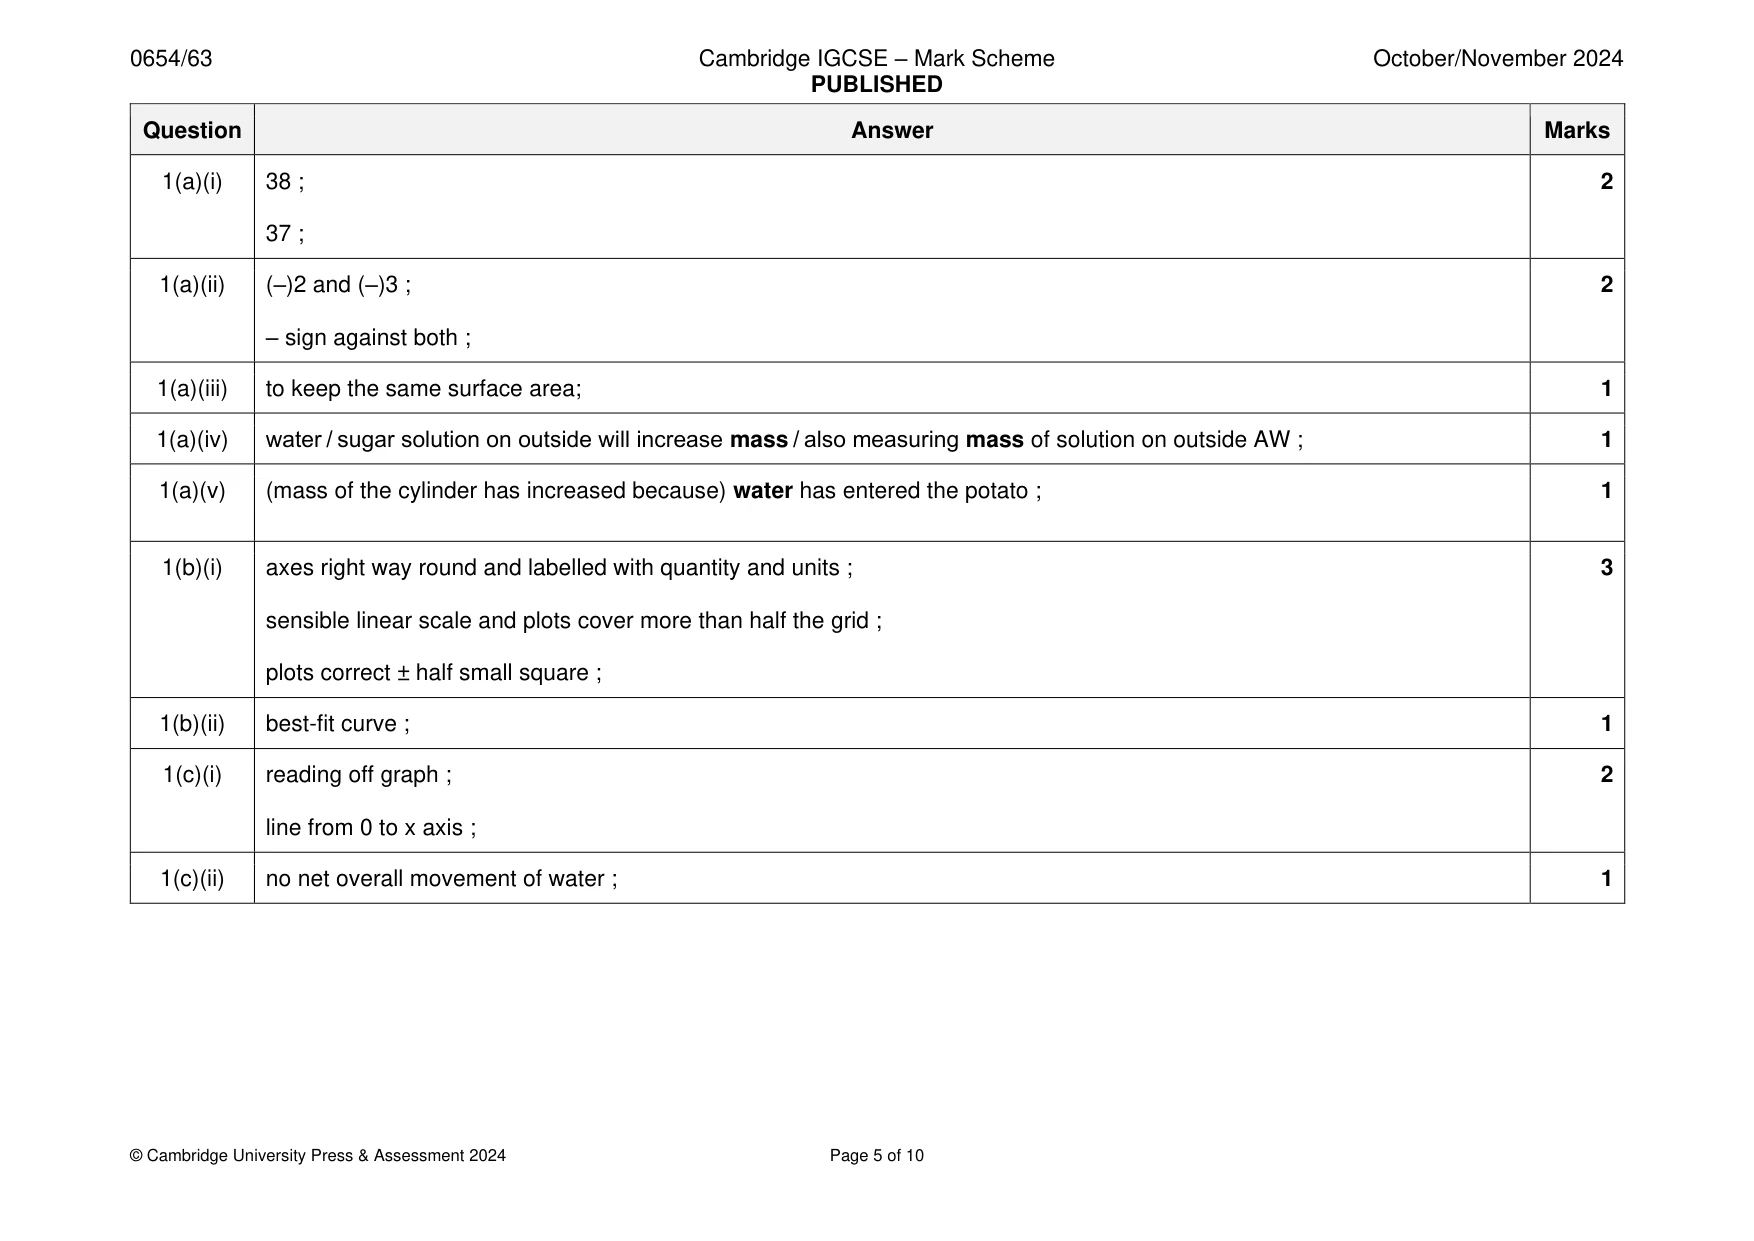
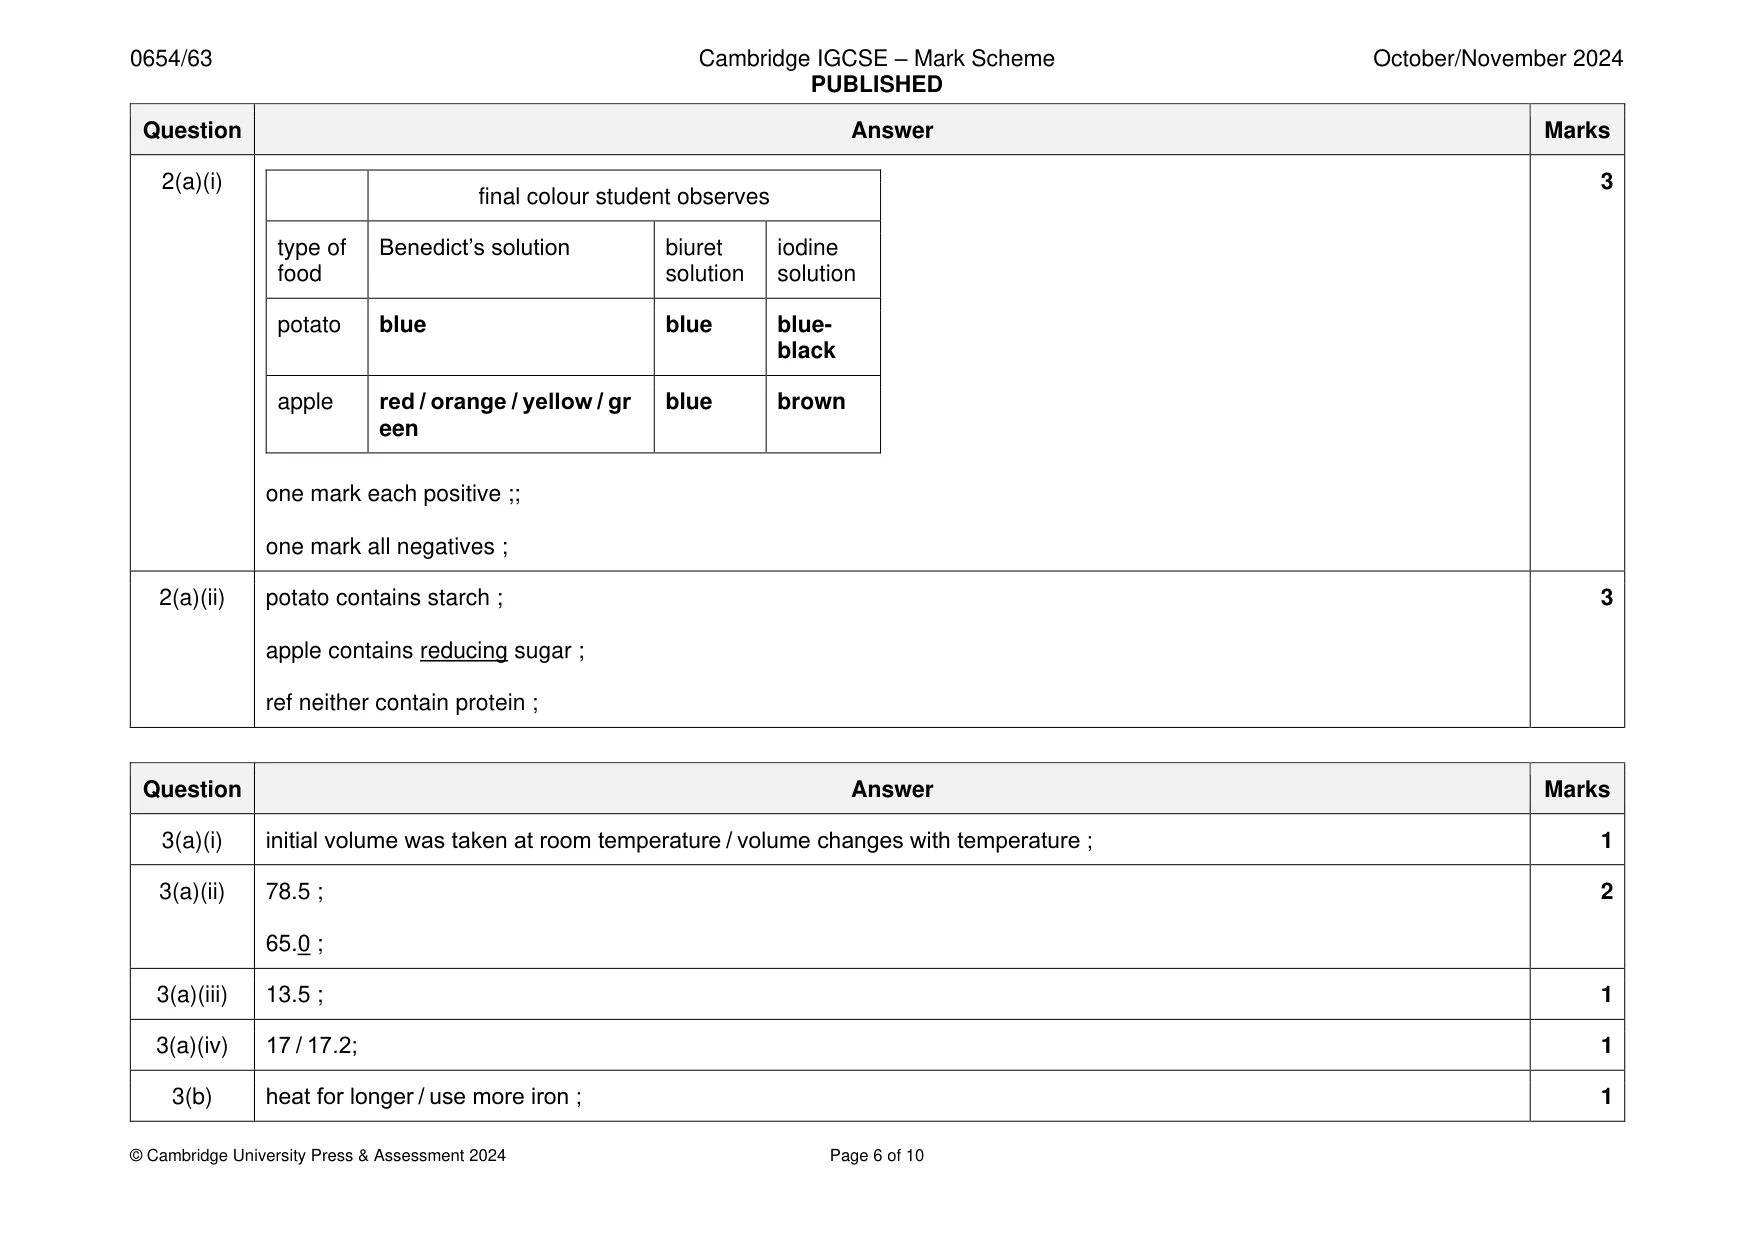
Mark scheme: 2(a)(i) 3 final colour student observes type of Benedict’s solution biuret iodine food solution solution potato blue blue blue- black apple red / orange / yellow / gr blue brown een one mark each positive ;; one mark all negatives ; 2(a)(ii) potato contains starch ; 3 apple contains reducing sugar ; ref neither contain protein ;
Q3 · A student investigates the composition of air
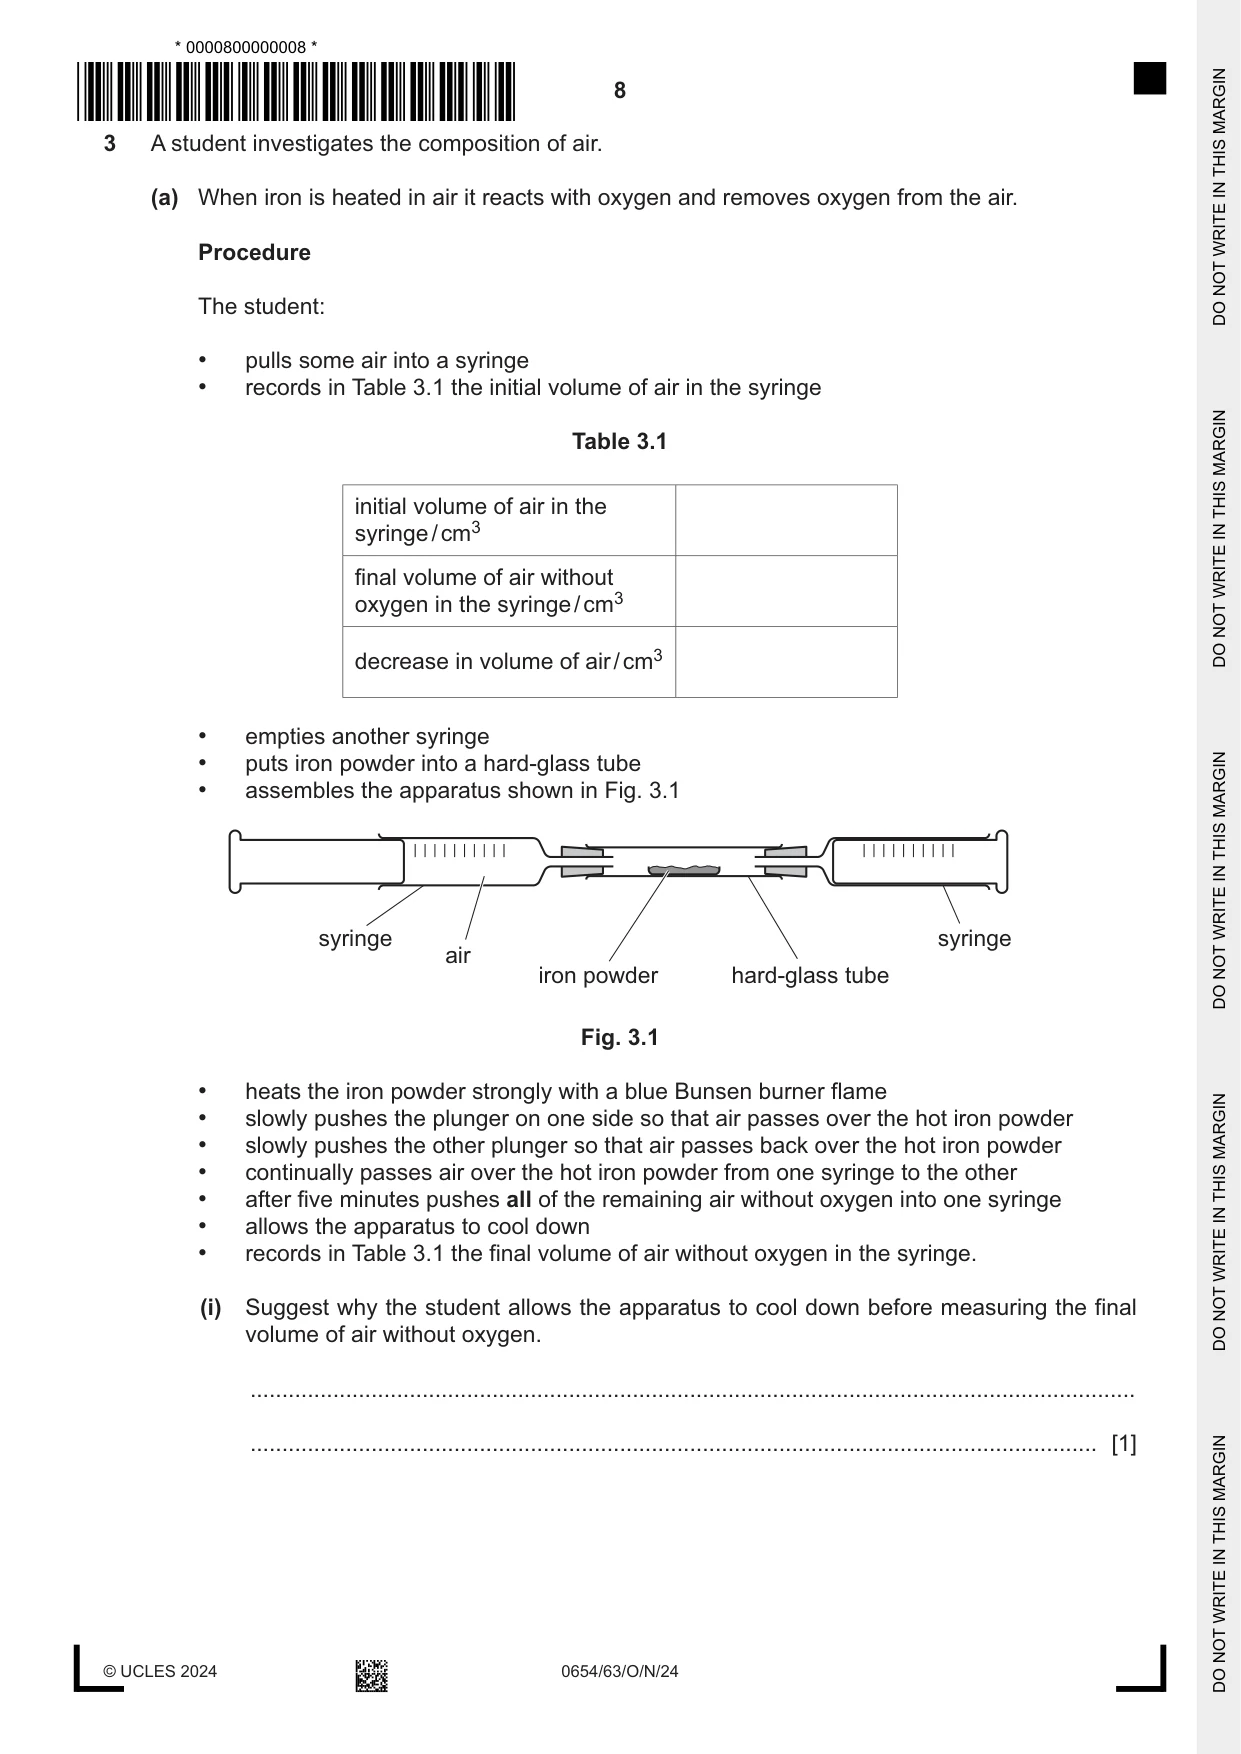
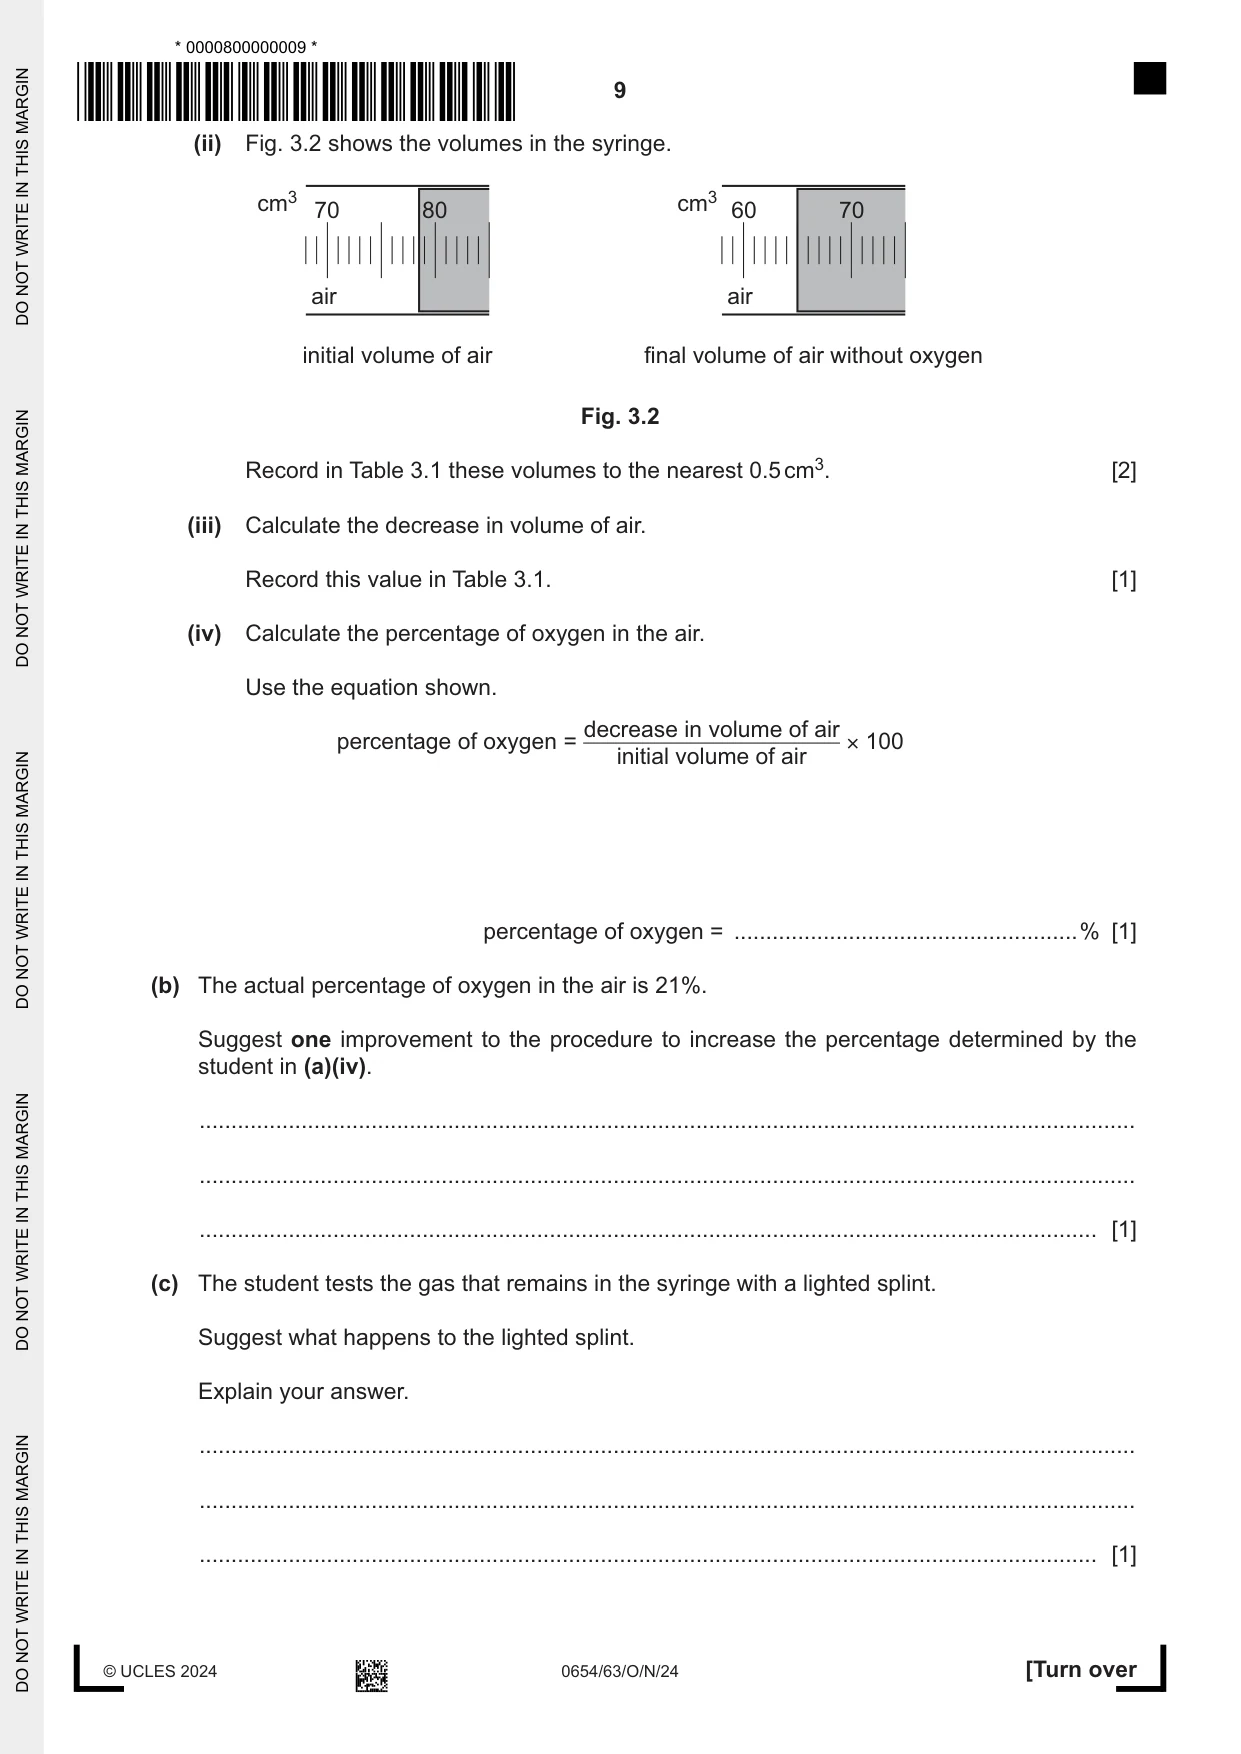
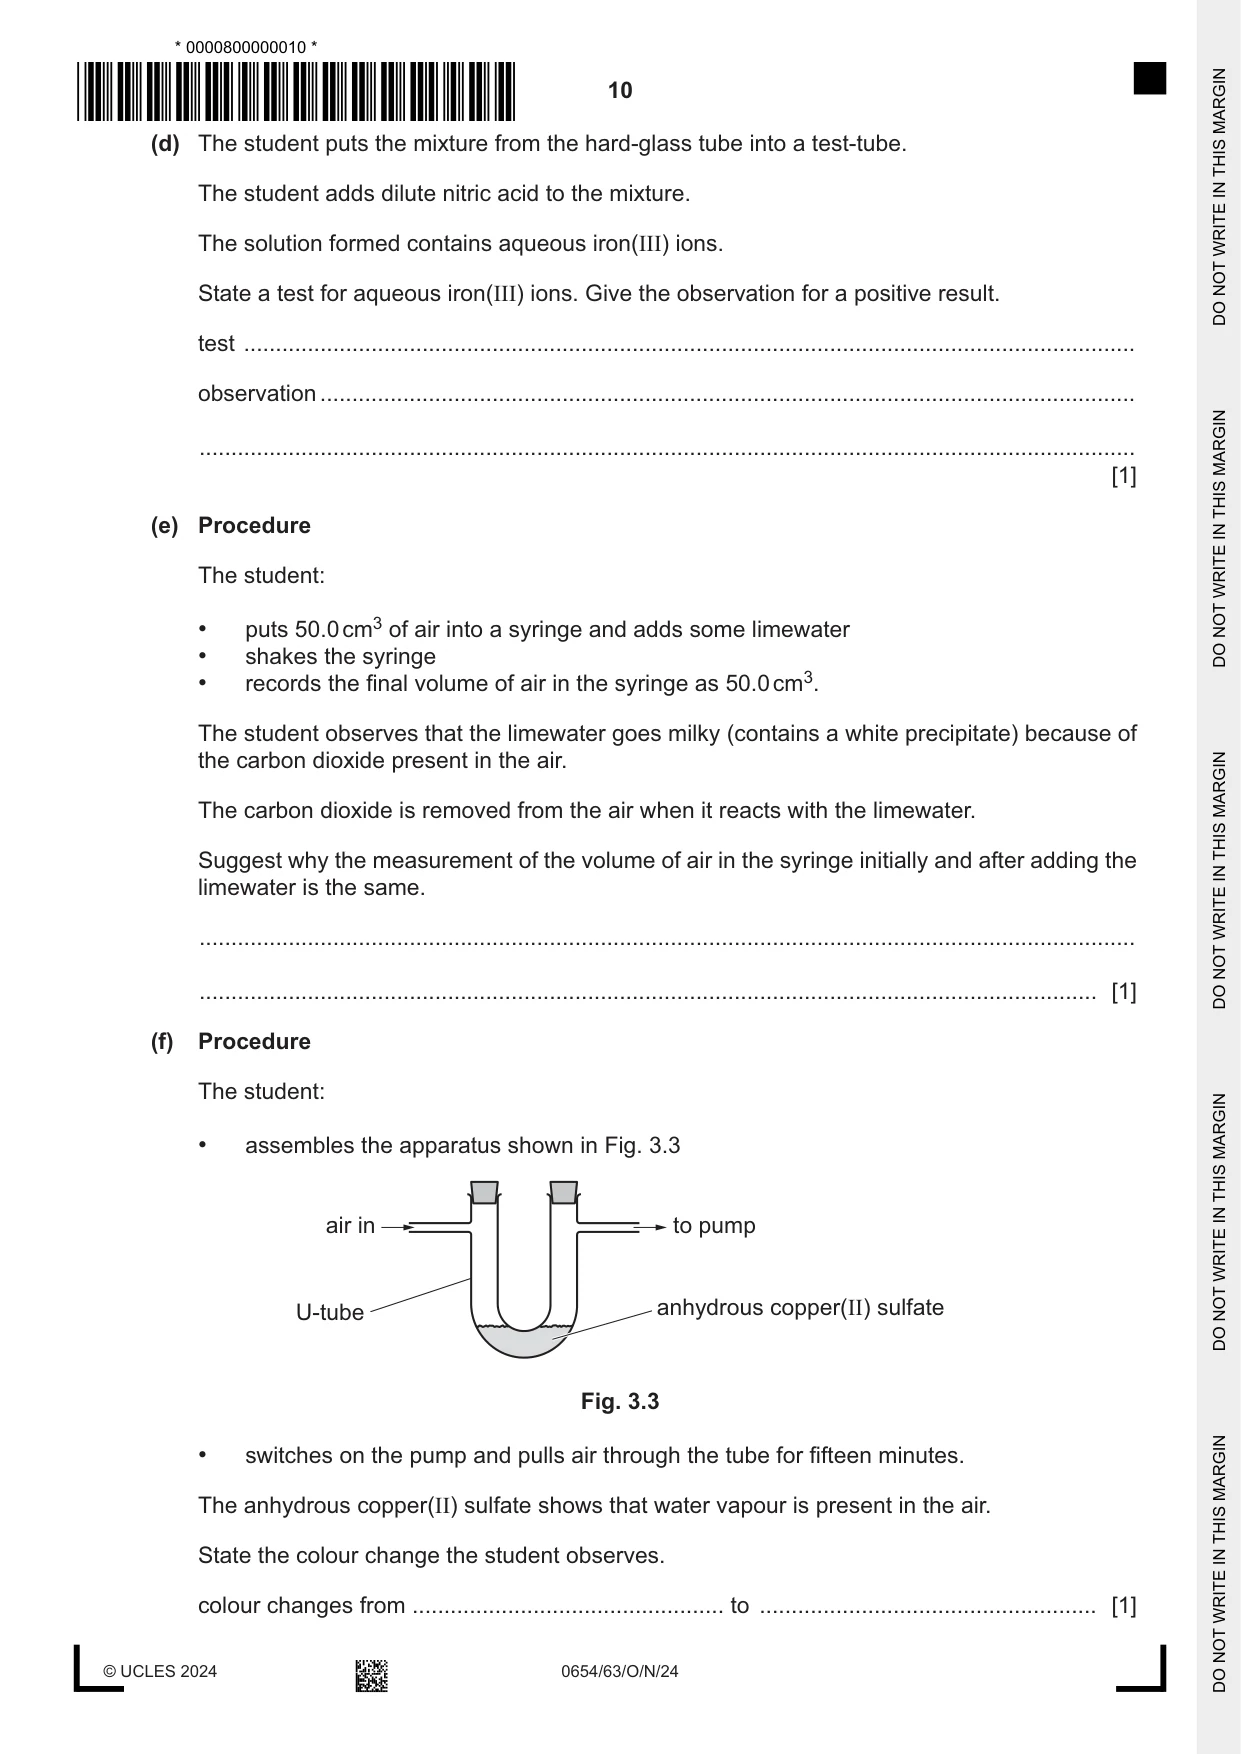
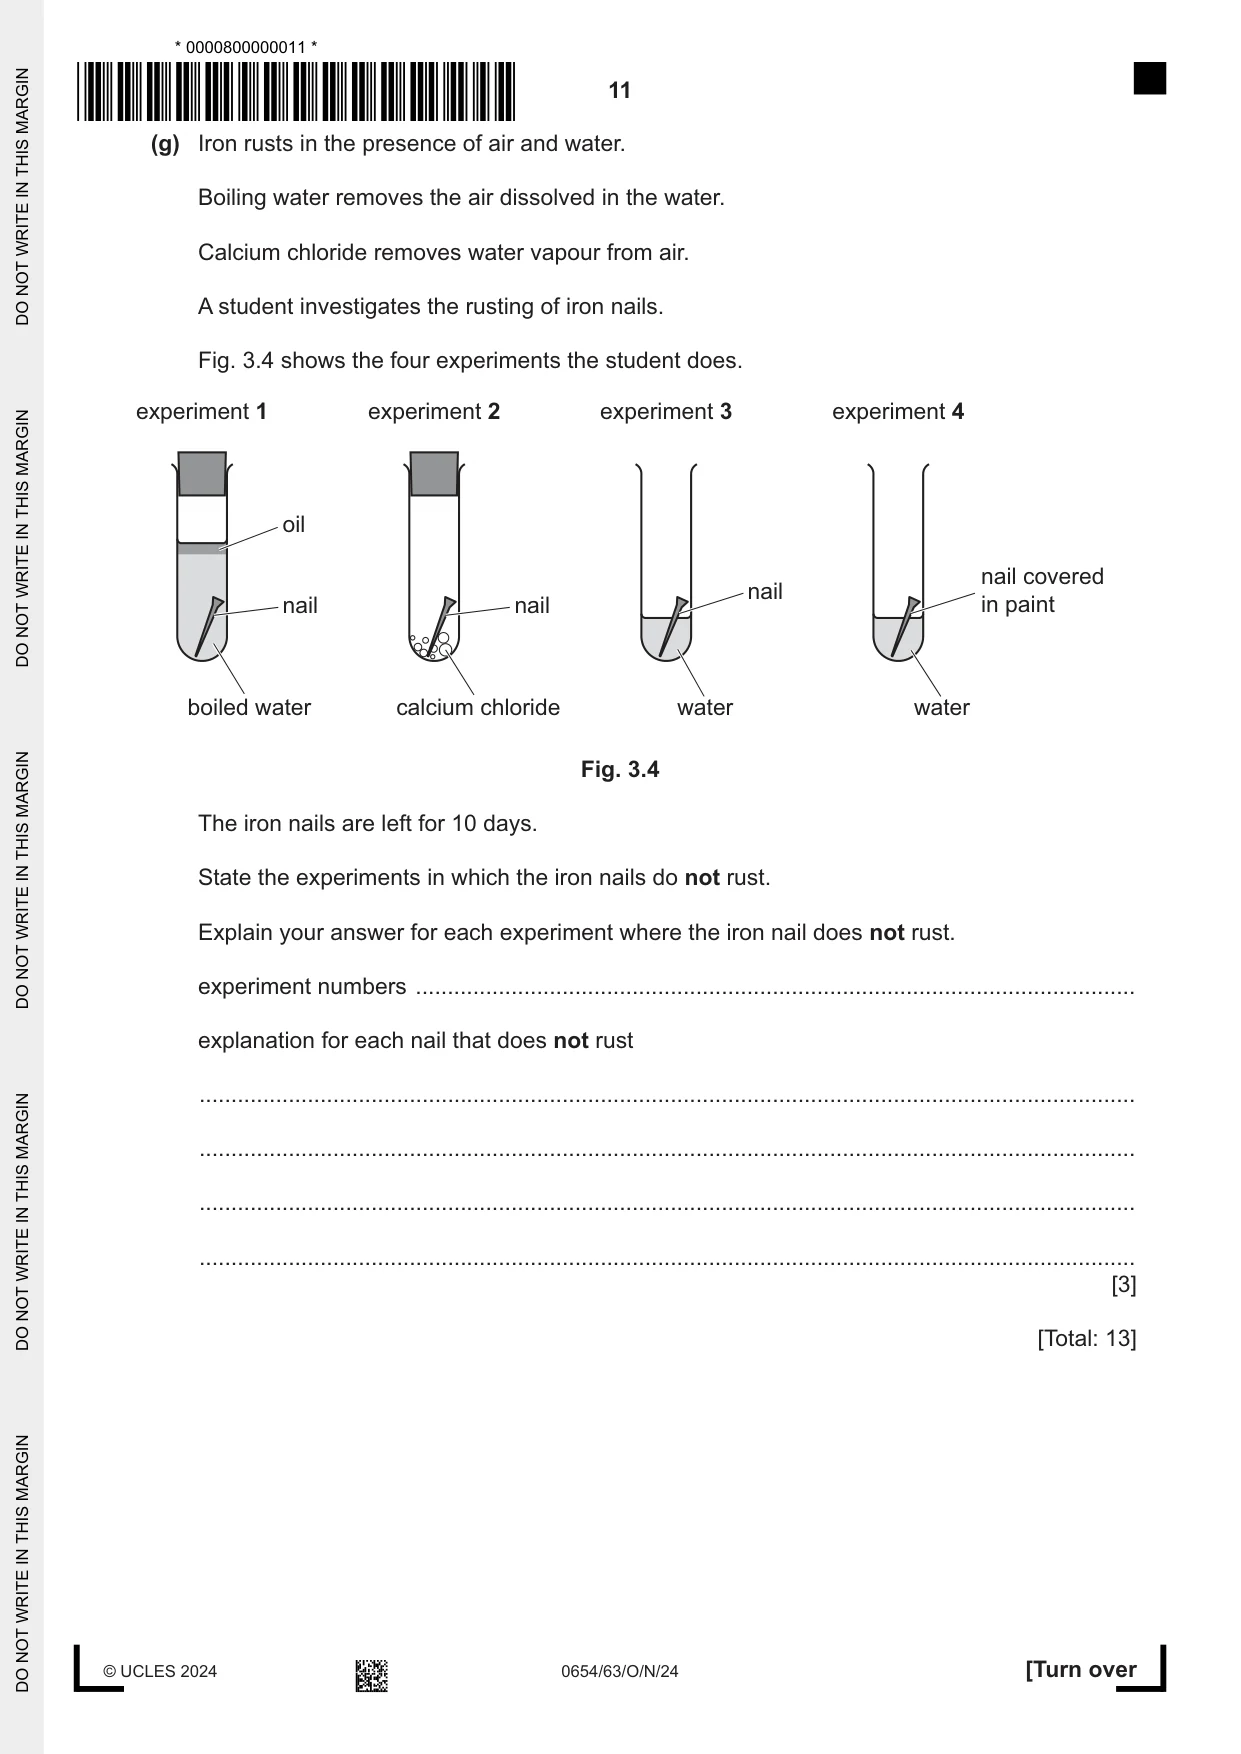
3 A student investigates the composition of air. (a) When iron is heated in air it reacts with oxygen and removes oxygen from the air. Procedure The student: • pulls some air into a syringe • records in Table 3.1 the initial volume of air in the syringe Table 3.1 initial volume of air in the syringe / cm3 final volume of air without oxygen in the syringe / cm3 decrease in volume of air / cm3 • empties another syringe • puts iron powder into a hard-glass tube • assembles the apparatus shown in Fig. 3.1 syringe syringe air iron powder hard-glass tube Fig. 3.1 • heats the iron powder strongly with a blue Bunsen burner flame • slowly pushes the plunger on one side so that air passes over the hot iron powder • slowly pushes the other plunger so that air passes back over the hot iron powder • continually passes air over the hot iron powder from one syringe to the other • after five minutes pushes all of the remaining air without oxygen into one syringe • allows the apparatus to cool down • records in Table 3.1 the final volume of air without oxygen in the syringe. (i) Suggest why the student allows the apparatus to cool down before measuring the final volume of air without oxygen. ........................................................................................................................................... ..................................................................................................................................... [1] (ii) Fig. 3.2 shows the volumes in the syringe. cm3 cm3 70 80 60 70 air air initial volume of air final volume of air without oxygen Fig. 3.2 Record in Table 3.1 these volumes to the nearest 0.5 cm3. [2] (iii) Calculate the decrease in volume of air. Record this value in Table 3.1. [1] (iv) Calculate the percentage of oxygen in the air. Use the equation shown. decrease in volume of air percentage of oxygen = × 100 initial volume of air percentage of oxygen = ......................................................% [1] (b) The actual percentage of oxygen in the air is 21%. Suggest one improvement to the procedure to increase the percentage determined by the student in (a)(iv). ................................................................................................................................................... ................................................................................................................................................... ............................................................................................................................................. [1] (c) The student tests the gas that remains in the syringe with a lighted splint. Suggest what happens to the lighted splint. Explain your answer. ................................................................................................................................................... ................................................................................................................................................... ............................................................................................................................................. [1] (d) The student puts the mixture from the hard-glass tube into a test-tube. The student adds dilute nitric acid to the mixture. The solution formed contains aqueous iron(III) ions. State a test for aqueous iron(III) ions. Give the observation for a positive result. test ............................................................................................................................................ observation ................................................................................................................................ ................................................................................................................................................... [1] (e) Procedure The student: • puts 50.0 cm3 of air into a syringe and adds some limewater • shakes the syringe • records the final volume of air in the syringe as 50.0 cm3. The student observes that the limewater goes milky (contains a white precipitate) because of the carbon dioxide present in the air. The carbon dioxide is removed from the air when it reacts with the limewater. Suggest why the measurement of the volume of air in the syringe initially and after adding the limewater is the same. ................................................................................................................................................... ............................................................................................................................................. [1] (f) Procedure The student: • assembles the apparatus shown in Fig. 3.3 air in to pump U-tube anhydrous copper(II) sulfate Fig. 3.3 • switches on the pump and pulls air through the tube for fifteen minutes. The anhydrous copper(II) sulfate shows that water vapour is present in the air. State the colour change the student observes. colour changes from ................................................. to ..................................................... [1] (g) Iron rusts in the presence of air and water. Boiling water removes the air dissolved in the water. Calcium chloride removes water vapour from air. A student investigates the rusting of iron nails. Fig. 3.4 shows the four experiments the student does. experiment 1 experiment 2 experiment 3 experiment 4 oil nail covered nail nail nail in paint boiled water calcium chloride water water Fig. 3.4 The iron nails are left for 10 days. State the experiments in which the iron nails do not rust. Explain your answer for each experiment where the iron nail does not rust. experiment numbers ................................................................................................................. explanation for each nail that does not rust ................................................................................................................................................... ................................................................................................................................................... ................................................................................................................................................... ................................................................................................................................................... [3] [Total: 13]
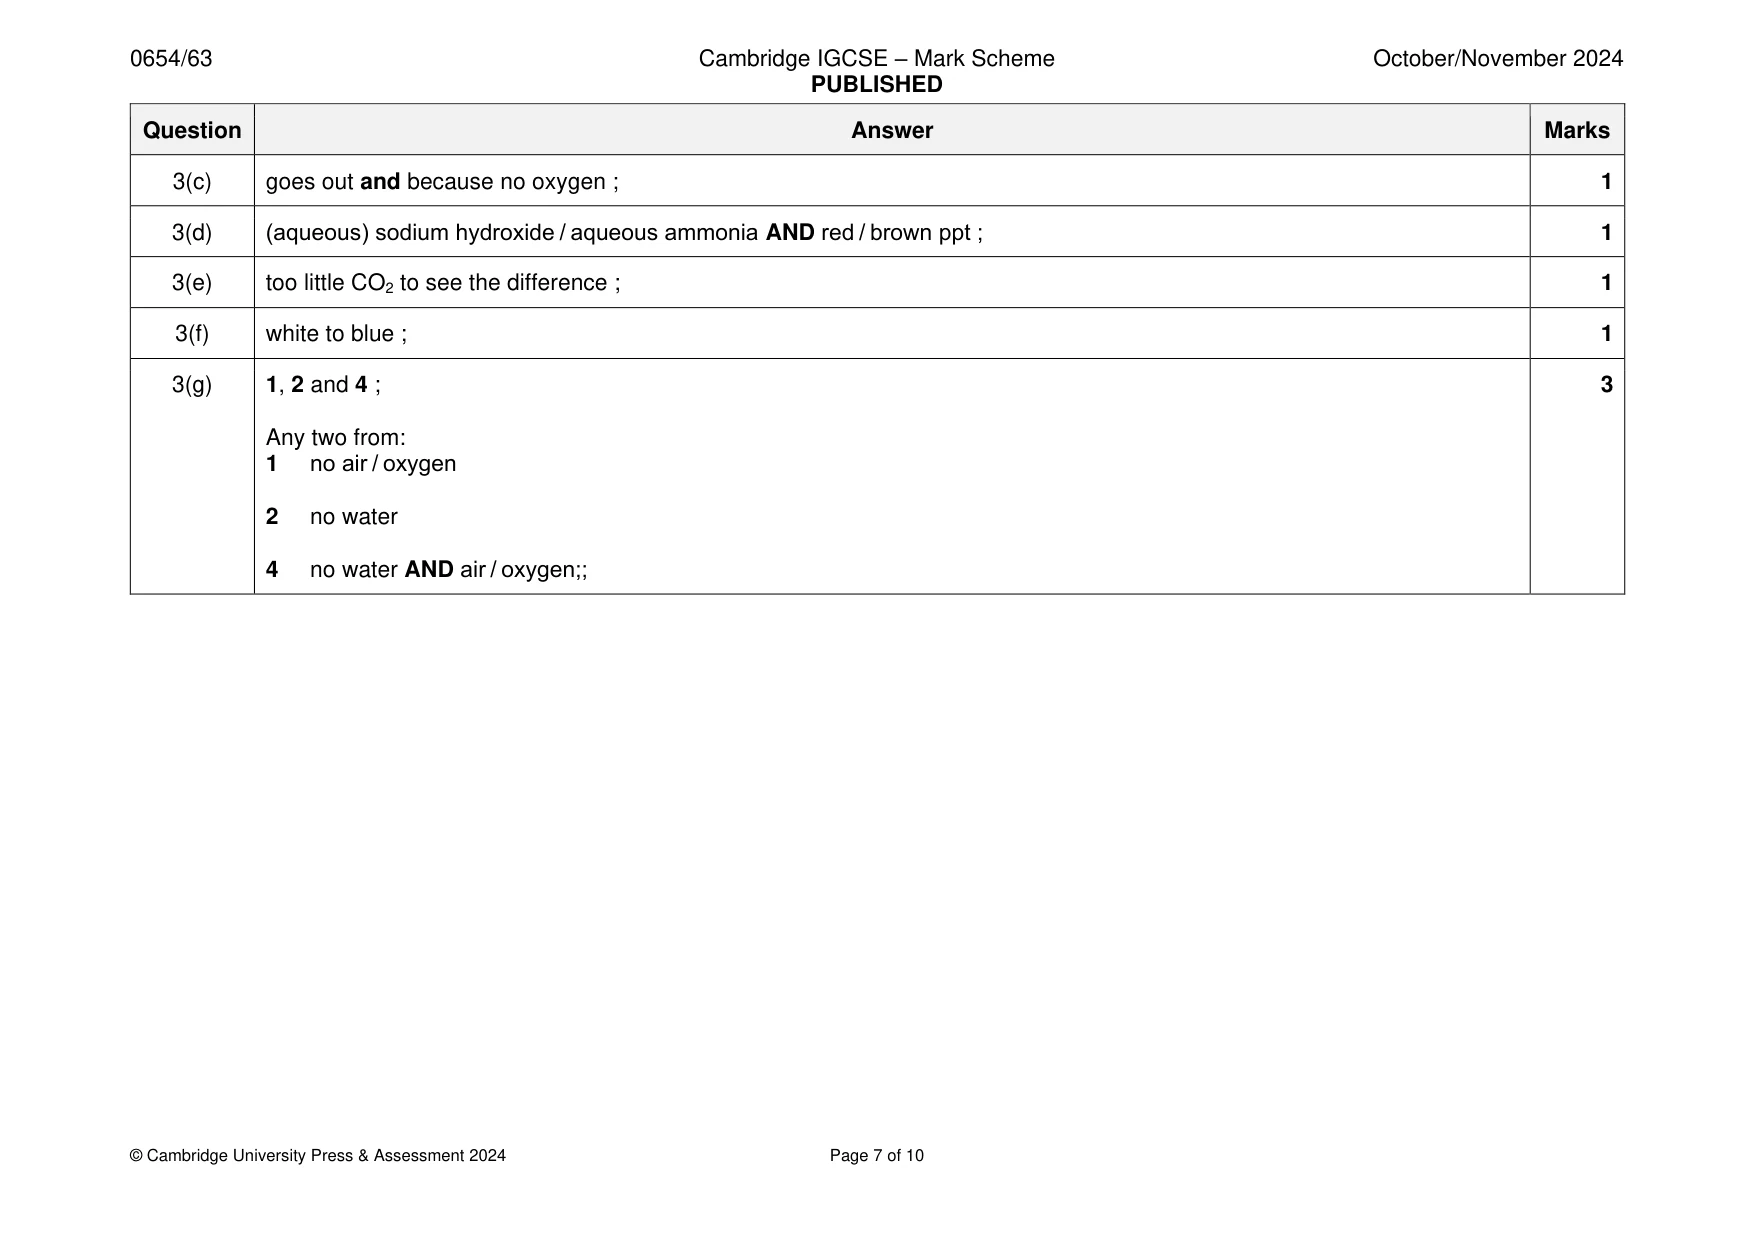
Mark scheme: 3(a)(i) initial volume was taken at room temperature / volume changes with temperature ; 1 3(a)(ii) 78.5 ; 2 65.0 ; 3(a)(iii) 13.5 ; 1 3(a)(iv) 17 / 17.2; 1 3(b) heat for longer / use more iron ; 1 3(c) goes out and because no oxygen ; 1 3(d) (aqueous) sodium hydroxide / aqueous ammonia AND red / brown ppt ; 1 3(e) too little CO2 to see the difference ; 1 3(f) white to blue ; 1 3(g) 1, 2 and 4 ; 3 Any two from: 1 no air / oxygen 2 no water 4 no water AND air / oxygen;;
Q4 · Rust is a brown solid that forms on the surface of iron
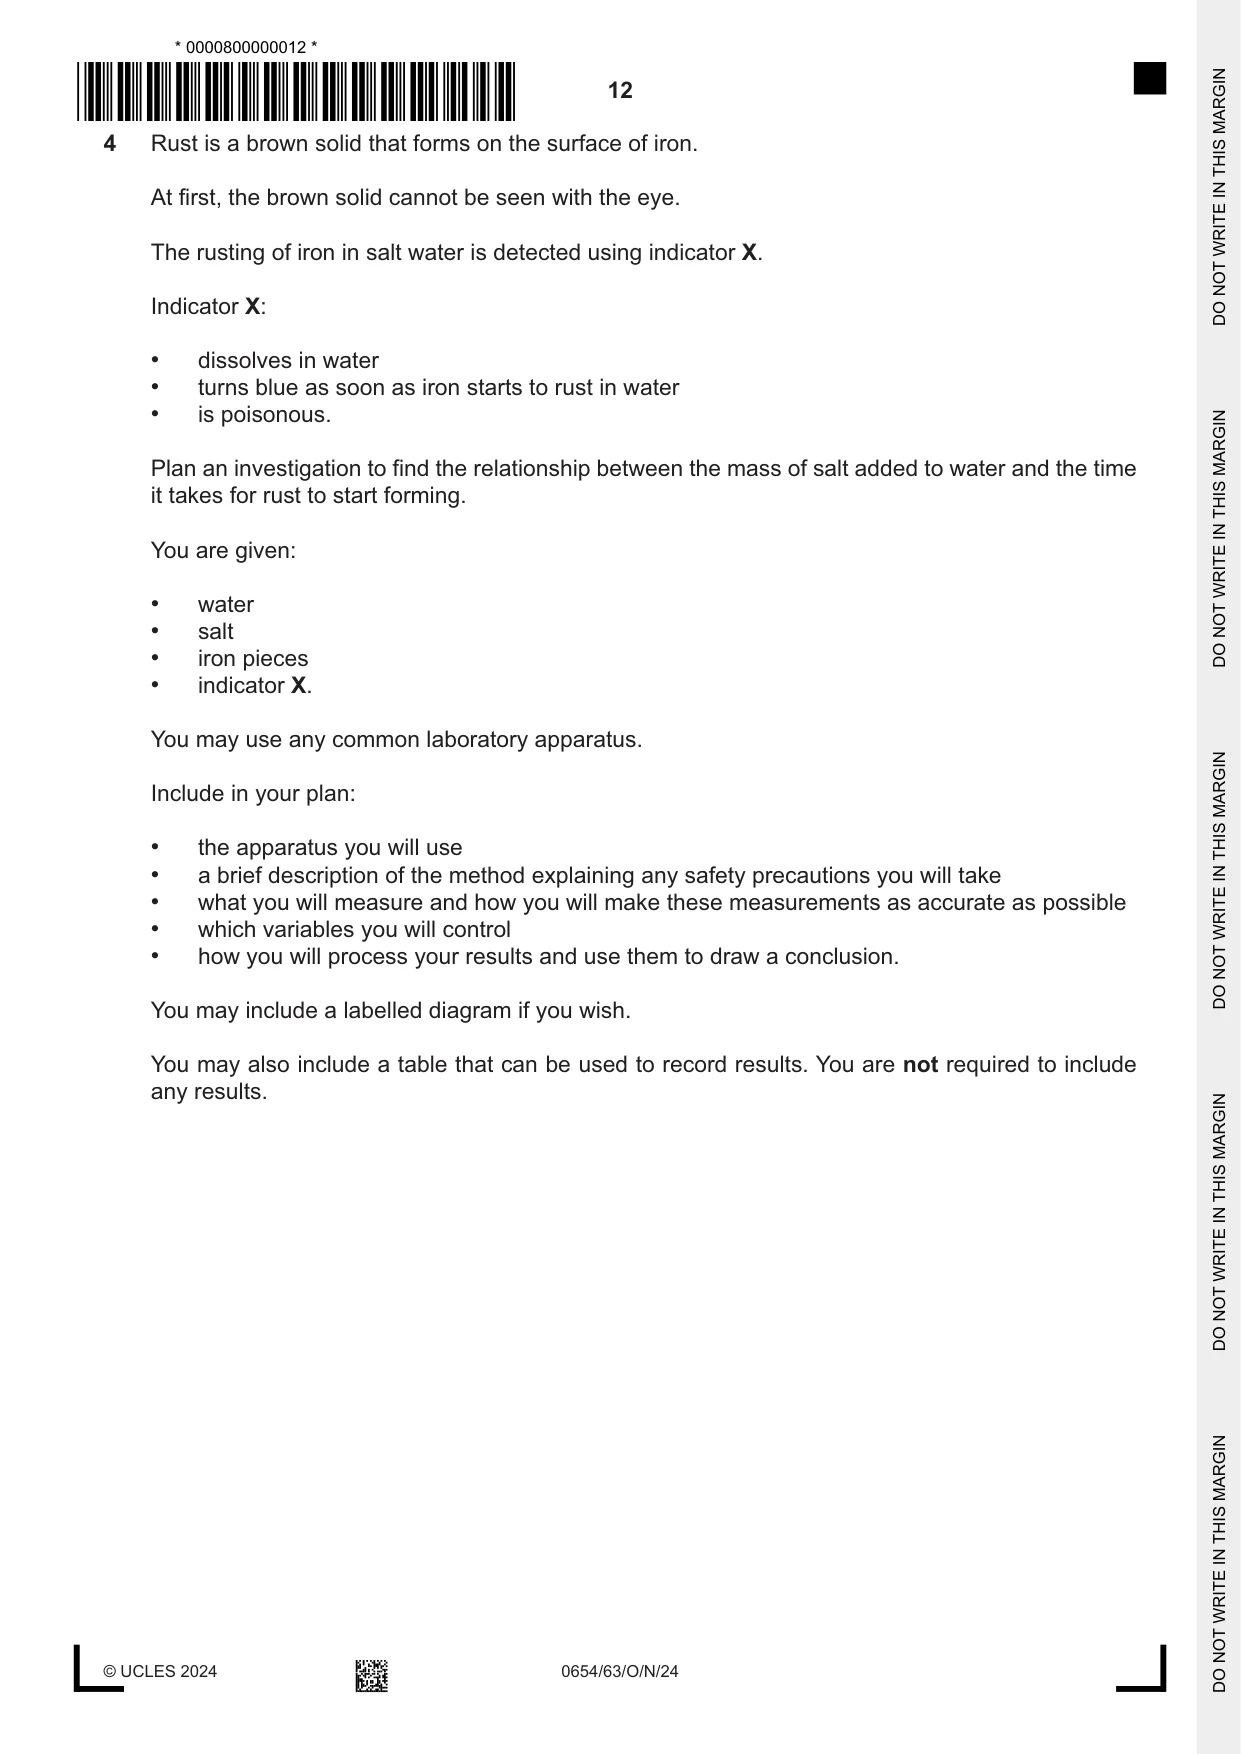
4 Rust is a brown solid that forms on the surface of iron. At first, the brown solid cannot be seen with the eye. The rusting of iron in salt water is detected using indicator X. Indicator X: • dissolves in water • turns blue as soon as iron starts to rust in water • is poisonous. Plan an investigation to find the relationship between the mass of salt added to water and the time it takes for rust to start forming. You are given: • water • salt • iron pieces • indicator X. You may use any common laboratory apparatus. Include in your plan: • the apparatus you will use • a brief description of the method explaining any safety precautions you will take • what you will measure and how you will make these measurements as accurate as possible • which variables you will control • how you will process your results and use them to draw a conclusion. You may include a labelled diagram if you wish. You may also include a table that can be used to record results. You are not required to include any results. .......................................................................................................................................................... .......................................................................................................................................................... .......................................................................................................................................................... .......................................................................................................................................................... .......................................................................................................................................................... .......................................................................................................................................................... .......................................................................................................................................................... .......................................................................................................................................................... .......................................................................................................................................................... .......................................................................................................................................................... .......................................................................................................................................................... .......................................................................................................................................................... .......................................................................................................................................................... .......................................................................................................................................................... .......................................................................................................................................................... .......................................................................................................................................................... .......................................................................................................................................................... .......................................................................................................................................................... .......................................................................................................................................................... .......................................................................................................................................................... .................................................................................................................................................... [7]
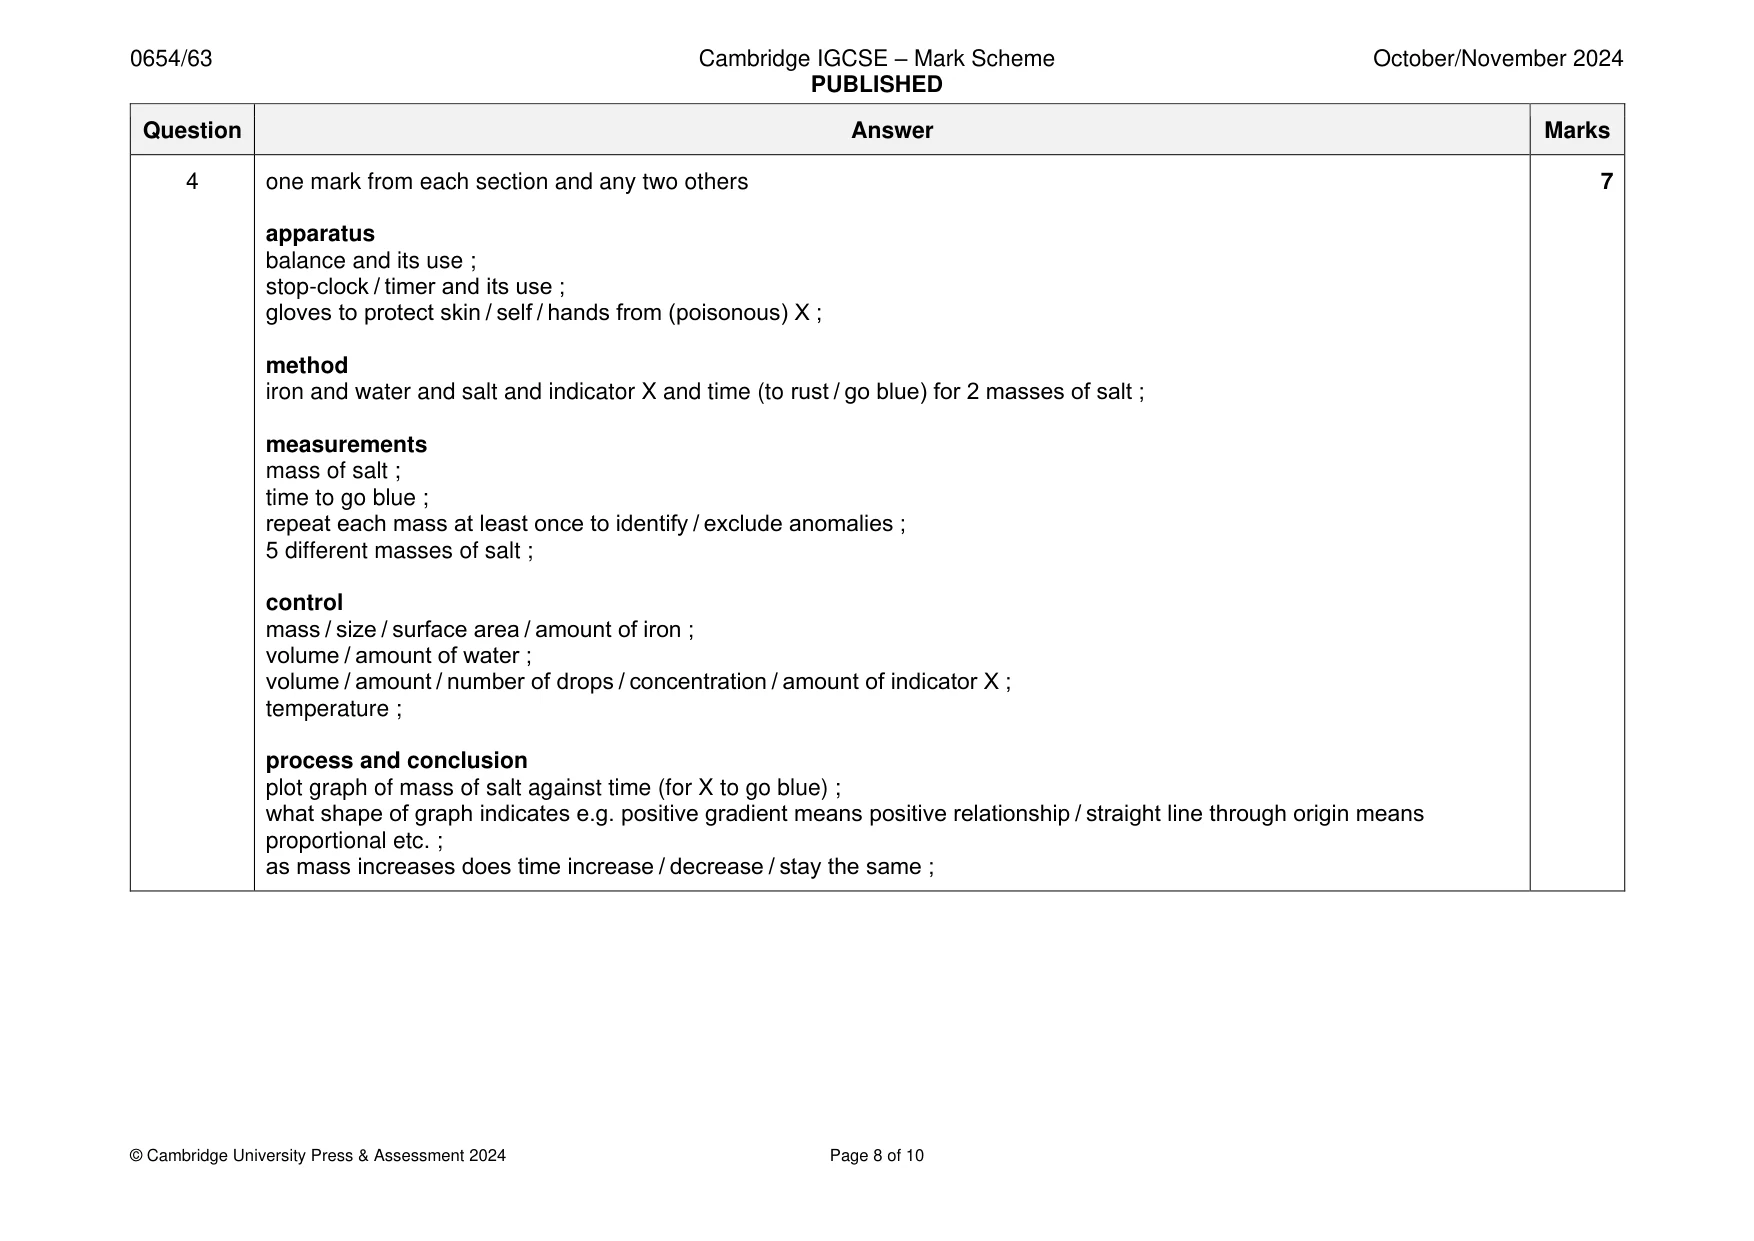
Mark scheme: 4 one mark from each section and any two others 7 apparatus balance and its use ; stop-clock / timer and its use ; gloves to protect skin / self / hands from (poisonous) X ; method iron and water and salt and indicator X and time (to rust / go blue) for 2 masses of salt ; measurements mass of salt ; time to go blue ; repeat each mass at least once to identify / exclude anomalies ; 5 different masses of salt ; control mass / size / surface area / amount of iron ; volume / amount of water ; volume / amount / number of drops / concentration / amount of indicator X ; temperature ; process and conclusion plot graph of mass of salt against time (for X to go blue) ; what shape of graph indicates e.g. positive gradient means positive relationship / straight line through origin means proportional etc. ; as mass increases does time increase / decrease / stay the same ;
Q5 · A student measures the focal length of a converging lens
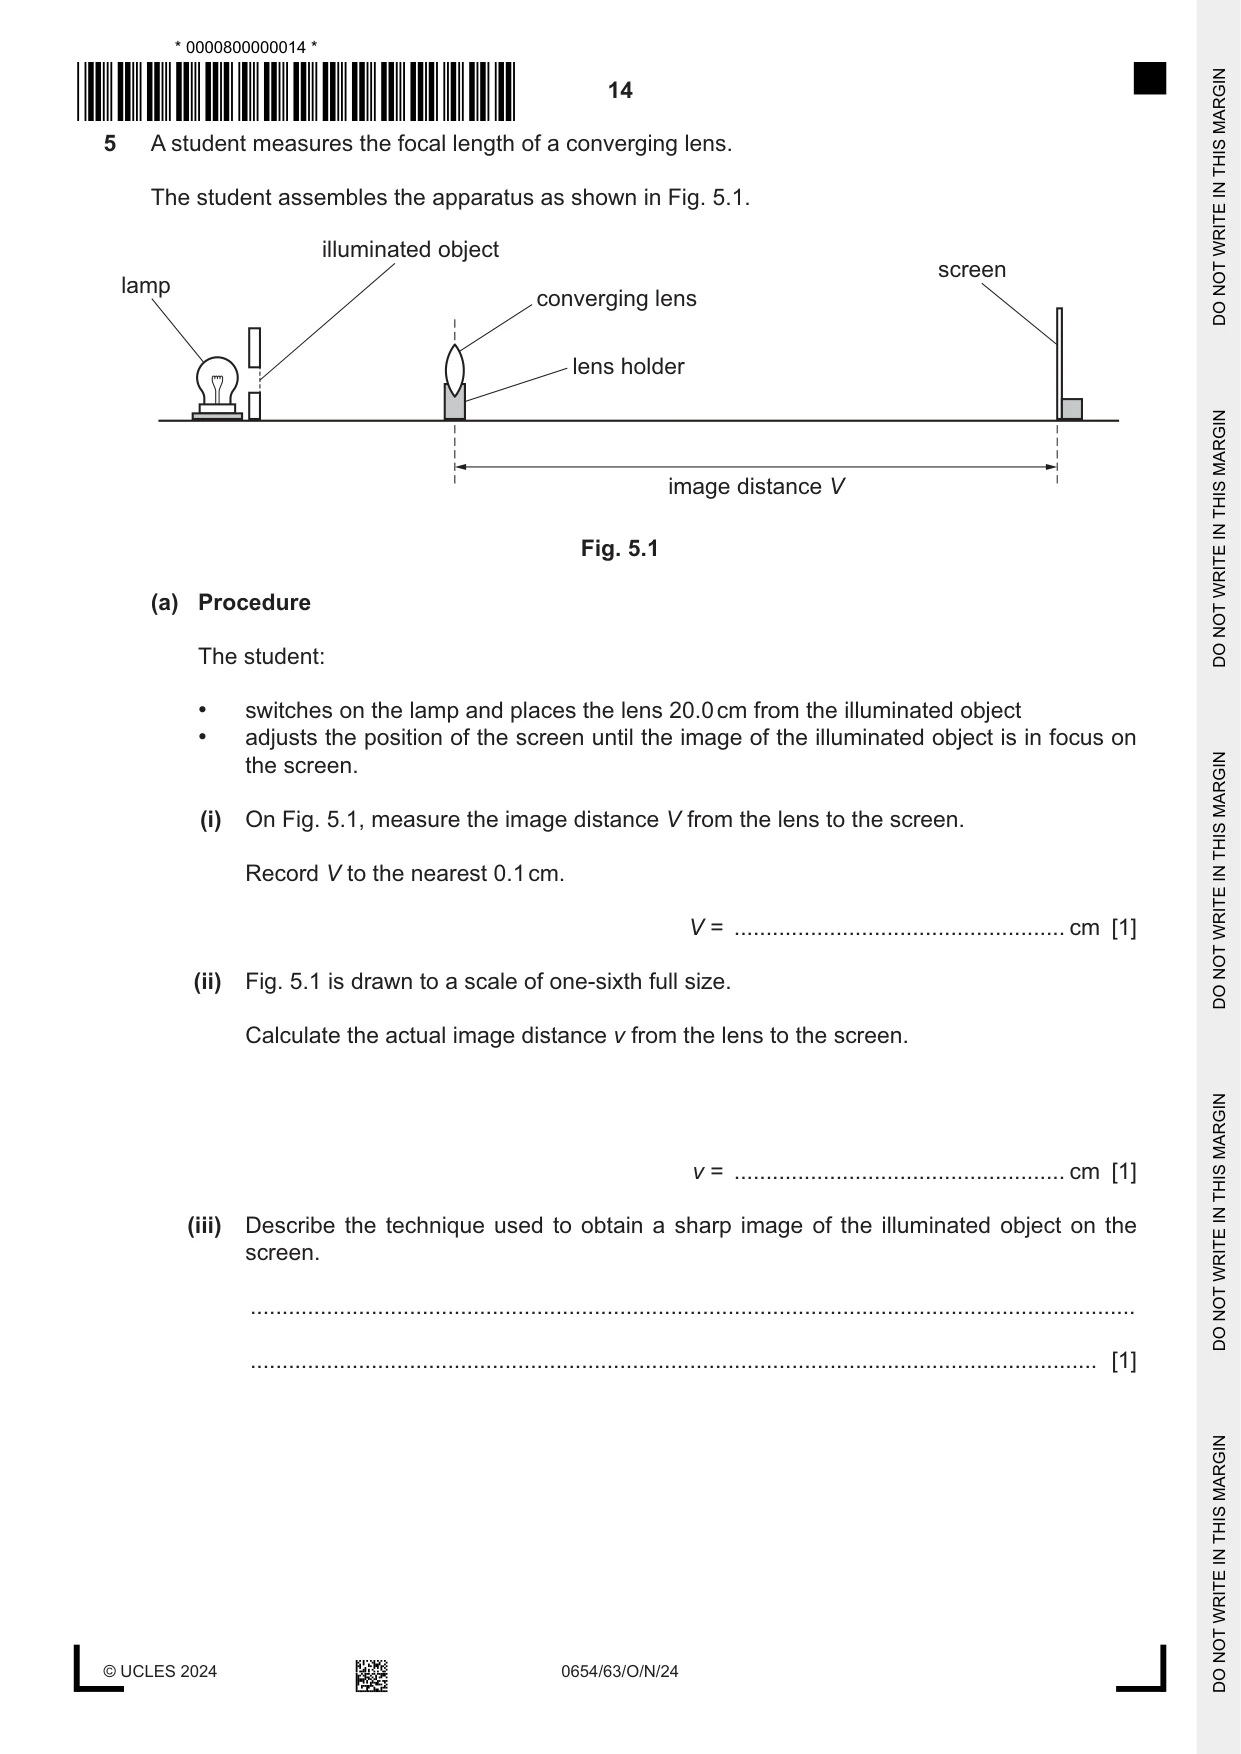
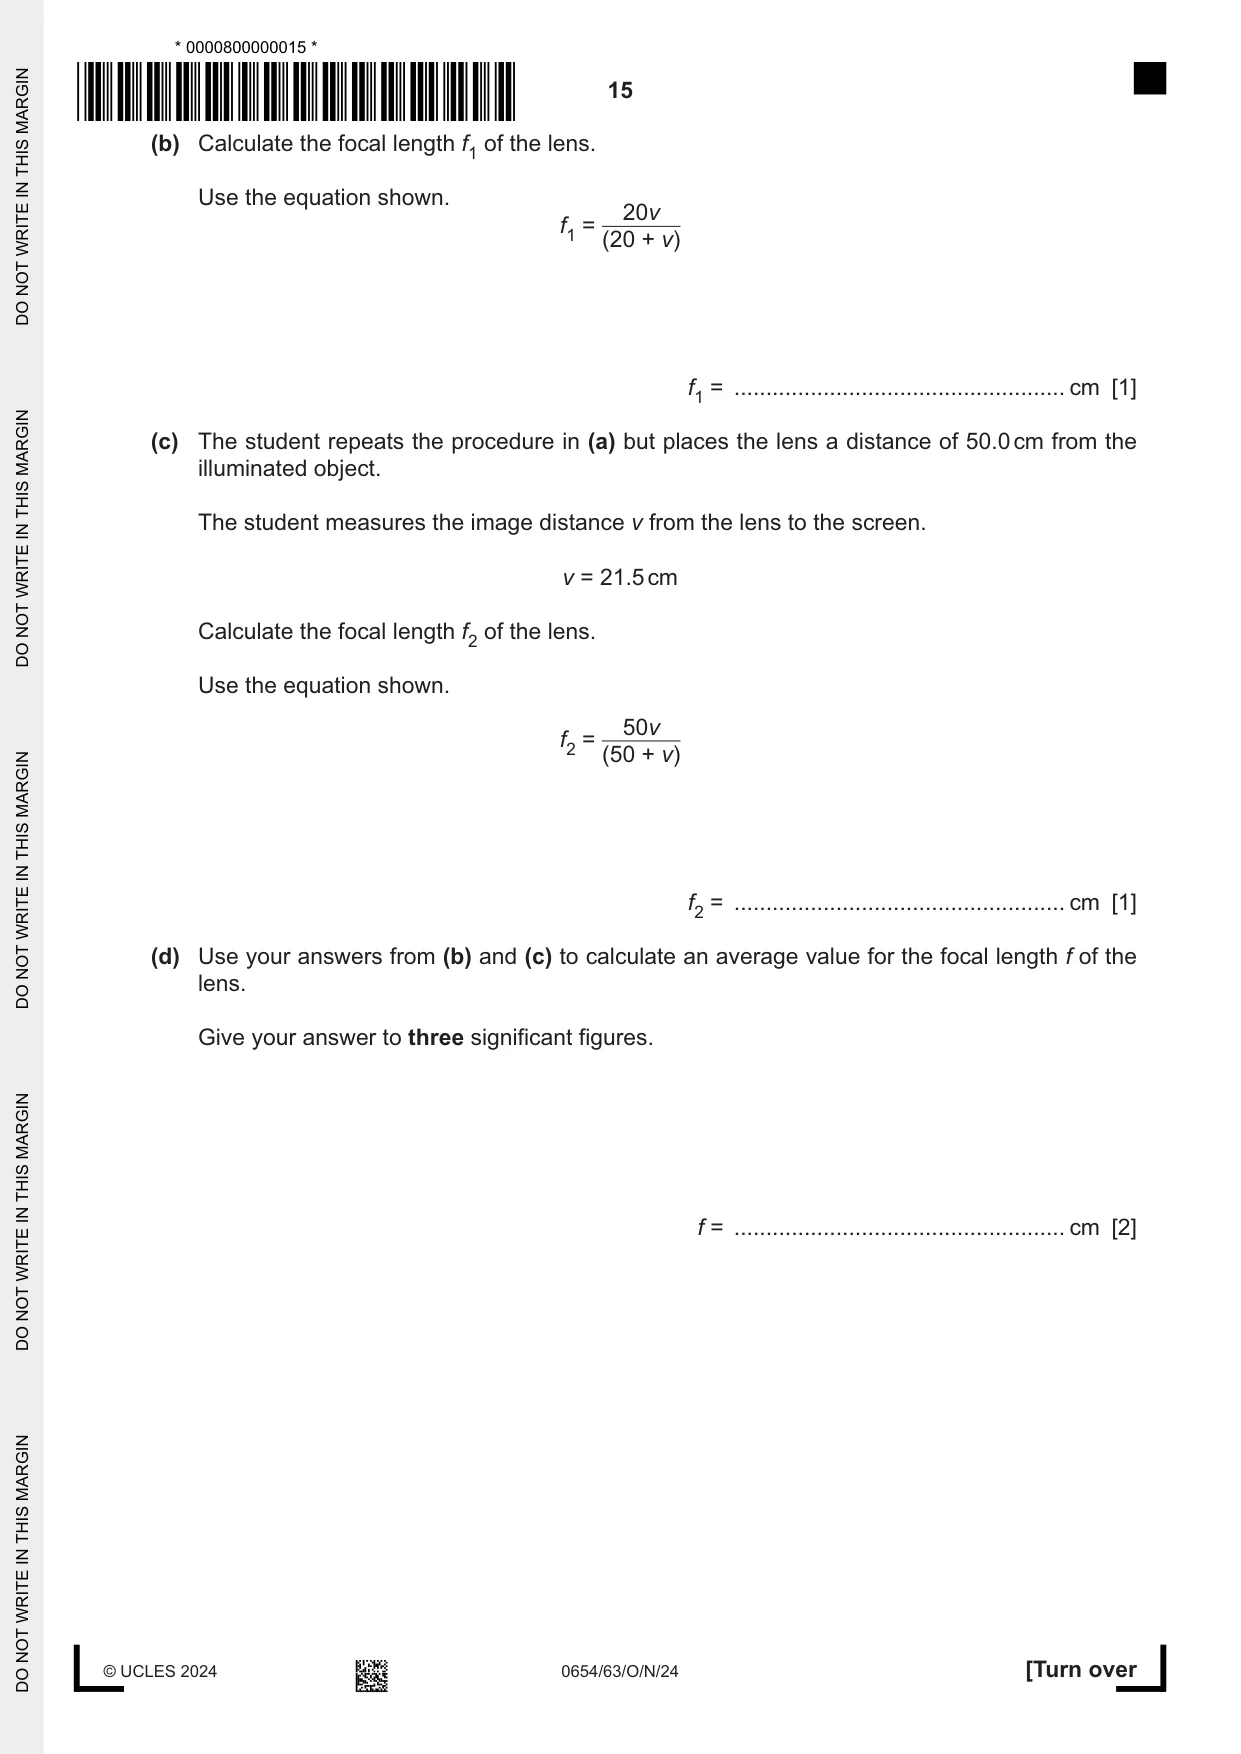
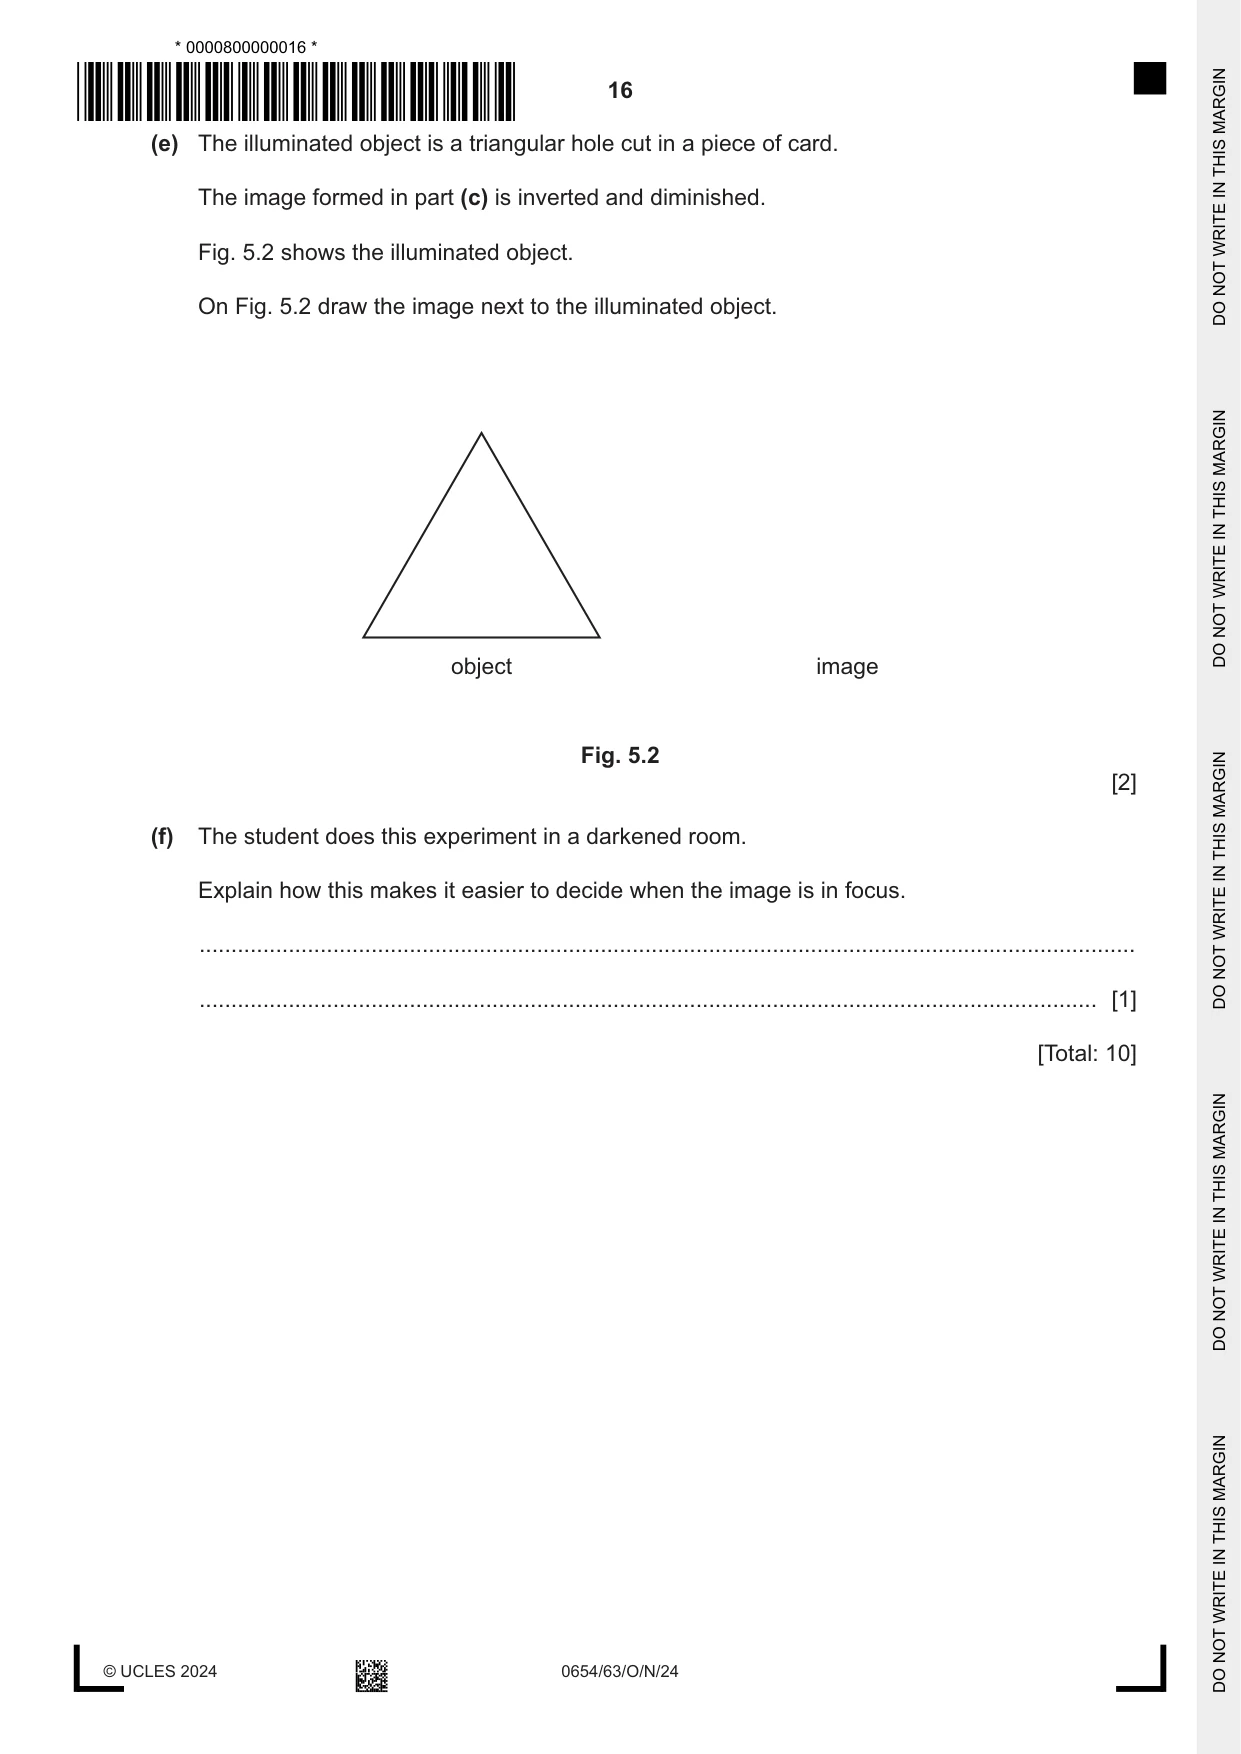
5 A student measures the focal length of a converging lens. The student assembles the apparatus as shown in Fig. 5.1. illuminated object screen lamp converging lens lens holder image distance V Fig. 5.1 (a) Procedure The student: • switches on the lamp and places the lens 20.0 cm from the illuminated object • adjusts the position of the screen until the image of the illuminated object is in focus on the screen. (i) On Fig. 5.1, measure the image distance V from the lens to the screen. Record V to the nearest 0.1 cm. V = .................................................... cm [1] (ii) Fig. 5.1 is drawn to a scale of one-sixth full size. Calculate the actual image distance v from the lens to the screen. v = .................................................... cm [1] (iii) Describe the technique used to obtain a sharp image of the illuminated object on the screen. ........................................................................................................................................... ..................................................................................................................................... [1] (b) Calculate the focal length f1 of the lens. Use the equation shown. 20v f1 = (20 + v) f1 = .................................................... cm [1] (c) The student repeats the procedure in (a) but places the lens a distance of 50.0 cm from the illuminated object. The student measures the image distance v from the lens to the screen. v = 21.5 cm Calculate the focal length f2 of the lens. Use the equation shown. 50v f2 = (50 + v) f2 = .................................................... cm [1] (d) Use your answers from (b) and (c) to calculate an average value for the focal length f of the lens. Give your answer to three significant figures. f = .................................................... cm [2] (e) The illuminated object is a triangular hole cut in a piece of card. The image formed in part (c) is inverted and diminished. Fig. 5.2 shows the illuminated object. On Fig. 5.2 draw the image next to the illuminated object. object image Fig. 5.2 [2] (f) The student does this experiment in a darkened room. Explain how this makes it easier to decide when the image is in focus. ................................................................................................................................................... ............................................................................................................................................. [1] [Total: 10]
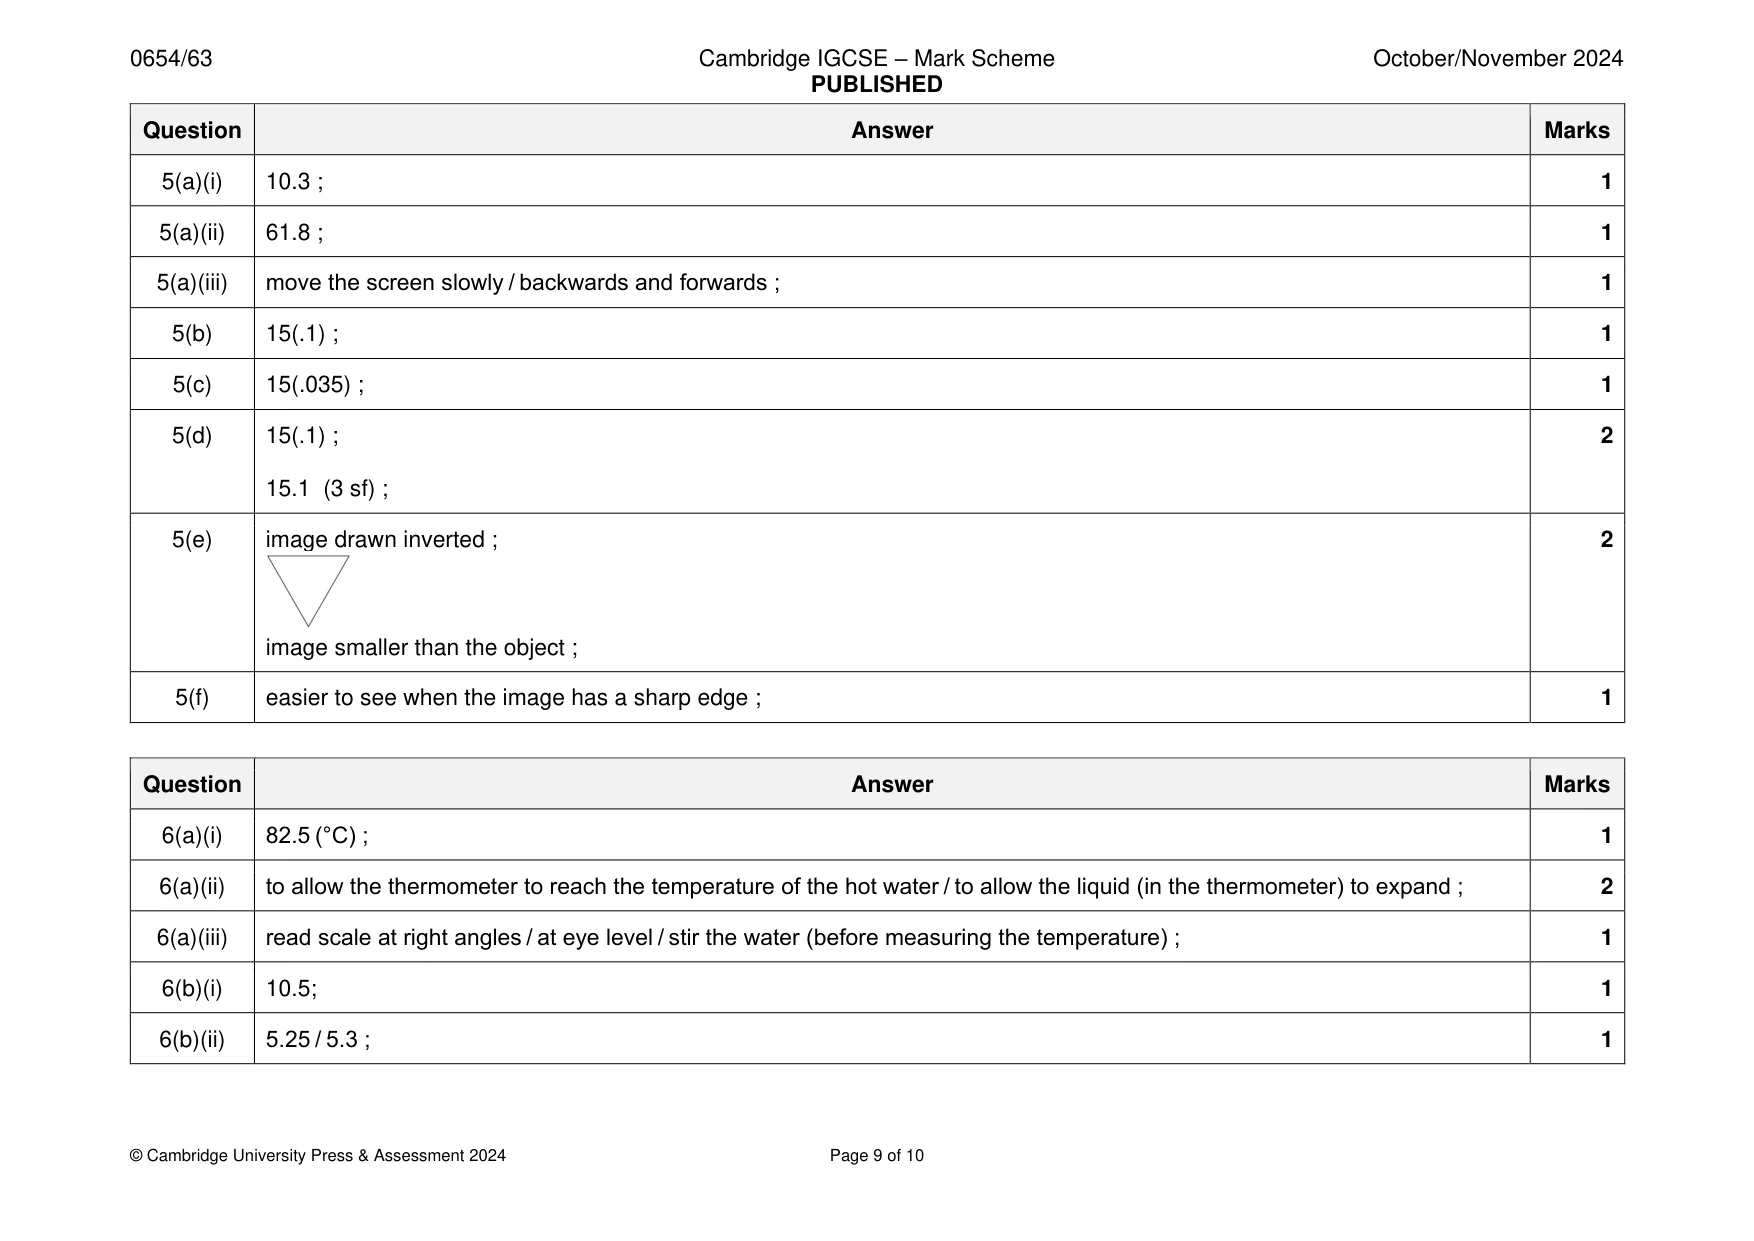
Mark scheme: 5(a)(i) 10.3 ; 1 5(a)(ii) 61.8 ; 1 5(a)(iii) move the screen slowly / backwards and forwards ; 1 5(b) 15(.1) ; 1 5(c) 15(.035) ; 1 5(d) 15(.1) ; 2 15.1 (3 sf) ; 5(e) image drawn inverted ; 2 image smaller than the object ; 5(f) easier to see when the image has a sharp edge ; 1
Q6 · A student investigates the rate of cooling of water
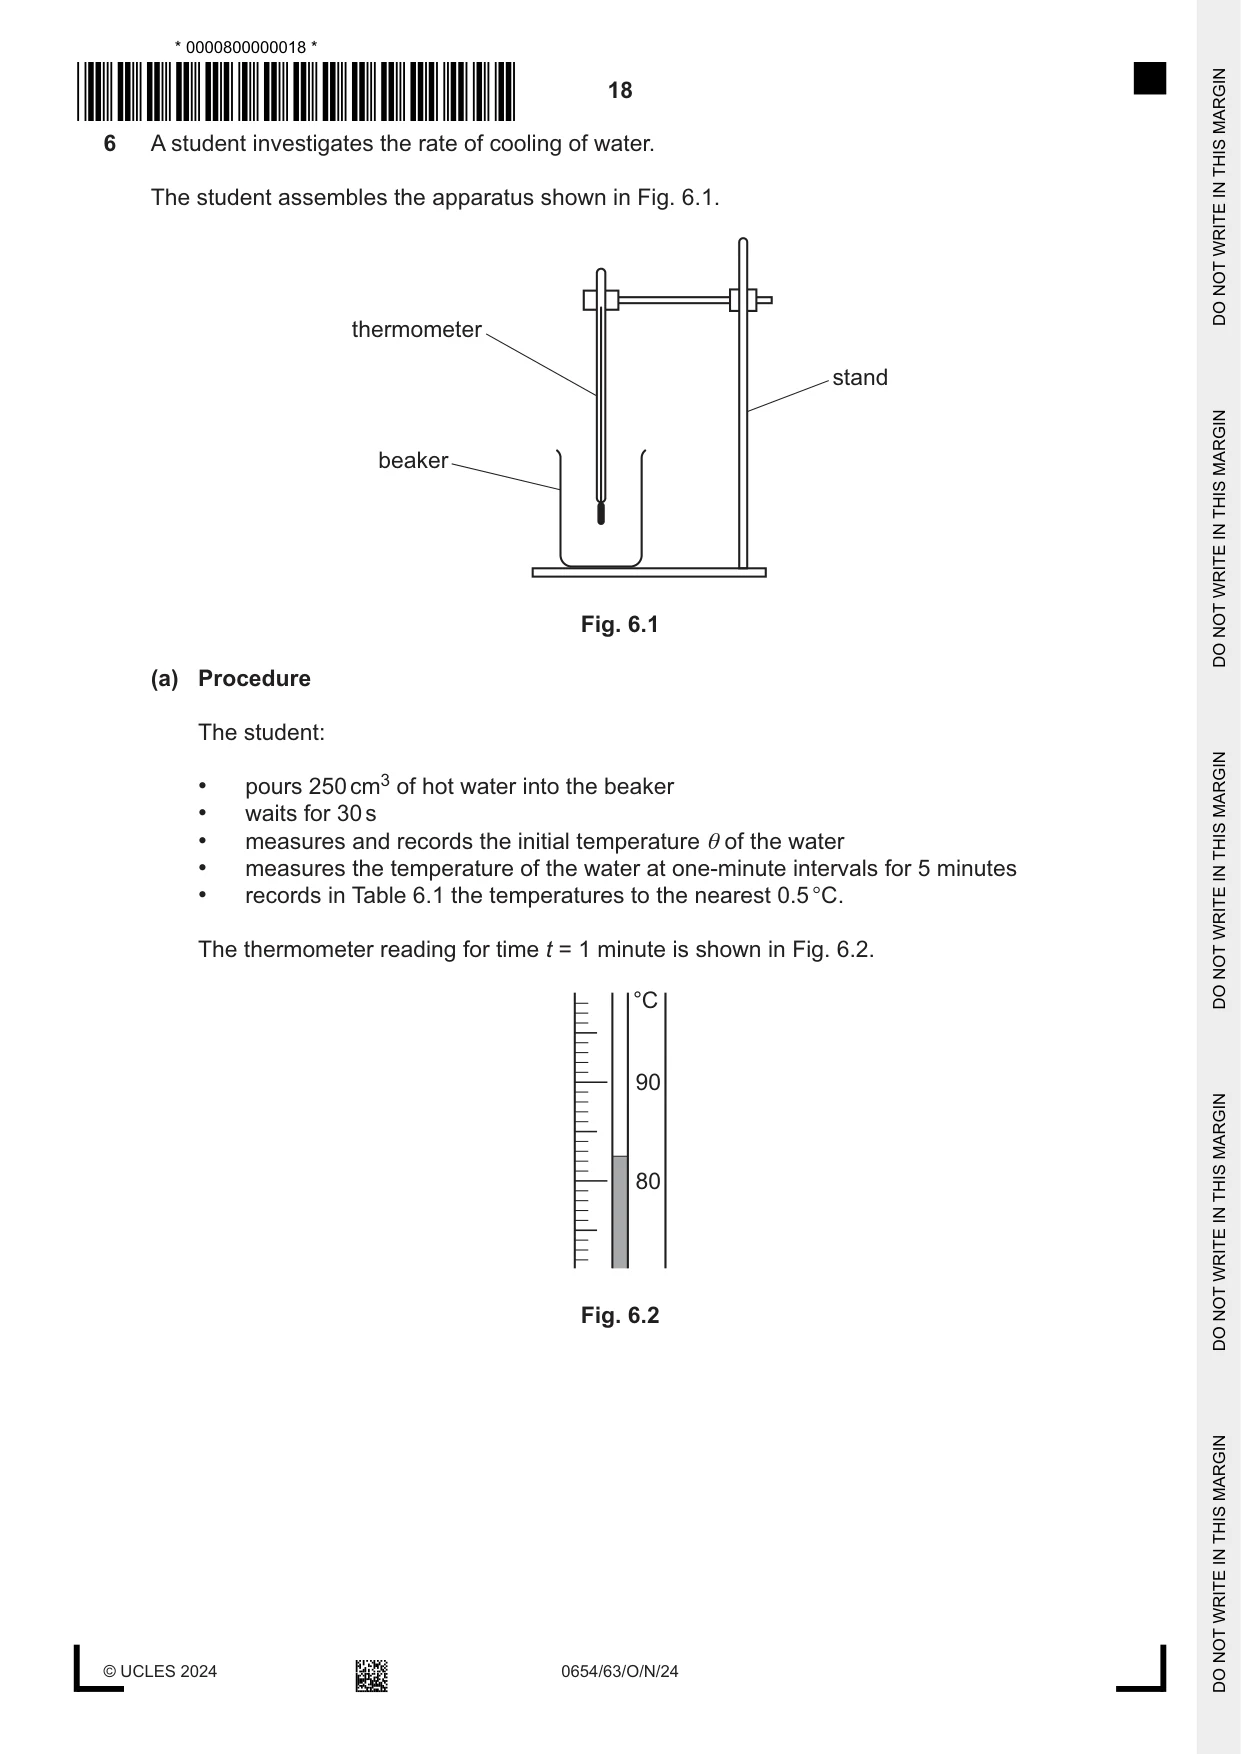
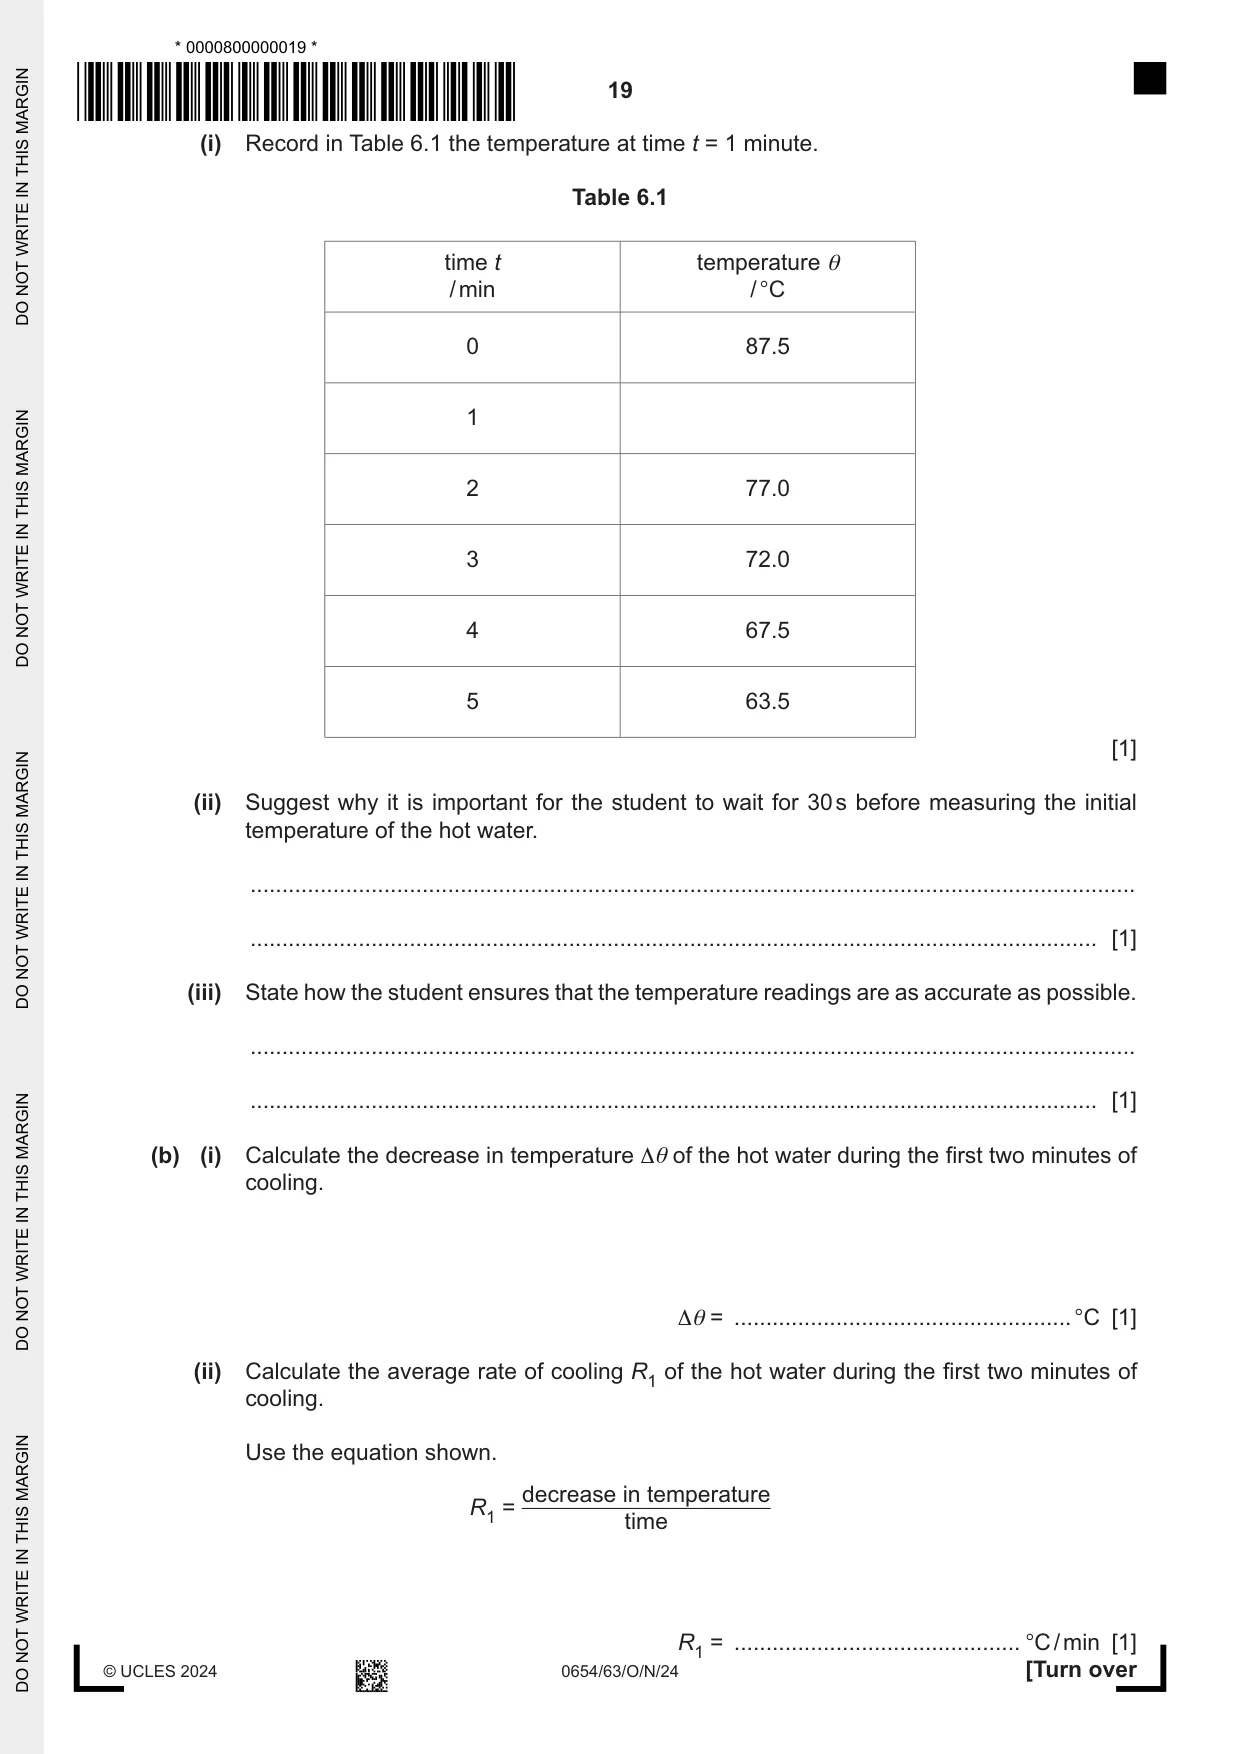
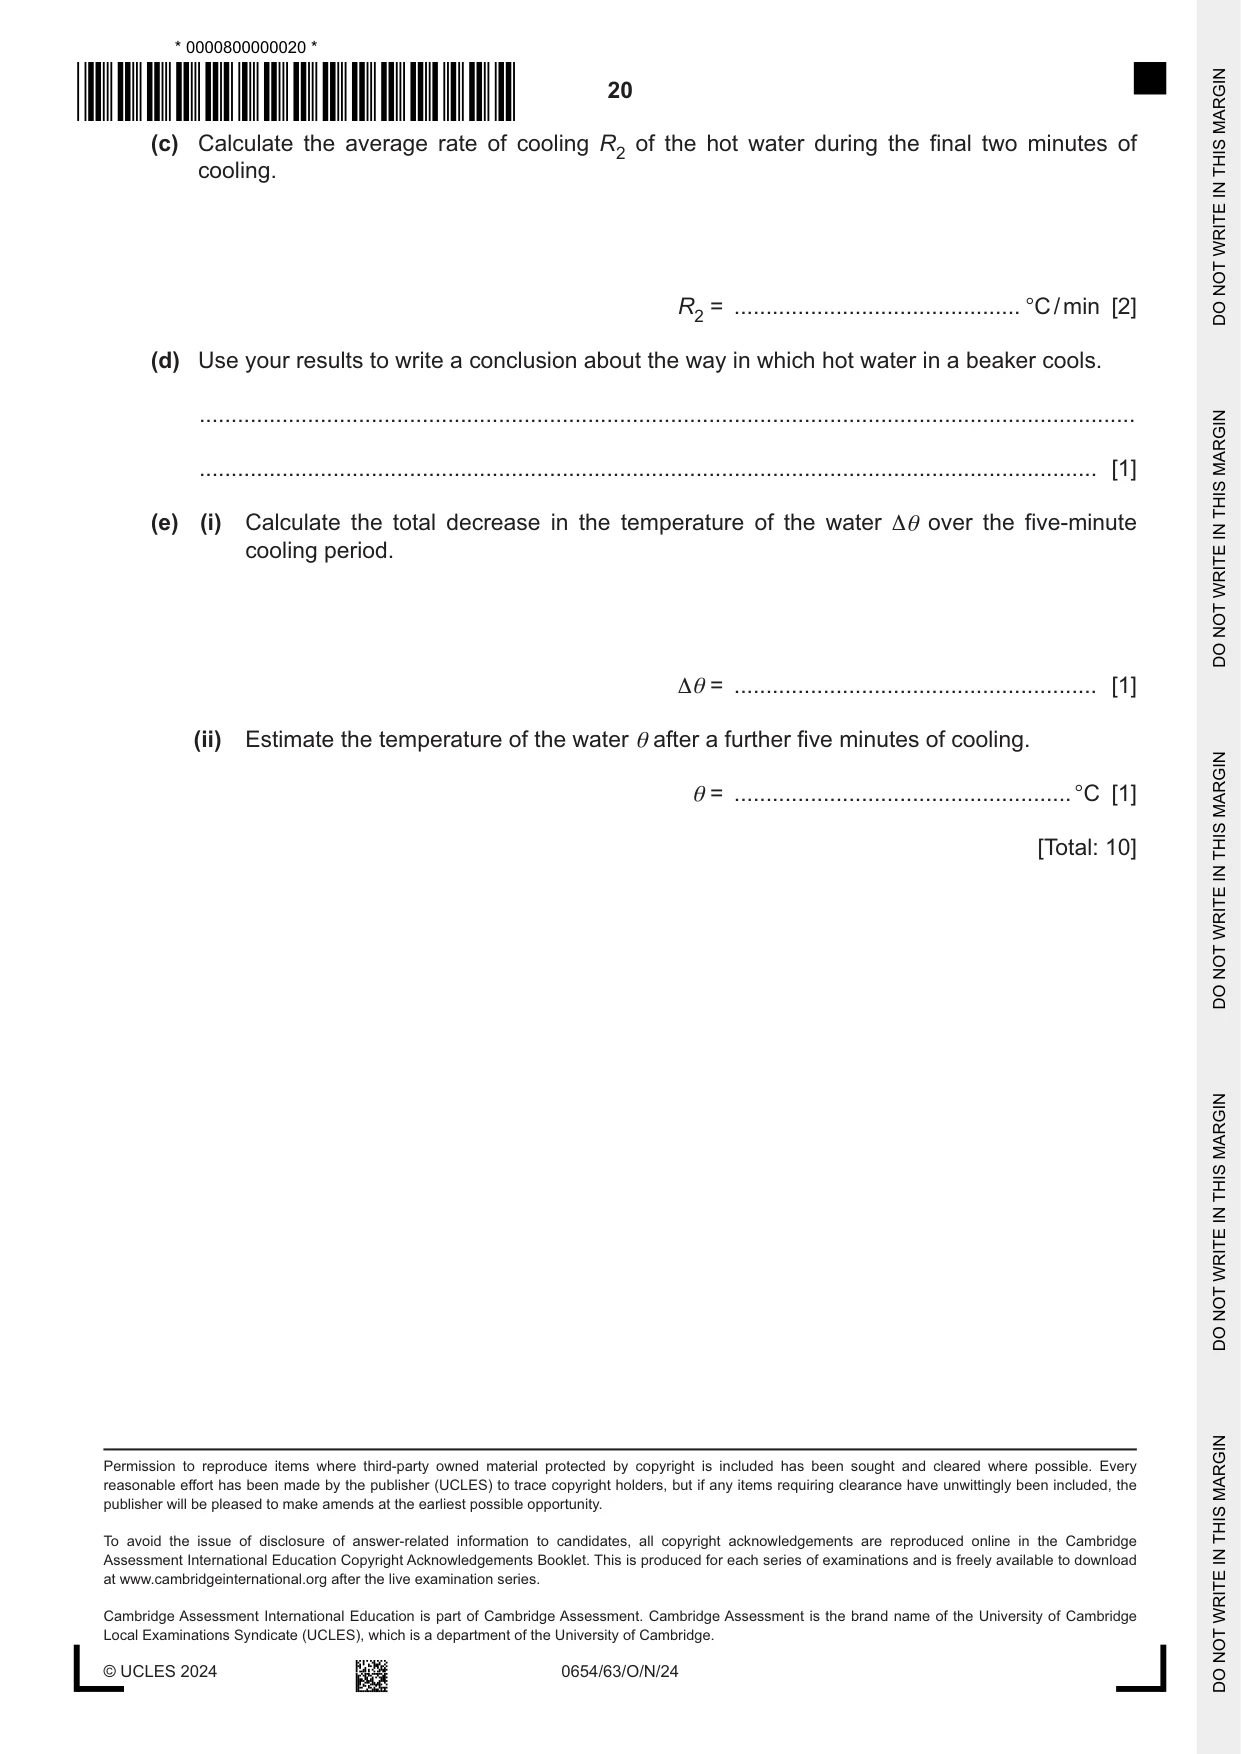
6 A student investigates the rate of cooling of water. The student assembles the apparatus shown in Fig. 6.1. thermometer stand beaker Fig. 6.1 (a) Procedure The student: • pours 250 cm3 of hot water into the beaker • waits for 30 s • measures and records the initial temperature θ of the water • measures the temperature of the water at one-minute intervals for 5 minutes • records in Table 6.1 the temperatures to the nearest 0.5 °C. The thermometer reading for time t = 1 minute is shown in Fig. 6.2. °C 90 80 Fig. 6.2 (i) Record in Table 6.1 the temperature at time t = 1 minute. Table 6.1 time t temperature θ / min / °C 0 87.5 1 2 77.0 3 72.0 4 67.5 5 63.5 [1] (ii) Suggest why it is important for the student to wait for 30 s before measuring the initial temperature of the hot water. ........................................................................................................................................... ..................................................................................................................................... [1] (iii) State how the student ensures that the temperature readings are as accurate as possible. ........................................................................................................................................... ..................................................................................................................................... [1] (b) (i) Calculate the decrease in temperature Δθ of the hot water during the first two minutes of cooling. Δθ = ..................................................... °C [1] (ii) Calculate the average rate of cooling R1 of the hot water during the first two minutes of cooling. Use the equation shown. decrease in temperature R1 = time R1 = ............................................. °C / min [1] (c) Calculate the average rate of cooling R2 of the hot water during the final two minutes of cooling. R2 = ............................................. °C / min [2] (d) Use your results to write a conclusion about the way in which hot water in a beaker cools. ................................................................................................................................................... ............................................................................................................................................. [1] (e) (i) Calculate the total decrease in the temperature of the water Δθ over the five-minute cooling period. Δθ = ......................................................... [1] (ii) Estimate the temperature of the water θ after a further five minutes of cooling. θ = ..................................................... °C [1] [Total: 10]
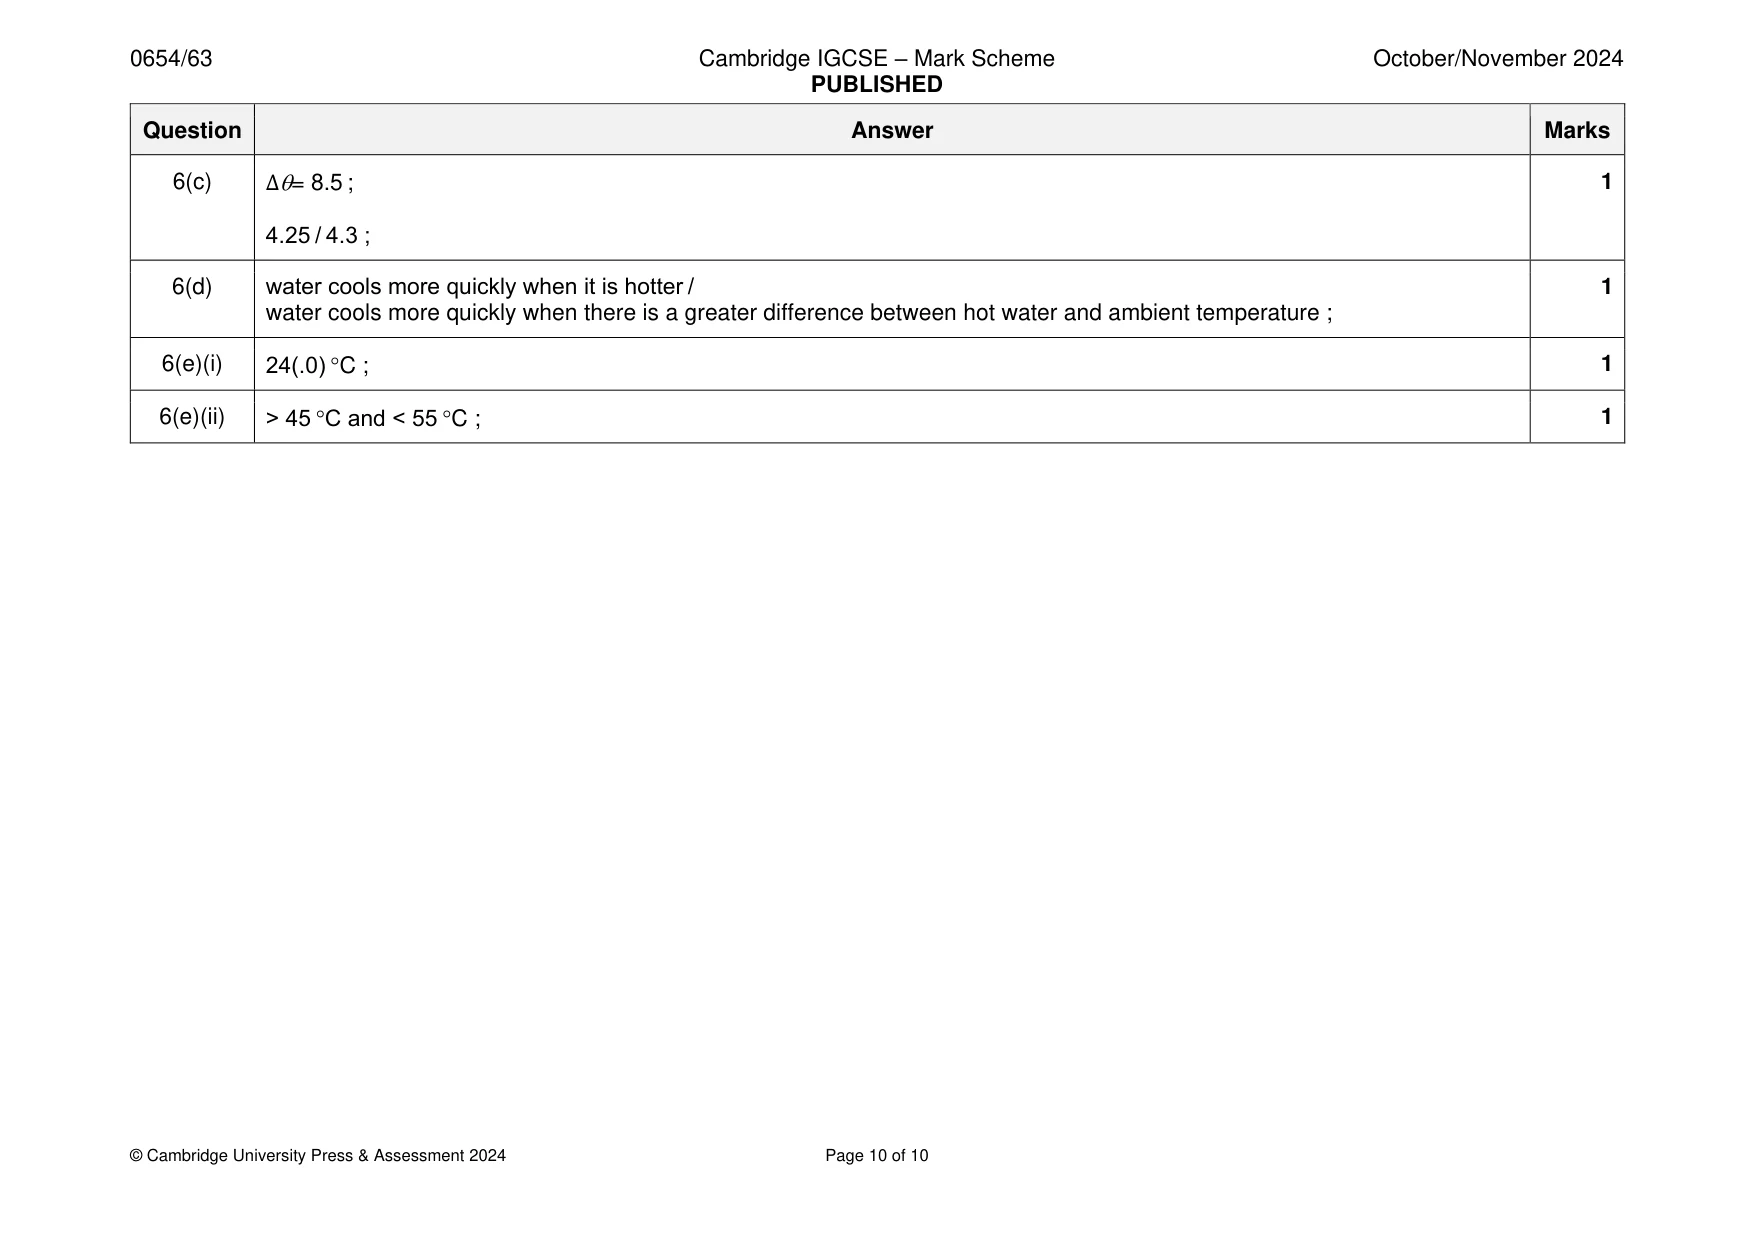
Mark scheme: 6(a)(i) 82.5 (°C) ; 1 6(a)(ii) to allow the thermometer to reach the temperature of the hot water / to allow the liquid (in the thermometer) to expand ; 2 6(a)(iii) read scale at right angles / at eye level / stir the water (before measuring the temperature) ; 1 6(b)(i) 10.5; 1 6(b)(ii) 5.25 / 5.3 ; 1 6(c) Δ= 8.5 ; 1 4.25 / 4.3 ; 6(d) water cools more quickly when it is hotter / 1 water cools more quickly when there is a greater difference between hot water and ambient temperature ; 6(e)(i) 24(.0) C ; 1 6(e)(ii) > 45 C and < 55 C ; 1
What was in this paper
The subtopics covered by these 6 questions, and how many questions each got. Open one in a new tab to see every Cambridge question on it.
What you needed in this session
Cambridge’s own grade thresholds for 2024 Oct/Nov, Paper 6 · Variant 3. A higher threshold means an easier paper — the bar moves with how the cohort did.