Cambridge IGCSE Sciences - Co-ordinated (Double) 0654 — 2024 Oct/Nov Paper 6 · Variant 1
0654/61/O/N/24 · 7 questions · 60 marks · ≈68 min
The question paper and its mark scheme, free to read here and free to download. This is Cambridge’s own paper, exactly as it was sat.
Question paper24 pages

Mark scheme10 pages
Answers below. Sit the paper first if you are practising.
Questions as text
Q1 · A student investigates an enzyme-controlled reaction
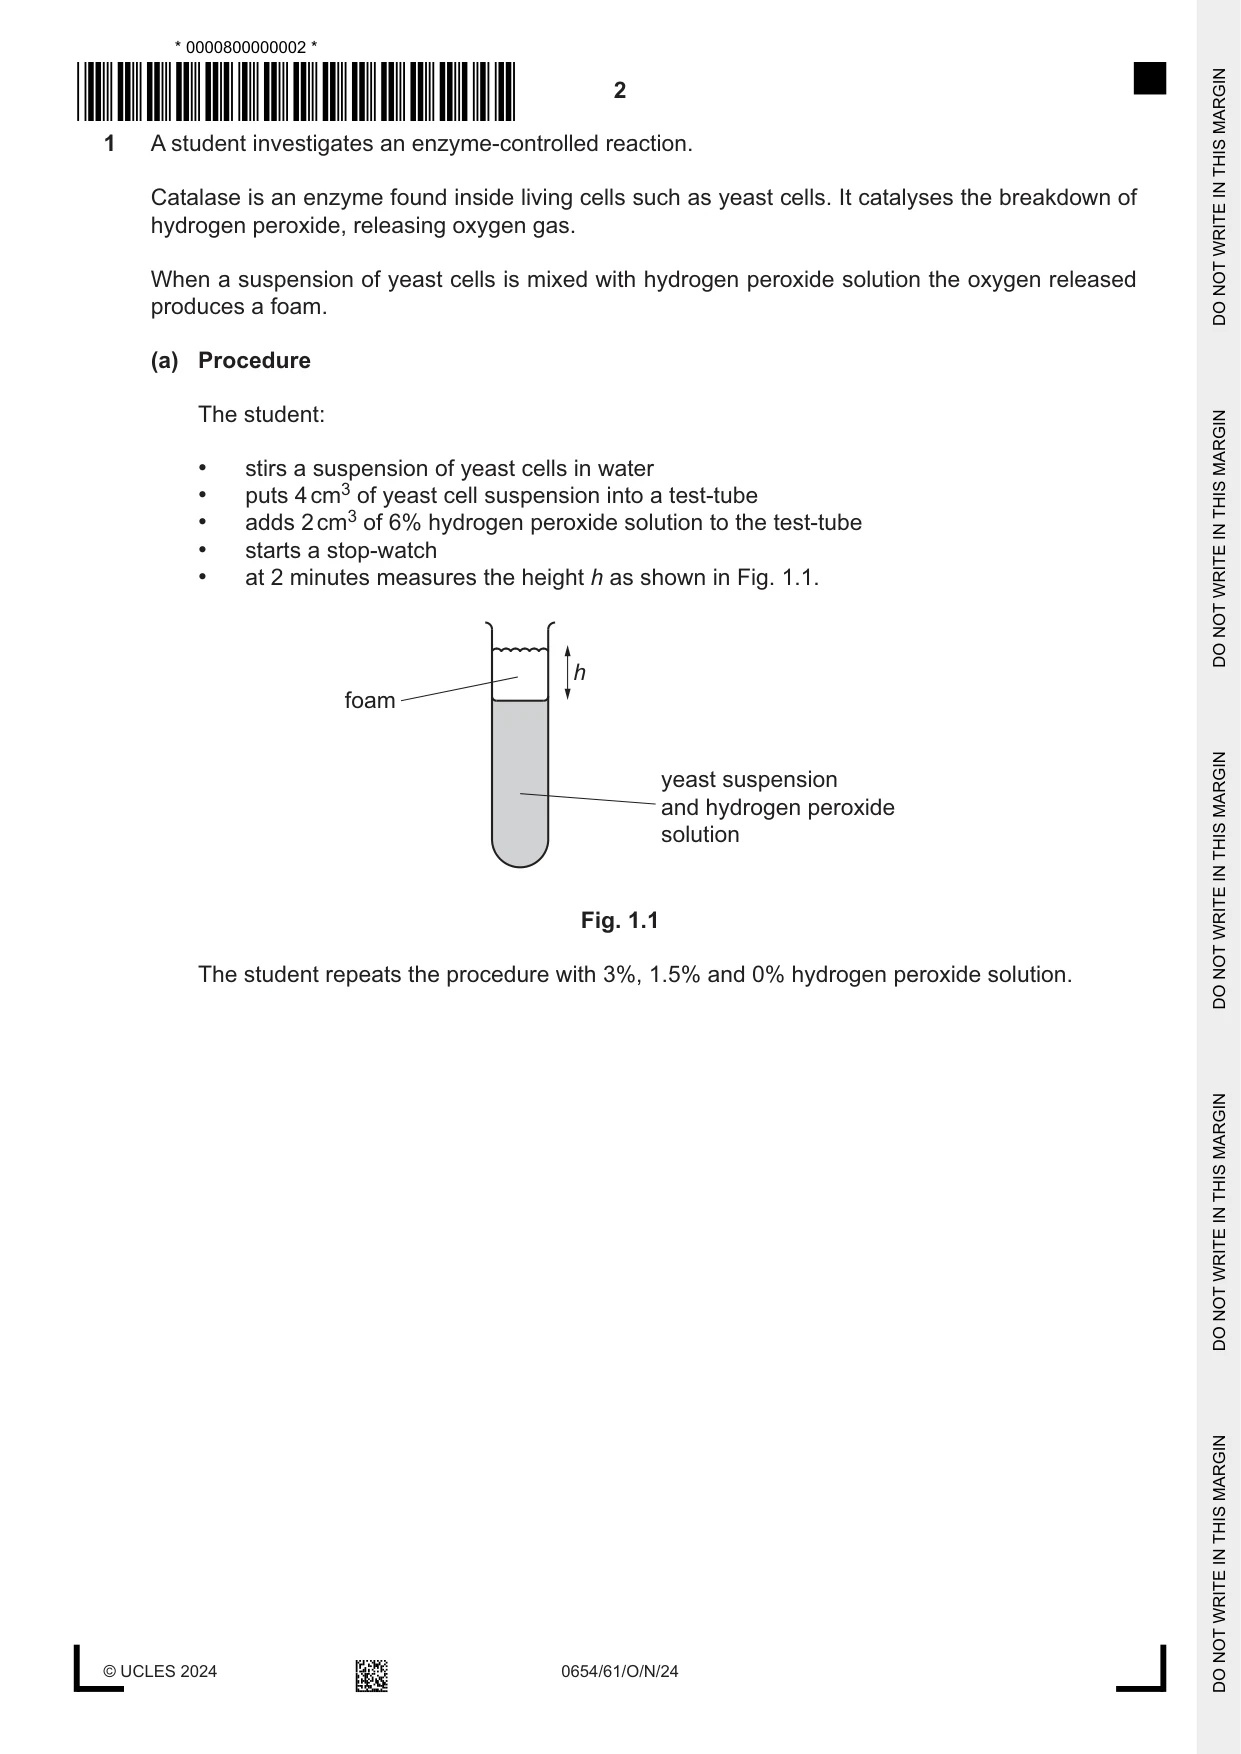
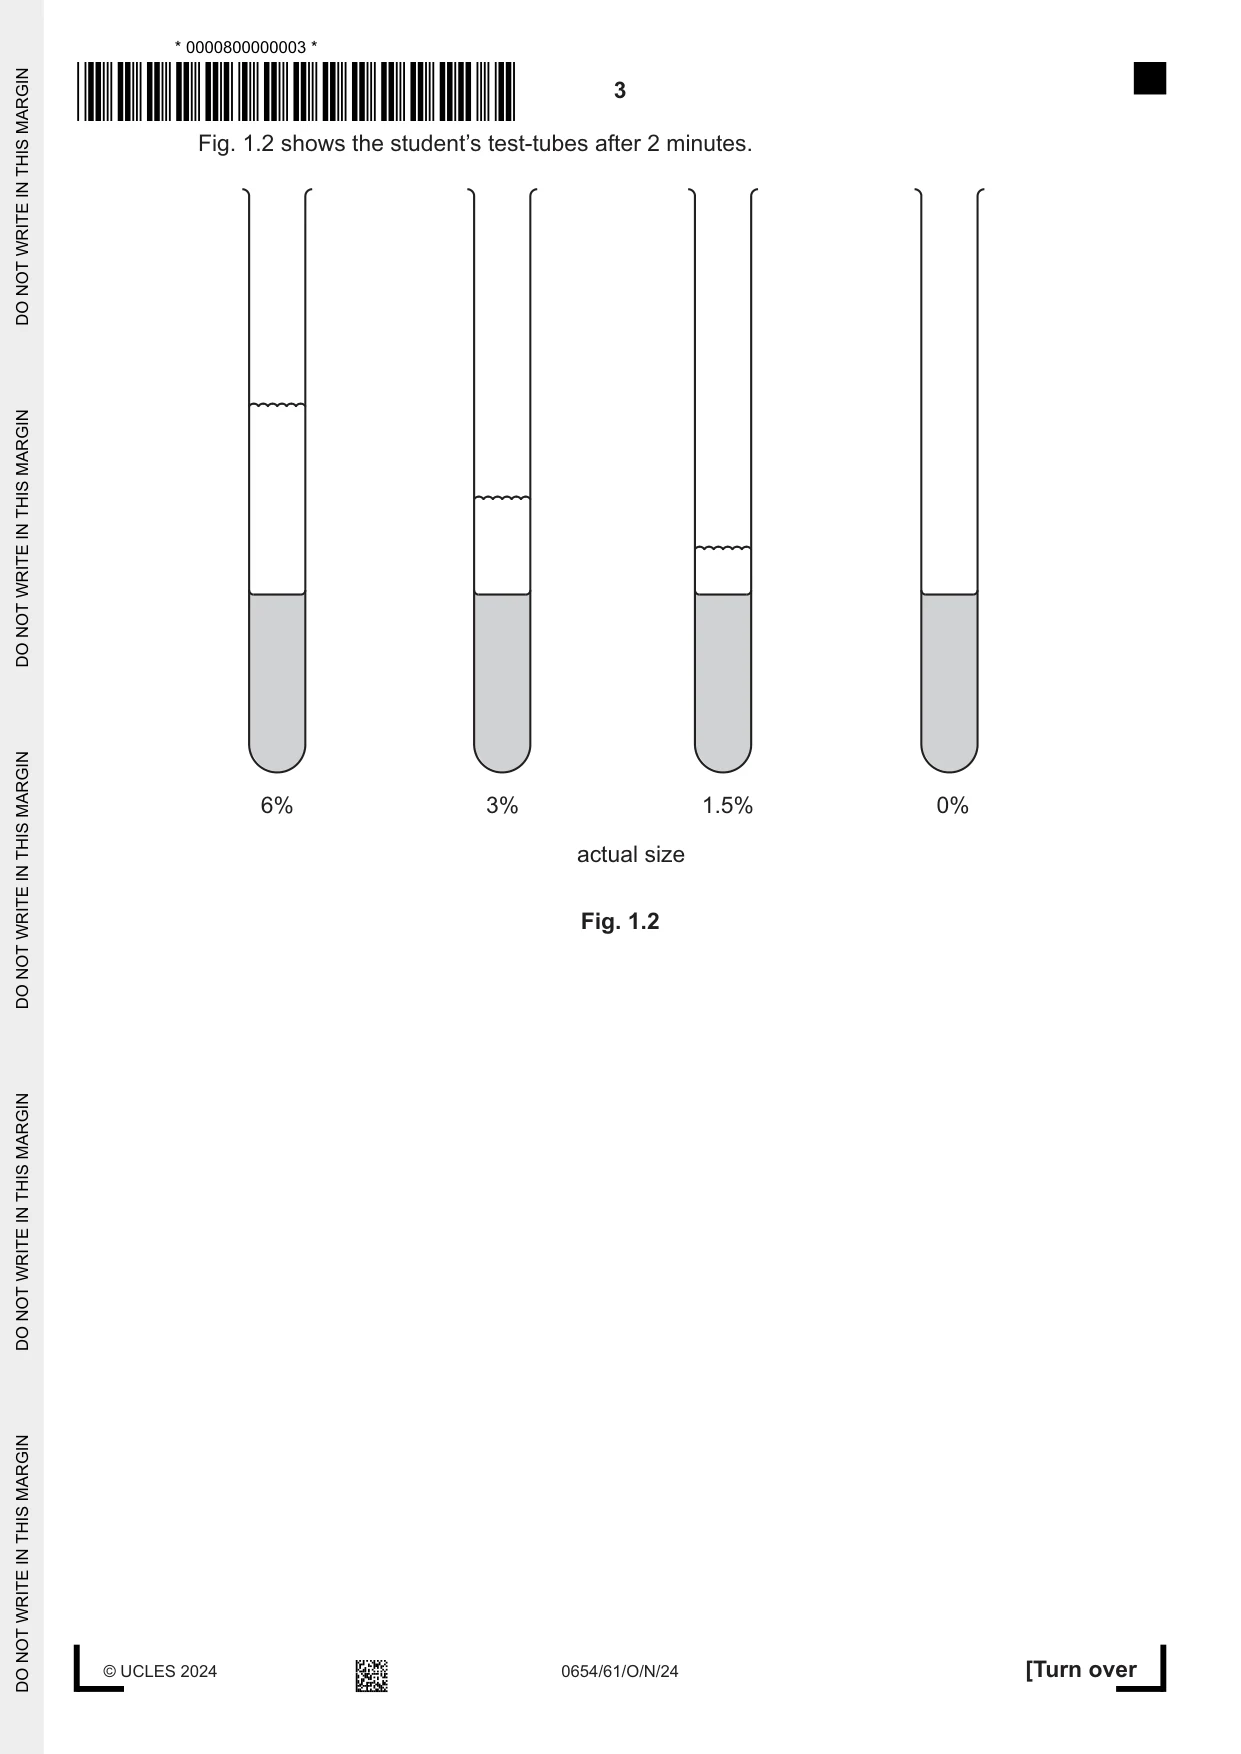
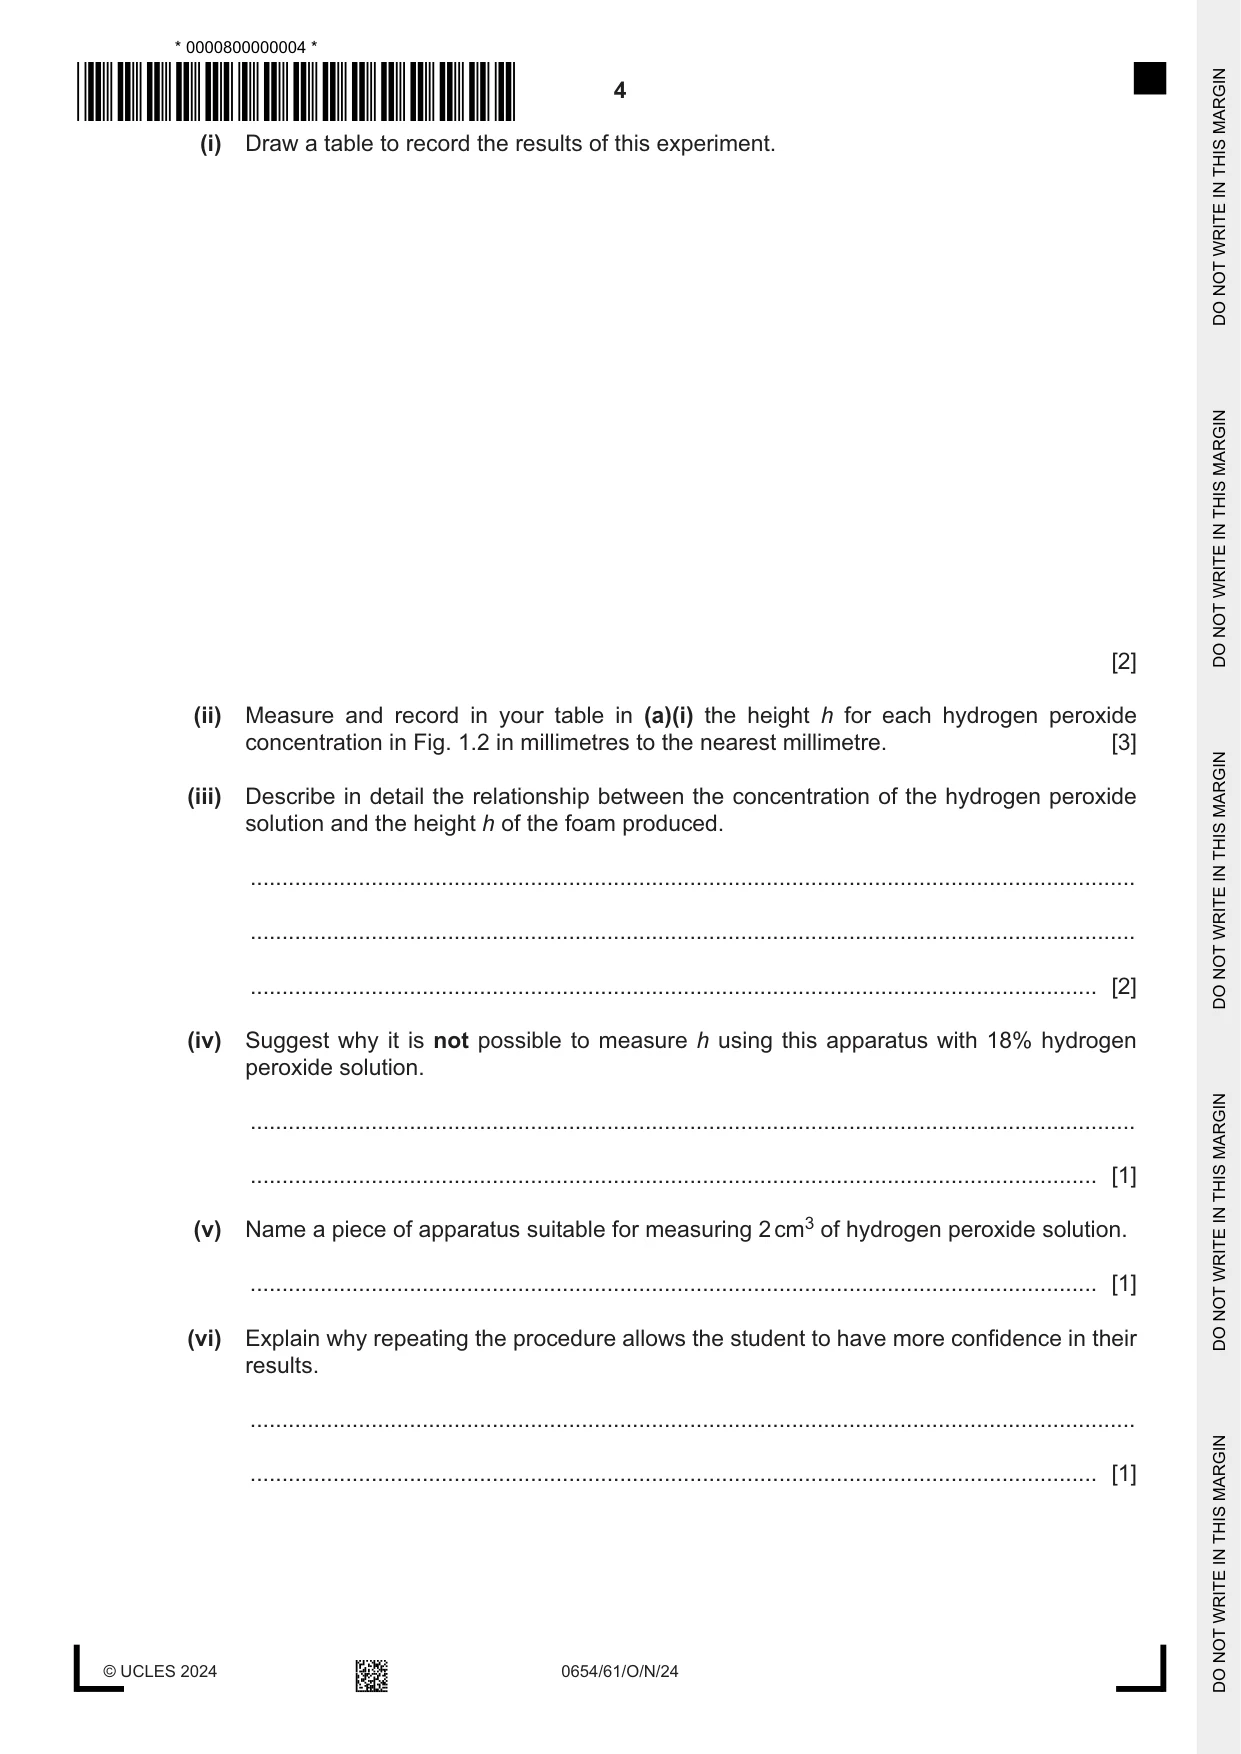
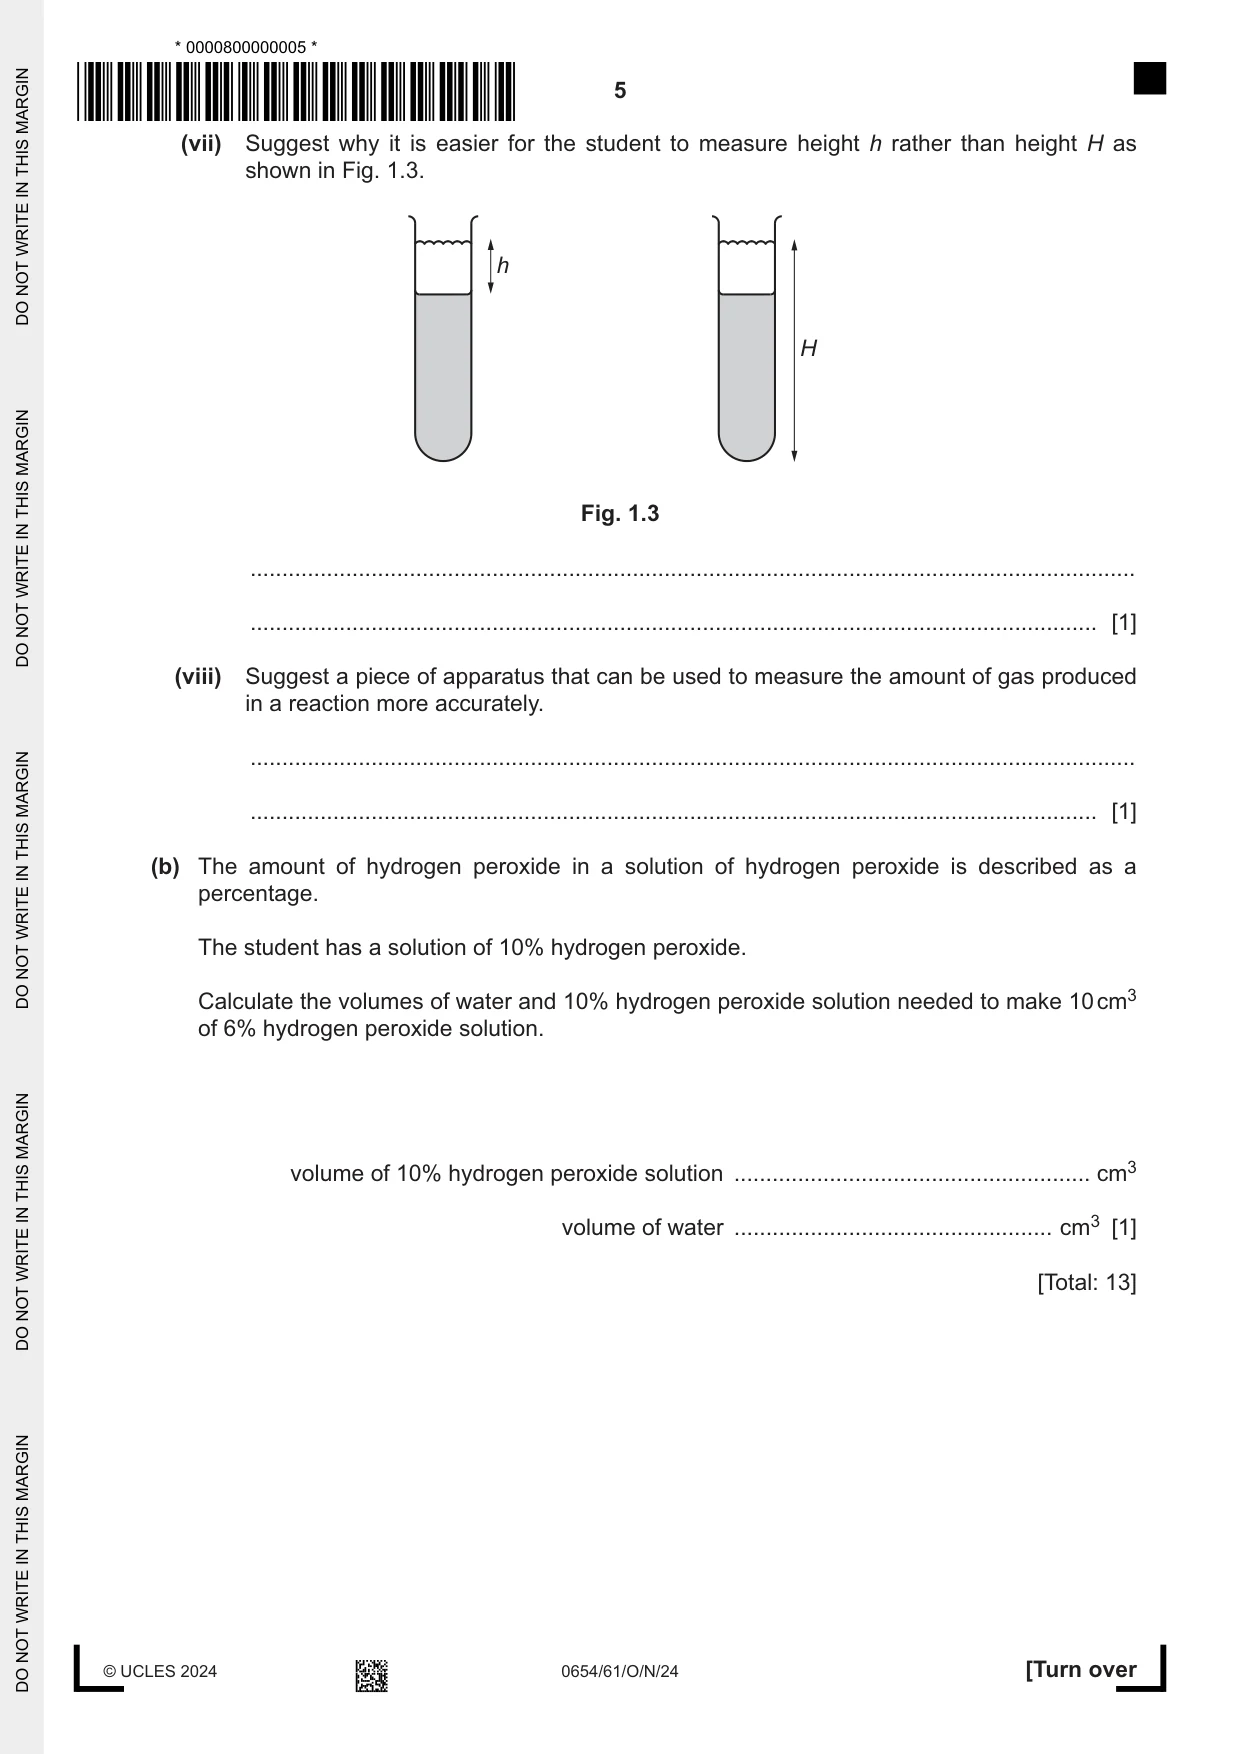
1 A student investigates an enzyme-controlled reaction. Catalase is an enzyme found inside living cells such as yeast cells. It catalyses the breakdown of hydrogen peroxide, releasing oxygen gas. When a suspension of yeast cells is mixed with hydrogen peroxide solution the oxygen released produces a foam. (a) Procedure The student: • stirs a suspension of yeast cells in water • puts 4 cm3 of yeast cell suspension into a test-tube • adds 2 cm3 of 6% hydrogen peroxide solution to the test-tube • starts a stop-watch • at 2 minutes measures the height h as shown in Fig. 1.1. h foam yeast suspension and hydrogen peroxide solution Fig. 1.1 The student repeats the procedure with 3%, 1.5% and 0% hydrogen peroxide solution. Fig. 1.2 shows the student’s test-tubes after 2 minutes. 6% 3% 1.5% 0% actual size Fig. 1.2 (i) Draw a table to record the results of this experiment. [2] (ii) Measure and record in your table in (a)(i) the height h for each hydrogen peroxide concentration in Fig. 1.2 in millimetres to the nearest millimetre. [3] (iii) Describe in detail the relationship between the concentration of the hydrogen peroxide solution and the height h of the foam produced. ........................................................................................................................................... ........................................................................................................................................... ..................................................................................................................................... [2] (iv) Suggest why it is not possible to measure h using this apparatus with 18% hydrogen peroxide solution. ........................................................................................................................................... ..................................................................................................................................... [1] (v) Name a piece of apparatus suitable for measuring 2 cm3 of hydrogen peroxide solution. ..................................................................................................................................... [1] (vi) Explain why repeating the procedure allows the student to have more confidence in their results. ........................................................................................................................................... ..................................................................................................................................... [1] (vii) Suggest why it is easier for the student to measure height h rather than height H as shown in Fig. 1.3. h H Fig. 1.3 ........................................................................................................................................... ..................................................................................................................................... [1] (viii) Suggest a piece of apparatus that can be used to measure the amount of gas produced in a reaction more accurately. ........................................................................................................................................... ..................................................................................................................................... [1] (b) The amount of hydrogen peroxide in a solution of hydrogen peroxide is described as a percentage. The student has a solution of 10% hydrogen peroxide. Calculate the volumes of water and 10% hydrogen peroxide solution needed to make 10 cm3 of 6% hydrogen peroxide solution. volume of 10% hydrogen peroxide solution ........................................................ cm3 volume of water .................................................. cm3 [1] [Total: 13]
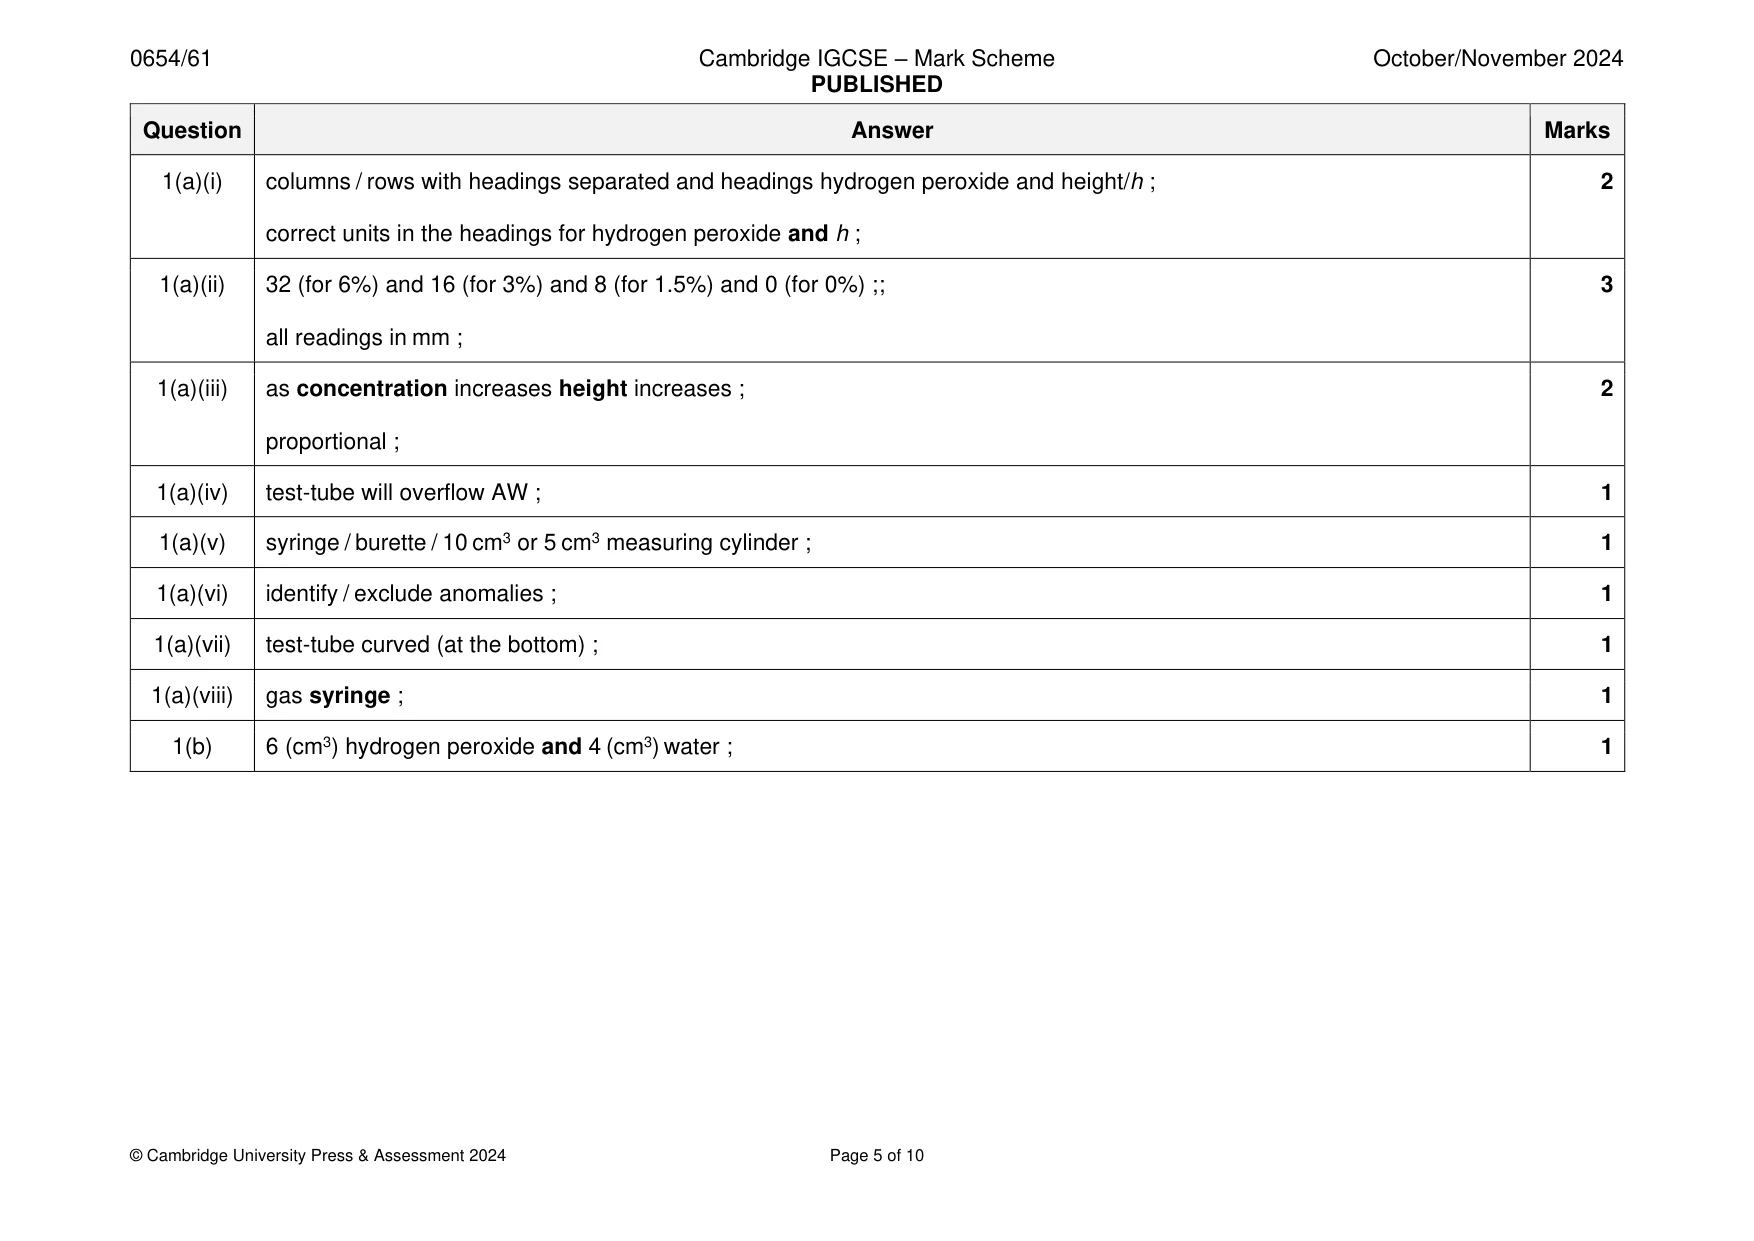
Mark scheme: Question Answer Marks 1(a)(i) columns / rows with headings separated and headings hydrogen peroxide and height/h ; 2 correct units in the headings for hydrogen peroxide and h ; 1(a)(ii) 32 (for 6%) and 16 (for 3%) and 8 (for 1.5%) and 0 (for 0%) ;; 3 all readings in mm ; 1(a)(iii) as concentration increases height increases ; 2 proportional ; 1(a)(iv) test-tube will overflow AW ; 1 1(a)(v) syringe / burette / 10 cm3 or 5 cm3 measuring cylinder ; 1 1(a)(vi) identify / exclude anomalies ; 1 1(a)(vii) test-tube curved (at the bottom) ; 1 1(a)(viii) gas syringe ; 1 1(b) 6 (cm3) hydrogen peroxide and 4 (cm3) water ; 1
Q2 · The pH of saliva in the mouth is approximately 7
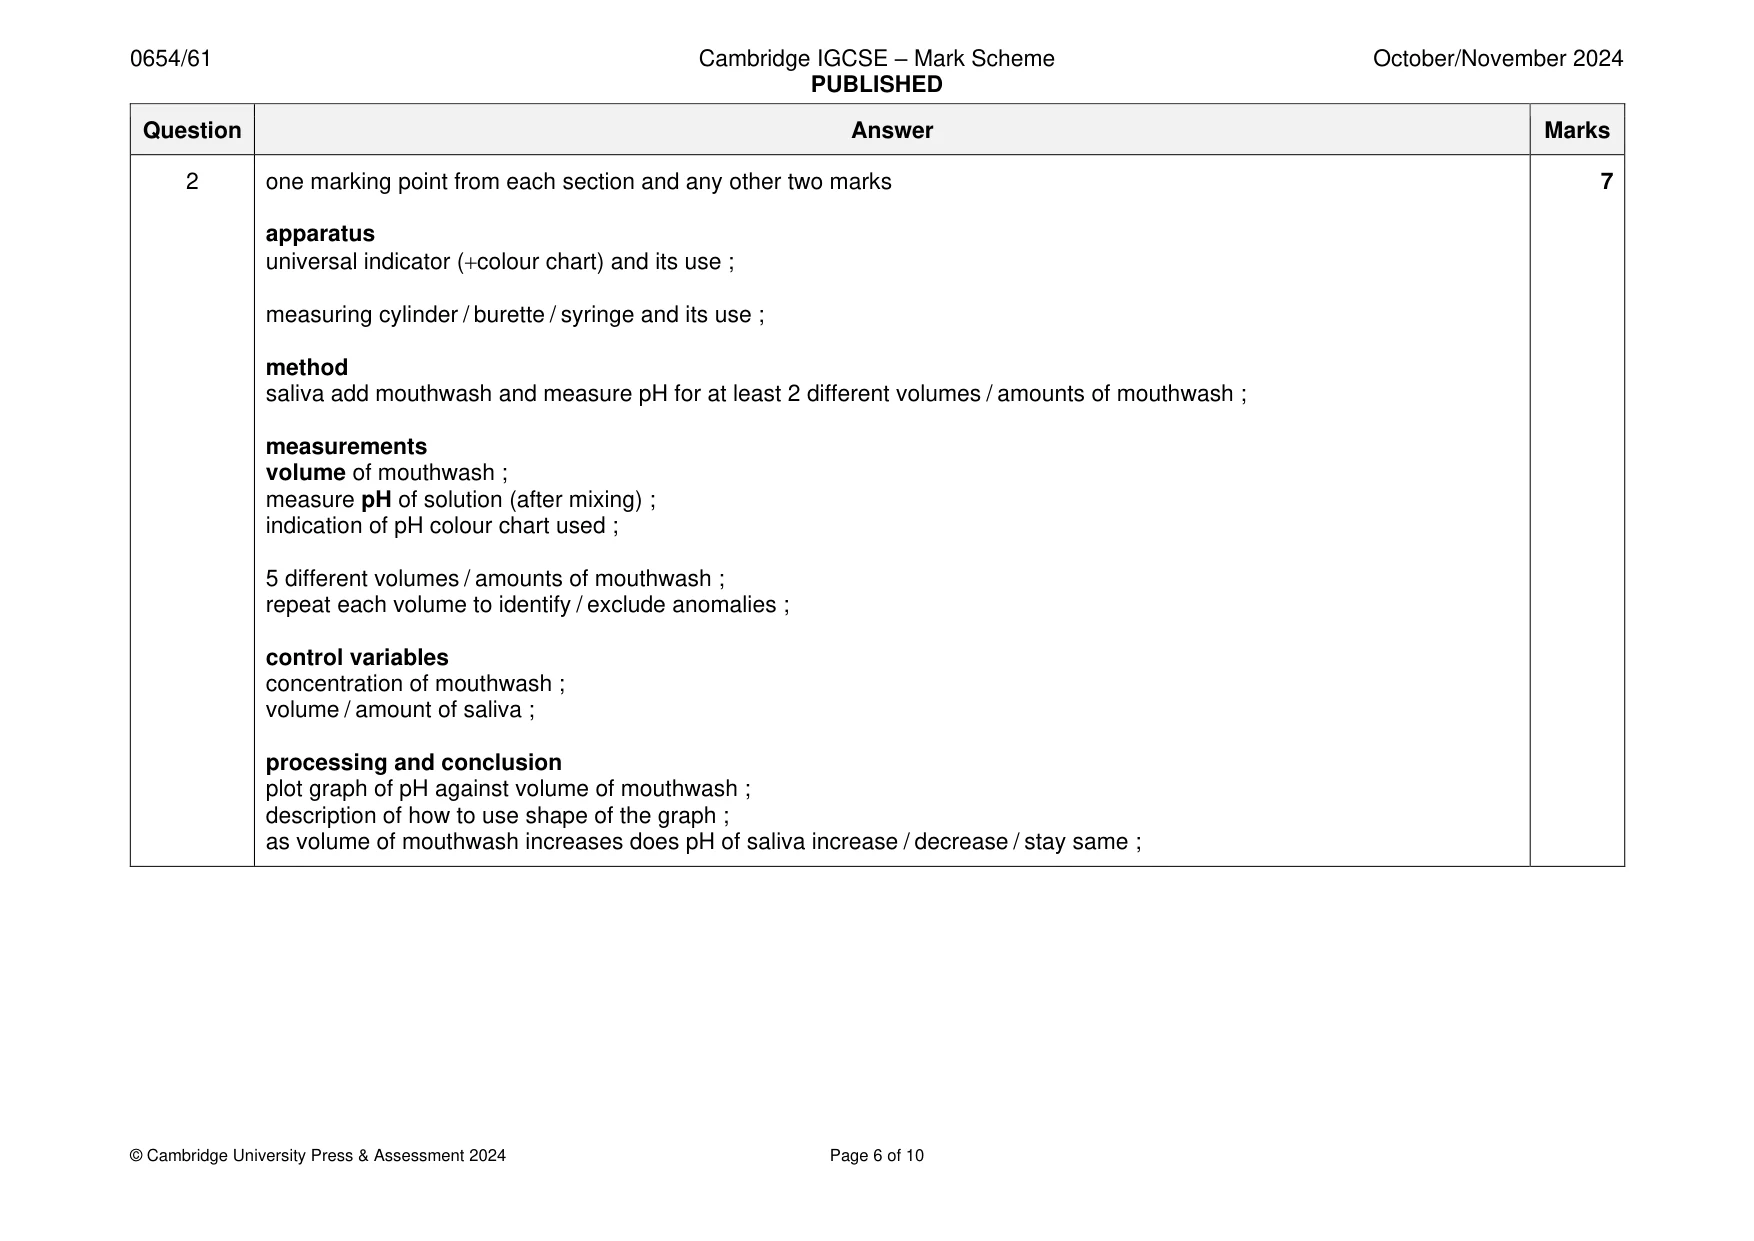
2 The pH of saliva in the mouth is approximately 7. Eating and drinking lowers the pH of saliva in the mouth. This can cause tooth decay. Mouthwash is sometimes used to raise the pH of saliva in the mouth. Plan an investigation to determine the relationship between the volume of mouthwash used and the pH of saliva. You are provided with: • mouthwash • a solution of saliva at pH 3. You may use any laboratory apparatus. In your plan include: • the apparatus needed • a brief description of the method • the measurements you will make • the variables you will control • how you process your results to draw a conclusion. .......................................................................................................................................................... .......................................................................................................................................................... .......................................................................................................................................................... .......................................................................................................................................................... .......................................................................................................................................................... .......................................................................................................................................................... .......................................................................................................................................................... .......................................................................................................................................................... .......................................................................................................................................................... .......................................................................................................................................................... .......................................................................................................................................................... .......................................................................................................................................................... .......................................................................................................................................................... .......................................................................................................................................................... .......................................................................................................................................................... .......................................................................................................................................................... .......................................................................................................................................................... .......................................................................................................................................................... .......................................................................................................................................................... .......................................................................................................................................................... .................................................................................................................................................... [7]
Mark scheme: 2 one marking point from each section and any other two marks 7 apparatus universal indicator (+colour chart) and its use ; measuring cylinder / burette / syringe and its use ; method saliva add mouthwash and measure pH for at least 2 different volumes / amounts of mouthwash ; measurements volume of mouthwash ; measure pH of solution (after mixing) ; indication of pH colour chart used ; 5 different volumes / amounts of mouthwash ; repeat each volume to identify / exclude anomalies ; control variables concentration of mouthwash ; volume / amount of saliva ; processing and conclusion plot graph of pH against volume of mouthwash ; description of how to use shape of the graph ; as volume of mouthwash increases does pH of saliva increase / decrease / stay same ;
Q3 · A student investigates the reactivity of metals by heating some metal carbonates
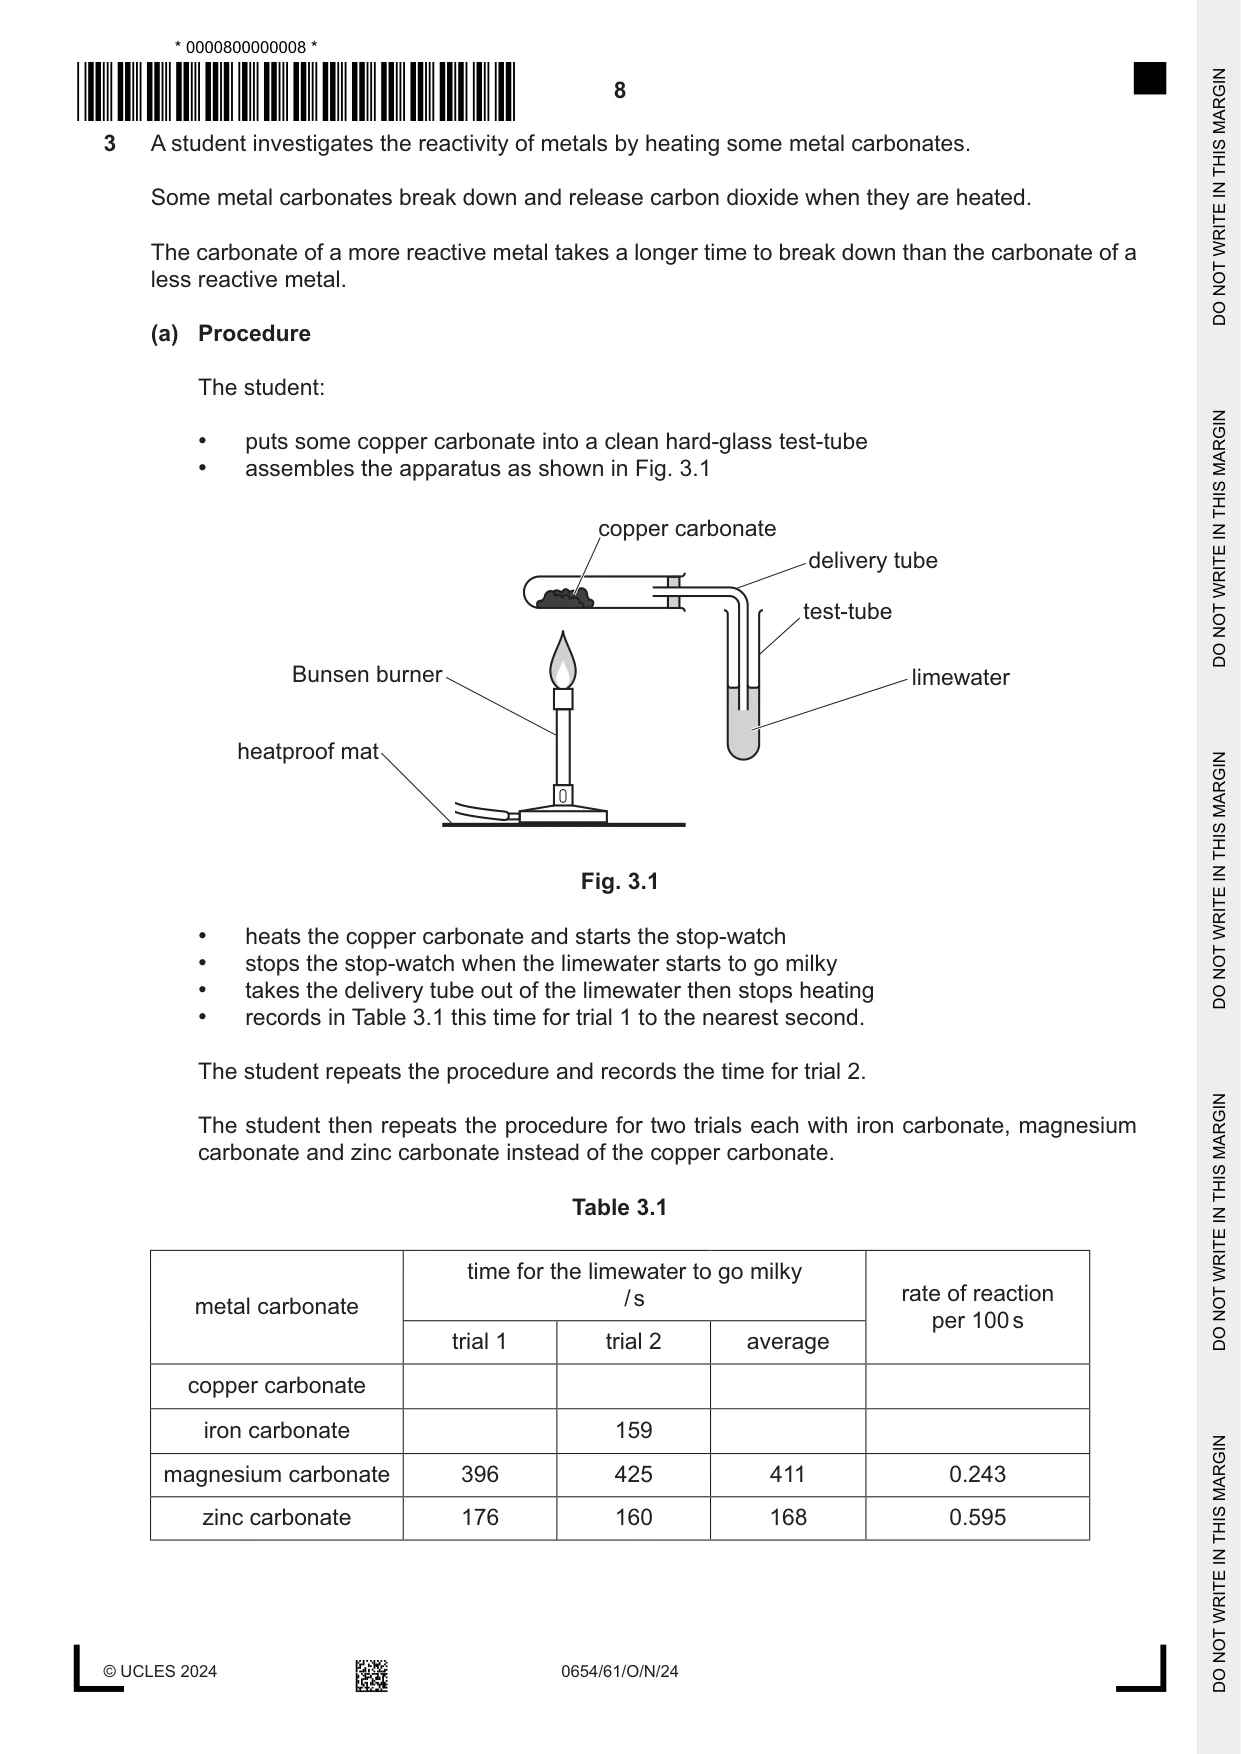
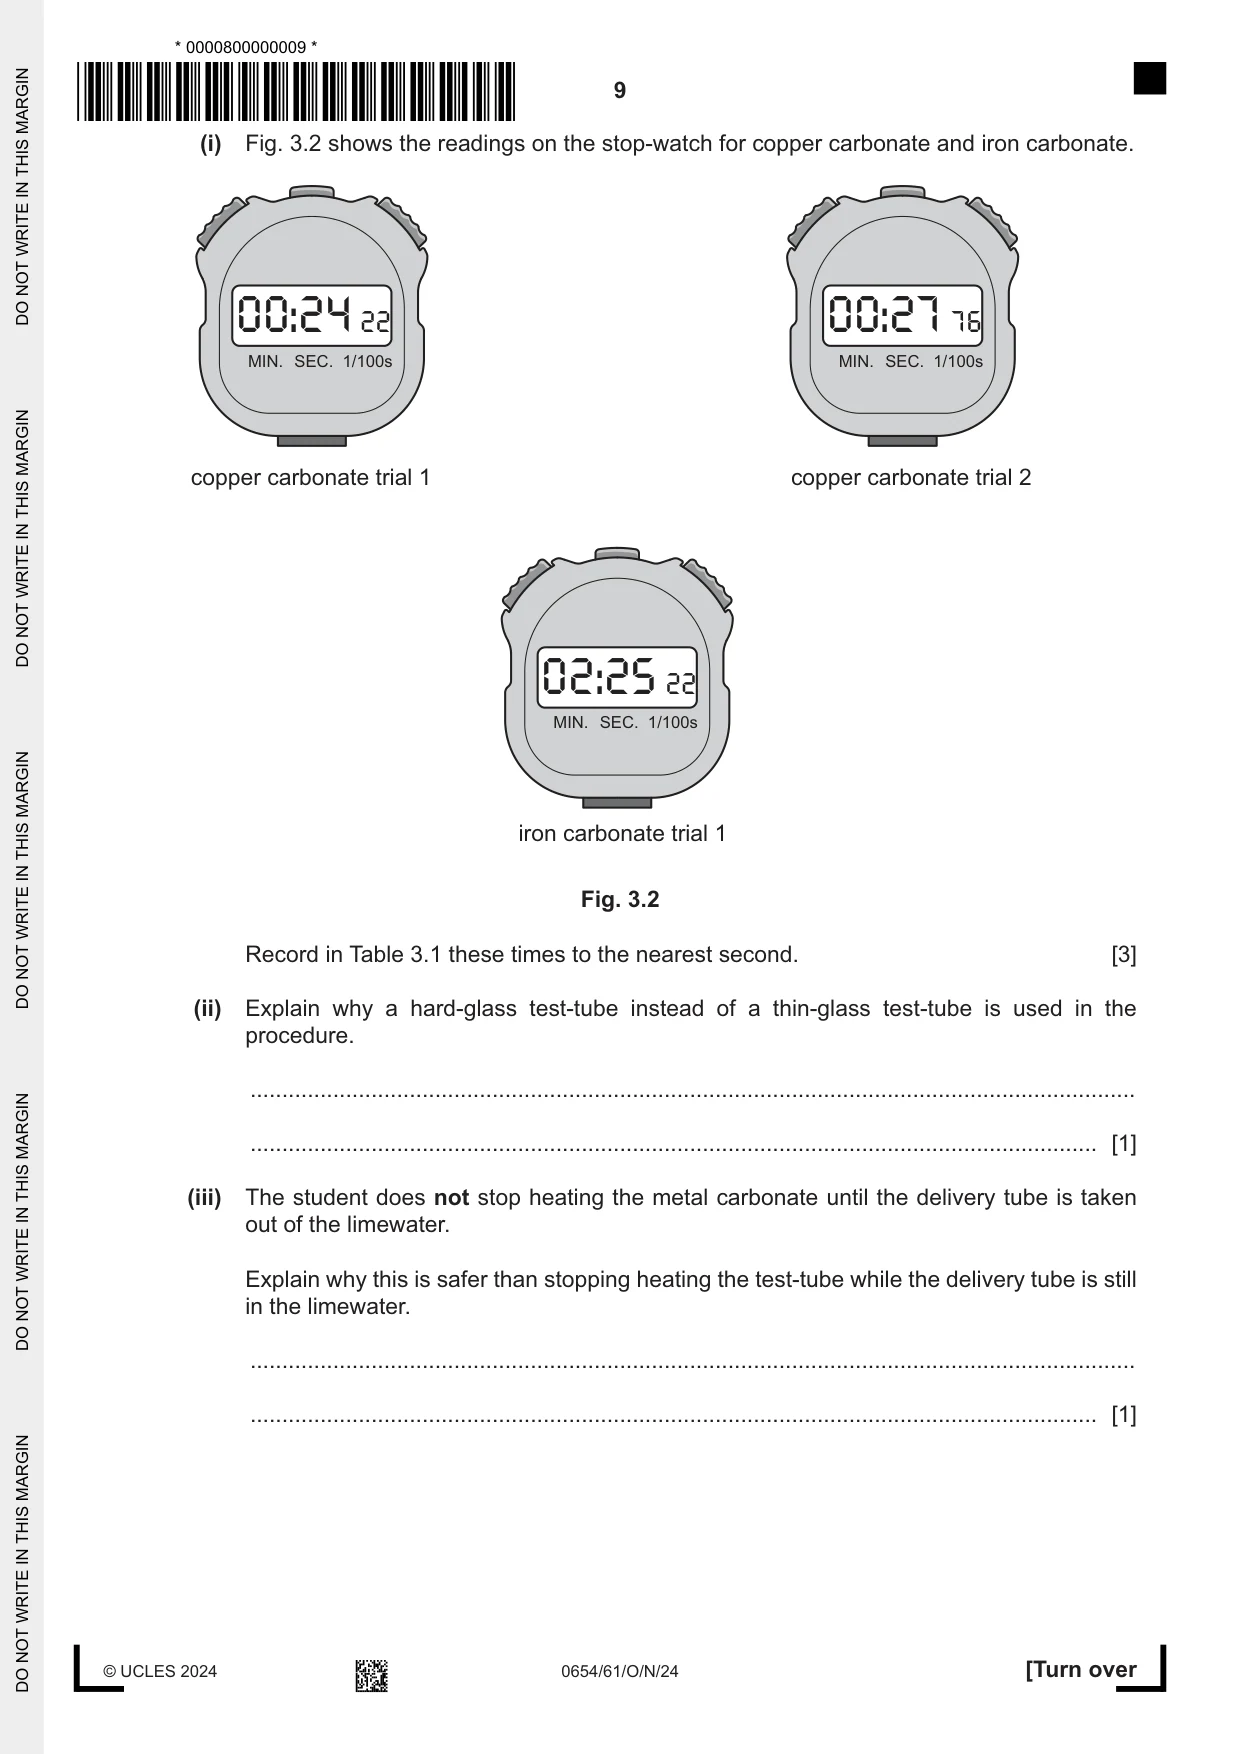
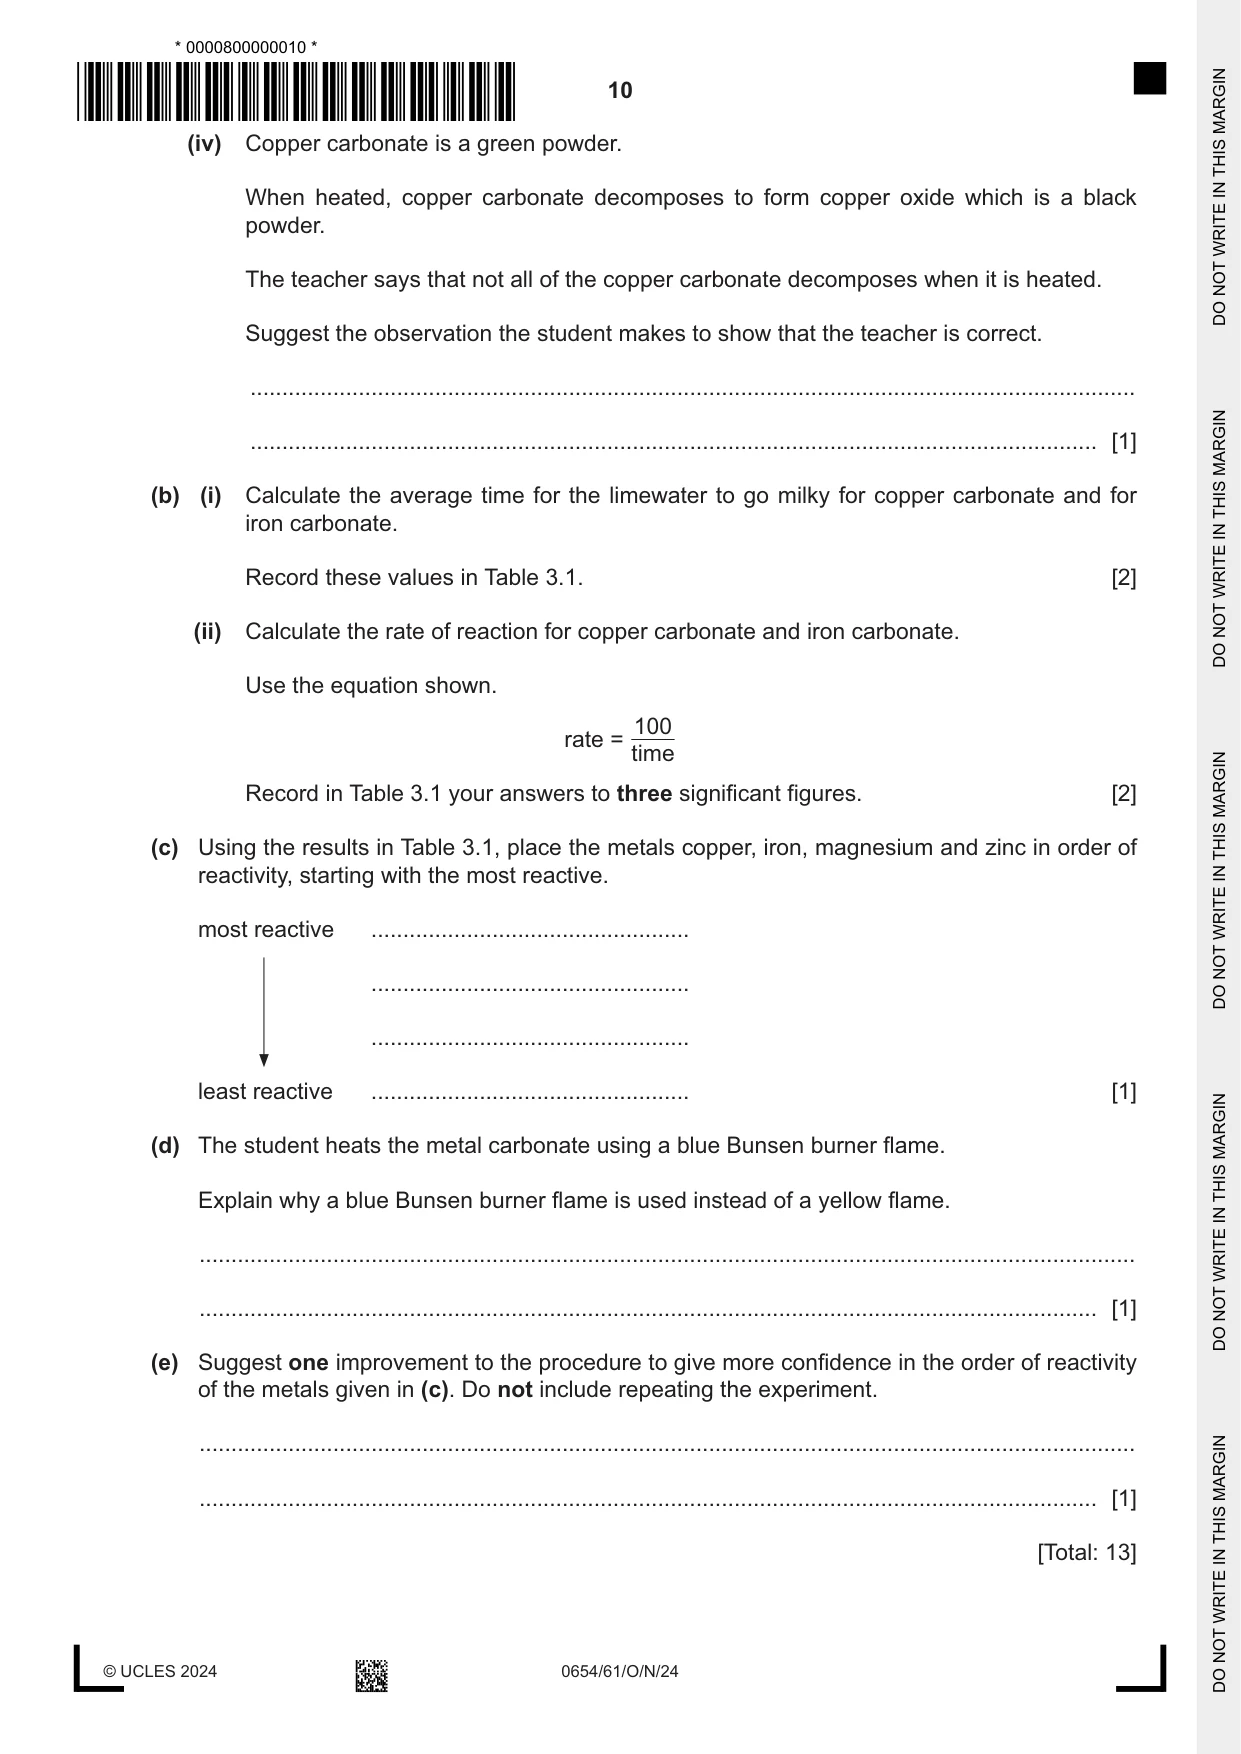
3 A student investigates the reactivity of metals by heating some metal carbonates. Some metal carbonates break down and release carbon dioxide when they are heated. The carbonate of a more reactive metal takes a longer time to break down than the carbonate of a less reactive metal. (a) Procedure The student: • puts some copper carbonate into a clean hard-glass test-tube • assembles the apparatus as shown in Fig. 3.1 copper carbonate delivery tube test-tube Bunsen burner limewater heatproof mat Fig. 3.1 • heats the copper carbonate and starts the stop-watch • stops the stop-watch when the limewater starts to go milky • takes the delivery tube out of the limewater then stops heating • records in Table 3.1 this time for trial 1 to the nearest second. The student repeats the procedure and records the time for trial 2. The student then repeats the procedure for two trials each with iron carbonate, magnesium carbonate and zinc carbonate instead of the copper carbonate. Table 3.1 time for the limewater to go milky / s rate of reaction metal carbonate per 100 s trial 1 trial 2 average copper carbonate iron carbonate 159 magnesium carbonate 396 425 411 0.243 zinc carbonate 176 160 168 0.595 (i) Fig. 3.2 shows the readings on the stop-watch for copper carbonate and iron carbonate. 00:24 22 00:27 76 MIN. SEC. 1/100s MIN. SEC. 1/100s copper carbonate trial 1 copper carbonate trial 2 02:25 22 MIN. SEC. 1/100s iron carbonate trial 1 Fig. 3.2 Record in Table 3.1 these times to the nearest second. [3] (ii) Explain why a hard-glass test-tube instead of a thin-glass test-tube is used in the procedure. ........................................................................................................................................... ..................................................................................................................................... [1] (iii) The student does not stop heating the metal carbonate until the delivery tube is taken out of the limewater. Explain why this is safer than stopping heating the test-tube while the delivery tube is still in the limewater. ........................................................................................................................................... ..................................................................................................................................... [1] (iv) Copper carbonate is a green powder. When heated, copper carbonate decomposes to form copper oxide which is a black powder. The teacher says that not all of the copper carbonate decomposes when it is heated. Suggest the observation the student makes to show that the teacher is correct. ........................................................................................................................................... ..................................................................................................................................... [1] (b) (i) Calculate the average time for the limewater to go milky for copper carbonate and for iron carbonate. Record these values in Table 3.1. [2] (ii) Calculate the rate of reaction for copper carbonate and iron carbonate. Use the equation shown. 100 rate = time Record in Table 3.1 your answers to three significant figures. [2] (c) Using the results in Table 3.1, place the metals copper, iron, magnesium and zinc in order of reactivity, starting with the most reactive. most reactive .................................................. .................................................. .................................................. least reactive .................................................. [1] (d) The student heats the metal carbonate using a blue Bunsen burner flame. Explain why a blue Bunsen burner flame is used instead of a yellow flame. ................................................................................................................................................... ............................................................................................................................................. [1] (e) Suggest one improvement to the procedure to give more confidence in the order of reactivity of the metals given in (c). Do not include repeating the experiment. ................................................................................................................................................... ............................................................................................................................................. [1] [Total: 13]
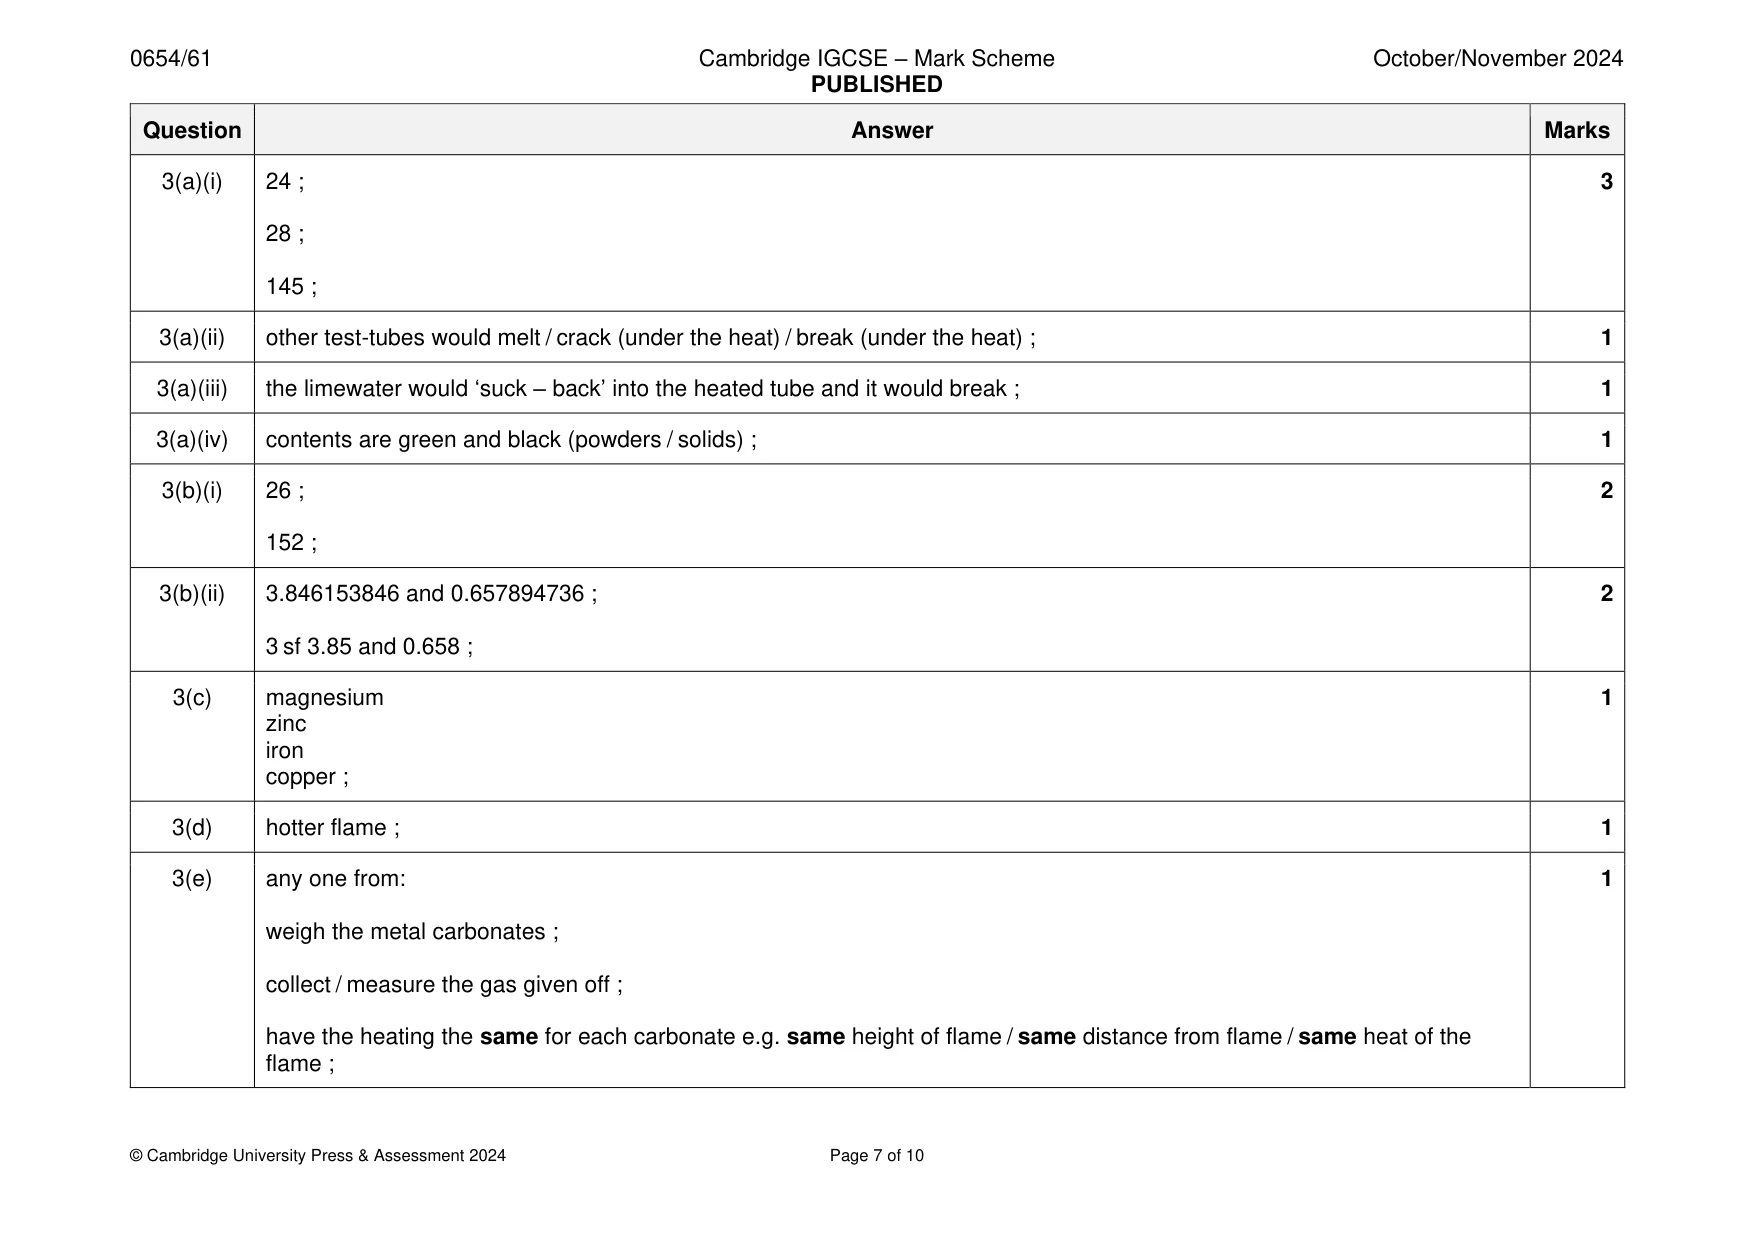
Mark scheme: 3(a)(i) 24 ; 3 28 ; 145 ; 3(a)(ii) other test-tubes would melt / crack (under the heat) / break (under the heat) ; 1 3(a)(iii) the limewater would ‘suck – back’ into the heated tube and it would break ; 1 3(a)(iv) contents are green and black (powders / solids) ; 1 3(b)(i) 26 ; 2 152 ; 3(b)(ii) 3.846153846 and 0.657894736 ; 2 3 sf 3.85 and 0.658 ; 3(c) magnesium 1 zinc iron copper ; 3(d) hotter flame ; 1 3(e) any one from: 1 weigh the metal carbonates ; collect / measure the gas given off ; have the heating the same for each carbonate e.g. same height of flame / same distance from flame / same heat of the flame ;
Q4 · A student investigates the reactivity of metals by measuring the voltage in…
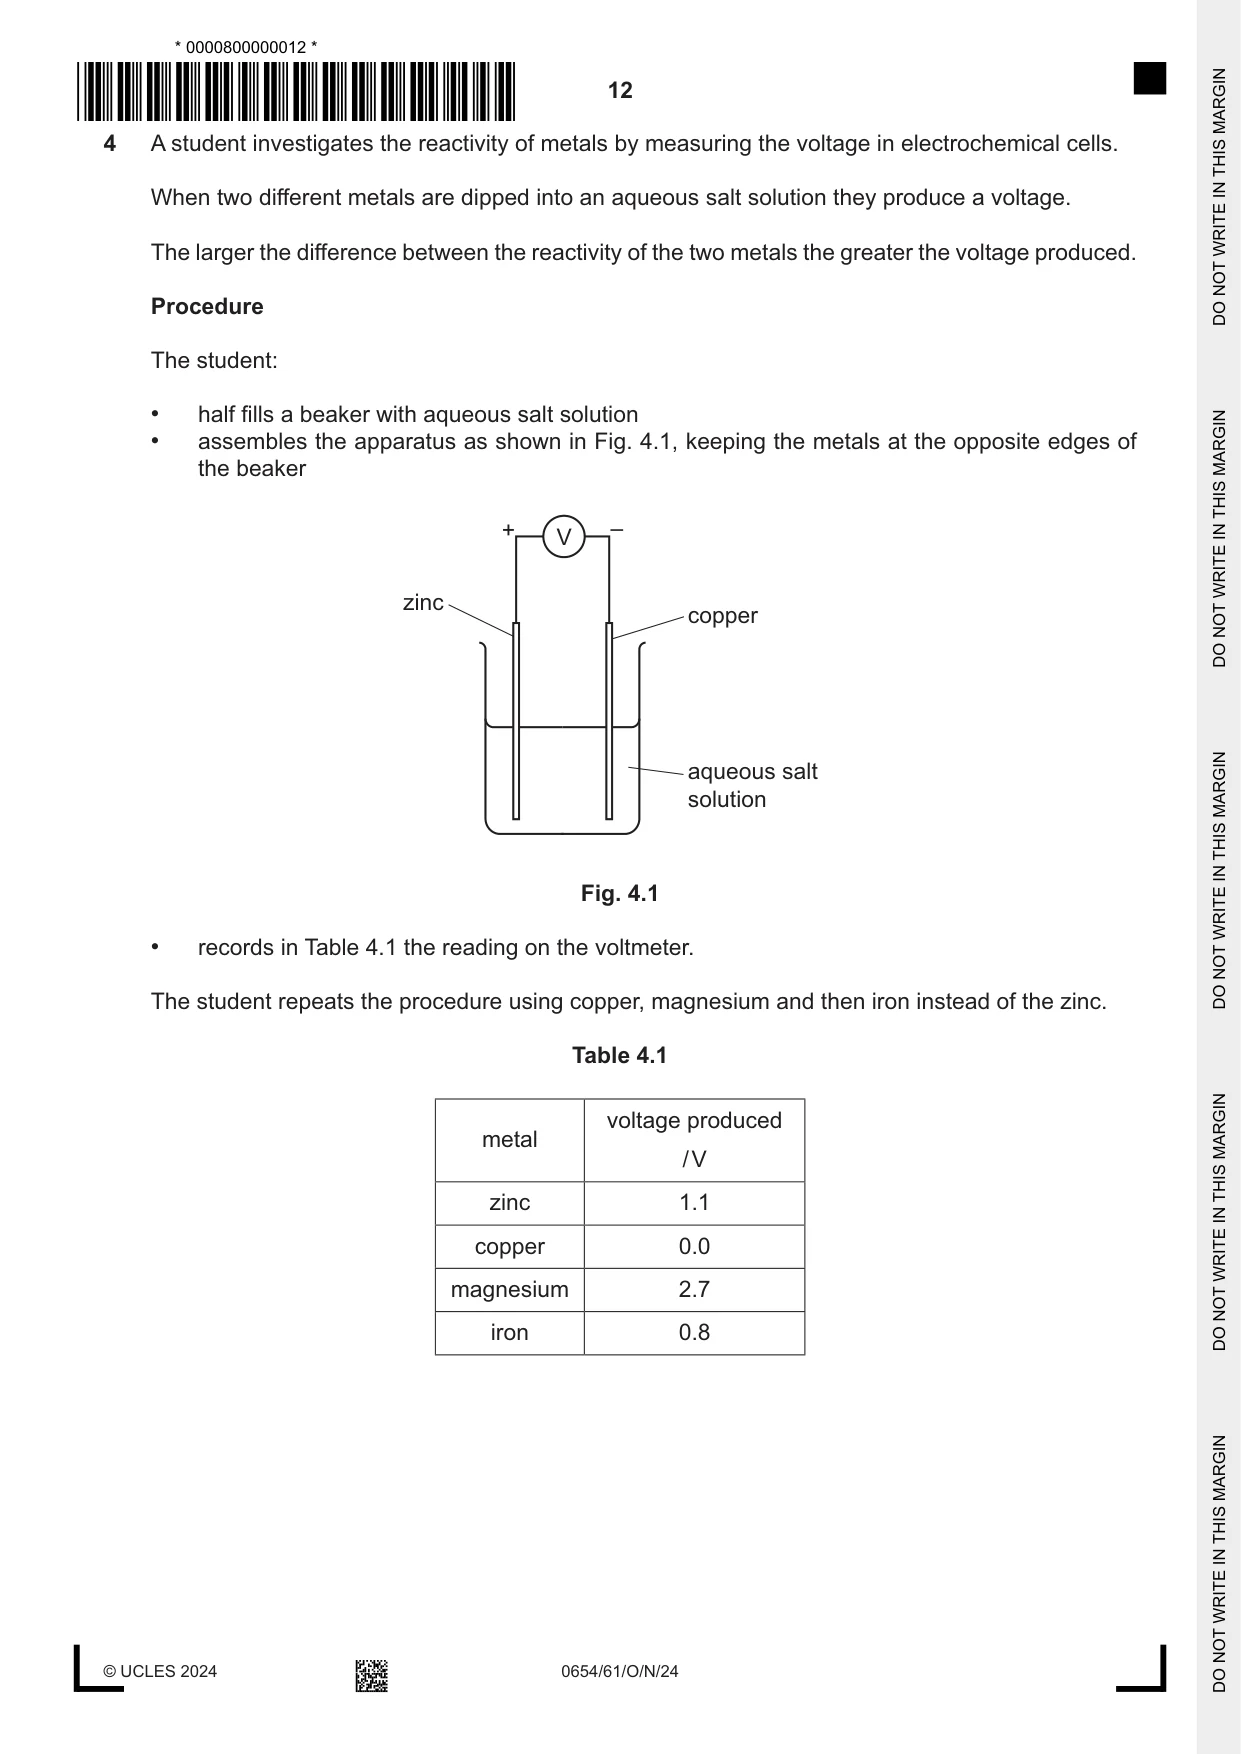
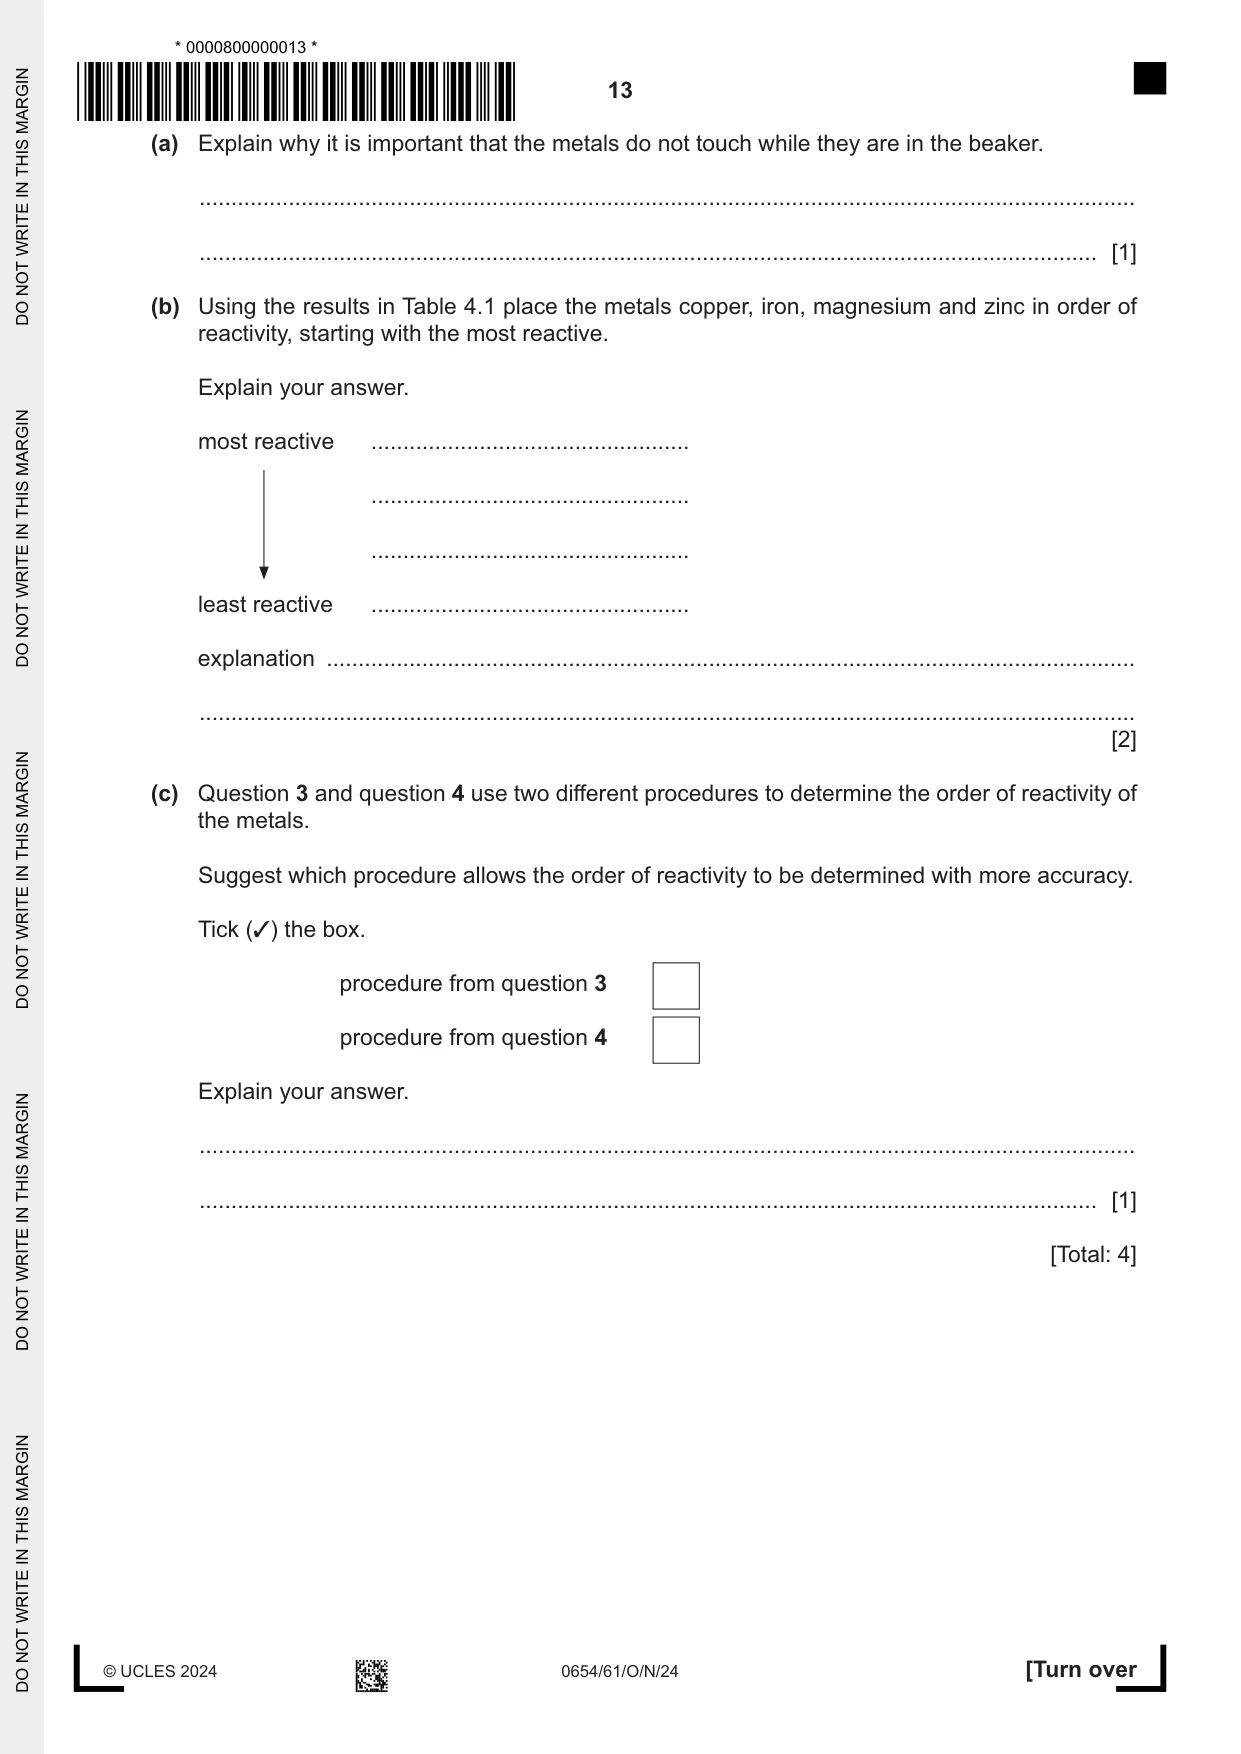
4 A student investigates the reactivity of metals by measuring the voltage in electrochemical cells. When two different metals are dipped into an aqueous salt solution they produce a voltage. The larger the difference between the reactivity of the two metals the greater the voltage produced. Procedure The student: • half fills a beaker with aqueous salt solution • assembles the apparatus as shown in Fig. 4.1, keeping the metals at the opposite edges of the beaker + – V zinc copper aqueous salt solution Fig. 4.1 • records in Table 4.1 the reading on the voltmeter. The student repeats the procedure using copper, magnesium and then iron instead of the zinc. Table 4.1 voltage produced metal / V zinc 1.1 copper 0.0 magnesium 2.7 iron 0.8 (a) Explain why it is important that the metals do not touch while they are in the beaker. ................................................................................................................................................... ............................................................................................................................................. [1] (b) Using the results in Table 4.1 place the metals copper, iron, magnesium and zinc in order of reactivity, starting with the most reactive. Explain your answer. most reactive .................................................. .................................................. .................................................. least reactive .................................................. explanation ............................................................................................................................... ................................................................................................................................................... [2] (c) Question 3 and question 4 use two different procedures to determine the order of reactivity of the metals. Suggest which procedure allows the order of reactivity to be determined with more accuracy. Tick (3) the box. procedure from question 3 procedure from question 4 Explain your answer. ................................................................................................................................................... ............................................................................................................................................. [1] [Total: 4]
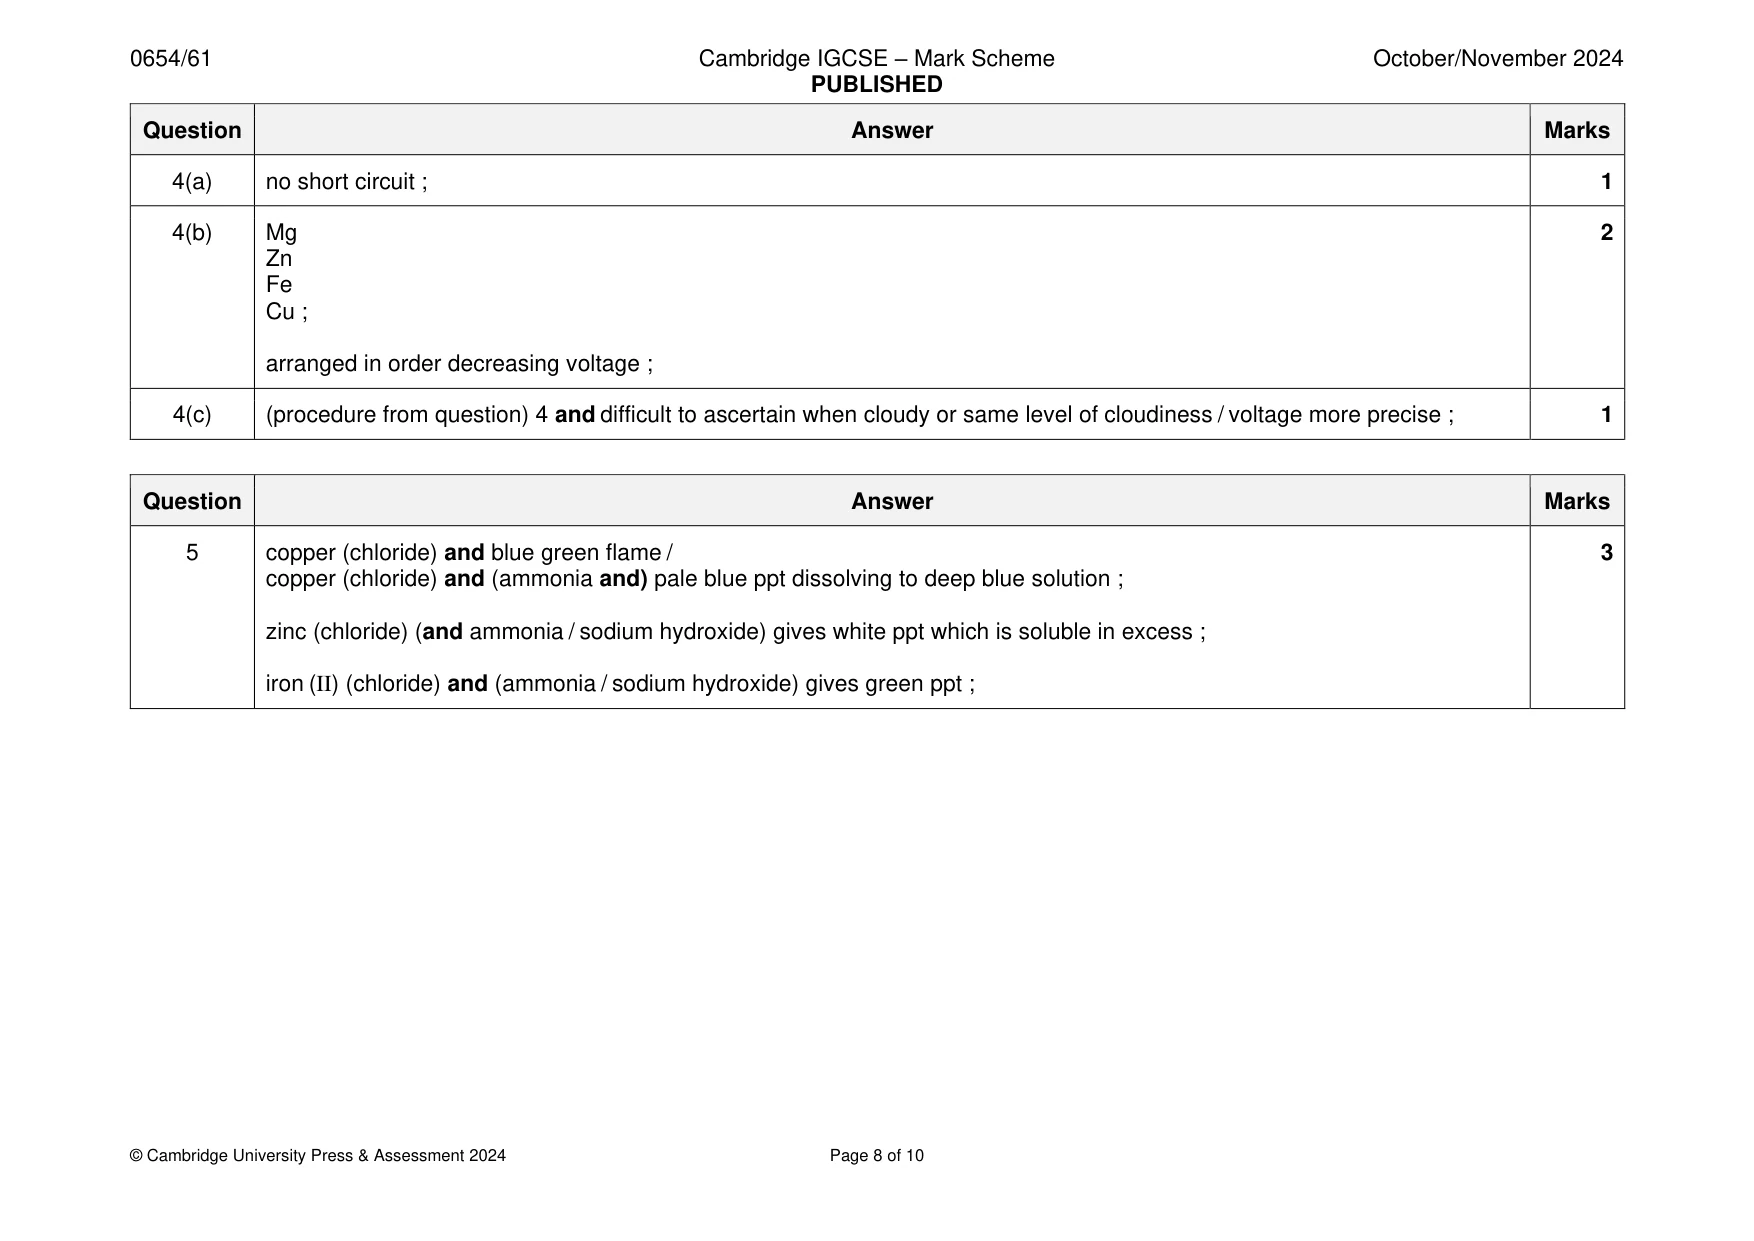
Mark scheme: 4(a) no short circuit ; 1 4(b) Mg 2 Zn Fe Cu ; arranged in order decreasing voltage ; 4(c) (procedure from question) 4 and difficult to ascertain when cloudy or same level of cloudiness / voltage more precise ; 1
Q5 · A student is given four solutions with labels H, J, K and L
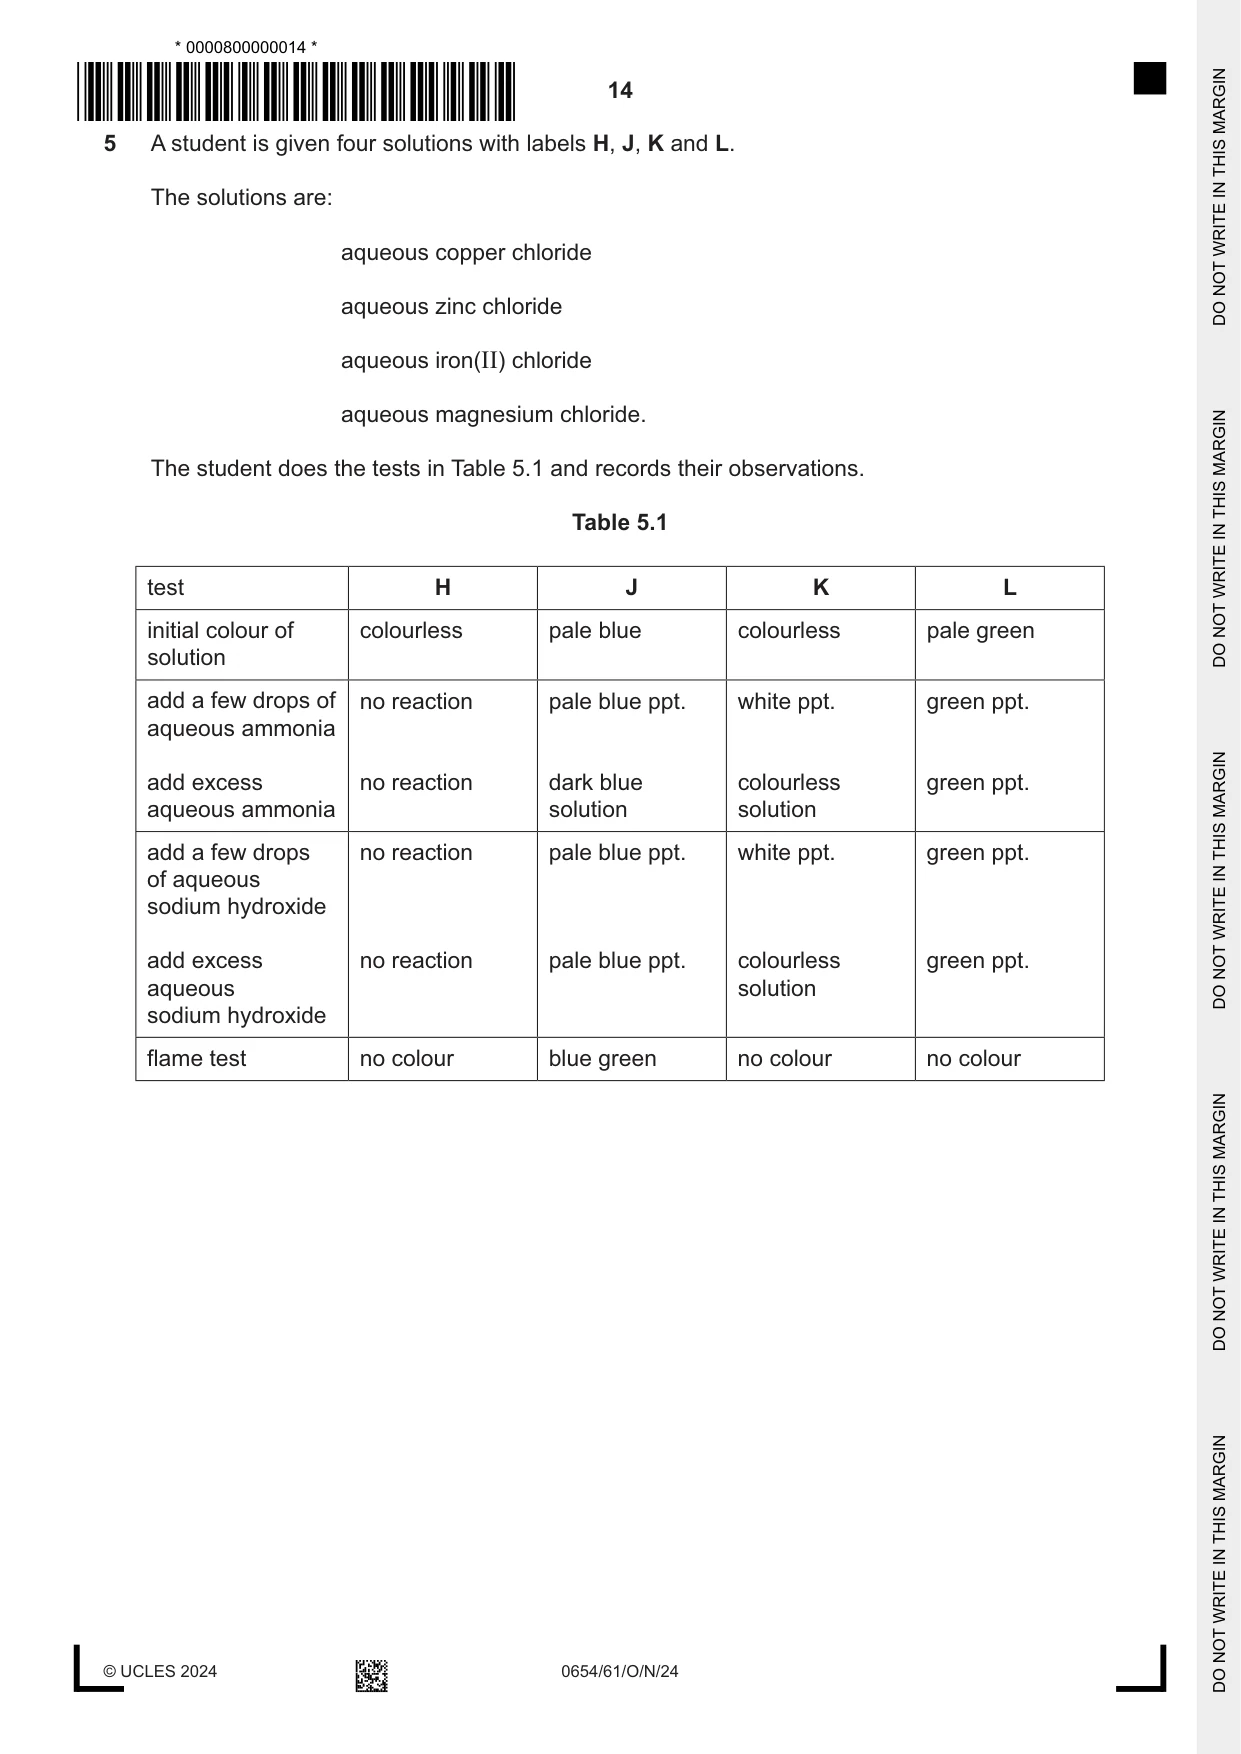
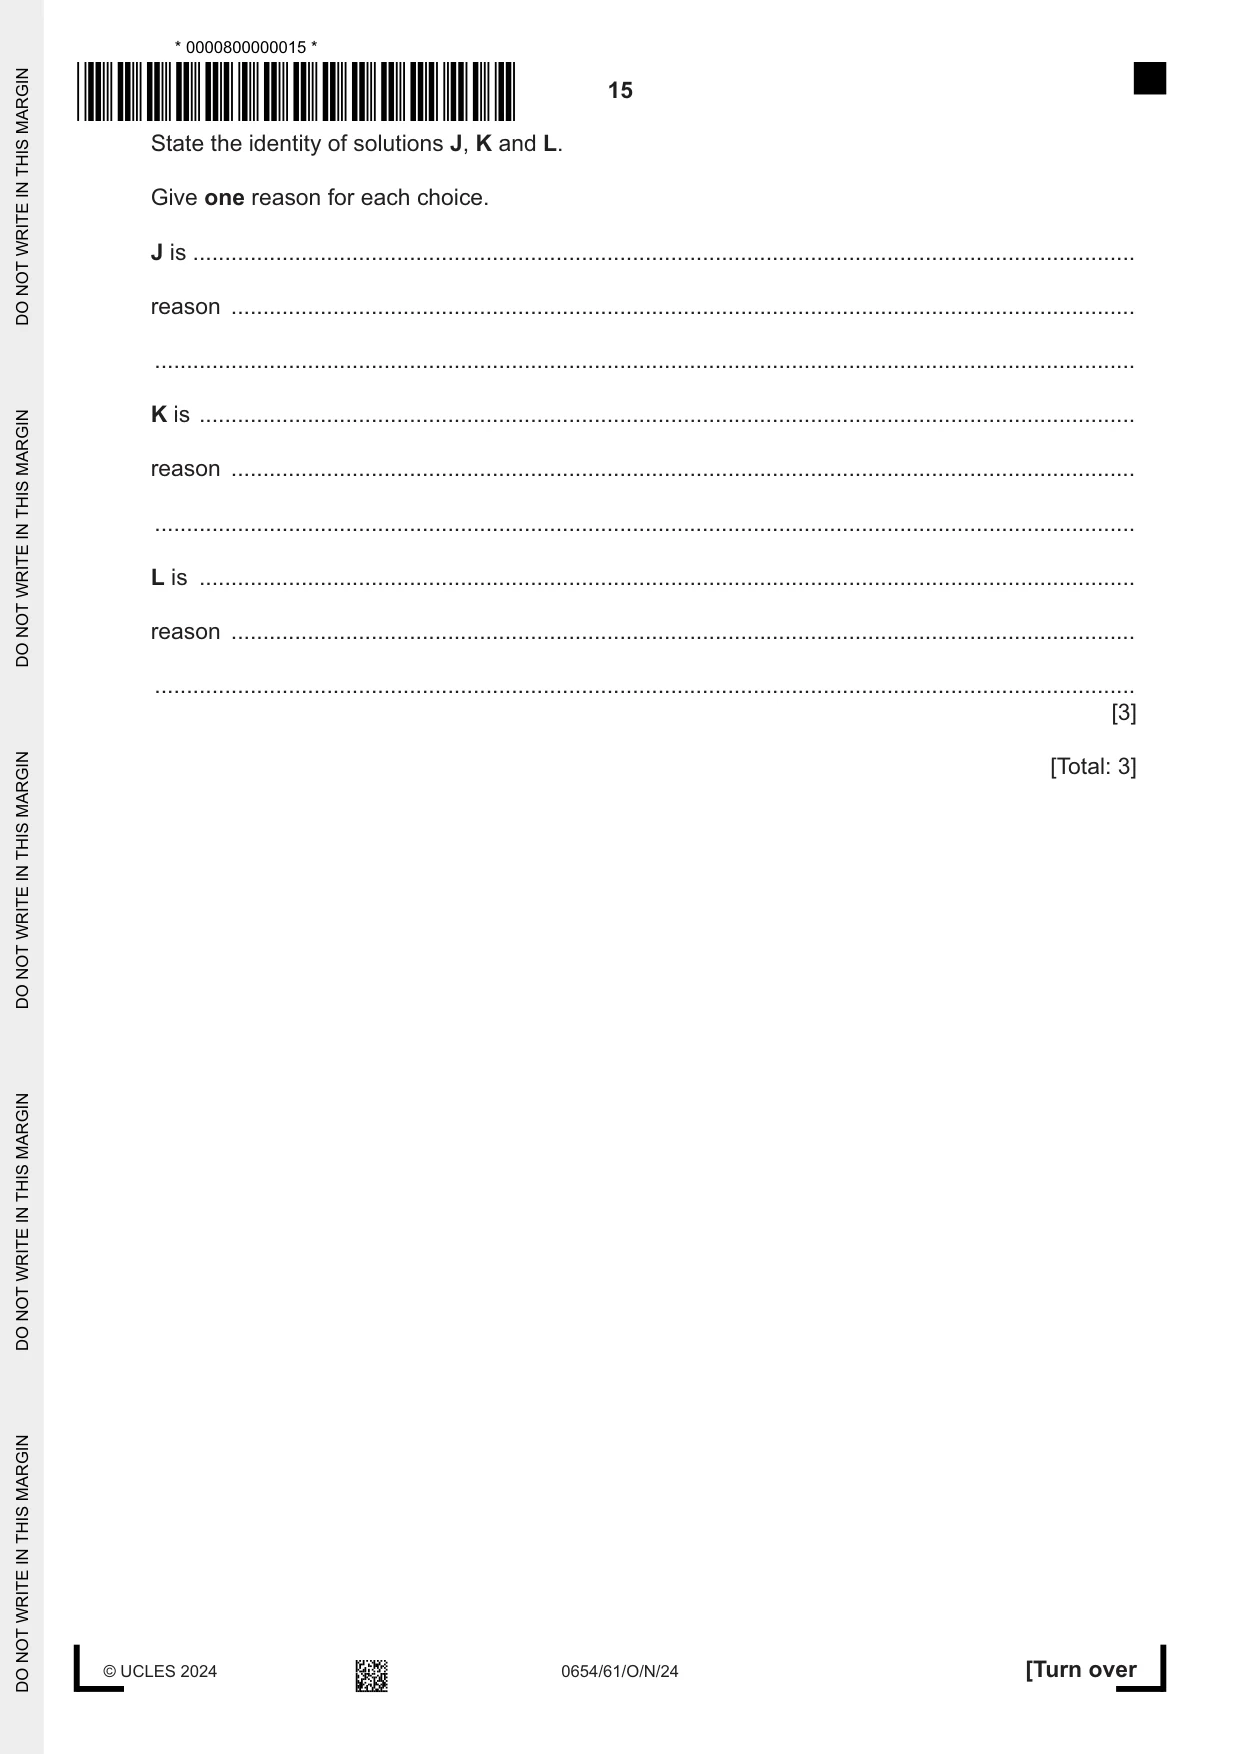
5 A student is given four solutions with labels H, J, K and L. The solutions are: aqueous copper chloride aqueous zinc chloride aqueous iron(II) chloride aqueous magnesium chloride. The student does the tests in Table 5.1 and records their observations. Table 5.1 test H J K L initial colour of colourless pale blue colourless pale green solution add a few drops of no reaction pale blue ppt. white ppt. green ppt. aqueous ammonia add excess no reaction dark blue colourless green ppt. aqueous ammonia solution solution add a few drops no reaction pale blue ppt. white ppt. green ppt. of aqueous sodium hydroxide add excess no reaction pale blue ppt. colourless green ppt. aqueous solution sodium hydroxide flame test no colour blue green no colour no colour State the identity of solutions J, K and L. Give one reason for each choice. J is .................................................................................................................................................... reason .............................................................................................................................................. .......................................................................................................................................................... K is ................................................................................................................................................... reason .............................................................................................................................................. .......................................................................................................................................................... L is ................................................................................................................................................... reason .............................................................................................................................................. .......................................................................................................................................................... [3] [Total: 3]
Mark scheme: 5 copper (chloride) and blue green flame / 3 copper (chloride) and (ammonia and) pale blue ppt dissolving to deep blue solution ; zinc (chloride) (and ammonia / sodium hydroxide) gives white ppt which is soluble in excess ; iron (II) (chloride) and (ammonia / sodium hydroxide) gives green ppt ;
Q6 · A student investigates the changes in potential difference V across a length of…
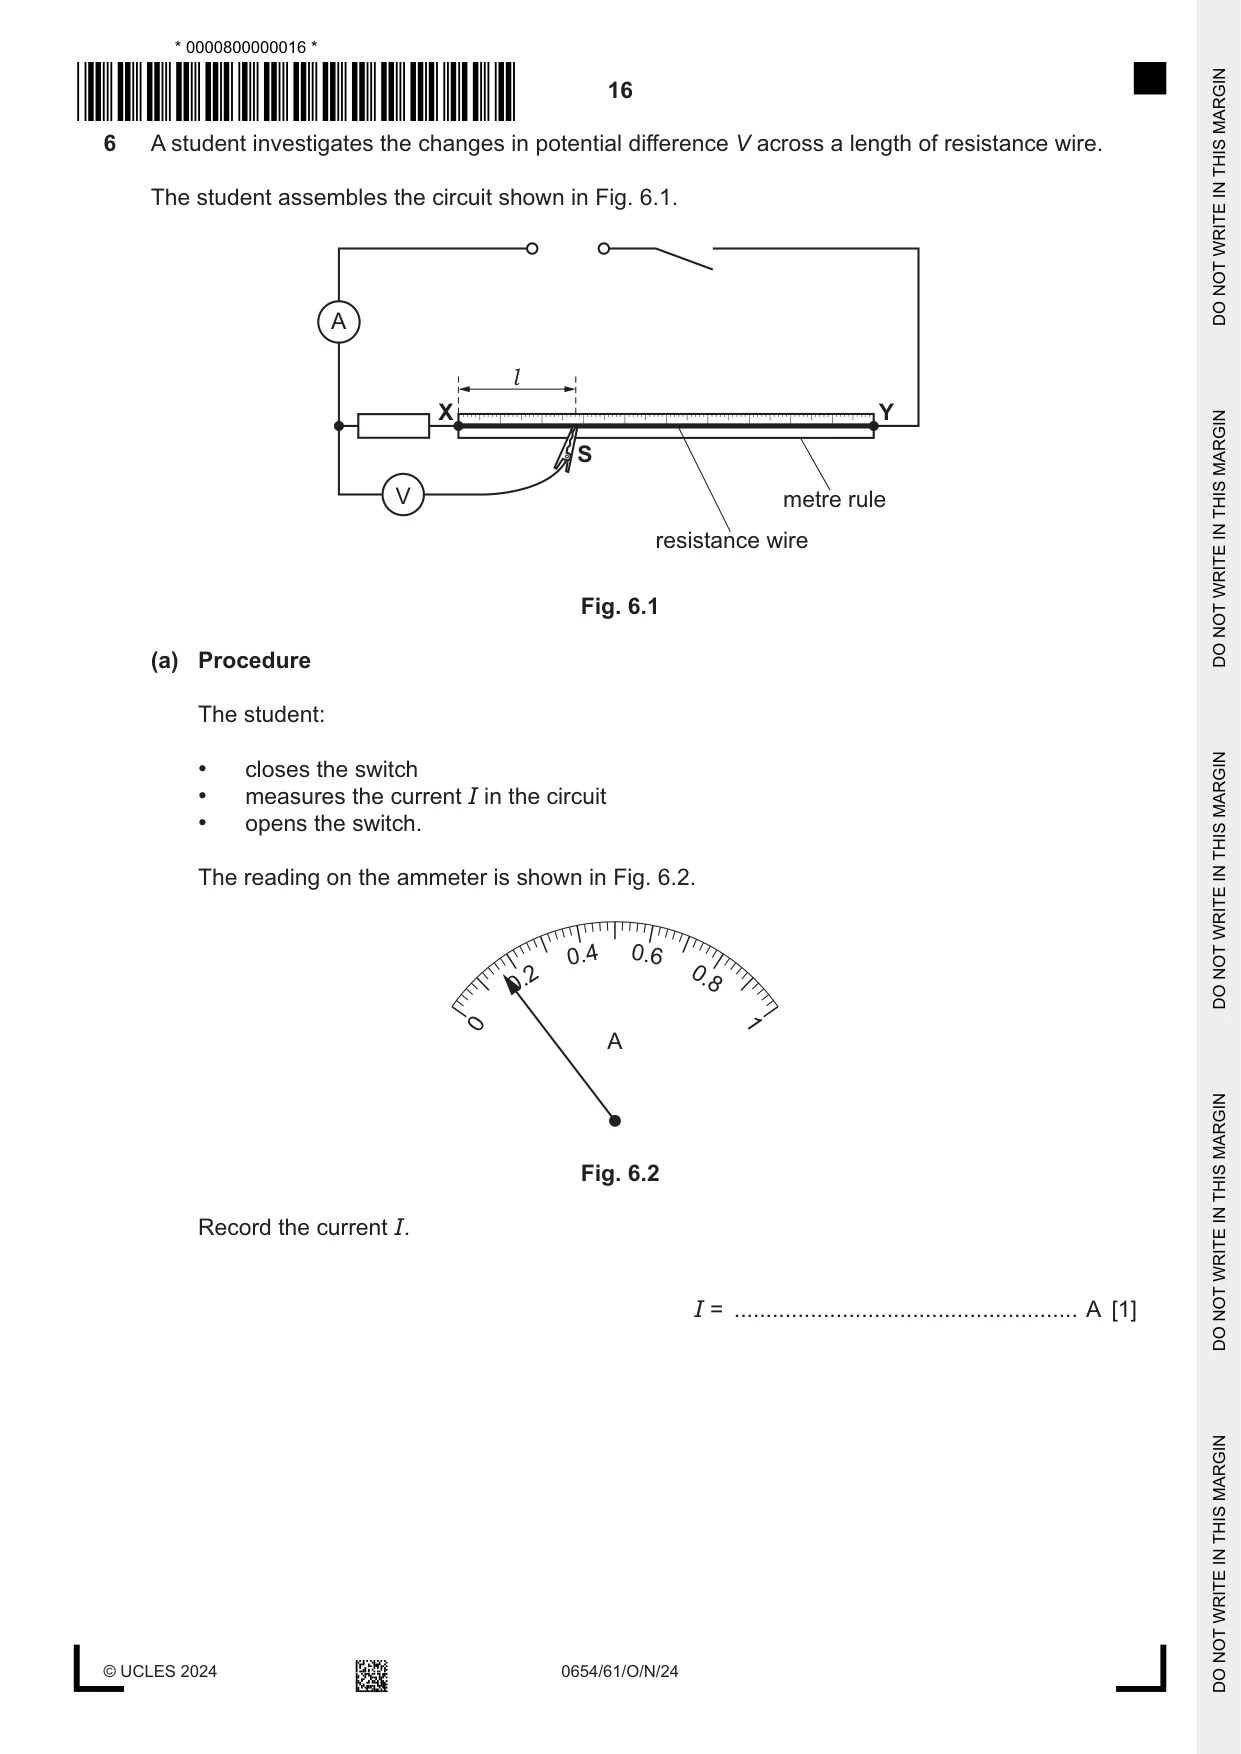
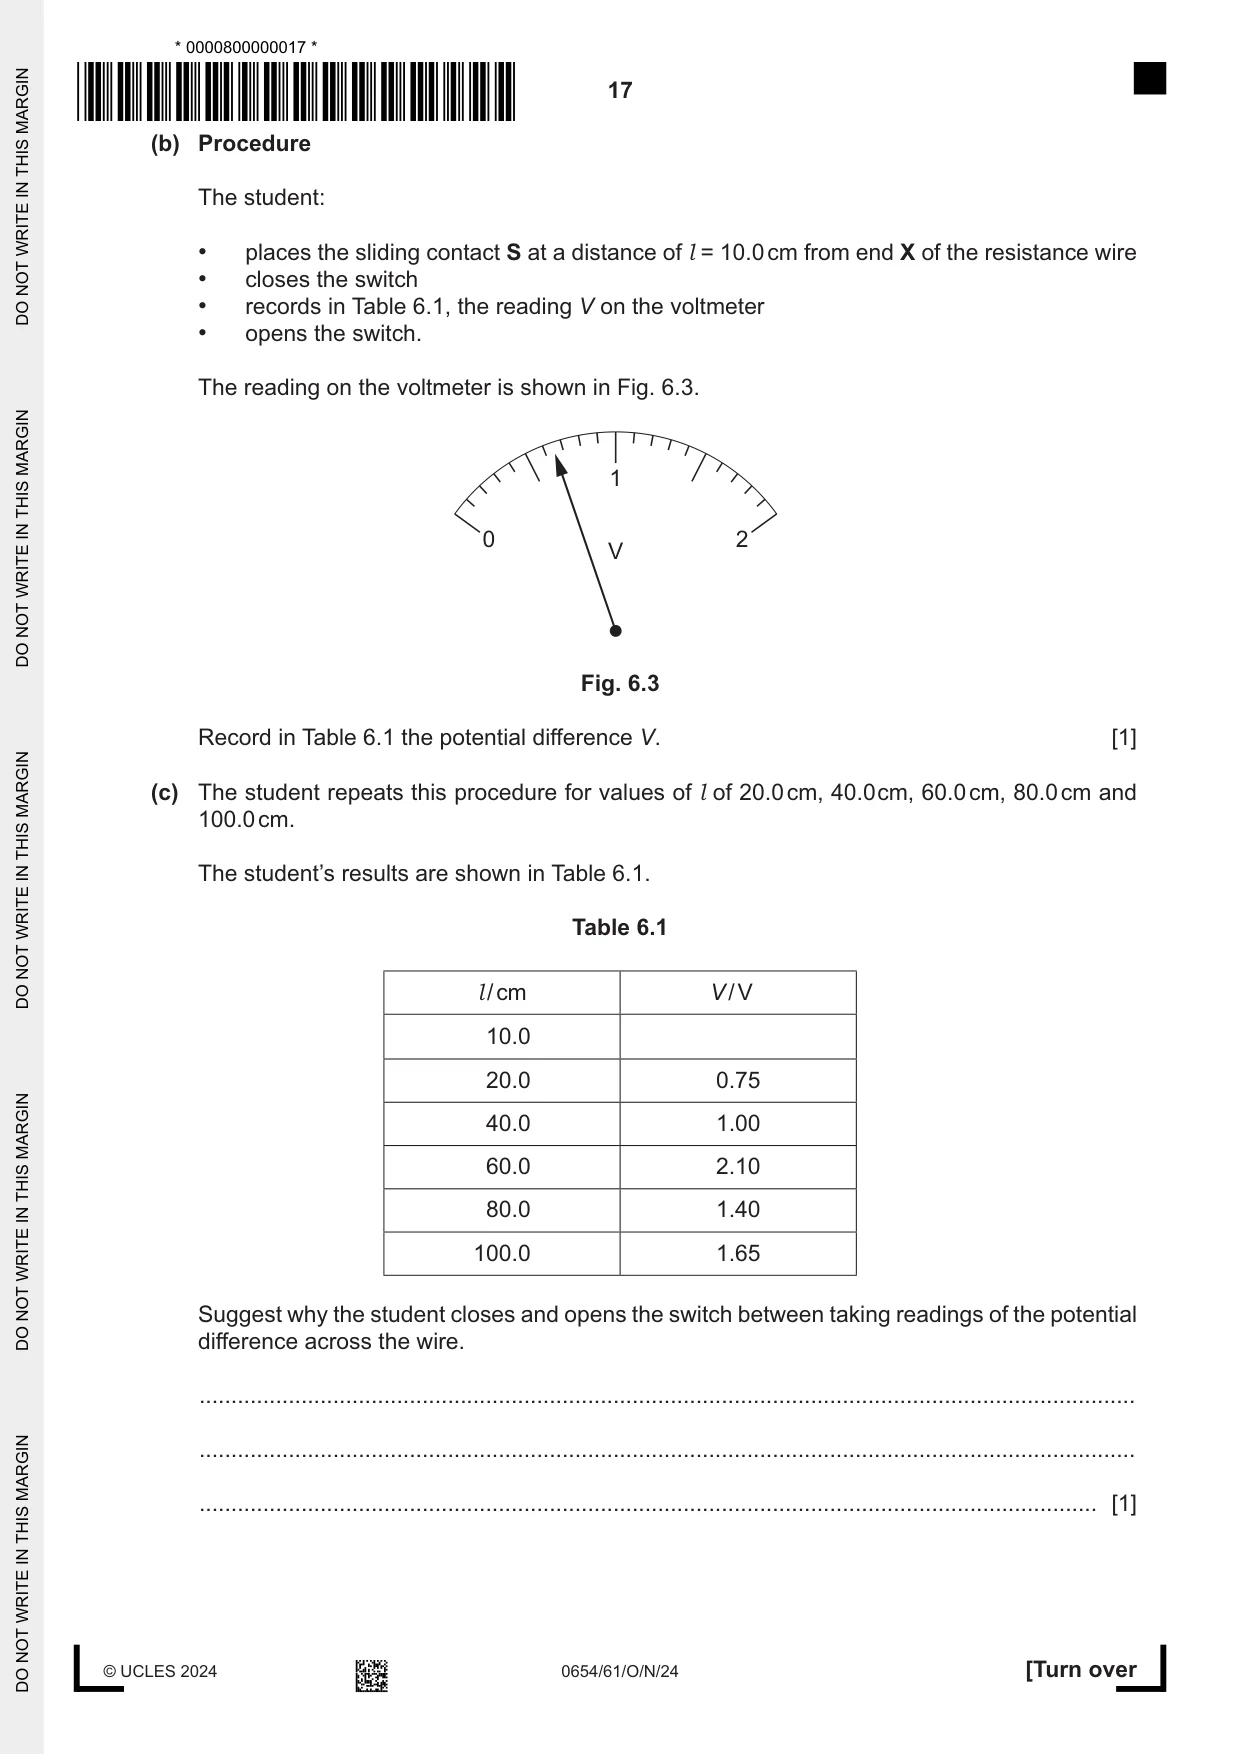
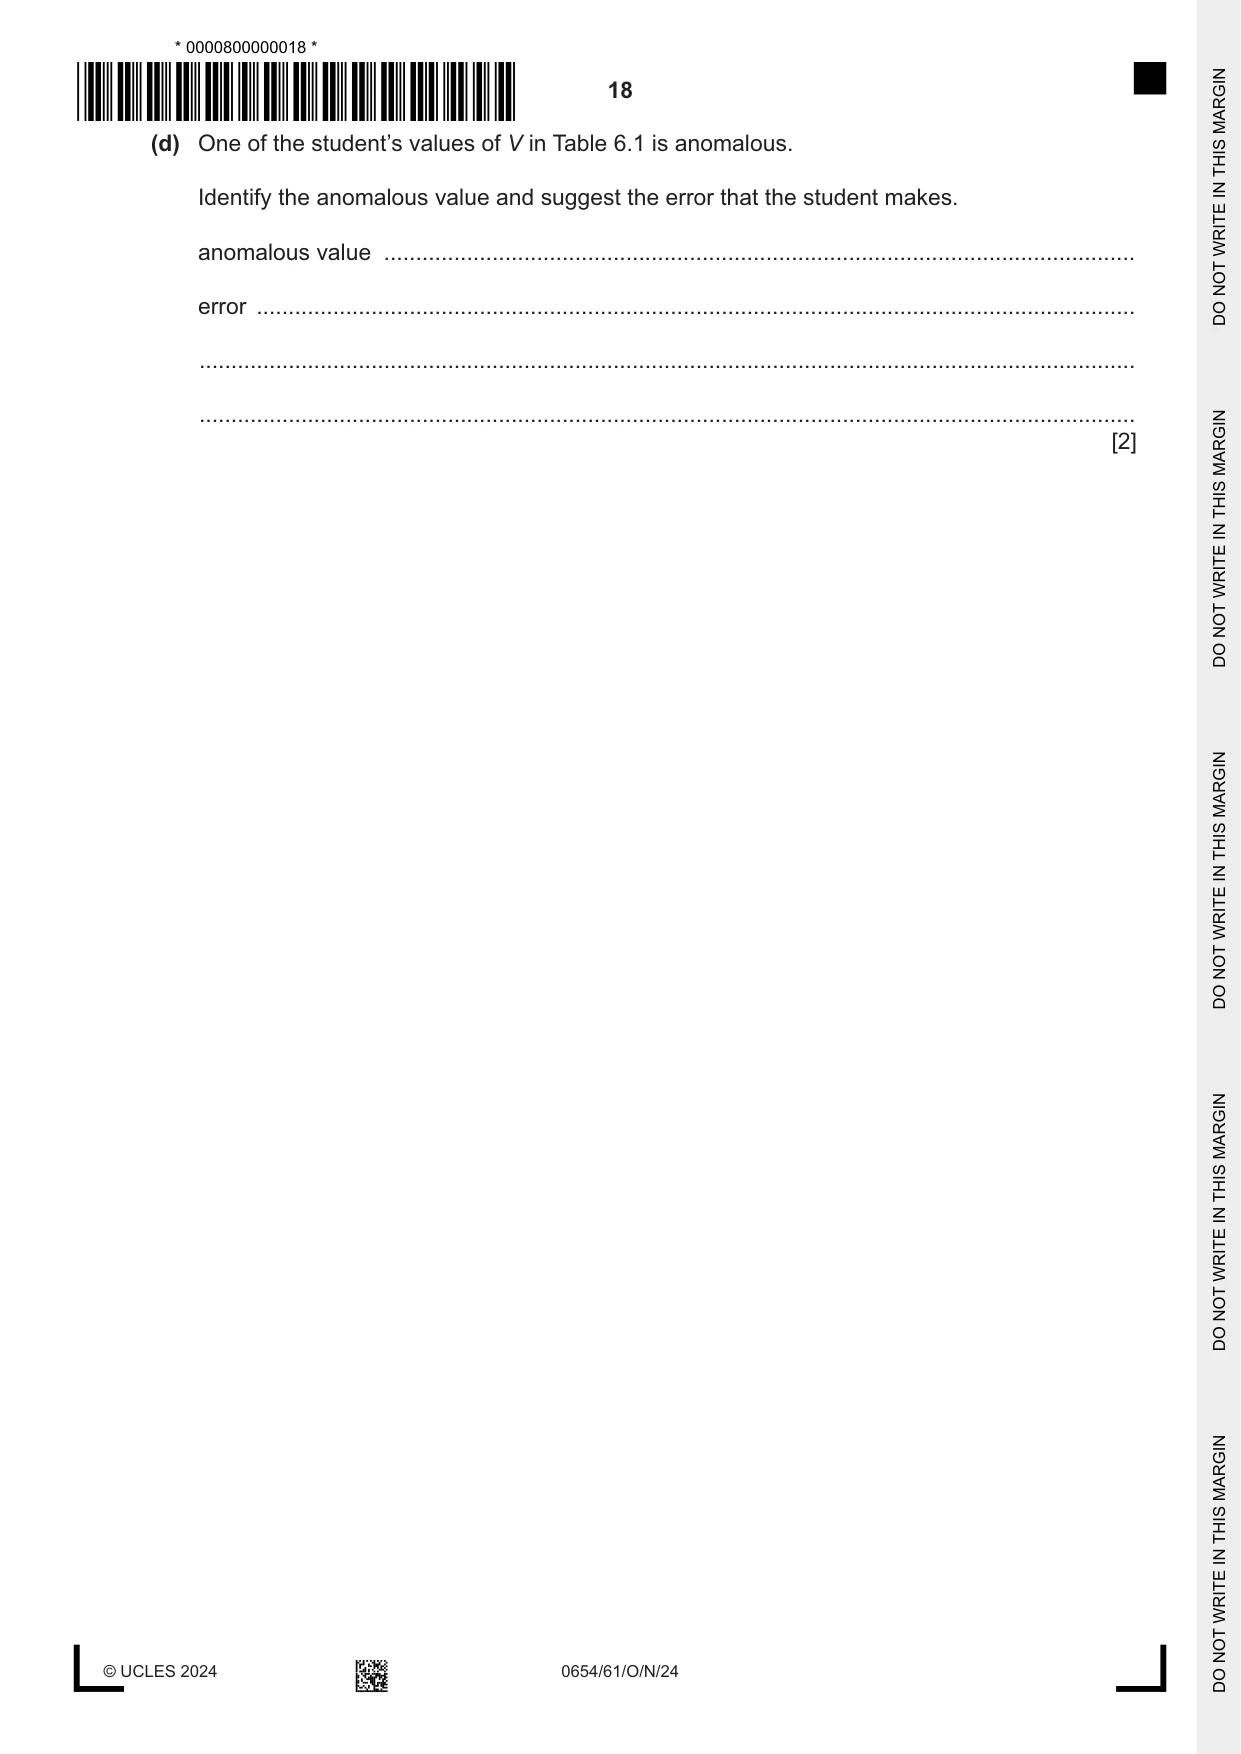
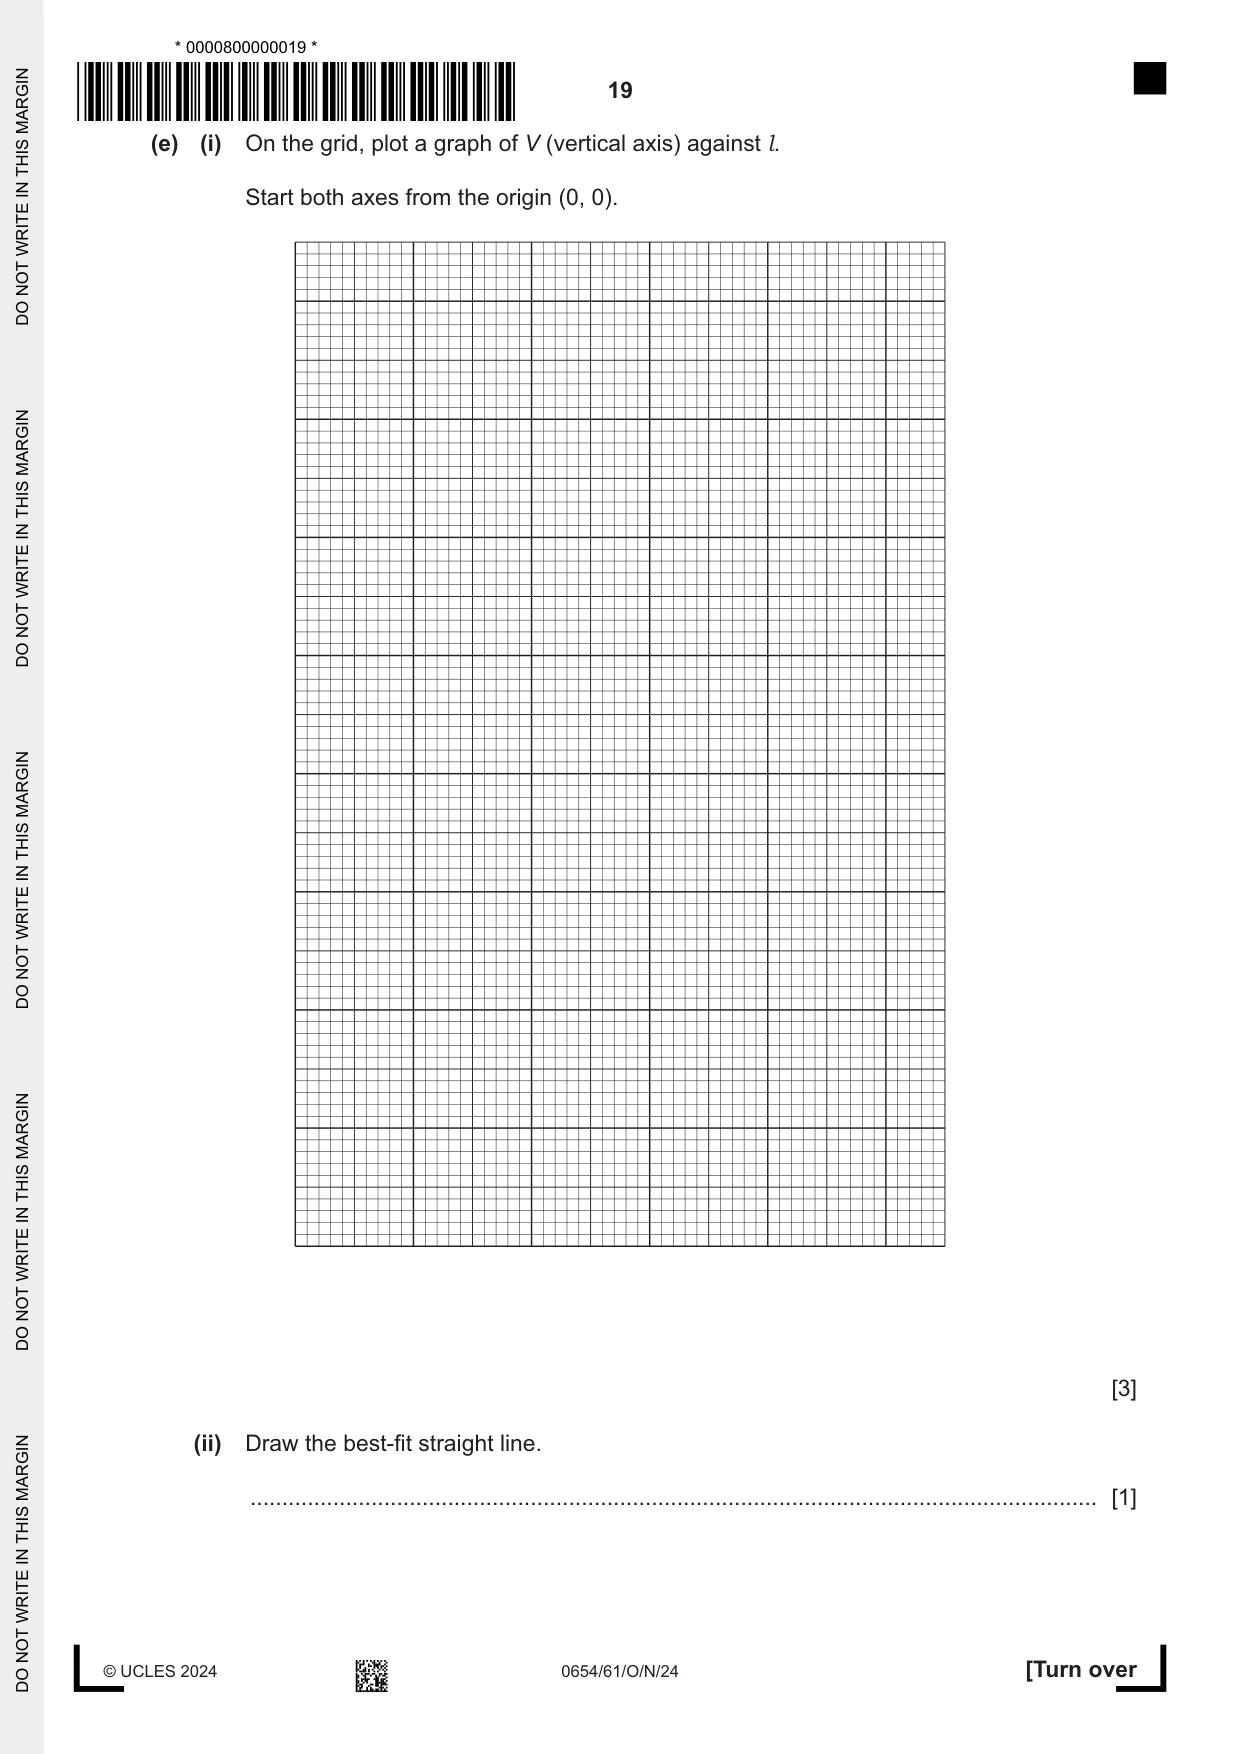
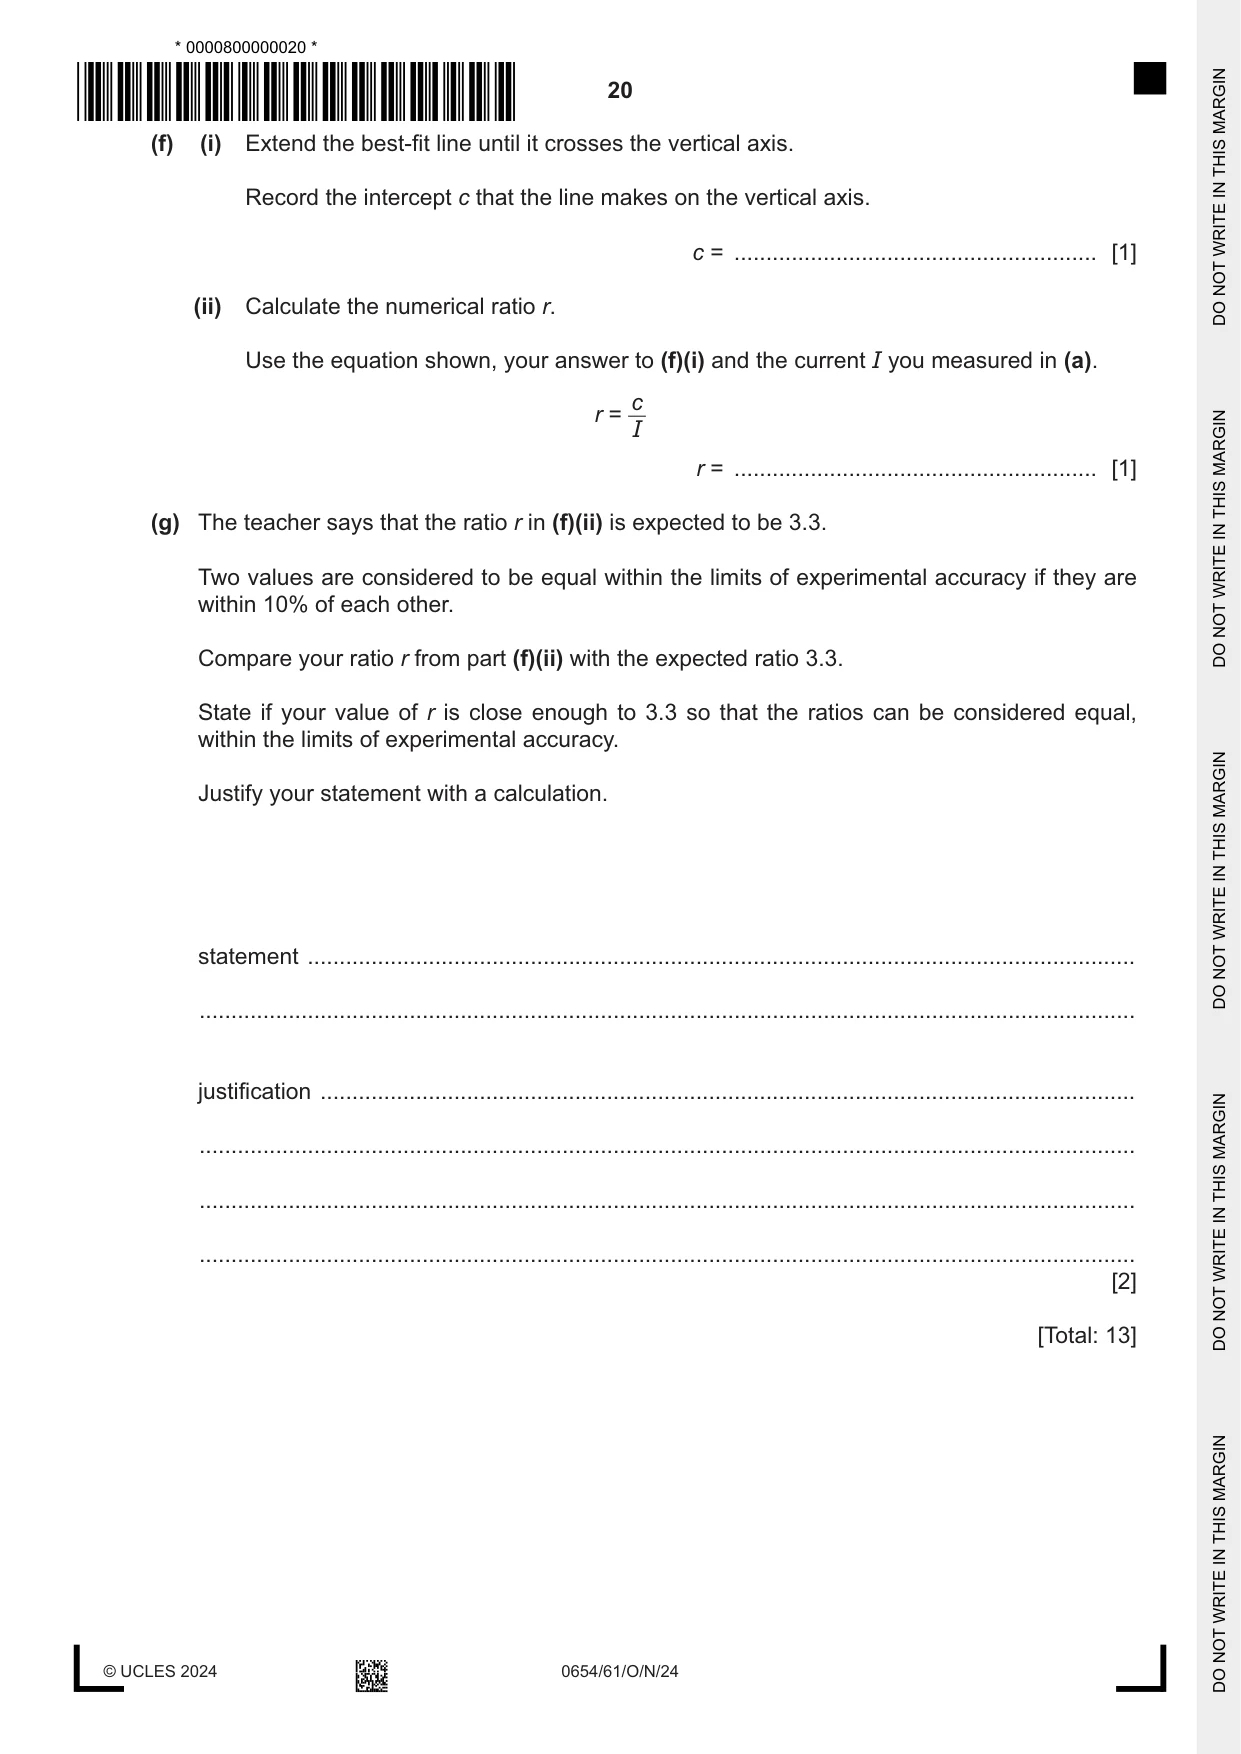
6 A student investigates the changes in potential difference V across a length of resistance wire. The student assembles the circuit shown in Fig. 6.1. A l X Y S V metre rule resistance wire Fig. 6.1 (a) Procedure The student: • closes the switch • measures the current I in the circuit • opens the switch. The reading on the ammeter is shown in Fig. 6.2. 0.4 0.6 0.2 0.8 0 1 A Fig. 6.2 Record the current I. I = ...................................................... A [1] (b) Procedure The student: • places the sliding contact S at a distance of l = 10.0 cm from end X of the resistance wire • closes the switch • records in Table 6.1, the reading V on the voltmeter • opens the switch. The reading on the voltmeter is shown in Fig. 6.3. 1 0 2 V Fig. 6.3 Record in Table 6.1 the potential difference V. [1] (c) The student repeats this procedure for values of l of 20.0 cm, 40.0 cm, 60.0 cm, 80.0 cm and 100.0 cm. The student’s results are shown in Table 6.1. Table 6.1 l / cm V / V 10.0 20.0 0.75 40.0 1.00 60.0 2.10 80.0 1.40 100.0 1.65 Suggest why the student closes and opens the switch between taking readings of the potential difference across the wire. ................................................................................................................................................... ................................................................................................................................................... ............................................................................................................................................. [1] (d) One of the student’s values of V in Table 6.1 is anomalous. Identify the anomalous value and suggest the error that the student makes. anomalous value ...................................................................................................................... error .......................................................................................................................................... ................................................................................................................................................... ................................................................................................................................................... [2] (e) (i) On the grid, plot a graph of V (vertical axis) against l. Start both axes from the origin (0, 0). [3] (ii) Draw the best-fit straight line. ..................................................................................................................................... [1] (f) (i) Extend the best-fit line until it crosses the vertical axis. Record the intercept c that the line makes on the vertical axis. c = ......................................................... [1] (ii) Calculate the numerical ratio r. Use the equation shown, your answer to (f)(i) and the current I you measured in (a). c r = I r = ......................................................... [1] (g) The teacher says that the ratio r in (f)(ii) is expected to be 3.3. Two values are considered to be equal within the limits of experimental accuracy if they are within 10% of each other. Compare your ratio r from part (f)(ii) with the expected ratio 3.3. State if your value of r is close enough to 3.3 so that the ratios can be considered equal, within the limits of experimental accuracy. Justify your statement with a calculation. statement .................................................................................................................................. ................................................................................................................................................... justification ................................................................................................................................ ................................................................................................................................................... ................................................................................................................................................... ................................................................................................................................................... [2] [Total: 13]
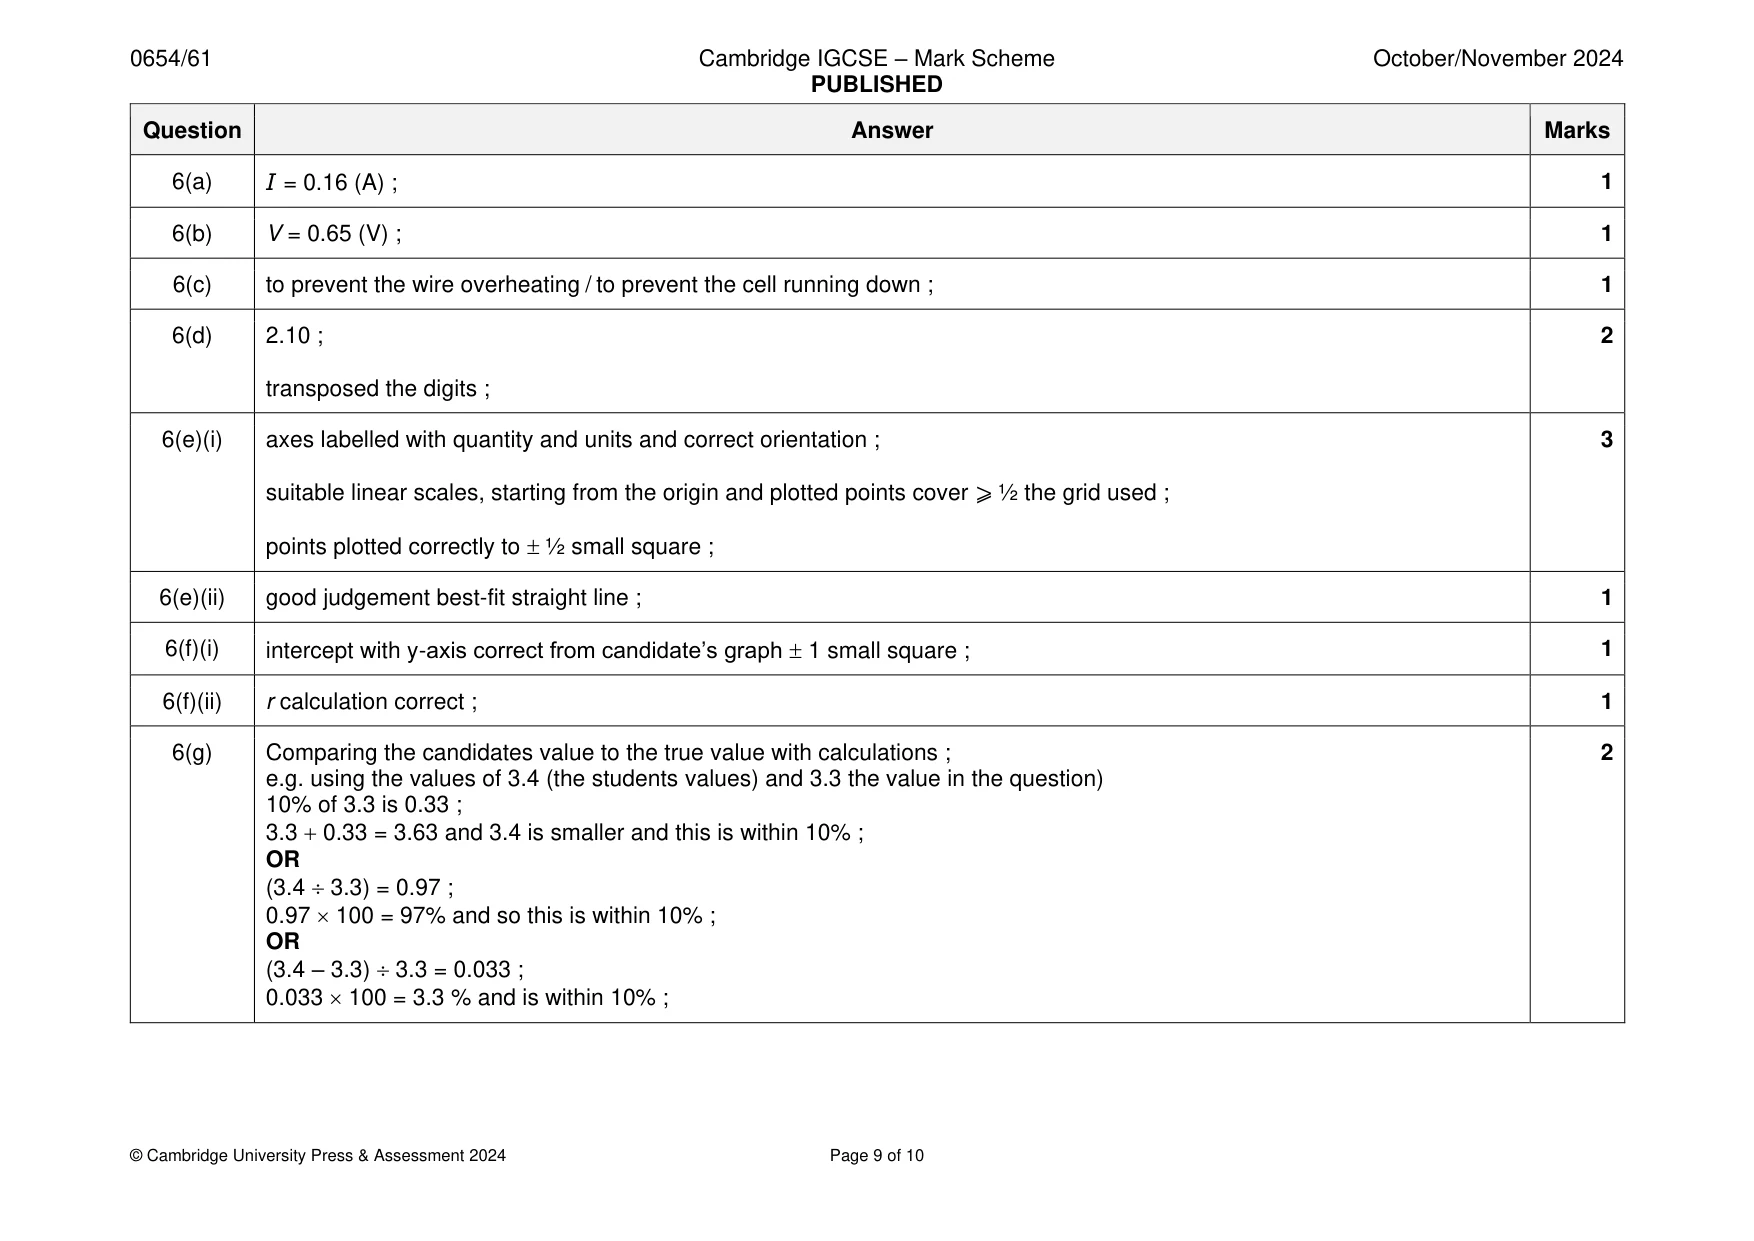
Mark scheme: 6(a) I = 0.16 (A) ; 1 6(b) V = 0.65 (V) ; 1 6(c) to prevent the wire overheating / to prevent the cell running down ; 1 6(d) 2.10 ; 2 transposed the digits ; 6(e)(i) axes labelled with quantity and units and correct orientation ; 3 suitable linear scales, starting from the origin and plotted points cover ⩾ ½ the grid used ; points plotted correctly to ½ small square ; 6(e)(ii) good judgement best-fit straight line ; 1 6(f)(i) intercept with y-axis correct from candidate’s graph 1 small square ; 1 6(f)(ii) r calculation correct ; 1 6(g) Comparing the candidates value to the true value with calculations ; 2 e.g. using the values of 3.4 (the students values) and 3.3 the value in the question) 10% of 3.3 is 0.33 ; 3.3 + 0.33 = 3.63 and 3.4 is smaller and this is within 10% ; OR (3.4 3.3) = 0.97 ; 0.97 100 = 97% and so this is within 10% ; OR (3.4 – 3.3) 3.3 = 0.033 ; 0.033 100 = 3.3 % and is within 10% ;
Q7 · A student measures the density of water using two different methods
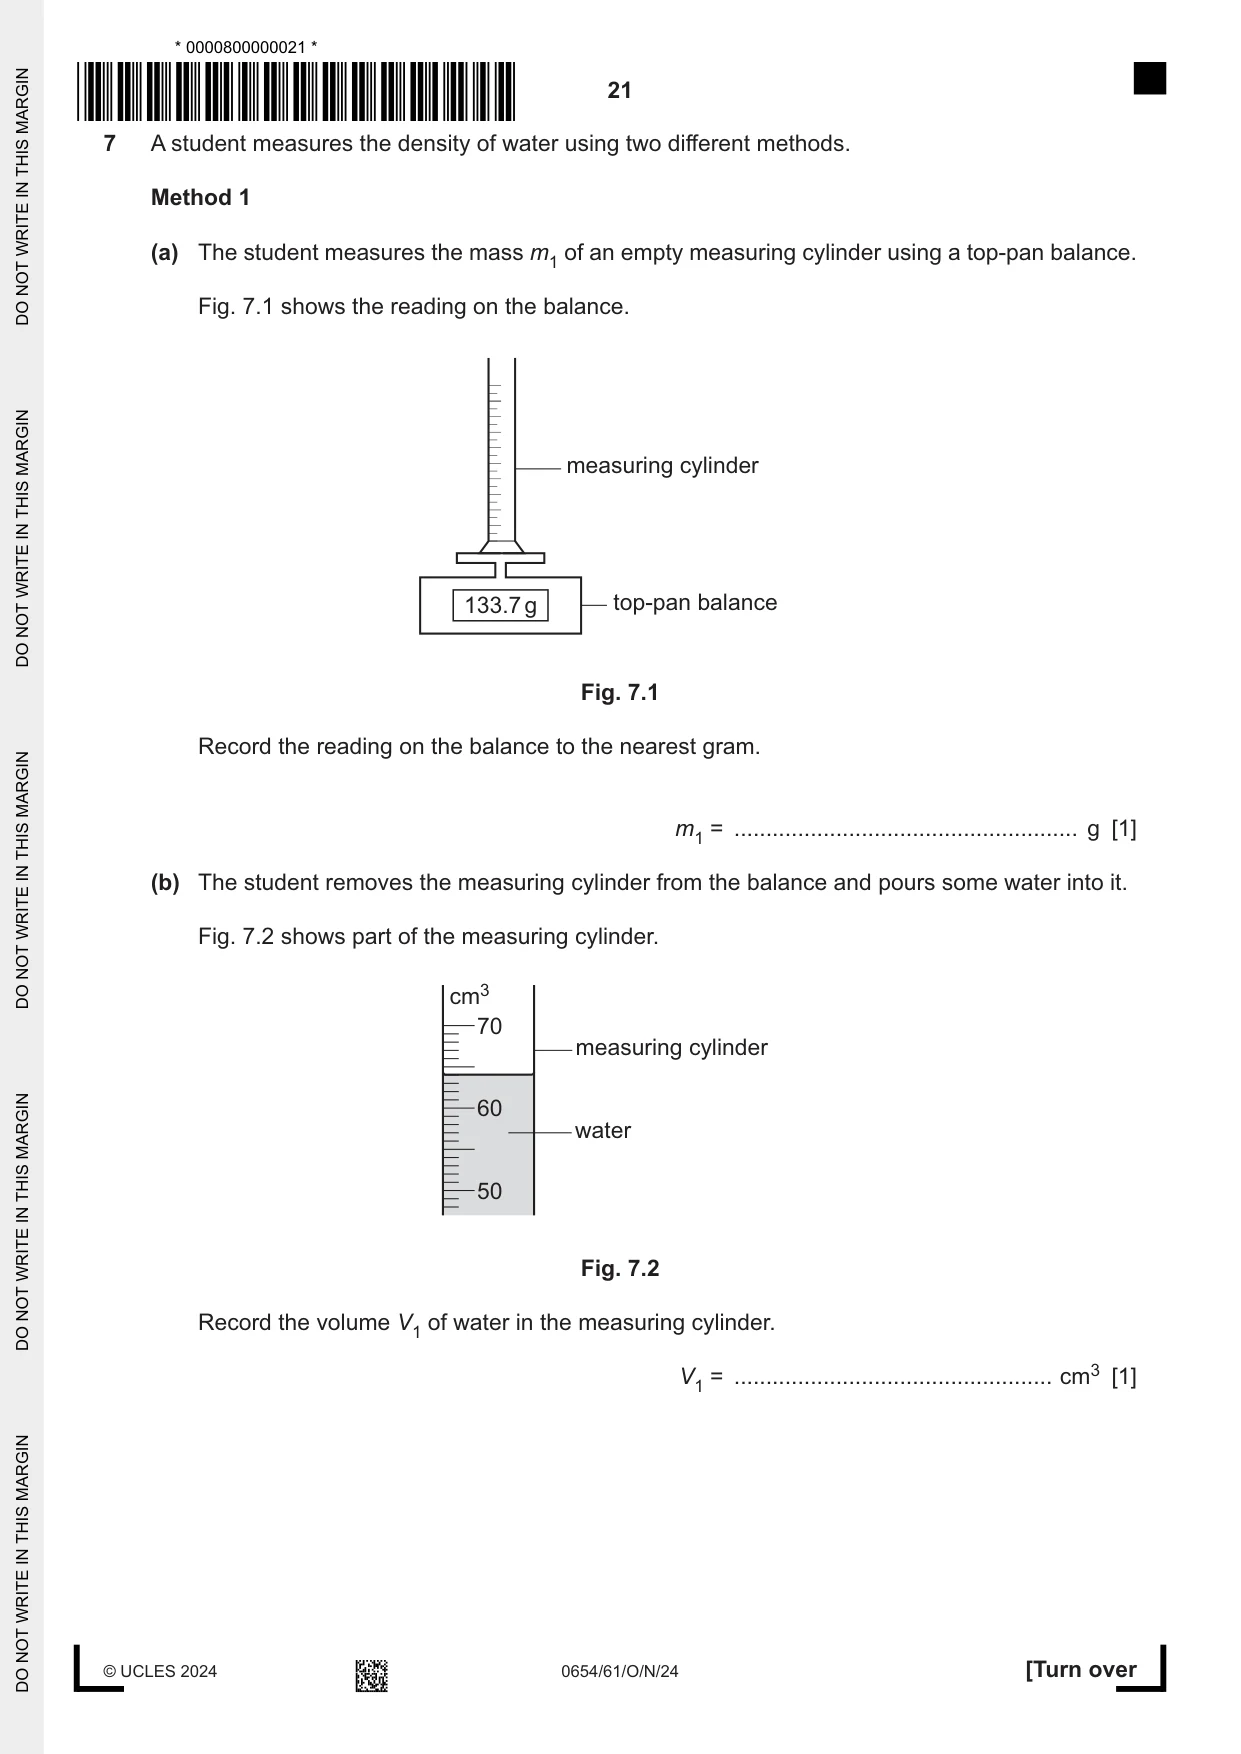
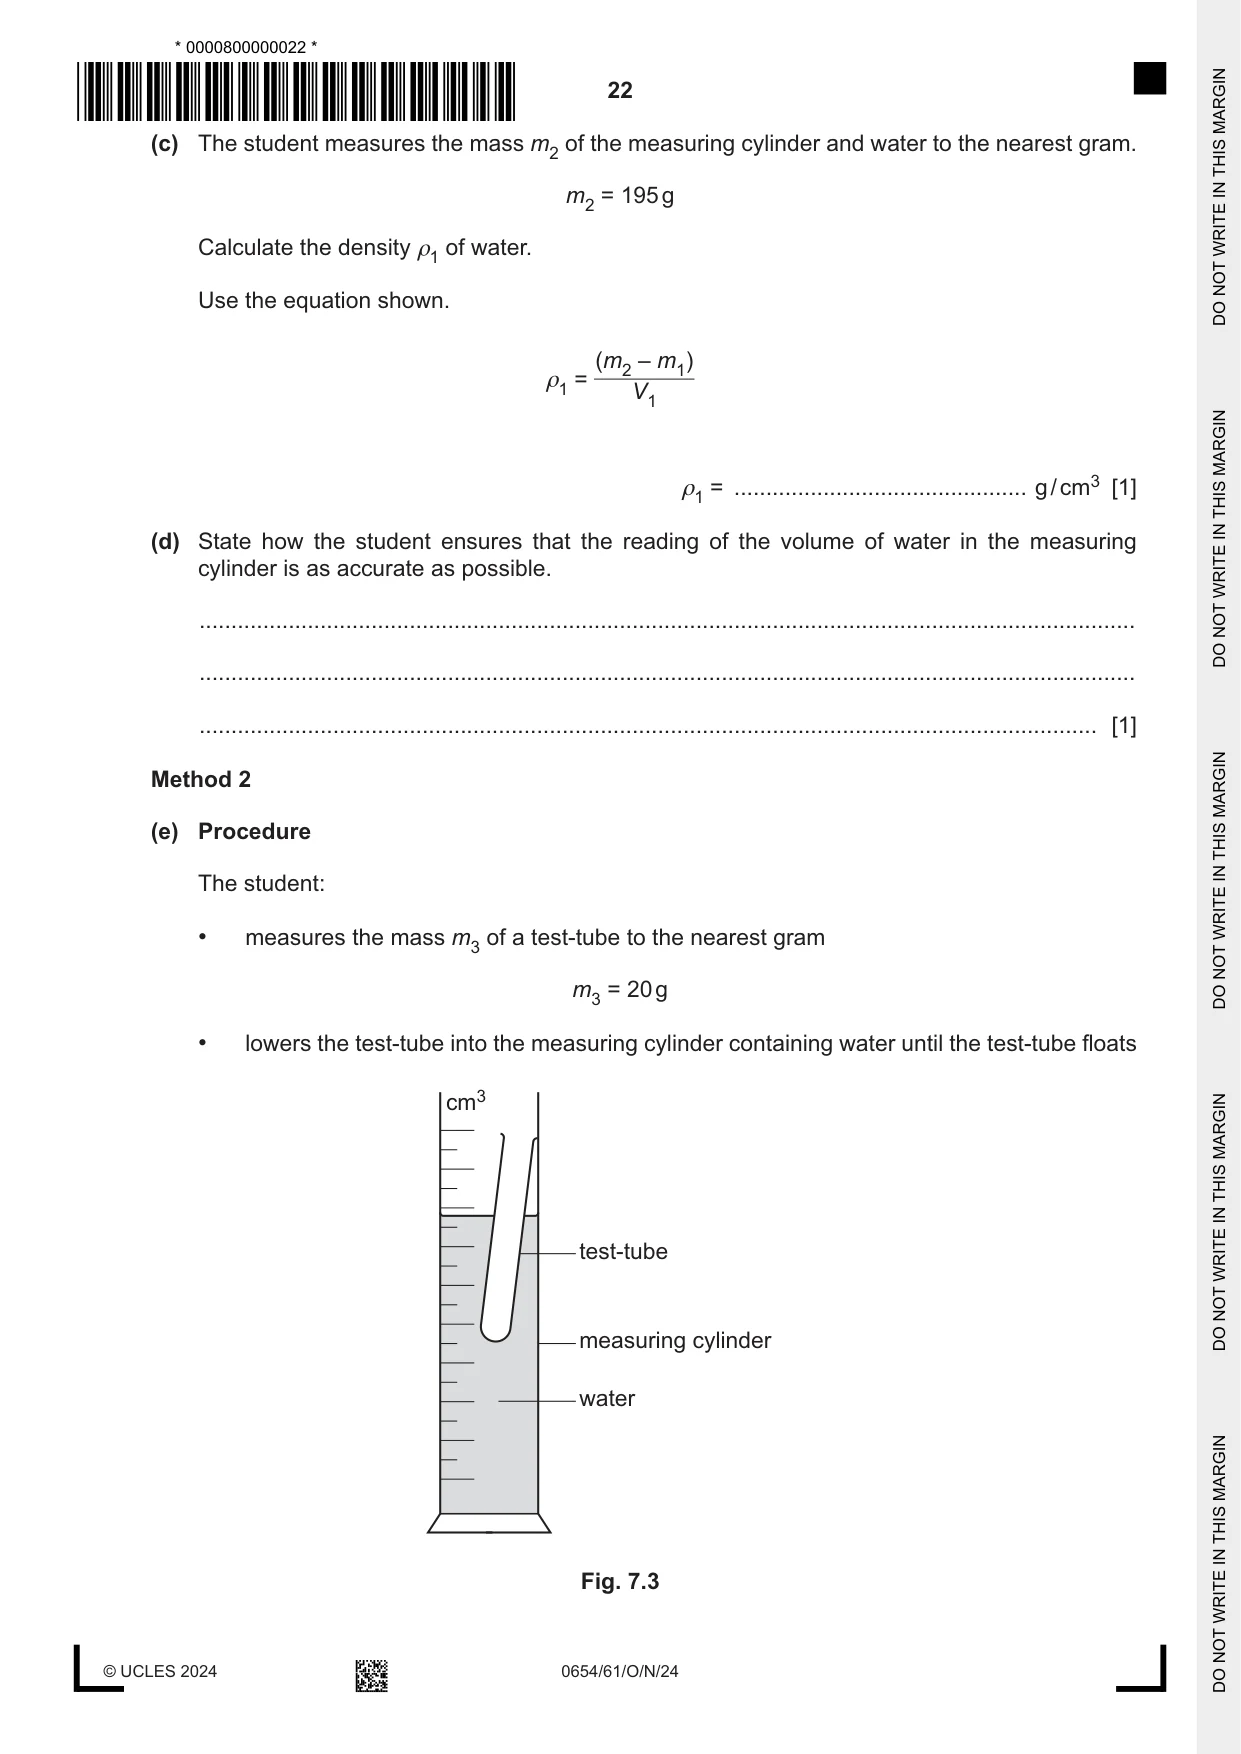
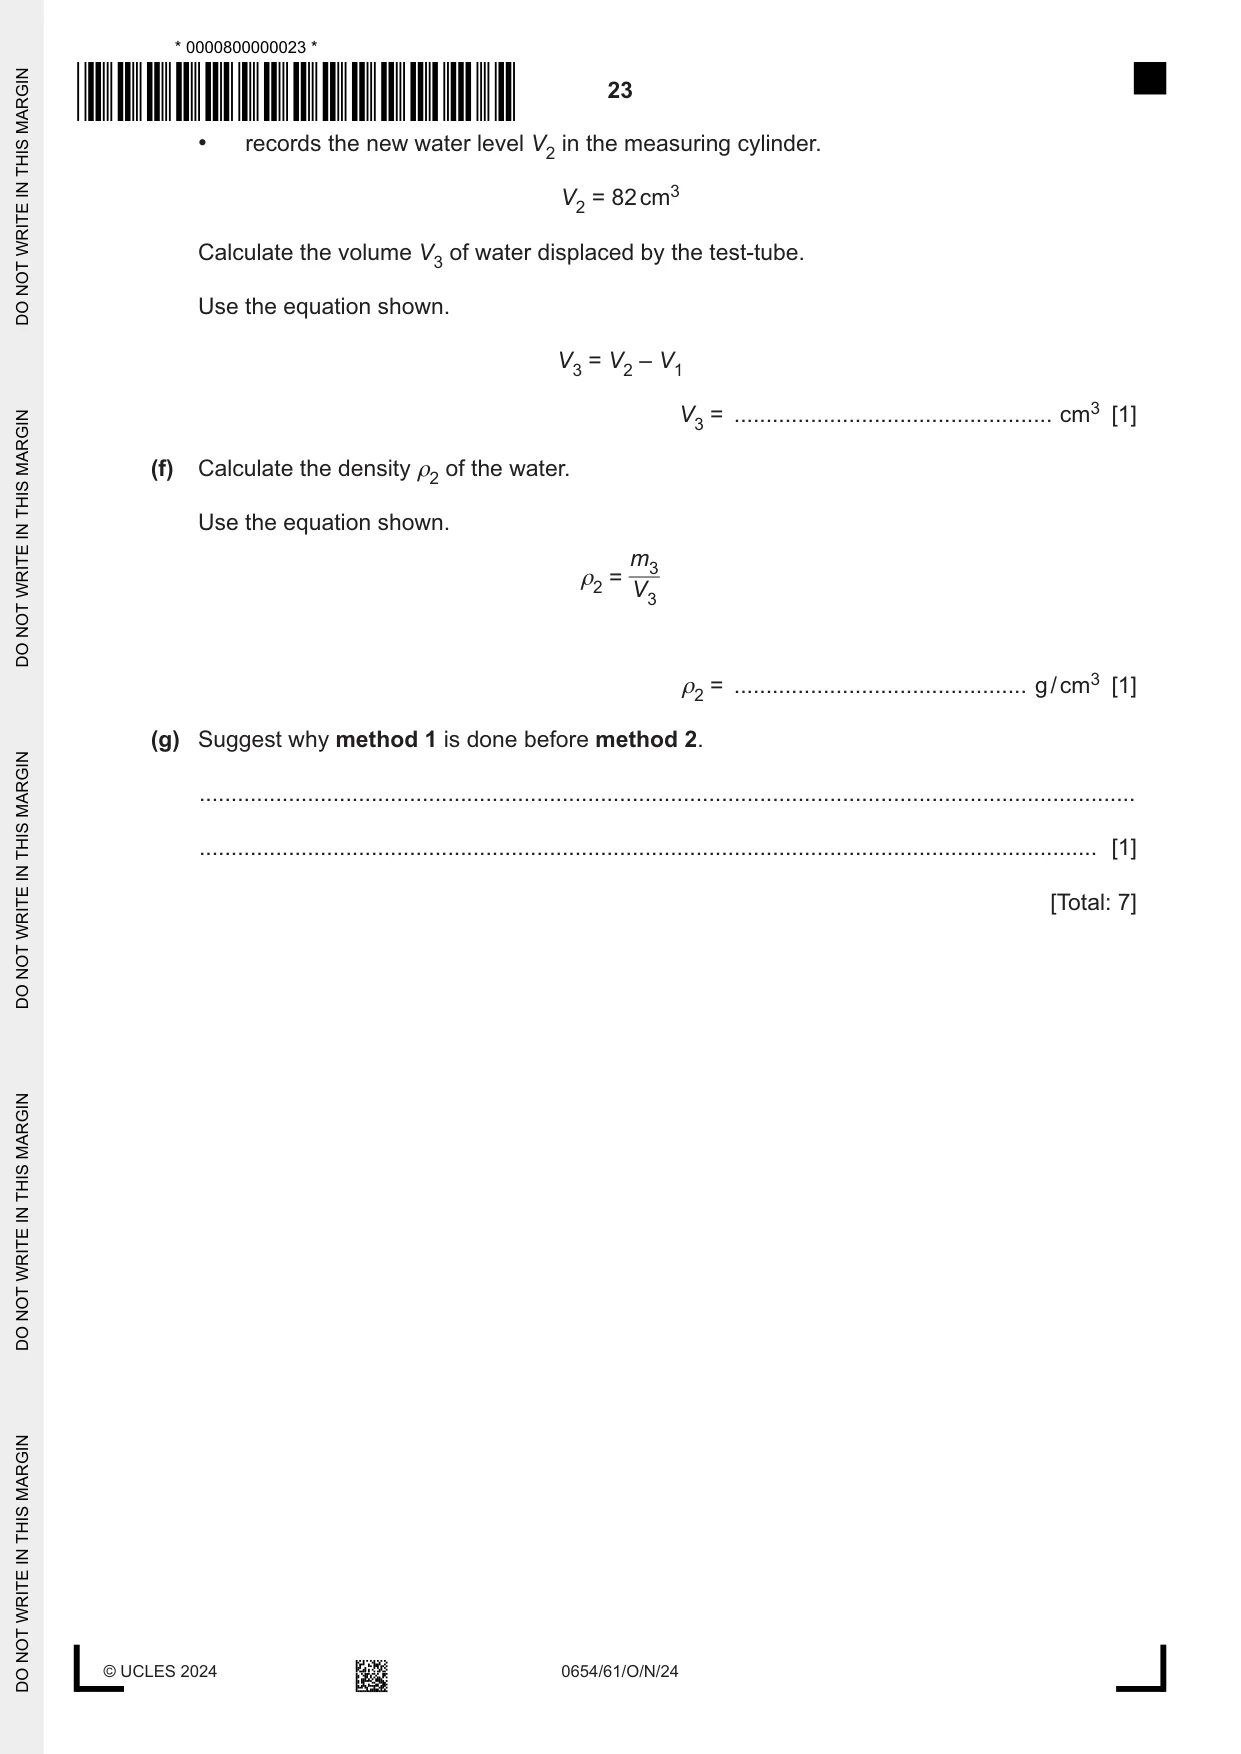
7 A student measures the density of water using two different methods. Method 1 (a) The student measures the mass m1 of an empty measuring cylinder using a top-pan balance. Fig. 7.1 shows the reading on the balance. measuring cylinder 133.7 g top-pan balance Fig. 7.1 Record the reading on the balance to the nearest gram. m1 = ...................................................... g [1] (b) The student removes the measuring cylinder from the balance and pours some water into it. Fig. 7.2 shows part of the measuring cylinder. cm3 70 measuring cylinder 60 water 50 Fig. 7.2 Record the volume V1 of water in the measuring cylinder. V1 = .................................................. cm3 [1] (c) The student measures the mass m2 of the measuring cylinder and water to the nearest gram. m2 = 195 g Calculate the density ρ1 of water. Use the equation shown. (m2 – m1) ρ1 = V1 ρ1 = .............................................. g / cm3 [1] (d) State how the student ensures that the reading of the volume of water in the measuring cylinder is as accurate as possible. ................................................................................................................................................... ................................................................................................................................................... ............................................................................................................................................. [1] Method 2 (e) Procedure The student: • measures the mass m3 of a test-tube to the nearest gram m3 = 20 g • lowers the test-tube into the measuring cylinder containing water until the test-tube floats cm3 test-tube measuring cylinder water Fig. 7.3 • records the new water level V2 in the measuring cylinder. V2 = 82 cm3 Calculate the volume V3 of water displaced by the test-tube. Use the equation shown. V3 = V2 – V1 V3 = .................................................. cm3 [1] (f) Calculate the density ρ2 of the water. Use the equation shown. m3 ρ2 = V3 ρ2 = .............................................. g / cm3 [1] (g) Suggest why method 1 is done before method 2. ................................................................................................................................................... ............................................................................................................................................. [1] [Total: 7]
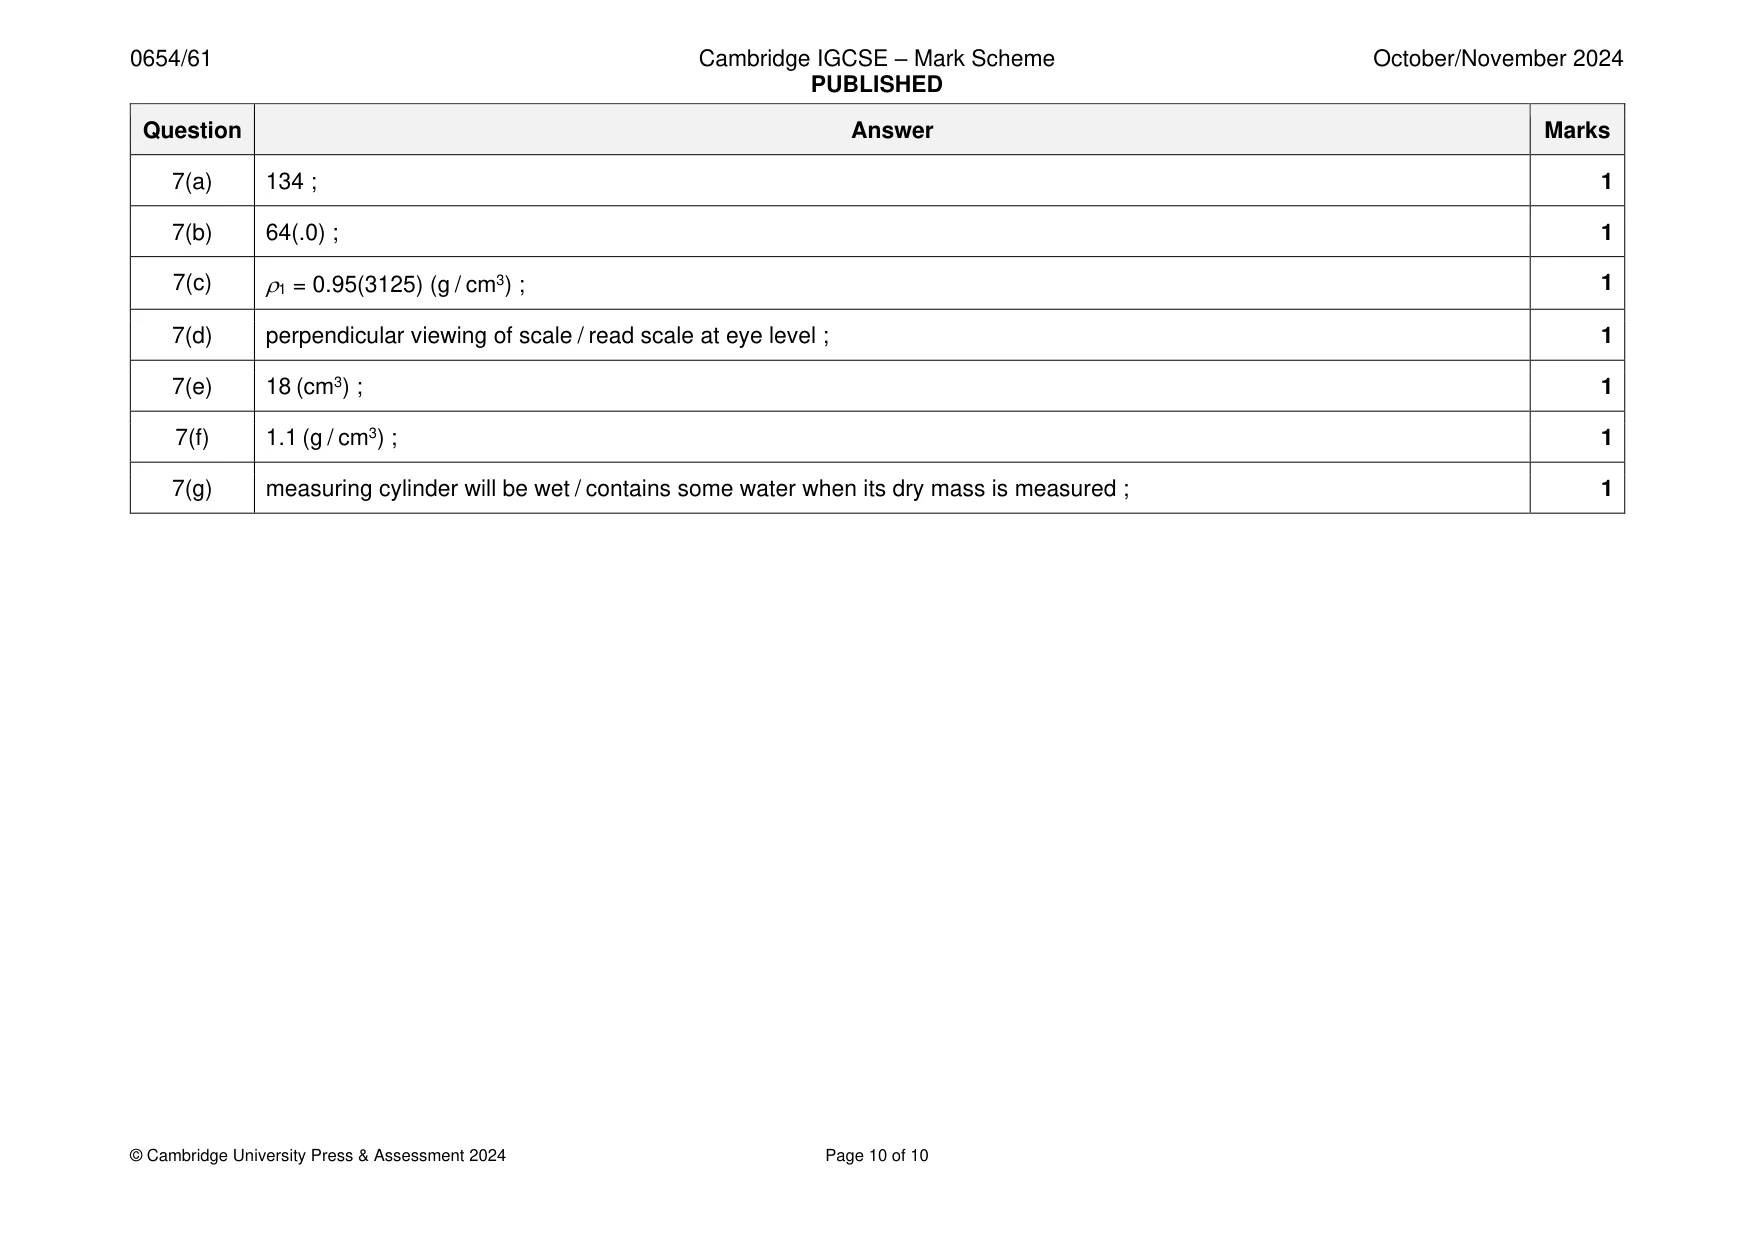
Mark scheme: 7(a) 134 ; 1 7(b) 64(.0) ; 1 7(c) 1 = 0.95(3125) (g / cm3) ; 1 7(d) perpendicular viewing of scale / read scale at eye level ; 1 7(e) 18 (cm3) ; 1 7(f) 1.1 (g / cm3) ; 1 7(g) measuring cylinder will be wet / contains some water when its dry mass is measured ; 1
What was in this paper
The subtopics covered by these 7 questions, and how many questions each got. Open one in a new tab to see every Cambridge question on it.
What you needed in this session
Cambridge’s own grade thresholds for 2024 Oct/Nov, Paper 6 · Variant 1. A higher threshold means an easier paper — the bar moves with how the cohort did.