Cambridge IGCSE Sciences - Co-ordinated (Double) 0654 — 2023 Oct/Nov Paper 6 · Variant 2
0654/62/O/N/23 · 6 questions · 60 marks · ≈68 min
The question paper and its mark scheme, free to read here and free to download. This is Cambridge’s own paper, exactly as it was sat.
Question paper20 pages



Mark scheme10 pages
Answers below. Sit the paper first if you are practising.
Questions as text
Q1 · A student investigates how small animals respond to the presence of light and water…
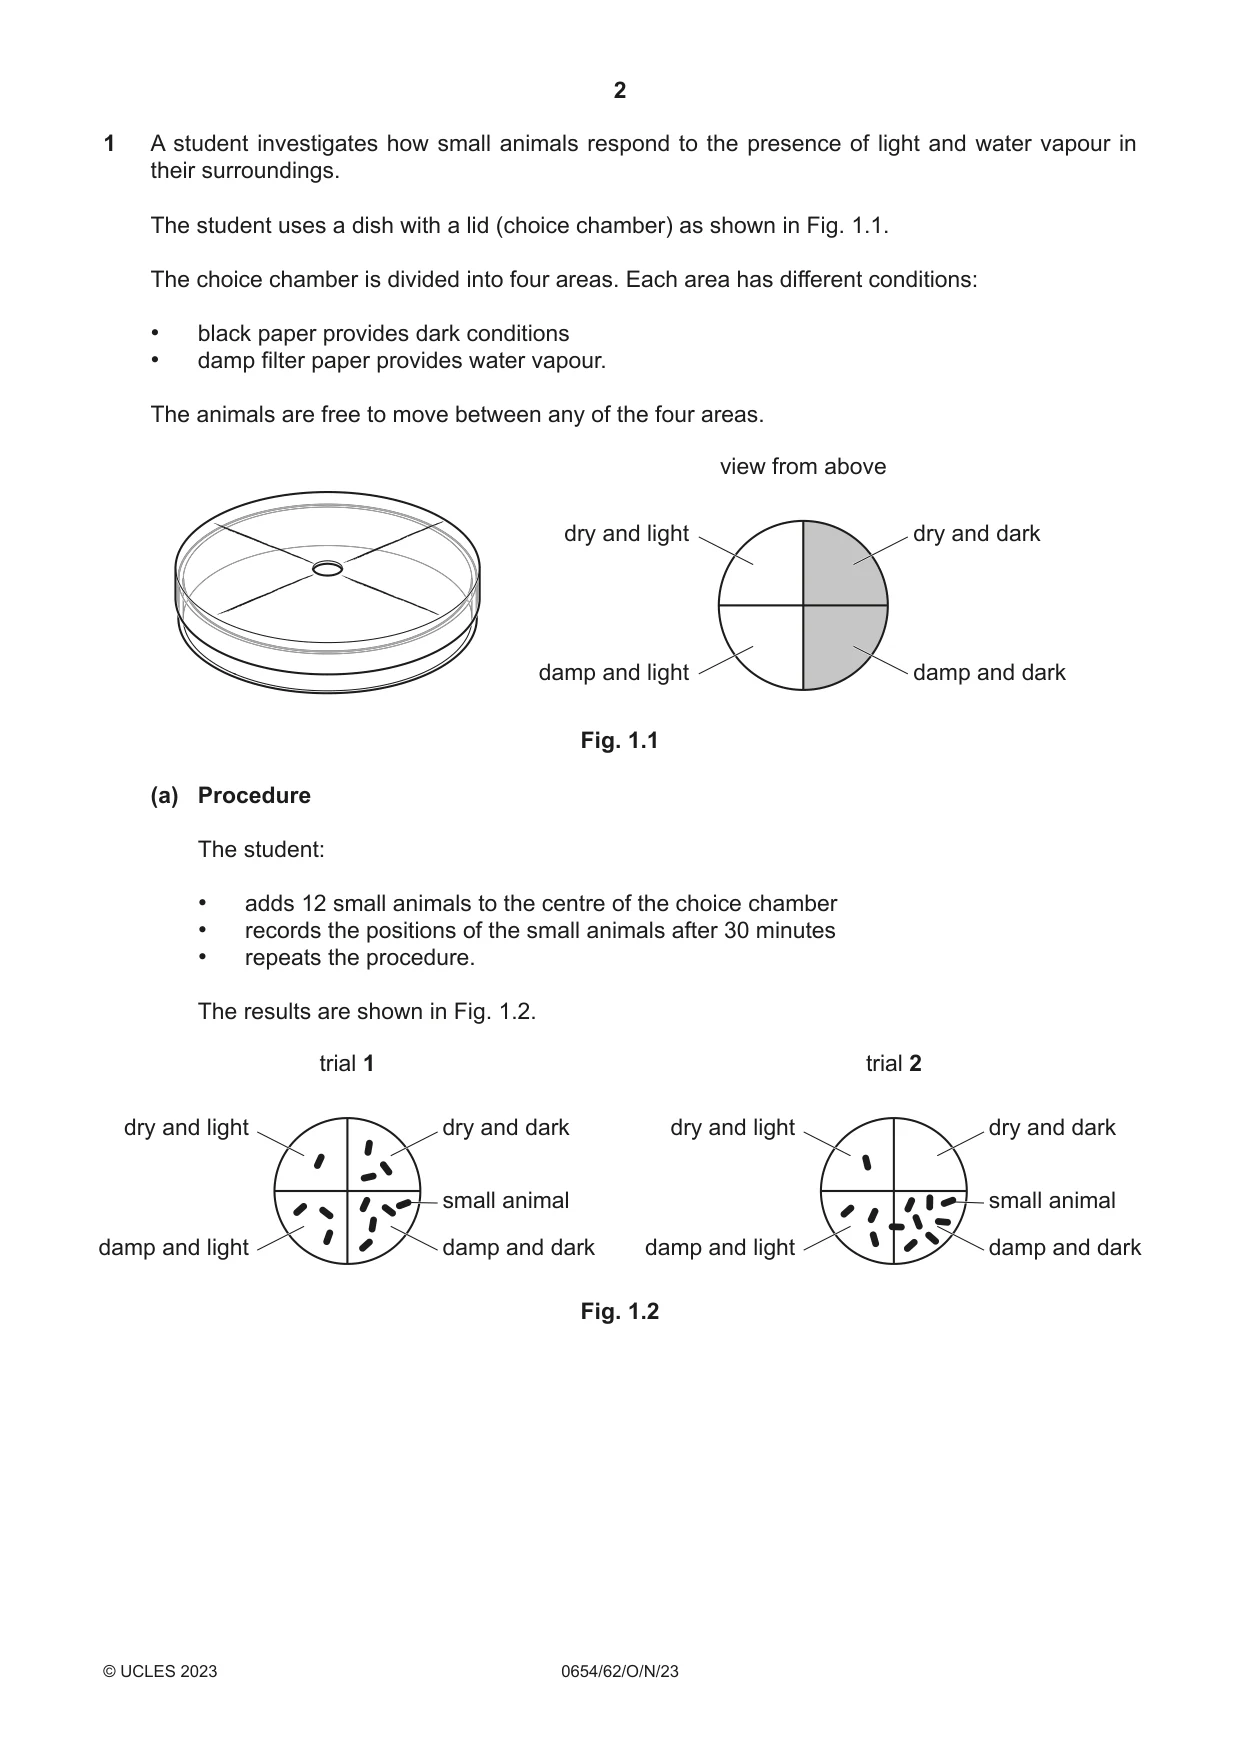
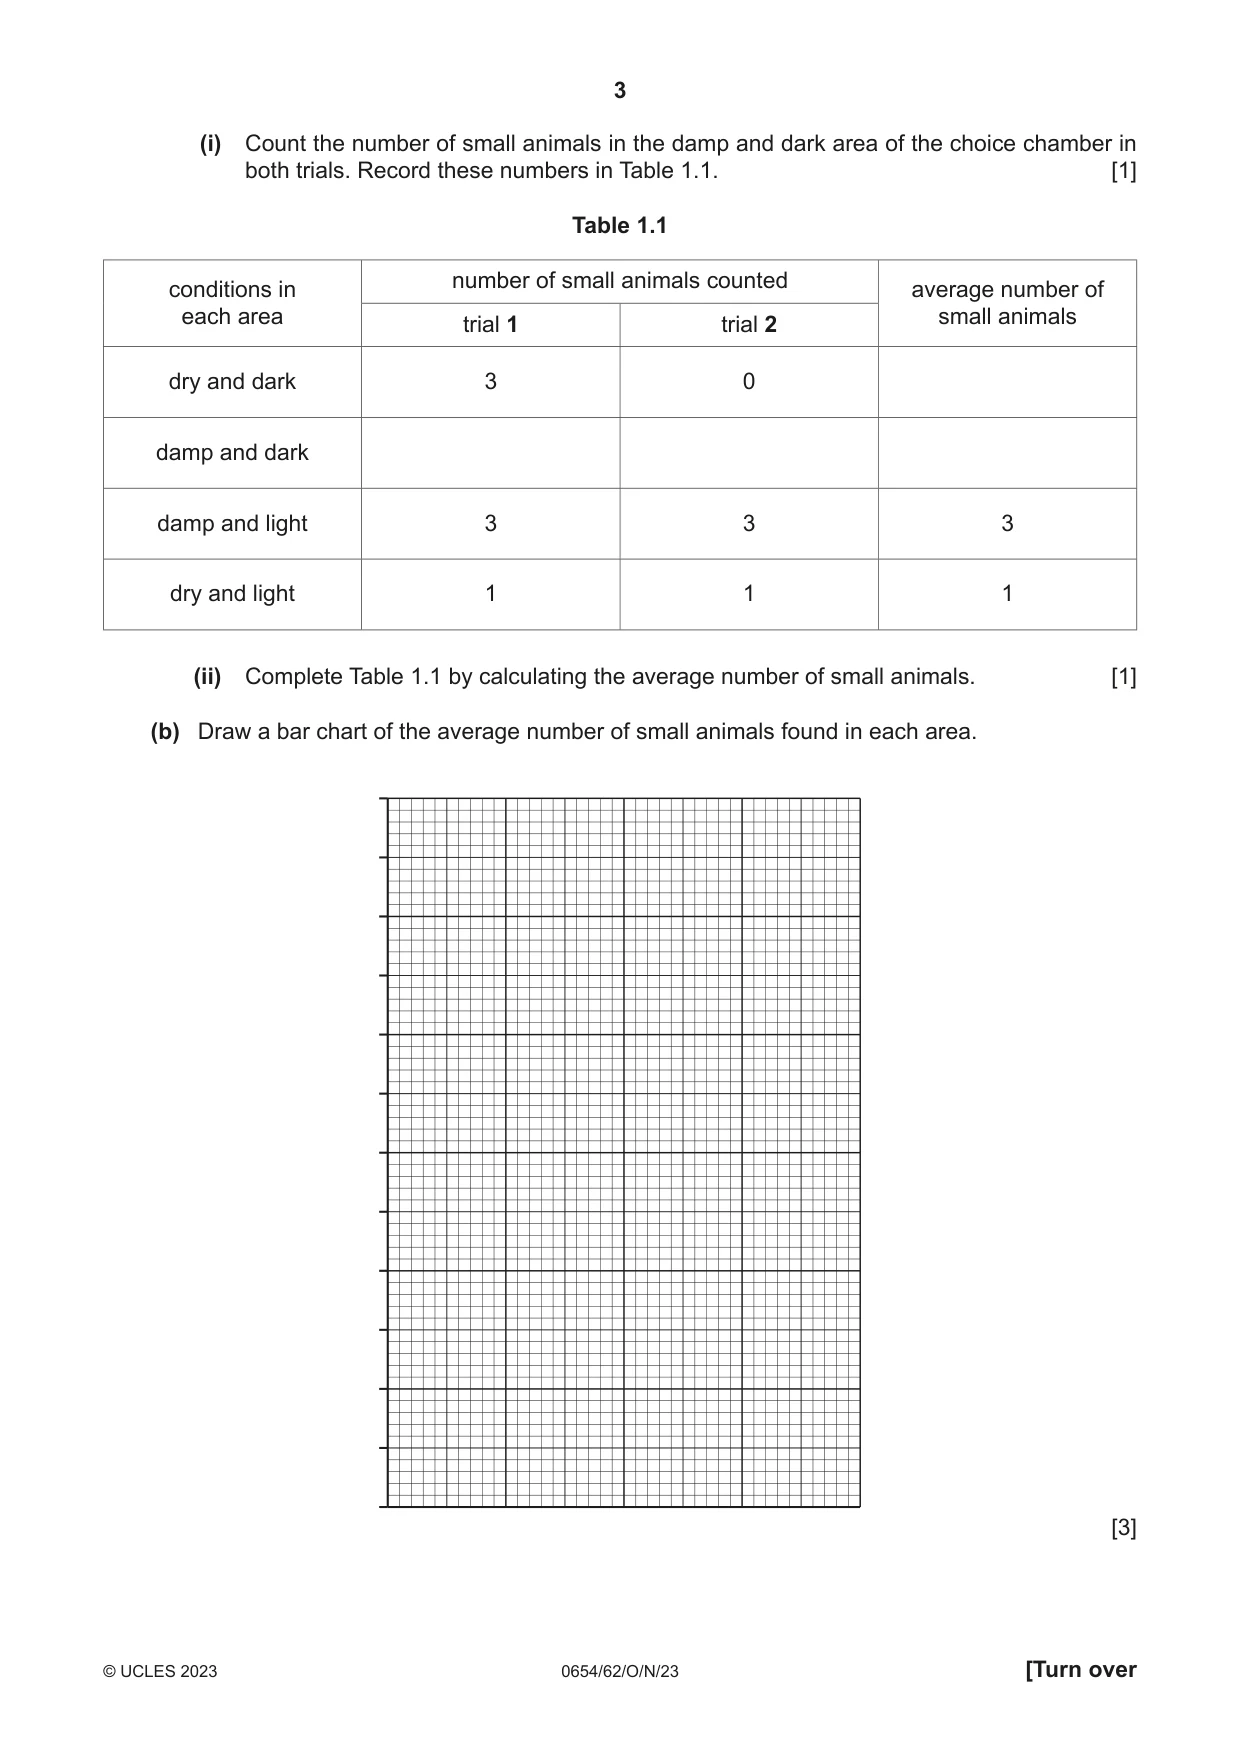
1 A student investigates how small animals respond to the presence of light and water vapour in their surroundings. The student uses a dish with a lid (choice chamber) as shown in Fig. 1.1. The choice chamber is divided into four areas. Each area has different conditions: • black paper provides dark conditions • damp filter paper provides water vapour. The animals are free to move between any of the four areas. view from above dry and light dry and dark damp and light damp and dark Fig. 1.1 (a) Procedure The student: • adds 12 small animals to the centre of the choice chamber • records the positions of the small animals after 30 minutes • repeats the procedure. The results are shown in Fig. 1.2. trial 1 trial 2 dry and light dry and dark dry and light dry and dark small animal small animal damp and light damp and dark damp and light damp and dark Fig. 1.2 (i) Count the number of small animals in the damp and dark area of the choice chamber in both trials. Record these numbers in Table 1.1. [1] Table 1.1 number of small animals counted conditions in average number of each area small animals trial 1 trial 2 dry and dark 3 0 damp and dark damp and light 3 3 3 dry and light 1 1 1 (ii) Complete Table 1.1 by calculating the average number of small animals. [1] (b) Draw a bar chart of the average number of small animals found in each area. [3] (c) (i) State which area of the choice chamber the small animals prefer. ........................................................................................................................................... ..................................................................................................................................... [1] (ii) The choice chamber has a small hole in the centre of the lid to allow the small animals to be added. Suggest why it is important that the small animals are added to the centre of the choice chamber. ........................................................................................................................................... ..................................................................................................................................... [1] (iii) Use these results to explain why another trial is needed to allow the student to identify anomalies. ........................................................................................................................................... ..................................................................................................................................... [1] [Total: 8]
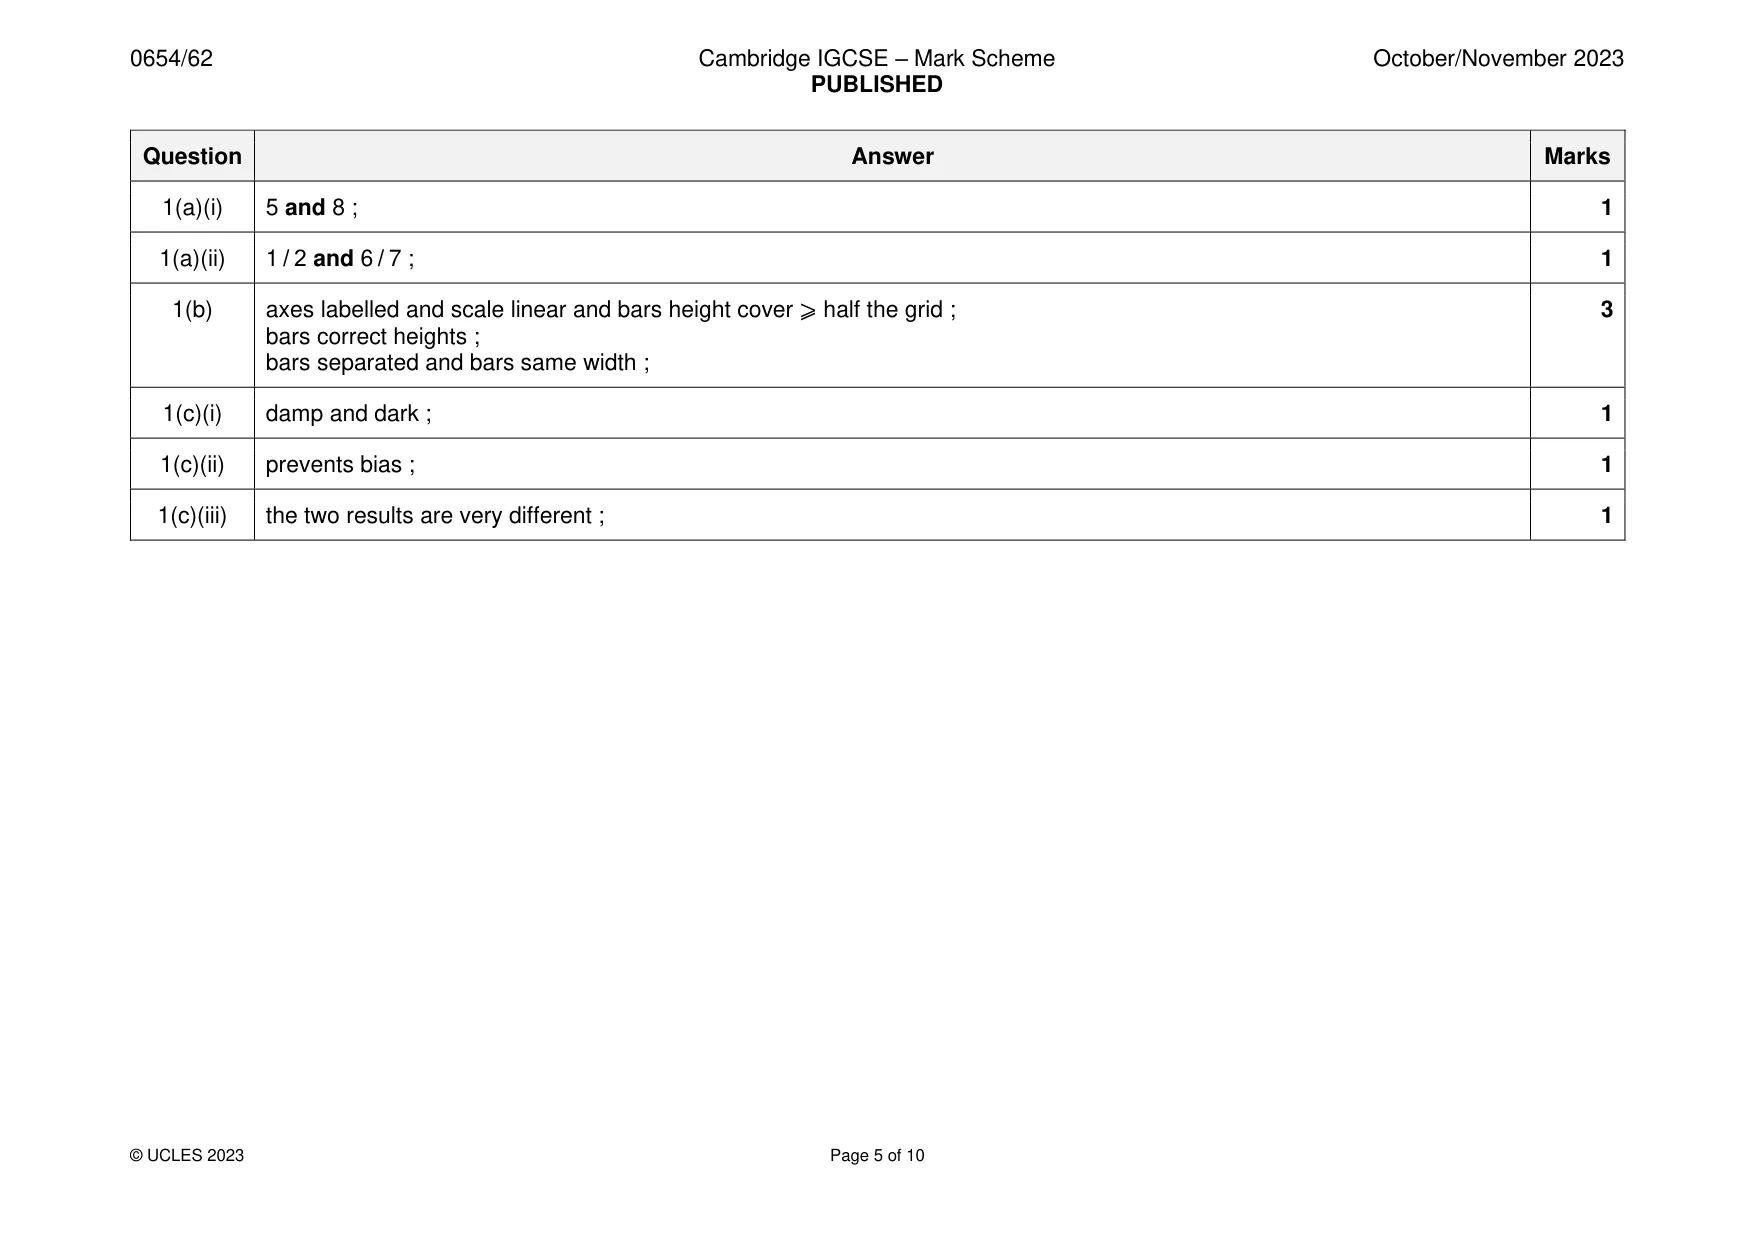
Mark scheme: Question Answer Marks 1(a)(i) 5 and 8 ; 1 1(a)(ii) 1 / 2 and 6 / 7 ; 1 1(b) axes labelled and scale linear and bars height cover ⩾ half the grid ; 3 bars correct heights ; bars separated and bars same width ; 1(c)(i) damp and dark ; 1 1(c)(ii) prevents bias ; 1 1(c)(iii) the two results are very different ; 1
Q2 · A student investigates the movement of molecules through a partially permeable membrane
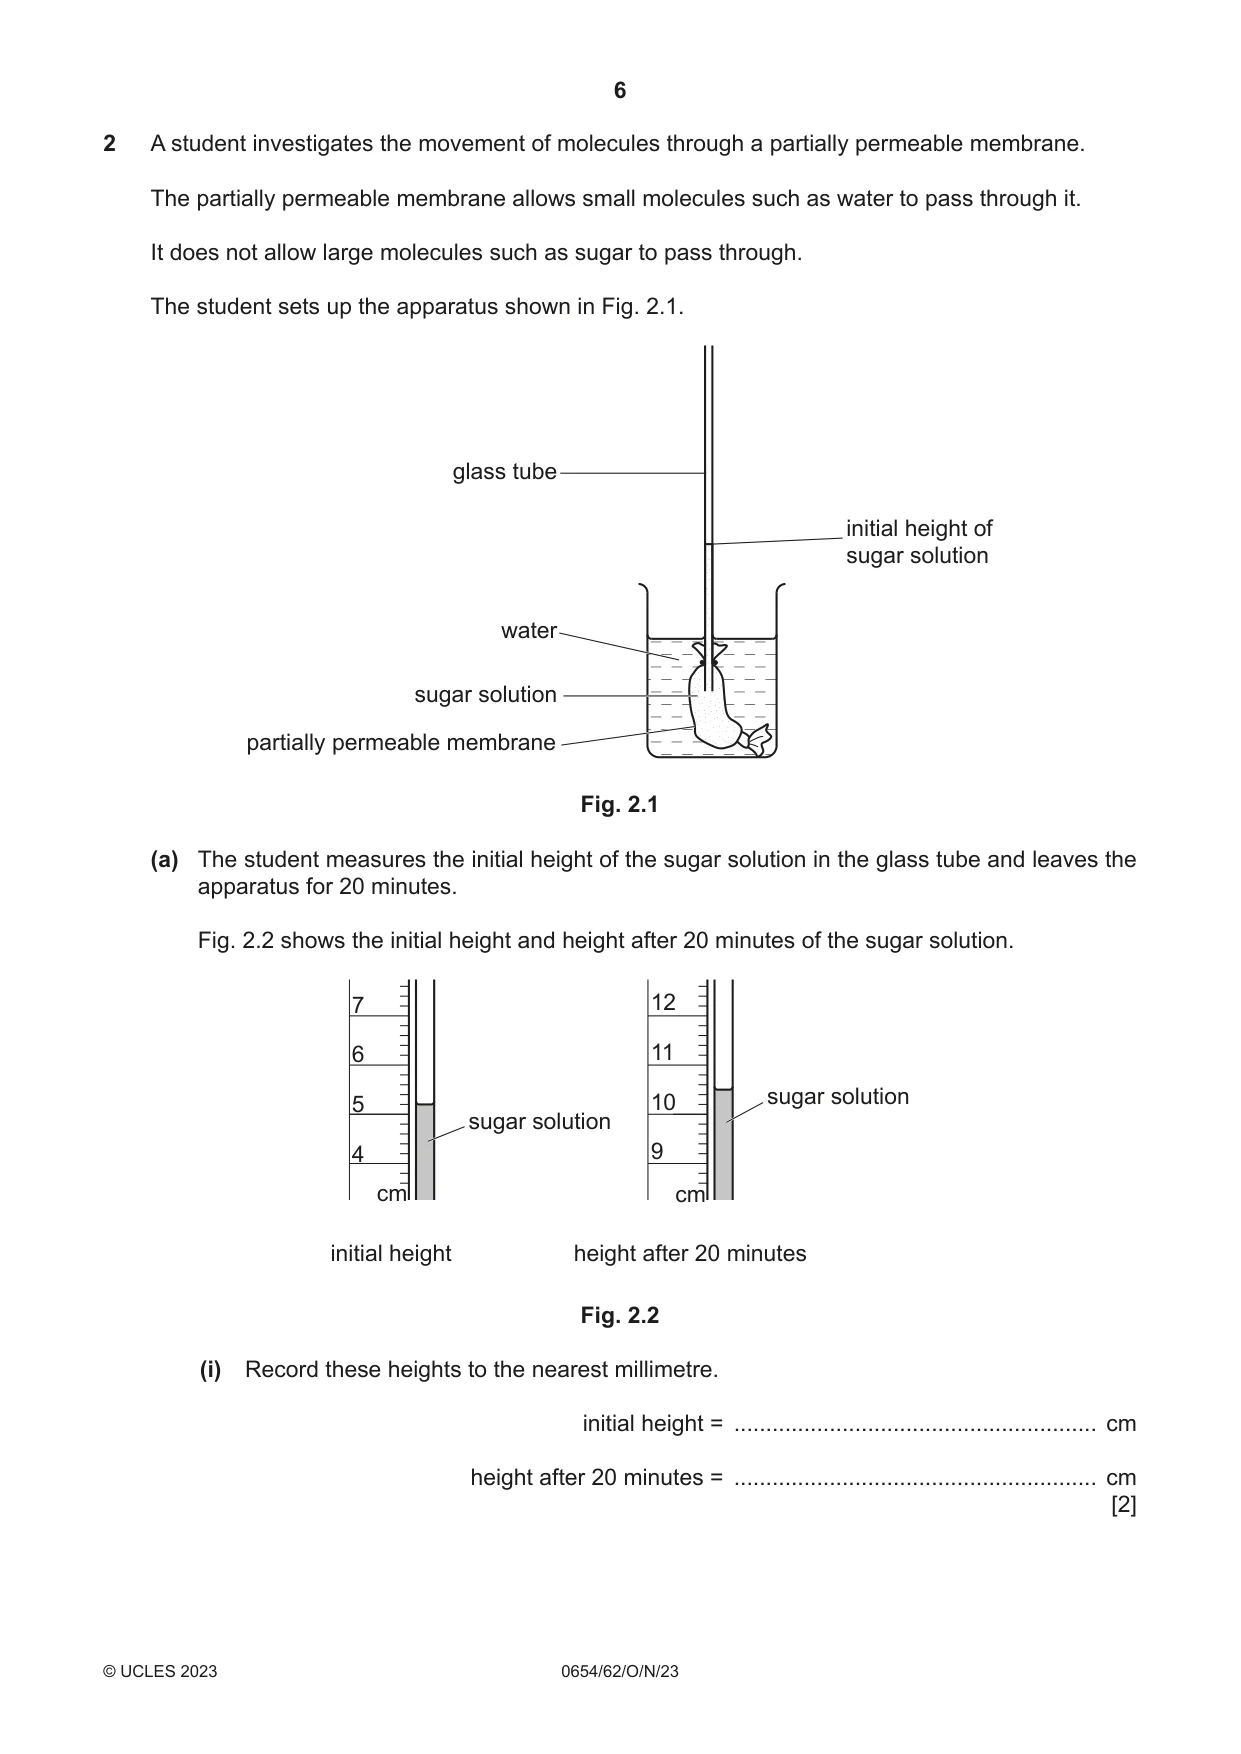
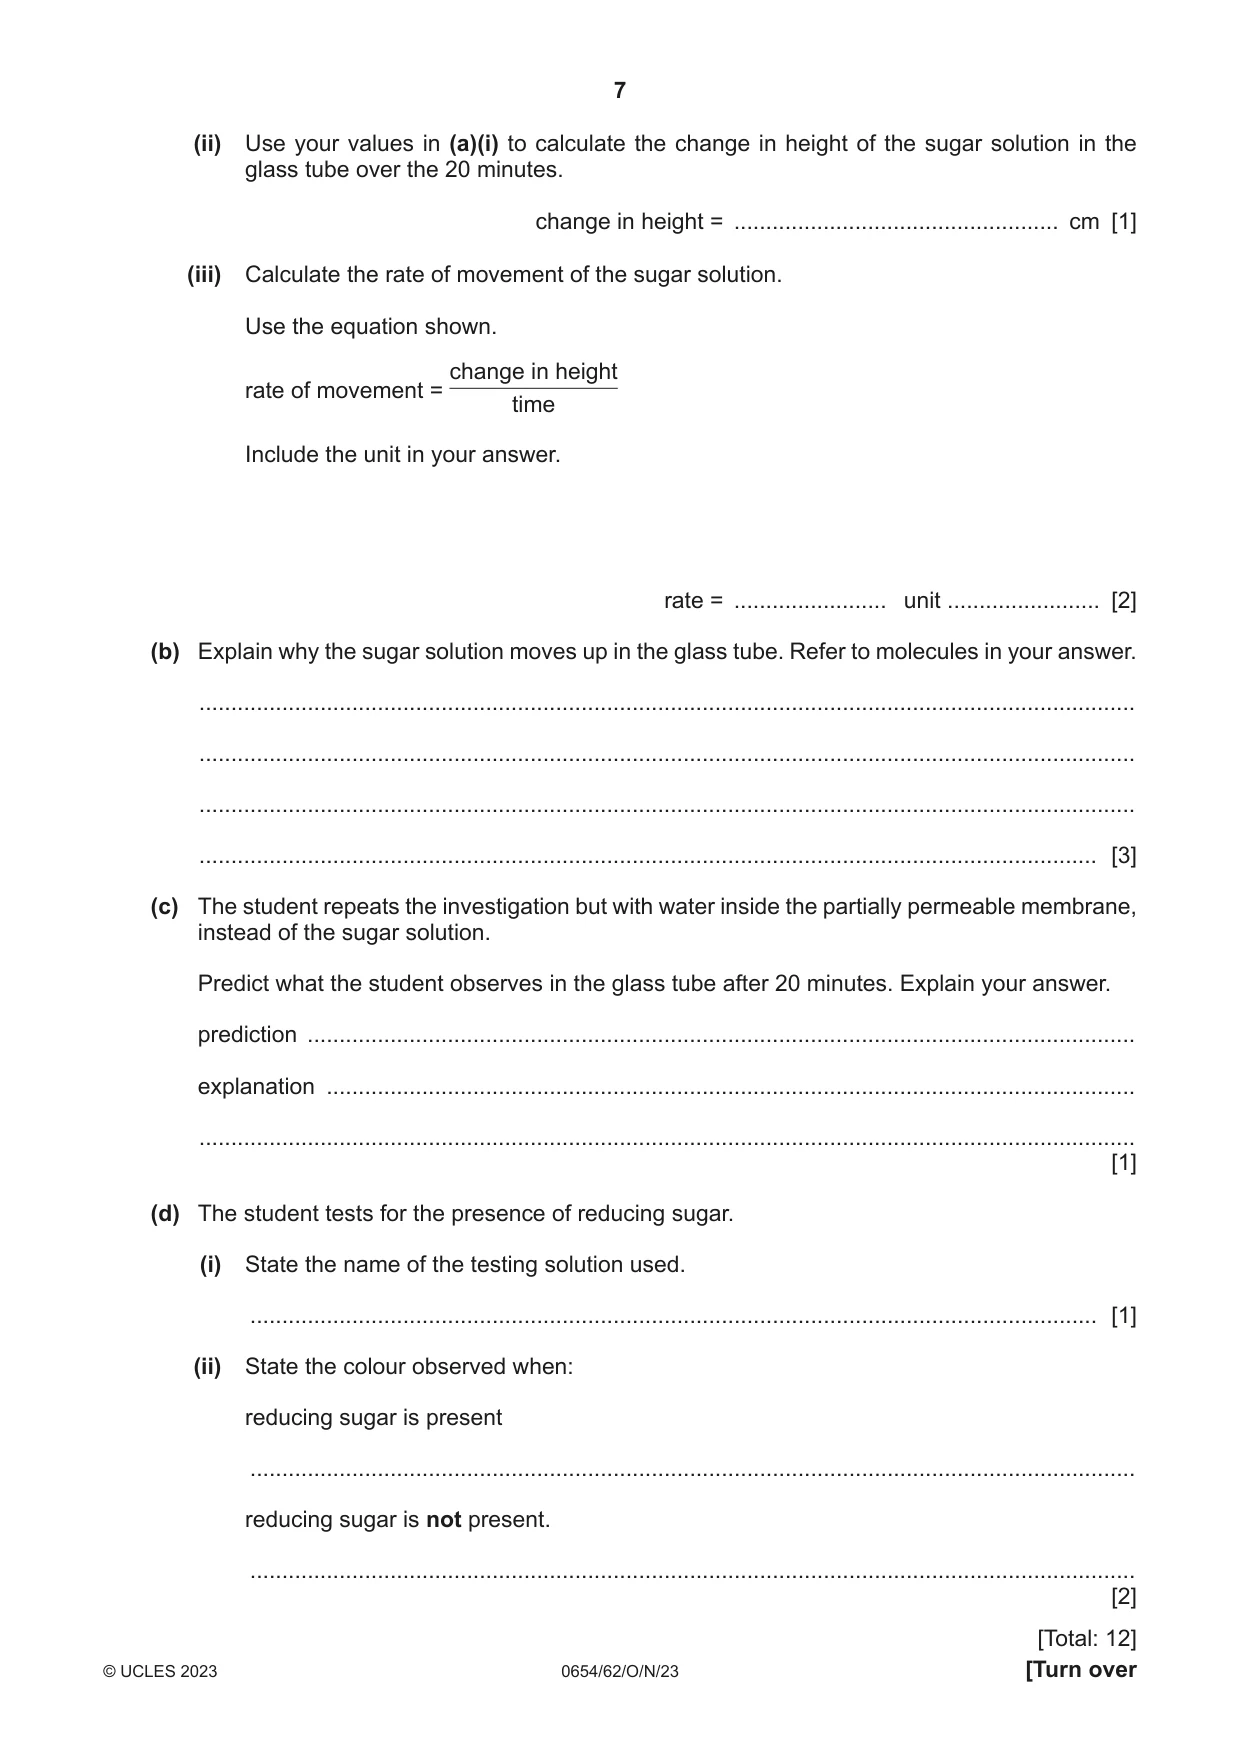
2 A student investigates the movement of molecules through a partially permeable membrane. The partially permeable membrane allows small molecules such as water to pass through it. It does not allow large molecules such as sugar to pass through. The student sets up the apparatus shown in Fig. 2.1. glass tube initial height of sugar solution water sugar solution partially permeable membrane Fig. 2.1 (a) The student measures the initial height of the sugar solution in the glass tube and leaves the apparatus for 20 minutes. Fig. 2.2 shows the initial height and height after 20 minutes of the sugar solution. 7 12 6 11 5 10 sugar solution sugar solution 4 9 cm cm initial height height after 20 minutes Fig. 2.2 (i) Record these heights to the nearest millimetre. initial height = ......................................................... cm height after 20 minutes = ......................................................... cm [2] (ii) Use your values in (a)(i) to calculate the change in height of the sugar solution in the glass tube over the 20 minutes. change in height = ................................................... cm [1] (iii) Calculate the rate of movement of the sugar solution. Use the equation shown. change in height rate of movement = time Include the unit in your answer. rate = ........................ unit ........................ [2] (b) Explain why the sugar solution moves up in the glass tube. Refer to molecules in your answer. ................................................................................................................................................... ................................................................................................................................................... ................................................................................................................................................... ............................................................................................................................................. [3] (c) The student repeats the investigation but with water inside the partially permeable membrane, instead of the sugar solution. Predict what the student observes in the glass tube after 20 minutes. Explain your answer. prediction .................................................................................................................................. explanation ............................................................................................................................... ................................................................................................................................................... [1] (d) The student tests for the presence of reducing sugar. (i) State the name of the testing solution used. ..................................................................................................................................... [1] (ii) State the colour observed when: reducing sugar is present ........................................................................................................................................... reducing sugar is not present. ........................................................................................................................................... [2] [Total: 12]
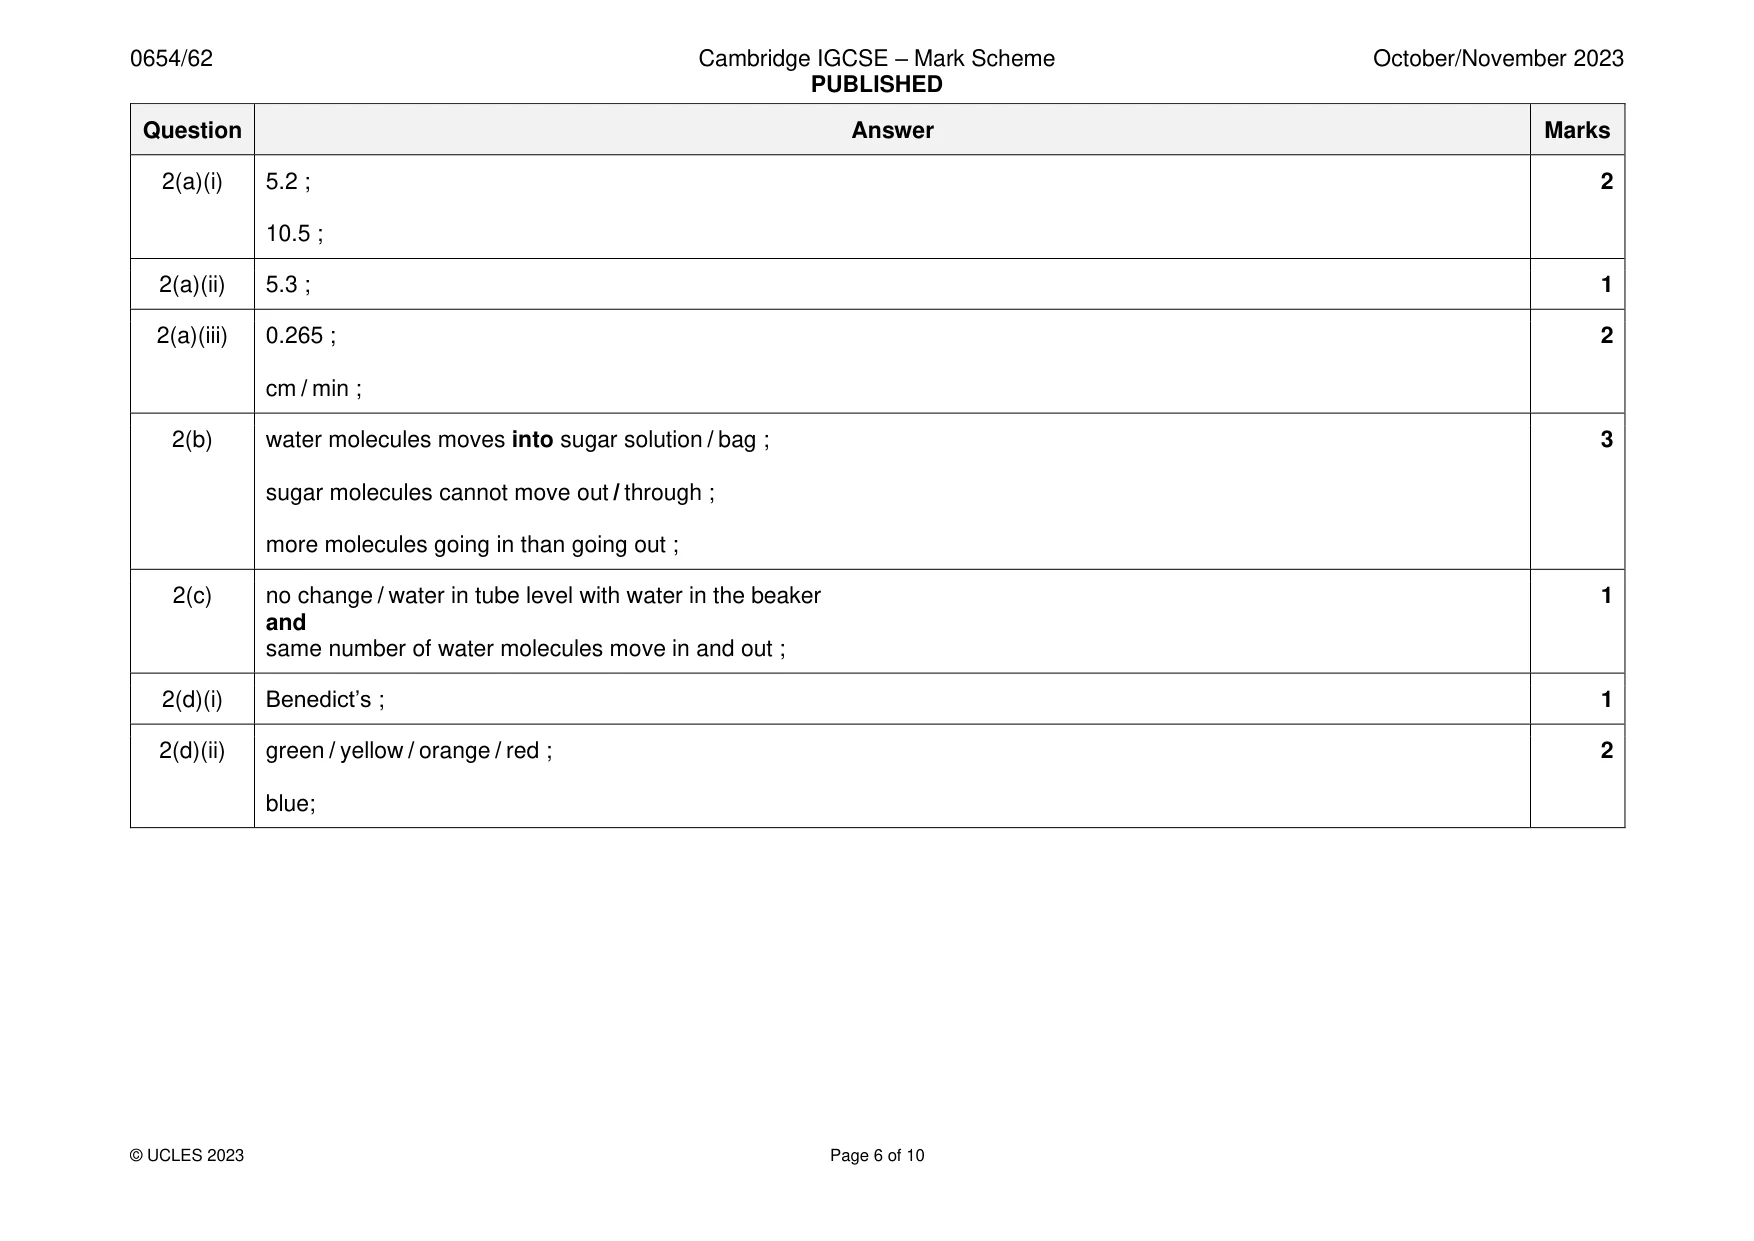
Mark scheme: 2(a)(i) 5.2 ; 2 10.5 ; 2(a)(ii) 5.3 ; 1 2(a)(iii) 0.265 ; 2 cm / min ; 2(b) water molecules moves into sugar solution / bag ; 3 sugar molecules cannot move out / through ; more molecules going in than going out ; 2(c) no change / water in tube level with water in the beaker 1 and same number of water molecules move in and out ; 2(d)(i) Benedict’s ; 1 2(d)(ii) green / yellow / orange / red ; 2 blue;
Q3 · A student investigates the thermal (heat) energy released when alcohols burn
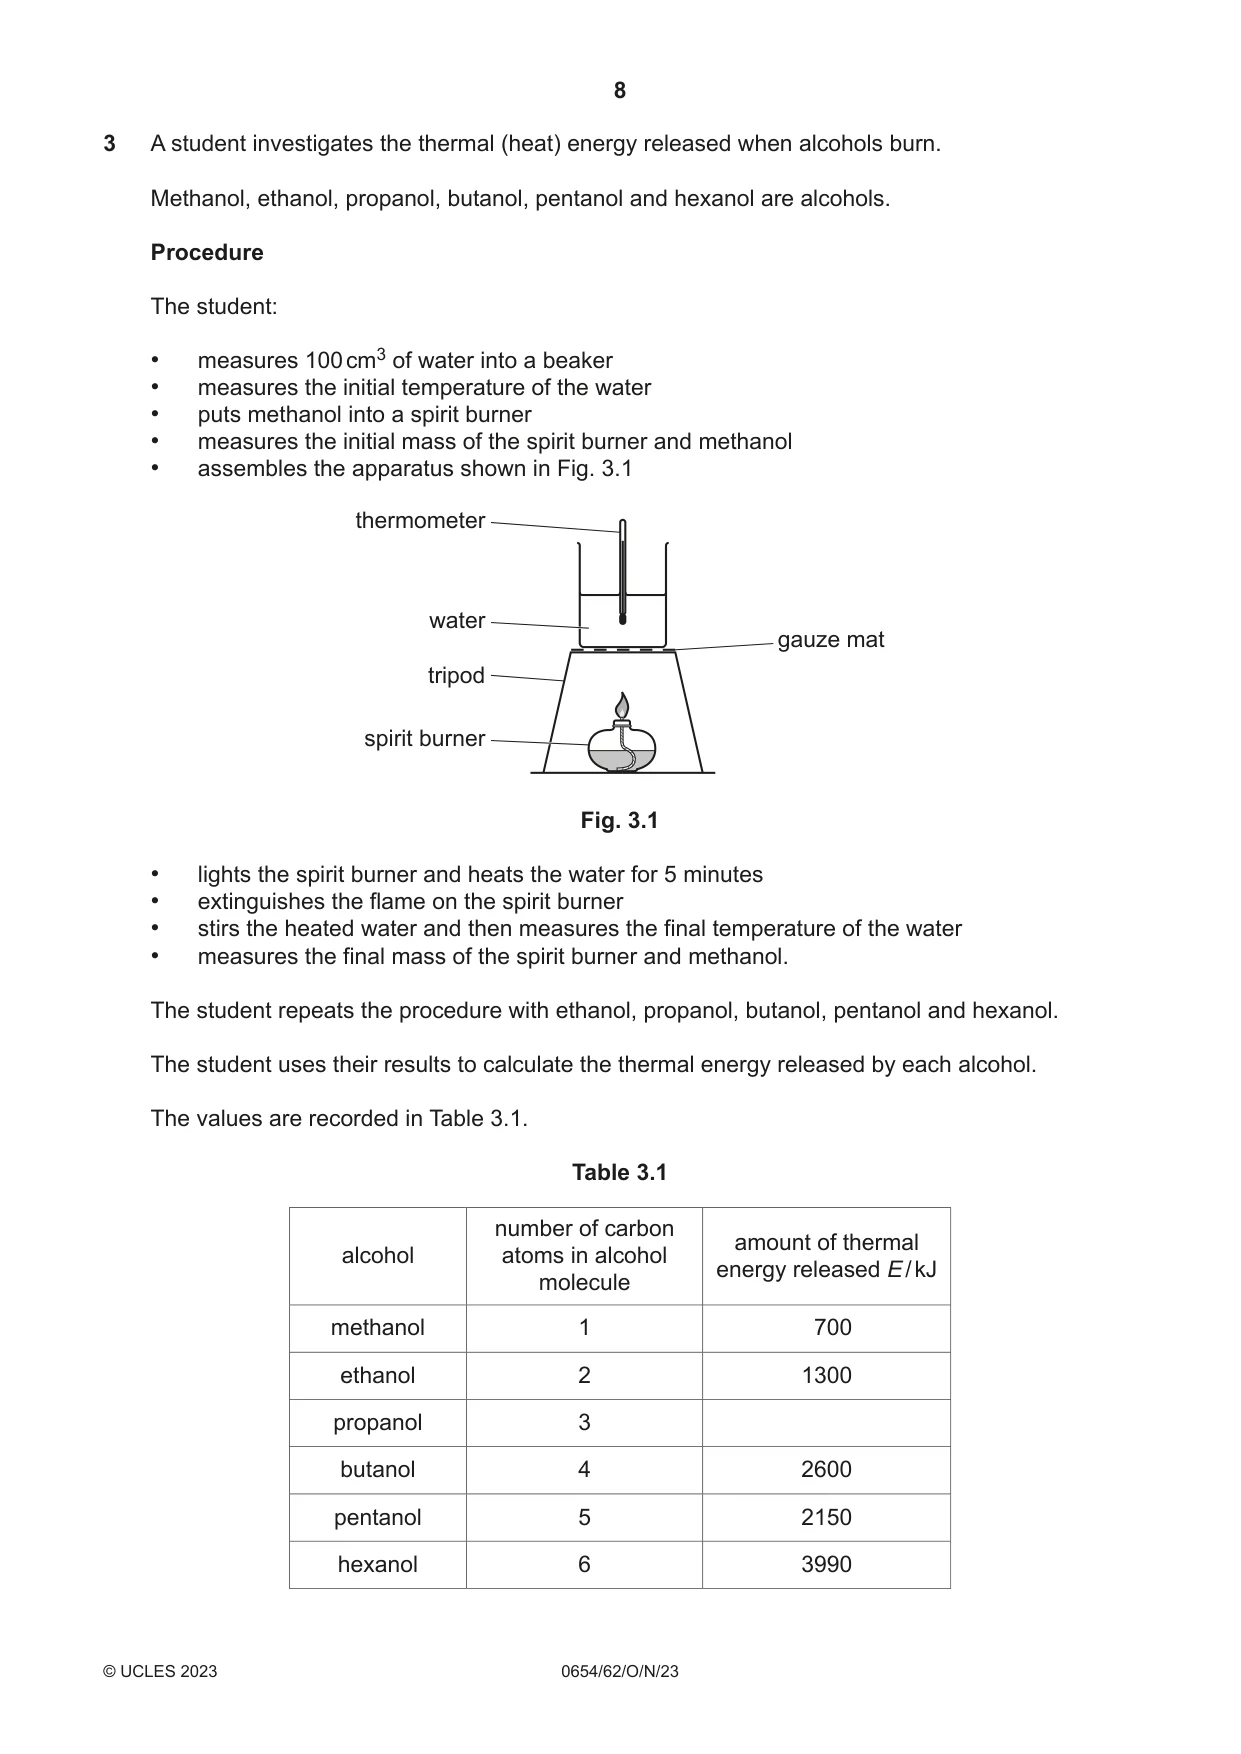
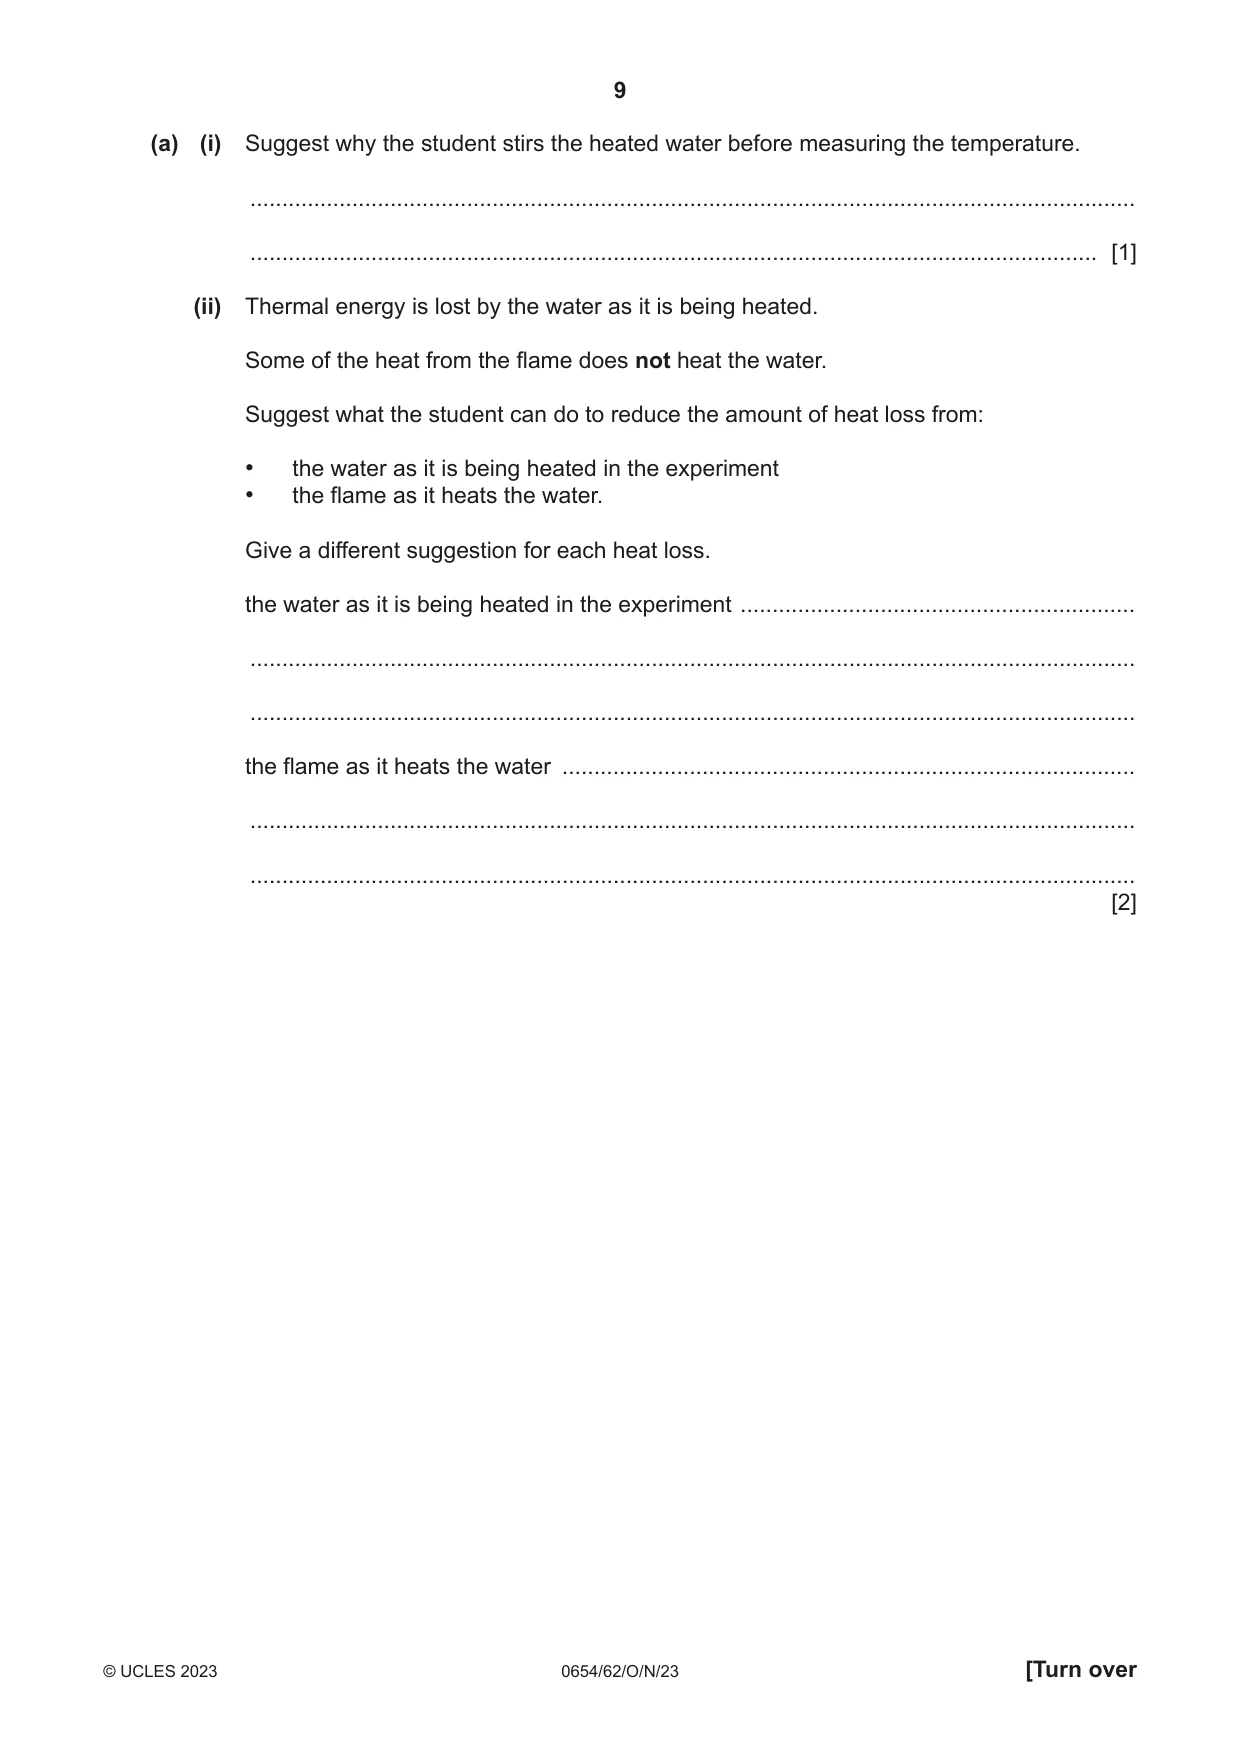
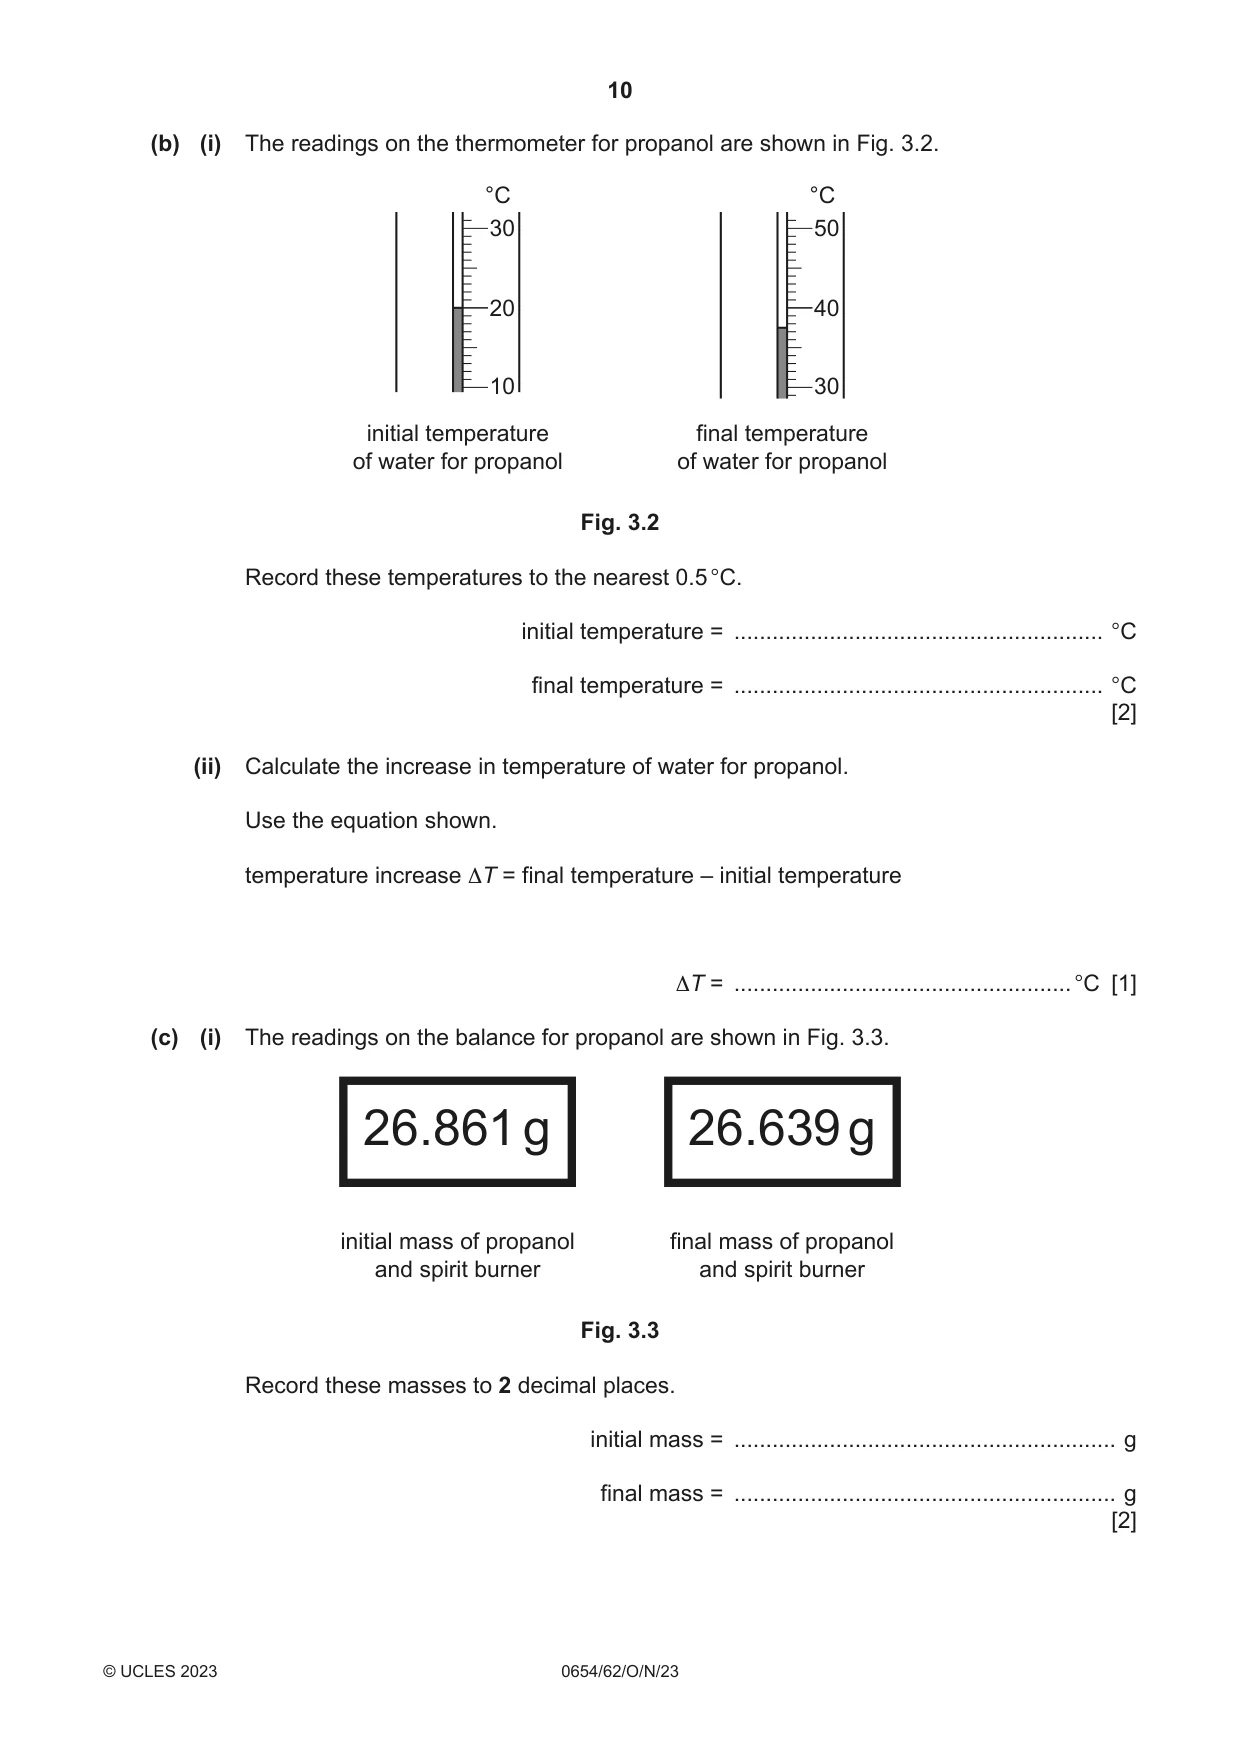
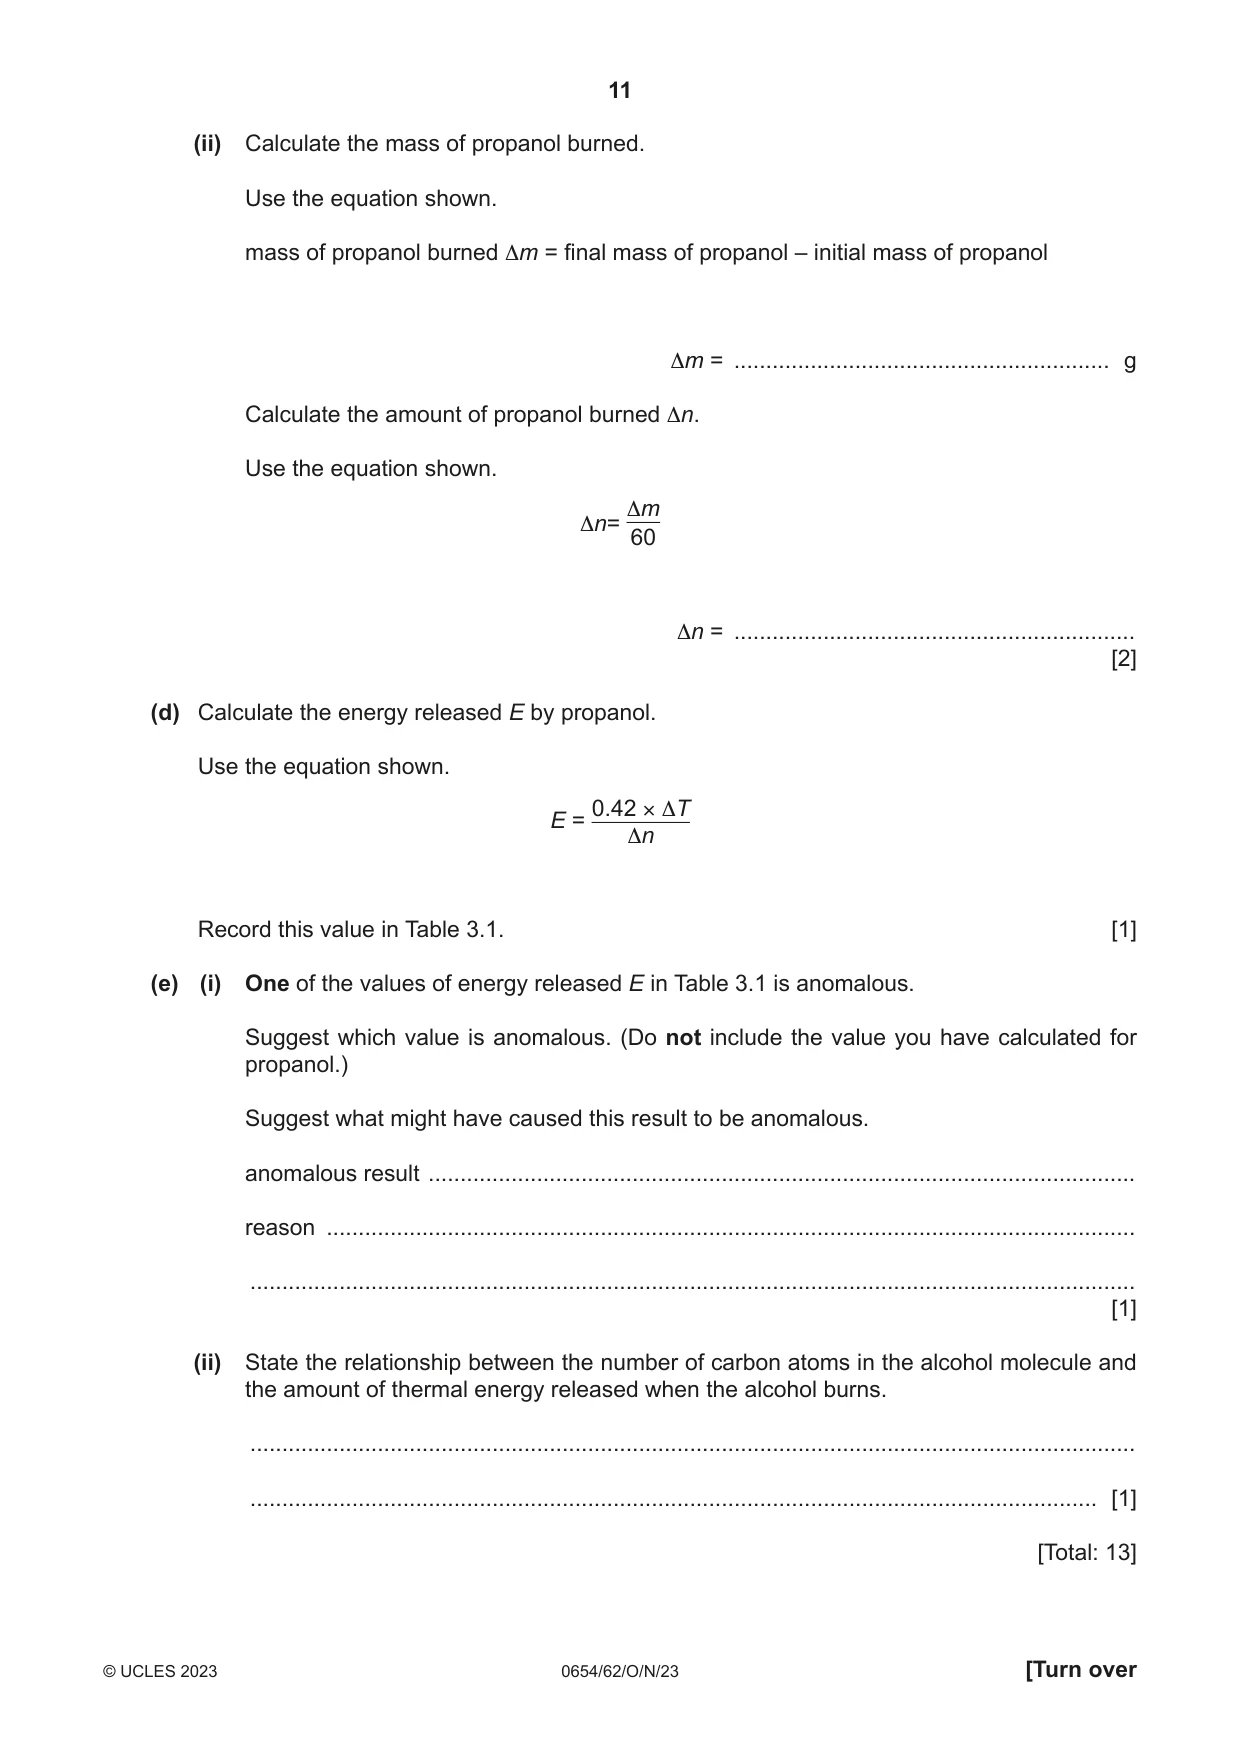
3 A student investigates the thermal (heat) energy released when alcohols burn. Methanol, ethanol, propanol, butanol, pentanol and hexanol are alcohols. Procedure The student: • measures 100 cm3 of water into a beaker • measures the initial temperature of the water • puts methanol into a spirit burner • measures the initial mass of the spirit burner and methanol • assembles the apparatus shown in Fig. 3.1 thermometer water gauze mat tripod spirit burner Fig. 3.1 • lights the spirit burner and heats the water for 5 minutes • extinguishes the flame on the spirit burner • stirs the heated water and then measures the final temperature of the water • measures the final mass of the spirit burner and methanol. The student repeats the procedure with ethanol, propanol, butanol, pentanol and hexanol. The student uses their results to calculate the thermal energy released by each alcohol. The values are recorded in Table 3.1. Table 3.1 number of carbon amount of thermal alcohol atoms in alcohol energy released E / kJ molecule methanol 1 700 ethanol 2 1300 propanol 3 butanol 4 2600 pentanol 5 2150 hexanol 6 3990 (a) (i) Suggest why the student stirs the heated water before measuring the temperature. ........................................................................................................................................... ..................................................................................................................................... [1] (ii) Thermal energy is lost by the water as it is being heated. Some of the heat from the flame does not heat the water. Suggest what the student can do to reduce the amount of heat loss from: • the water as it is being heated in the experiment • the flame as it heats the water. Give a different suggestion for each heat loss. the water as it is being heated in the experiment .............................................................. ........................................................................................................................................... ........................................................................................................................................... the flame as it heats the water .......................................................................................... ........................................................................................................................................... ........................................................................................................................................... [2] (b) (i) The readings on the thermometer for propanol are shown in Fig. 3.2. °C °C 30 50 20 40 10 30 initial temperature final temperature of water for propanol of water for propanol Fig. 3.2 Record these temperatures to the nearest 0.5 °C. initial temperature = .......................................................... °C final temperature = .......................................................... °C [2] (ii) Calculate the increase in temperature of water for propanol. Use the equation shown. temperature increase ΔT = final temperature – initial temperature ΔT = ..................................................... °C [1] (c) (i) The readings on the balance for propanol are shown in Fig. 3.3. 26.861 g 26.639 g initial mass of propanol final mass of propanol and spirit burner and spirit burner Fig. 3.3 Record these masses to 2 decimal places. initial mass = ............................................................ g final mass = ............................................................ g [2] (ii) Calculate the mass of propanol burned. Use the equation shown. mass of propanol burned Δm = final mass of propanol – initial mass of propanol Δm = ........................................................... g Calculate the amount of propanol burned Δn. Use the equation shown. Δm Δn= 60 Δn = ............................................................... [2] (d) Calculate the energy released E by propanol. Use the equation shown. 0.42 × ΔT E = Δn Record this value in Table 3.1. [1] (e) (i) One of the values of energy released E in Table 3.1 is anomalous. Suggest which value is anomalous. (Do not include the value you have calculated for propanol.) Suggest what might have caused this result to be anomalous. anomalous result ............................................................................................................... reason ............................................................................................................................... ........................................................................................................................................... [1] (ii) State the relationship between the number of carbon atoms in the alcohol molecule and the amount of thermal energy released when the alcohol burns. ........................................................................................................................................... ..................................................................................................................................... [1] [Total: 13]
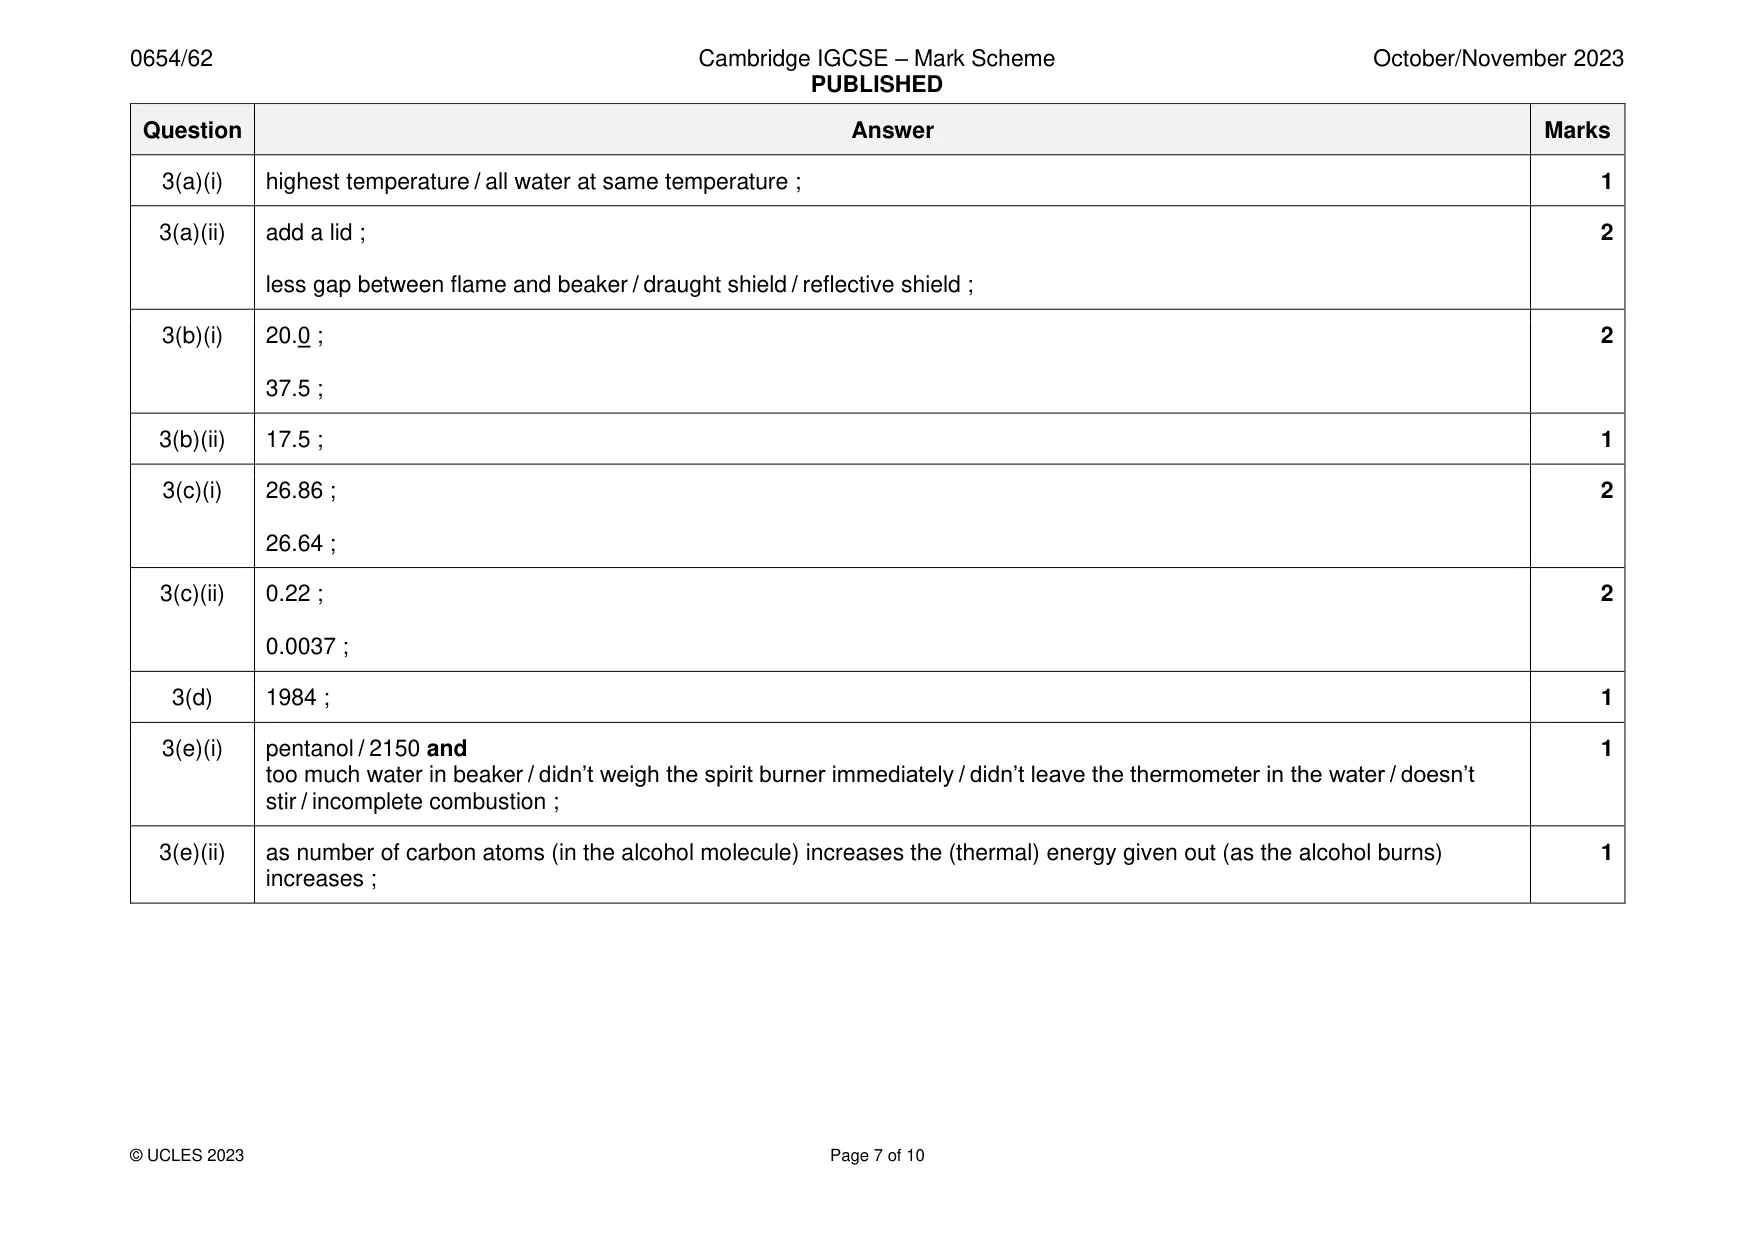
Mark scheme: 3(a)(i) highest temperature / all water at same temperature ; 1 3(a)(ii) add a lid ; 2 less gap between flame and beaker / draught shield / reflective shield ; 3(b)(i) 20.0 ; 2 37.5 ; 3(b)(ii) 17.5 ; 1 3(c)(i) 26.86 ; 2 26.64 ; 3(c)(ii) 0.22 ; 2 0.0037 ; 3(d) 1984 ; 1 3(e)(i) pentanol / 2150 and 1 too much water in beaker / didn’t weigh the spirit burner immediately / didn’t leave the thermometer in the water / doesn’t stir / incomplete combustion ; 3(e)(ii) as number of carbon atoms (in the alcohol molecule) increases the (thermal) energy given out (as the alcohol burns) 1 increases ;
Q4 · When sodium carbonate solid reacts with dilute hydrochloric acid it makes carbon dioxide…
4 When sodium carbonate solid reacts with dilute hydrochloric acid it makes carbon dioxide gas. When the carbon dioxide gas made is bubbled into a detergent the bubbles make a foam. The more carbon dioxide that is bubbled into the detergent the more foam is made. You are provided with: • detergent (washing up liquid) • sodium carbonate • dilute hydrochloric acid • any common laboratory apparatus. Plan an investigation to find the relationship between the mass of sodium carbonate added to dilute hydrochloric acid and the height of foam made. Include in your plan: • the apparatus needed, including a labelled diagram if you wish • a brief description of the method, including any safety precautions • the measurements you will make, including how to make them as accurate as possible • the variables you will control • how you will process your results to draw a conclusion. Include a results table if you wish. You are not required to add any results into the table. .......................................................................................................................................................... .......................................................................................................................................................... .......................................................................................................................................................... .......................................................................................................................................................... .......................................................................................................................................................... .......................................................................................................................................................... .......................................................................................................................................................... .......................................................................................................................................................... .......................................................................................................................................................... .......................................................................................................................................................... .......................................................................................................................................................... .......................................................................................................................................................... .......................................................................................................................................................... .......................................................................................................................................................... .......................................................................................................................................................... .......................................................................................................................................................... .......................................................................................................................................................... .......................................................................................................................................................... .......................................................................................................................................................... .......................................................................................................................................................... .......................................................................................................................................................... .......................................................................................................................................................... .......................................................................................................................................................... .......................................................................................................................................................... .......................................................................................................................................................... .......................................................................................................................................................... .......................................................................................................................................................... .................................................................................................................................................... [7]
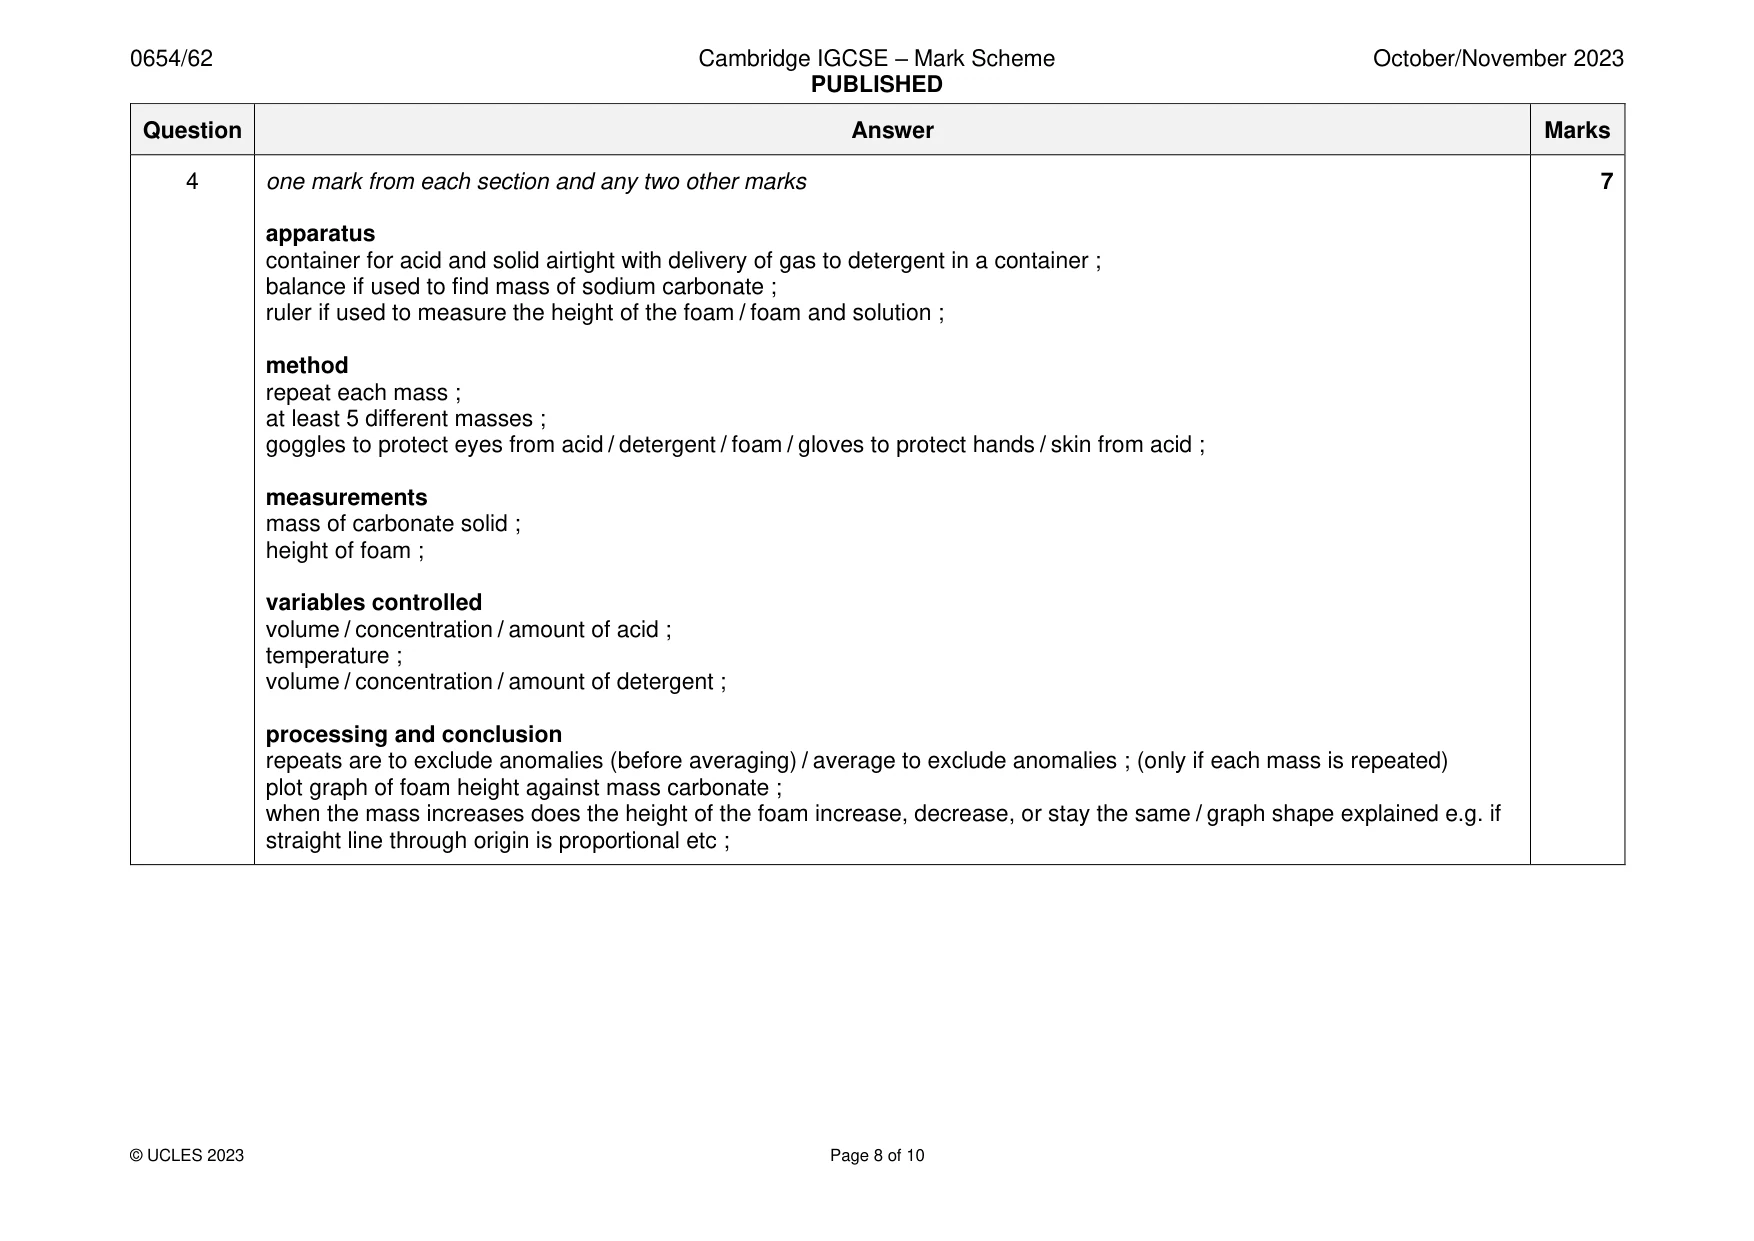
Mark scheme: 4 one mark from each section and any two other marks 7 apparatus container for acid and solid airtight with delivery of gas to detergent in a container ; balance if used to find mass of sodium carbonate ; ruler if used to measure the height of the foam / foam and solution ; method repeat each mass ; at least 5 different masses ; goggles to protect eyes from acid / detergent / foam / gloves to protect hands / skin from acid ; measurements mass of carbonate solid ; height of foam ; variables controlled volume / concentration / amount of acid ; temperature ; volume / concentration / amount of detergent ; processing and conclusion repeats are to exclude anomalies (before averaging) / average to exclude anomalies ; (only if each mass is repeated) plot graph of foam height against mass carbonate ; when the mass increases does the height of the foam increase, decrease, or stay the same / graph shape explained e.g. if straight line through origin is proportional etc ;
Q5 · A student investigates the image formed by a converging lens
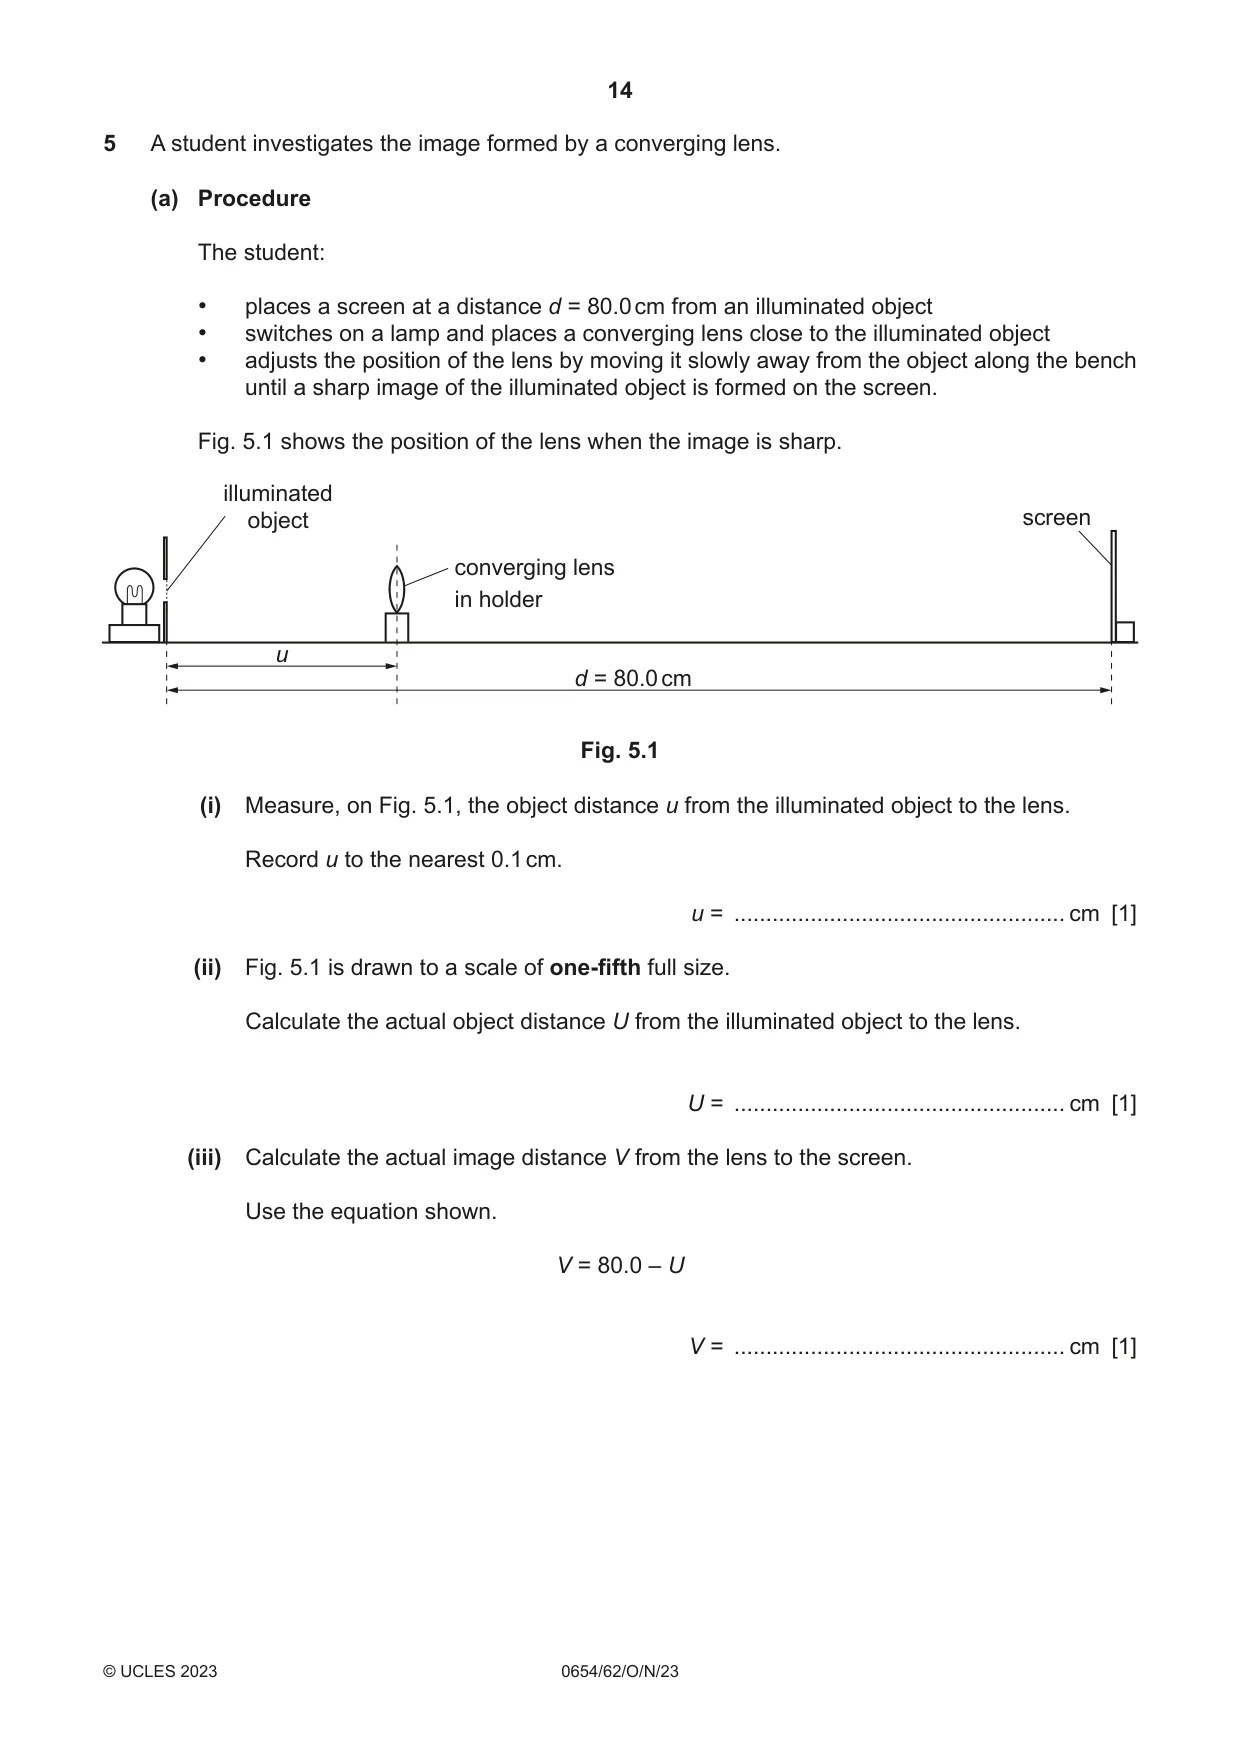
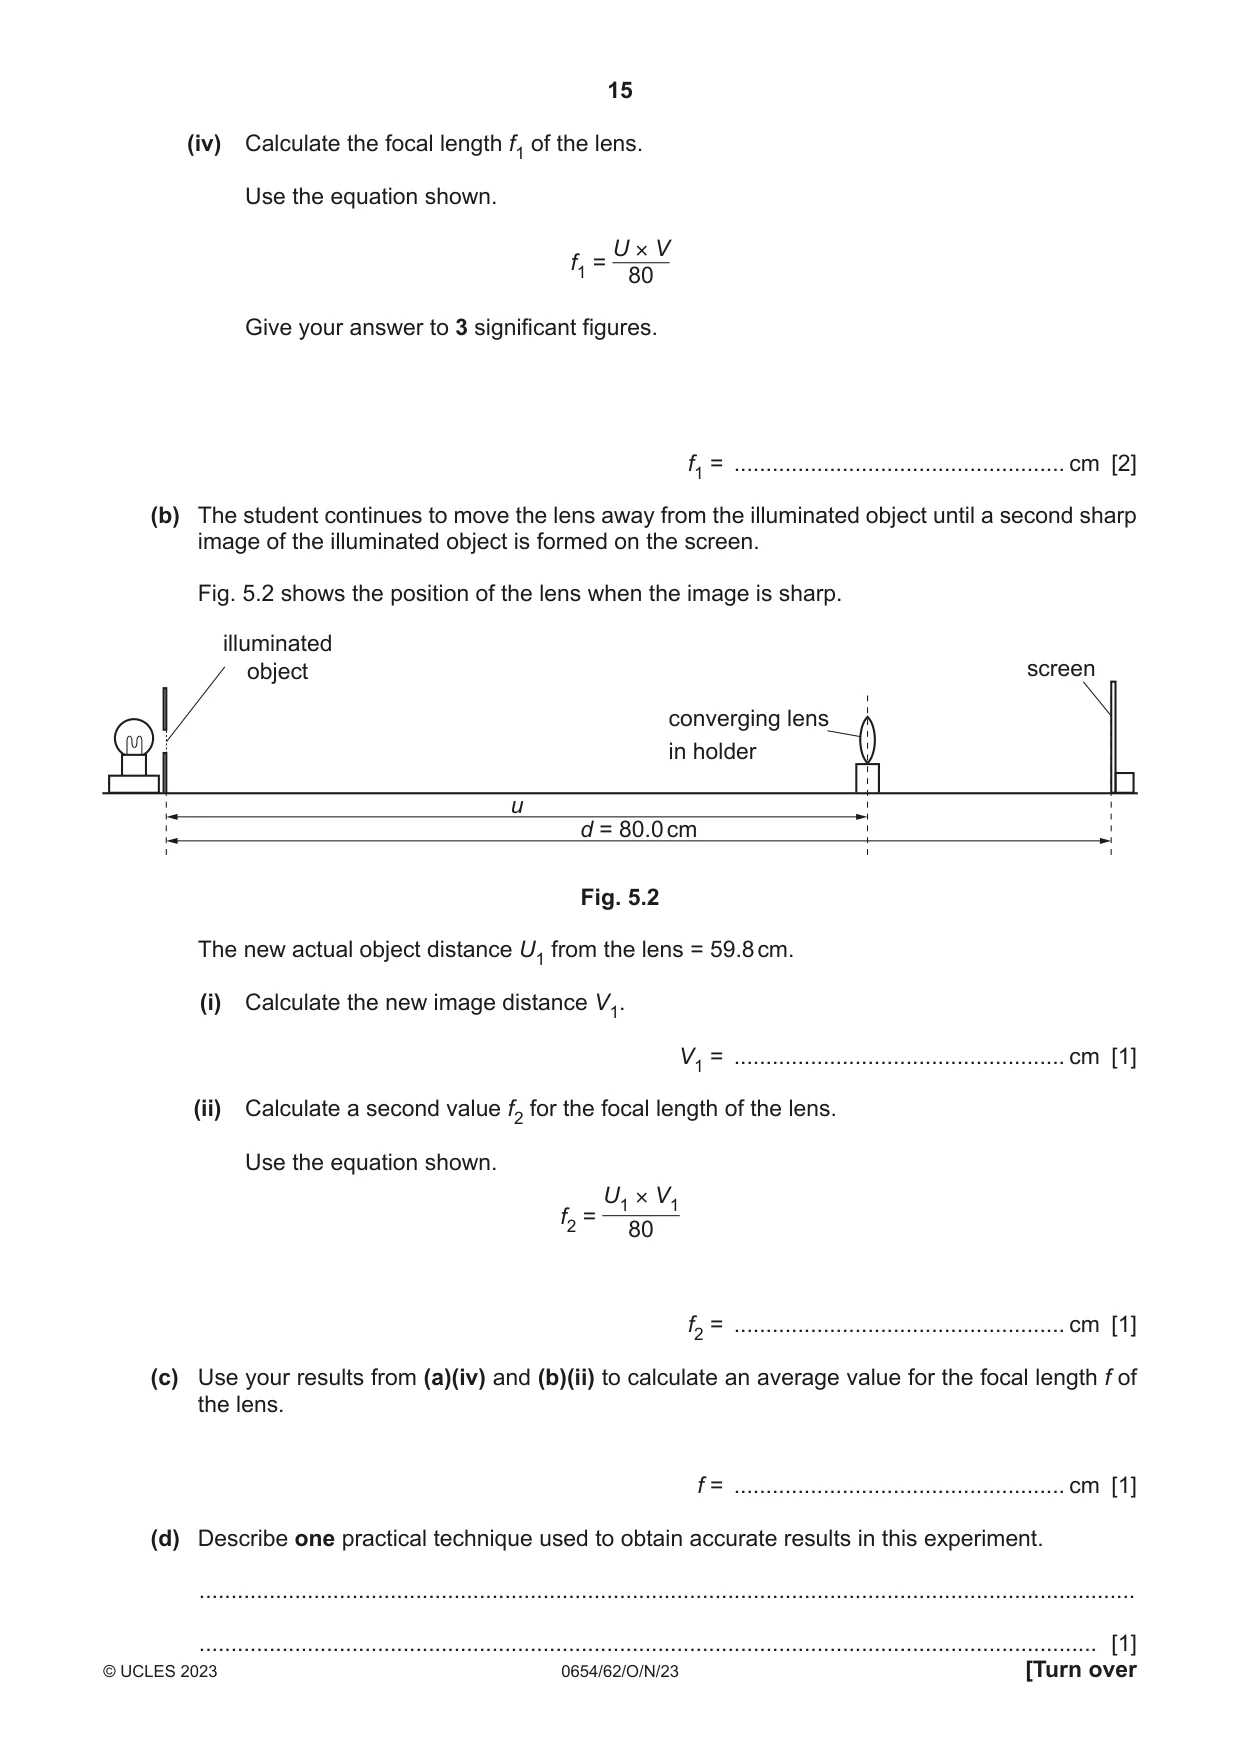
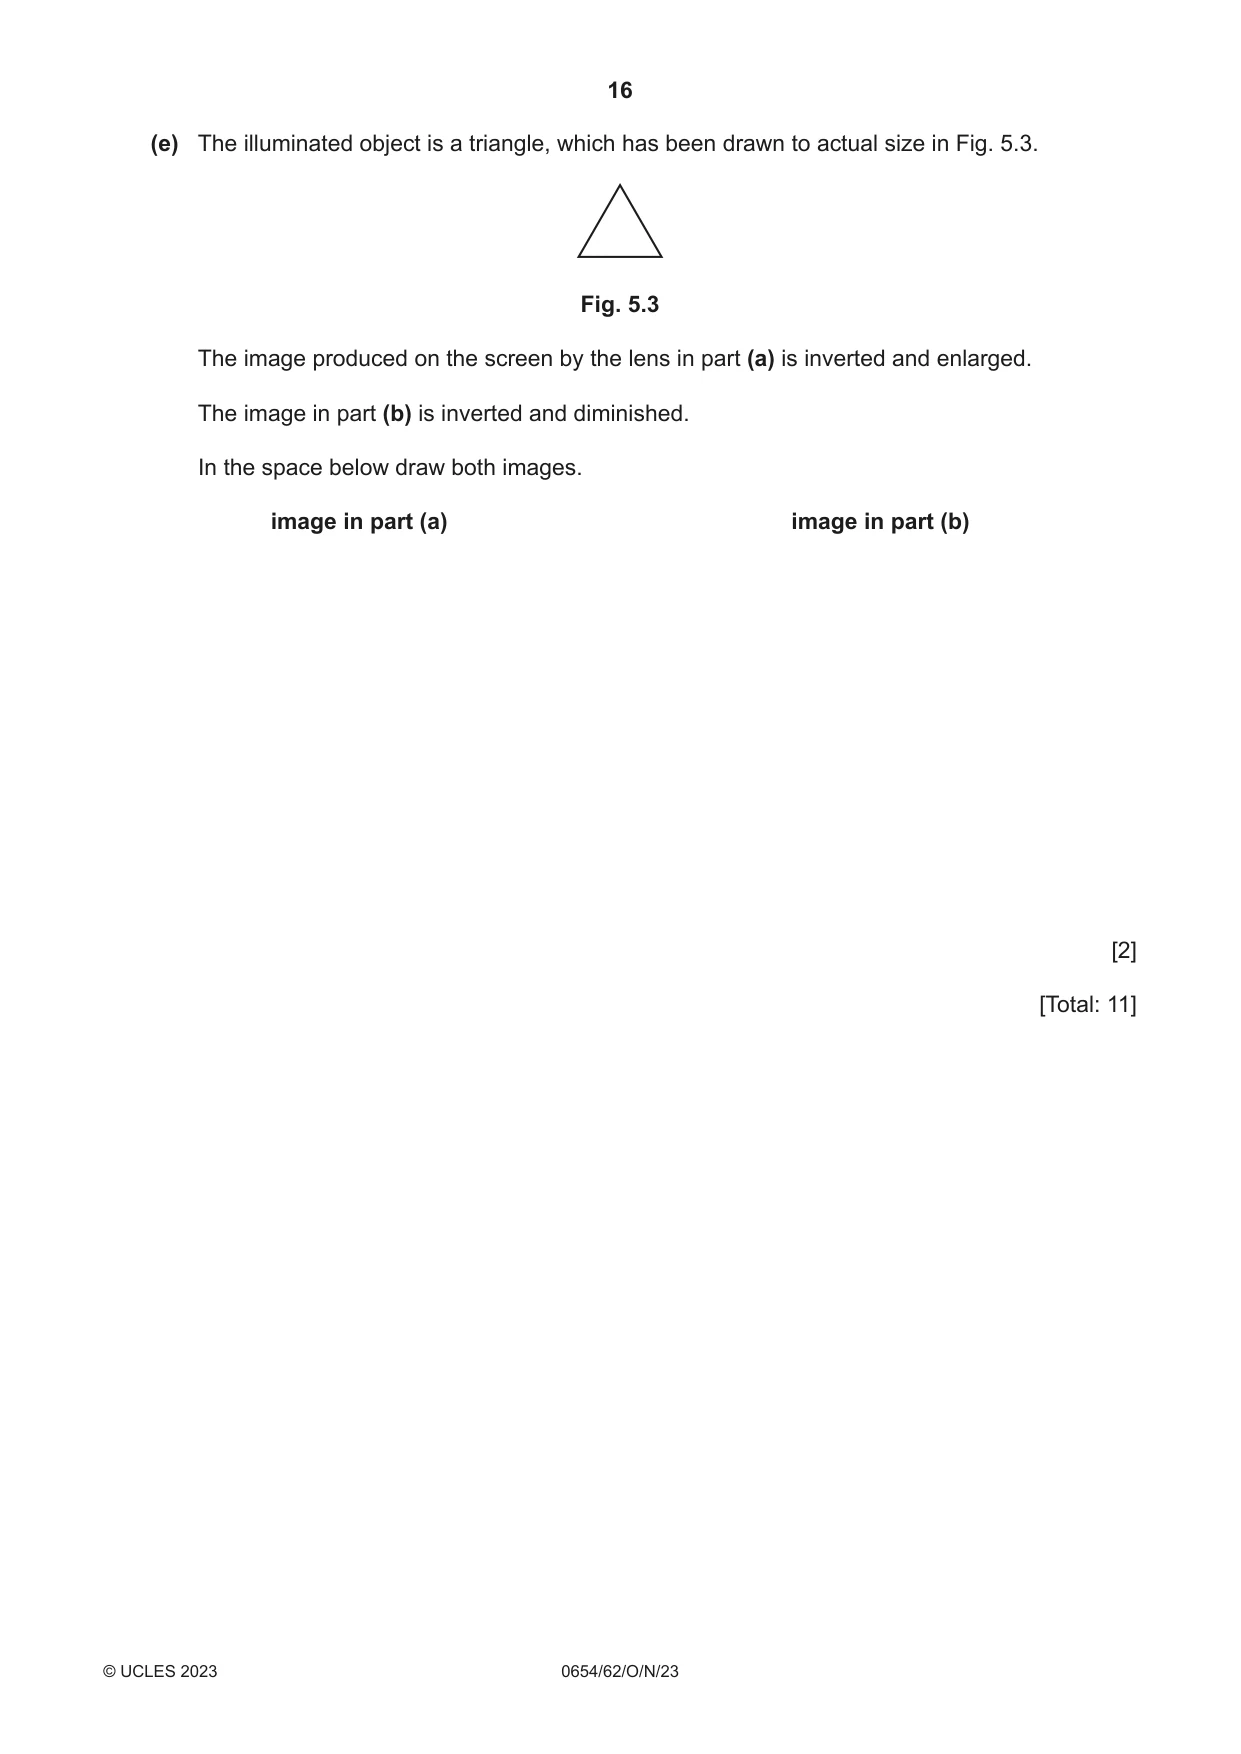
5 A student investigates the image formed by a converging lens. (a) Procedure The student: • places a screen at a distance d = 80.0 cm from an illuminated object • switches on a lamp and places a converging lens close to the illuminated object • adjusts the position of the lens by moving it slowly away from the object along the bench until a sharp image of the illuminated object is formed on the screen. Fig. 5.1 shows the position of the lens when the image is sharp. illuminated object screen converging lens in holder u d = 80.0 cm Fig. 5.1 (i) Measure, on Fig. 5.1, the object distance u from the illuminated object to the lens. Record u to the nearest 0.1 cm. u = .................................................... cm [1] (ii) Fig. 5.1 is drawn to a scale of one‑fifth full size. Calculate the actual object distance U from the illuminated object to the lens. U = .................................................... cm [1] (iii) Calculate the actual image distance V from the lens to the screen. Use the equation shown. V = 80.0 – U V = .................................................... cm [1] (iv) Calculate the focal length f1 of the lens. Use the equation shown. U × V f1 = 80 Give your answer to 3 significant figures. f1 = .................................................... cm [2] (b) The student continues to move the lens away from the illuminated object until a second sharp image of the illuminated object is formed on the screen. Fig. 5.2 shows the position of the lens when the image is sharp. illuminated object screen converging lens in holder u d = 80.0 cm Fig. 5.2 The new actual object distance U1 from the lens = 59.8 cm. (i) Calculate the new image distance V1. V1 = .................................................... cm [1] (ii) Calculate a second value f2 for the focal length of the lens. Use the equation shown. U1 × V1 f2 = 80 f2 = .................................................... cm [1] (c) Use your results from (a)(iv) and (b)(ii) to calculate an average value for the focal length f of the lens. f = .................................................... cm [1] (d) Describe one practical technique used to obtain accurate results in this experiment. ................................................................................................................................................... (e) The illuminated object is a triangle, which has been drawn to actual size in Fig. 5.3. Fig. 5.3 The image produced on the screen by the lens in part (a) is inverted and enlarged. The image in part (b) is inverted and diminished. In the space below draw both images. image in part (a) image in part (b) [2] [Total: 11]
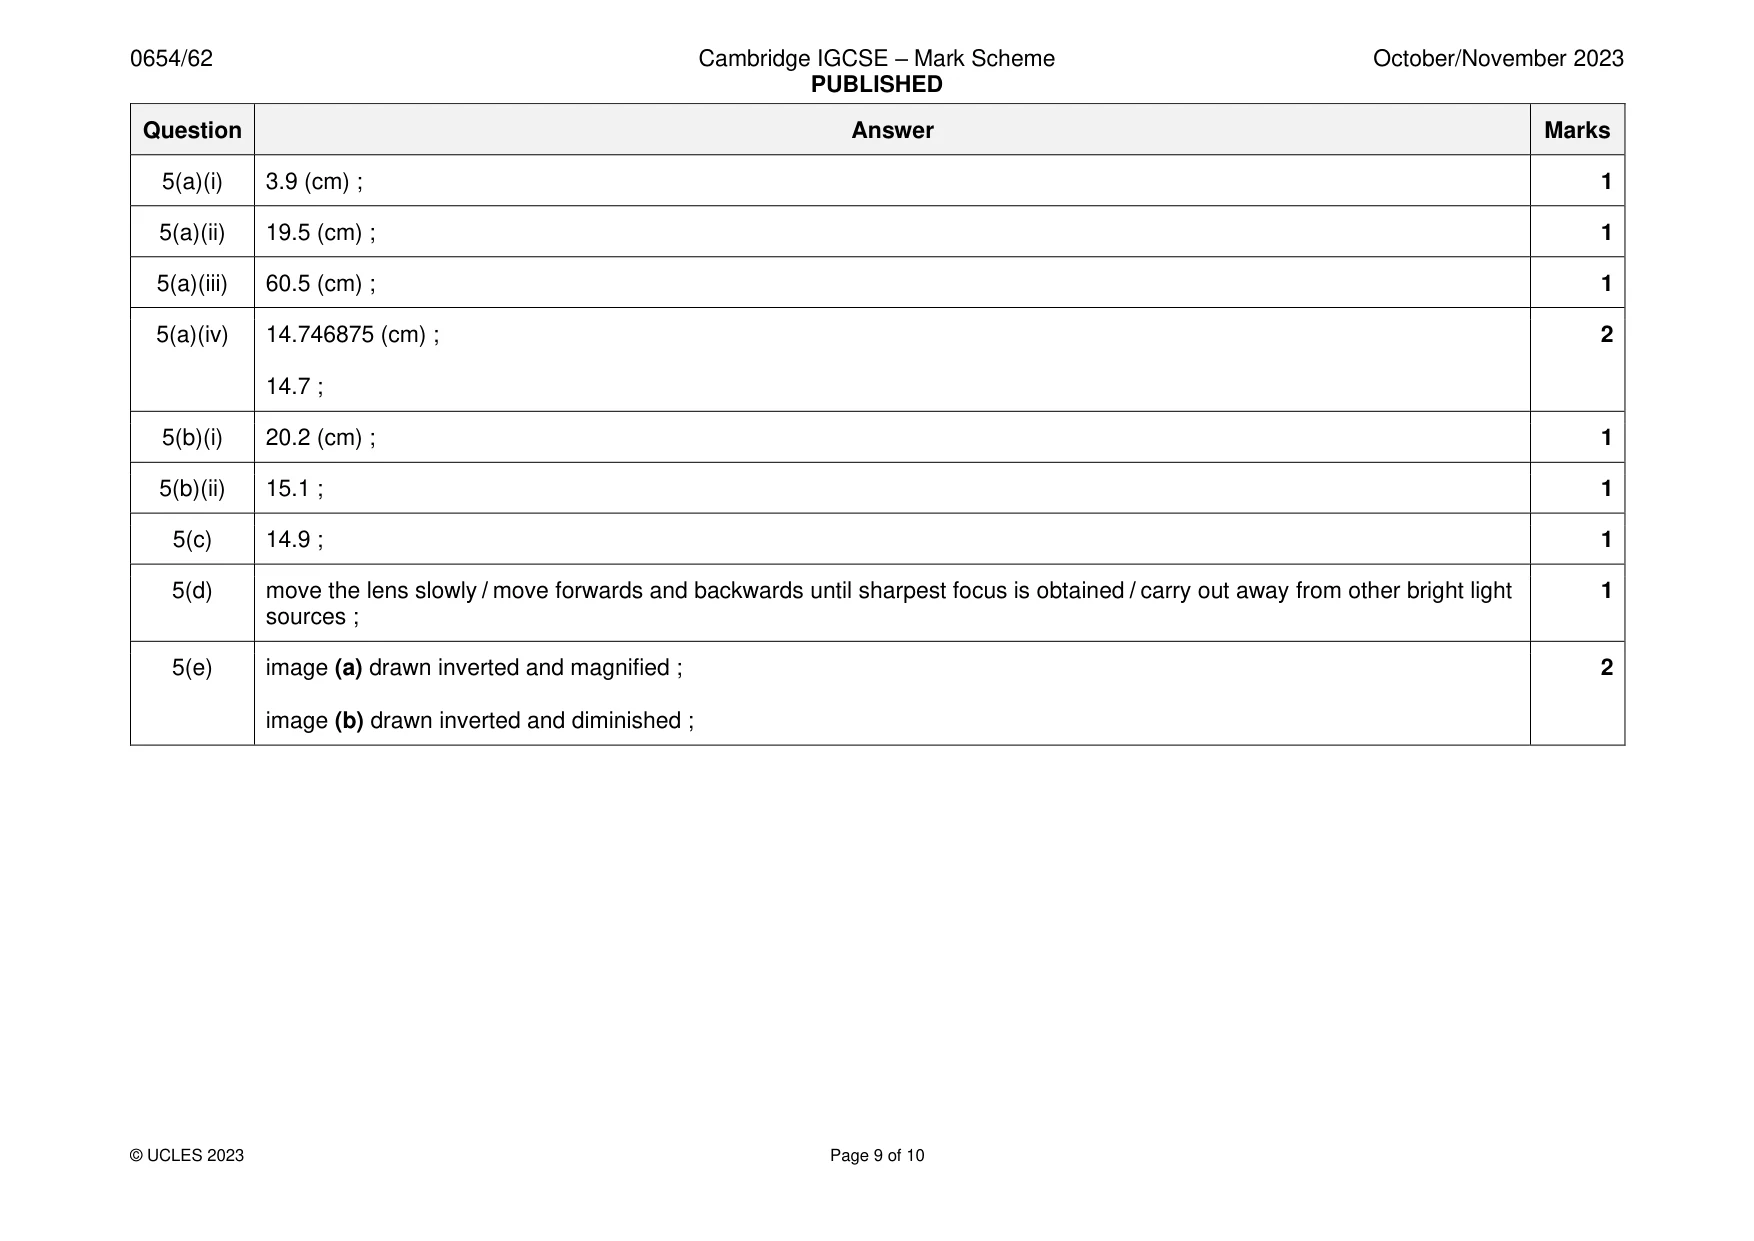
Mark scheme: 5(a)(i) 3.9 (cm) ; 1 5(a)(ii) 19.5 (cm) ; 1 5(a)(iii) 60.5 (cm) ; 1 5(a)(iv) 14.746875 (cm) ; 2 14.7 ; 5(b)(i) 20.2 (cm) ; 1 5(b)(ii) 15.1 ; 1 5(c) 14.9 ; 1 5(d) move the lens slowly / move forwards and backwards until sharpest focus is obtained / carry out away from other bright light 1 sources ; 5(e) image (a) drawn inverted and magnified ; 2 image (b) drawn inverted and diminished ;
Q6 · A student investigates whether two resistance wires X and Y are made from the same metal
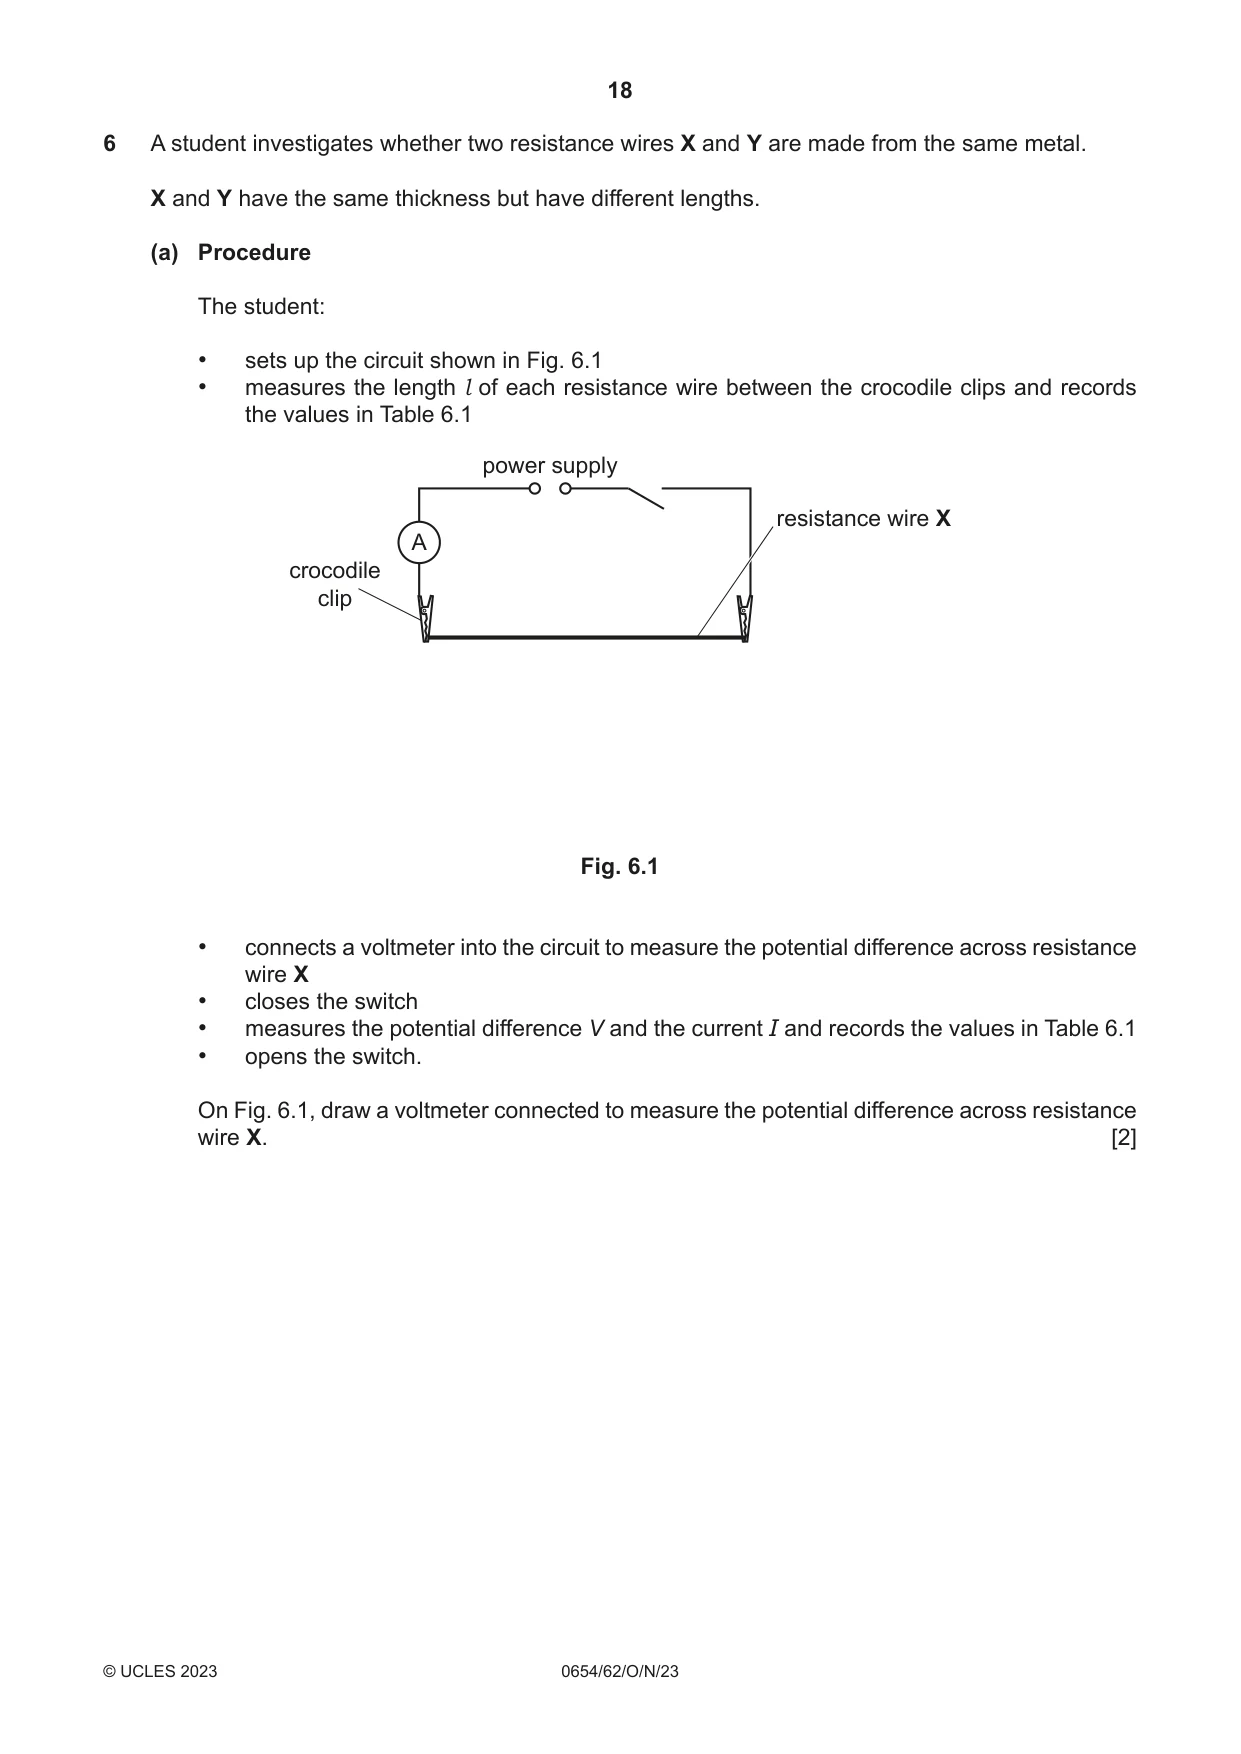
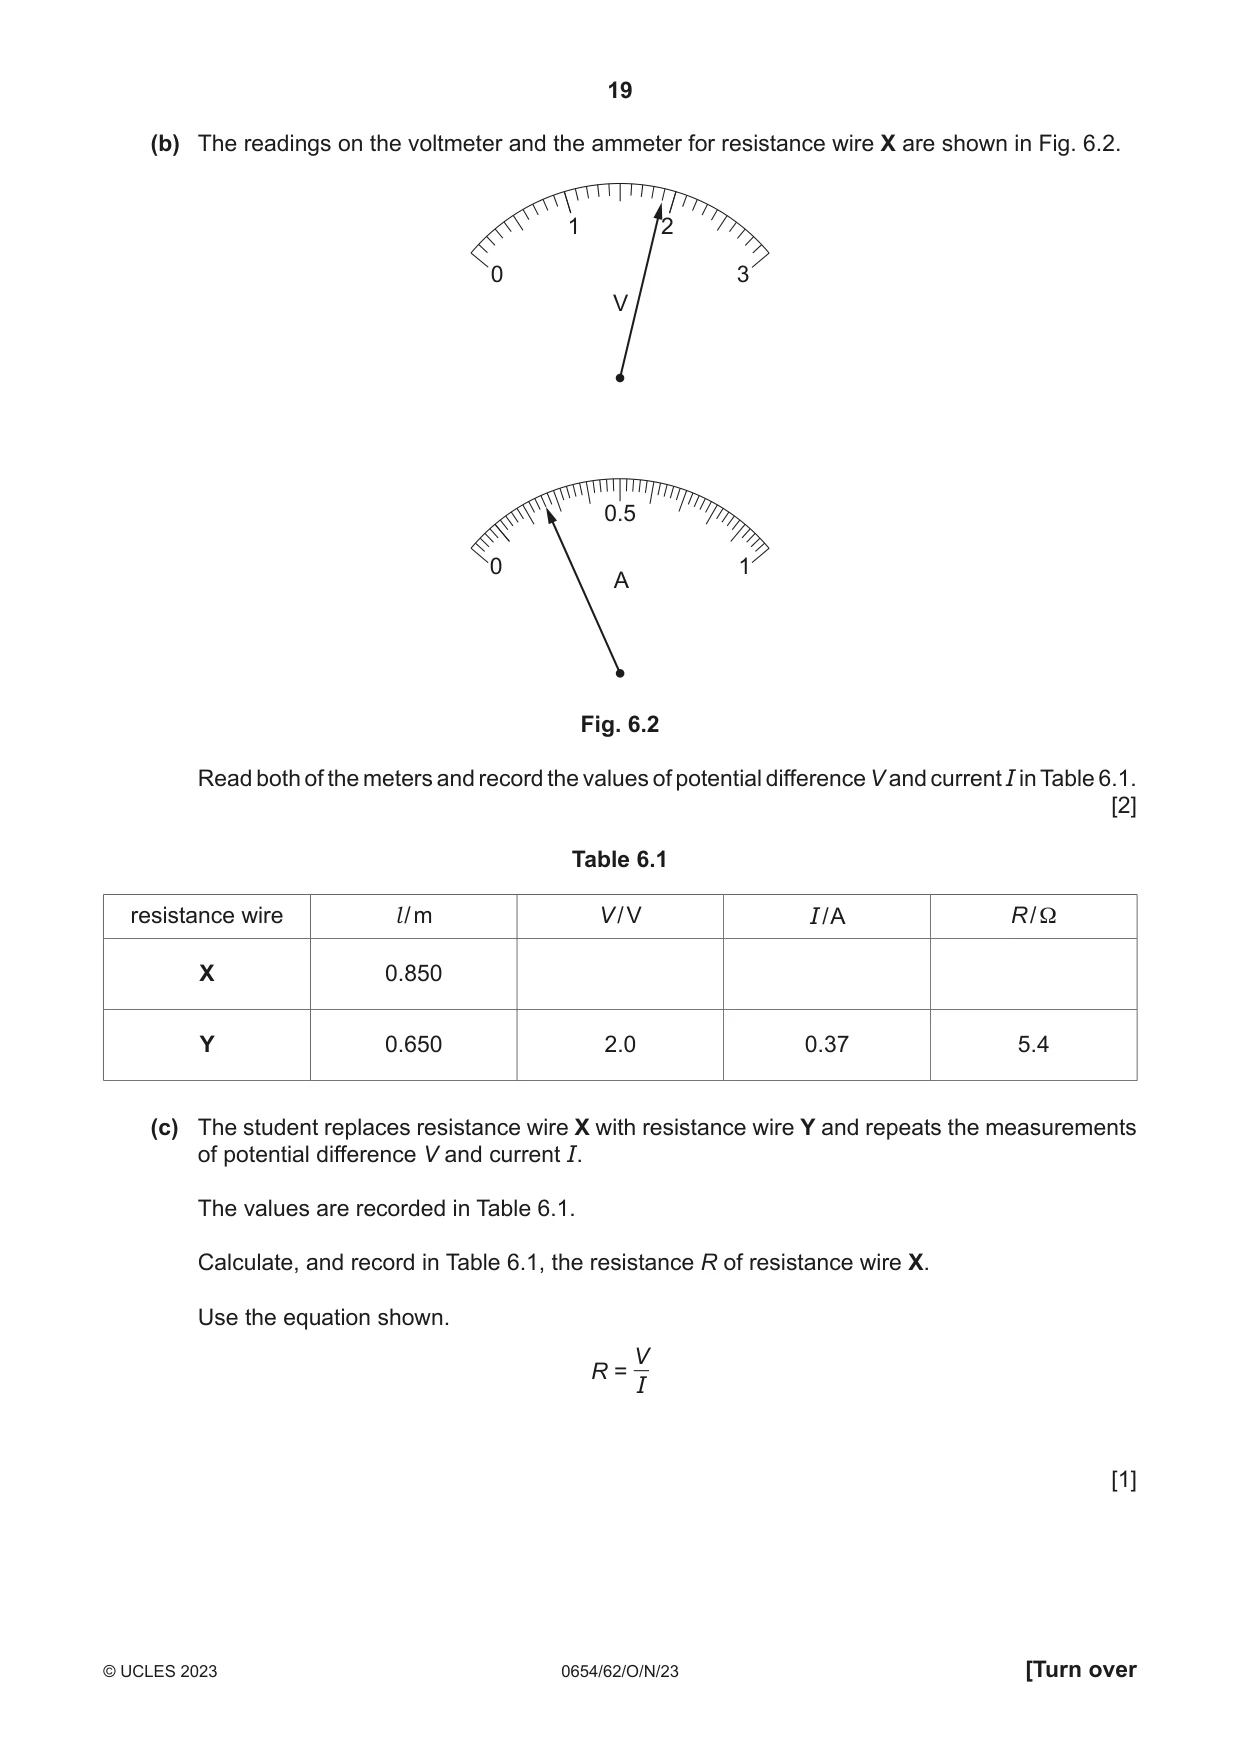
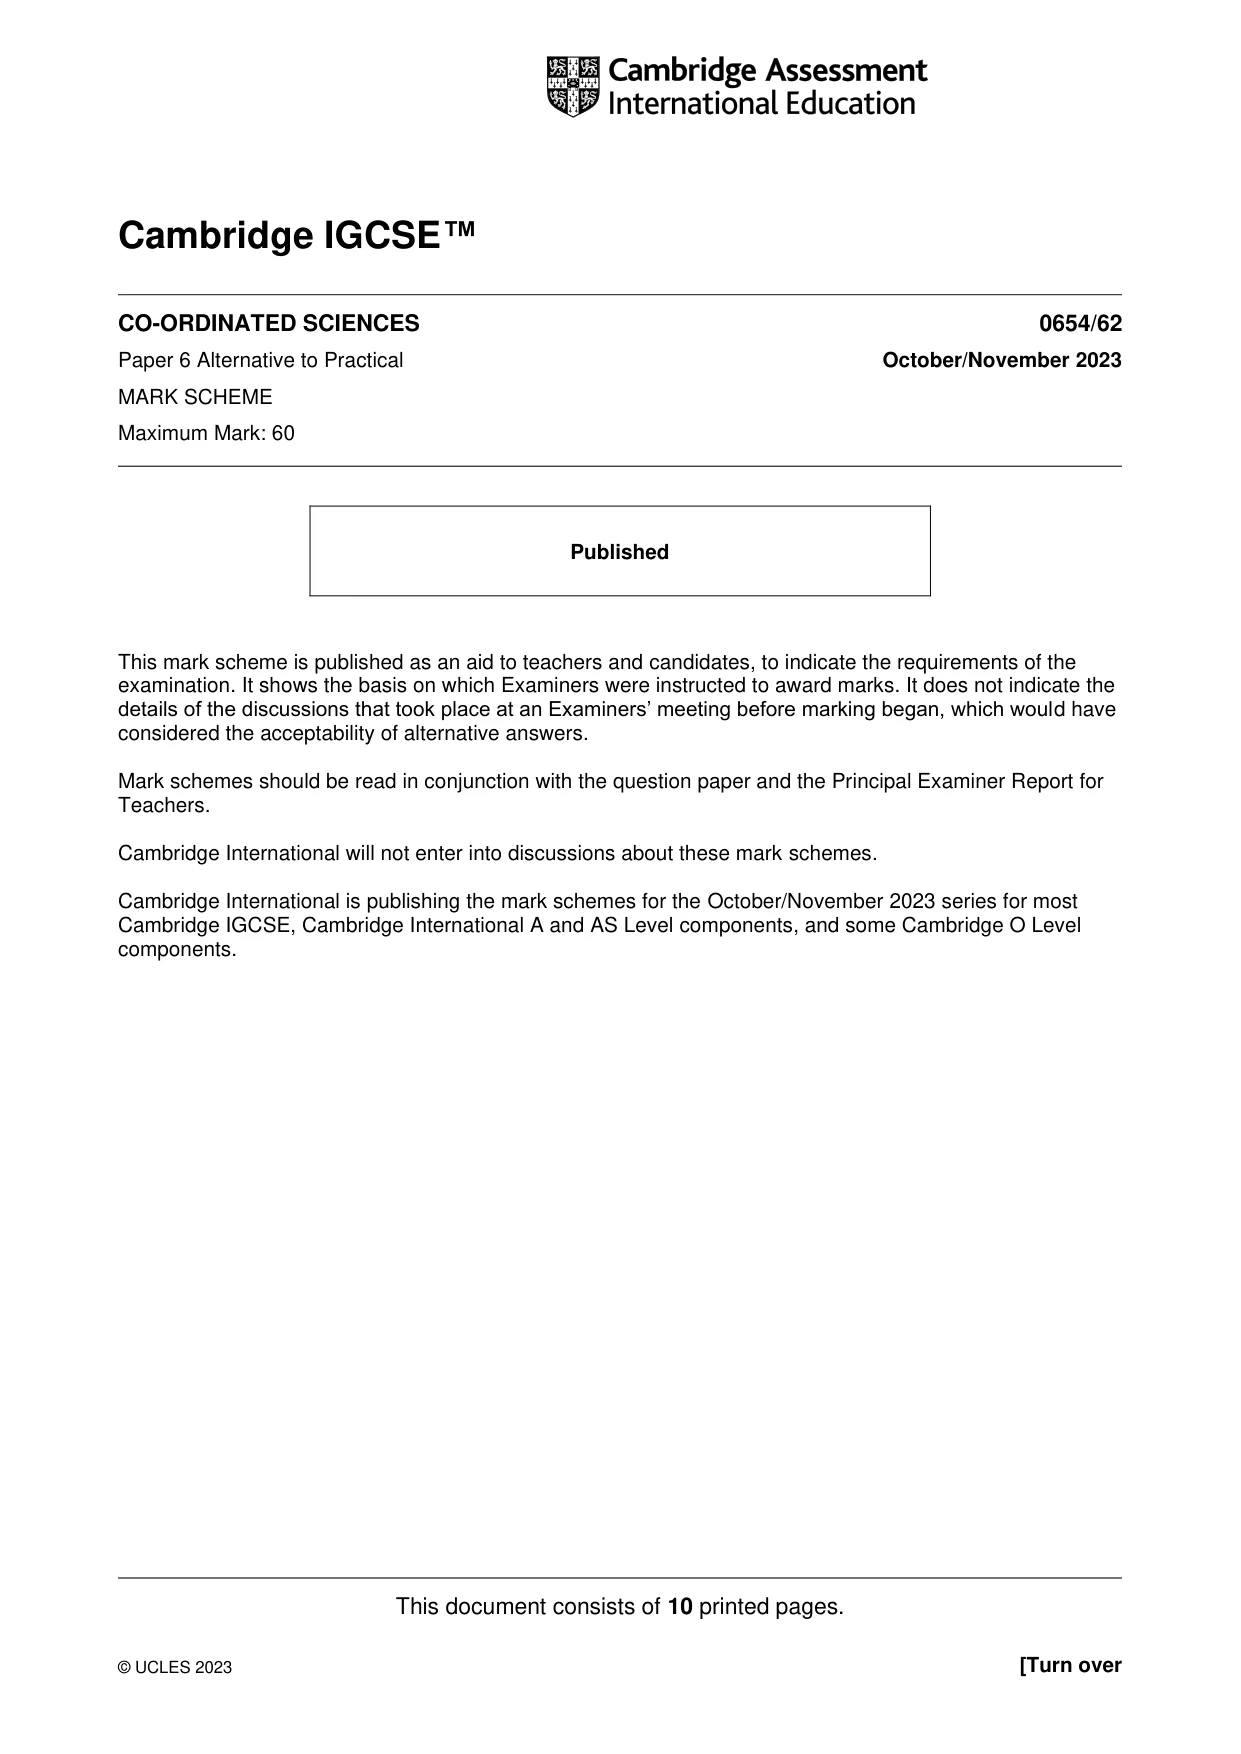
6 A student investigates whether two resistance wires X and Y are made from the same metal. X and Y have the same thickness but have different lengths. (a) Procedure The student: • sets up the circuit shown in Fig. 6.1 • measures the length l of each resistance wire between the crocodile clips and records the values in Table 6.1 power supply resistance wire X A crocodile clip Fig. 6.1 • connects a voltmeter into the circuit to measure the potential difference across resistance wire X • closes the switch • measures the potential difference V and the current I and records the values in Table 6.1 • opens the switch. On Fig. 6.1, draw a voltmeter connected to measure the potential difference across resistance wire X. [2] (b) The readings on the voltmeter and the ammeter for resistance wire X are shown in Fig. 6.2. 1 2 0 3 V 0.5 0 1 A Fig. 6.2 Read both of the meters and record the values of potential difference V and current I in Table 6.1. [2] Table 6.1 resistance wire l / m V / V I / A R / Ω X 0.850 Y 0.650 2.0 0.37 5.4 (c) The student replaces resistance wire X with resistance wire Y and repeats the measurements of potential difference V and current I. The values are recorded in Table 6.1. Calculate, and record in Table 6.1, the resistance R of resistance wire X. Use the equation shown. V R = I [1] (d) Calculate the resistance per metre r of each resistance wire. Use the equation shown. R r = l r for wire X = ....................................................... Ω / m r for wire Y = ....................................................... Ω / m [1] (e) Two quantities can be considered to be the same, within the limits of experimental accuracy, if their values are within 10% of each other. Use your values from (d) to suggest if the resistance wires are made from the same metal. Support your answer with a calculation. ................................................................................................................................................... ................................................................................................................................................... ................................................................................................................................................... ............................................................................................................................................. [2] (f) In this experiment the resistance wires heat up. Suggest one method of reducing the heating effect in the wires. ................................................................................................................................................... ............................................................................................................................................. [1] [Total: 9]
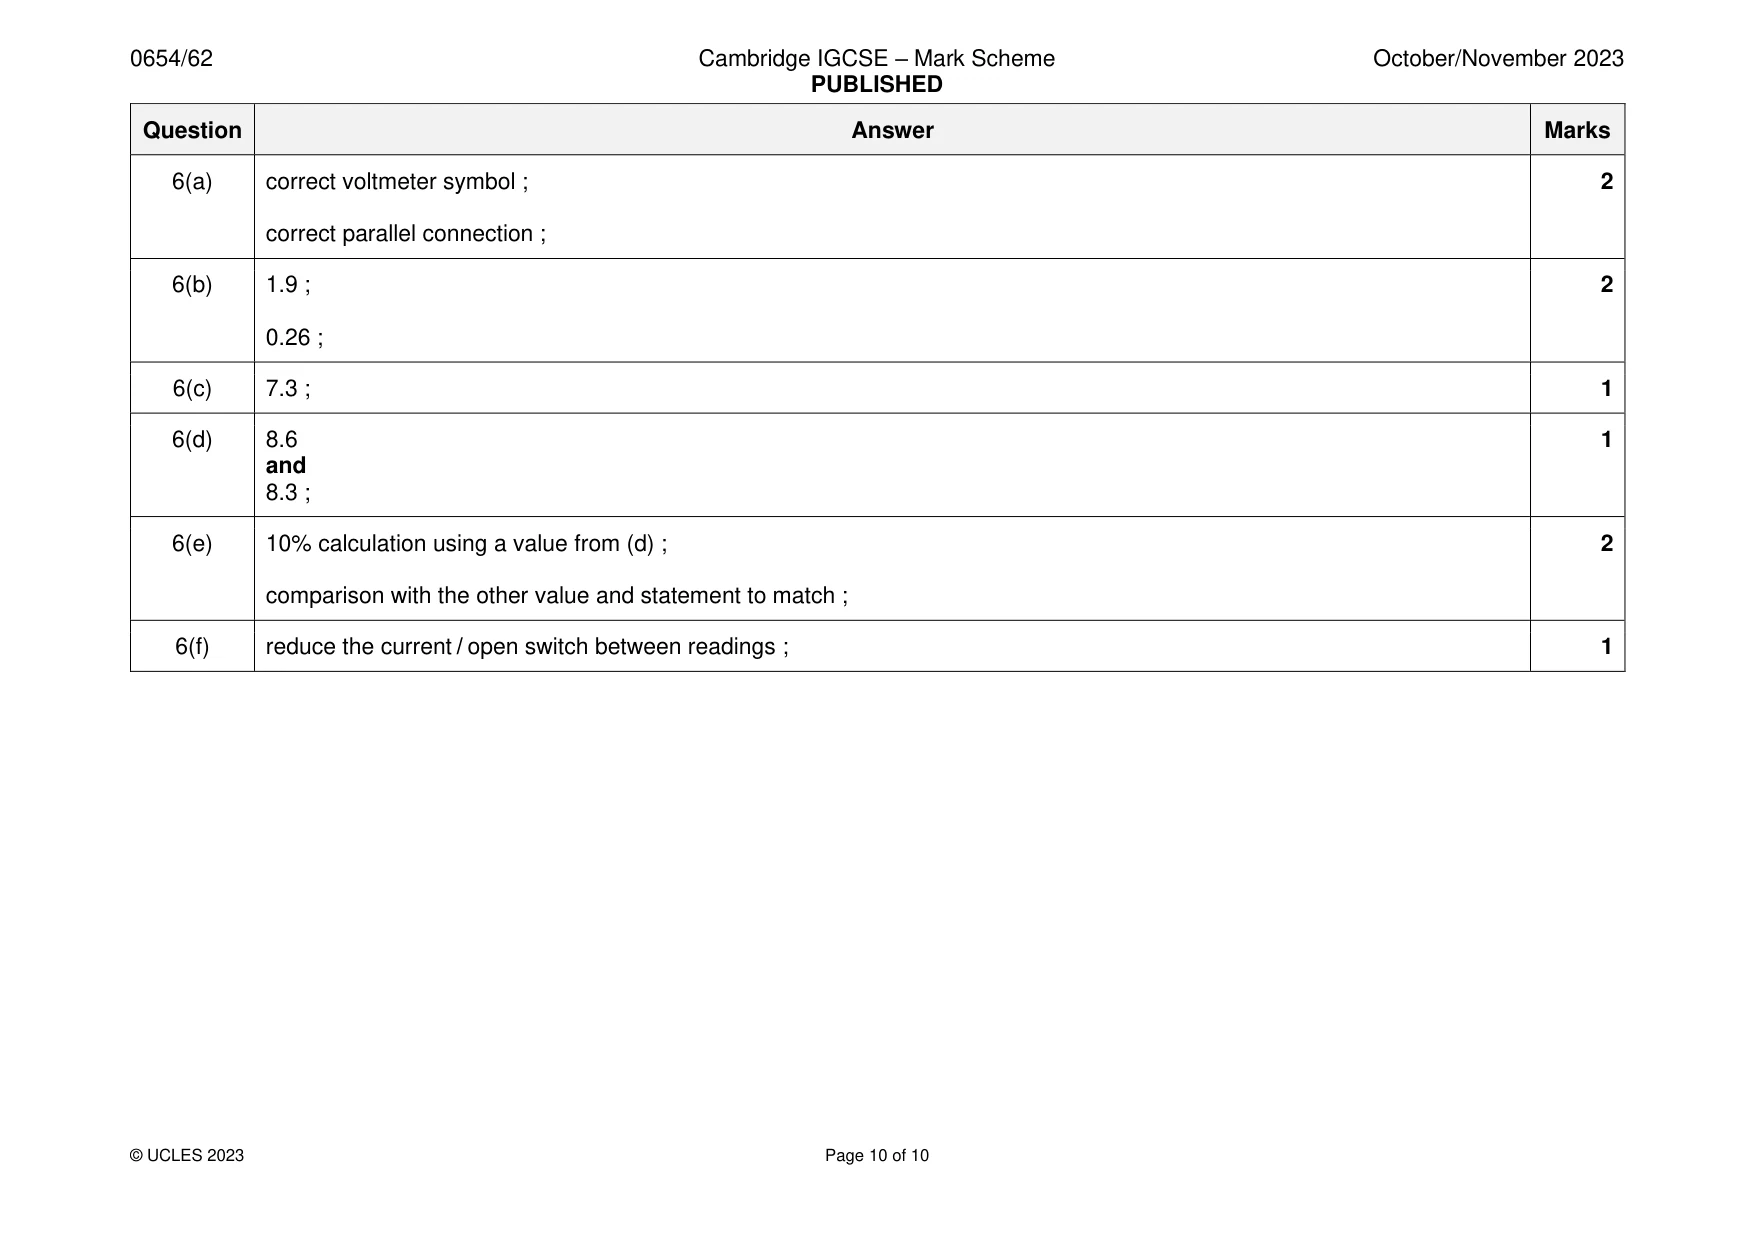
Mark scheme: 6(a) correct voltmeter symbol ; 2 correct parallel connection ; 6(b) 1.9 ; 2 0.26 ; 6(c) 7.3 ; 1 6(d) 8.6 1 and 8.3 ; 6(e) 10% calculation using a value from (d) ; 2 comparison with the other value and statement to match ; 6(f) reduce the current / open switch between readings ; 1
What was in this paper
The subtopics covered by these 6 questions, and how many questions each got. Open one in a new tab to see every Cambridge question on it.
What you needed in this session
Cambridge’s own grade thresholds for 2023 Oct/Nov, Paper 6 · Variant 2. A higher threshold means an easier paper — the bar moves with how the cohort did.