Cambridge IGCSE Sciences - Co-ordinated (Double) 0654 — 2023 Oct/Nov Paper 6 · Variant 3
0654/63/O/N/23 · 5 questions · 60 marks · ≈68 min
The question paper and its mark scheme, free to read here and free to download. This is Cambridge’s own paper, exactly as it was sat.
Question paper20 pages




Mark scheme10 pages
Answers below. Sit the paper first if you are practising.
Questions as text
Q1 · A student investigates an enzyme-controlled reaction
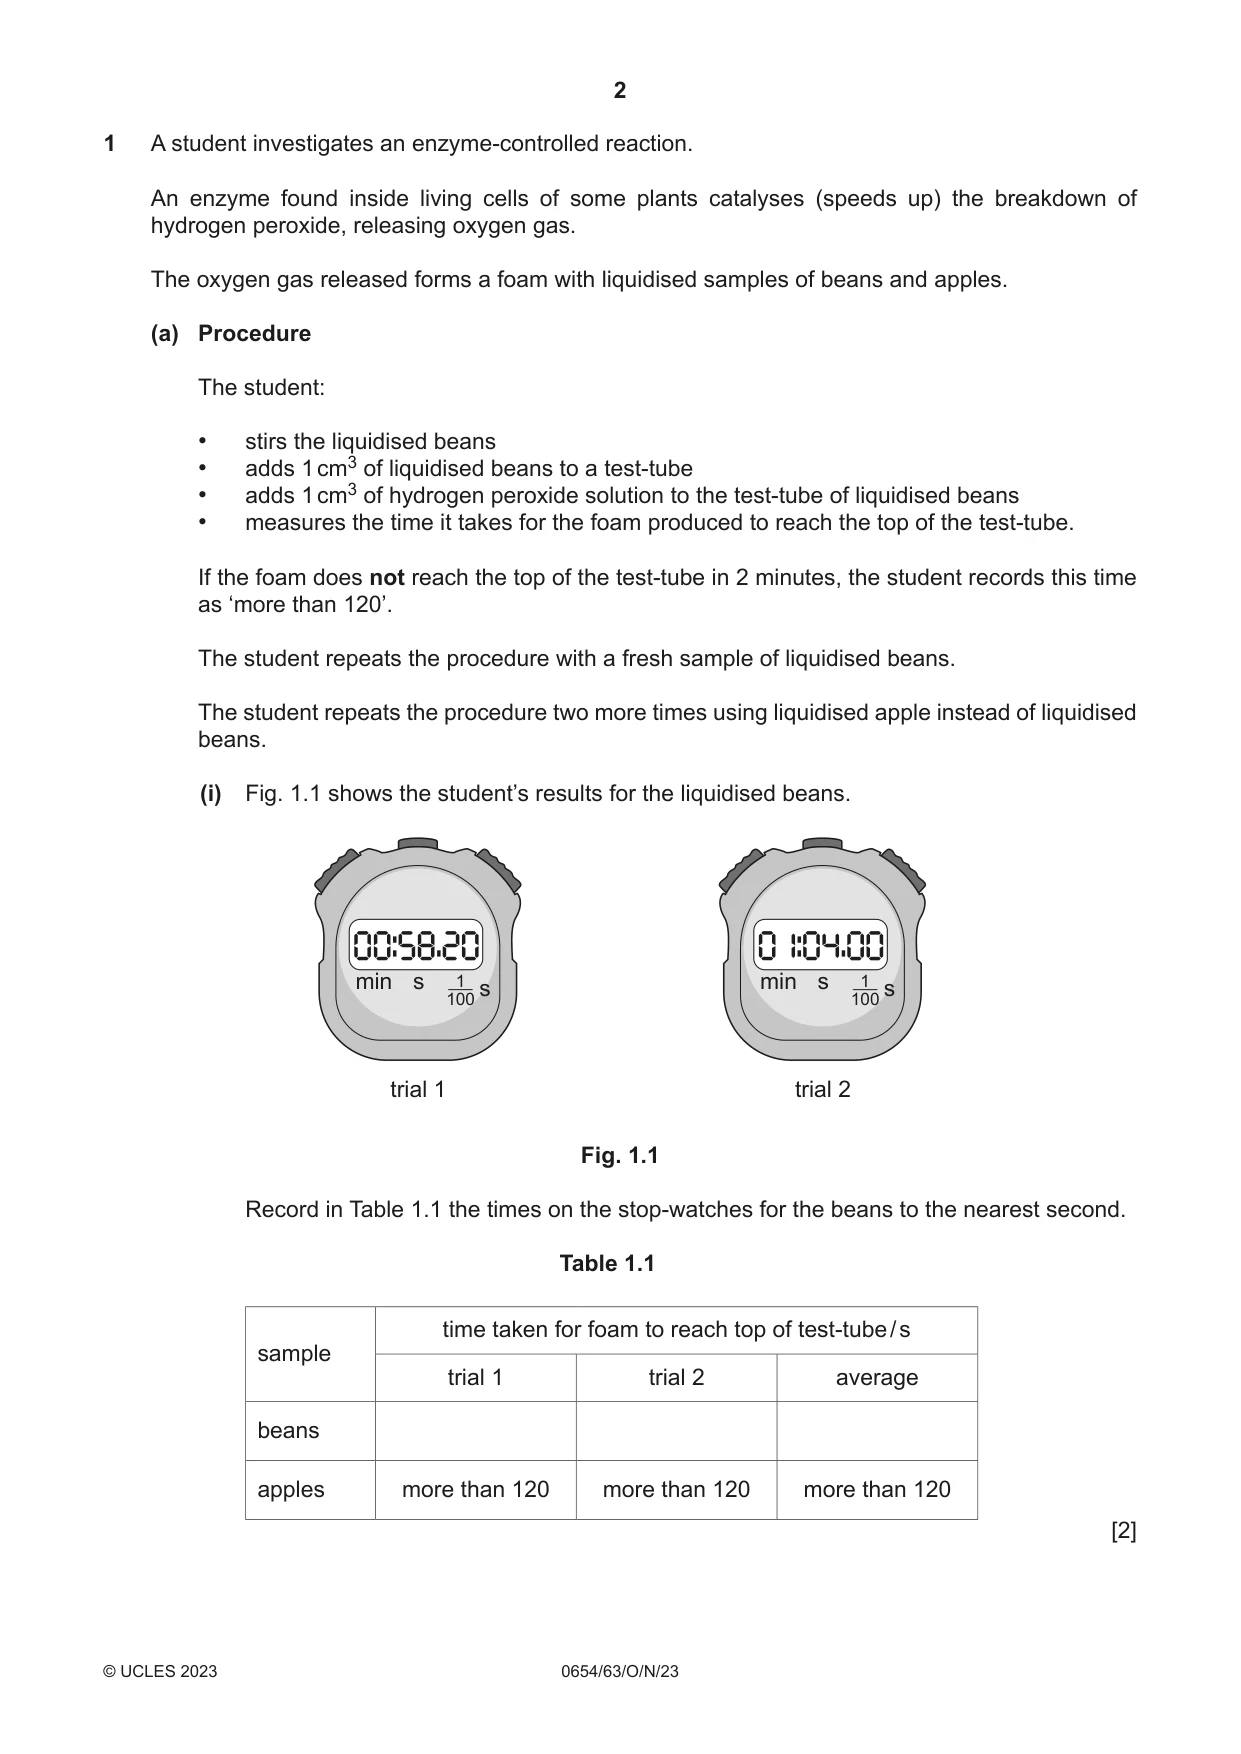
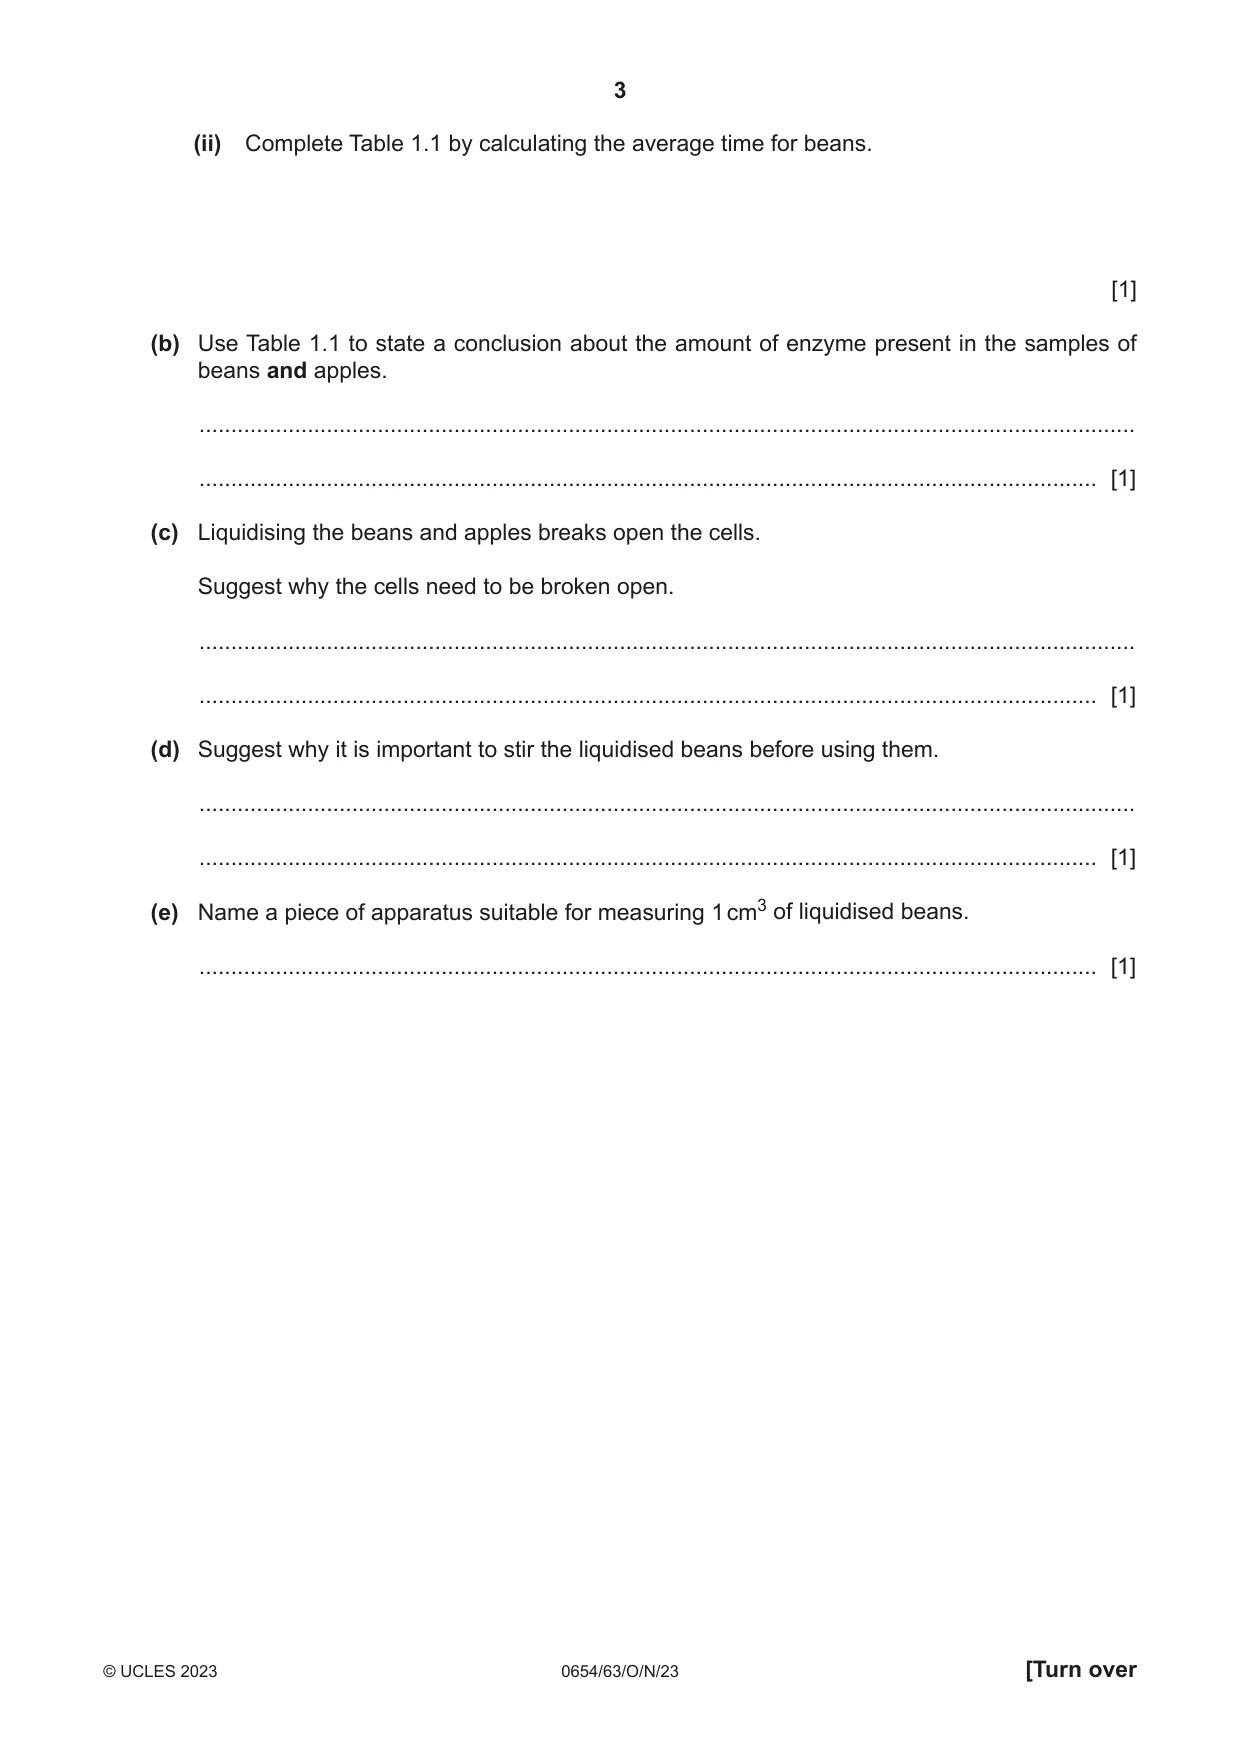
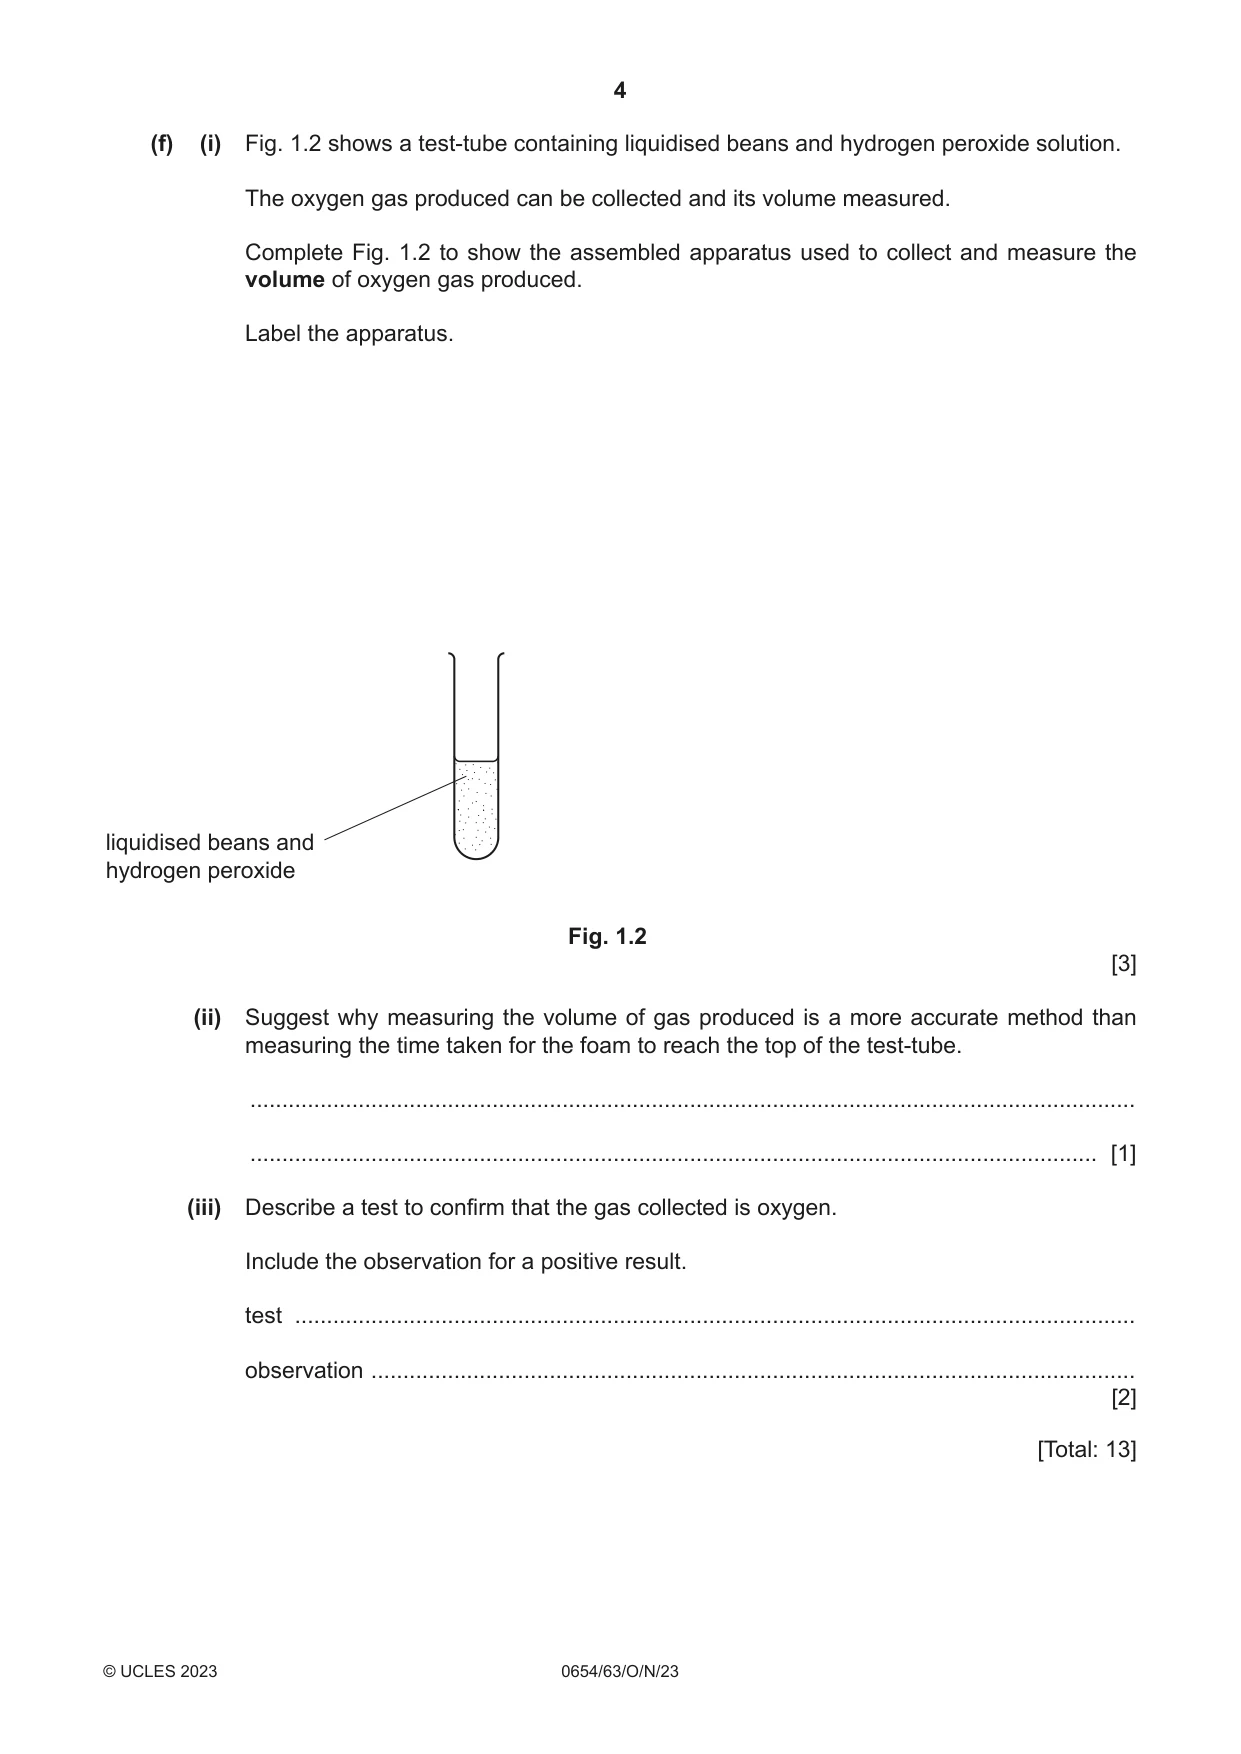
1 A student investigates an enzyme-controlled reaction. An enzyme found inside living cells of some plants catalyses (speeds up) the breakdown of hydrogen peroxide, releasing oxygen gas. The oxygen gas released forms a foam with liquidised samples of beans and apples. (a) Procedure The student: • stirs the liquidised beans • adds 1 cm3 of liquidised beans to a test-tube • adds 1 cm3 of hydrogen peroxide solution to the test-tube of liquidised beans • measures the time it takes for the foam produced to reach the top of the test-tube. If the foam does not reach the top of the test-tube in 2 minutes, the student records this time as ‘more than 120’. The student repeats the procedure with a fresh sample of liquidised beans. The student repeats the procedure two more times using liquidised apple instead of liquidised beans. (i) Fig. 1.1 shows the student’s results for the liquidised beans. min s 1 min s 1 s s 100 100 trial 1 trial 2 Fig. 1.1 Record in Table 1.1 the times on the stop-watches for the beans to the nearest second. Table 1.1 time taken for foam to reach top of test-tube / s sample trial 1 trial 2 average beans apples more than 120 more than 120 more than 120 [2] (ii) Complete Table 1.1 by calculating the average time for beans. [1] (b) Use Table 1.1 to state a conclusion about the amount of enzyme present in the samples of beans and apples. ................................................................................................................................................... ............................................................................................................................................. [1] (c) Liquidising the beans and apples breaks open the cells. Suggest why the cells need to be broken open. ................................................................................................................................................... ............................................................................................................................................. [1] (d) Suggest why it is important to stir the liquidised beans before using them. ................................................................................................................................................... ............................................................................................................................................. [1] (e) Name a piece of apparatus suitable for measuring 1 cm3 of liquidised beans. ............................................................................................................................................. [1] (f) (i) Fig. 1.2 shows a test-tube containing liquidised beans and hydrogen peroxide solution. The oxygen gas produced can be collected and its volume measured. Complete Fig. 1.2 to show the assembled apparatus used to collect and measure the volume of oxygen gas produced. Label the apparatus. liquidised beans and hydrogen peroxide Fig. 1.2 [3] (ii) Suggest why measuring the volume of gas produced is a more accurate method than measuring the time taken for the foam to reach the top of the test-tube. ........................................................................................................................................... ..................................................................................................................................... [1] (iii) Describe a test to confirm that the gas collected is oxygen. Include the observation for a positive result. test .................................................................................................................................... observation ........................................................................................................................ [2] [Total: 13]
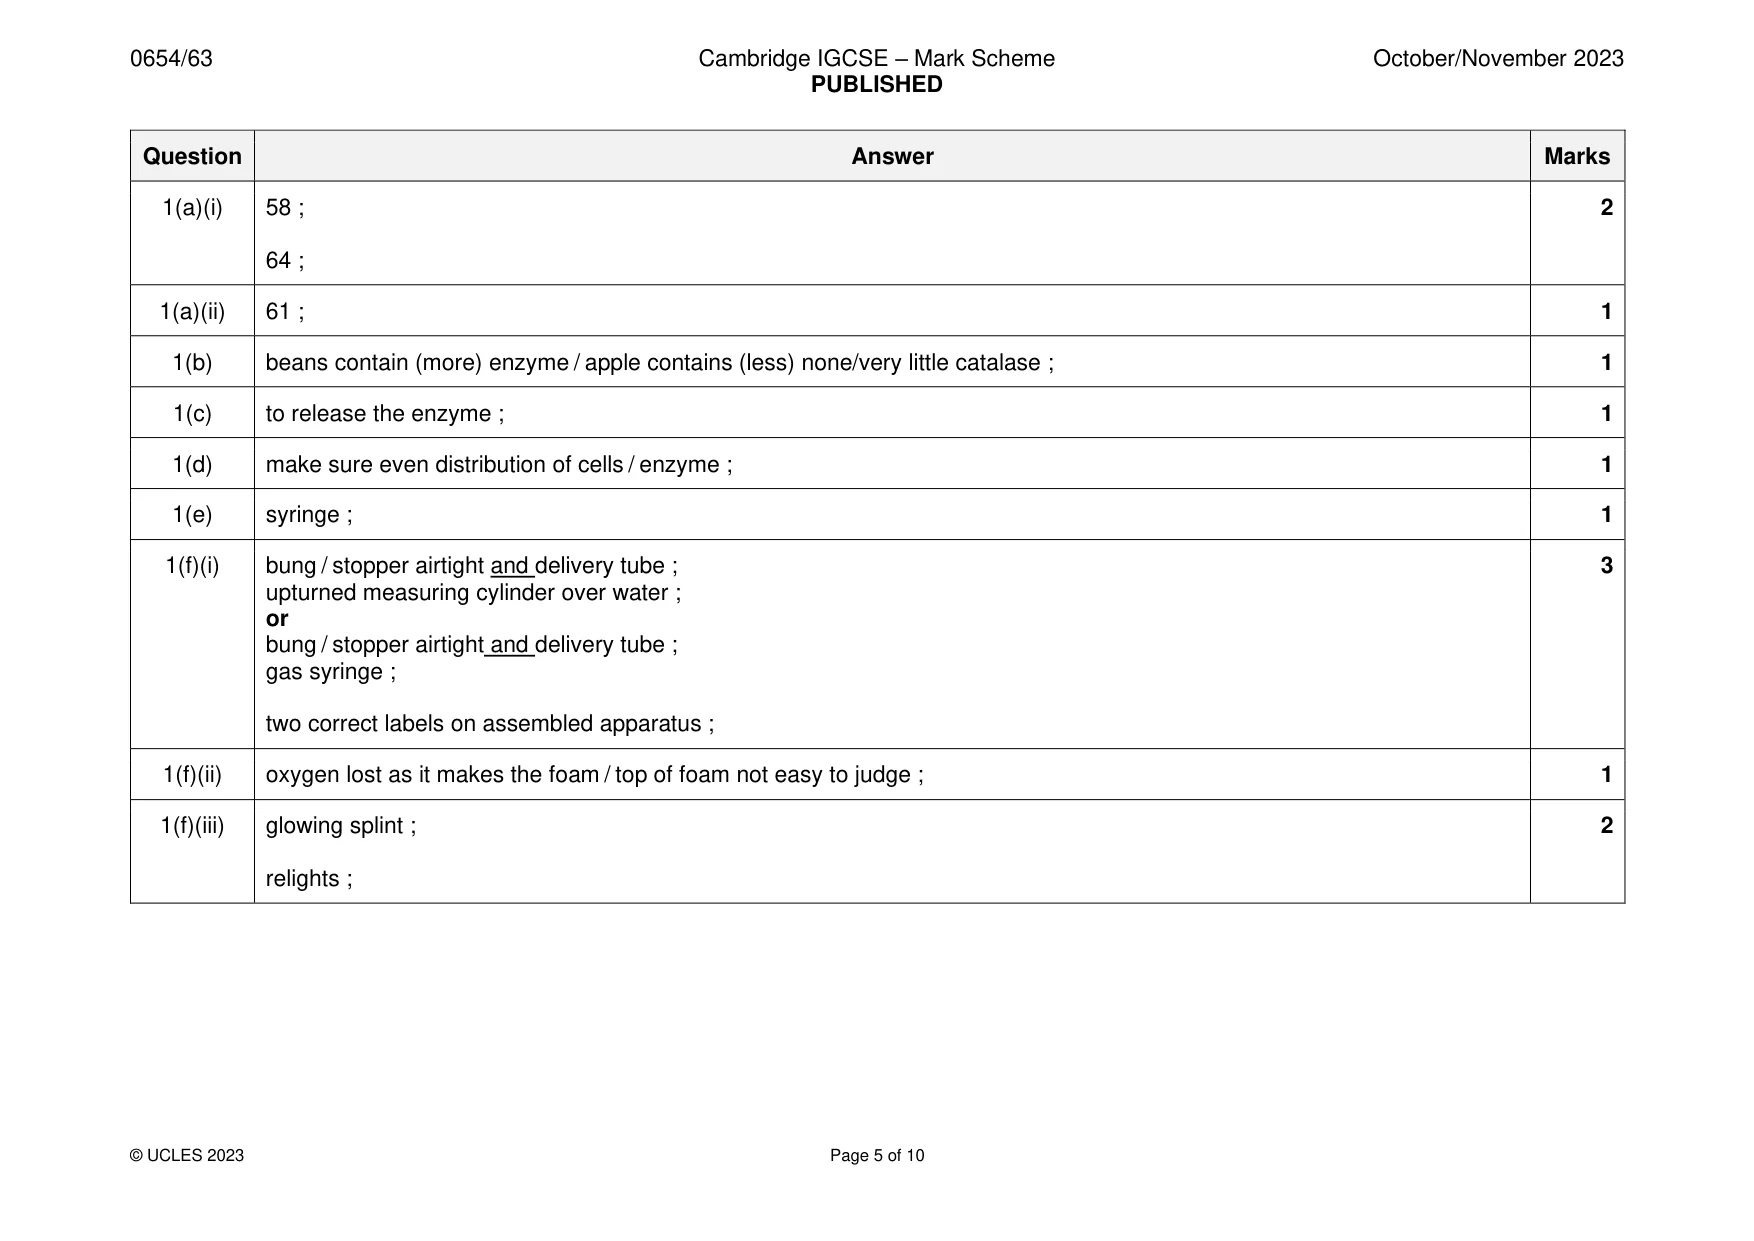
Mark scheme: Question Answer Marks 1(a)(i) 58 ; 2 64 ; 1(a)(ii) 61 ; 1 1(b) beans contain (more) enzyme / apple contains (less) none/very little catalase ; 1 1(c) to release the enzyme ; 1 1(d) make sure even distribution of cells / enzyme ; 1 1(e) syringe ; 1 1(f)(i) bung / stopper airtight and delivery tube ; 3 upturned measuring cylinder over water ; or bung / stopper airtight and delivery tube ; gas syringe ; two correct labels on assembled apparatus ; 1(f)(ii) oxygen lost as it makes the foam / top of foam not easy to judge ; 1 1(f)(iii) glowing splint ; 2 relights ;
Q2 · Amylase is a digestive enzyme that breaks down starch into sugars
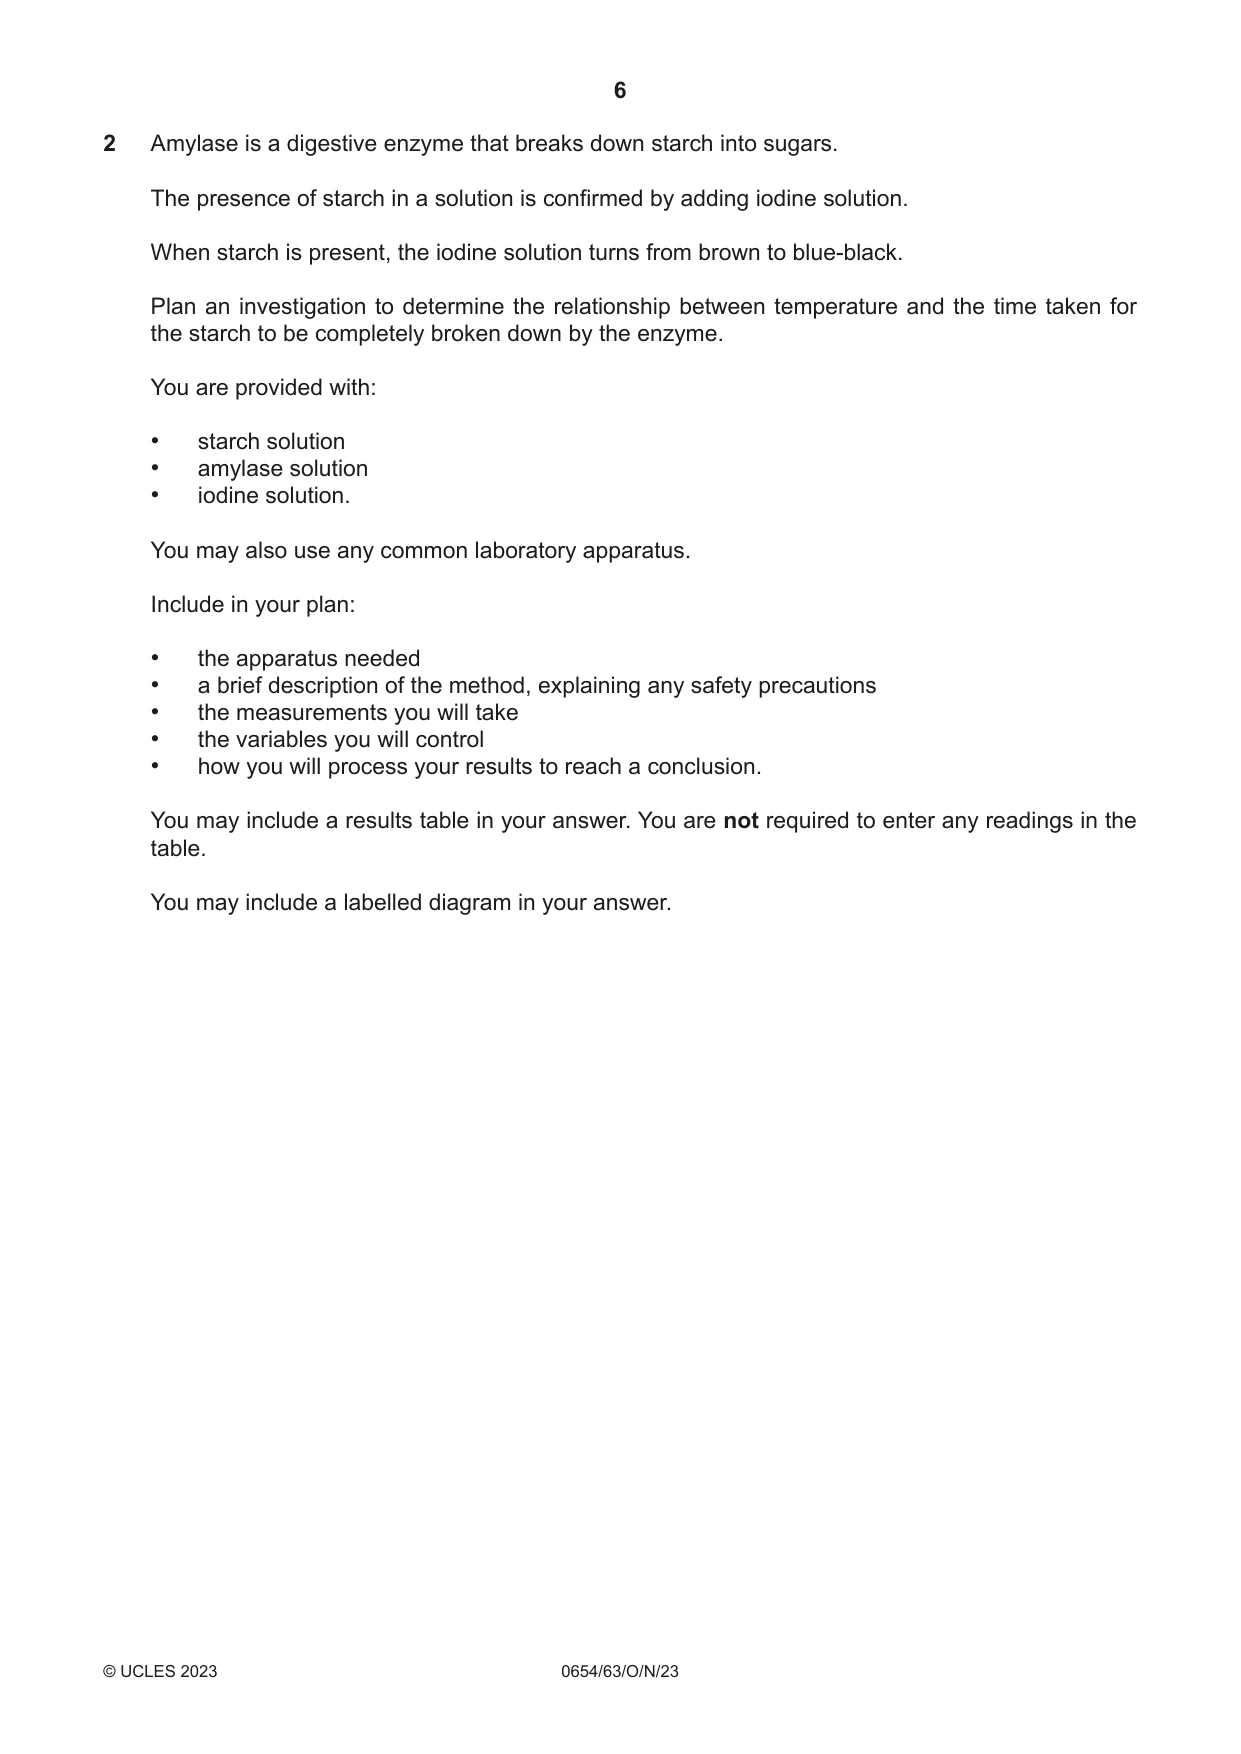
2 Amylase is a digestive enzyme that breaks down starch into sugars. The presence of starch in a solution is confirmed by adding iodine solution. When starch is present, the iodine solution turns from brown to blue-black. Plan an investigation to determine the relationship between temperature and the time taken for the starch to be completely broken down by the enzyme. You are provided with: • starch solution • amylase solution • iodine solution. You may also use any common laboratory apparatus. Include in your plan: • the apparatus needed • a brief description of the method, explaining any safety precautions • the measurements you will take • the variables you will control • how you will process your results to reach a conclusion. You may include a results table in your answer. You are not required to enter any readings in the table. You may include a labelled diagram in your answer. .......................................................................................................................................................... .......................................................................................................................................................... .......................................................................................................................................................... .......................................................................................................................................................... .......................................................................................................................................................... .......................................................................................................................................................... .......................................................................................................................................................... .......................................................................................................................................................... .......................................................................................................................................................... .......................................................................................................................................................... .......................................................................................................................................................... .......................................................................................................................................................... .......................................................................................................................................................... .......................................................................................................................................................... .......................................................................................................................................................... .......................................................................................................................................................... .......................................................................................................................................................... .......................................................................................................................................................... .......................................................................................................................................................... .......................................................................................................................................................... .................................................................................................................................................... [7]
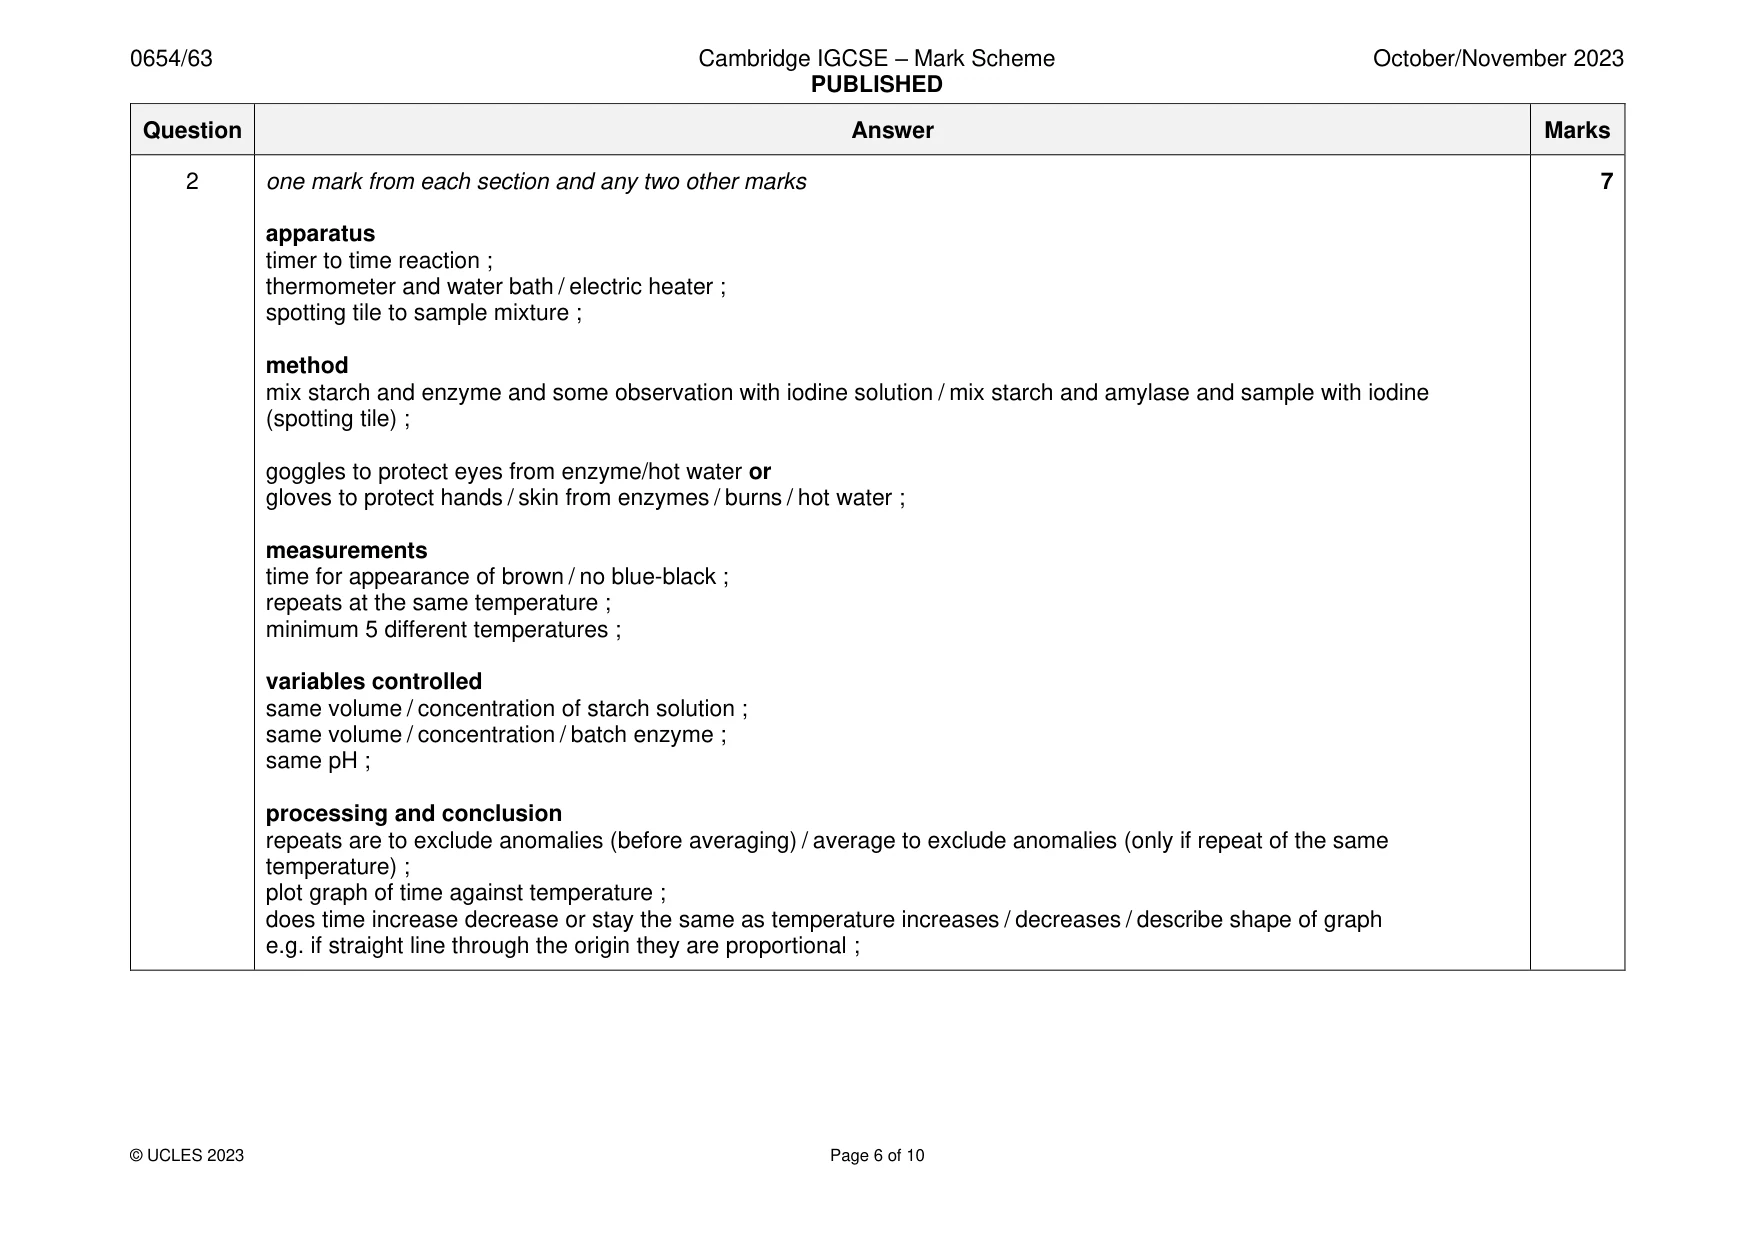
Mark scheme: 2 one mark from each section and any two other marks 7 apparatus timer to time reaction ; thermometer and water bath / electric heater ; spotting tile to sample mixture ; method mix starch and enzyme and some observation with iodine solution / mix starch and amylase and sample with iodine (spotting tile) ; goggles to protect eyes from enzyme/hot water or gloves to protect hands / skin from enzymes / burns / hot water ; measurements time for appearance of brown / no blue-black ; repeats at the same temperature ; minimum 5 different temperatures ; variables controlled same volume / concentration of starch solution ; same volume / concentration / batch enzyme ; same pH ; processing and conclusion repeats are to exclude anomalies (before averaging) / average to exclude anomalies (only if repeat of the same temperature) ; plot graph of time against temperature ; does time increase decrease or stay the same as temperature increases / decreases / describe shape of graph e.g. if straight line through the origin they are proportional ;
Q3 · A student determines the percentage purity of a sample of compound F and identifies the…
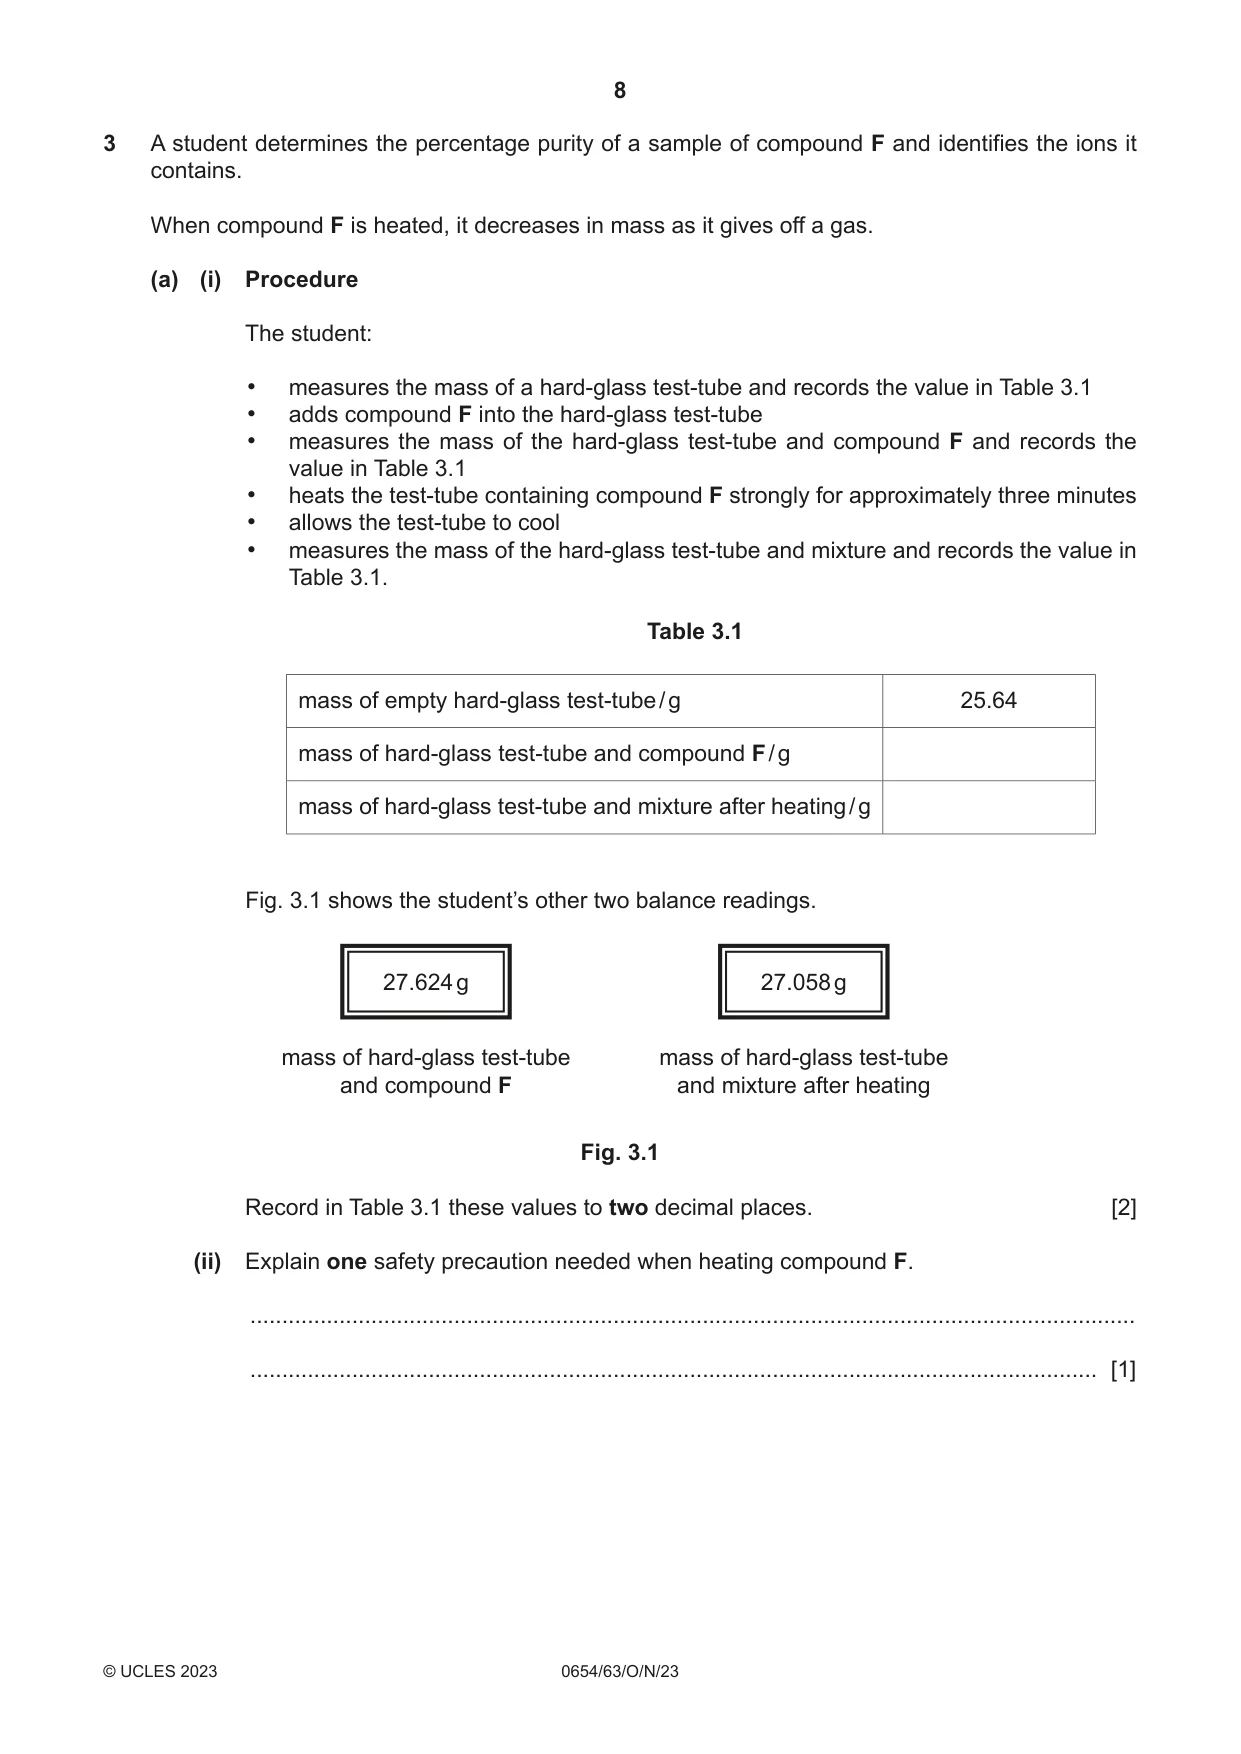
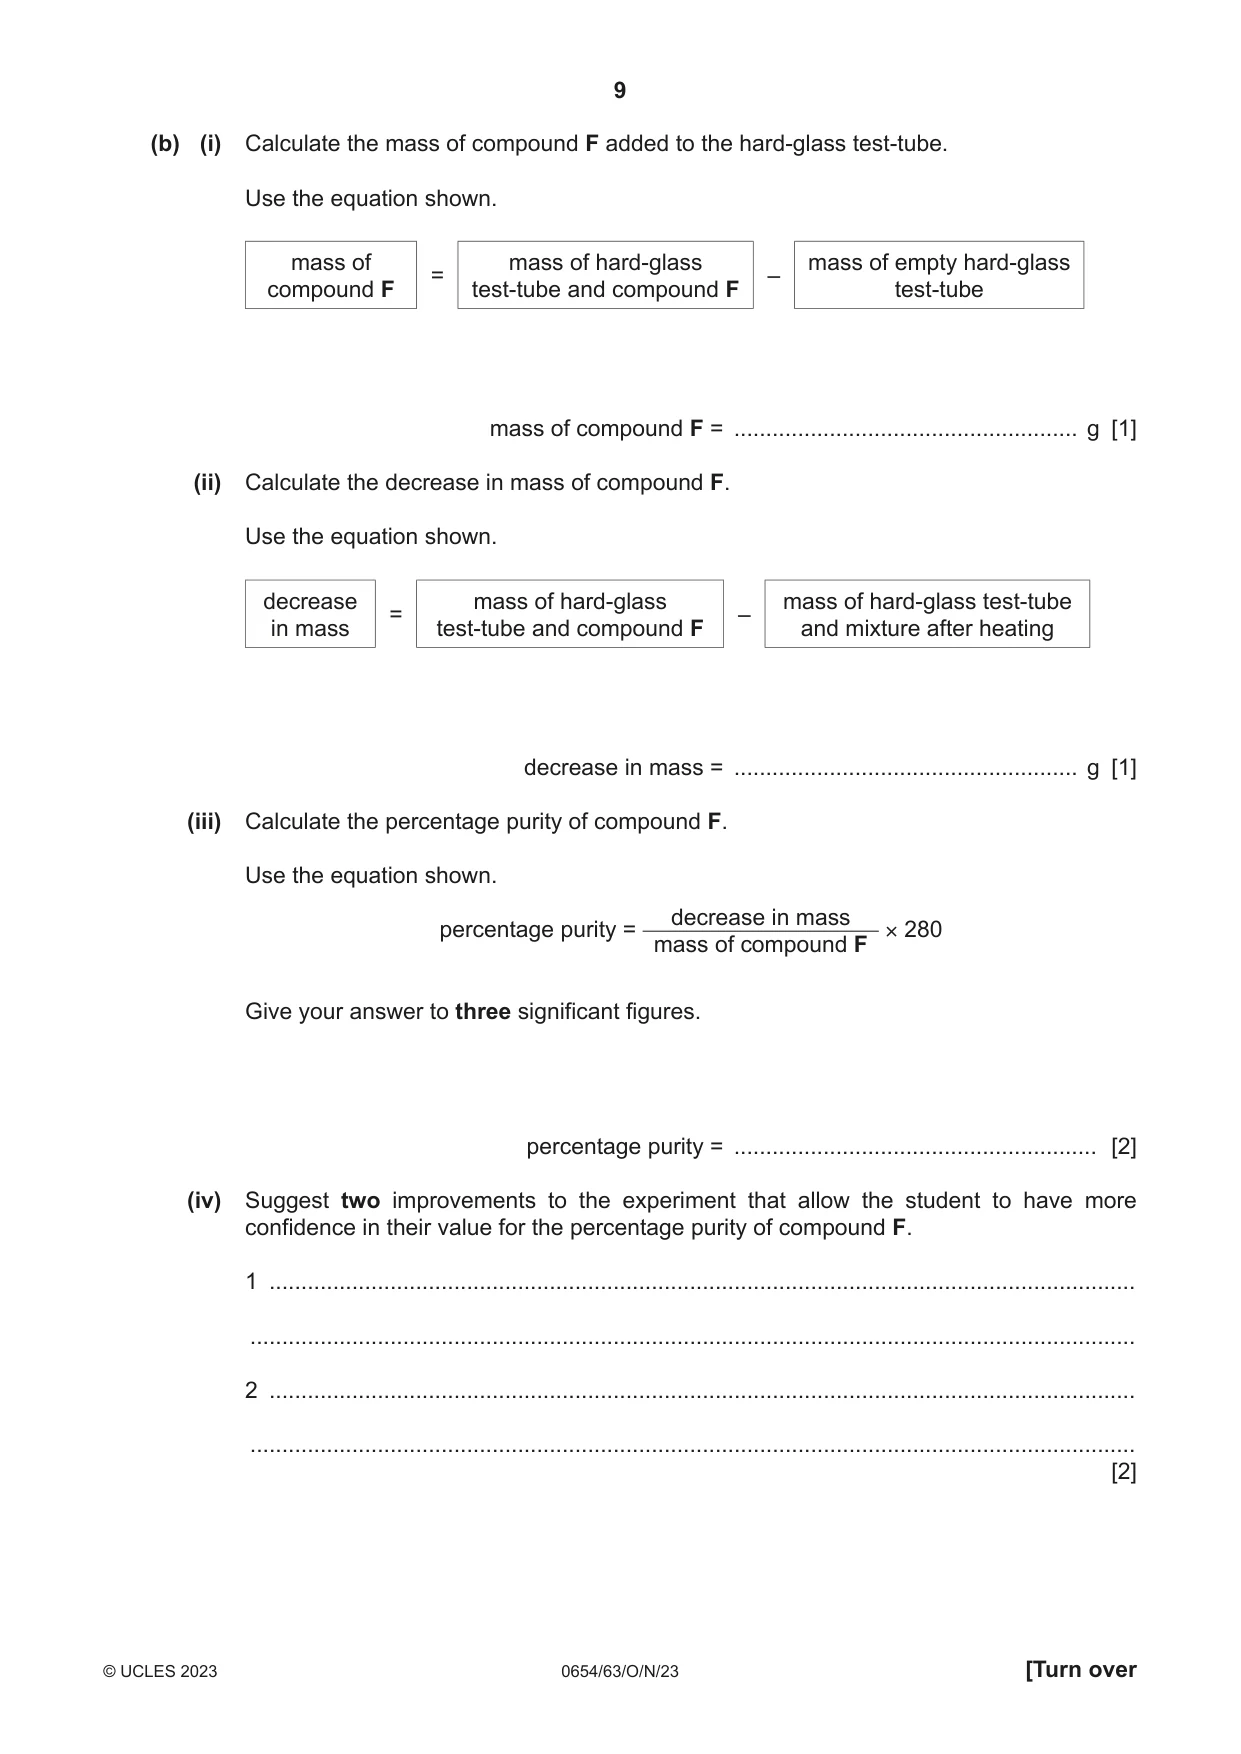
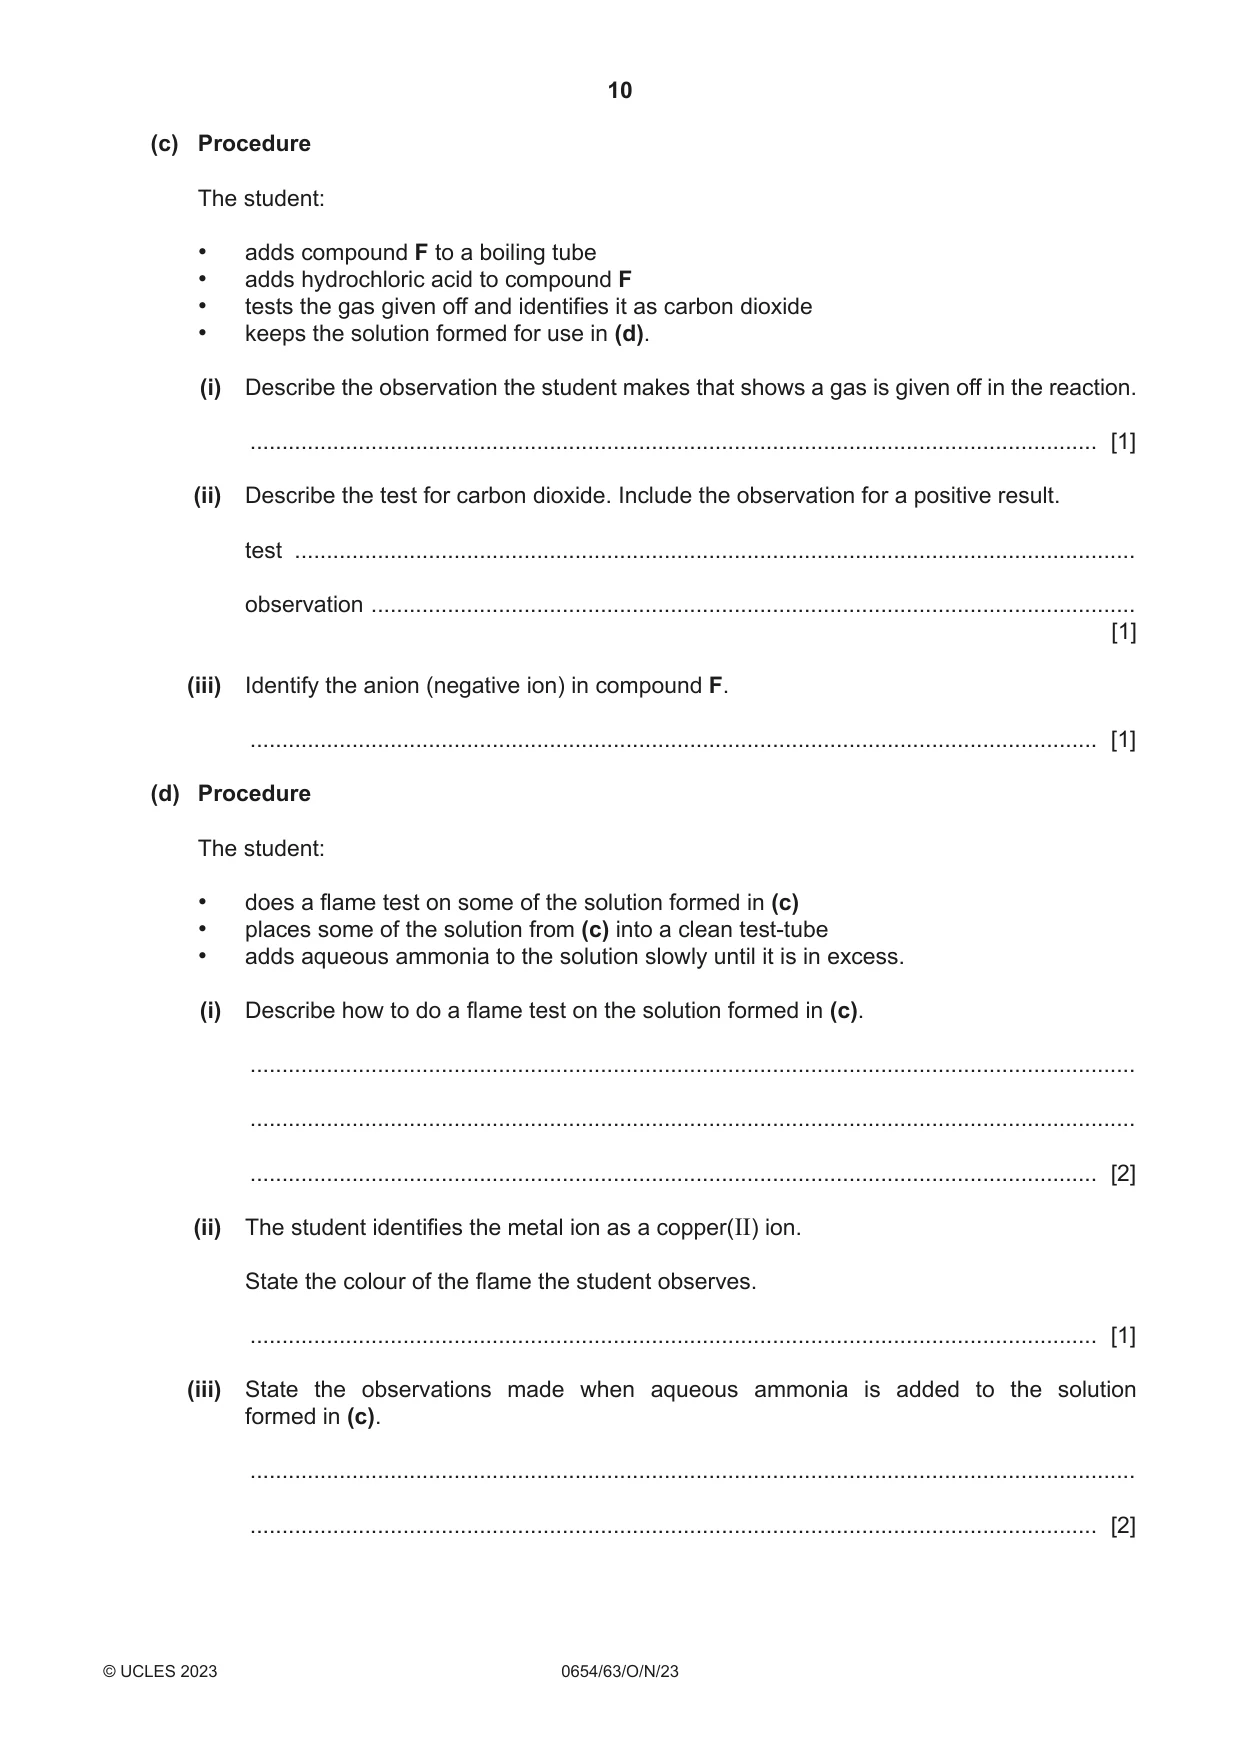
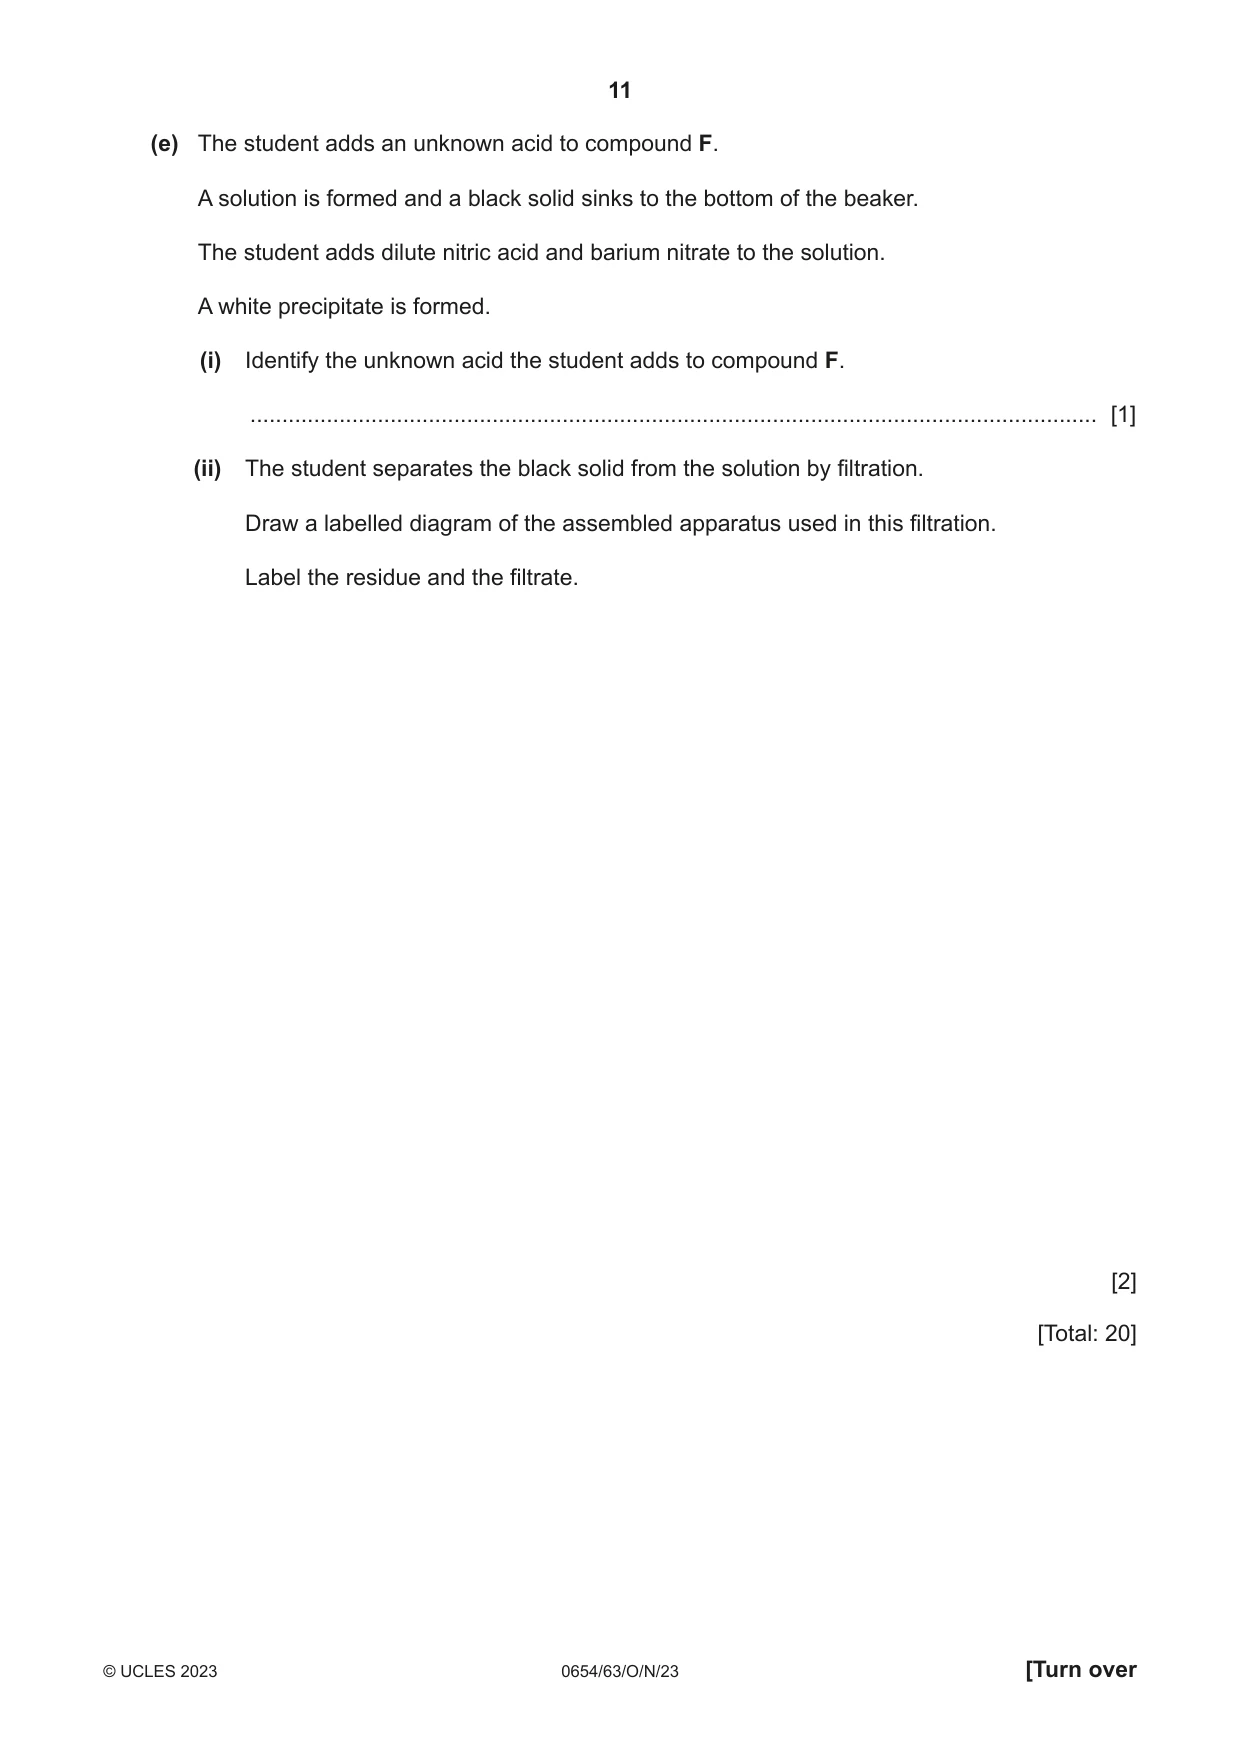
3 A student determines the percentage purity of a sample of compound F and identifies the ions it contains. When compound F is heated, it decreases in mass as it gives off a gas. (a) (i) Procedure The student: • measures the mass of a hard-glass test-tube and records the value in Table 3.1 • adds compound F into the hard-glass test-tube • measures the mass of the hard-glass test-tube and compound F and records the value in Table 3.1 • heats the test-tube containing compound F strongly for approximately three minutes • allows the test-tube to cool • measures the mass of the hard-glass test-tube and mixture and records the value in Table 3.1. Table 3.1 mass of empty hard-glass test-tube / g 25.64 mass of hard-glass test-tube and compound F / g mass of hard-glass test-tube and mixture after heating / g Fig. 3.1 shows the student’s other two balance readings. 27.624 g 27.058 g mass of hard-glass test-tube mass of hard-glass test-tube and compound F and mixture after heating Fig. 3.1 Record in Table 3.1 these values to two decimal places. [2] (ii) Explain one safety precaution needed when heating compound F. ........................................................................................................................................... ..................................................................................................................................... [1] (b) (i) Calculate the mass of compound F added to the hard-glass test-tube. Use the equation shown. mass of mass of hard-glass mass of empty hard-glass = – compound F test-tube and compound F test-tube mass of compound F = ...................................................... g [1] (ii) Calculate the decrease in mass of compound F. Use the equation shown. decrease mass of hard-glass mass of hard-glass test-tube = – in mass test-tube and compound F and mixture after heating decrease in mass = ...................................................... g [1] (iii) Calculate the percentage purity of compound F. Use the equation shown. decrease in mass percentage purity = × 280 mass of compound F Give your answer to three significant figures. percentage purity = ......................................................... [2] (iv) Suggest two improvements to the experiment that allow the student to have more confidence in their value for the percentage purity of compound F. 1 ........................................................................................................................................ ........................................................................................................................................... 2 ........................................................................................................................................ ........................................................................................................................................... [2] (c) Procedure The student: • adds compound F to a boiling tube • adds hydrochloric acid to compound F • tests the gas given off and identifies it as carbon dioxide • keeps the solution formed for use in (d). (i) Describe the observation the student makes that shows a gas is given off in the reaction. ..................................................................................................................................... [1] (ii) Describe the test for carbon dioxide. Include the observation for a positive result. test .................................................................................................................................... observation ........................................................................................................................ [1] (iii) Identify the anion (negative ion) in compound F. ..................................................................................................................................... [1] (d) Procedure The student: • does a flame test on some of the solution formed in (c) • places some of the solution from (c) into a clean test-tube • adds aqueous ammonia to the solution slowly until it is in excess. (i) Describe how to do a flame test on the solution formed in (c). ........................................................................................................................................... ........................................................................................................................................... ..................................................................................................................................... [2] (ii) The student identifies the metal ion as a copper(II) ion. State the colour of the flame the student observes. ..................................................................................................................................... [1] (iii) State the observations made when aqueous ammonia is added to the solution formed in (c). ........................................................................................................................................... ..................................................................................................................................... [2] (e) The student adds an unknown acid to compound F. A solution is formed and a black solid sinks to the bottom of the beaker. The student adds dilute nitric acid and barium nitrate to the solution. A white precipitate is formed. (i) Identify the unknown acid the student adds to compound F. ..................................................................................................................................... [1] (ii) The student separates the black solid from the solution by filtration. Draw a labelled diagram of the assembled apparatus used in this filtration. Label the residue and the filtrate. [2] [Total: 20]
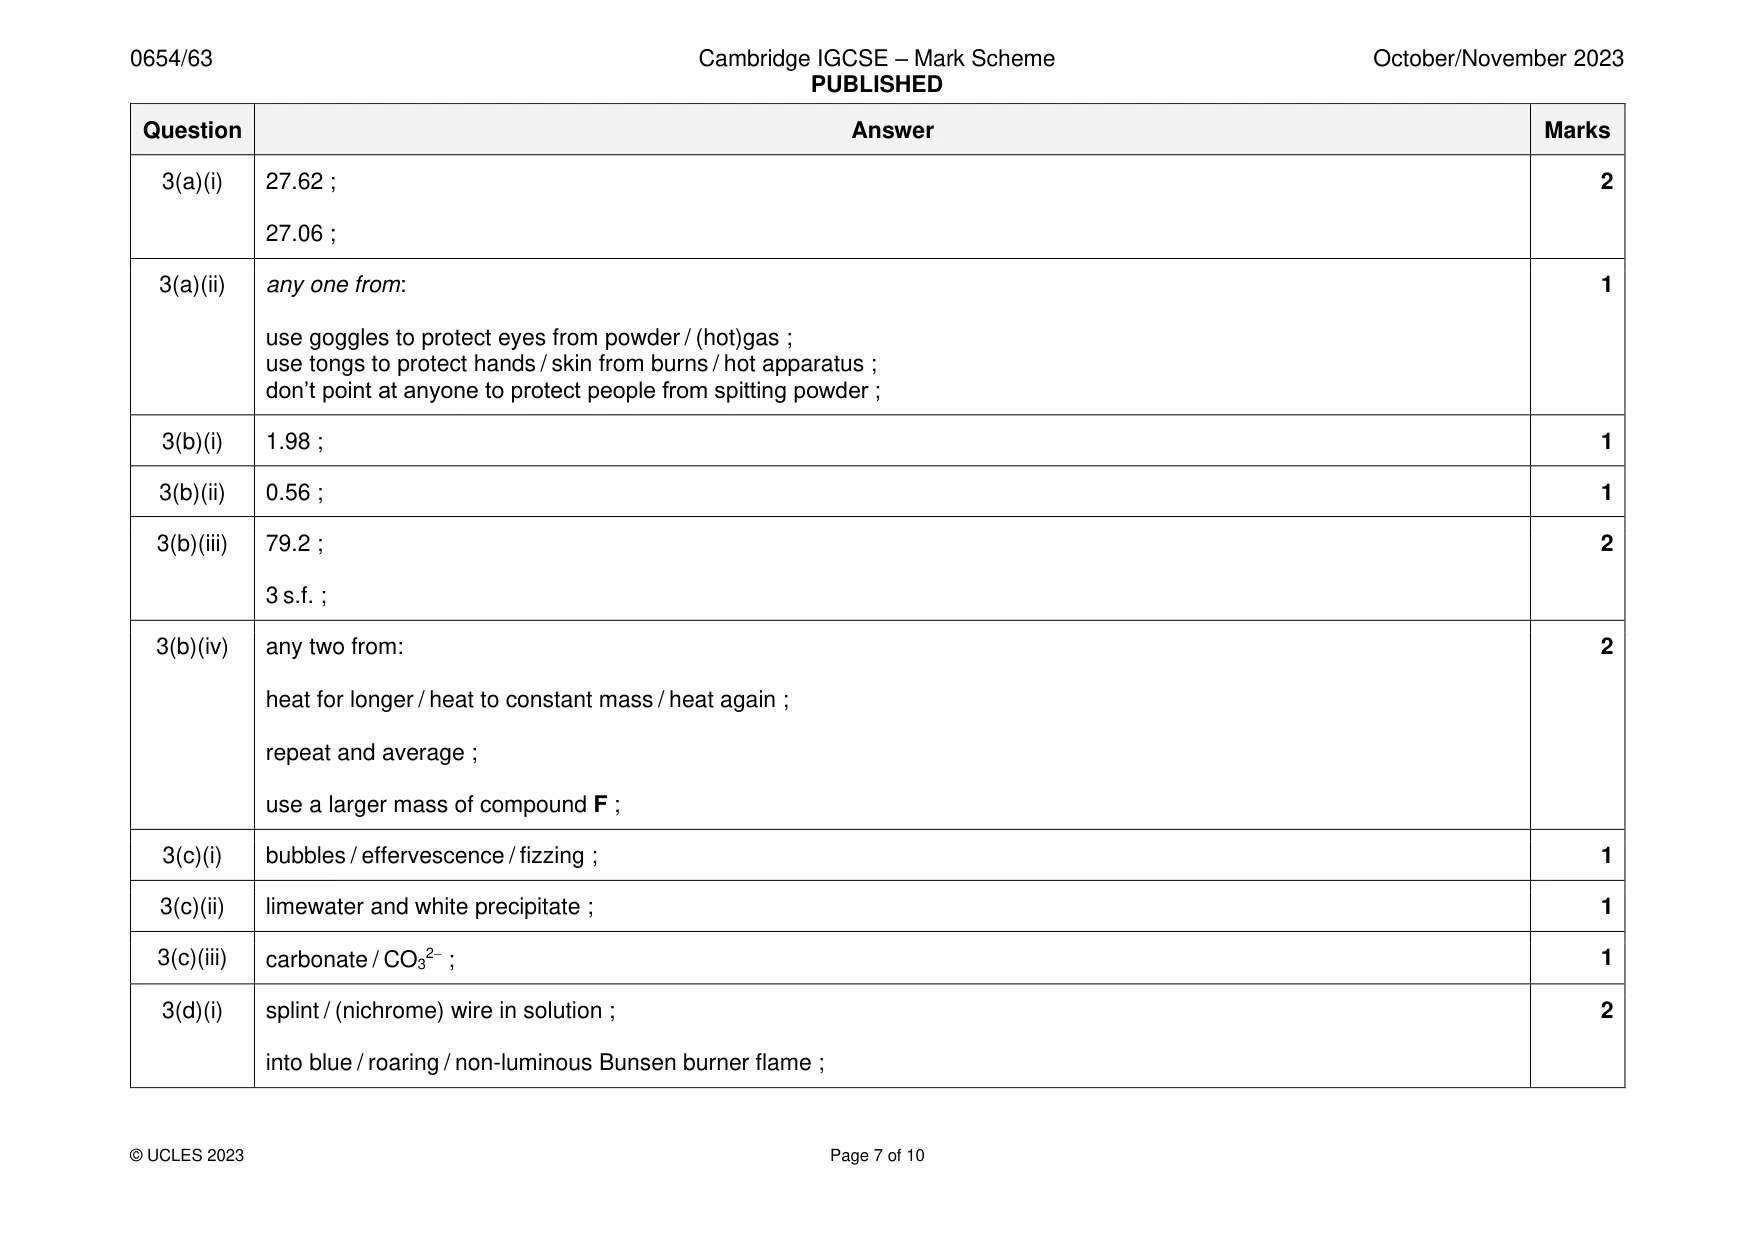
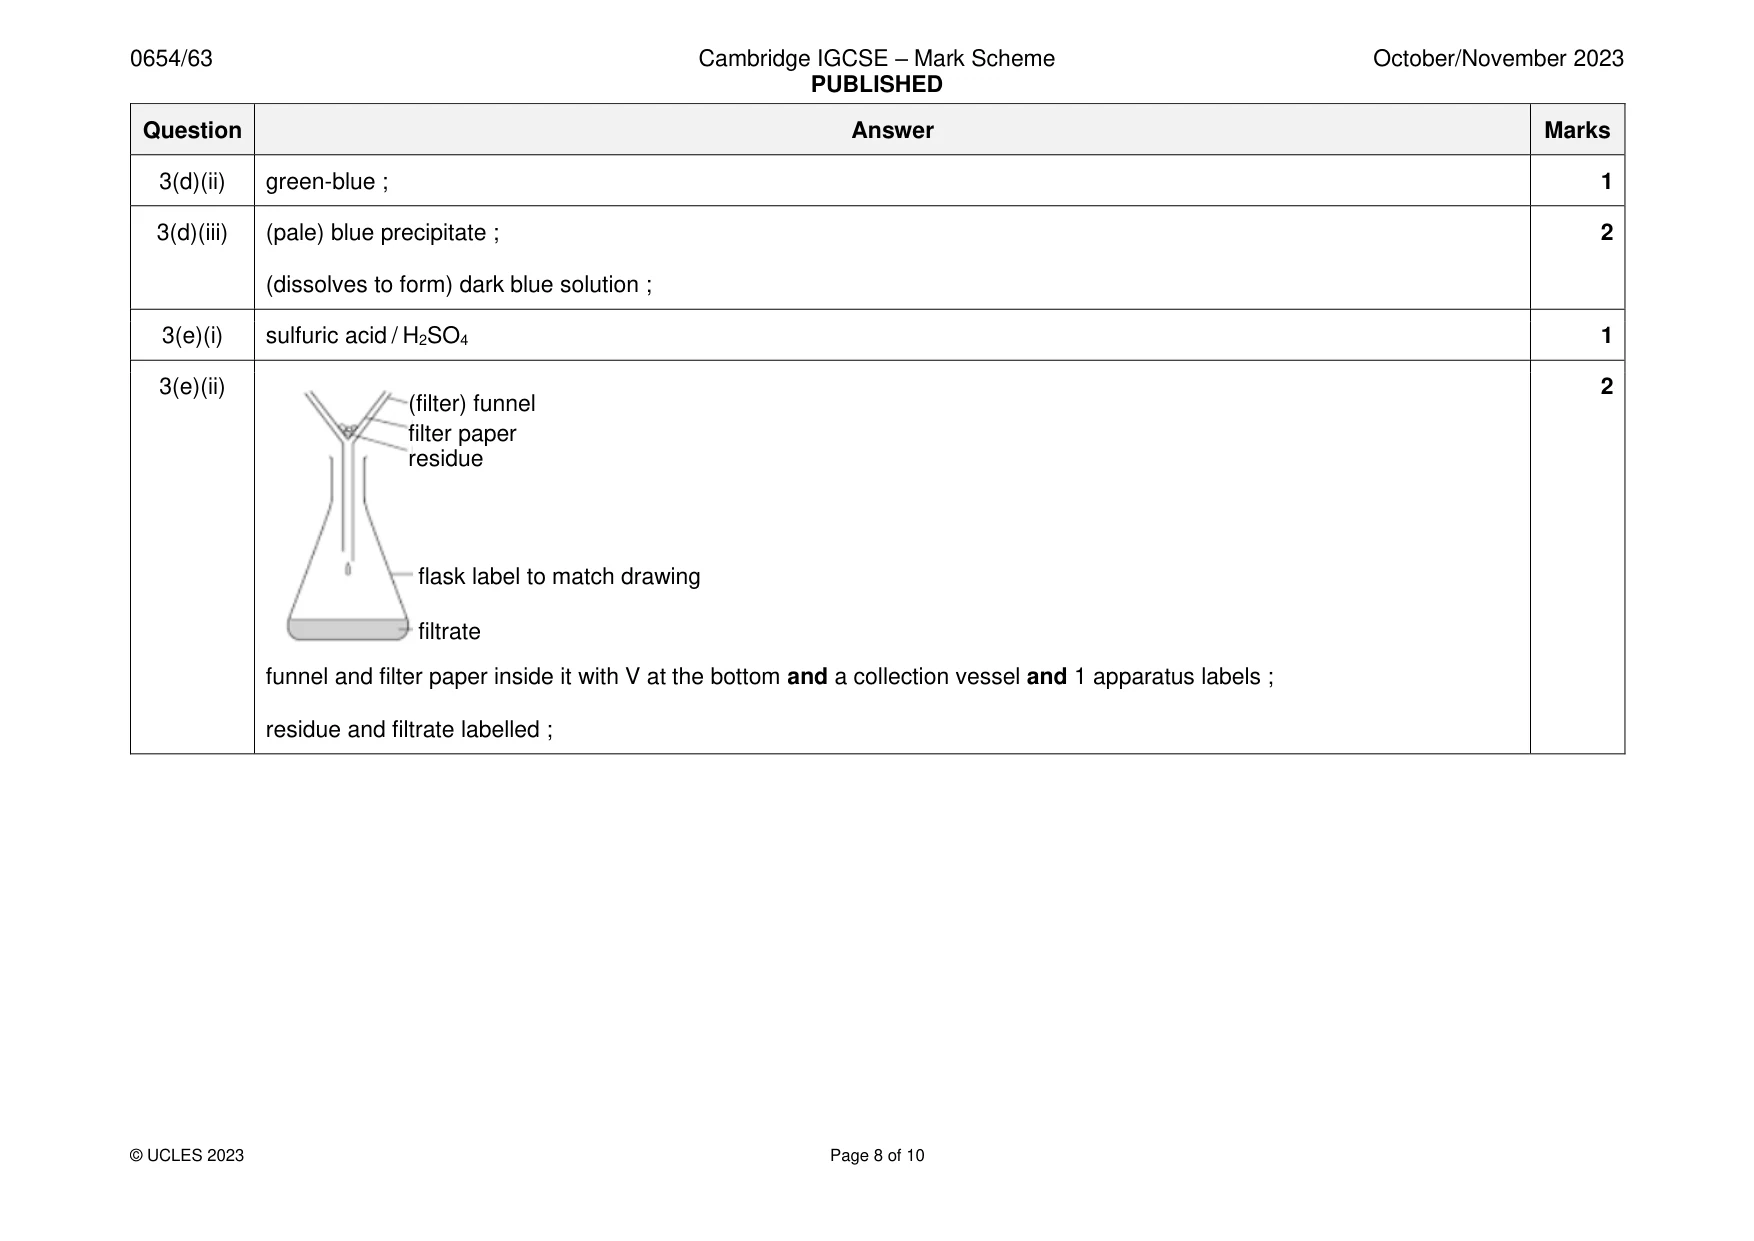
Mark scheme: 3(a)(i) 27.62 ; 2 27.06 ; 3(a)(ii) any one from: 1 use goggles to protect eyes from powder / (hot)gas ; use tongs to protect hands / skin from burns / hot apparatus ; don’t point at anyone to protect people from spitting powder ; 3(b)(i) 1.98 ; 1 3(b)(ii) 0.56 ; 1 3(b)(iii) 79.2 ; 2 3 s.f. ; 3(b)(iv) any two from: 2 heat for longer / heat to constant mass / heat again ; repeat and average ; use a larger mass of compound F ; 3(c)(i) bubbles / effervescence / fizzing ; 1 3(c)(ii) limewater and white precipitate ; 1 3(c)(iii) carbonate / CO32− ; 1 3(d)(i) splint / (nichrome) wire in solution ; 2 into blue / roaring / non-luminous Bunsen burner flame ; 3(d)(ii) green-blue ; 1 3(d)(iii) (pale) blue precipitate ; 2 (dissolves to form) dark blue solution ; 3(e)(i) sulfuric acid / H2SO4 1 3(e)(ii) 2 (filter) funnel filter paper residue flask label to match drawing filtrate funnel and filter paper inside it with V at the bottom and a collection vessel and 1 apparatus labels ; residue and filtrate labelled ;
Q4 · A student investigates the oscillations of a simple pendulum
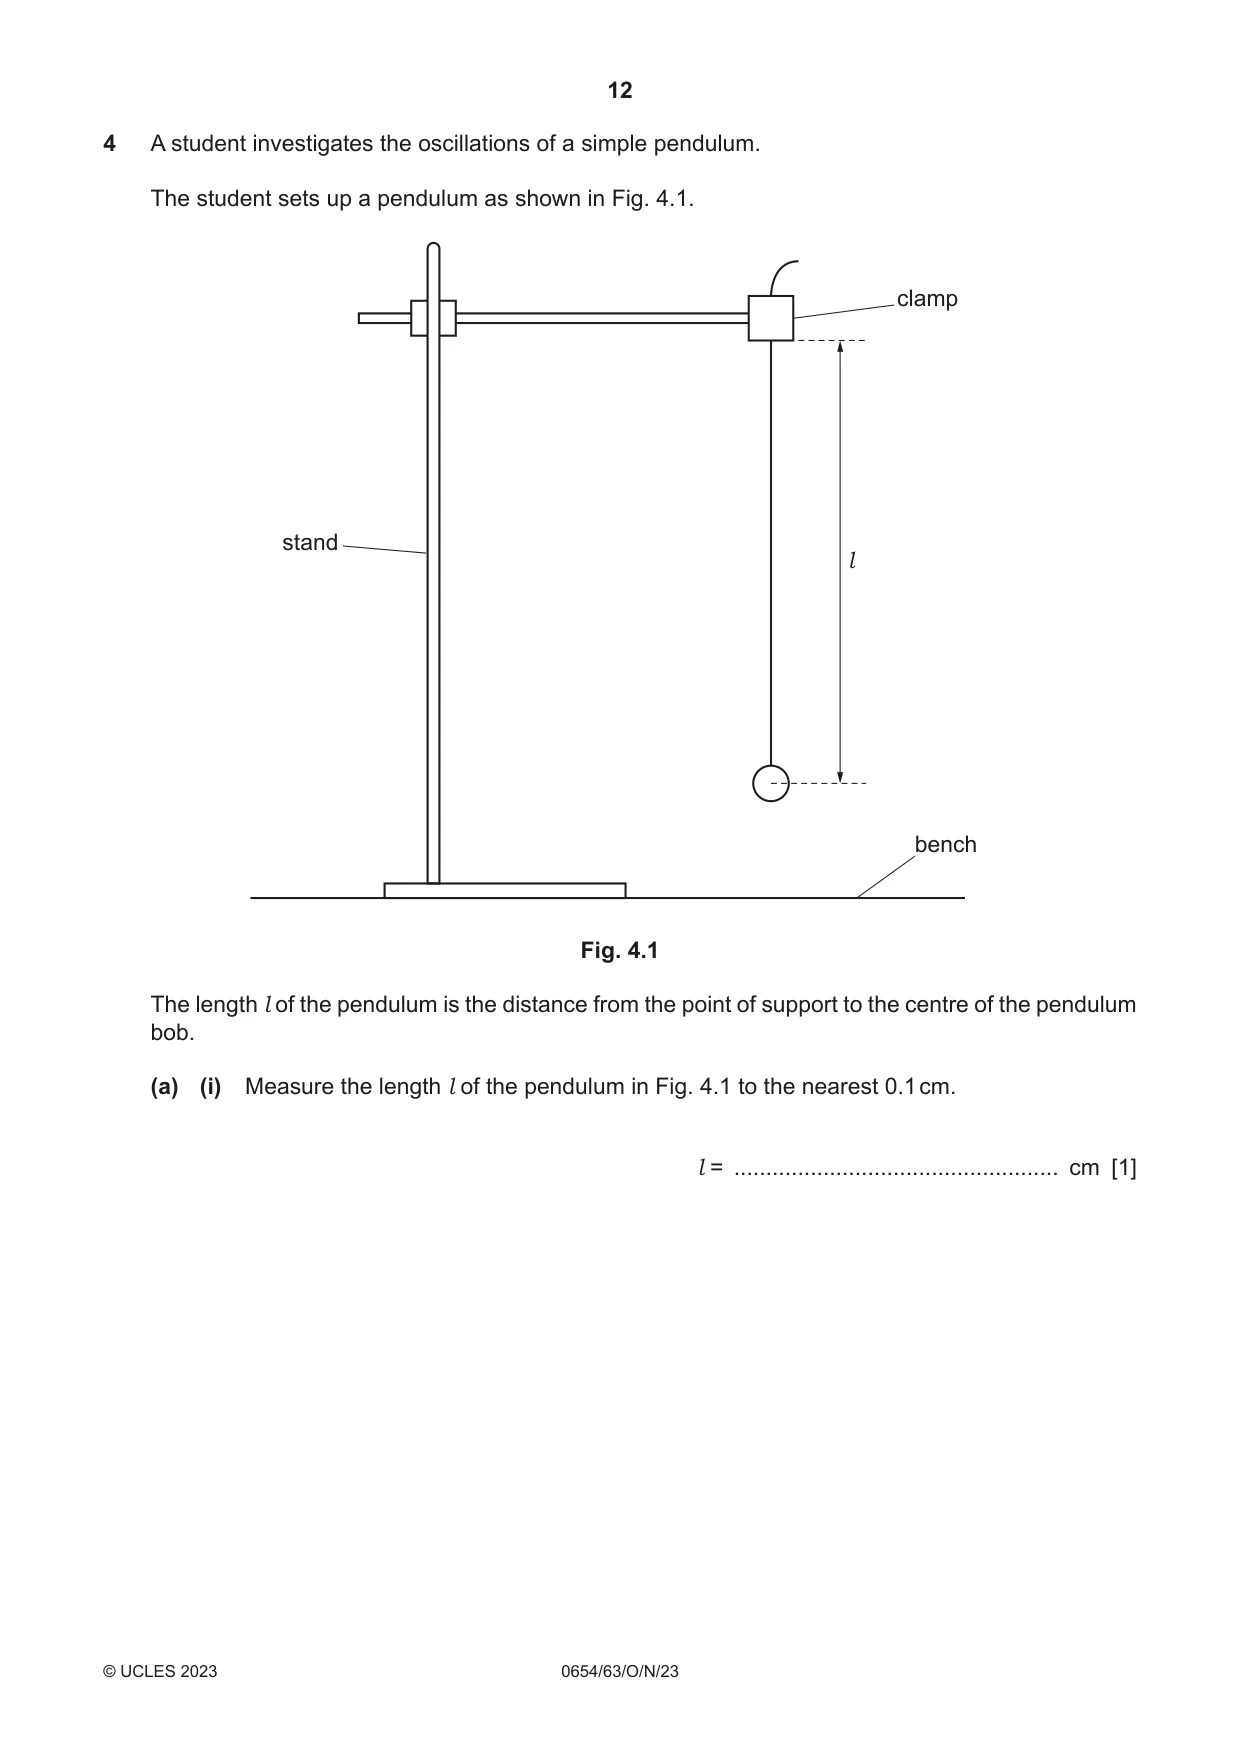
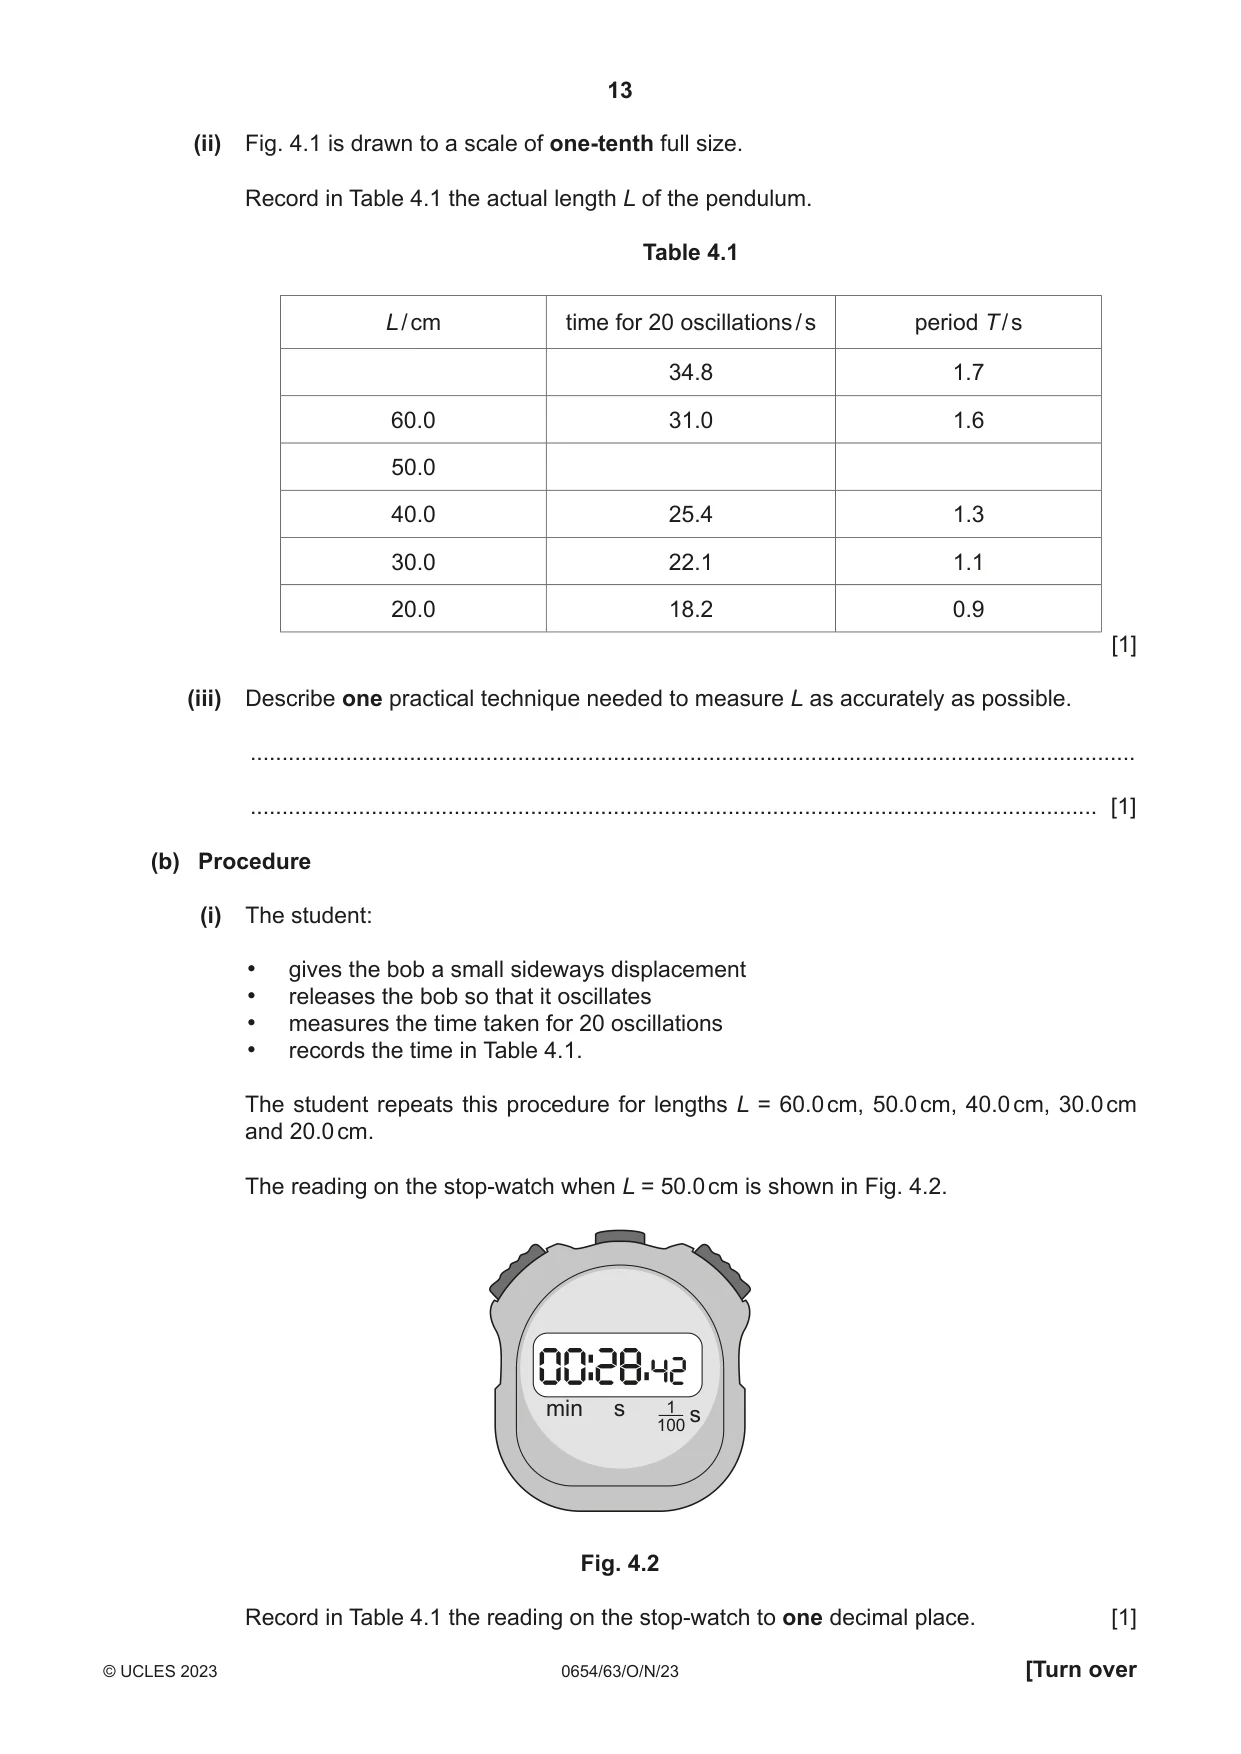
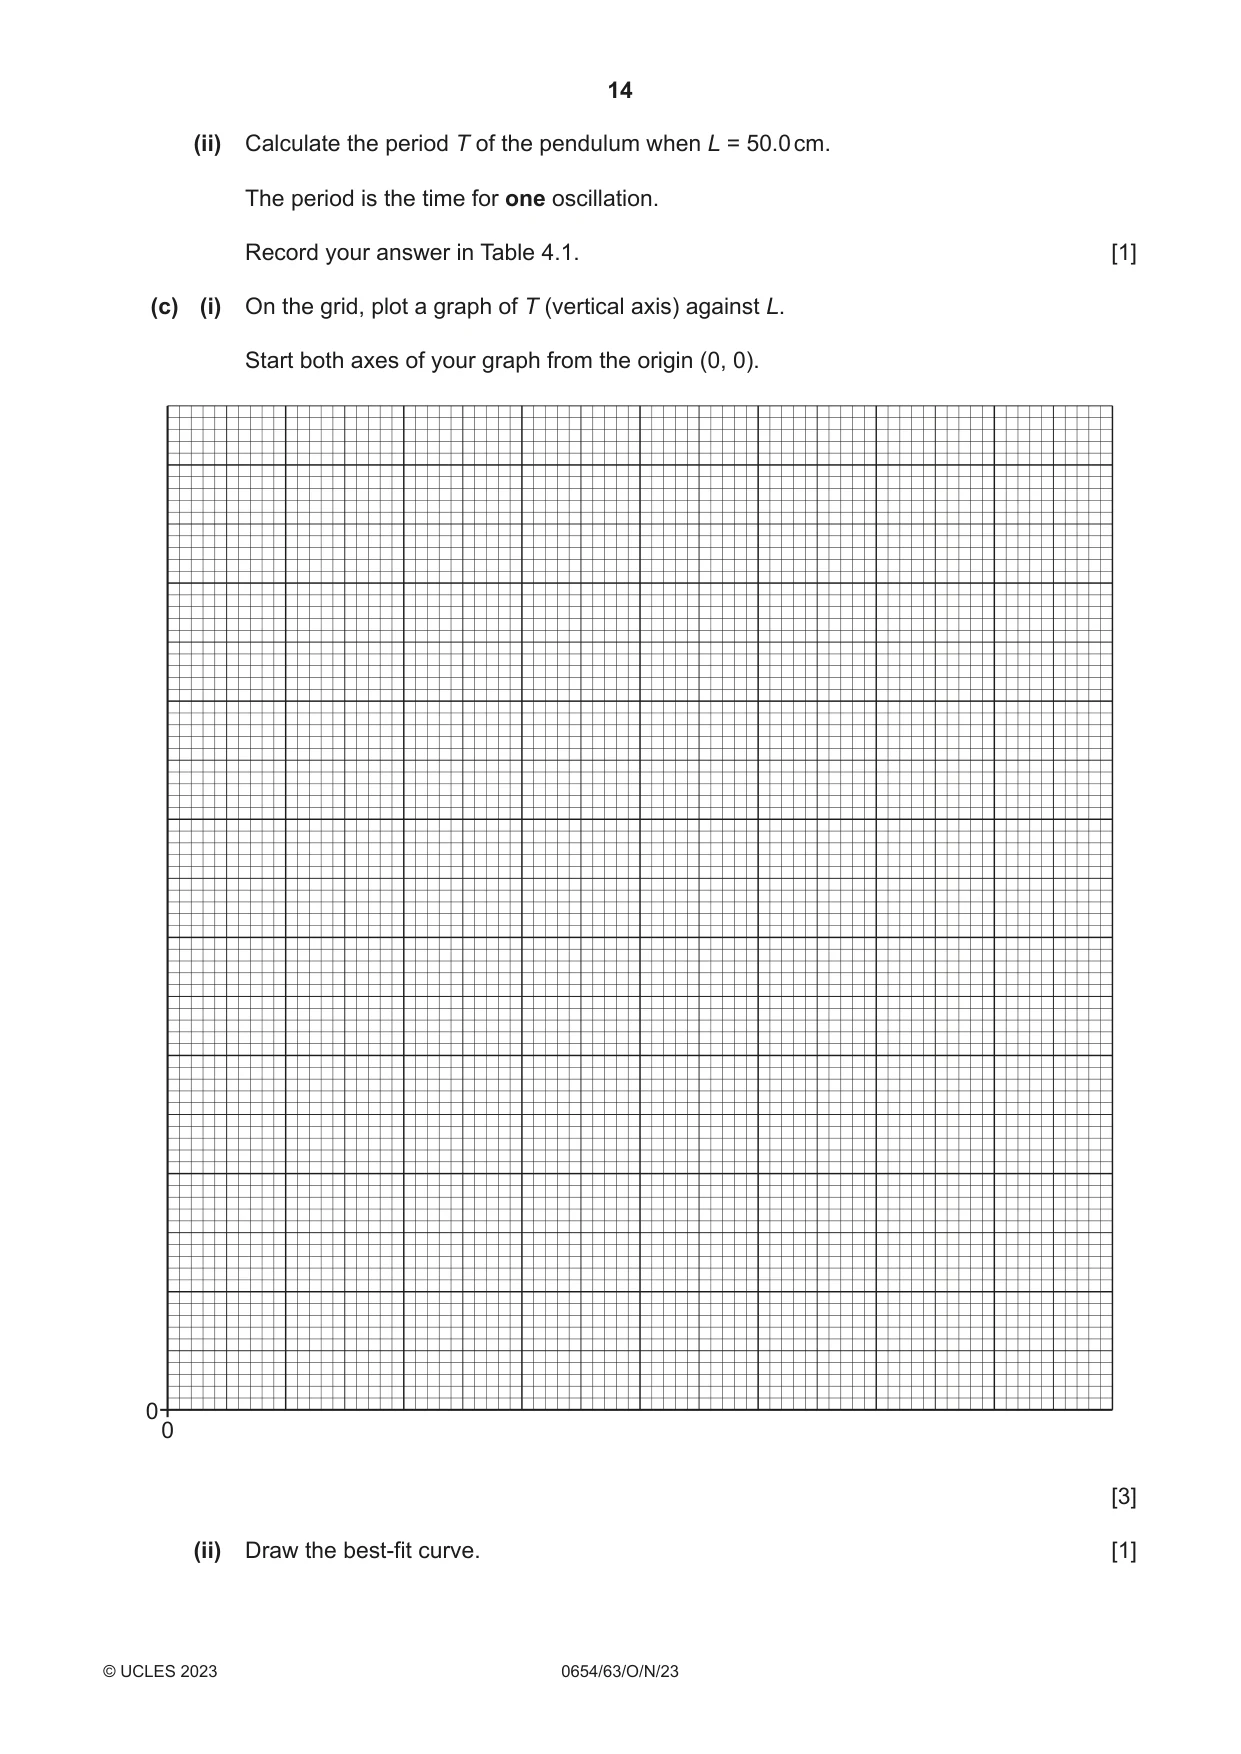
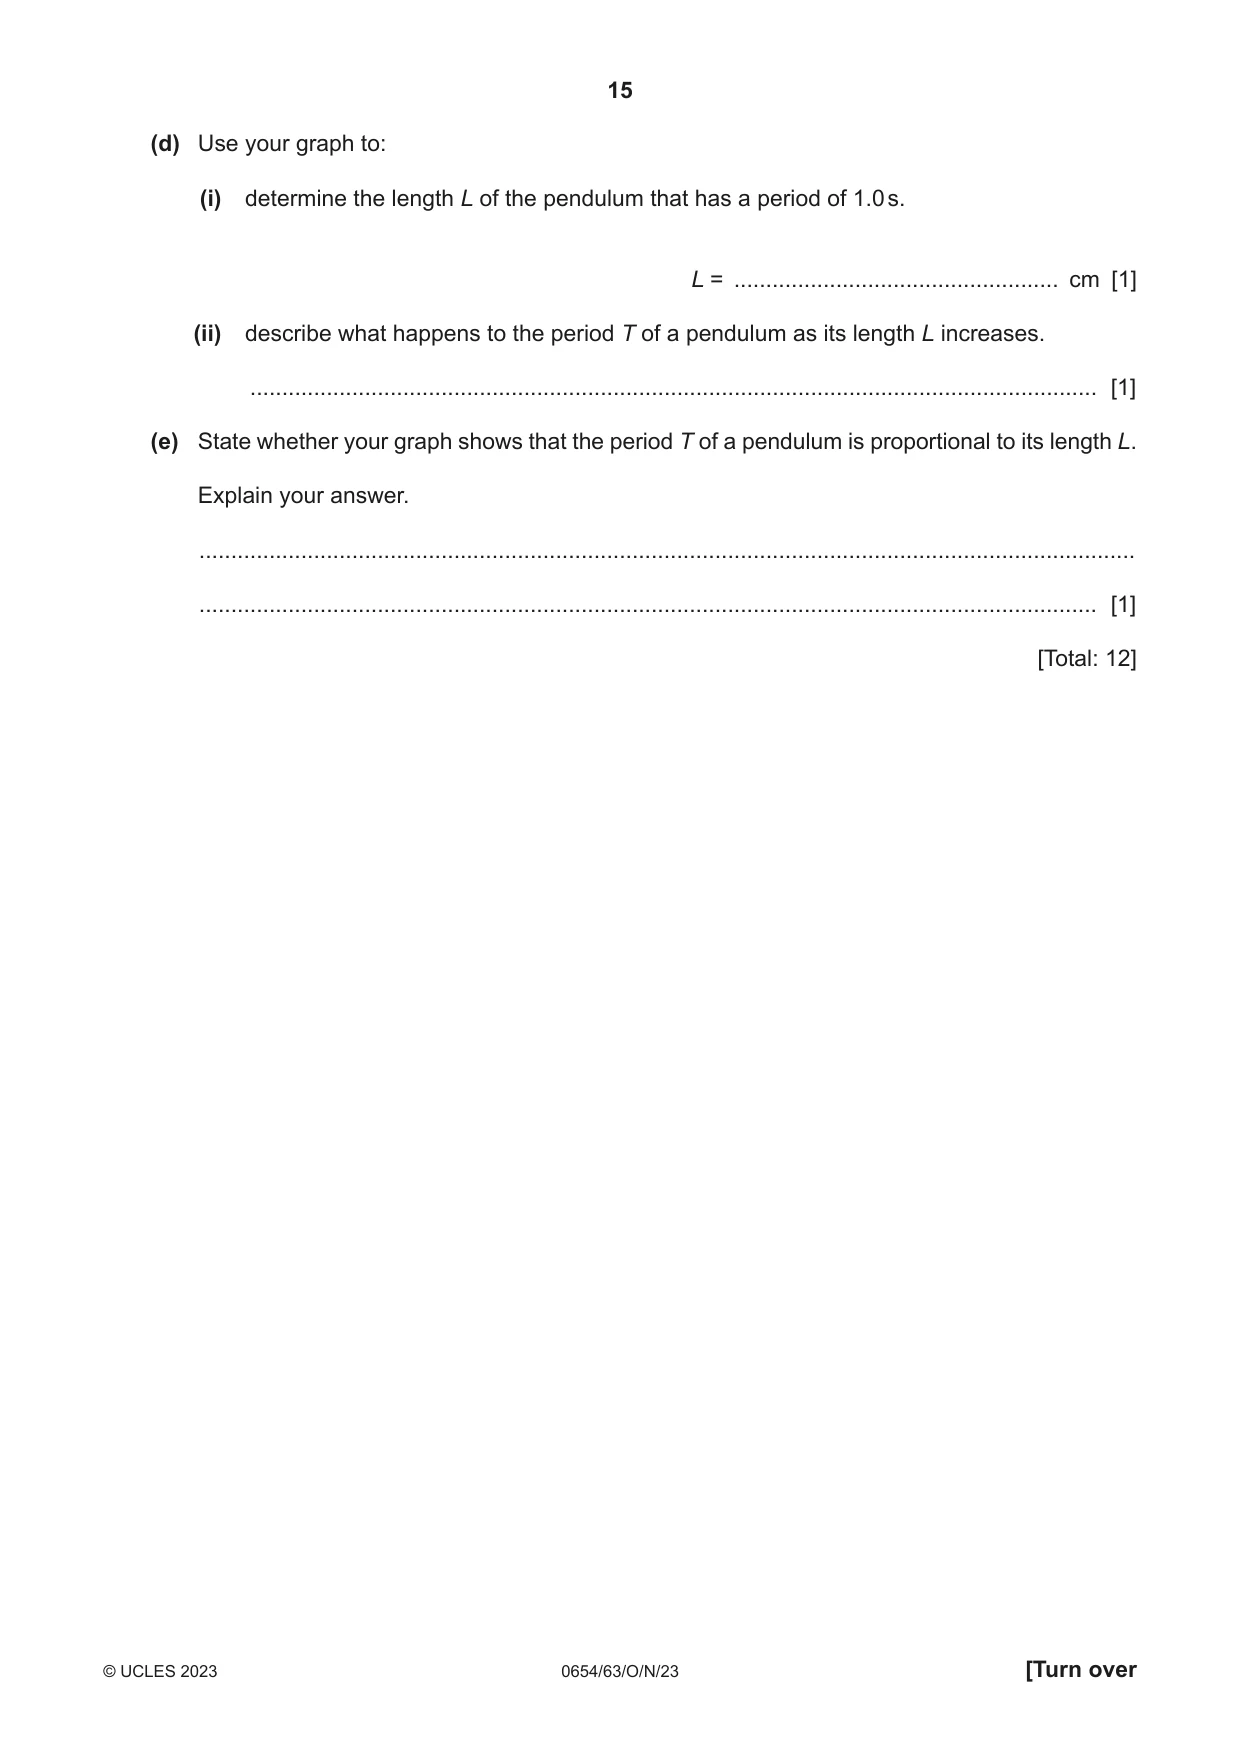
4 A student investigates the oscillations of a simple pendulum. The student sets up a pendulum as shown in Fig. 4.1. clamp stand l bench Fig. 4.1 The length l of the pendulum is the distance from the point of support to the centre of the pendulum bob. (a) (i) Measure the length l of the pendulum in Fig. 4.1 to the nearest 0.1 cm. l = ................................................... cm [1] (ii) Fig. 4.1 is drawn to a scale of one-tenth full size. Record in Table 4.1 the actual length L of the pendulum. Table 4.1 L / cm time for 20 oscillations / s period T / s 34.8 1.7 60.0 31.0 1.6 50.0 40.0 25.4 1.3 30.0 22.1 1.1 20.0 18.2 0.9 [1] (iii) Describe one practical technique needed to measure L as accurately as possible. ........................................................................................................................................... ..................................................................................................................................... [1] (b) Procedure (i) The student: • gives the bob a small sideways displacement • releases the bob so that it oscillates • measures the time taken for 20 oscillations • records the time in Table 4.1. The student repeats this procedure for lengths L = 60.0 cm, 50.0 cm, 40.0 cm, 30.0 cm and 20.0 cm. The reading on the stop-watch when L = 50.0 cm is shown in Fig. 4.2. min s 1 s 100 Fig. 4.2 Record in Table 4.1 the reading on the stop-watch to one decimal place. [1] (ii) Calculate the period T of the pendulum when L = 50.0 cm. The period is the time for one oscillation. Record your answer in Table 4.1. [1] (c) (i) On the grid, plot a graph of T (vertical axis) against L. Start both axes of your graph from the origin (0, 0). 0 0 [3] (ii) Draw the best-fit curve. [1] (d) Use your graph to: (i) determine the length L of the pendulum that has a period of 1.0 s. L = ................................................... cm [1] (ii) describe what happens to the period T of a pendulum as its length L increases. ..................................................................................................................................... [1] (e) State whether your graph shows that the period T of a pendulum is proportional to its length L. Explain your answer. ................................................................................................................................................... ............................................................................................................................................. [1] [Total: 12]
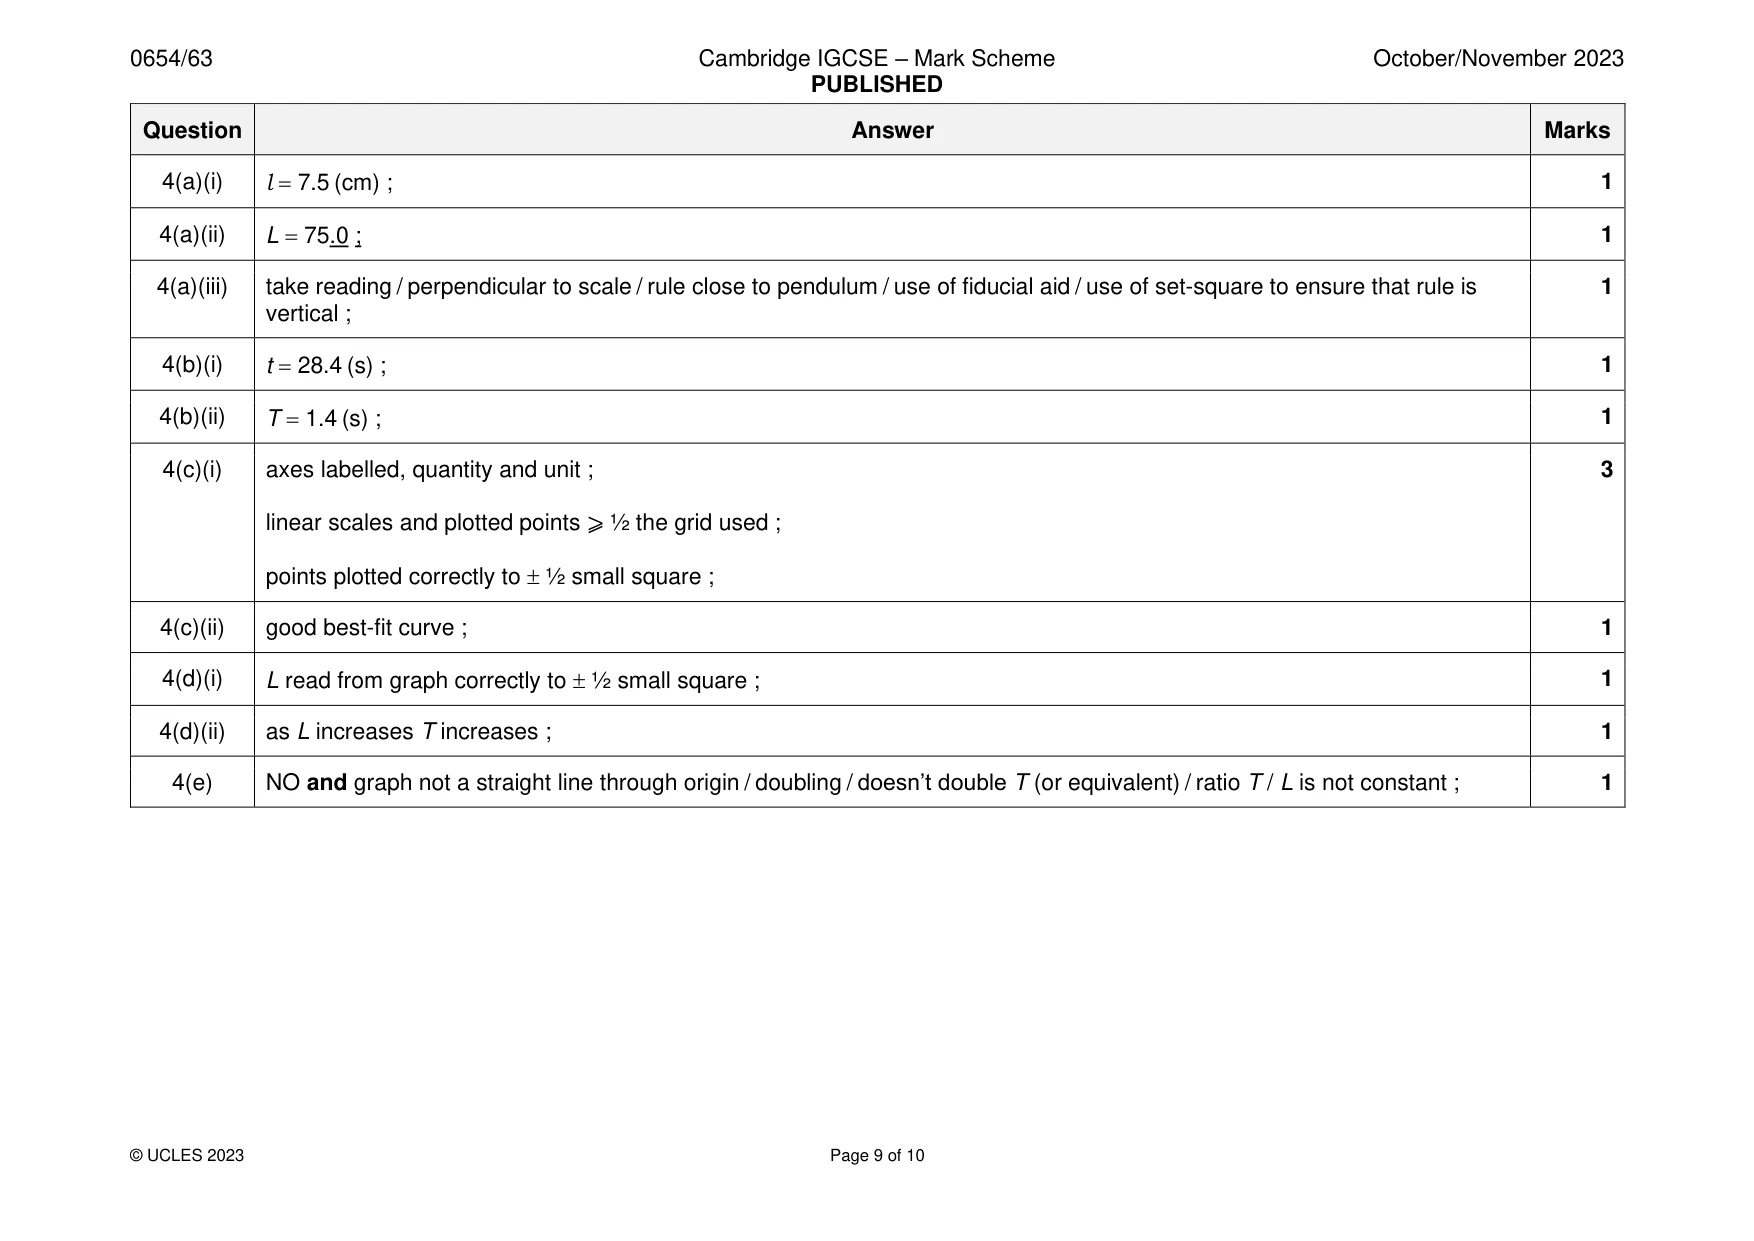
Mark scheme: 4(a)(i) l = 7.5 (cm) ; 1 4(a)(ii) L = 75.0 ; 1 4(a)(iii) take reading / perpendicular to scale / rule close to pendulum / use of fiducial aid / use of set-square to ensure that rule is 1 vertical ; 4(b)(i) t = 28.4 (s) ; 1 4(b)(ii) T = 1.4 (s) ; 1 4(c)(i) axes labelled, quantity and unit ; 3 linear scales and plotted points ⩾ ½ the grid used ; points plotted correctly to ½ small square ; 4(c)(ii) good best-fit curve ; 1 4(d)(i) L read from graph correctly to ½ small square ; 1 4(d)(ii) as L increases T increases ; 1 4(e) NO and graph not a straight line through origin / doubling / doesn’t double T (or equivalent) / ratio T / L is not constant ; 1
More questions on Physical quantities and measurement techniques
Q5 · A student investigates the cooling of hot water in two beakers, P and Q
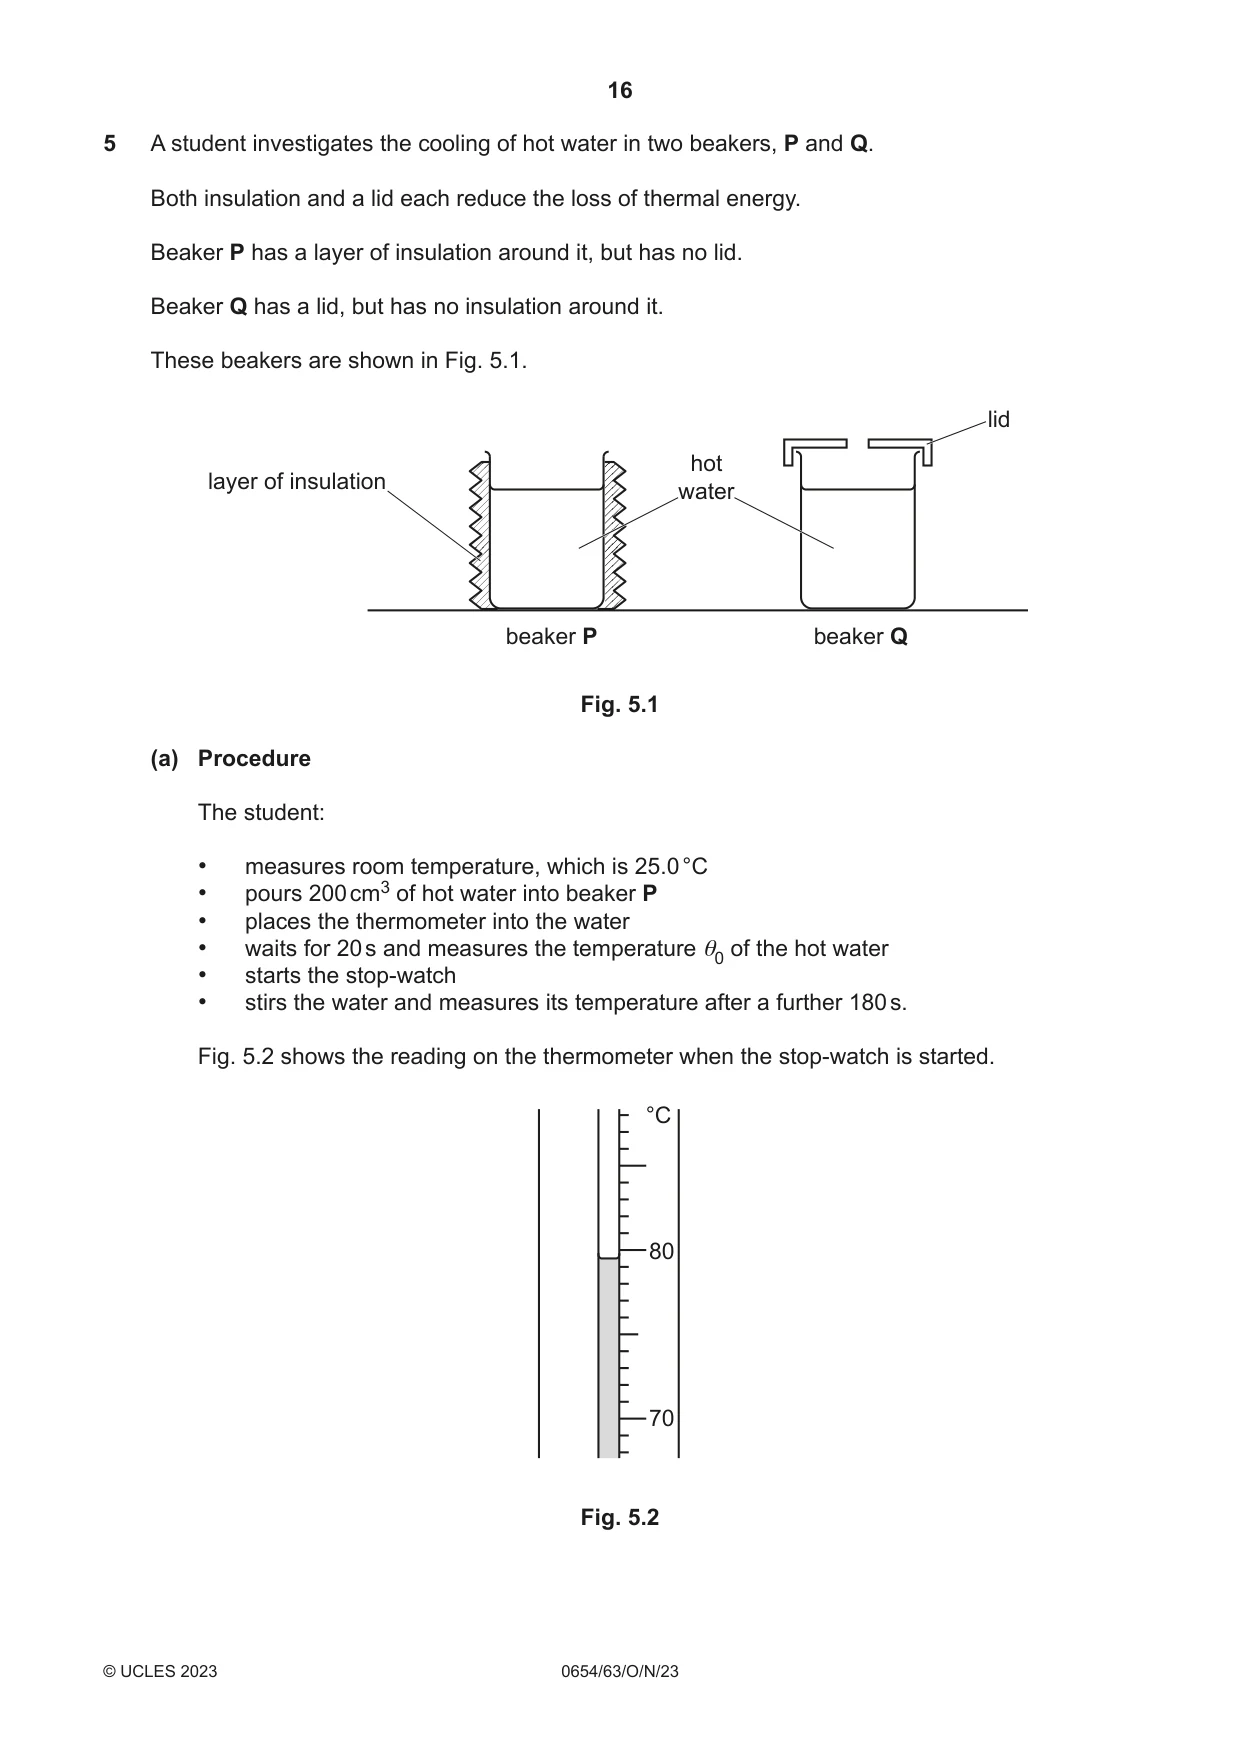
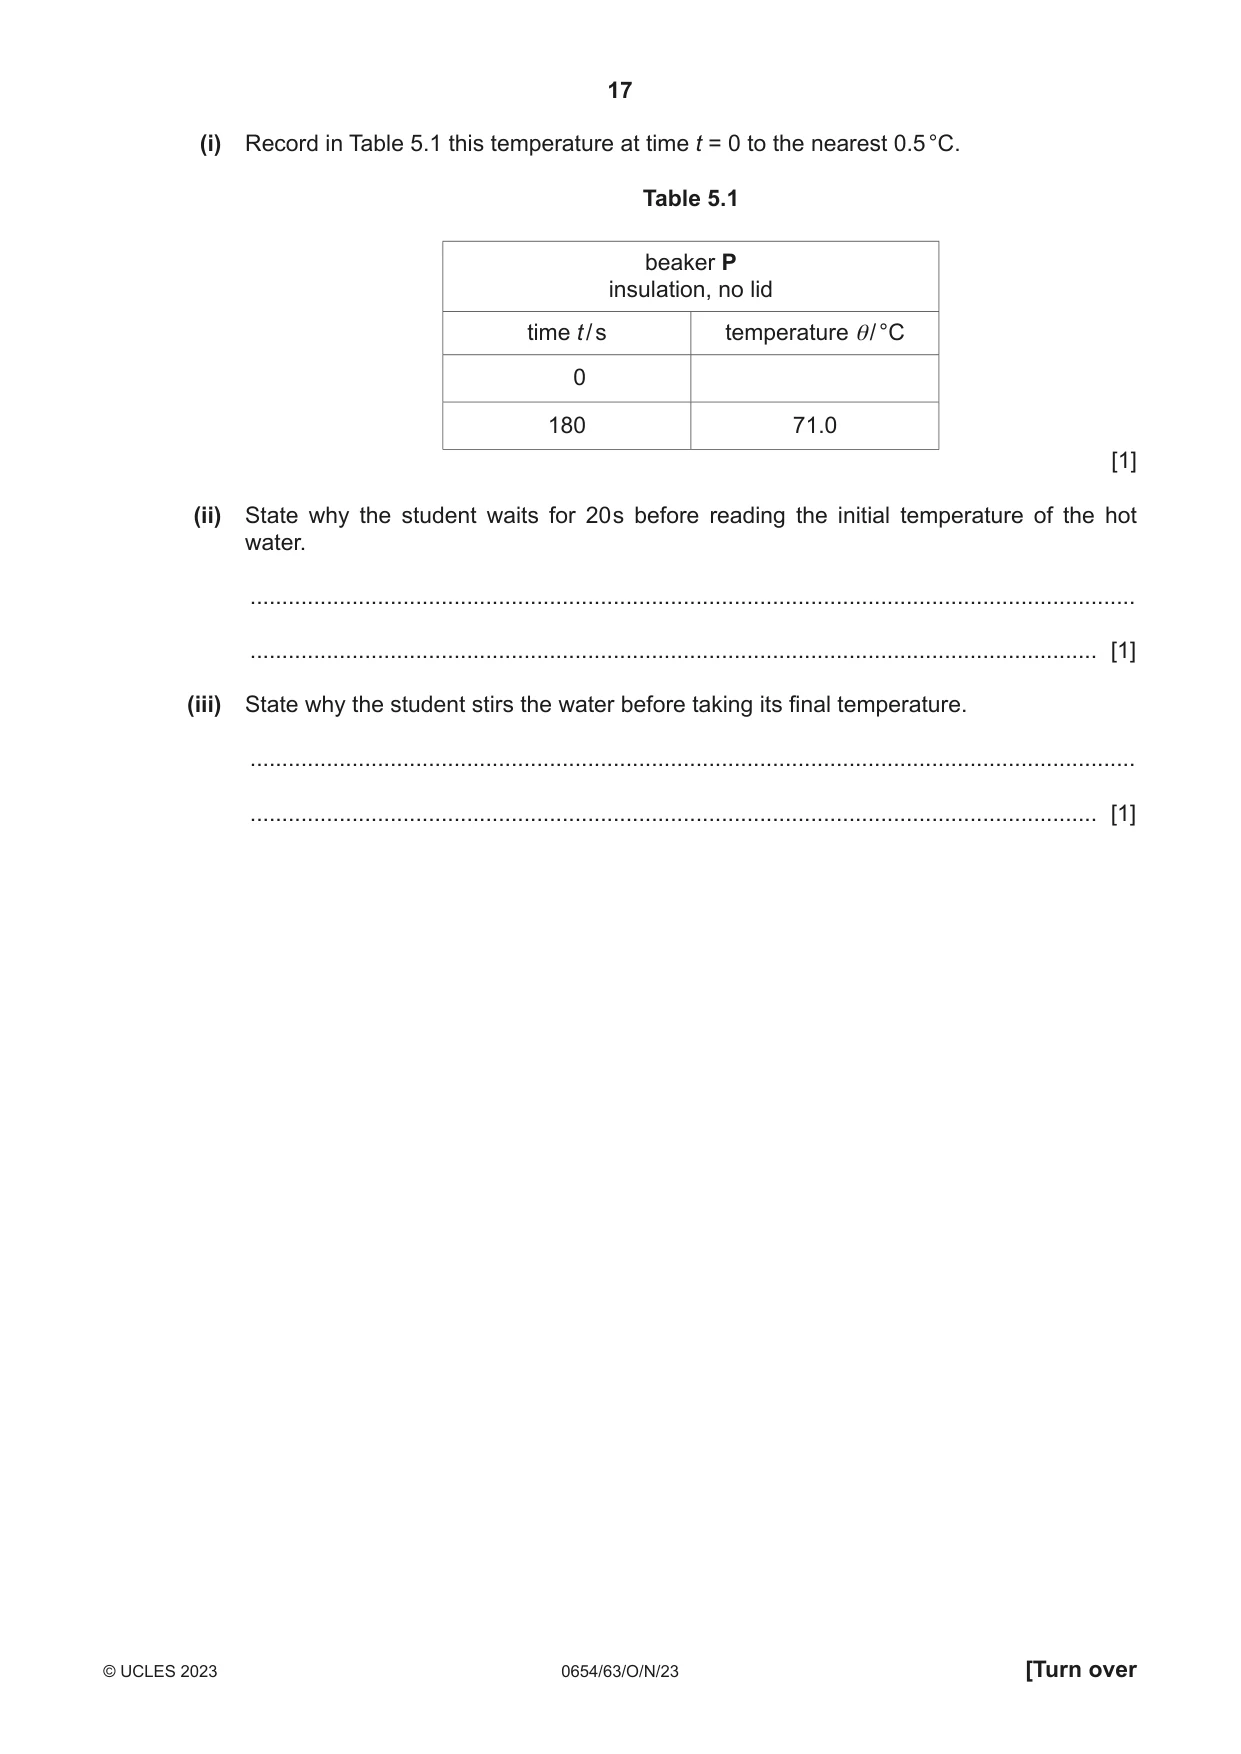
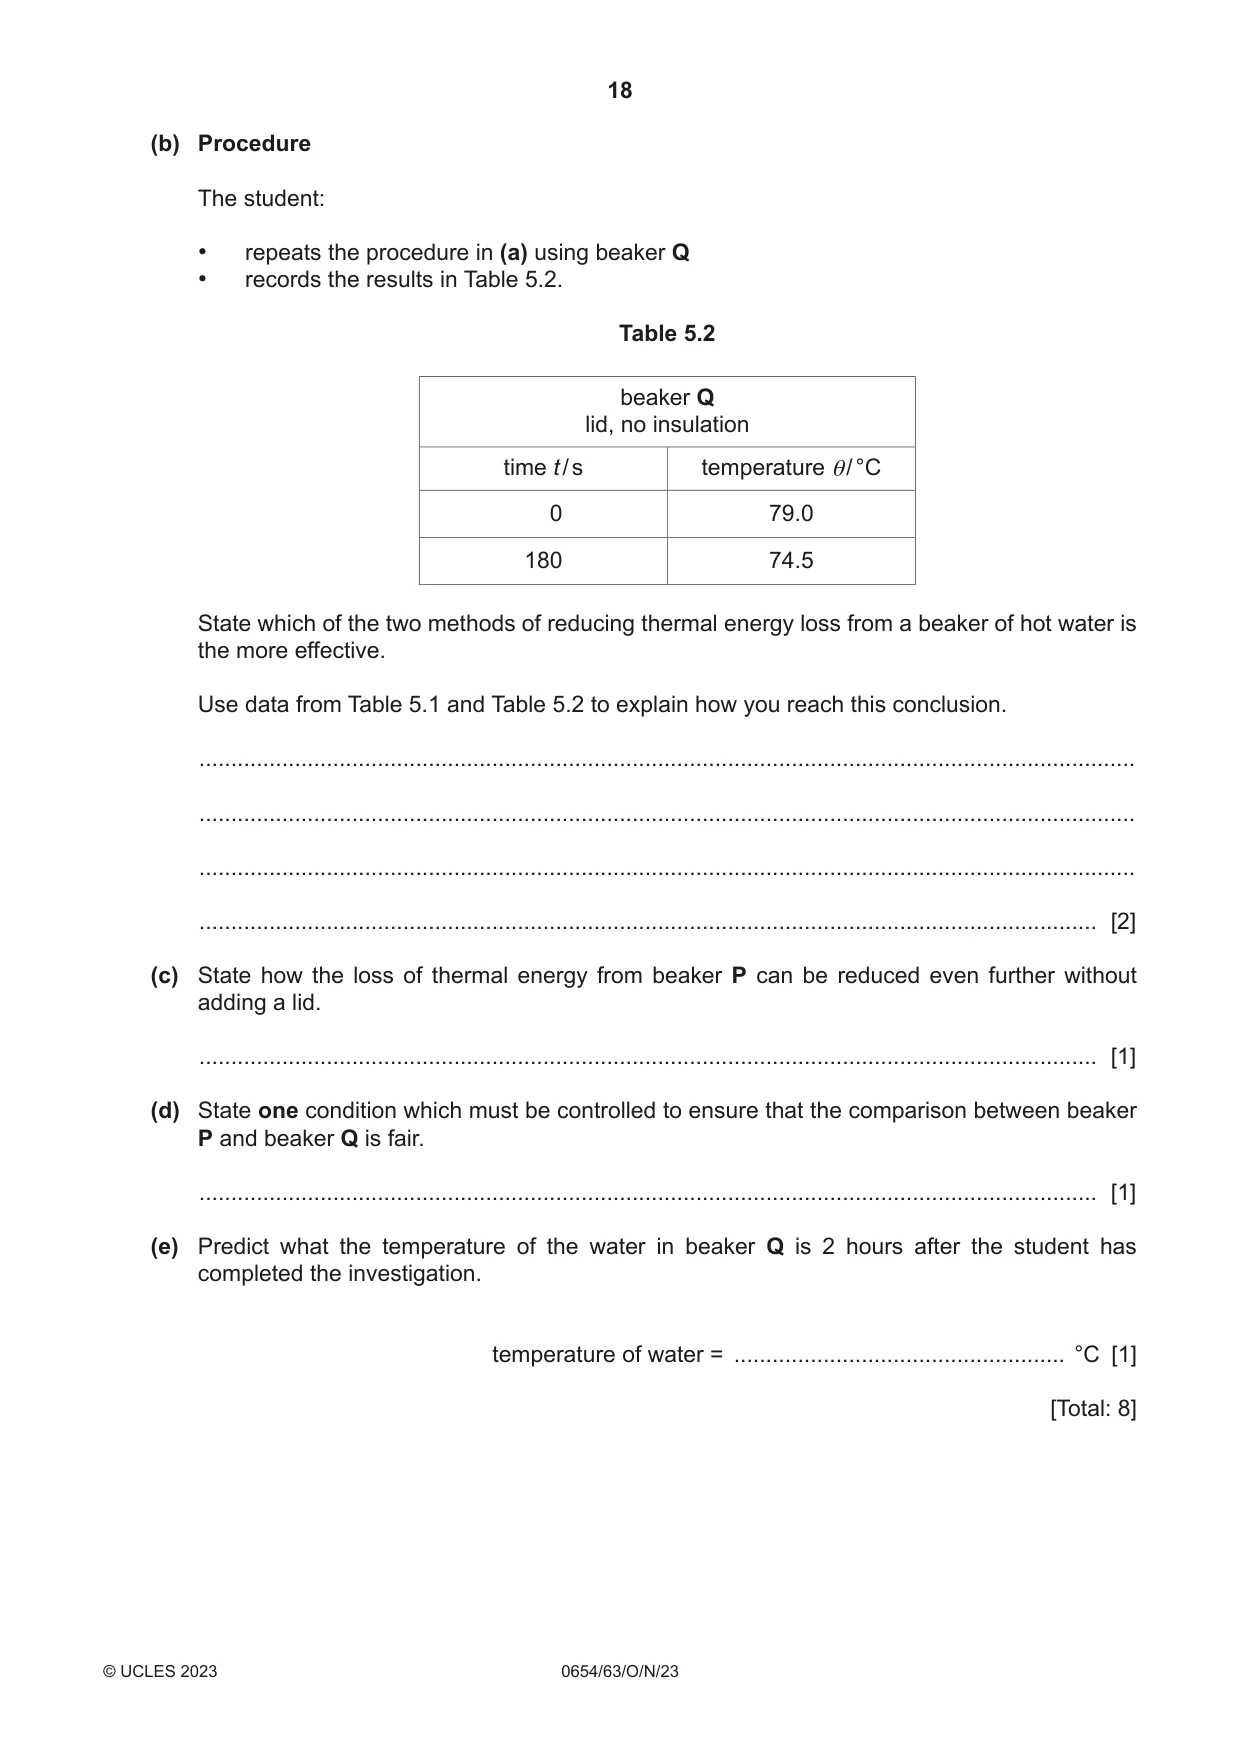
5 A student investigates the cooling of hot water in two beakers, P and Q. Both insulation and a lid each reduce the loss of thermal energy. Beaker P has a layer of insulation around it, but has no lid. Beaker Q has a lid, but has no insulation around it. These beakers are shown in Fig. 5.1. lid hot layer of insulation water beaker P beaker Q Fig. 5.1 (a) Procedure The student: • measures room temperature, which is 25.0 °C • pours 200 cm3 of hot water into beaker P • places the thermometer into the water • waits for 20 s and measures the temperature θ0 of the hot water • starts the stop-watch • stirs the water and measures its temperature after a further 180 s. Fig. 5.2 shows the reading on the thermometer when the stop-watch is started. °C 80 70 Fig. 5.2 (i) Record in Table 5.1 this temperature at time t = 0 to the nearest 0.5 °C. Table 5.1 beaker P insulation, no lid time t / s temperature θ/ °C 0 180 71.0 [1] (ii) State why the student waits for 20 s before reading the initial temperature of the hot water. ........................................................................................................................................... ..................................................................................................................................... [1] (iii) State why the student stirs the water before taking its final temperature. ........................................................................................................................................... ..................................................................................................................................... [1] (b) Procedure The student: • repeats the procedure in (a) using beaker Q • records the results in Table 5.2. Table 5.2 beaker Q lid, no insulation time t / s temperature θ/ °C 0 79.0 180 74.5 State which of the two methods of reducing thermal energy loss from a beaker of hot water is the more effective. Use data from Table 5.1 and Table 5.2 to explain how you reach this conclusion. ................................................................................................................................................... ................................................................................................................................................... ................................................................................................................................................... ............................................................................................................................................. [2] (c) State how the loss of thermal energy from beaker P can be reduced even further without adding a lid. ............................................................................................................................................. [1] (d) State one condition which must be controlled to ensure that the comparison between beaker P and beaker Q is fair. ............................................................................................................................................. [1] (e) Predict what the temperature of the water in beaker Q is 2 hours after the student has completed the investigation. temperature of water = .................................................... °C [1] [Total: 8]
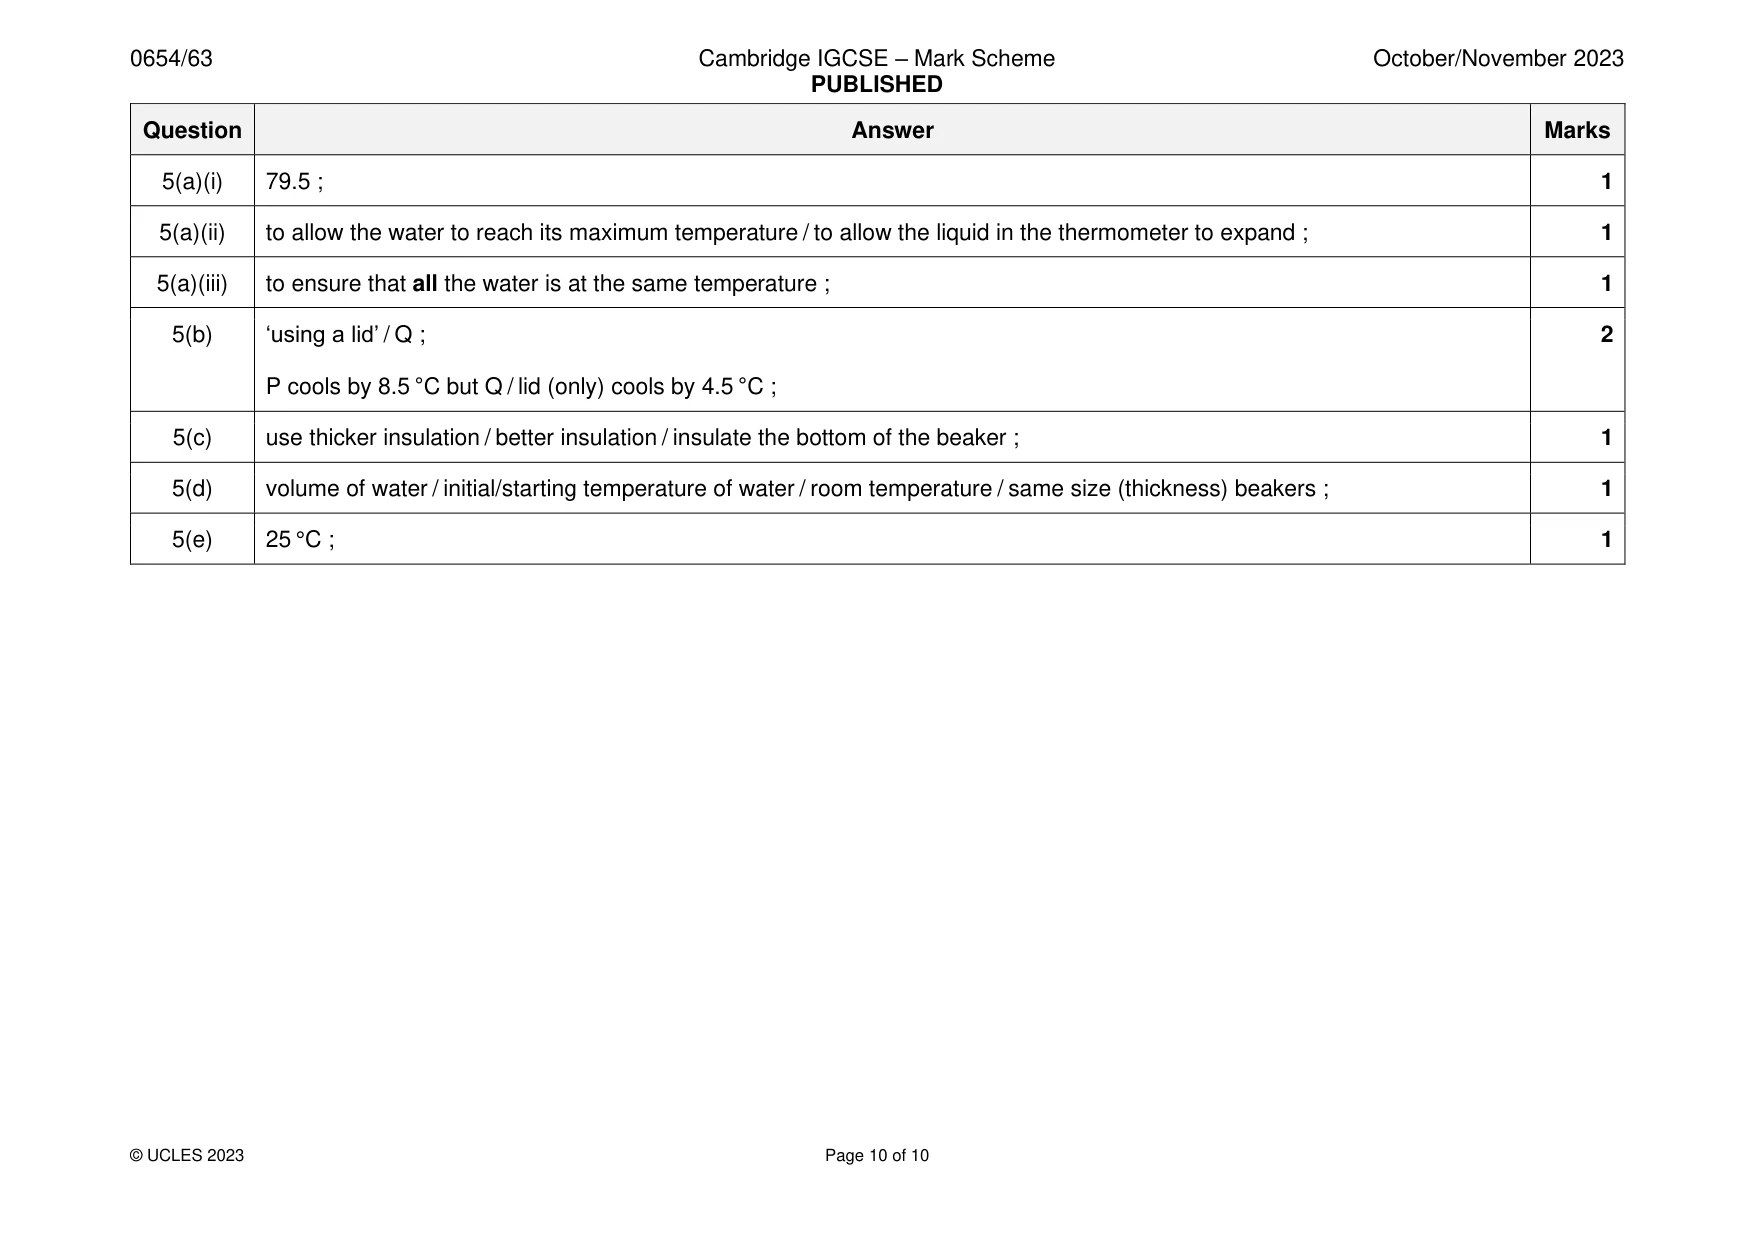
Mark scheme: 5(a)(i) 79.5 ; 1 5(a)(ii) to allow the water to reach its maximum temperature / to allow the liquid in the thermometer to expand ; 1 5(a)(iii) to ensure that all the water is at the same temperature ; 1 5(b) ‘using a lid’ / Q ; 2 P cools by 8.5 °C but Q / lid (only) cools by 4.5 °C ; 5(c) use thicker insulation / better insulation / insulate the bottom of the beaker ; 1 5(d) volume of water / initial/starting temperature of water / room temperature / same size (thickness) beakers ; 1 5(e) 25 °C ; 1
What was in this paper
The subtopics covered by these 5 questions, and how many questions each got. Open one in a new tab to see every Cambridge question on it.
What you needed in this session
Cambridge’s own grade thresholds for 2023 Oct/Nov, Paper 6 · Variant 3. A higher threshold means an easier paper — the bar moves with how the cohort did.