Cambridge IGCSE Sciences - Co-ordinated (Double) 0654 — 2022 Oct/Nov Paper 6 · Variant 2
0654/62/O/N/22 · 7 questions · 60 marks · ≈68 min
The question paper and its mark scheme, free to read here and free to download. This is Cambridge’s own paper, exactly as it was sat.
Question paper24 pages




Mark scheme10 pages
Answers below. Sit the paper first if you are practising.
Questions as text
Q1 · A student investigates respiration in small animals
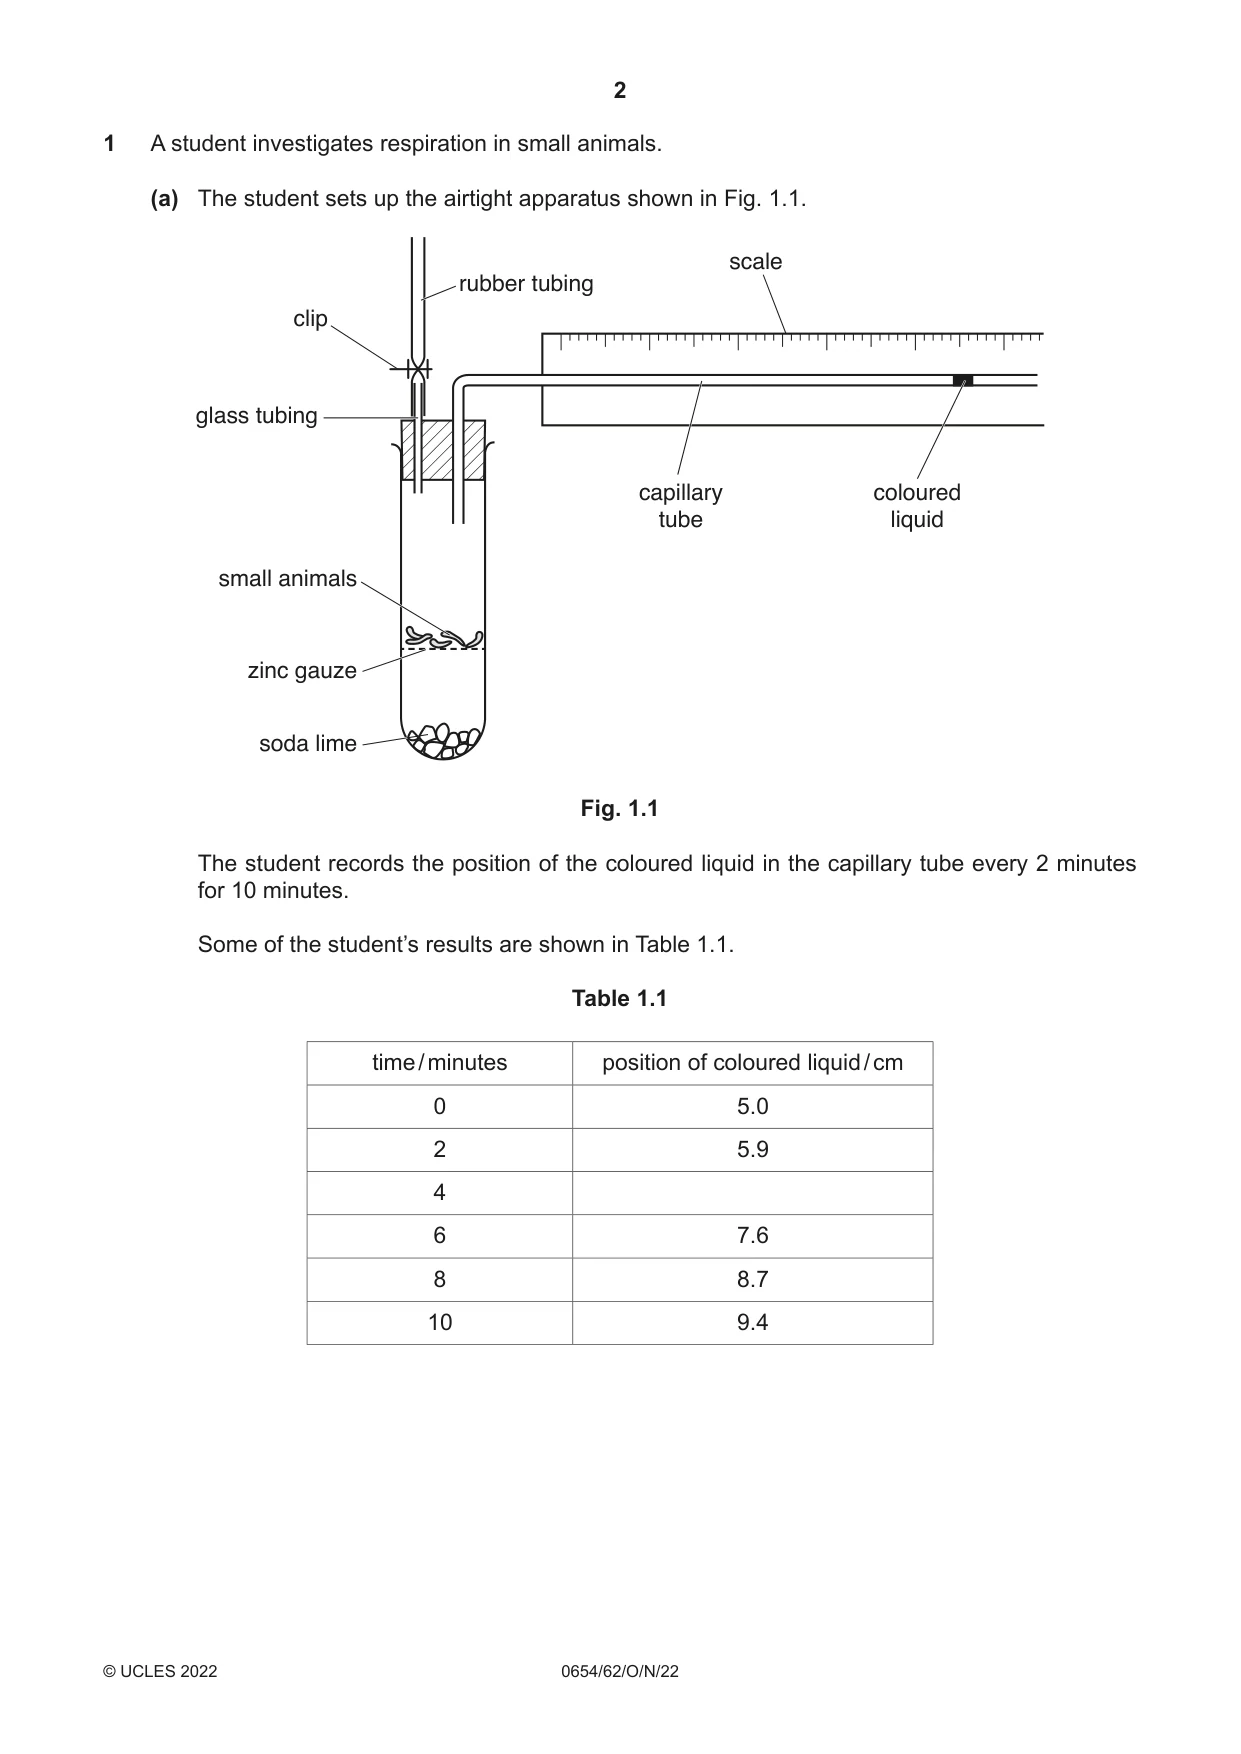
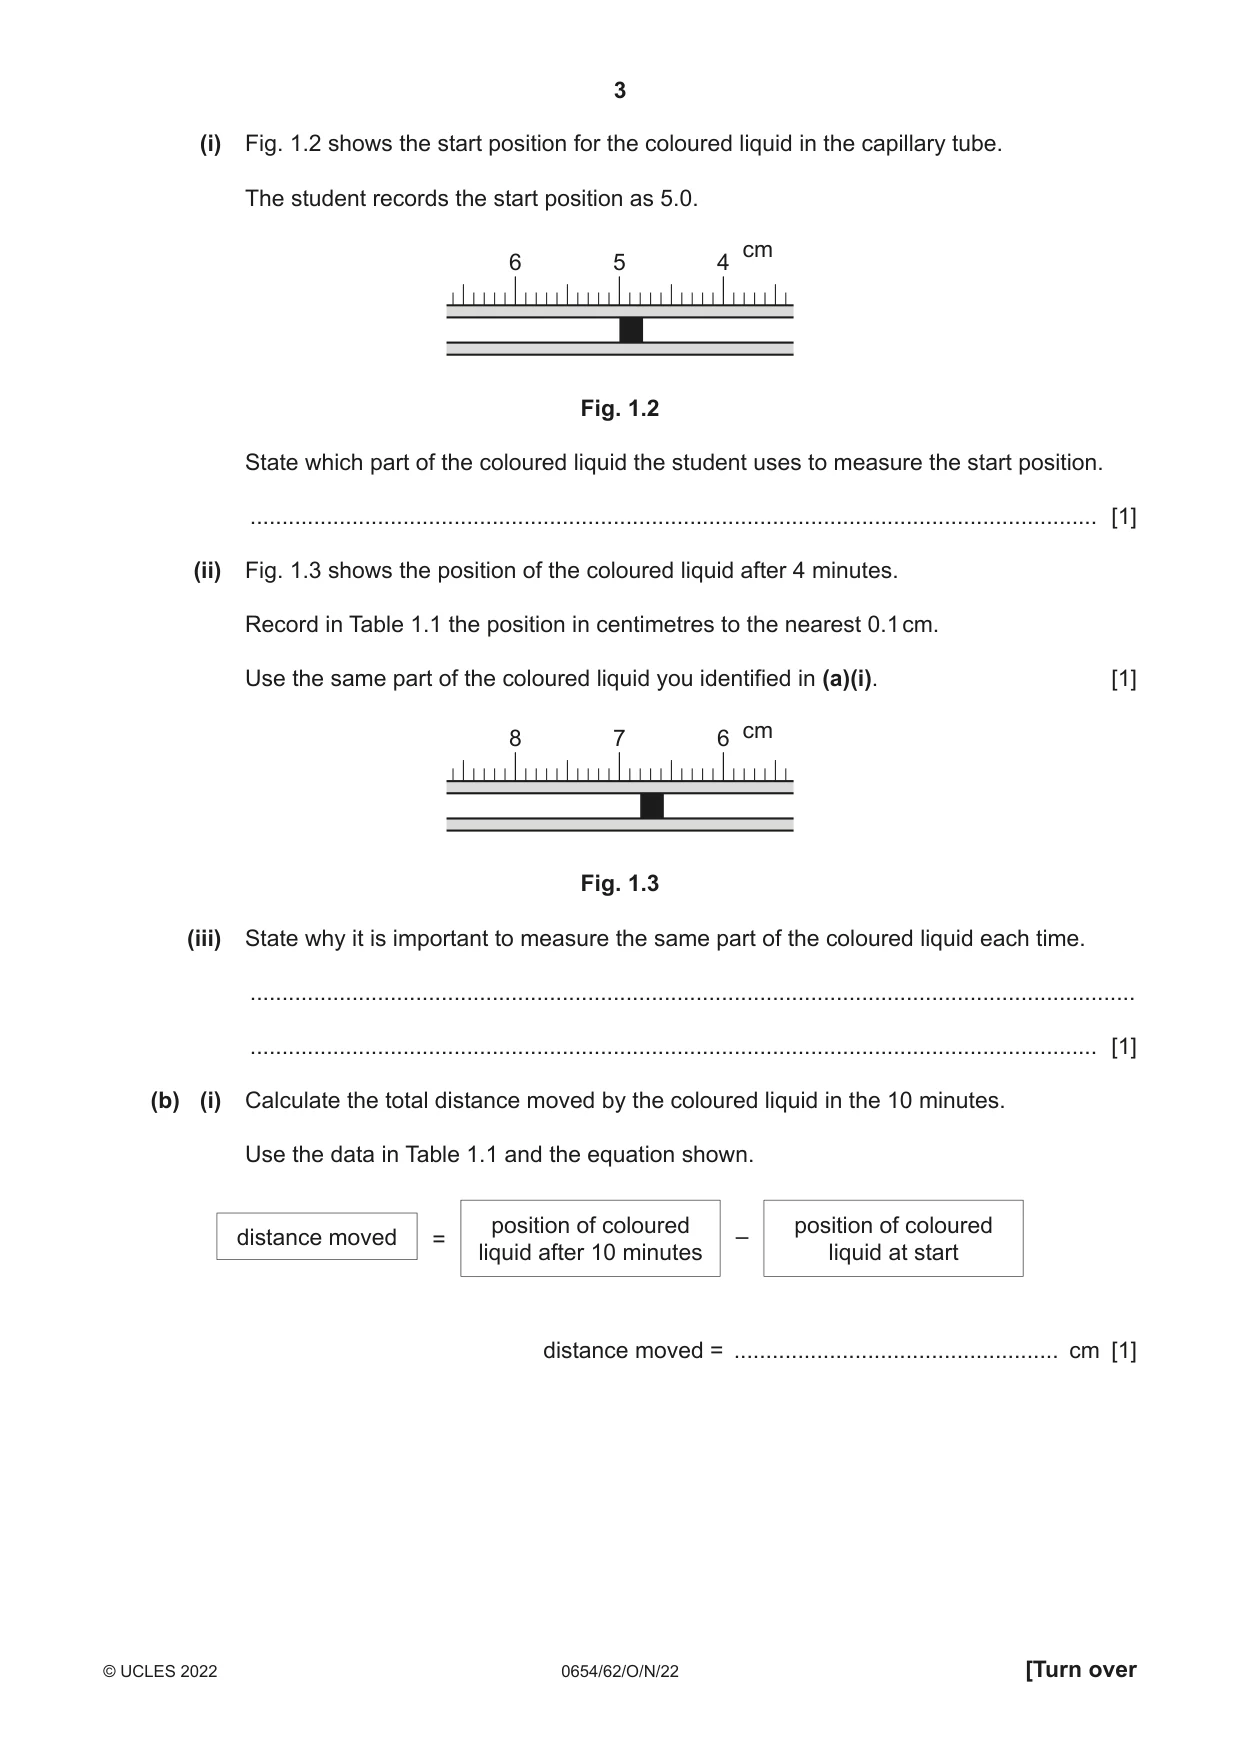
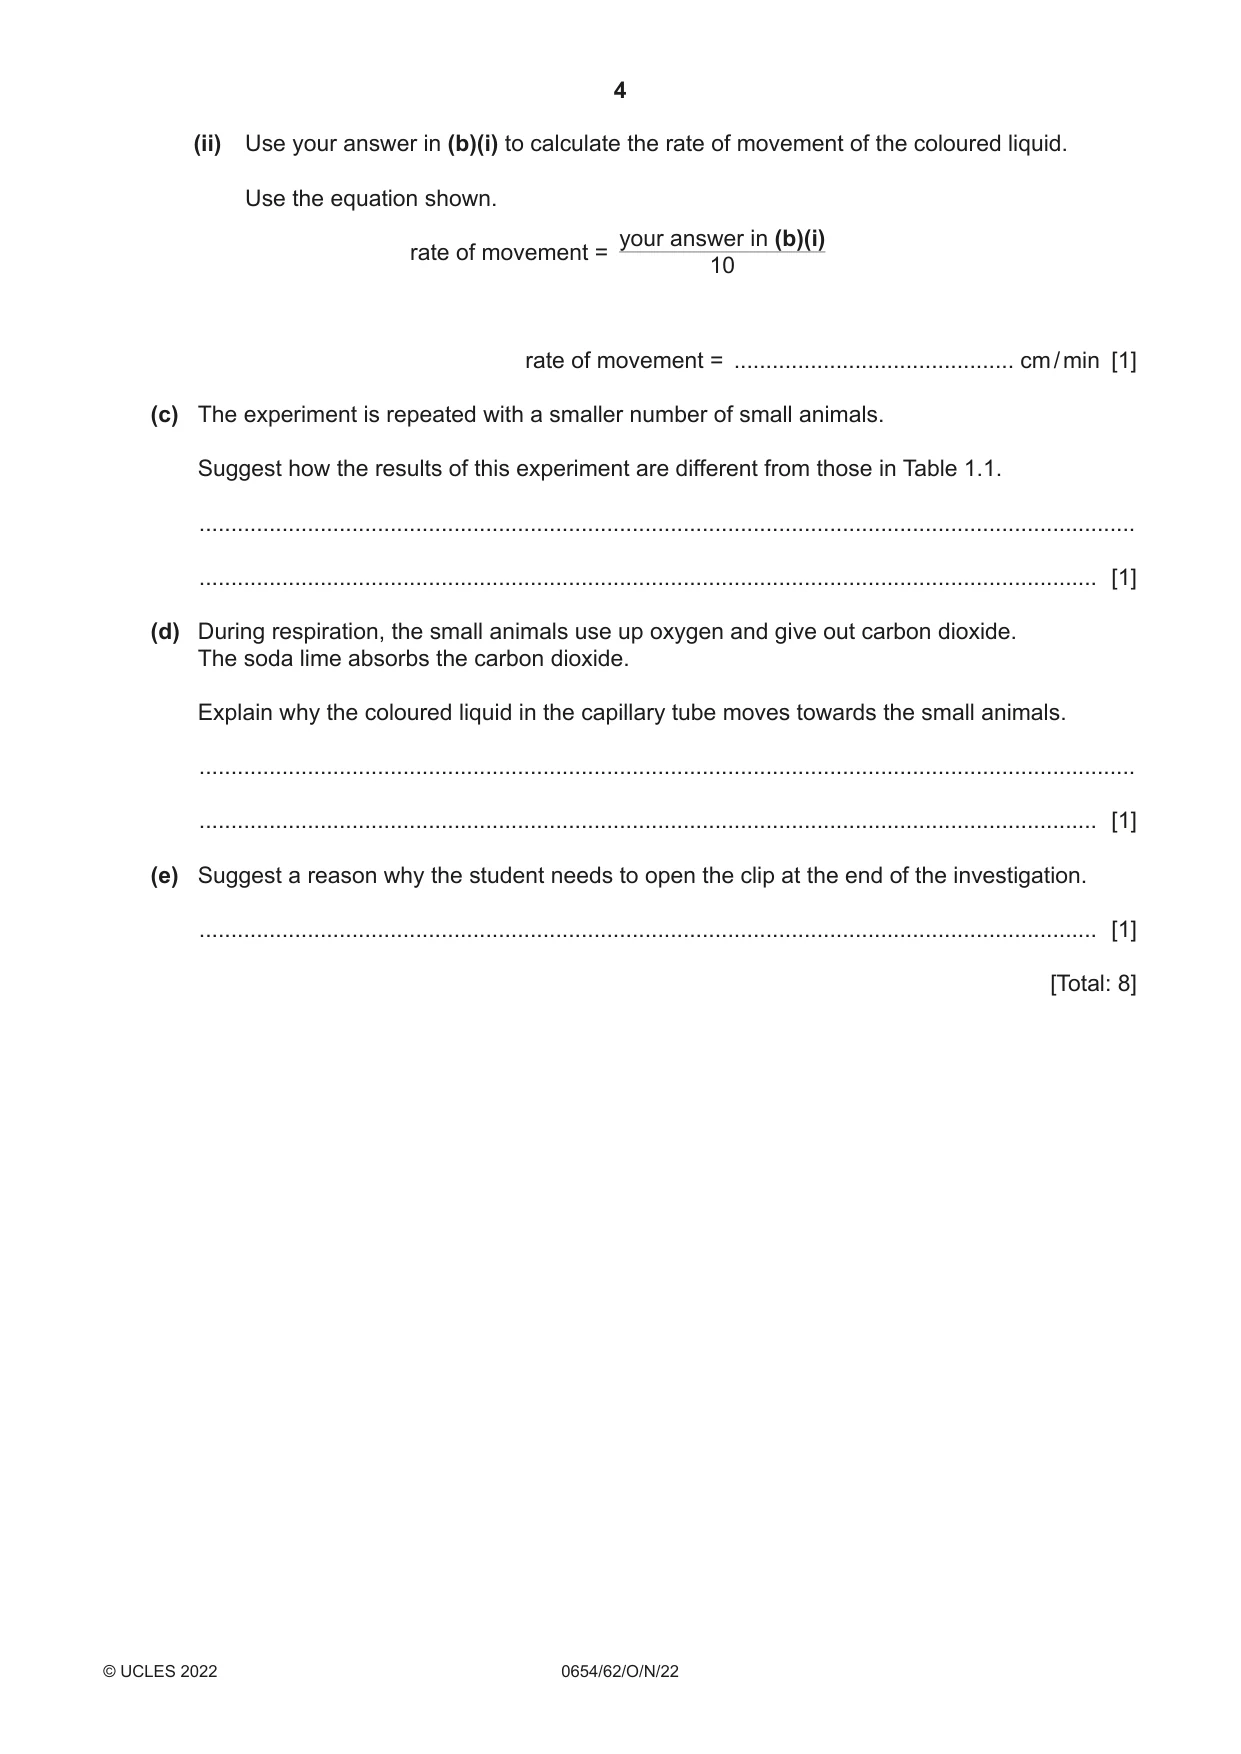
1 A student investigates respiration in small animals. (a) The student sets up the airtight apparatus shown in Fig. 1.1. scale rubber tubing clip glass tubing capillary coloured tube liquid small animals zinc gauze soda lime Fig. 1.1 The student records the position of the coloured liquid in the capillary tube every 2 minutes for 10 minutes. Some of the student’s results are shown in Table 1.1. Table 1.1 time / minutes position of coloured liquid / cm 0 5.0 2 5.9 4 6 7.6 8 8.7 10 9.4 (i) Fig. 1.2 shows the start position for the coloured liquid in the capillary tube. The student records the start position as 5.0. cm 6 5 4 Fig. 1.2 State which part of the coloured liquid the student uses to measure the start position. ..................................................................................................................................... [1] (ii) Fig. 1.3 shows the position of the coloured liquid after 4 minutes. Record in Table 1.1 the position in centimetres to the nearest 0.1 cm. Use the same part of the coloured liquid you identified in (a)(i). [1] cm 8 7 6 Fig. 1.3 (iii) State why it is important to measure the same part of the coloured liquid each time. ........................................................................................................................................... ..................................................................................................................................... [1] (b) (i) Calculate the total distance moved by the coloured liquid in the 10 minutes. Use the data in Table 1.1 and the equation shown. position of coloured position of coloured distance moved = – liquid after 10 minutes liquid at start distance moved = ................................................... cm [1] (ii) Use your answer in (b)(i) to calculate the rate of movement of the coloured liquid. Use the equation shown. your answer in (b)(i) rate of movement = 10 rate of movement = ............................................ cm / min [1] (c) The experiment is repeated with a smaller number of small animals. Suggest how the results of this experiment are different from those in Table 1.1. ................................................................................................................................................... ............................................................................................................................................. [1] (d) During respiration, the small animals use up oxygen and give out carbon dioxide. The soda lime absorbs the carbon dioxide. Explain why the coloured liquid in the capillary tube moves towards the small animals. ................................................................................................................................................... ............................................................................................................................................. [1] (e) Suggest a reason why the student needs to open the clip at the end of the investigation. ............................................................................................................................................. [1] [Total: 8]
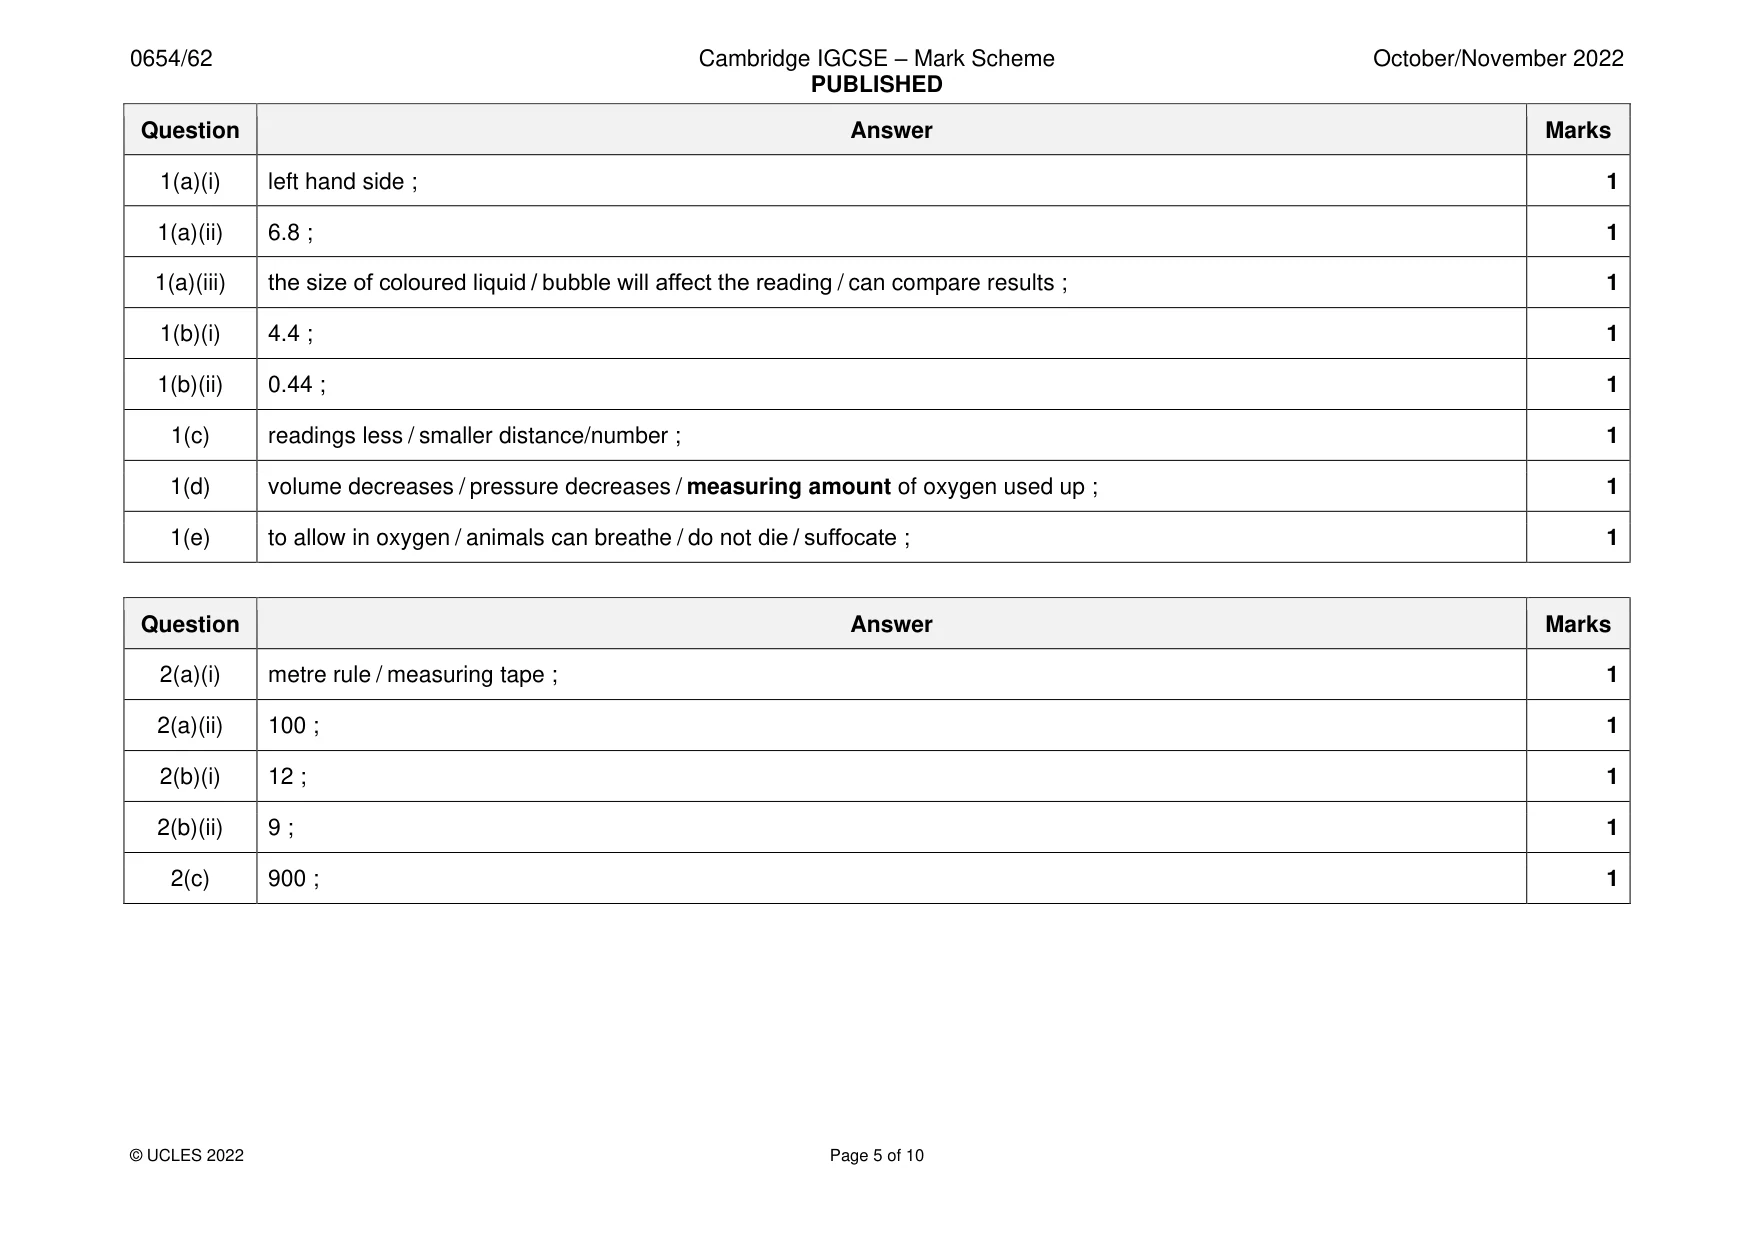
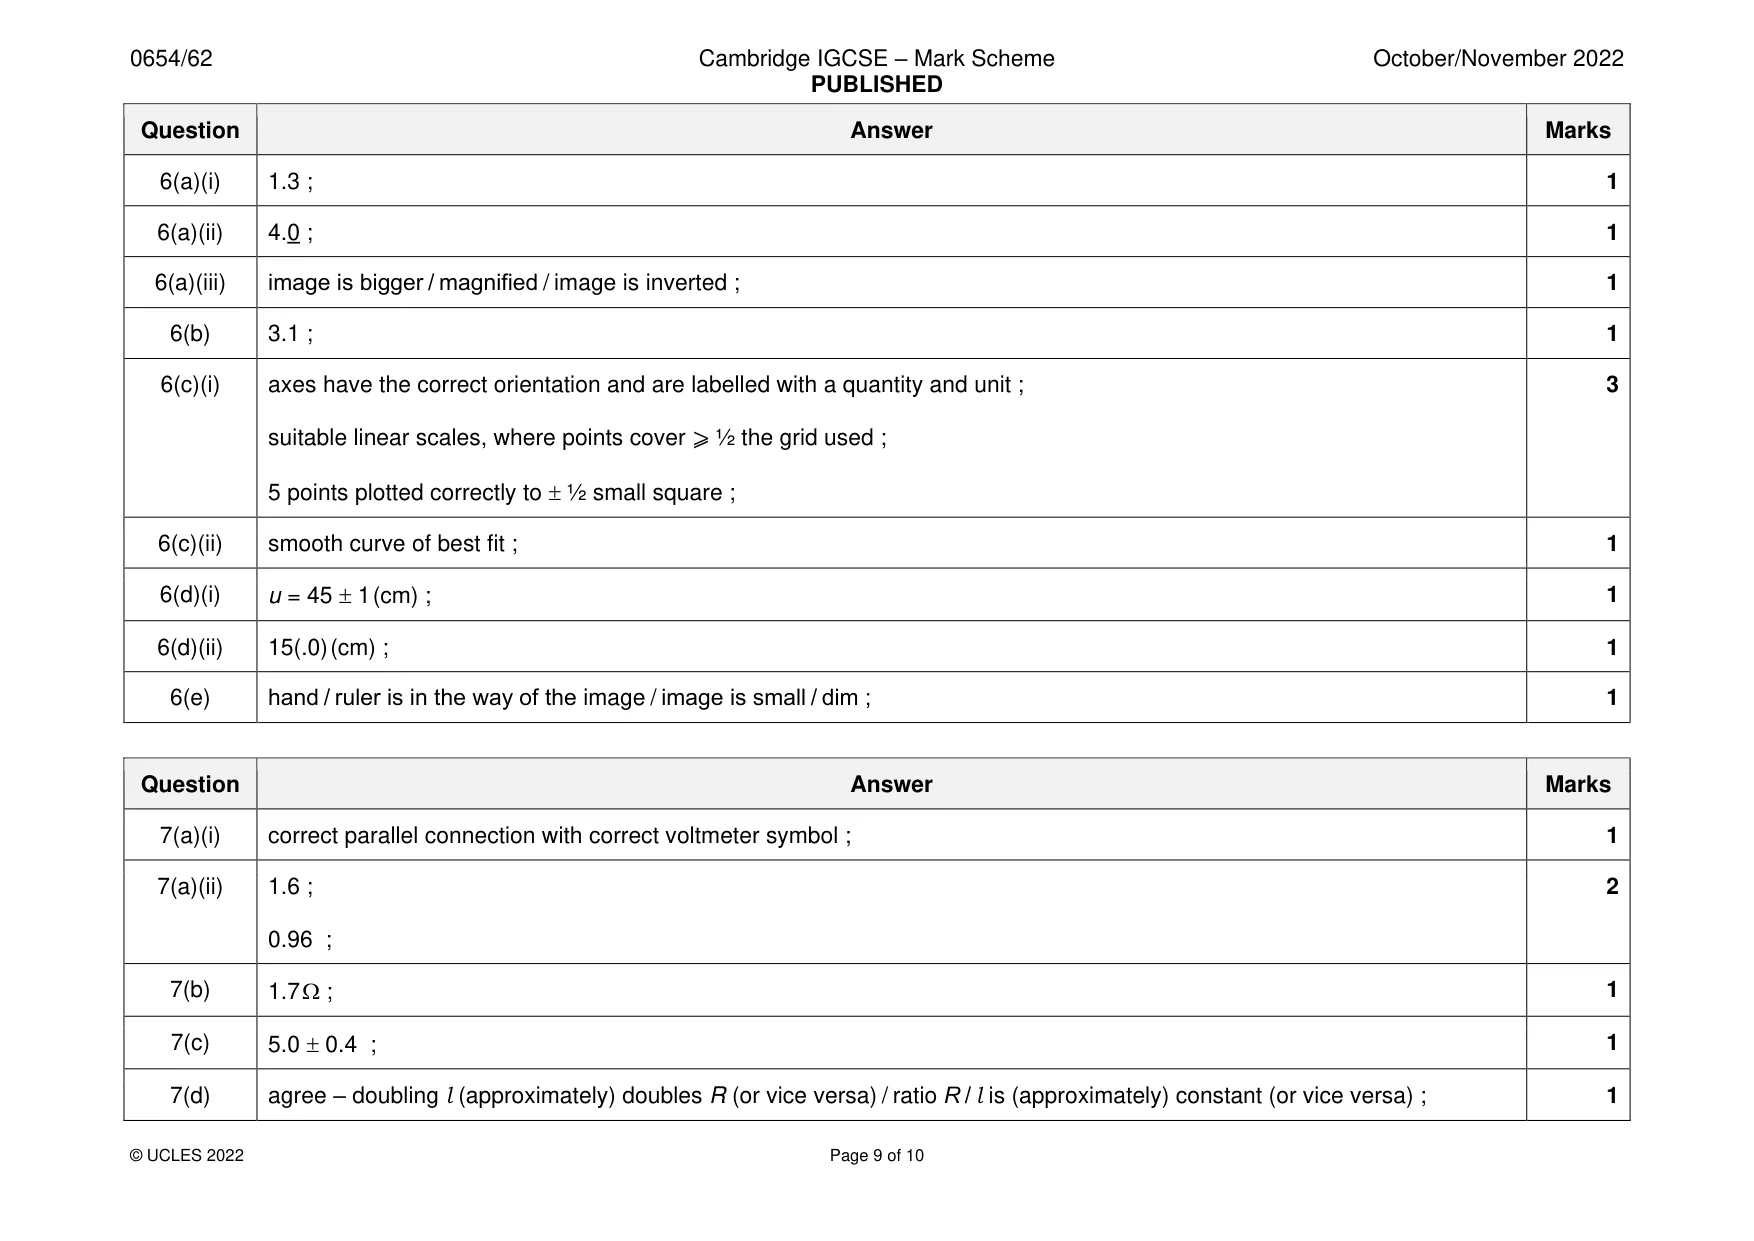
Mark scheme: Question Answer Marks 1(a)(i) left hand side ; 1 1(a)(ii) 6.8 ; 1 1(a)(iii) the size of coloured liquid / bubble will affect the reading / can compare results ; 1 1(b)(i) 4.4 ; 1 1(b)(ii) 0.44 ; 1 1(c) readings less / smaller distance/number ; 1 1(d) volume decreases / pressure decreases / measuring amount of oxygen used up ; 1 1(e) to allow in oxygen / animals can breathe / do not die / suffocate ; 1
More questions on Physical quantities and measurement techniques
Q2 · A student estimates the number of daisy plants in a garden
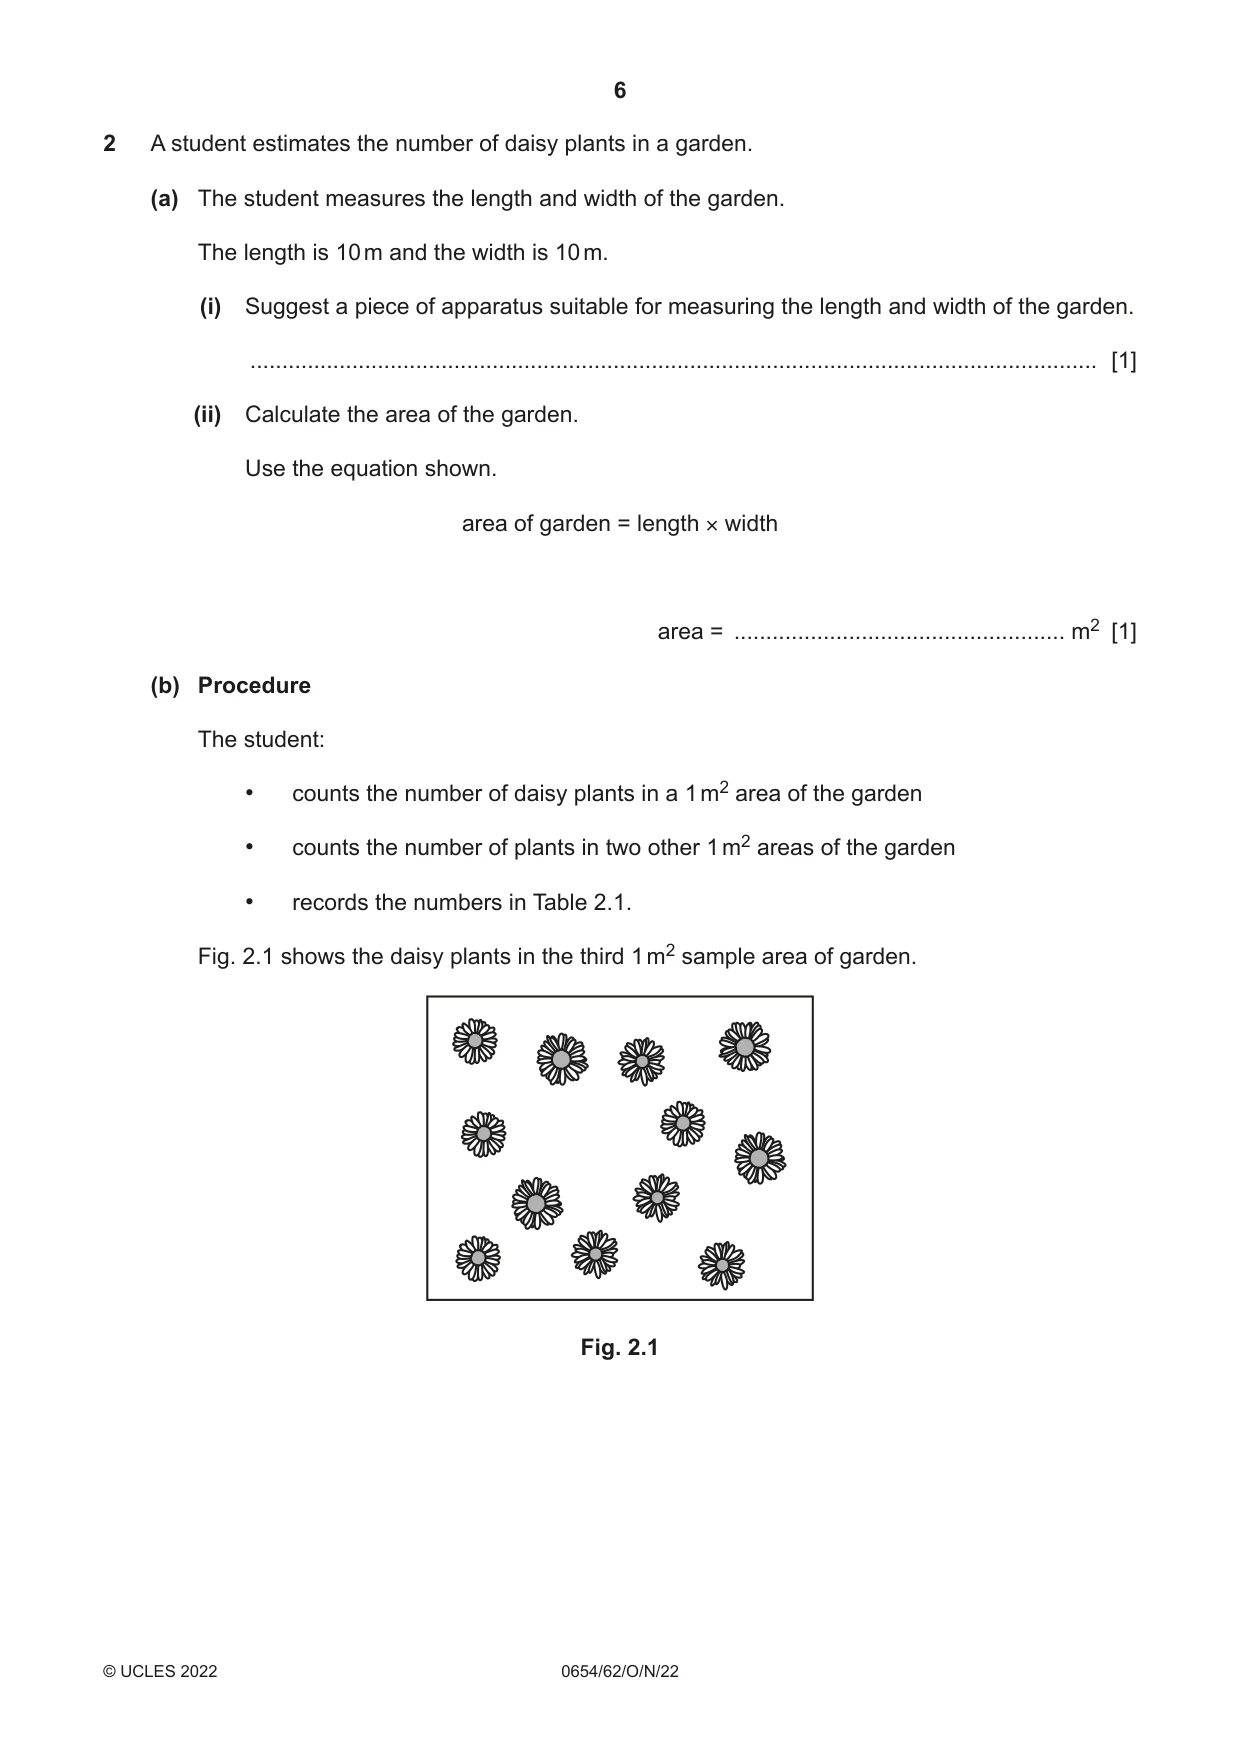
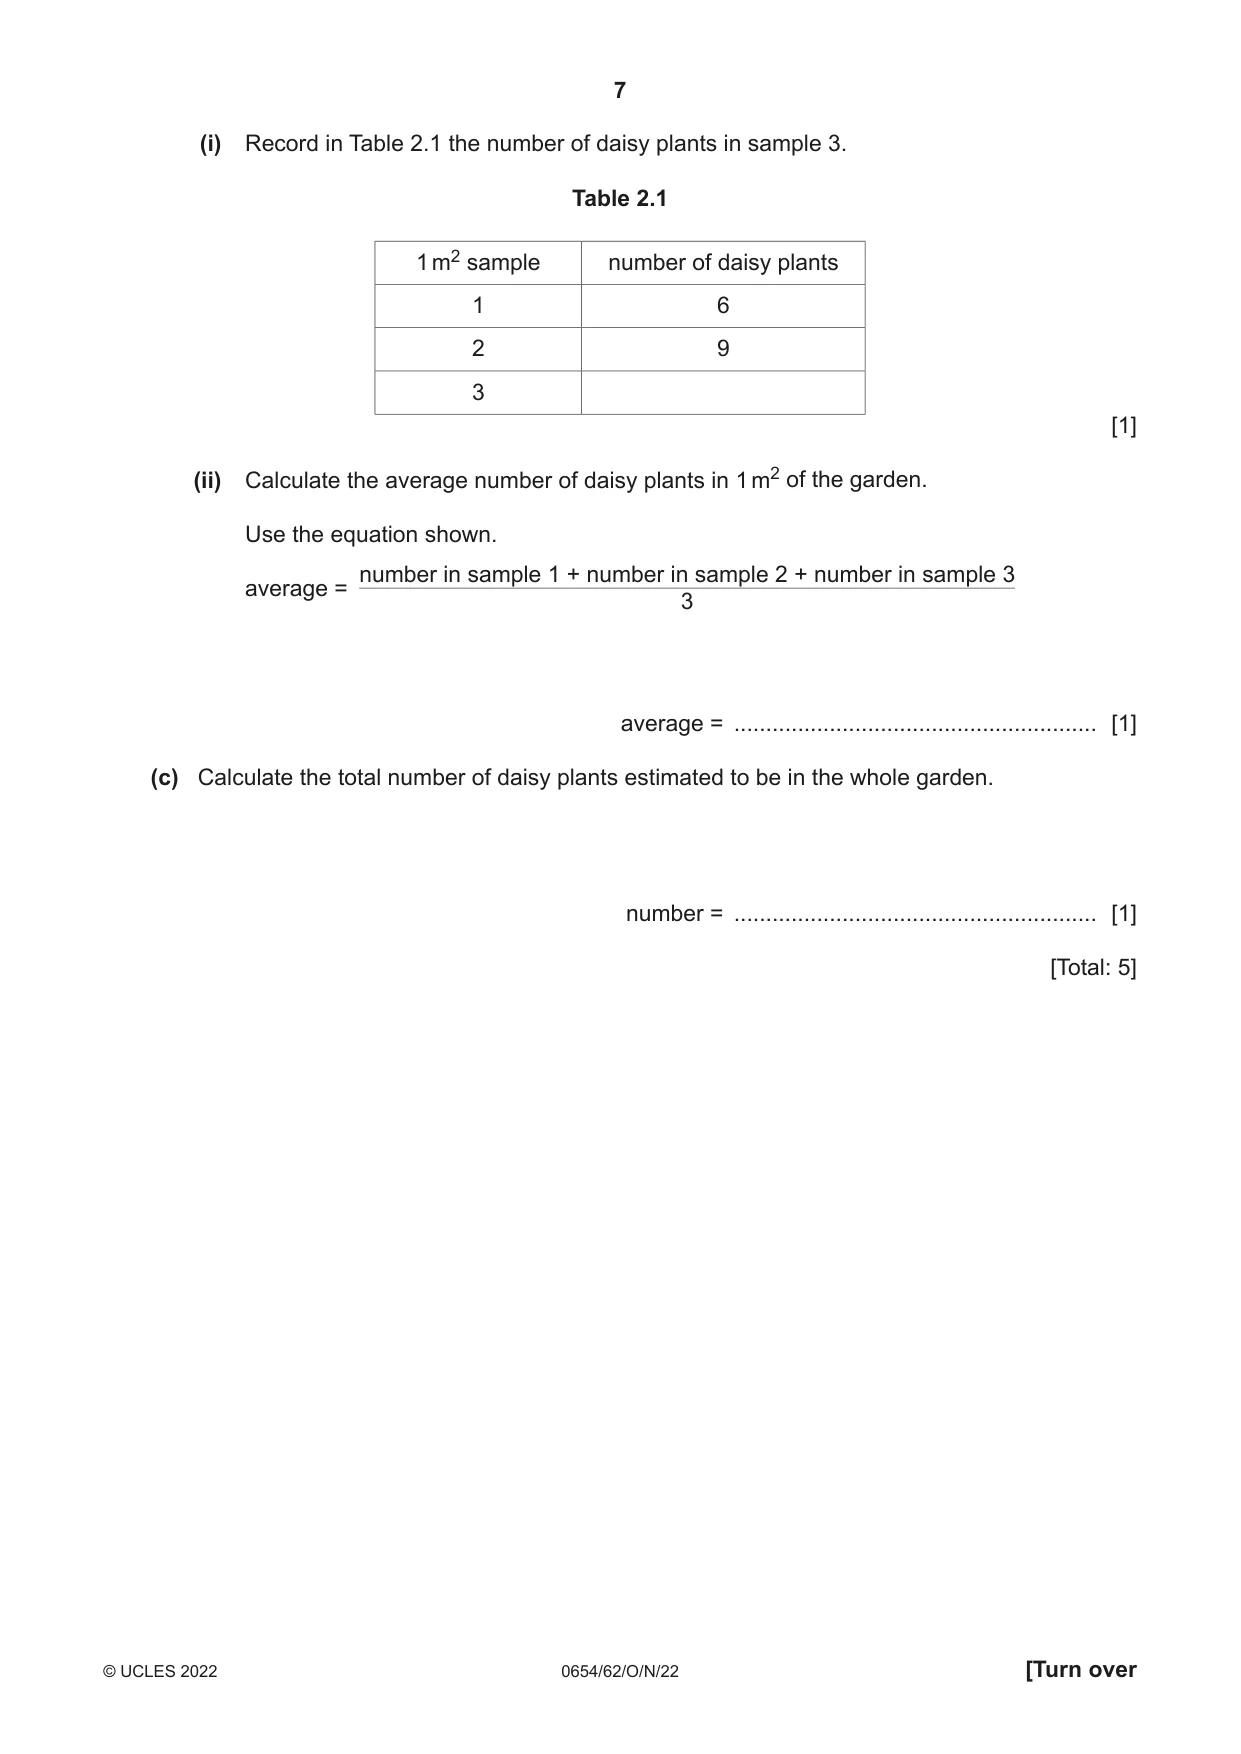
2 A student estimates the number of daisy plants in a garden. (a) The student measures the length and width of the garden. The length is 10 m and the width is 10 m. (i) Suggest a piece of apparatus suitable for measuring the length and width of the garden. ..................................................................................................................................... [1] (ii) Calculate the area of the garden. Use the equation shown. area of garden = length × width area = .................................................... m2 [1] (b) Procedure The student: • counts the number of daisy plants in a 1 m2 area of the garden • counts the number of plants in two other 1 m2 areas of the garden • records the numbers in Table 2.1. Fig. 2.1 shows the daisy plants in the third 1 m2 sample area of garden. Fig. 2.1 (i) Record in Table 2.1 the number of daisy plants in sample 3. Table 2.1 1 m2 sample number of daisy plants 1 6 2 9 3 [1] (ii) Calculate the average number of daisy plants in 1 m2 of the garden. Use the equation shown. number in sample 1 + number in sample 2 + number in sample 3 average = 3 average = ......................................................... [1] (c) Calculate the total number of daisy plants estimated to be in the whole garden. number = ......................................................... [1] [Total: 5]
Mark scheme: 2(a)(i) metre rule / measuring tape ; 1 2(a)(ii) 100 ; 1 2(b)(i) 12 ; 1 2(b)(ii) 9 ; 1 2(c) 900 ; 1
Q3 · Amylase is a digestive enzyme that breaks down starch into reducing sugar
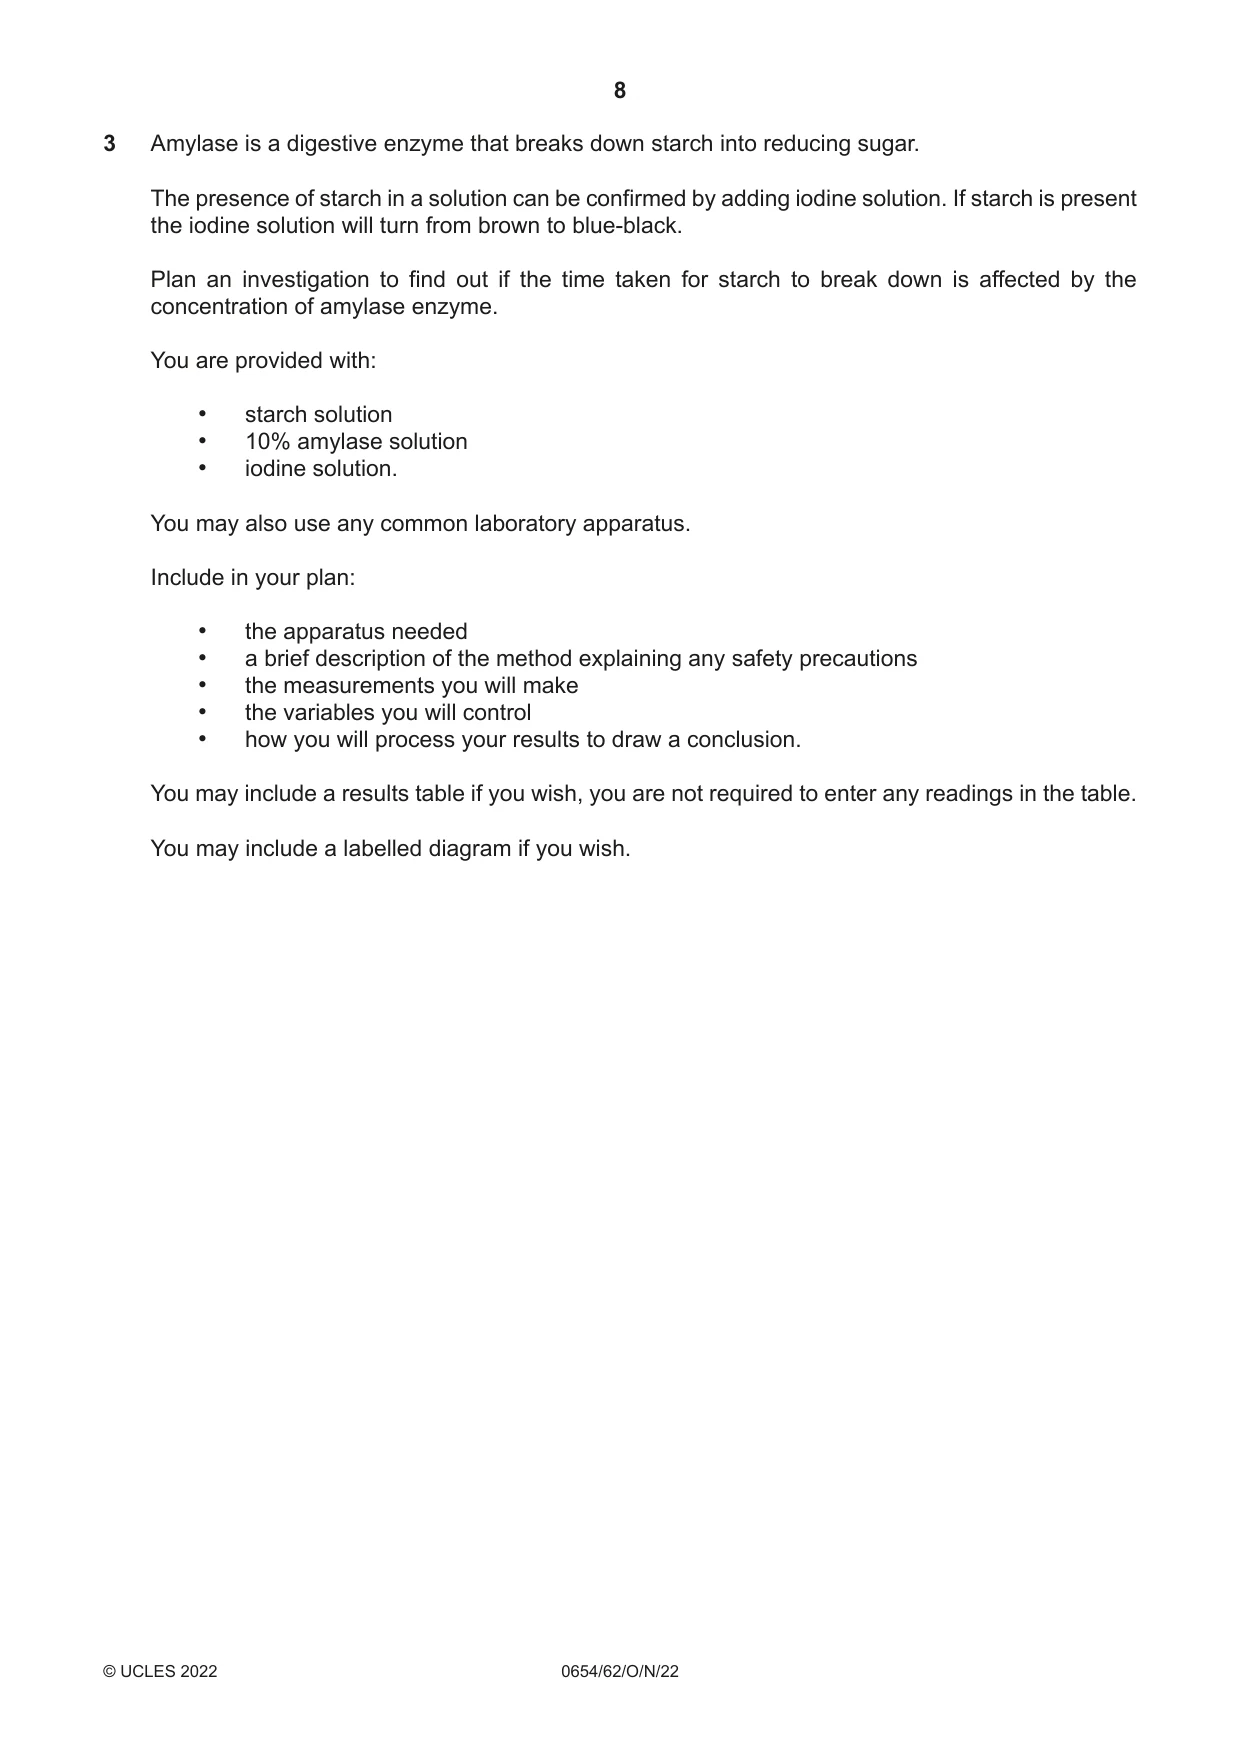
3 Amylase is a digestive enzyme that breaks down starch into reducing sugar. The presence of starch in a solution can be confirmed by adding iodine solution. If starch is present the iodine solution will turn from brown to blue-black. Plan an investigation to find out if the time taken for starch to break down is affected by the concentration of amylase enzyme. You are provided with: • starch solution • 10% amylase solution • iodine solution. You may also use any common laboratory apparatus. Include in your plan: • the apparatus needed • a brief description of the method explaining any safety precautions • the measurements you will make • the variables you will control • how you will process your results to draw a conclusion. You may include a results table if you wish, you are not required to enter any readings in the table. You may include a labelled diagram if you wish. .......................................................................................................................................................... .......................................................................................................................................................... .......................................................................................................................................................... .......................................................................................................................................................... .......................................................................................................................................................... .......................................................................................................................................................... .......................................................................................................................................................... .......................................................................................................................................................... .......................................................................................................................................................... .......................................................................................................................................................... .......................................................................................................................................................... .......................................................................................................................................................... .......................................................................................................................................................... .......................................................................................................................................................... .......................................................................................................................................................... .......................................................................................................................................................... .......................................................................................................................................................... .......................................................................................................................................................... .......................................................................................................................................................... .......................................................................................................................................................... .................................................................................................................................................... [7]
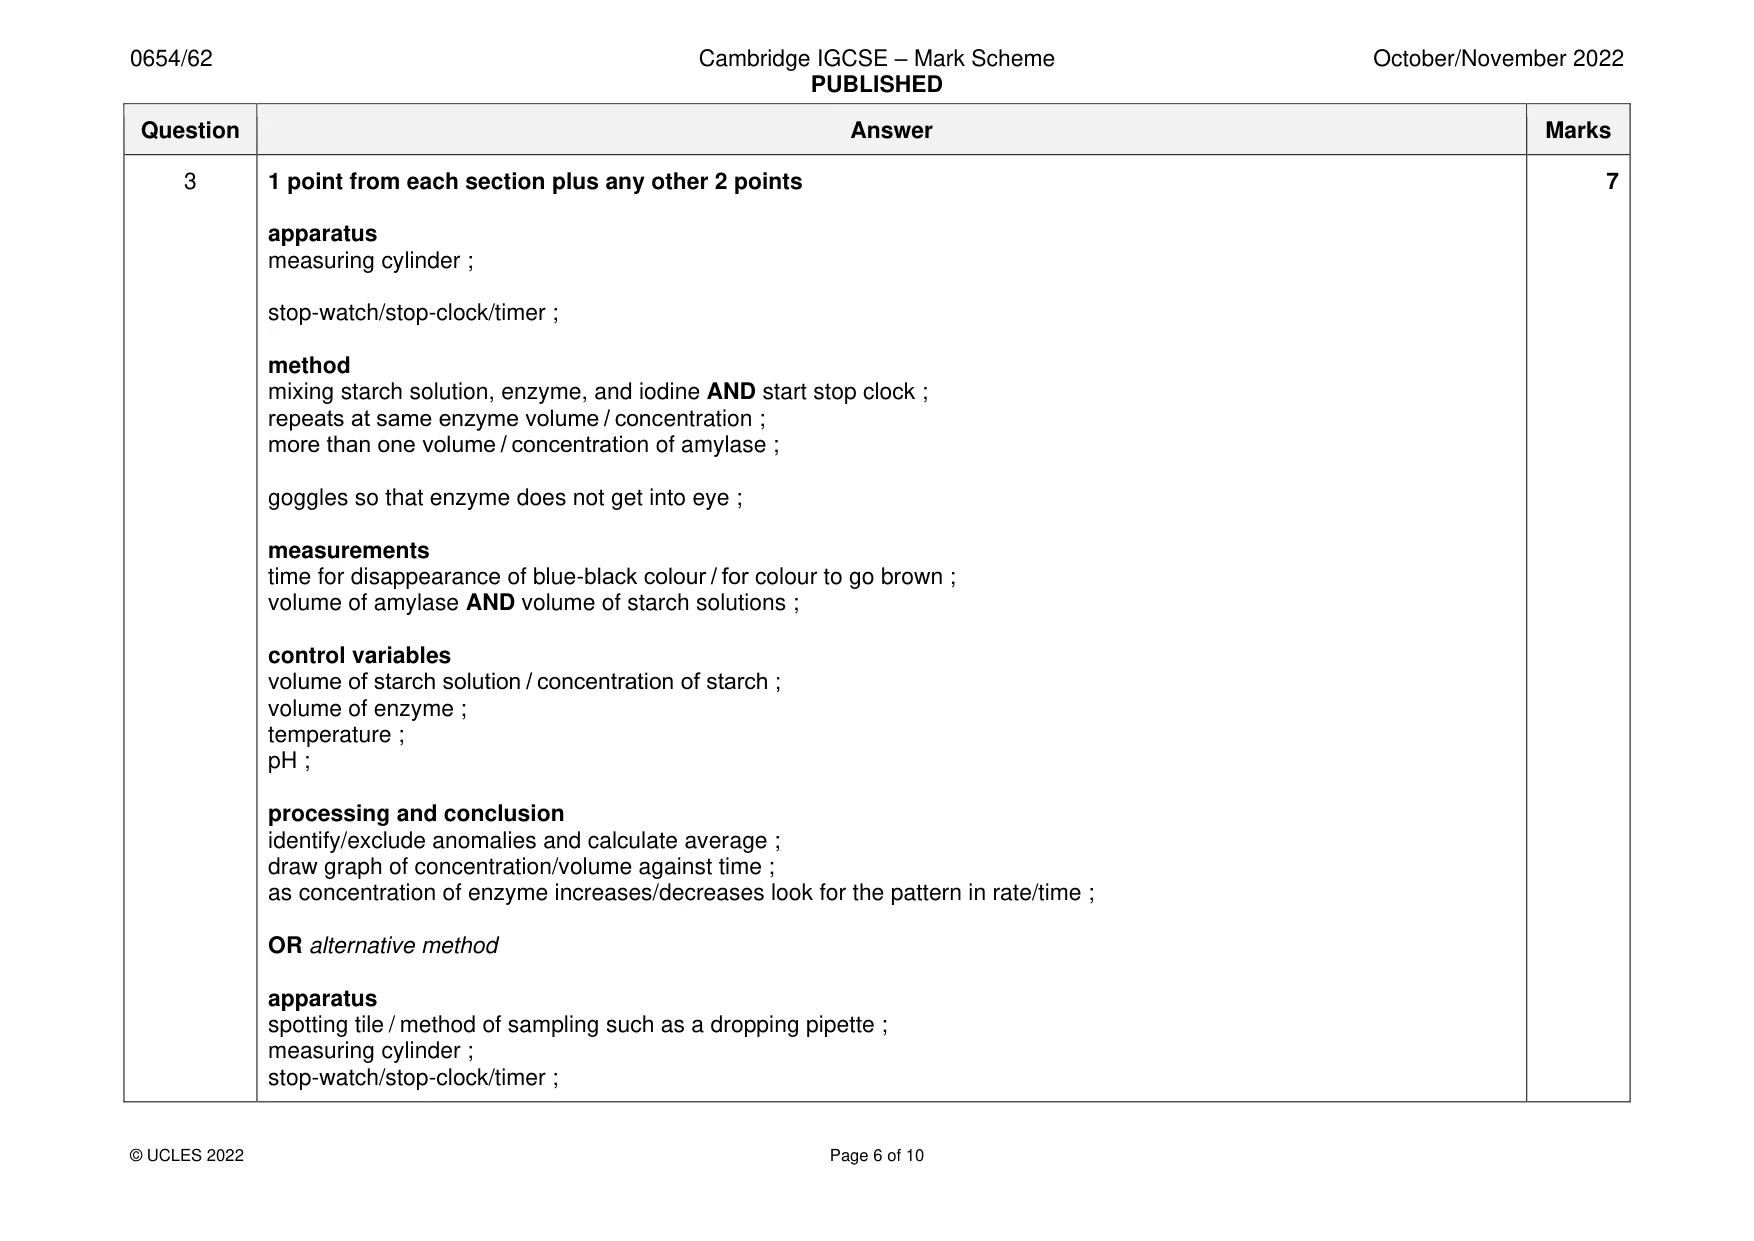
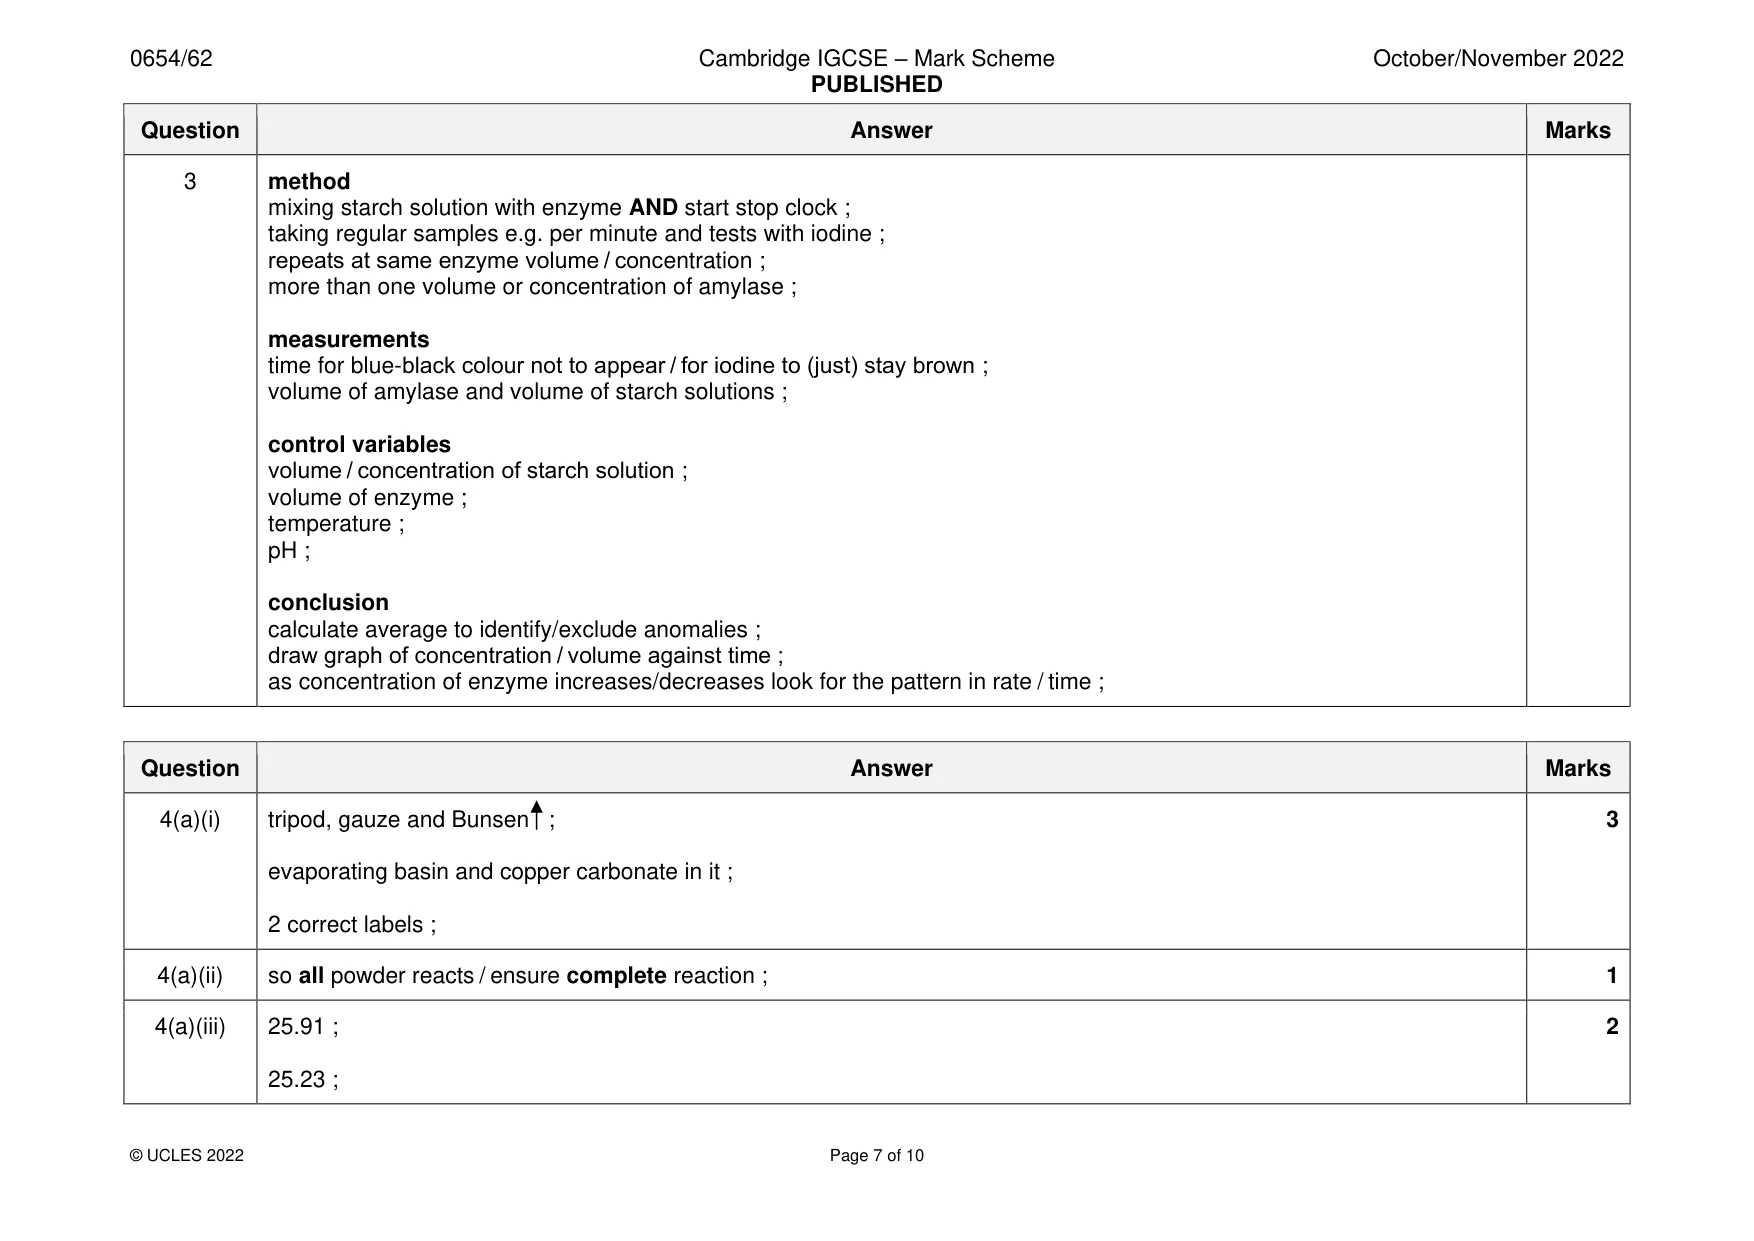
Mark scheme: 3 1 point from each section plus any other 2 points 7 apparatus measuring cylinder ; stop-watch/stop-clock/timer ; method mixing starch solution, enzyme, and iodine AND start stop clock ; repeats at same enzyme volume / concentration ; more than one volume / concentration of amylase ; goggles so that enzyme does not get into eye ; measurements time for disappearance of blue-black colour / for colour to go brown ; volume of amylase AND volume of starch solutions ; control variables volume of starch solution / concentration of starch ; volume of enzyme ; temperature ; pH ; processing and conclusion identify/exclude anomalies and calculate average ; draw graph of concentration/volume against time ; as concentration of enzyme increases/decreases look for the pattern in rate/time ; OR alternative method apparatus spotting tile / method of sampling such as a dropping pipette ; measuring cylinder ; stop-watch/stop-clock/timer ; 3 method mixing starch solution with enzyme AND start stop clock ; taking regular samples e.g. per minute and tests with iodine ; repeats at same enzyme volume / concentration ; more than one volume or concentration of amylase ; measurements time for blue-black colour not to appear / for iodine to (just) stay brown ; volume of amylase and volume of starch solutions ; control variables volume / concentration of starch solution ; volume of enzyme ; temperature ; pH ; conclusion calculate average to identify/exclude anomalies ; draw graph of concentration / volume against time ; as concentration of enzyme increases/decreases look for the pattern in rate / time ;
Q4 · A student investigates the percentage yield for the decomposition of copper carbonate
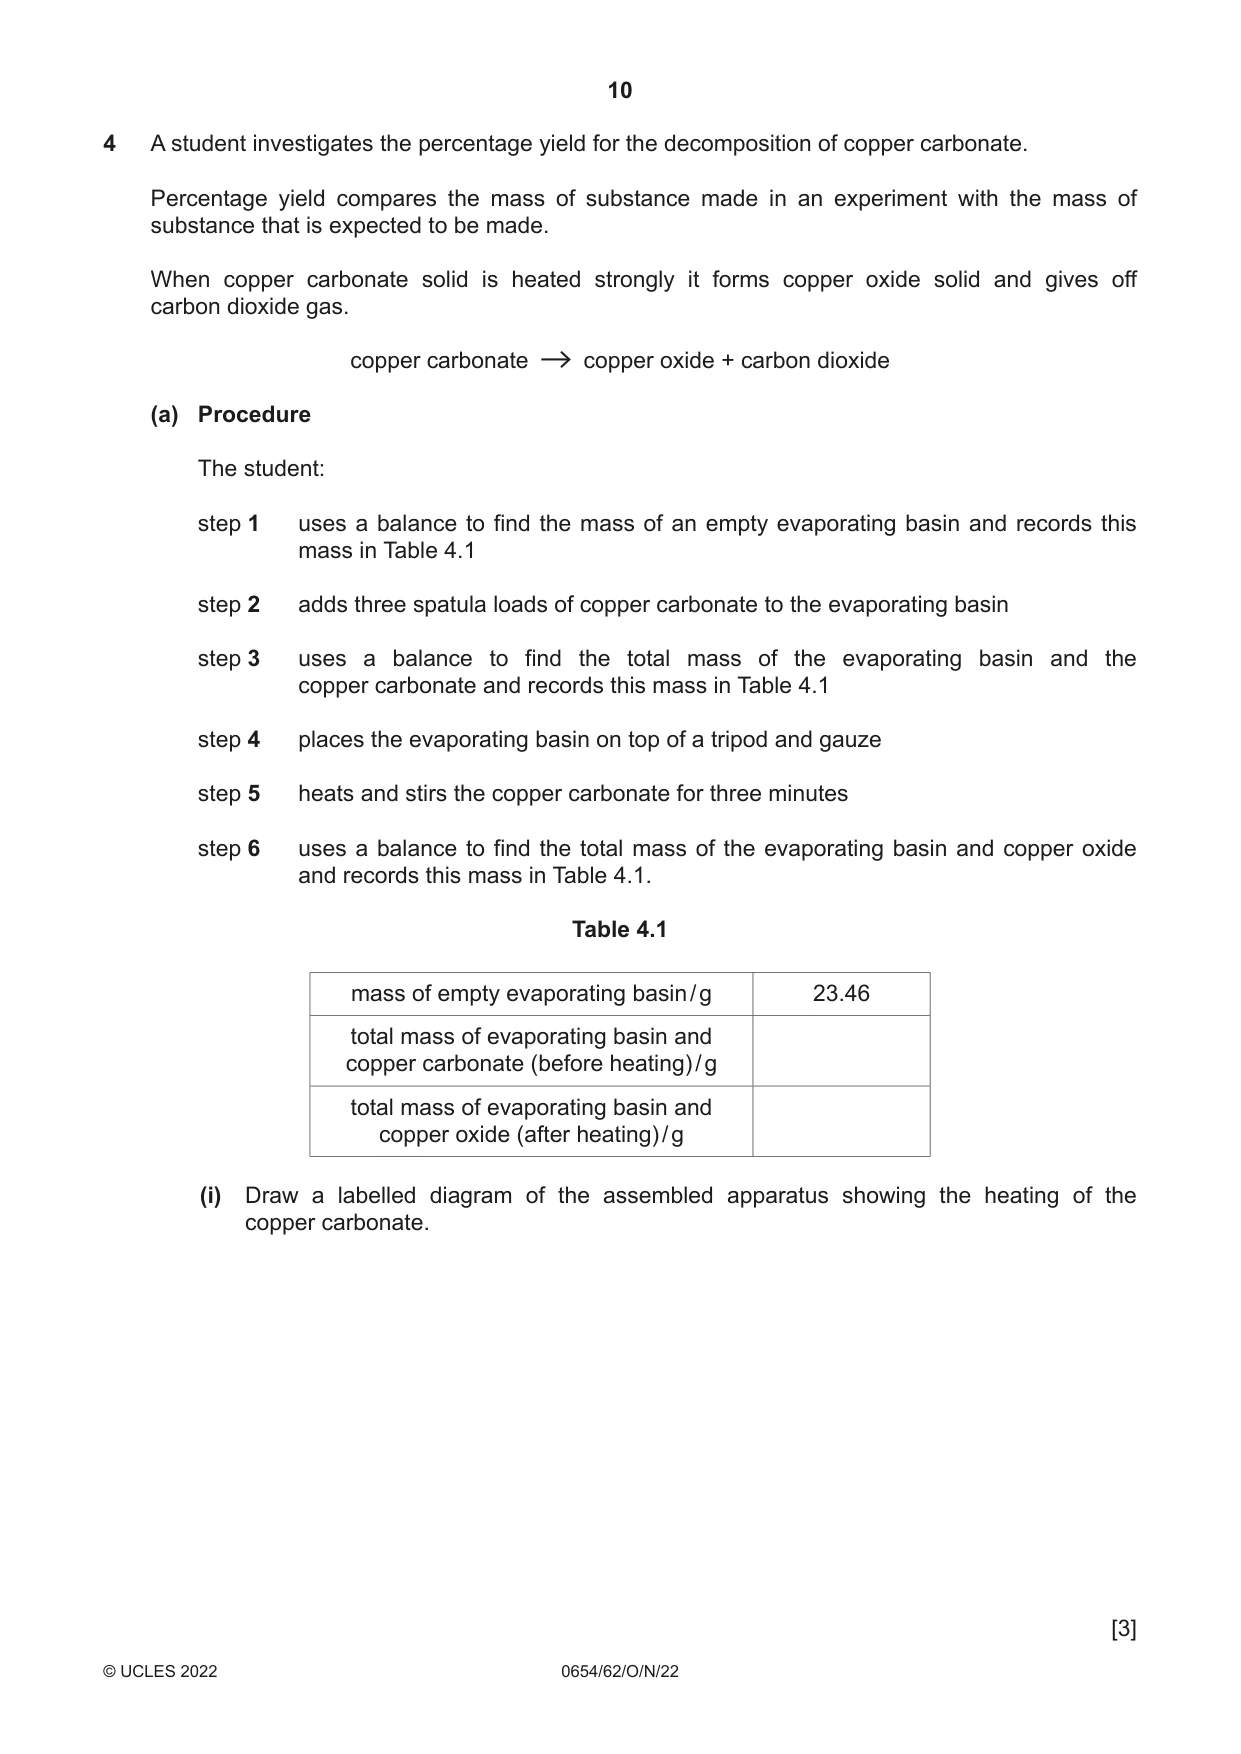
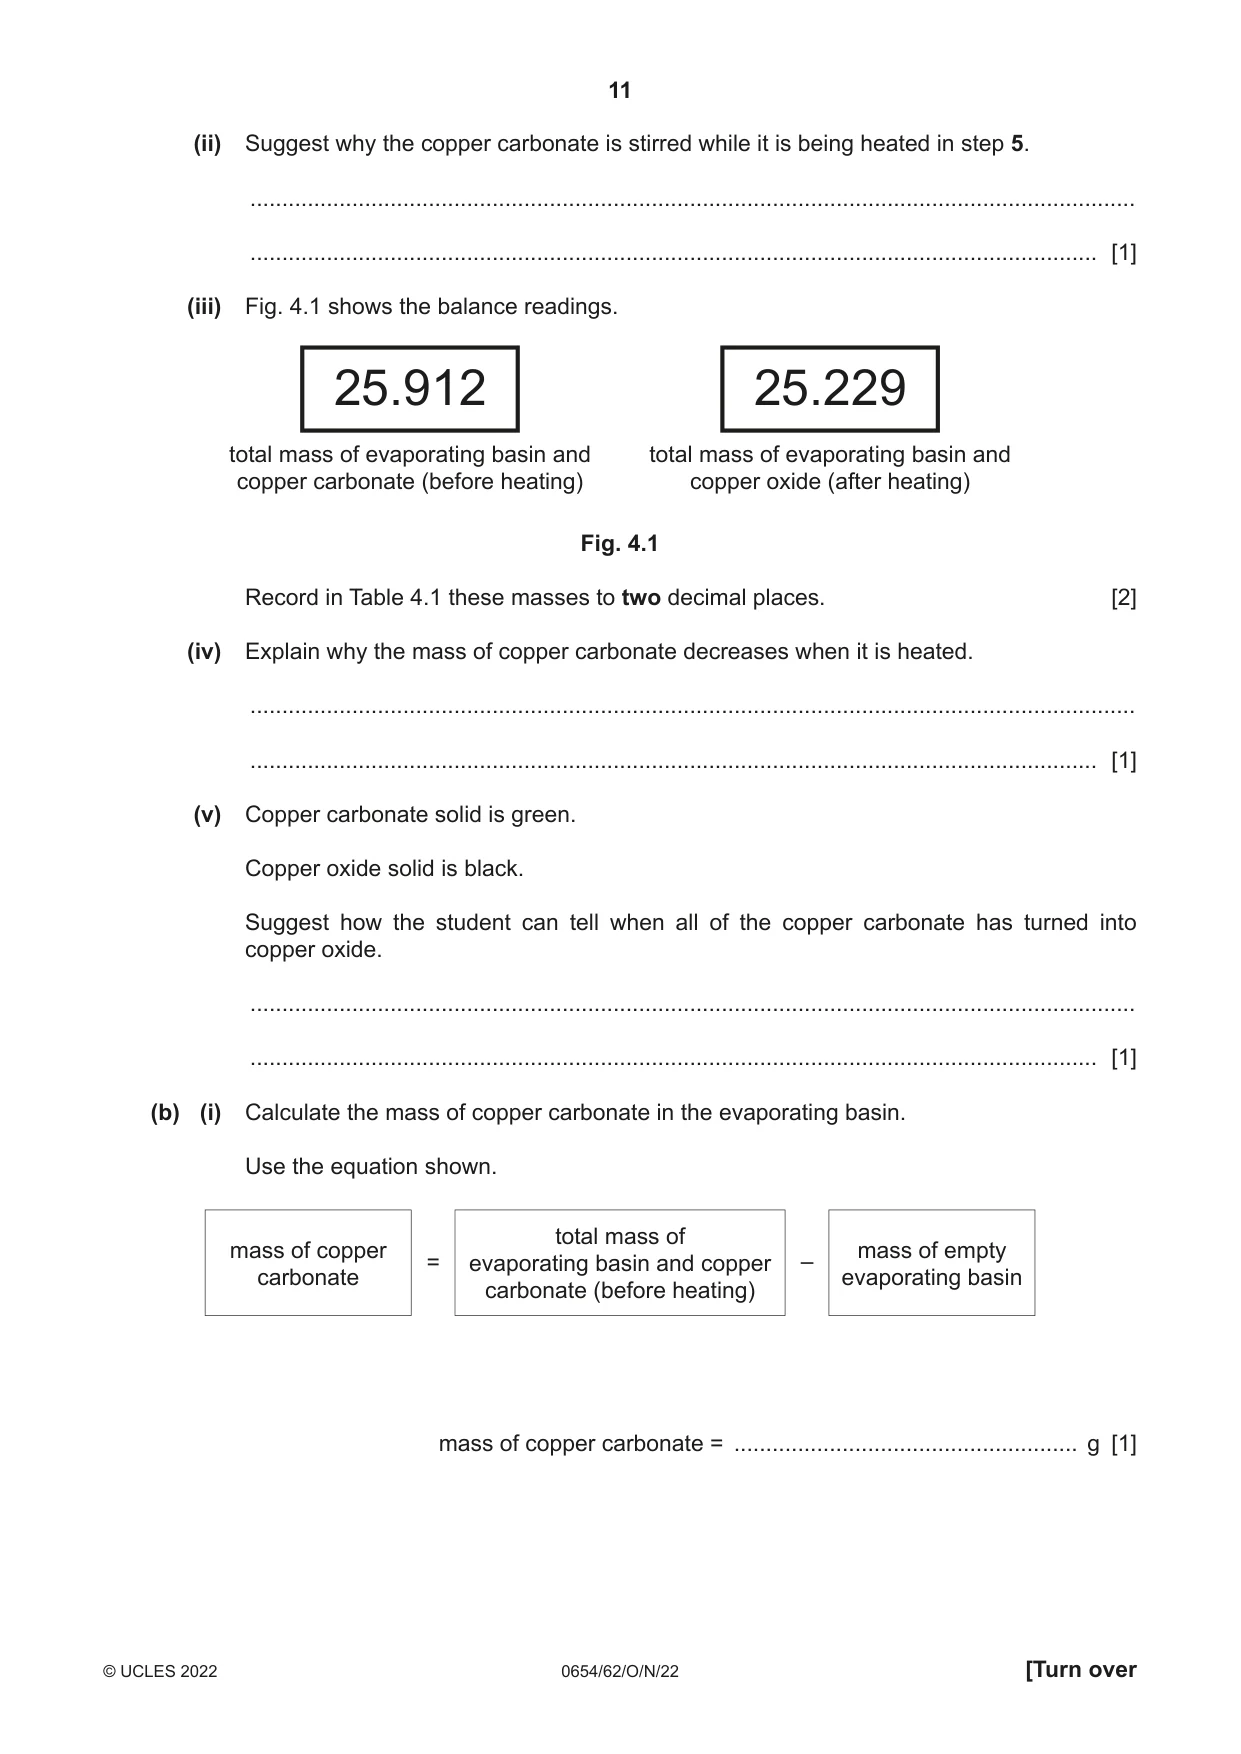
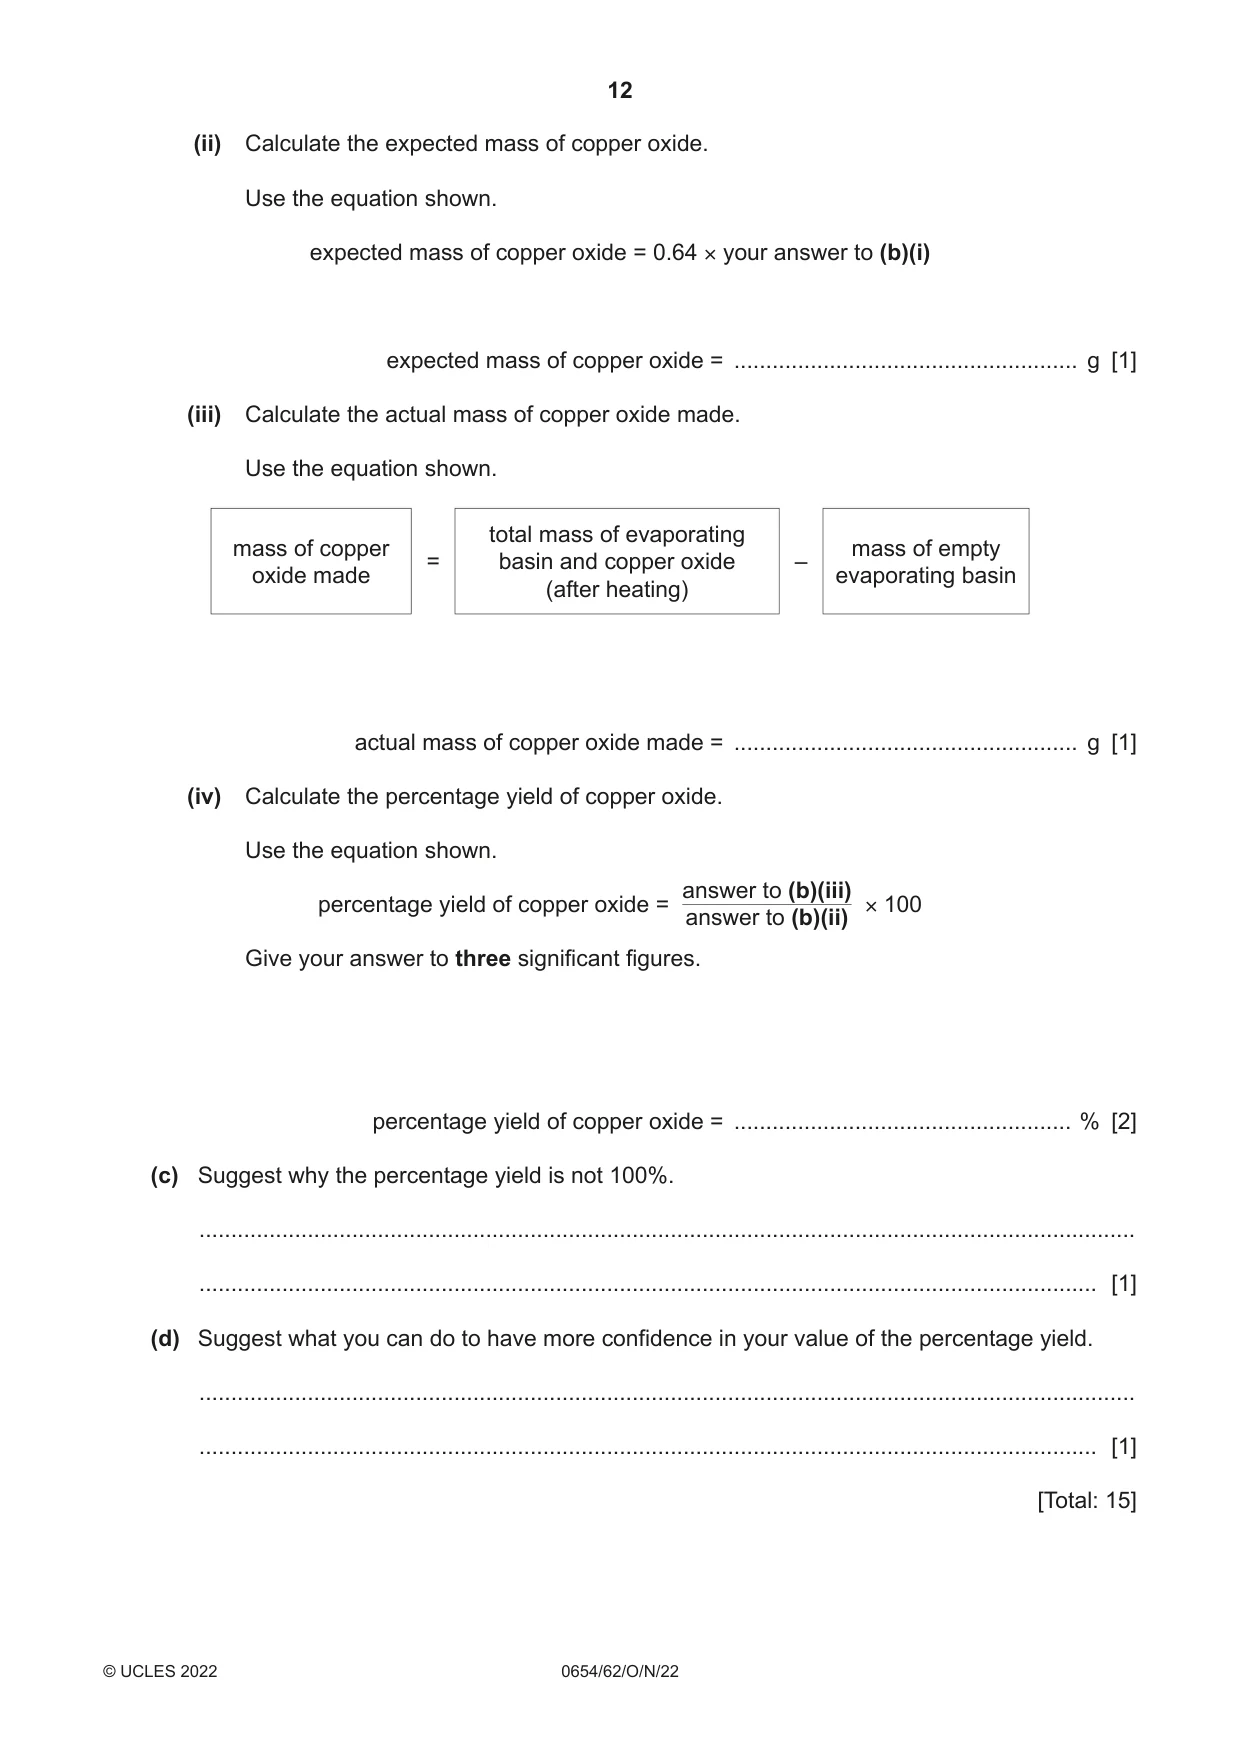
4 A student investigates the percentage yield for the decomposition of copper carbonate. Percentage yield compares the mass of substance made in an experiment with the mass of substance that is expected to be made. When copper carbonate solid is heated strongly it forms copper oxide solid and gives off carbon dioxide gas. copper carbonate copper oxide + carbon dioxide (a) Procedure The student: step 1 uses a balance to find the mass of an empty evaporating basin and records this mass in Table 4.1 step 2 adds three spatula loads of copper carbonate to the evaporating basin step 3 uses a balance to find the total mass of the evaporating basin and the copper carbonate and records this mass in Table 4.1 step 4 places the evaporating basin on top of a tripod and gauze step 5 heats and stirs the copper carbonate for three minutes step 6 uses a balance to find the total mass of the evaporating basin and copper oxide and records this mass in Table 4.1. Table 4.1 mass of empty evaporating basin / g 23.46 total mass of evaporating basin and copper carbonate (before heating) / g total mass of evaporating basin and copper oxide (after heating) / g (i) Draw a labelled diagram of the assembled apparatus showing the heating of the copper carbonate. [3] (ii) Suggest why the copper carbonate is stirred while it is being heated in step 5. ........................................................................................................................................... ..................................................................................................................................... [1] (iii) Fig. 4.1 shows the balance readings. 25.912 25.229 total mass of evaporating basin and total mass of evaporating basin and copper carbonate (before heating) copper oxide (after heating) Fig. 4.1 Record in Table 4.1 these masses to two decimal places. [2] (iv) Explain why the mass of copper carbonate decreases when it is heated. ........................................................................................................................................... ..................................................................................................................................... [1] (v) Copper carbonate solid is green. Copper oxide solid is black. Suggest how the student can tell when all of the copper carbonate has turned into copper oxide. ........................................................................................................................................... ..................................................................................................................................... [1] (b) (i) Calculate the mass of copper carbonate in the evaporating basin. Use the equation shown. total mass of mass of copper mass of empty = evaporating basin and copper – carbonate evaporating basin carbonate (before heating) mass of copper carbonate = ...................................................... g [1] (ii) Calculate the expected mass of copper oxide. Use the equation shown. expected mass of copper oxide = 0.64 × your answer to (b)(i) expected mass of copper oxide = ...................................................... g [1] (iii) Calculate the actual mass of copper oxide made. Use the equation shown. total mass of evaporating mass of copper mass of empty = basin and copper oxide – oxide made evaporating basin (after heating) actual mass of copper oxide made = ...................................................... g [1] (iv) Calculate the percentage yield of copper oxide. Use the equation shown. answer to (b)(iii) percentage yield of copper oxide = × 100 answer to (b)(ii) Give your answer to three significant figures. percentage yield of copper oxide = ..................................................... % [2] (c) Suggest why the percentage yield is not 100%. ................................................................................................................................................... ............................................................................................................................................. [1] (d) Suggest what you can do to have more confidence in your value of the percentage yield. ................................................................................................................................................... ............................................................................................................................................. [1] [Total: 15]
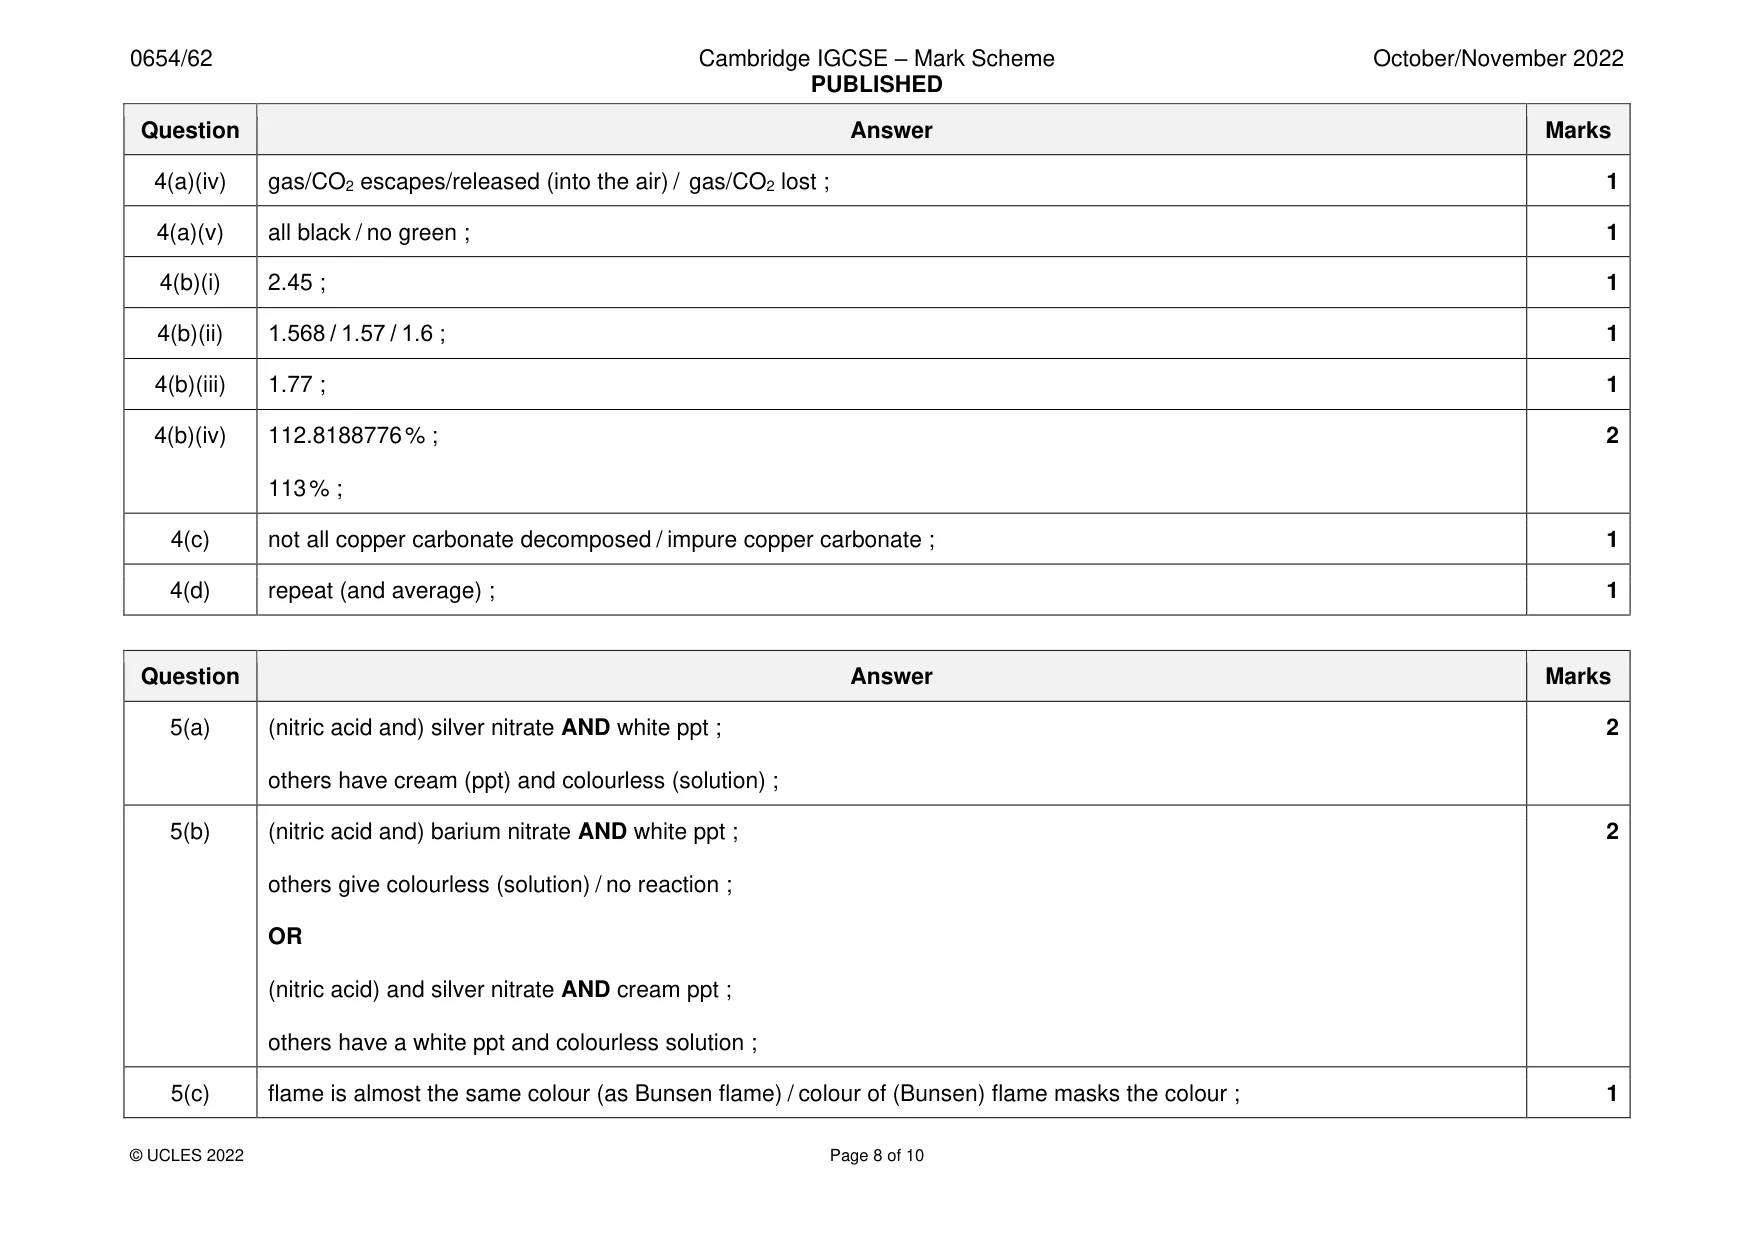
Mark scheme: 4(a)(i) tripod, gauze and Bunsen ; 3 evaporating basin and copper carbonate in it ; 2 correct labels ; 4(a)(ii) so all powder reacts / ensure complete reaction ; 1 4(a)(iii) 25.91 ; 2 25.23 ; 4(a)(iv) gas/CO2 escapes/released (into the air) / gas/CO2 lost ; 1 4(a)(v) all black / no green ; 1 4(b)(i) 2.45 ; 1 4(b)(ii) 1.568 / 1.57 / 1.6 ; 1 4(b)(iii) 1.77 ; 1 4(b)(iv) 112.8188776 % ; 2 113 % ; 4(c) not all copper carbonate decomposed / impure copper carbonate ; 1 4(d) repeat (and average) ; 1
Q5 · A student does some tests on solutions R, S and T
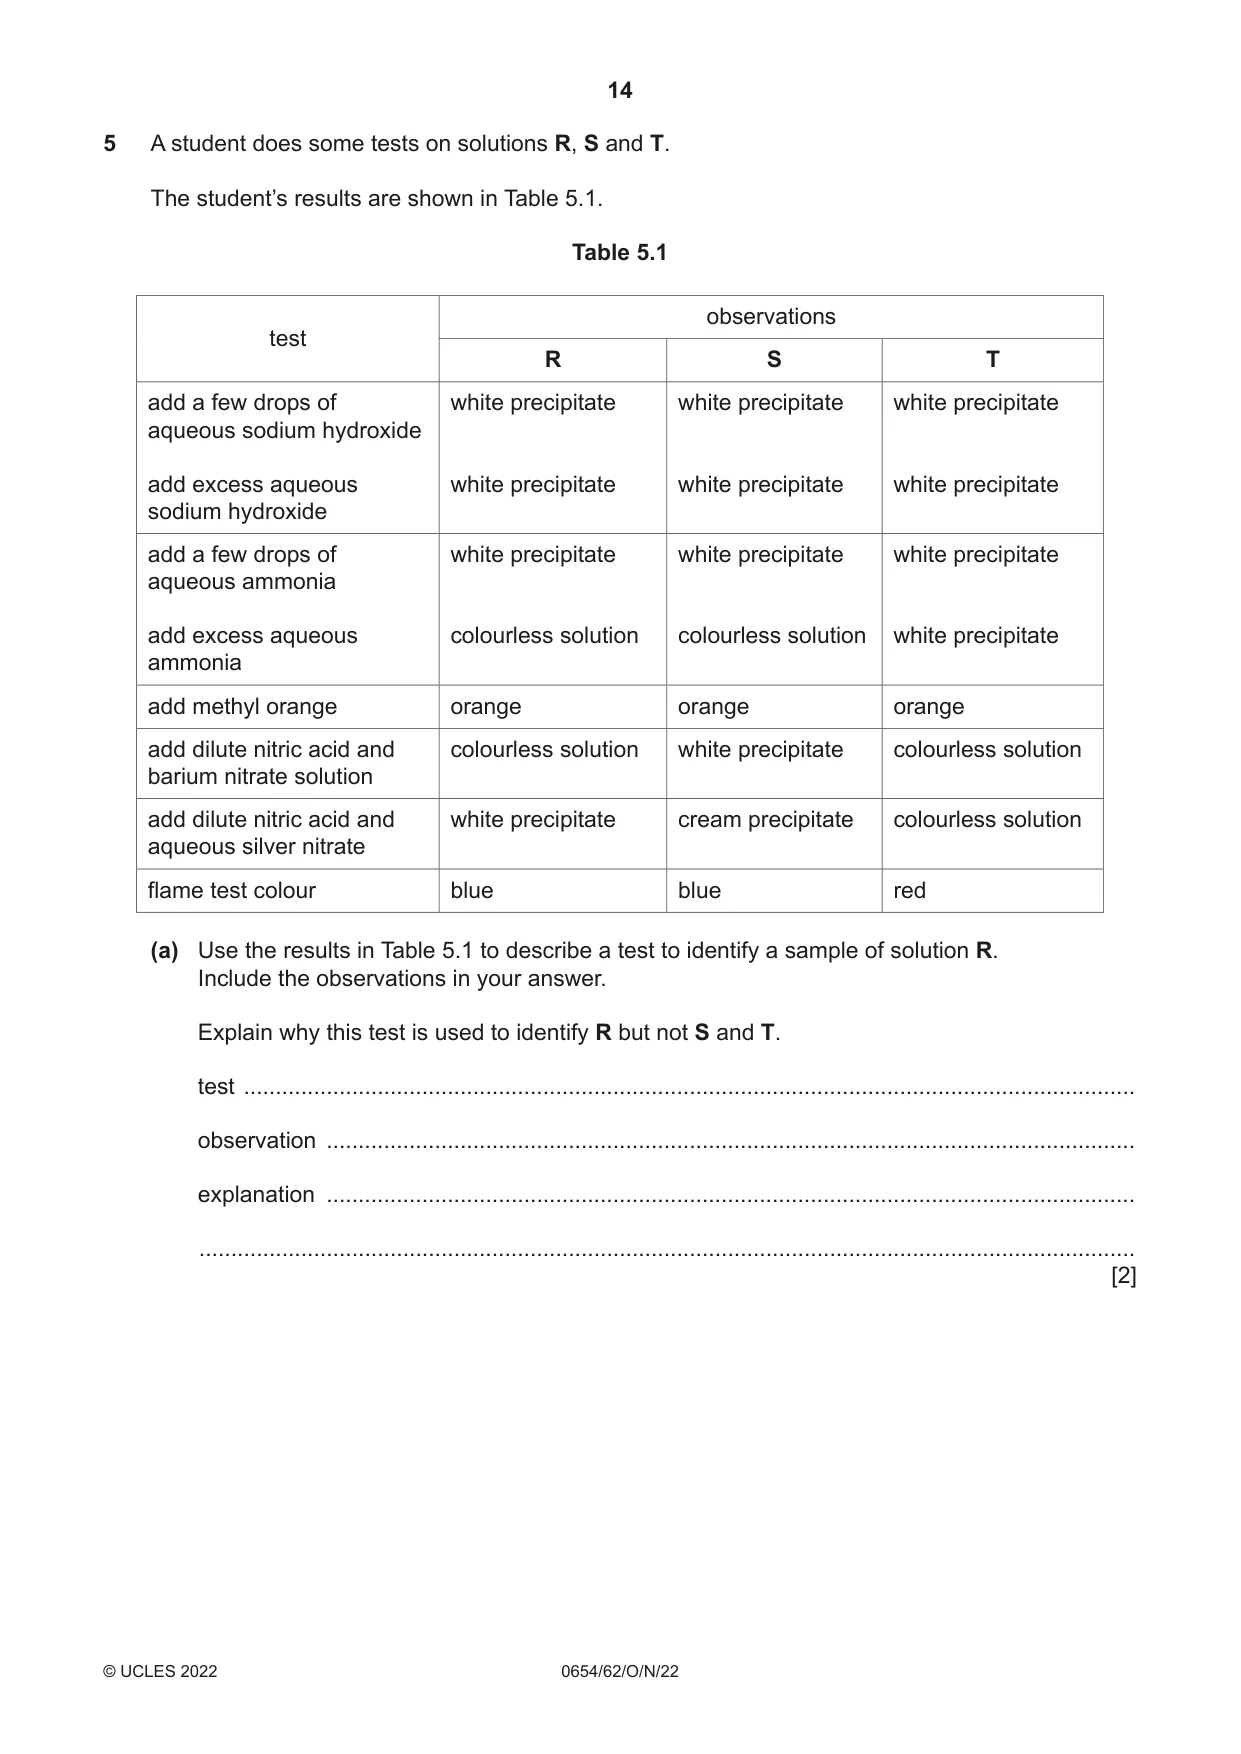
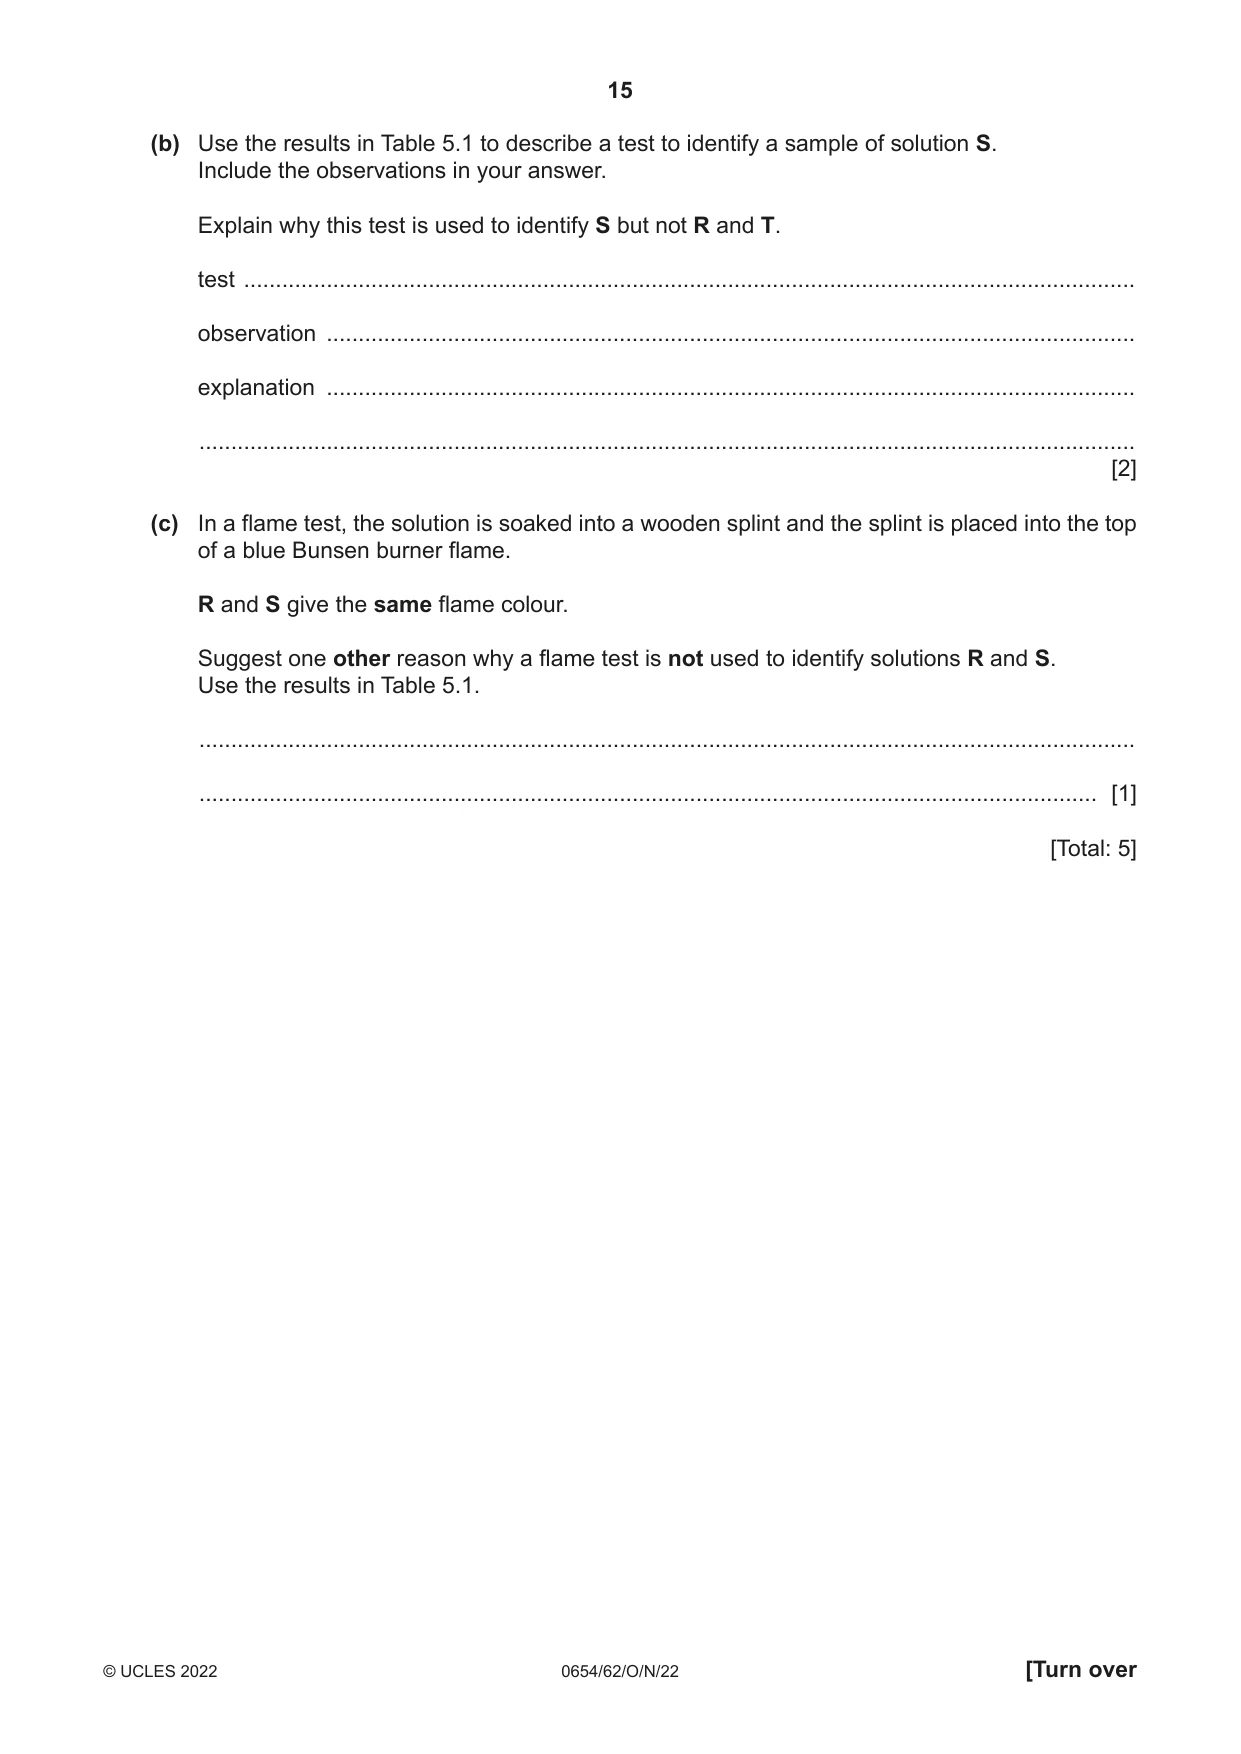
5 A student does some tests on solutions R, S and T. The student’s results are shown in Table 5.1. Table 5.1 observations test R S T add a few drops of white precipitate white precipitate white precipitate aqueous sodium hydroxide add excess aqueous white precipitate white precipitate white precipitate sodium hydroxide add a few drops of white precipitate white precipitate white precipitate aqueous ammonia add excess aqueous colourless solution colourless solution white precipitate ammonia add methyl orange orange orange orange add dilute nitric acid and colourless solution white precipitate colourless solution barium nitrate solution add dilute nitric acid and white precipitate cream precipitate colourless solution aqueous silver nitrate flame test colour blue blue red (a) Use the results in Table 5.1 to describe a test to identify a sample of solution R. Include the observations in your answer. Explain why this test is used to identify R but not S and T. test ............................................................................................................................................ observation ............................................................................................................................... explanation ............................................................................................................................... ................................................................................................................................................... [2] (b) Use the results in Table 5.1 to describe a test to identify a sample of solution S. Include the observations in your answer. Explain why this test is used to identify S but not R and T. test ............................................................................................................................................ observation ............................................................................................................................... explanation ............................................................................................................................... ................................................................................................................................................... [2] (c) In a flame test, the solution is soaked into a wooden splint and the splint is placed into the top of a blue Bunsen burner flame. R and S give the same flame colour. Suggest one other reason why a flame test is not used to identify solutions R and S. Use the results in Table 5.1. ................................................................................................................................................... ............................................................................................................................................. [1] [Total: 5]
Mark scheme: 5(a) (nitric acid and) silver nitrate AND white ppt ; 2 others have cream (ppt) and colourless (solution) ; 5(b) (nitric acid and) barium nitrate AND white ppt ; 2 others give colourless (solution) / no reaction ; OR (nitric acid) and silver nitrate AND cream ppt ; others have a white ppt and colourless solution ; 5(c) flame is almost the same colour (as Bunsen flame) / colour of (Bunsen) flame masks the colour ; 1
Q6 · A student investigates the magnification of an image formed by a converging lens
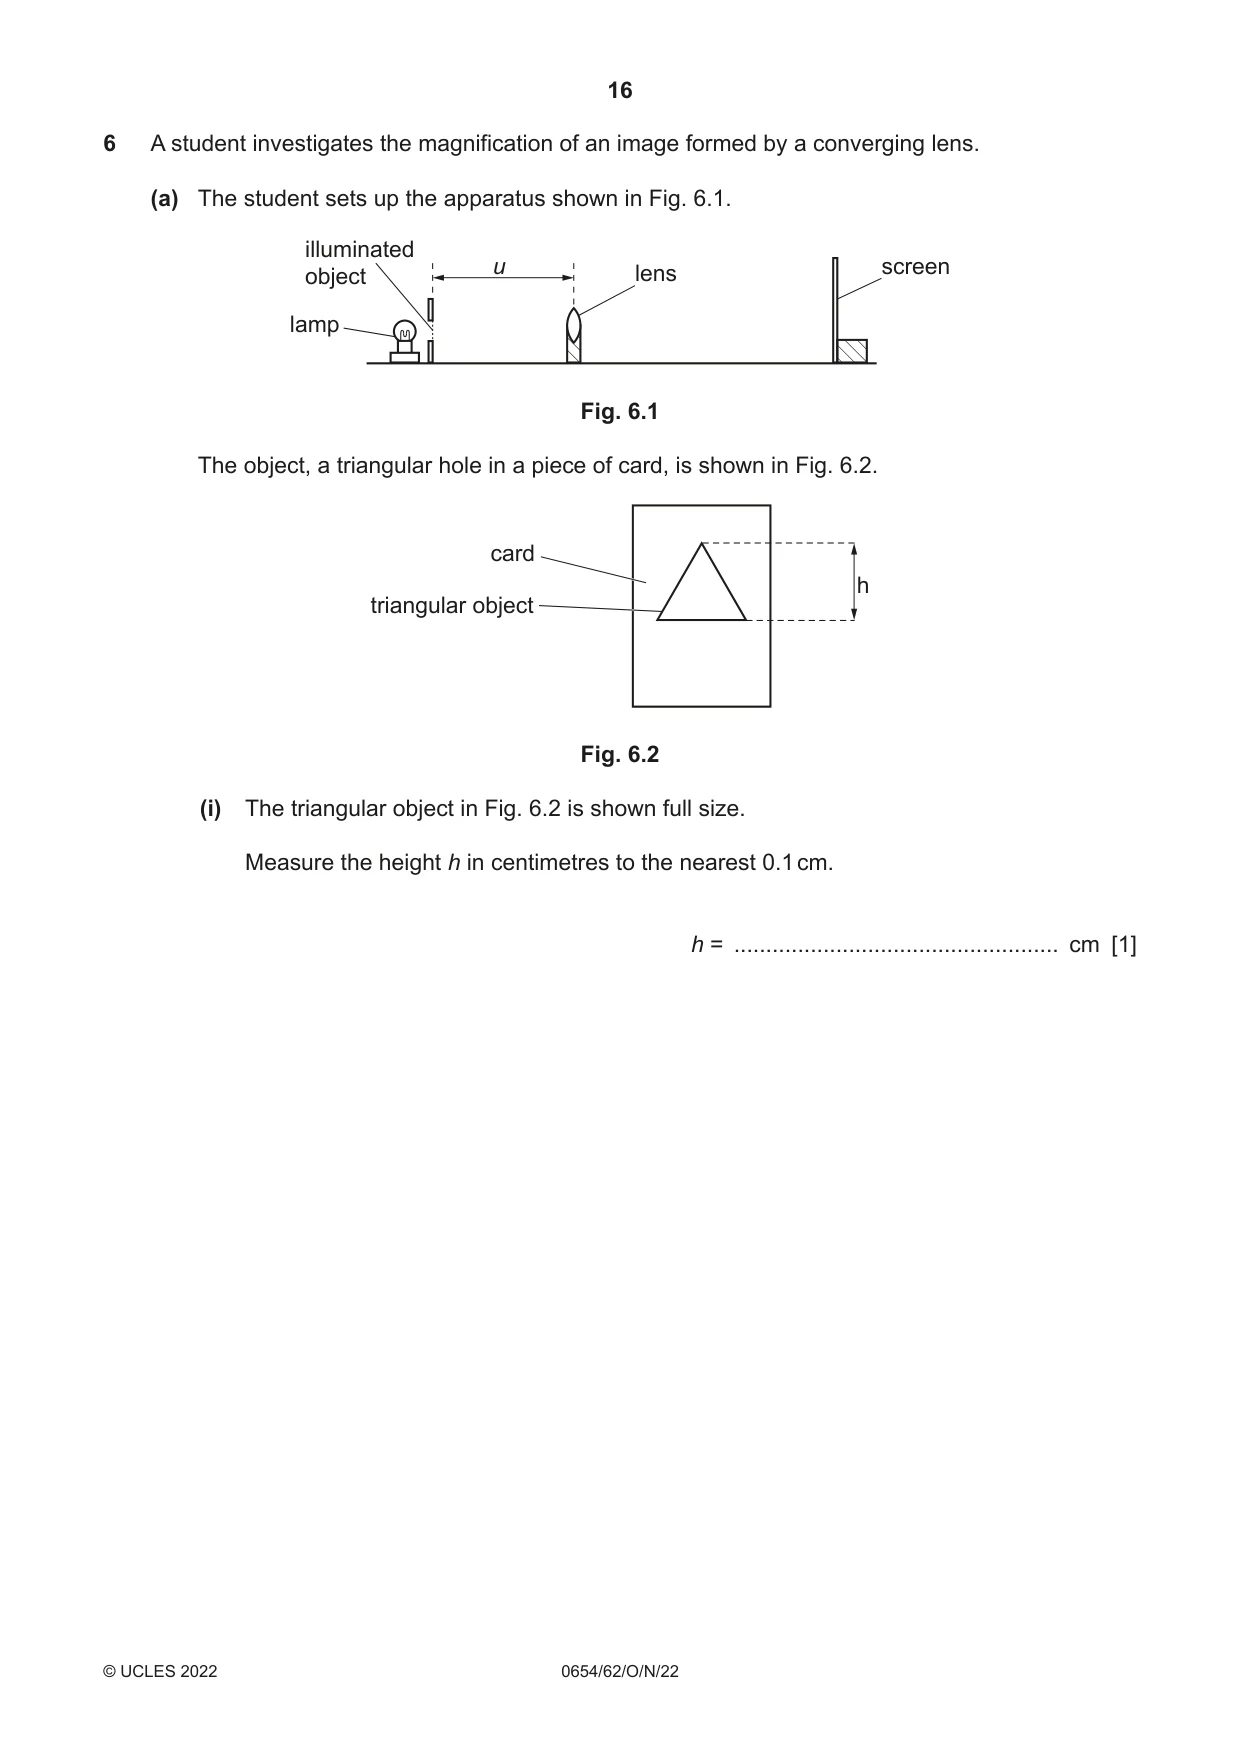
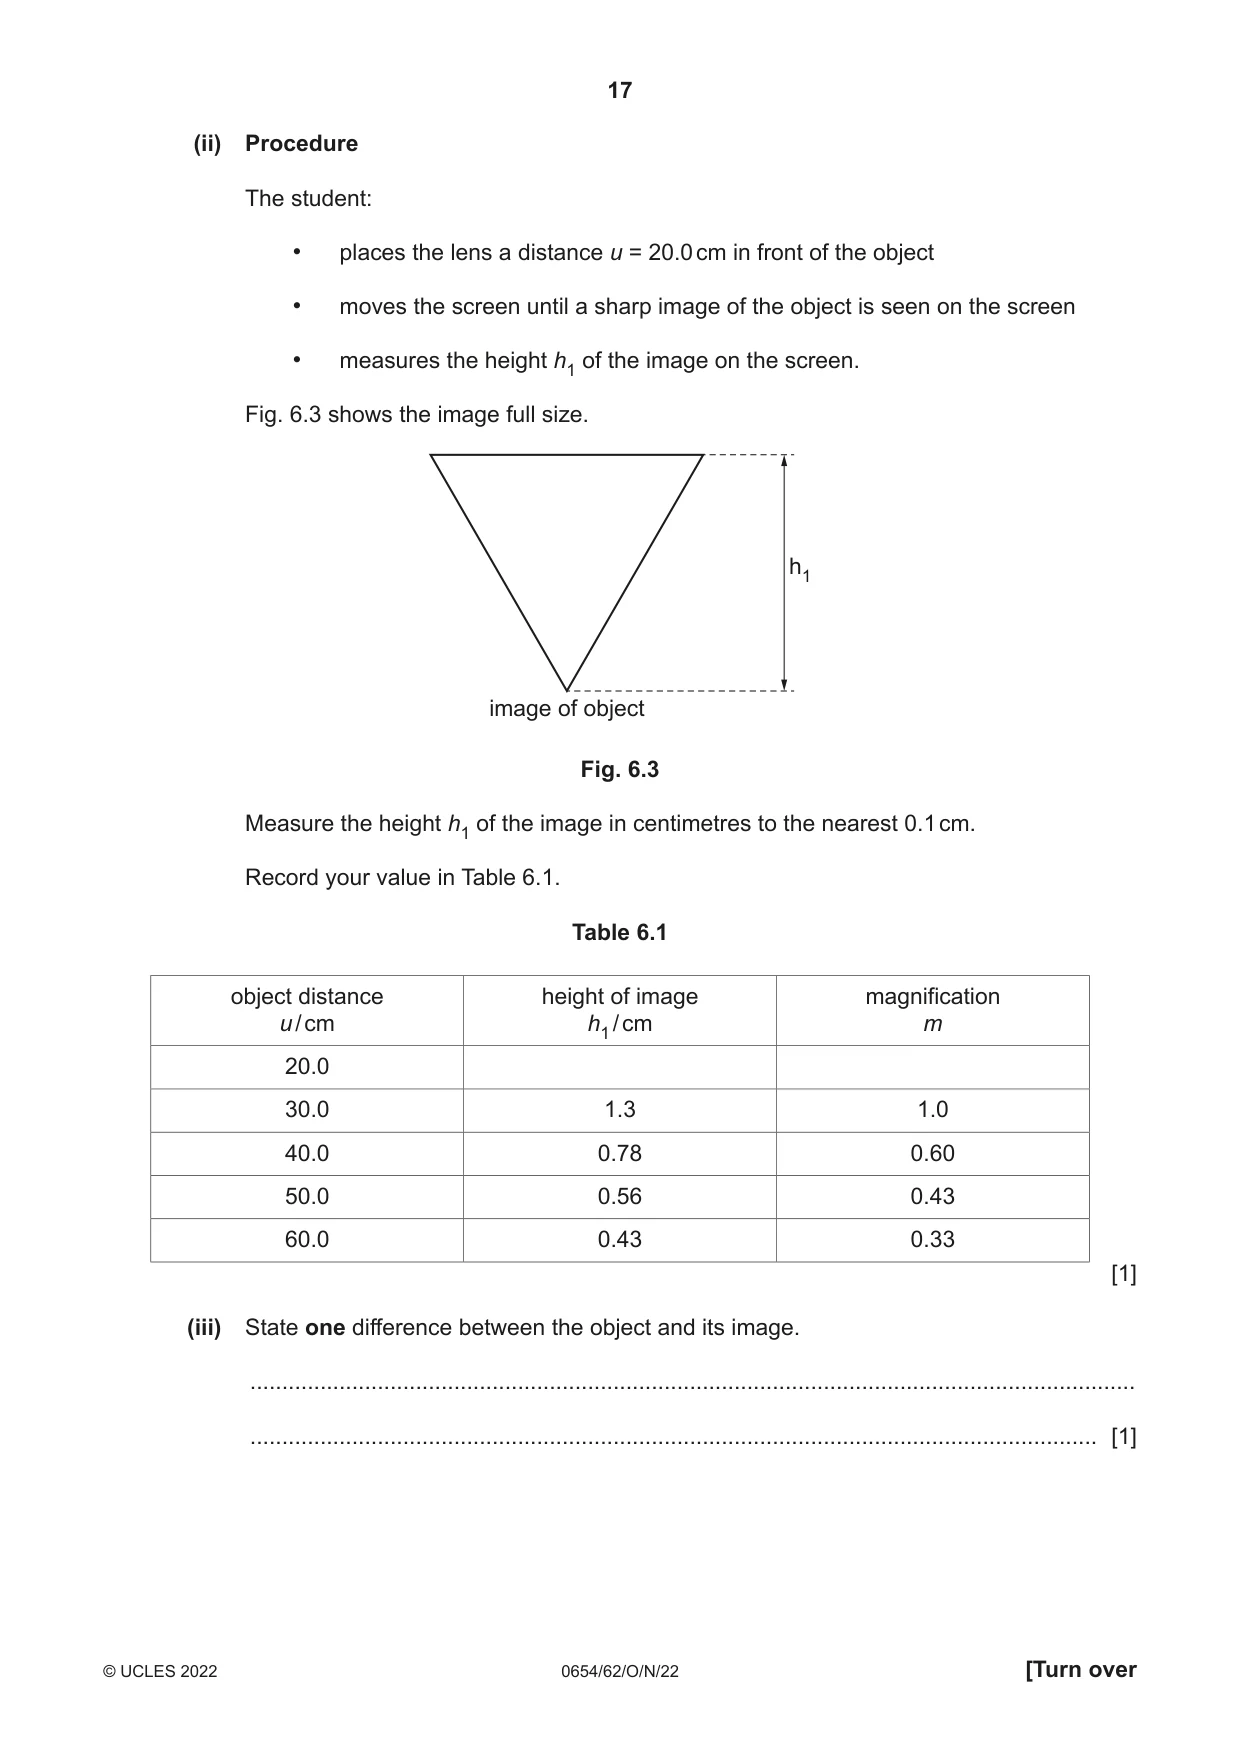
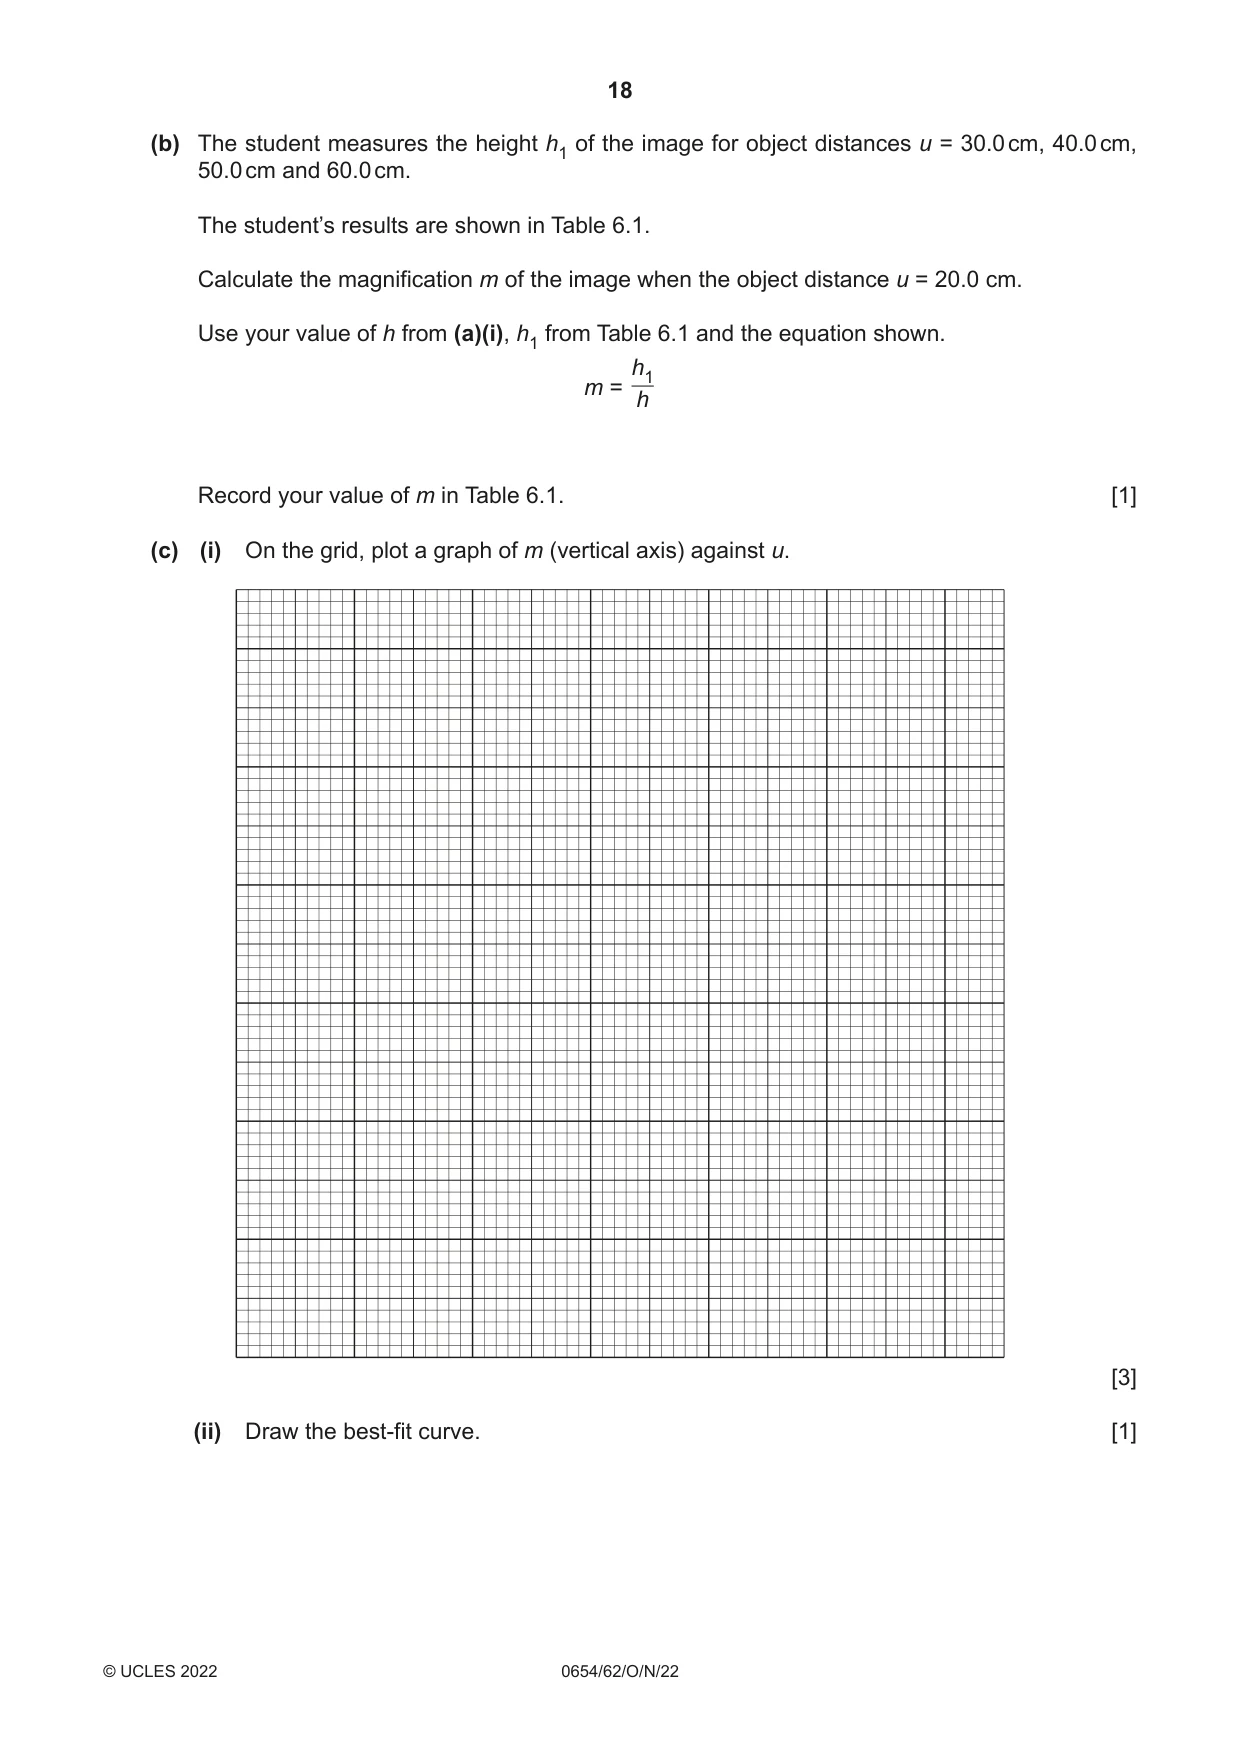
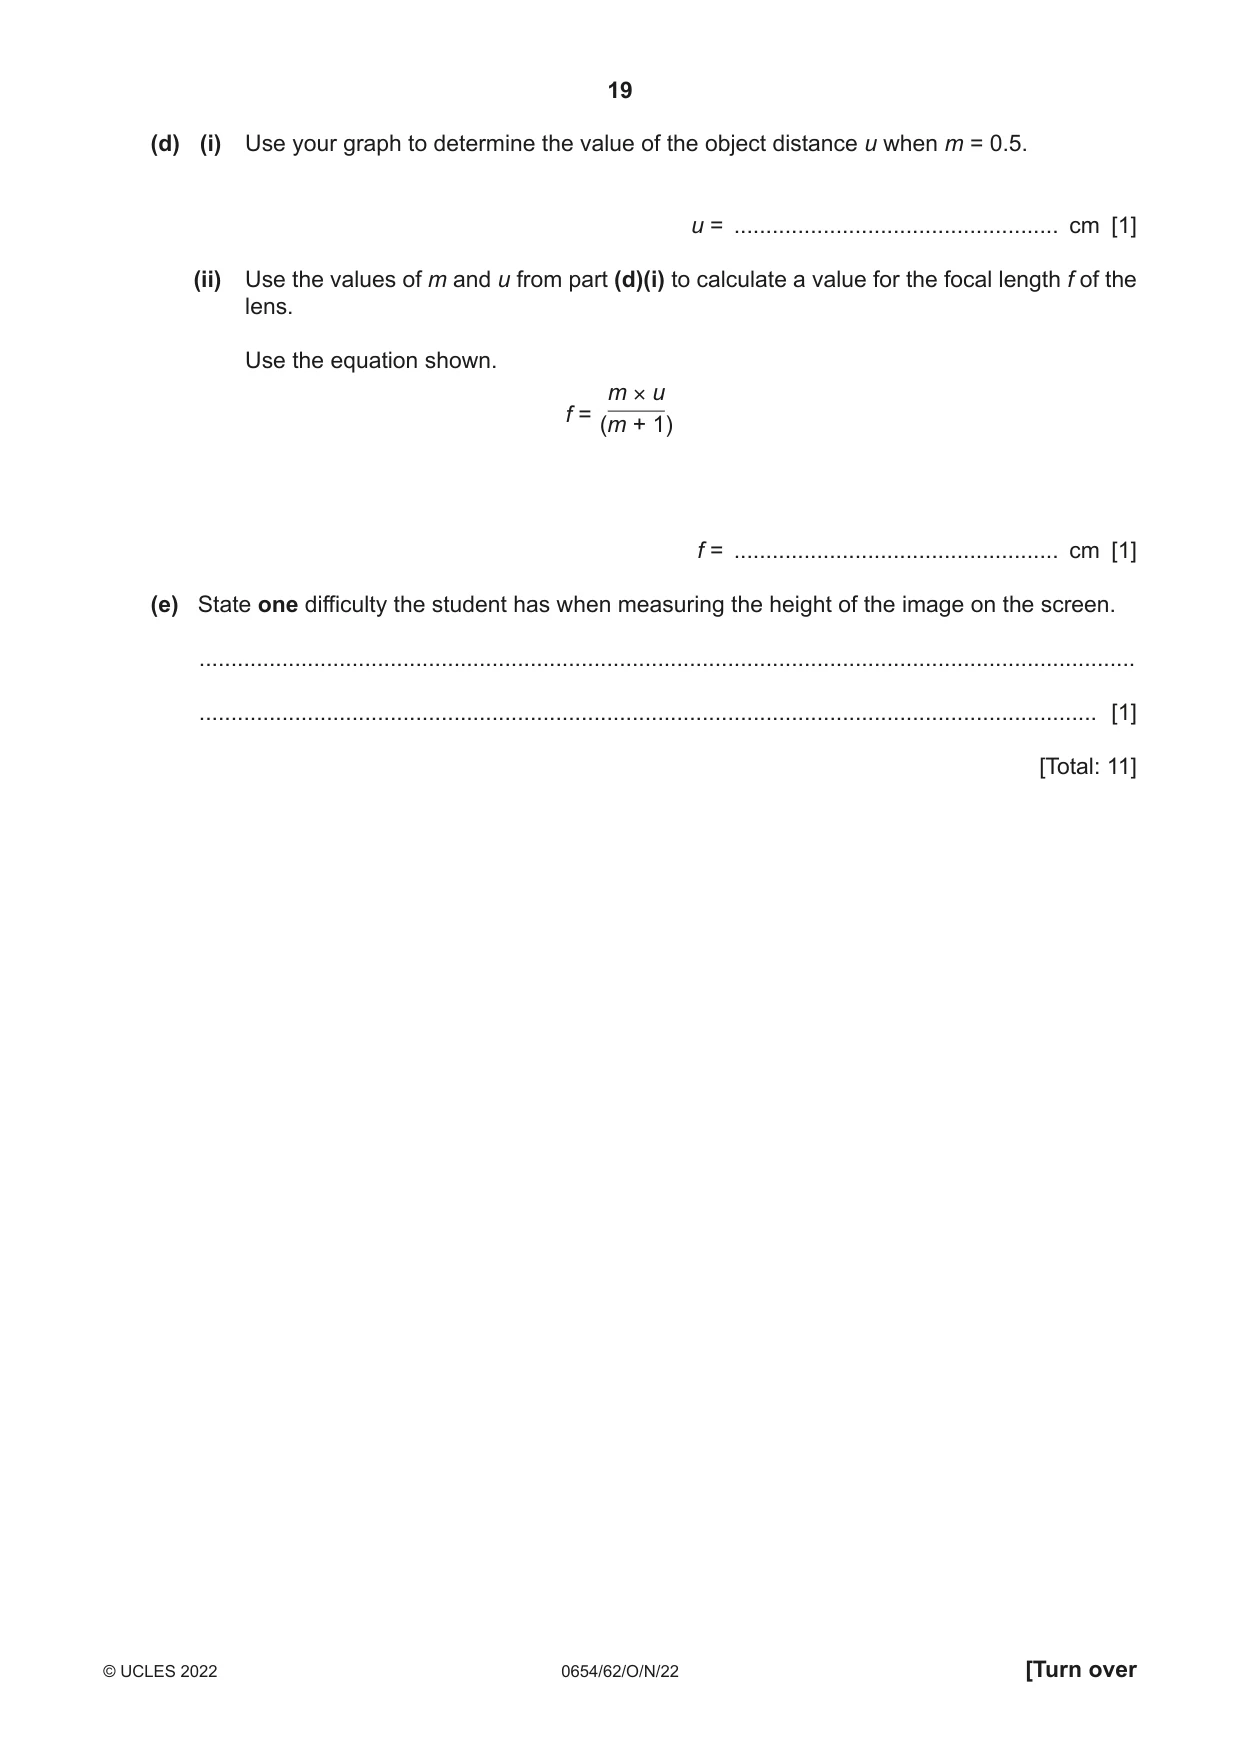
6 A student investigates the magnification of an image formed by a converging lens. (a) The student sets up the apparatus shown in Fig. 6.1. illuminated u screen object lens lamp Fig. 6.1 The object, a triangular hole in a piece of card, is shown in Fig. 6.2. card h triangular object Fig. 6.2 (i) The triangular object in Fig. 6.2 is shown full size. Measure the height h in centimetres to the nearest 0.1 cm. h = ................................................... cm [1] (ii) Procedure The student: • places the lens a distance u = 20.0 cm in front of the object • moves the screen until a sharp image of the object is seen on the screen • measures the height h1 of the image on the screen. Fig. 6.3 shows the image full size. h1 image of object Fig. 6.3 Measure the height h1 of the image in centimetres to the nearest 0.1 cm. Record your value in Table 6.1. Table 6.1 object distance height of image magnification u / cm h1 / cm m 20.0 30.0 1.3 1.0 40.0 0.78 0.60 50.0 0.56 0.43 60.0 0.43 0.33 [1] (iii) State one difference between the object and its image. ........................................................................................................................................... ..................................................................................................................................... [1] (b) The student measures the height h1 of the image for object distances u = 30.0 cm, 40.0 cm, 50.0 cm and 60.0 cm. The student’s results are shown in Table 6.1. Calculate the magnification m of the image when the object distance u = 20.0 cm. Use your value of h from (a)(i), h1 from Table 6.1 and the equation shown. h1 m = h Record your value of m in Table 6.1. [1] (c) (i) On the grid, plot a graph of m (vertical axis) against u. [3] (ii) Draw the best-fit curve. [1] (d) (i) Use your graph to determine the value of the object distance u when m = 0.5. u = ................................................... cm [1] (ii) Use the values of m and u from part (d)(i) to calculate a value for the focal length f of the lens. Use the equation shown. m × u f = (m + 1) f = ................................................... cm [1] (e) State one difficulty the student has when measuring the height of the image on the screen. ................................................................................................................................................... ............................................................................................................................................. [1] [Total: 11]
Mark scheme: 6(a)(i) 1.3 ; 1 6(a)(ii) 4.0 ; 1 6(a)(iii) image is bigger / magnified / image is inverted ; 1 6(b) 3.1 ; 1 6(c)(i) axes have the correct orientation and are labelled with a quantity and unit ; 3 suitable linear scales, where points cover ⩾ ½ the grid used ; 5 points plotted correctly to ½ small square ; 6(c)(ii) smooth curve of best fit ; 1 6(d)(i) u = 45 1 (cm) ; 1 6(d)(ii) 15(.0) (cm) ; 1 6(e) hand / ruler is in the way of the image / image is small / dim ; 1
Q7 · A student investigates how the resistance of a wire changes as its length l changes
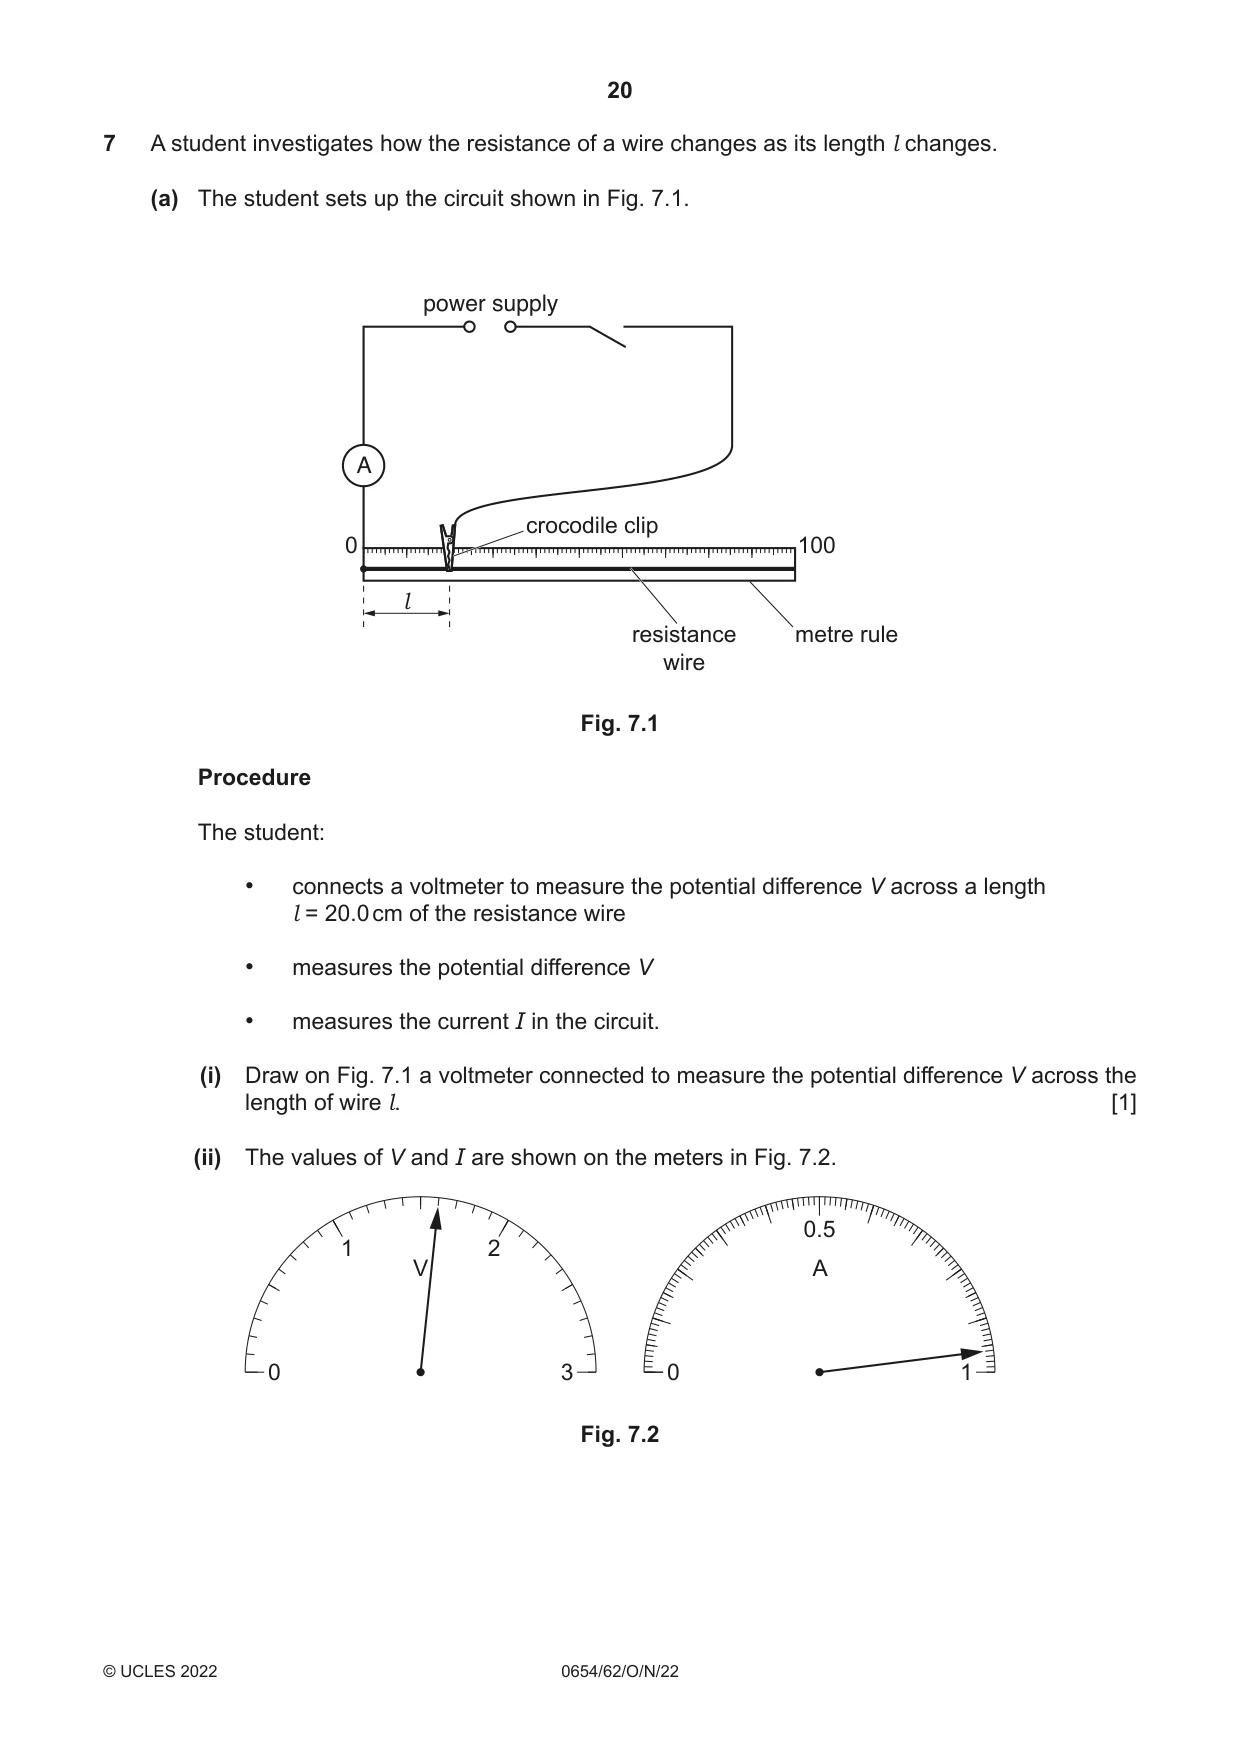
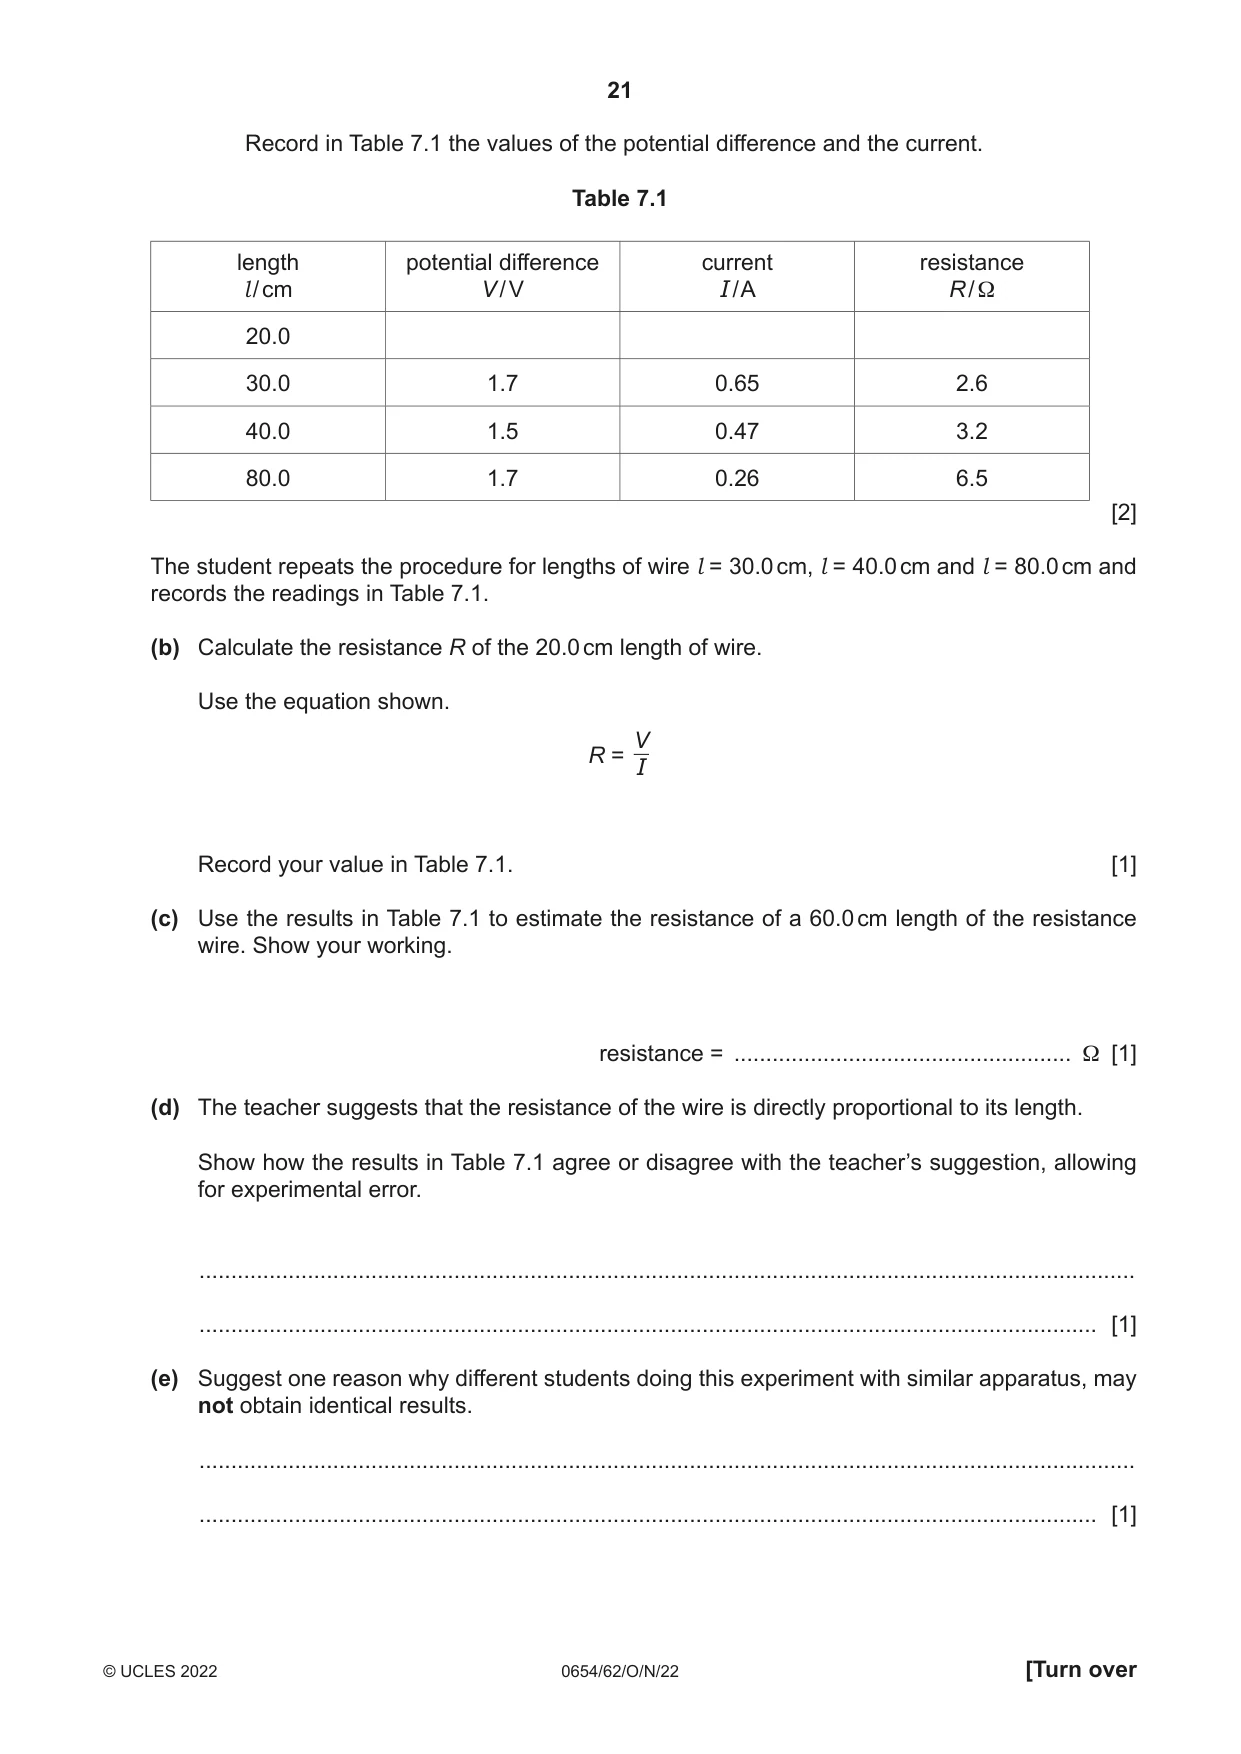
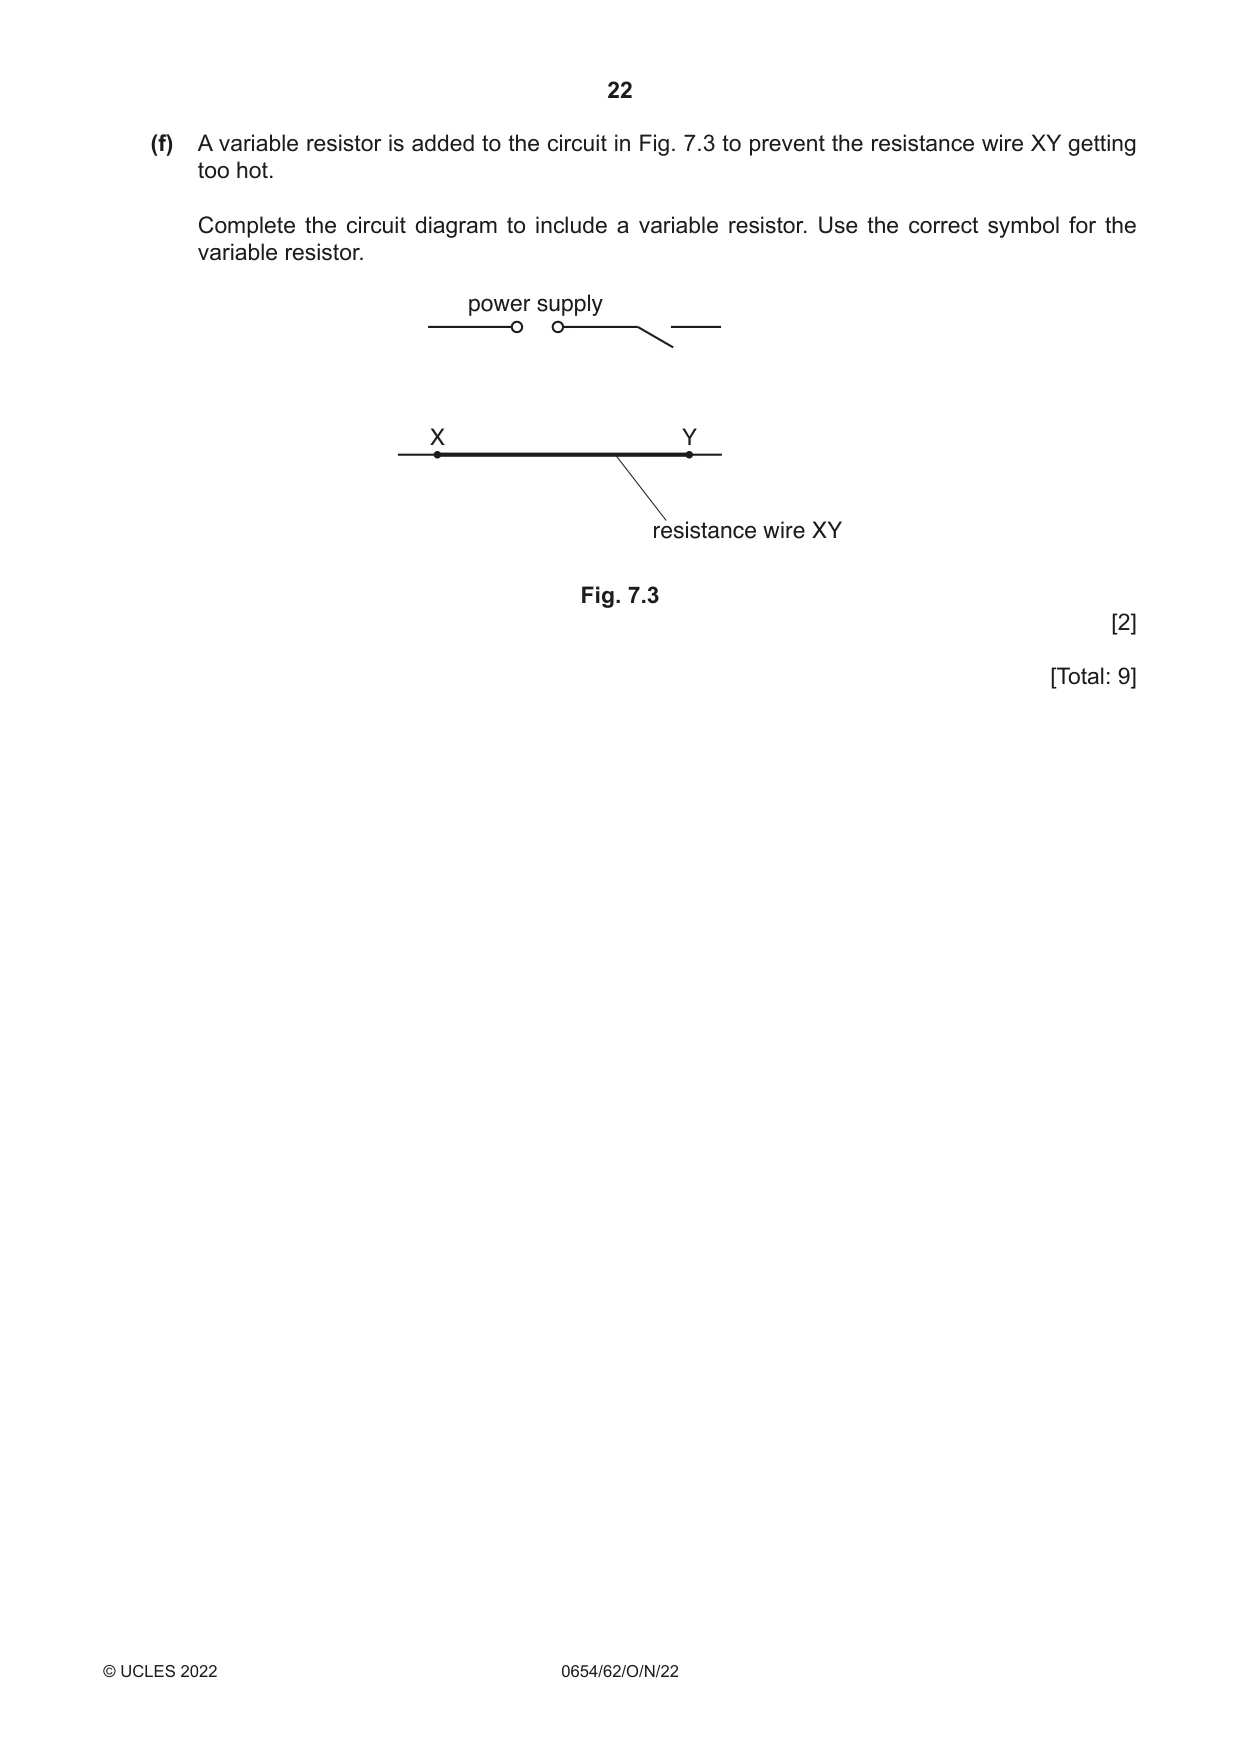
7 A student investigates how the resistance of a wire changes as its length l changes. (a) The student sets up the circuit shown in Fig. 7.1. power supply A crocodile clip 0 100 l resistance metre rule wire Fig. 7.1 Procedure The student: • connects a voltmeter to measure the potential difference V across a length l = 20.0 cm of the resistance wire • measures the potential difference V • measures the current I in the circuit. (i) Draw on Fig. 7.1 a voltmeter connected to measure the potential difference V across the length of wire l. [1] (ii) The values of V and I are shown on the meters in Fig. 7.2. 0.5 1 2 V A 0 3 0 1 Fig. 7.2 Record in Table 7.1 the values of the potential difference and the current. Table 7.1 length potential difference current resistance l / cm V / V I / A R / Ω 20.0 30.0 1.7 0.65 2.6 40.0 1.5 0.47 3.2 80.0 1.7 0.26 6.5 [2] The student repeats the procedure for lengths of wire l = 30.0 cm, l = 40.0 cm and l = 80.0 cm and records the readings in Table 7.1. (b) Calculate the resistance R of the 20.0 cm length of wire. Use the equation shown. V R = I Record your value in Table 7.1. [1] (c) Use the results in Table 7.1 to estimate the resistance of a 60.0 cm length of the resistance wire. Show your working. resistance = ..................................................... Ω [1] (d) The teacher suggests that the resistance of the wire is directly proportional to its length. Show how the results in Table 7.1 agree or disagree with the teacher’s suggestion, allowing for experimental error. ................................................................................................................................................... ............................................................................................................................................. [1] (e) Suggest one reason why different students doing this experiment with similar apparatus, may not obtain identical results. ................................................................................................................................................... ............................................................................................................................................. [1] (f) A variable resistor is added to the circuit in Fig. 7.3 to prevent the resistance wire XY getting too hot. Complete the circuit diagram to include a variable resistor. Use the correct symbol for the variable resistor. power supply X Y resistance wire XY Fig. 7.3 [2] [Total: 9]
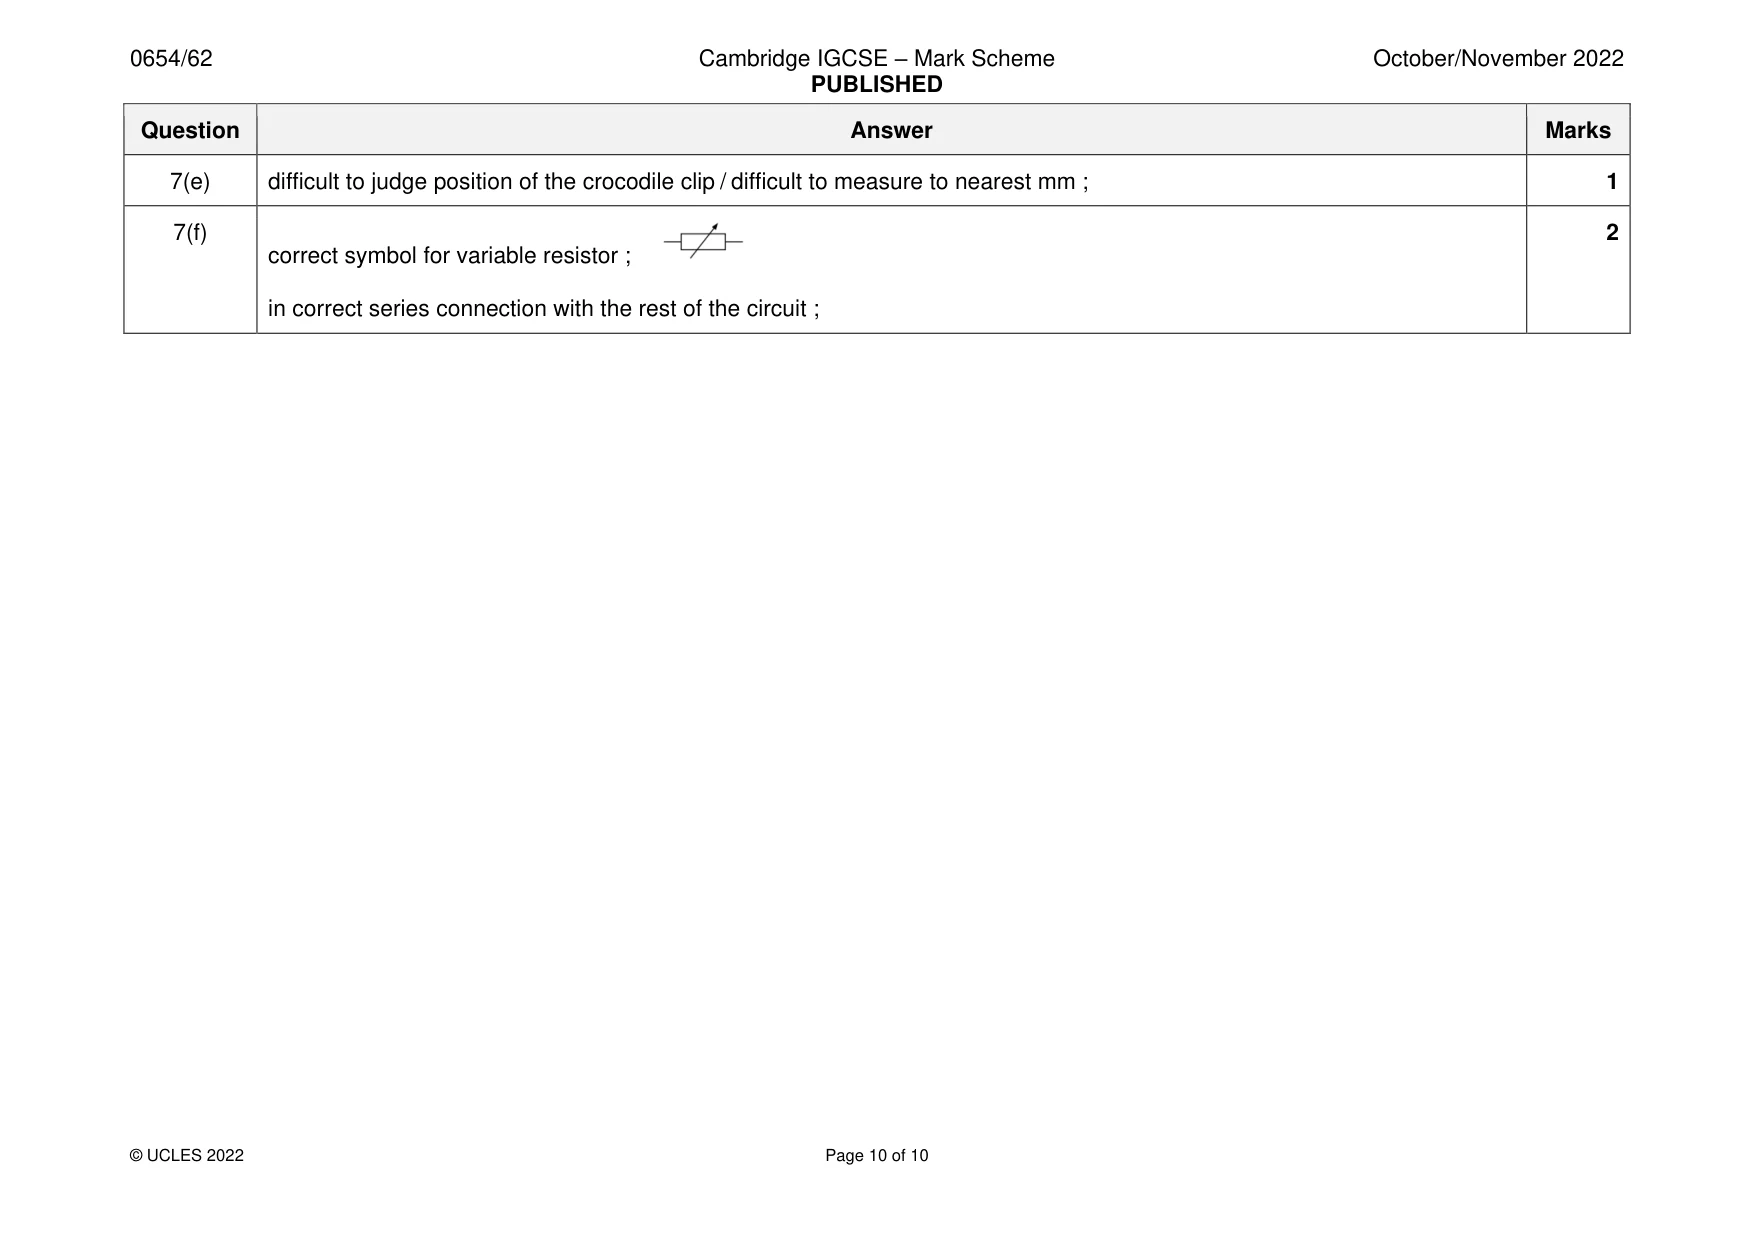
Mark scheme: 7(a)(i) correct parallel connection with correct voltmeter symbol ; 1 7(a)(ii) 1.6 ; 2 0.96 ; 7(b) 1.7 ; 1 7(c) 5.0 0.4 ; 1 7(d) agree – doubling l (approximately) doubles R (or vice versa) / ratio R / l is (approximately) constant (or vice versa) ; 1 7(e) difficult to judge position of the crocodile clip / difficult to measure to nearest mm ; 1 7(f) 2 correct symbol for variable resistor ; in correct series connection with the rest of the circuit ;
What was in this paper
The subtopics covered by these 7 questions, and how many questions each got. Open one in a new tab to see every Cambridge question on it.
What you needed in this session
Cambridge’s own grade thresholds for 2022 Oct/Nov, Paper 6 · Variant 2. A higher threshold means an easier paper — the bar moves with how the cohort did.